
ac 2021 61 - Growing Science
16
* Corresponding author. Tel.: +60177912628 E-mail address: [email protected] (T.T.J. Tan) © 2021 by the authors; licensee Growing Science, Canada doi: 10.5267/j.ac.2021.3.005 Accounting 7 (2021) 1033–1048 Contents lists available at GrowingScience Accounting homepage: www.GrowingScience.com/ac/ac.html Can investors benefit from corporate social responsibility and portfolio model during the Covid19 pandemic? Ternence T. J. Tan a* and Baliira Kalyebara b a Faculty of Business, Economics and Social Development, University of Malaysia Terengganu, Kuala Nerus, Terengganu, Malaysia b Department of Accounting and Finance, School of Business, American University of Ras Al Khaimah, United Arab Emirates C H R O N I C L E A B S T R A C T Article history: Received: November 15, 2020 Received in revised format: January 28 2021 Accepted: March 2, 2021 Available online: March 2, 2021 Since late 2019 and throughout 2020, the global economy has been experiencing difficult times due to the outbreak of the lethal Coronavirus (COVID-19). This study looks at the financial impact of this epidemic on the global economy using Malaysian market index i.e., FTSE Bursa Malaysia KLCI before and during COVID-19. Measuring the financial impact of this epidemic on the Malaysia economy may help policy makers to develop measures to avert similar financial catastrophic impacts on the global economy. The study uses Sharpe optimal and naïve diversification model to solve a scenario that factors in the level of corporate social responsibility (CSR) exhibited before and during the epidemic to measure the financial impact on the stock portfolio. The results show that the emergence of COVID-19exacerbated the already weak Malaysian economy. Our findings may help the policy makers in Malaysia to develop and maintain techniques and policies that may mitigate the negative financial impact and handle similar epidemics in the future. Future studies could cover the financial impact of CSR using variable scoring and apply the portfolio model with practical and prevailing constraints. © 2021 by the authors; licensee Growing Science, Canada Keywords: Corporate Social Responsibility Naïve Diversification Optimal Portfolio Sharpe Ratio Covid19 pandemic Portfolio Optimization 1. Introduction In responding to the COVID-19 epidemic, the majority of countries in the world including Malaysia announced lockdown policies (Express, 2020). On 18th March 2020, Malaysia introduced such a policy that allowed only businesses offering essential services to operate (Tang, 2020). Due to the pandemic, it has been widely reported that the virus and lockdowns have direct impacts on financial performance and the global stock markets. Therefore, analysis of the investment portfolios due to the global pandemic is an important and topical subject. The mathematical framework for portfolio models was developed by Harry Markowitz (1952) who was awarded the Nobel Memorial Prize in Economic Sciences for his contributions. Frankfuther, Philips and Seagle (1976) documented that Sharpe model could produce more reliable results than the Markowitz model as it could eliminate the excess and inefficient inputs. DeMinguel, Garlappi and Uppal (2009) discussed the conditions that could help Modern Portfolio Theory (MPT) to outperform Naive diversification. The results concluded that additional constraints and small portfolio size are the basic conditions that helped achieve a result similar to those from Simaan 1997. According to Brinson, Singer, Beebower (1991), asset allocation carries a large portion in determining portfolio performance. The estimation error increased with portfolio size and reduced the performance of a portfolio. Later, Nwakanma (2014) showed that Markowitz model could take the privilege of naive diversification if and only if the study uses between 6-10 assets. Recently, Nor and Islam (2016, 2017) further prove found similar results that MPT dominated naive diversification with the assistance of small portfolio size and practical constraints. Extending the studies of Nakai, Yamaguchi, Takeuchi (2016), and Tan and Kalyebara (2019), this
Transcript of ac 2021 61 - Growing Science
* Corresponding author. Tel.: +60177912628 E-mail address: [email protected] (T.T.J. Tan) © 2021 by the authors; licensee Growing Science, Canada doi: 10.5267/j.ac.2021.3.005
Accounting 7 (2021) 1033–1048
Contents lists available at GrowingScience
Accounting
homepage: www.GrowingScience.com/ac/ac.html
Can investors benefit from corporate social responsibility and portfolio model during the Covid19 pandemic?
Ternence T. J. Tana* and Baliira Kalyebarab
aFaculty of Business, Economics and Social Development, University of Malaysia Terengganu, Kuala Nerus, Terengganu, Malaysia bDepartment of Accounting and Finance, School of Business, American University of Ras Al Khaimah, United Arab Emirates C H R O N I C L E A B S T R A C T
Article history: Received: November 15, 2020 Received in revised format: January 28 2021 Accepted: March 2, 2021 Available online: March 2, 2021
Since late 2019 and throughout 2020, the global economy has been experiencing difficult times due to the outbreak of the lethal Coronavirus (COVID-19). This study looks at the financial impact of this epidemic on the global economy using Malaysian market index i.e., FTSE Bursa Malaysia KLCI before and during COVID-19. Measuring the financial impact of this epidemic on the Malaysia economy may help policy makers to develop measures to avert similar financial catastrophic impacts on the global economy. The study uses Sharpe optimal and naïve diversification model to solve a scenario that factors in the level of corporate social responsibility (CSR) exhibited before and during the epidemic to measure the financial impact on the stock portfolio. The results show that the emergence of COVID-19exacerbated the already weak Malaysian economy. Our findings may help the policy makers in Malaysia to develop and maintain techniques and policies that may mitigate the negative financial impact and handle similar epidemics in the future. Future studies could cover the financial impact of CSR using variable scoring and apply the portfolio model with practical and prevailing constraints.
© 2021 by the authors; licensee Growing Science, Canada
Keywords: Corporate Social Responsibility Naïve Diversification Optimal Portfolio Sharpe Ratio Covid19 pandemic Portfolio Optimization
1. Introduction
In responding to the COVID-19 epidemic, the majority of countries in the world including Malaysia announced lockdown policies (Express, 2020). On 18th March 2020, Malaysia introduced such a policy that allowed only businesses offering essential services to operate (Tang, 2020). Due to the pandemic, it has been widely reported that the virus and lockdowns have direct impacts on financial performance and the global stock markets. Therefore, analysis of the investment portfolios due to the global pandemic is an important and topical subject. The mathematical framework for portfolio models was developed by Harry Markowitz (1952) who was awarded the Nobel Memorial Prize in Economic Sciences for his contributions. Frankfuther, Philips and Seagle (1976) documented that Sharpe model could produce more reliable results than the Markowitz model as it could eliminate the excess and inefficient inputs. DeMinguel, Garlappi and Uppal (2009) discussed the conditions that could help Modern Portfolio Theory (MPT) to outperform Naive diversification. The results concluded that additional constraints and small portfolio size are the basic conditions that helped achieve a result similar to those from Simaan 1997. According to Brinson, Singer, Beebower (1991), asset allocation carries a large portion in determining portfolio performance. The estimation error increased with portfolio size and reduced the performance of a portfolio. Later, Nwakanma (2014) showed that Markowitz model could take the privilege of naive diversification if and only if the study uses between 6-10 assets. Recently, Nor and Islam (2016, 2017) further prove found similar results that MPT dominated naive diversification with the assistance of small portfolio size and practical constraints. Extending the studies of Nakai, Yamaguchi, Takeuchi (2016), and Tan and Kalyebara (2019), this
1034
study applies the data sample to the current pandemic situation to incorporate practical views of the effect of CSR in portfolio financial performance. According to Alexandar and Burcholz (1978), Brammer and Brooks (2006), corporate social responsibility (CSR) does not have any financial effect on stock value. However, Godfrey et al. (2009) found that there is an effect of CSR on capital preservation; but it does not expand the capital structure of the firm. In other words, CSR act as a cushion for a firm to withstand negative financial impact. Later, CSR was incorporated in portfolio theory and applied in investments in 2015 (Oikonomou, Platanakis and Sutcliffe, 2015; Calvo, Ivorra and Liern, 2015). Furthermore, Nakai, Yamaguchi, Takeuchi (2016) found that Corporate Social Responsibility (CSR) assists a firm to withstand the negative financial impact of financial crises. The results showed that a portfolio with CSR and constraints can outperform the Naïve diversification and classics Markowitz model. These results are what is expected in theory. Nor and Zawawi (2018) conducted a study on the financial impact of CSR in portfolio performance specifically from the perspective of corporate governance. However, the results show that weak corporate governance can dominate strong corporate governance during out-sample analysis. Tan and Kalyebara (2019) conducted research that analyzed the financial impact of CSR on portfolio investment. Firstly, they ranked the Top constituent FTSE KLCI according to their Environmental, Social, and Governance variable scoring. After asset screening, they optimized the portfolio and recorded the performance. The results show that Sharpe-optimal model can outperform Naïve diversification, while Bottom ESG scoring outperforms Top ESG scoring. These results may be due to portfolio factors and economic factors. A more recent study by Rehman et al. (2021) in BRICS argues that investors are becoming more interested in socially responsible investments in emerging economies. They also suggested future research to explore portfolios based on environment, social and governance (ESG) using 1/N and Markowitz (1952) efficient frontier, among others. 2. Data and model This study analyzes the financial effect of Corporate Social Responsibility (CSR) and shares price using the portfolio model during the COVID-19 epidemic. Hence, 40 listed firms listed on FTSE Bursa Malaysia KLCI are employed to analyze for the period of 11 years (1 Jan 2009 - 1 Sept 2020). The time covers a pre-epidemic period (2009-2019), and during the epidemic period (2020). This paper maintains the portfolio size in 20, a majority of risk reduced during portfolio size reaching 10-20 (Edwin and Martin, 1977), while Nor and Islam (2017) document Sharpe optimal portfolio can outperform naïve diversification during portfolio size 15-30. The study shows the practical financial effect of CSR during the epidemic situation in Malaysia. Firstly, all the involved companies are categorized according to their scoring in Environmental, Social and Governance variables, which are calculated by financial professionals. Secondly, each category undergoes portfolio optimization computation and formed four (4) portfolios by applying the Naive diversification and Sharpe optimal model. Accordingly, Sharpe optimal model used simple constraints which are 0.01 as the floor portion to avoid estimation error. In this study, it is assumed that the Malaysia Stock Market is in weak form efficiency and a simple buy-hold strategy is the preferred management strategy. Meanwhile, this study also uses the 12-month Malaysia Treasury Bill as the risk-free rate (3.17%). The optimization portfolio model used in this study is as flows: 𝑚𝑎𝑥 ∑ 𝑊 𝐸 𝑅 − 𝑇𝑅∑ 𝑊𝑊𝜎,,
(1)
subject to 𝑊 = 1
(2) 0.01 ≤ 𝑊 ≤ 0.10 (3) whereas: 𝑊 : weight of stock 𝑖 𝑊 : weight of stock 𝑗 𝑊 : weight of stock 𝑘 in a portfolio 𝜎 : covariance of stock 𝑖 and stock 𝑗 𝐸 𝑅 : expected return of stock 𝑘 𝑇𝑅 : risk-free rate
T.T.J. Tan and B. Kalyebara /Accounting 7 (2021) 1035
In this paper, the General Reducing Gradient Non-linear (GRG Non-linear) algorithm is applied to solve the optimization problem due to its robustness in computation time. The GRG Non-linear is an extension of reducing gradient to solve the inequalities constraints and thus suitable for our portfolio selection problem. Besides, the objective function of this paper is to find the maximum value of Sharpe ratio with floor and ceiling constraints which providing a smooth function graph that permissible the solver to run through and tracking the optimal solution (see Maia et al., 2017; Arora, 2017; Charlie, nd). 3. Results and Discussion
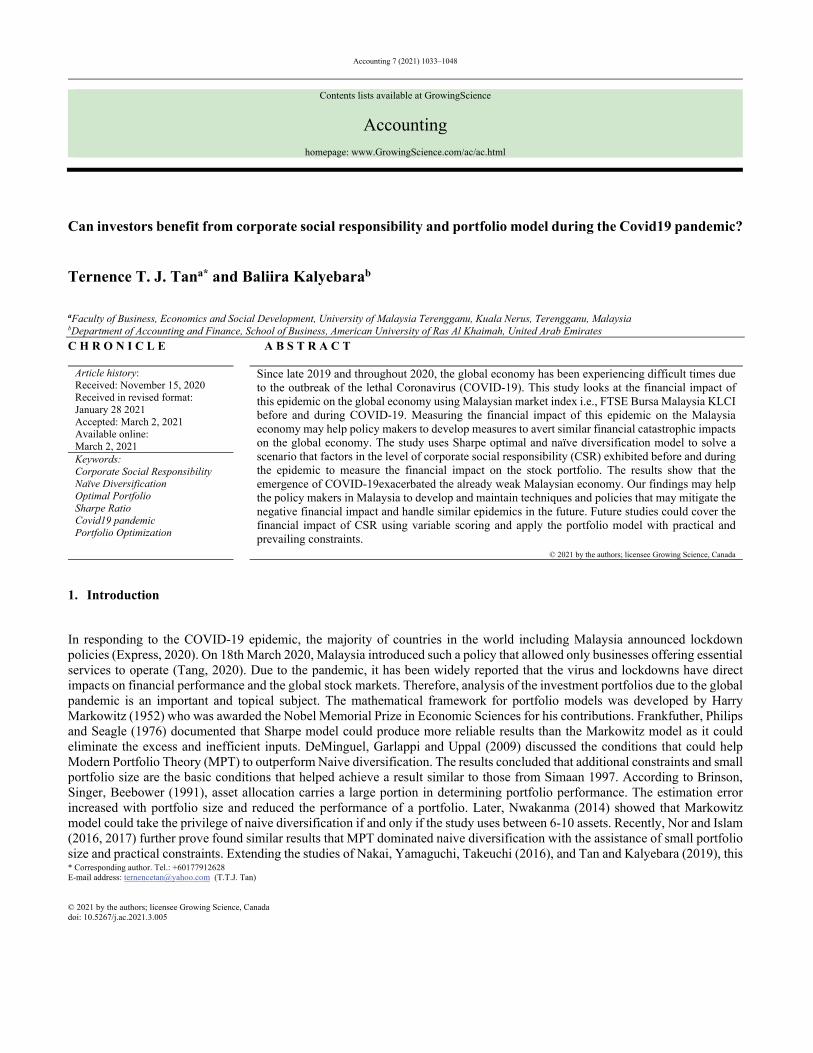
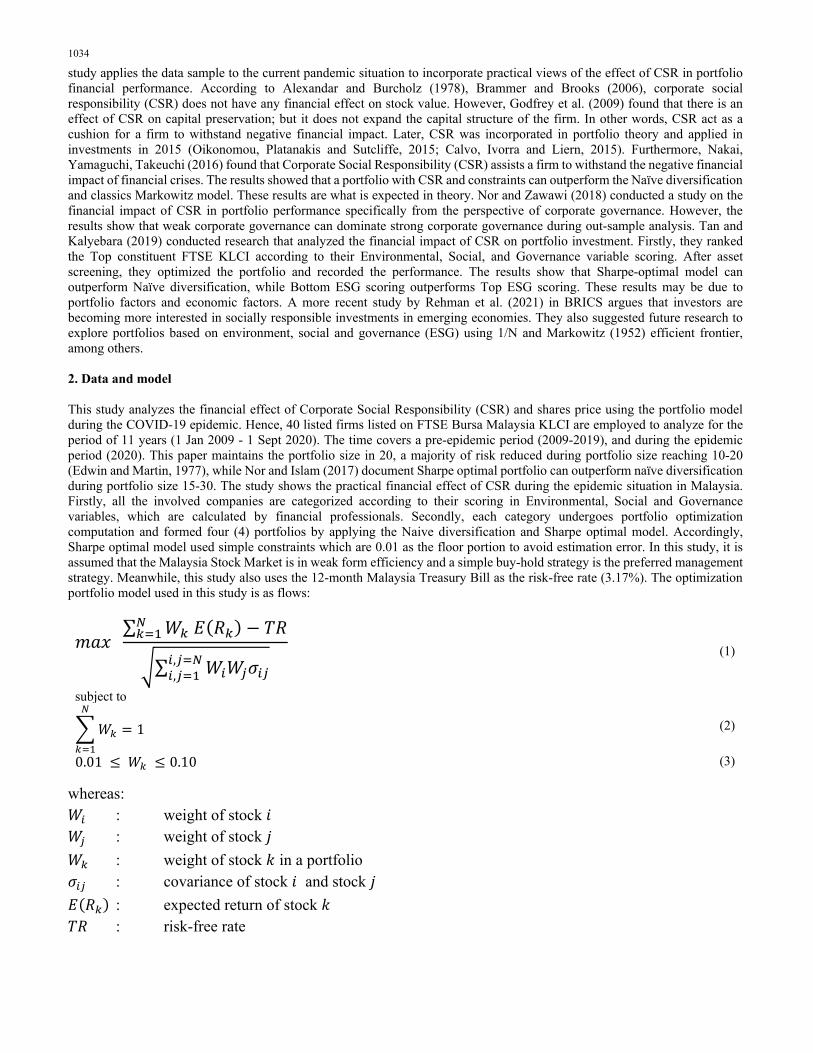
The goal of this study is to find out the financial impact of incorporating CSR into the investment portfolio of stocks listed on KLCI in Malaysia before and during COVID-19. Therefore, the sample data covers the pre-epidemic period (Oct 2018 - Dec 2019) and the COVID-19 period from Jan 2020 to Sept 2020. The results from the investment portfolios constructed show that Sharpe optimal model produces higher stock prices than the naive diversification.
Fig. 1. Composition of Bottom Rating Sharpe Optimal Portfolio
Fig. 2. Composition of High Rating Sharpe Optimal Portfolio
Table 1 Optimization report (Bottom Rating portfolio 20)
Objective Cell (Max) Cell Name Original Value Final Value
$D$168 Sharpe Ratio 5.4756 8.2319
Variable Cells Cell Name Original Value Final Value Integer
$C$165 WEIGHT NESTLE (MALAYSIA) 0.0500 0.1000 Contin $D$165 WEIGHT HAP SENG CONSOLIDATED 0.0500 0.1000 Contin $E$165 WEIGHT HARTALEGA HOLDINGS 0.0500 0.1000 Contin $F$165 WEIGHT PRESS METAL ALUMINIUM HOLDINGS 0.0500 0.0641 Contin $G$165 WEIGHT TOP GLOVE CORPORATION 0.0500 0.0713 Contin $H$165 WEIGHT FRASER & NEAVE HOLDINGS 0.0500 0.1000 Contin $I$165 WEIGHT MYEG SERVICE 0.0500 0.0702 Contin $J$165 WEIGHT HONG LEONG BANK 0.0500 0.1000 Contin $K$165 WEIGHT DIALOG GROUP 0.0500 0.1000 Contin $L$165 WEIGHT AMMB HOLDINGS 0.0500 0.0100 Contin $M$165 WEIGHT PETRONAS GAS 0.0500 0.0100 Contin $N$165 WEIGHT MALAYSIA AIRPORTS HDG 0.0500 0.0100 Contin $O$165 WEIGHT ALLIANCE BANK MALAYSIA 0.0500 0.0100 Contin $P$165 WEIGHT KUALA LUMPUR KEPONG 0.0500 0.0100 Contin $Q$165 WEIGHT HONG LEONG FINL GP. 0.0500 0.0944 Contin $R$165 WEIGHT GENTING 0.0500 0.0100 Contin $S$165 WEIGHT PPB GROUP 0.0500 0.0100 Contin $T$165 WEIGHT AIRASIA GROUP 0.0500 0.0100 Contin $U$165 WEIGHT UMV HOLDINGS 0.0500 0.0100 Contin $V$165 WEIGHT SP SETIA 0.0500 0.0100 Contin
Note: GRG Nonlinear undergoes 35 time of iteration with 53.5 seconds to find a solution that satisfied all the constraints and optimality. Option applied are Max Time unlimited, iterations unlimited, precision 0.000001,use Automatic Scaling, Show iteration results convergence 0.0001,population size 100, random seed 0, derivatives forward, require bounds, Max subproblem unlimited, Max integer Tolerance 1%, assume non negative.
1036
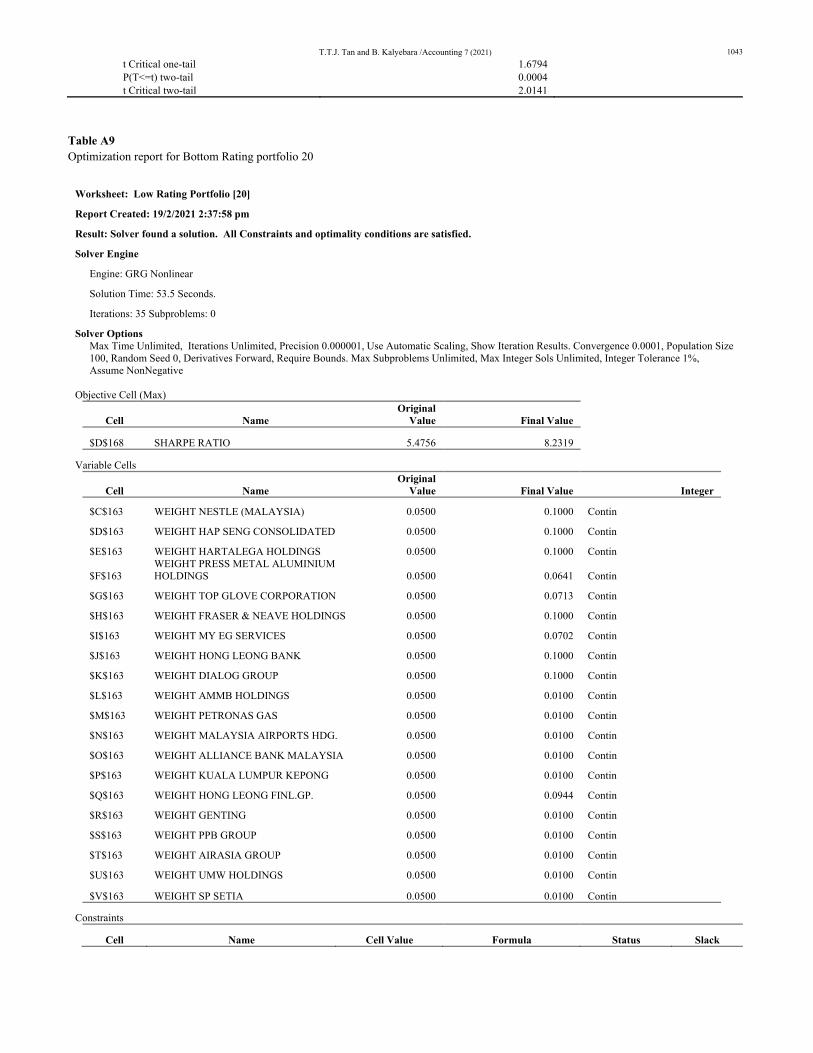
In this study, Sharpe optimal model maintains a minimum portion of (0.01) and a maximum (0.10) to maintain the diversification effect. According to strategic asset allocation, Sharpe optimal can allocate the portion on the stock that has performed well in sample analysis. Thus, this may be the reason that supports the higher stock price. Furthermore, Bottom rating stocks perform better than Top rating stocks during the comparison period between both sets of portfolios by using the same model. See Tables A5 and A6 in the Appendix for further details. In Fig. 1 and Fig. 2, we show the differences between Bottom and High ratings Sharpe optimal models. From the perspective of the optimization process, the Bottom portfolio optimization process takes 53.5 second and 35 iterations to maximize 50.34% (from 5.4756 to 8.2319) of Sharpe Ratio value, while Top portfolio optimization process takes 4.45 second and 23 iterations to maximize 36.88% (from -1.4782 to -0.9330). All the results satisfied the constraints and reached their optimal level. In other words, these analyses confirm the optimality of our portfolios (refer to Tables 1 and 2 while detailed reports can be seen in Tables A9 and A10).
Table 2 Optimization report (High Rating portfolio 20)
Objective Cell (Max) Cell Name Original Value Final Value
$E$168 Sharpe Ratio (1.4782) (0.9330) Variable Cells
Cell Name Original Value Final Value Integer $C$163 WEIGHT MALAYAN BANKING 0.0500 0.0900 Contin $D$163 WEIGHT TENAGA NASIONAL 0.0500 0.0100 Contin $E$163 WEIGHT CIMB GROUP HOLDING 0.0500 0.0100 Contin $F$163 WEIGHT GENTING MALAYSIA 0.0500 0.0100 Contin $G$163 WEIGHT IOI CORPORATION 0.0500 0.1000 Contin $H$163 WEIGHT BURSA MALAYSIA 0.0500 0.1000 Contin $I$163 WEIGHT UEM SUNRISE 0.0500 0.1000 Contin $J$163 WEIGHT BRIT.AMER.TOB.(MALAYSIA) 0.0500 0.0100 Contin $K$163 WEIGHT TELEKOM MALAYSIA 0.0500 0.0100 Contin $L$163 WEIGHT DIGI.COM 0.0500 0.0100 Contin $M$163 WEIGHT AXIATA GROUP 0.0500 0.1000 Contin $N$163 WEIGHT YTL CORPORATION 0.0500 0.0100 Contin $O$163 WEIGHT RHB BANK BHD 0.0500 0.1000 Contin $P$163 WEIGHT PUBLIC BANK 0.0500 0.1000 Contin $Q$163 WEIGHT IJM CORPORATION 0.0500 0.0100 Contin $R$163 WEIGHT GENTING 0.0500 0.1000 Contin $S$163 WEIGHTYTL POWER INTERNATIONAL 0.0500 0.0100 Contin $T$163 WEIGHT GAMUDA 0.0500 0.0100 Contin $U$163 WEIGHT SIME DARBY 0.0500 0.1000 Contin $V$163 WEIGHT MISC BHD 0.0500 0.0100 Contin
Note: GRG Nonlinear undergoes 23 time of iteration with4. seconds to find a solution that satisfied all the constraints and optimality. Option applied are Max Time unlimited, iterations unlimited, precision 0.000001, use Automatic Scaling, Show iteration results convergence 0.0001,population size 100, random seed 0, derivatives forward, require bounds, Max subproblem unlimited, Max integer Tolerance 1%, assume non negative.
It can be seen in Fig. 1 and Fig. 2 that the composition both portfolios is able to maintain the effect of diversification as it allocates a portion in each asset which is considered as well performing. However, Table 3 shows our results, which may indicate that the top rating stocks fail to withstand the financial impact of the pandemic. Table 3 Summary of results
Bottom High Naïve Sharpe Naïve Sharpe In -Sample Out Analysis In -Sample Out Analysis In -Sample Out Analysis In -Sample Out Analysis Portfolio return 1.44% 6.45% 1.97% 10.13% (0.13%) (2.10%) (0.05%) (1.59%) Annualize 18.71% 111.78% 26.39% 218.36% (1.55%) (22.50%) (0.55%) (17.49%) Portfolio risk 2.84% 10.02% 2.82% 13.62% 3.19% 4.90% 3.98% 4.85% Sortino Ratio 24.73 15.91 (5.65) (2.21) Sharpe Ratio 5.48 10.84 8.23 15.80 (1.48) (5.24) (0.93) (4.26)
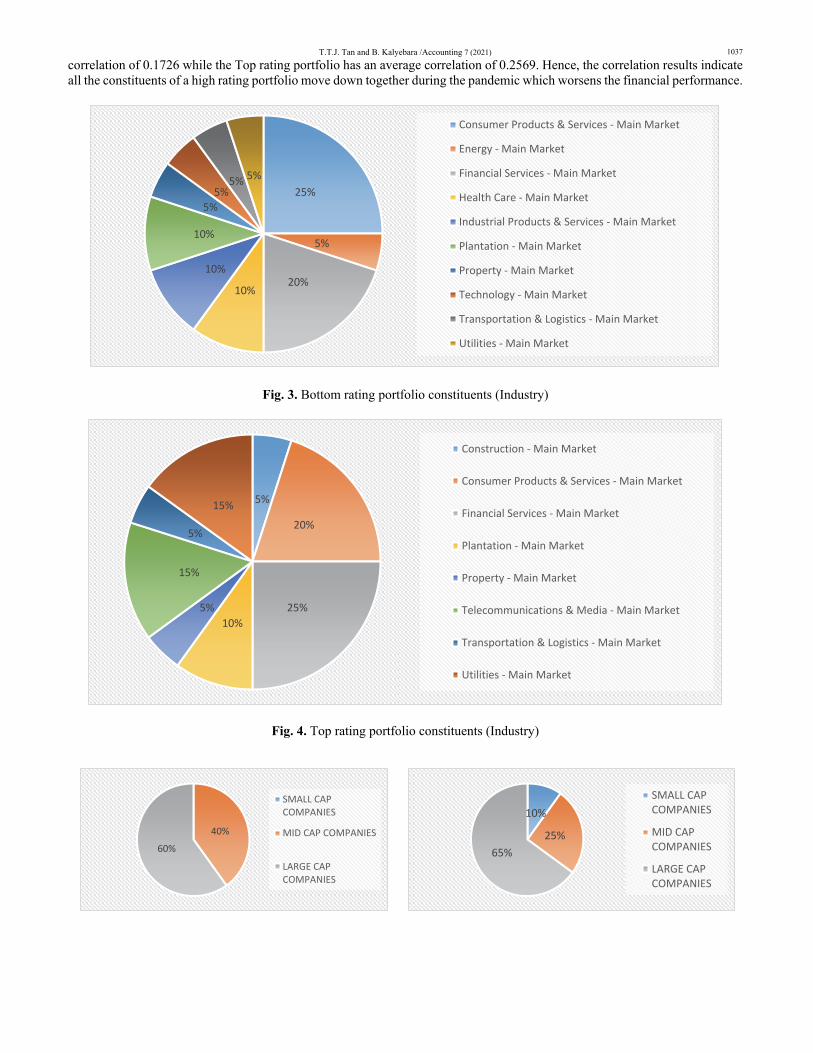
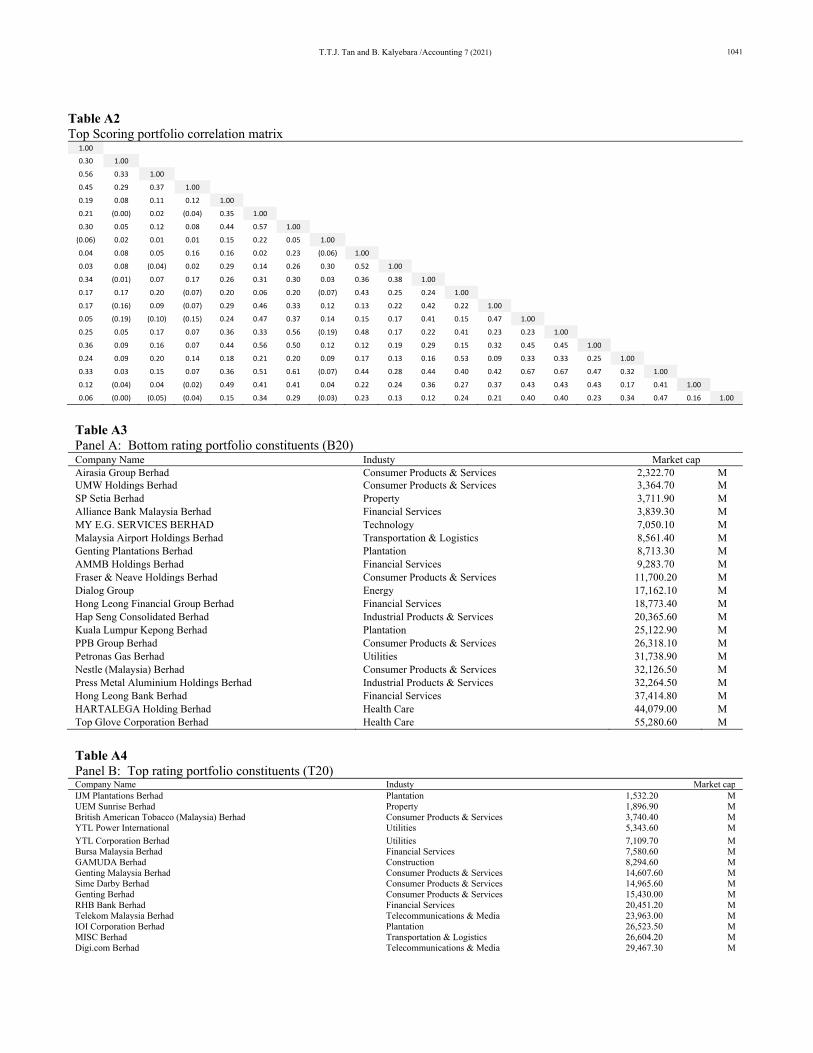
One of the possible reasons could be due to the effectiveness of diversification and asset allocation. Firstly, Fig. 3 and Fig. 4 show the different industries that are involved and Bottom rating portfolios are invested in more variety industries than Top rating. Accordingly, the bottom rating portfolio has high effectiveness compared to the top rating portfolio as Bottom rating portfolios are invested in more variety industries compared to Top rating. Statistically, the bottom rating portfolio has an average
T.T.J. Tan and B. Kalyebara /Accounting 7 (2021) 1037
correlation of 0.1726 while the Top rating portfolio has an average correlation of 0.2569. Hence, the correlation results indicate all the constituents of a high rating portfolio move down together during the pandemic which worsens the financial performance.
Fig. 3. Bottom rating portfolio constituents (Industry)
Fig. 4. Top rating portfolio constituents (Industry)
25%
5%
20%10%
10%
10%
5%5%
5% 5%
Consumer Products & Services - Main Market
Energy - Main Market
Financial Services - Main Market
Health Care - Main Market
Industrial Products & Services - Main Market
Plantation - Main Market
Property - Main Market
Technology - Main Market
Transportation & Logistics - Main Market
Utilities - Main Market
5%
20%
25%10%
5%
15%
5%
15%
Construction - Main Market
Consumer Products & Services - Main Market
Financial Services - Main Market
Plantation - Main Market
Property - Main Market
Telecommunications & Media - Main Market
Transportation & Logistics - Main Market
Utilities - Main Market
40%60%
SMALL CAPCOMPANIES
MID CAP COMPANIES
LARGE CAPCOMPANIES
10%
25%65%
SMALL CAPCOMPANIES
MID CAPCOMPANIES
LARGE CAPCOMPANIES
1038
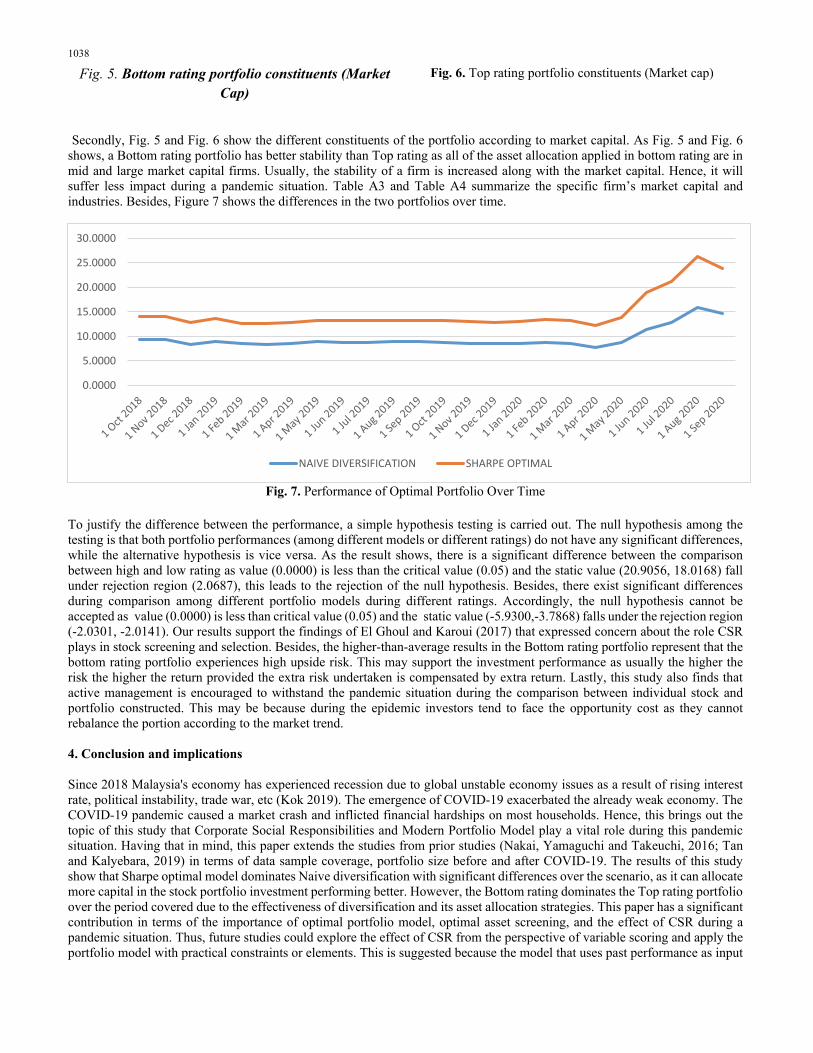
Fig. 5. Bottom rating portfolio constituents (Market Cap)
Fig. 6. Top rating portfolio constituents (Market cap)
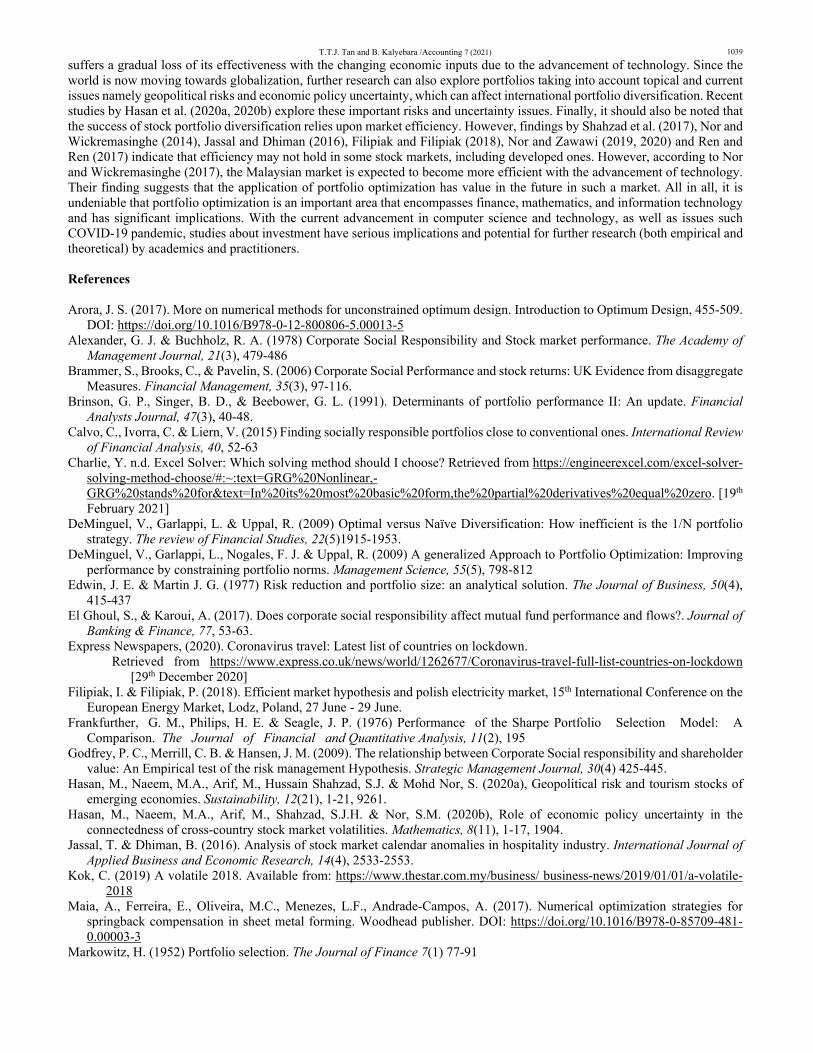
Secondly, Fig. 5 and Fig. 6 show the different constituents of the portfolio according to market capital. As Fig. 5 and Fig. 6 shows, a Bottom rating portfolio has better stability than Top rating as all of the asset allocation applied in bottom rating are in mid and large market capital firms. Usually, the stability of a firm is increased along with the market capital. Hence, it will suffer less impact during a pandemic situation. Table A3 and Table A4 summarize the specific firm’s market capital and industries. Besides, Figure 7 shows the differences in the two portfolios over time.
Fig. 7. Performance of Optimal Portfolio Over Time
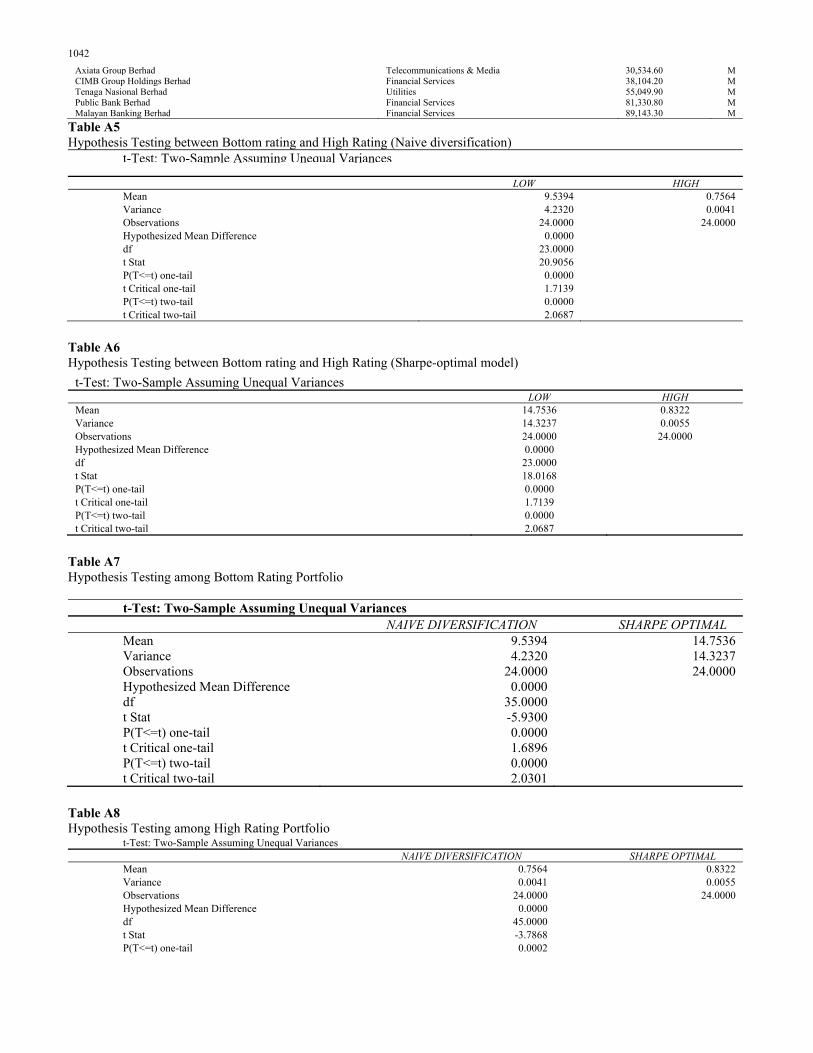
To justify the difference between the performance, a simple hypothesis testing is carried out. The null hypothesis among the testing is that both portfolio performances (among different models or different ratings) do not have any significant differences, while the alternative hypothesis is vice versa. As the result shows, there is a significant difference between the comparison between high and low rating as value (0.0000) is less than the critical value (0.05) and the static value (20.9056, 18.0168) fall under rejection region (2.0687), this leads to the rejection of the null hypothesis. Besides, there exist significant differences during comparison among different portfolio models during different ratings. Accordingly, the null hypothesis cannot be accepted as value (0.0000) is less than critical value (0.05) and the static value (-5.9300,-3.7868) falls under the rejection region (-2.0301, -2.0141). Our results support the findings of El Ghoul and Karoui (2017) that expressed concern about the role CSR plays in stock screening and selection. Besides, the higher-than-average results in the Bottom rating portfolio represent that the bottom rating portfolio experiences high upside risk. This may support the investment performance as usually the higher the risk the higher the return provided the extra risk undertaken is compensated by extra return. Lastly, this study also finds that active management is encouraged to withstand the pandemic situation during the comparison between individual stock and portfolio constructed. This may be because during the epidemic investors tend to face the opportunity cost as they cannot rebalance the portion according to the market trend. 4. Conclusion and implications Since 2018 Malaysia's economy has experienced recession due to global unstable economy issues as a result of rising interest rate, political instability, trade war, etc (Kok 2019). The emergence of COVID-19 exacerbated the already weak economy. The COVID-19 pandemic caused a market crash and inflicted financial hardships on most households. Hence, this brings out the topic of this study that Corporate Social Responsibilities and Modern Portfolio Model play a vital role during this pandemic situation. Having that in mind, this paper extends the studies from prior studies (Nakai, Yamaguchi and Takeuchi, 2016; Tan and Kalyebara, 2019) in terms of data sample coverage, portfolio size before and after COVID-19. The results of this study show that Sharpe optimal model dominates Naive diversification with significant differences over the scenario, as it can allocate more capital in the stock portfolio investment performing better. However, the Bottom rating dominates the Top rating portfolio over the period covered due to the effectiveness of diversification and its asset allocation strategies. This paper has a significant contribution in terms of the importance of optimal portfolio model, optimal asset screening, and the effect of CSR during a pandemic situation. Thus, future studies could explore the effect of CSR from the perspective of variable scoring and apply the portfolio model with practical constraints or elements. This is suggested because the model that uses past performance as input
0.0000
5.0000
10.0000
15.0000
20.0000
25.0000
30.0000
NAIVE DIVERSIFICATION SHARPE OPTIMAL
T.T.J. Tan and B. Kalyebara /Accounting 7 (2021) 1039
suffers a gradual loss of its effectiveness with the changing economic inputs due to the advancement of technology. Since the world is now moving towards globalization, further research can also explore portfolios taking into account topical and current issues namely geopolitical risks and economic policy uncertainty, which can affect international portfolio diversification. Recent studies by Hasan et al. (2020a, 2020b) explore these important risks and uncertainty issues. Finally, it should also be noted that the success of stock portfolio diversification relies upon market efficiency. However, findings by Shahzad et al. (2017), Nor and Wickremasinghe (2014), Jassal and Dhiman (2016), Filipiak and Filipiak (2018), Nor and Zawawi (2019, 2020) and Ren and Ren (2017) indicate that efficiency may not hold in some stock markets, including developed ones. However, according to Nor and Wickremasinghe (2017), the Malaysian market is expected to become more efficient with the advancement of technology. Their finding suggests that the application of portfolio optimization has value in the future in such a market. All in all, it is undeniable that portfolio optimization is an important area that encompasses finance, mathematics, and information technology and has significant implications. With the current advancement in computer science and technology, as well as issues such COVID-19 pandemic, studies about investment have serious implications and potential for further research (both empirical and theoretical) by academics and practitioners. References Arora, J. S. (2017). More on numerical methods for unconstrained optimum design. Introduction to Optimum Design, 455-509.
DOI: https://doi.org/10.1016/B978-0-12-800806-5.00013-5 Alexander, G. J. & Buchholz, R. A. (1978) Corporate Social Responsibility and Stock market performance. The Academy of
Management Journal, 21(3), 479-486 Brammer, S., Brooks, C., & Pavelin, S. (2006) Corporate Social Performance and stock returns: UK Evidence from disaggregate
Measures. Financial Management, 35(3), 97-116. Brinson, G. P., Singer, B. D., & Beebower, G. L. (1991). Determinants of portfolio performance II: An update. Financial
Analysts Journal, 47(3), 40-48. Calvo, C., Ivorra, C. & Liern, V. (2015) Finding socially responsible portfolios close to conventional ones. International Review
of Financial Analysis, 40, 52-63 Charlie, Y. n.d. Excel Solver: Which solving method should I choose? Retrieved from https://engineerexcel.com/excel-solver-
solving-method-choose/#:~:text=GRG%20Nonlinear,-GRG%20stands%20for&text=In%20its%20most%20basic%20form,the%20partial%20derivatives%20equal%20zero. [19th February 2021]
DeMinguel, V., Garlappi, L. & Uppal, R. (2009) Optimal versus Naïve Diversification: How inefficient is the 1/N portfolio strategy. The review of Financial Studies, 22(5)1915-1953.
DeMinguel, V., Garlappi, L., Nogales, F. J. & Uppal, R. (2009) A generalized Approach to Portfolio Optimization: Improving performance by constraining portfolio norms. Management Science, 55(5), 798-812
Edwin, J. E. & Martin J. G. (1977) Risk reduction and portfolio size: an analytical solution. The Journal of Business, 50(4), 415-437
El Ghoul, S., & Karoui, A. (2017). Does corporate social responsibility affect mutual fund performance and flows?. Journal of Banking & Finance, 77, 53-63.
Express Newspapers, (2020). Coronavirus travel: Latest list of countries on lockdown. Retrieved from https://www.express.co.uk/news/world/1262677/Coronavirus-travel-full-list-countries-on-lockdown
[29th December 2020] Filipiak, I. & Filipiak, P. (2018). Efficient market hypothesis and polish electricity market, 15th International Conference on the
European Energy Market, Lodz, Poland, 27 June - 29 June. Frankfurther, G. M., Philips, H. E. & Seagle, J. P. (1976) Performance of the Sharpe Portfolio Selection Model: A
Comparison. The Journal of Financial and Quantitative Analysis, 11(2), 195 Godfrey, P. C., Merrill, C. B. & Hansen, J. M. (2009). The relationship between Corporate Social responsibility and shareholder
value: An Empirical test of the risk management Hypothesis. Strategic Management Journal, 30(4) 425-445. Hasan, M., Naeem, M.A., Arif, M., Hussain Shahzad, S.J. & Mohd Nor, S. (2020a), Geopolitical risk and tourism stocks of
emerging economies. Sustainability, 12(21), 1-21, 9261. Hasan, M., Naeem, M.A., Arif, M., Shahzad, S.J.H. & Nor, S.M. (2020b), Role of economic policy uncertainty in the
connectedness of cross-country stock market volatilities. Mathematics, 8(11), 1-17, 1904. Jassal, T. & Dhiman, B. (2016). Analysis of stock market calendar anomalies in hospitality industry. International Journal of
Applied Business and Economic Research, 14(4), 2533-2553. Kok, C. (2019) A volatile 2018. Available from: https://www.thestar.com.my/business/ business-news/2019/01/01/a-volatile-
2018 Maia, A., Ferreira, E., Oliveira, M.C., Menezes, L.F., Andrade-Campos, A. (2017). Numerical optimization strategies for
springback compensation in sheet metal forming. Woodhead publisher. DOI: https://doi.org/10.1016/B978-0-85709-481-0.00003-3
Markowitz, H. (1952) Portfolio selection. The Journal of Finance 7(1) 77-91
1040
Nakai, M., Yamaguchi, K., Takeuchi, K. (2016) Can SRI Funds better resist global financial crisis? Evidence from Japan. International Review of Financial Analysis, 48, 12-20
Nor, S. M. & Islam, S. M. N. (2017) Further examination of the 1/N portfolio rule: a comparison against Sharpe-optimal portfolios under varying constraints. Economic Annals-ХХI, 166(7-8), 56-60
Nor, S. M. & Islam, S. M. N. (2016) Beating the market: Can evolutionary-based portfolio optimisation outperform the Talmudic diversification strategy? International Journal of Monetary Economics and Finance 9(1), 90-99.
Nor, S. M. & Wickremasinghe, G. (2014). The profitability of MACD and RSI trading rules in the Australian stock market. Investment Management and Financial Innovations, 11(4), 194-199.
Nor, S. M. & Wickremasinghe, G. (2017). Market efficiency and technical analysis during different market phases: further evidence from Malaysia. Investment Management and Financial Innovations, 14(2), 359-366.
Nor, S. M. & Zawawi, N. H. M. (2018). Optimal portfolios vis-à-vis corporate governance ratings: Some UK evidence. Economic Annals-ХХI. 170, 57-63
Nor, S. M. & Zawawi, N. H. M. (2019). Does technical analysis work in the Russian market? Insights from MICEX (MOEX Russia) Index component stocks. Economic Annals-XXI, 178(7-8), 114-122.
Nor, S. M. & Zawawi, N. H. M. (2020). A neural network approach for fundamental investment analysis: A case of Athens stock exchange. Economic Annals-XXI, 182(3-4), 56-63.
Nwakanma, P. C. (2014). Talmud and Markowitz Diversification Strategies: Evidence from Nigerian Stock Market. Accounting and Finance Research 3(2), 145-152
Oikonomou, I., Platanakis, E., & Sutcliffe, C. (2018). Socially responsible investment portfolios: Does the optimization process matter?. The British Accounting Review, 50(4), 379-401.
Rehman, R. U., Abidin, M. Z. U., Ali, R., Nor, S. M., Naseem, M. A., Hasan, M., & Ahmad, M. I. (2021) The Integration of Conventional Equity Indices with Environmental, Social, and Governance Indices: Evidence from Emerging Economies. Sustainability, 13(2), 676. https://doi.org/10.3390/su13020676
Ren, L. & Ren, P. (2017). Testing the market efficiency by mean absolute deviation. Benchmarking, 24(7), 2049-2062. Shahzad, S.J.H., Nor, S.M., Mensi, W. & Kumar, R.R. (2017). Examining the efficiency and interdependence of US credit and
stock markets through MF-DFA and MF-DXA approaches. Physica A: Statistical Mechanics and its Applications, 471, 351–363.
Simaan, Y. (1997) Estimation risk in portfolio selection: The Mean Variance Model versus the Mean Absolute Deviation Model. Management Science, 43(10), 1437-1446
Tan, T. J. & Kalyebara, B. (2019) Customized CSR Ratings and Optimal Sharpe Portfolios in the Bursa Malaysia. International Journal of Recent Technology and Engineering, 8(3) 2640-2644
Tang, K. Ho. D. (2020). Movement Control as An Effective Measure Against COVID-19 Spread in Malaysia: An Overview. DOI: 10.1007/s10389-020-01316-w
The Economic at large, n.d .Arithmetic, Harmonic, and Geometric Means with R. Retrieved from http://economistatlarge.com/r-guide/arithmetic-harmonic-geometric-means-r [20th June 2018]
Appendix
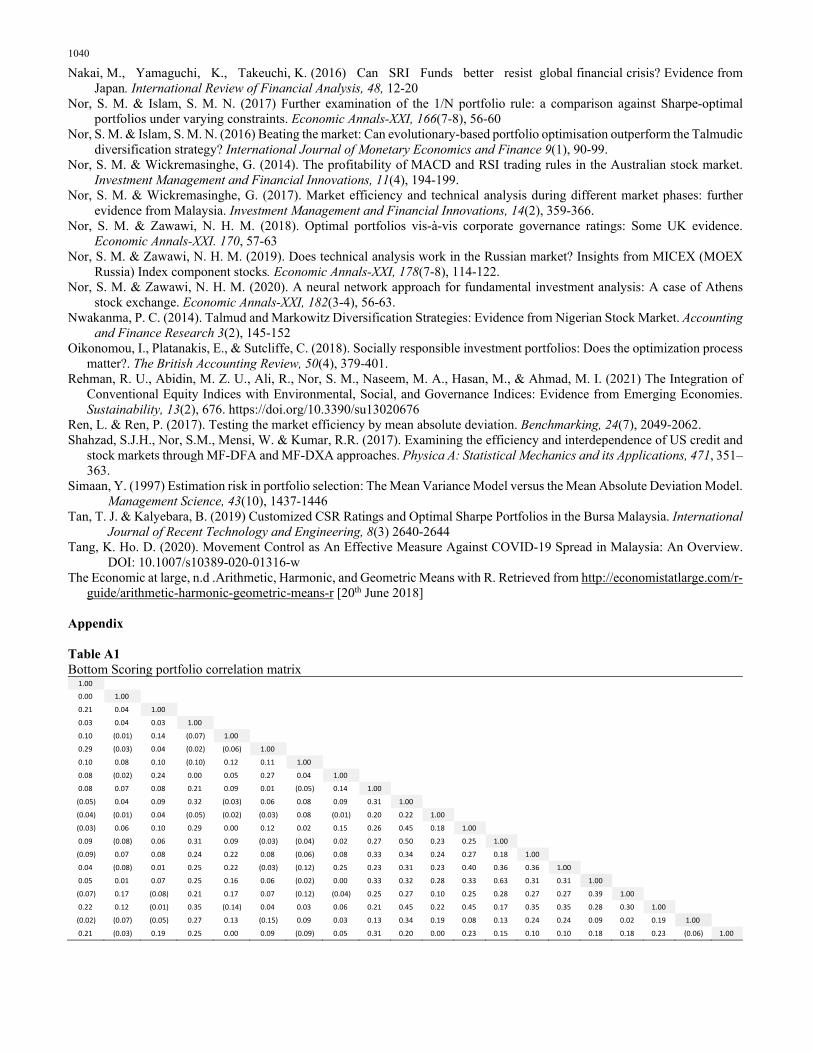
ble A1aT Bottom Scoring portfolio correlation matrix
1.00 0.00 1.00 0.21 0.04 1.00 0.03 0.04 0.03 1.00 0.10 (0.01) 0.14 (0.07) 1.00 0.29 (0.03) 0.04 (0.02) (0.06) 1.00 0.10 0.08 0.10 (0.10) 0.12 0.11 1.00 0.08 (0.02) 0.24 0.00 0.05 0.27 0.04 1.00 0.08 0.07 0.08 0.21 0.09 0.01 (0.05) 0.14 1.00 (0.05) 0.04 0.09 0.32 (0.03) 0.06 0.08 0.09 0.31 1.00 (0.04) (0.01) 0.04 (0.05) (0.02) (0.03) 0.08 (0.01) 0.20 0.22 1.00 (0.03) 0.06 0.10 0.29 0.00 0.12 0.02 0.15 0.26 0.45 0.18 1.00 0.09 (0.08) 0.06 0.31 0.09 (0.03) (0.04) 0.02 0.27 0.50 0.23 0.25 1.00 (0.09) 0.07 0.08 0.24 0.22 0.08 (0.06) 0.08 0.33 0.34 0.24 0.27 0.18 1.00 0.04 (0.08) 0.01 0.25 0.22 (0.03) (0.12) 0.25 0.23 0.31 0.23 0.40 0.36 0.36 1.00 0.05 0.01 0.07 0.25 0.16 0.06 (0.02) 0.00 0.33 0.32 0.28 0.33 0.63 0.31 0.31 1.00 (0.07) 0.17 (0.08) 0.21 0.17 0.07 (0.12) (0.04) 0.25 0.27 0.10 0.25 0.28 0.27 0.27 0.39 1.00 0.22 0.12 (0.01) 0.35 (0.14) 0.04 0.03 0.06 0.21 0.45 0.22 0.45 0.17 0.35 0.35 0.28 0.30 1.00 (0.02) (0.07) (0.05) 0.27 0.13 (0.15) 0.09 0.03 0.13 0.34 0.19 0.08 0.13 0.24 0.24 0.09 0.02 0.19 1.00 0.21 (0.03) 0.19 0.25 0.00 0.09 (0.09) 0.05 0.31 0.20 0.00 0.23 0.15 0.10 0.10 0.18 0.18 0.23 (0.06) 1.00
T.T.J. Tan and B. Kalyebara /Accounting 7 (2021) 1041
ble A2aT Top Scoring portfolio correlation matrix
1.00 0.30 1.00 0.56 0.33 1.00 0.45 0.29 0.37 1.00 0.19 0.08 0.11 0.12 1.00 0.21 (0.00) 0.02 (0.04) 0.35 1.00 0.30 0.05 0.12 0.08 0.44 0.57 1.00
(0.06) 0.02 0.01 0.01 0.15 0.22 0.05 1.00 0.04 0.08 0.05 0.16 0.16 0.02 0.23 (0.06) 1.00 0.03 0.08 (0.04) 0.02 0.29 0.14 0.26 0.30 0.52 1.00 0.34 (0.01) 0.07 0.17 0.26 0.31 0.30 0.03 0.36 0.38 1.00 0.17 0.17 0.20 (0.07) 0.20 0.06 0.20 (0.07) 0.43 0.25 0.24 1.00 0.17 (0.16) 0.09 (0.07) 0.29 0.46 0.33 0.12 0.13 0.22 0.42 0.22 1.00 0.05 (0.19) (0.10) (0.15) 0.24 0.47 0.37 0.14 0.15 0.17 0.41 0.15 0.47 1.00 0.25 0.05 0.17 0.07 0.36 0.33 0.56 (0.19) 0.48 0.17 0.22 0.41 0.23 0.23 1.00 0.36 0.09 0.16 0.07 0.44 0.56 0.50 0.12 0.12 0.19 0.29 0.15 0.32 0.45 0.45 1.00 0.24 0.09 0.20 0.14 0.18 0.21 0.20 0.09 0.17 0.13 0.16 0.53 0.09 0.33 0.33 0.25 1.00 0.33 0.03 0.15 0.07 0.36 0.51 0.61 (0.07) 0.44 0.28 0.44 0.40 0.42 0.67 0.67 0.47 0.32 1.00 0.12 (0.04) 0.04 (0.02) 0.49 0.41 0.41 0.04 0.22 0.24 0.36 0.27 0.37 0.43 0.43 0.43 0.17 0.41 1.00 0.06 (0.00) (0.05) (0.04) 0.15 0.34 0.29 (0.03) 0.23 0.13 0.12 0.24 0.21 0.40 0.40 0.23 0.34 0.47 0.16 1.00
3 ble AaT
Panel A: Bottom rating portfolio constituents (B20) Company Name Industy Market cap Airasia Group Berhad Consumer Products & Services 2,322.70 M UMW Holdings Berhad Consumer Products & Services 3,364.70 M SP Setia Berhad Property 3,711.90 M Alliance Bank Malaysia Berhad Financial Services 3,839.30 M MY E.G. SERVICES BERHAD Technology 7,050.10 M Malaysia Airport Holdings Berhad Transportation & Logistics 8,561.40 M Genting Plantations Berhad Plantation 8,713.30 M AMMB Holdings Berhad Financial Services 9,283.70 M Fraser & Neave Holdings Berhad Consumer Products & Services 11,700.20 M Dialog Group Energy 17,162.10 M Hong Leong Financial Group Berhad Financial Services 18,773.40 M Hap Seng Consolidated Berhad Industrial Products & Services 20,365.60 M Kuala Lumpur Kepong Berhad Plantation 25,122.90 M PPB Group Berhad Consumer Products & Services 26,318.10 M Petronas Gas Berhad Utilities 31,738.90 M Nestle (Malaysia) Berhad Consumer Products & Services 32,126.50 M Press Metal Aluminium Holdings Berhad Industrial Products & Services 32,264.50 M Hong Leong Bank Berhad Financial Services 37,414.80 M HARTALEGA Holding Berhad Health Care 44,079.00 M Top Glove Corporation Berhad Health Care 55,280.60 M
4 ble AaT
Panel B: Top rating portfolio constituents (T20) Company Name Industy Market cap IJM Plantations Berhad Plantation 1,532.20 M UEM Sunrise Berhad Property 1,896.90 M British American Tobacco (Malaysia) Berhad Consumer Products & Services 3,740.40 M YTL Power International Utilities 5,343.60 M YTL Corporation Berhad Utilities 7,109.70 M Bursa Malaysia Berhad Financial Services 7,580.60 M GAMUDA Berhad Construction 8,294.60 M Genting Malaysia Berhad Consumer Products & Services 14,607.60 M Sime Darby Berhad Consumer Products & Services 14,965.60 M Genting Berhad Consumer Products & Services 15,430.00 M RHB Bank Berhad Financial Services 20,451.20 M Telekom Malaysia Berhad Telecommunications & Media 23,963.00 M IOI Corporation Berhad Plantation 26,523.50 M MISC Berhad Transportation & Logistics 26,604.20 M Digi.com Berhad Telecommunications & Media 29,467.30 M
1042Axiata Group Berhad Telecommunications & Media 30,534.60 M CIMB Group Holdings Berhad Financial Services 38,104.20 M Tenaga Nasional Berhad Utilities 55,049.90 M Public Bank Berhad Financial Services 81,330.80 M Malayan Banking Berhad Financial Services 89,143.30 M
Table A5 Hypothesis Testing between Bottom rating and High Rating (Naive diversification)
t-Test: Two-Sample Assuming Unequal Variances
LOW HIGH Mean 9.5394 0.7564 Variance 4.2320 0.0041 Observations 24.0000 24.0000 Hypothesized Mean Difference 0.0000 df 23.0000 t Stat 20.9056 P(T<=t) one-tail 0.0000 t Critical one-tail 1.7139 P(T<=t) two-tail 0.0000 t Critical two-tail 2.0687
Table A6 Hypothesis Testing between Bottom rating and High Rating (Sharpe-optimal model)
t-Test: Two-Sample Assuming Unequal Variances LOW HIGH
Mean 14.7536 0.8322 Variance 14.3237 0.0055 Observations 24.0000 24.0000 Hypothesized Mean Difference 0.0000 df 23.0000 t Stat 18.0168 P(T<=t) one-tail 0.0000 t Critical one-tail 1.7139 P(T<=t) two-tail 0.0000 t Critical two-tail 2.0687
Table A7 Hypothesis Testing among Bottom Rating Portfolio
t-Test: Two-Sample Assuming Unequal Variances
NAIVE DIVERSIFICATION SHARPE OPTIMAL Mean 9.5394 14.7536 Variance 4.2320 14.3237 Observations 24.0000 24.0000 Hypothesized Mean Difference 0.0000 df 35.0000 t Stat -5.9300 P(T<=t) one-tail 0.0000 t Critical one-tail 1.6896 P(T<=t) two-tail 0.0000 t Critical two-tail 2.0301
Table A8 Hypothesis Testing among High Rating Portfolio
t-Test: Two-Sample Assuming Unequal Variances NAIVE DIVERSIFICATION SHARPE OPTIMAL
Mean 0.7564 0.8322 Variance 0.0041 0.0055 Observations 24.0000 24.0000 Hypothesized Mean Difference 0.0000 df 45.0000 t Stat -3.7868 P(T<=t) one-tail 0.0002
T.T.J. Tan and B. Kalyebara /Accounting 7 (2021) 1043t Critical one-tail 1.6794 P(T<=t) two-tail 0.0004 t Critical two-tail 2.0141
Table A9 Optimization report for Bottom Rating portfolio 20
Worksheet: Low Rating Portfolio [20]
Report Created: 19/2/2021 2:37:58 pm
Result: Solver found a solution. All Constraints and optimality conditions are satisfied.
Solver Engine
Engine: GRG Nonlinear
Solution Time: 53.5 Seconds.
Iterations: 35 Subproblems: 0
Solver Options
Max Time Unlimited, Iterations Unlimited, Precision 0.000001, Use Automatic Scaling, Show Iteration Results. Convergence 0.0001, Population Size 100, Random Seed 0, Derivatives Forward, Require Bounds. Max Subproblems Unlimited, Max Integer Sols Unlimited, Integer Tolerance 1%, Assume NonNegative
Objective Cell (Max)
Cell Name Original
Value Final Value
$D$168 SHARPE RATIO 5.4756 8.2319
Variable Cells
Cell Name Original
Value Final Value Integer
$C$163 WEIGHT NESTLE (MALAYSIA) 0.0500 0.1000 Contin
$D$163 WEIGHT HAP SENG CONSOLIDATED 0.0500 0.1000 Contin
$E$163 WEIGHT HARTALEGA HOLDINGS 0.0500 0.1000 Contin
$F$163 WEIGHT PRESS METAL ALUMINIUM HOLDINGS 0.0500 0.0641 Contin
$G$163 WEIGHT TOP GLOVE CORPORATION 0.0500 0.0713 Contin
$H$163 WEIGHT FRASER & NEAVE HOLDINGS 0.0500 0.1000 Contin
$I$163 WEIGHT MY EG SERVICES 0.0500 0.0702 Contin
$J$163 WEIGHT HONG LEONG BANK 0.0500 0.1000 Contin
$K$163 WEIGHT DIALOG GROUP 0.0500 0.1000 Contin
$L$163 WEIGHT AMMB HOLDINGS 0.0500 0.0100 Contin
$M$163 WEIGHT PETRONAS GAS 0.0500 0.0100 Contin
$N$163 WEIGHT MALAYSIA AIRPORTS HDG. 0.0500 0.0100 Contin
$O$163 WEIGHT ALLIANCE BANK MALAYSIA 0.0500 0.0100 Contin
$P$163 WEIGHT KUALA LUMPUR KEPONG 0.0500 0.0100 Contin
$Q$163 WEIGHT HONG LEONG FINL.GP. 0.0500 0.0944 Contin
$R$163 WEIGHT GENTING 0.0500 0.0100 Contin
$S$163 WEIGHT PPB GROUP 0.0500 0.0100 Contin
$T$163 WEIGHT AIRASIA GROUP 0.0500 0.0100 Contin
$U$163 WEIGHT UMW HOLDINGS 0.0500 0.0100 Contin
$V$163 WEIGHT SP SETIA 0.0500 0.0100 Contin
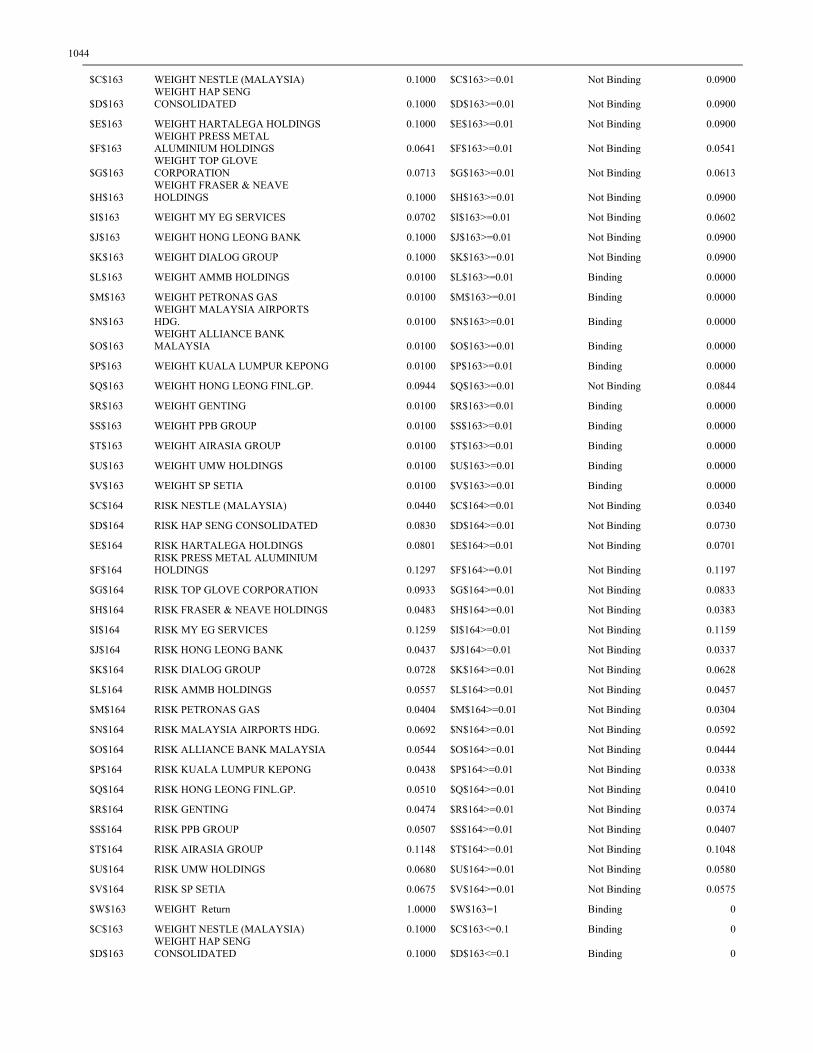
Constraints
Cell Name Cell Value Formula Status Slack
1044
$C$163 WEIGHT NESTLE (MALAYSIA) 0.1000 $C$163>=0.01 Not Binding 0.0900
$D$163 WEIGHT HAP SENG CONSOLIDATED 0.1000 $D$163>=0.01 Not Binding 0.0900
$E$163 WEIGHT HARTALEGA HOLDINGS 0.1000 $E$163>=0.01 Not Binding 0.0900
$F$163 WEIGHT PRESS METAL ALUMINIUM HOLDINGS 0.0641 $F$163>=0.01 Not Binding 0.0541
$G$163 WEIGHT TOP GLOVE CORPORATION 0.0713 $G$163>=0.01 Not Binding 0.0613
$H$163 WEIGHT FRASER & NEAVE HOLDINGS 0.1000 $H$163>=0.01 Not Binding 0.0900
$I$163 WEIGHT MY EG SERVICES 0.0702 $I$163>=0.01 Not Binding 0.0602
$J$163 WEIGHT HONG LEONG BANK 0.1000 $J$163>=0.01 Not Binding 0.0900
$K$163 WEIGHT DIALOG GROUP 0.1000 $K$163>=0.01 Not Binding 0.0900
$L$163 WEIGHT AMMB HOLDINGS 0.0100 $L$163>=0.01 Binding 0.0000
$M$163 WEIGHT PETRONAS GAS 0.0100 $M$163>=0.01 Binding 0.0000
$N$163 WEIGHT MALAYSIA AIRPORTS HDG. 0.0100 $N$163>=0.01 Binding 0.0000
$O$163 WEIGHT ALLIANCE BANK MALAYSIA 0.0100 $O$163>=0.01 Binding 0.0000
$P$163 WEIGHT KUALA LUMPUR KEPONG 0.0100 $P$163>=0.01 Binding 0.0000
$Q$163 WEIGHT HONG LEONG FINL.GP. 0.0944 $Q$163>=0.01 Not Binding 0.0844
$R$163 WEIGHT GENTING 0.0100 $R$163>=0.01 Binding 0.0000
$S$163 WEIGHT PPB GROUP 0.0100 $S$163>=0.01 Binding 0.0000
$T$163 WEIGHT AIRASIA GROUP 0.0100 $T$163>=0.01 Binding 0.0000
$U$163 WEIGHT UMW HOLDINGS 0.0100 $U$163>=0.01 Binding 0.0000
$V$163 WEIGHT SP SETIA 0.0100 $V$163>=0.01 Binding 0.0000
$C$164 RISK NESTLE (MALAYSIA) 0.0440 $C$164>=0.01 Not Binding 0.0340
$D$164 RISK HAP SENG CONSOLIDATED 0.0830 $D$164>=0.01 Not Binding 0.0730
$E$164 RISK HARTALEGA HOLDINGS 0.0801 $E$164>=0.01 Not Binding 0.0701
$F$164 RISK PRESS METAL ALUMINIUM HOLDINGS 0.1297 $F$164>=0.01 Not Binding 0.1197
$G$164 RISK TOP GLOVE CORPORATION 0.0933 $G$164>=0.01 Not Binding 0.0833
$H$164 RISK FRASER & NEAVE HOLDINGS 0.0483 $H$164>=0.01 Not Binding 0.0383
$I$164 RISK MY EG SERVICES 0.1259 $I$164>=0.01 Not Binding 0.1159
$J$164 RISK HONG LEONG BANK 0.0437 $J$164>=0.01 Not Binding 0.0337
$K$164 RISK DIALOG GROUP 0.0728 $K$164>=0.01 Not Binding 0.0628
$L$164 RISK AMMB HOLDINGS 0.0557 $L$164>=0.01 Not Binding 0.0457
$M$164 RISK PETRONAS GAS 0.0404 $M$164>=0.01 Not Binding 0.0304
$N$164 RISK MALAYSIA AIRPORTS HDG. 0.0692 $N$164>=0.01 Not Binding 0.0592
$O$164 RISK ALLIANCE BANK MALAYSIA 0.0544 $O$164>=0.01 Not Binding 0.0444
$P$164 RISK KUALA LUMPUR KEPONG 0.0438 $P$164>=0.01 Not Binding 0.0338
$Q$164 RISK HONG LEONG FINL.GP. 0.0510 $Q$164>=0.01 Not Binding 0.0410
$R$164 RISK GENTING 0.0474 $R$164>=0.01 Not Binding 0.0374
$S$164 RISK PPB GROUP 0.0507 $S$164>=0.01 Not Binding 0.0407
$T$164 RISK AIRASIA GROUP 0.1148 $T$164>=0.01 Not Binding 0.1048
$U$164 RISK UMW HOLDINGS 0.0680 $U$164>=0.01 Not Binding 0.0580
$V$164 RISK SP SETIA 0.0675 $V$164>=0.01 Not Binding 0.0575
$W$163 WEIGHT Return 1.0000 $W$163=1 Binding 0
$C$163 WEIGHT NESTLE (MALAYSIA) 0.1000 $C$163<=0.1 Binding 0
$D$163 WEIGHT HAP SENG CONSOLIDATED 0.1000 $D$163<=0.1 Binding 0
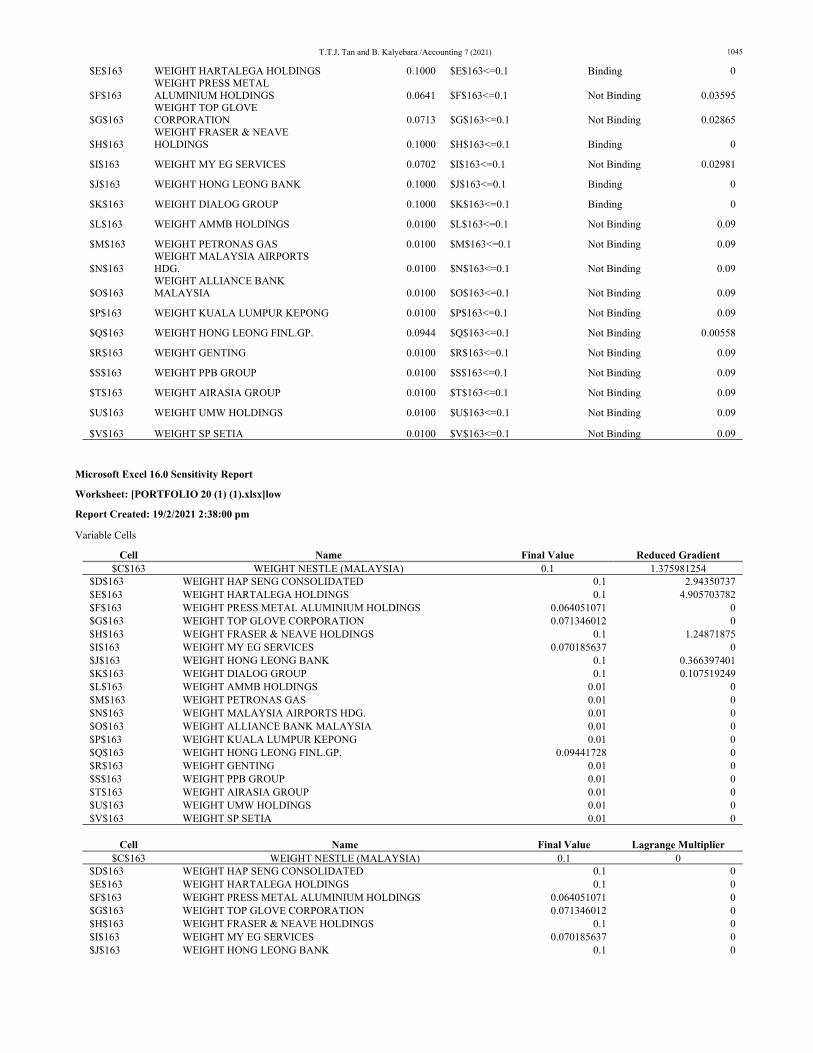
T.T.J. Tan and B. Kalyebara /Accounting 7 (2021) 1045
$E$163 WEIGHT HARTALEGA HOLDINGS 0.1000 $E$163<=0.1 Binding 0
$F$163 WEIGHT PRESS METAL ALUMINIUM HOLDINGS 0.0641 $F$163<=0.1 Not Binding 0.03595
$G$163 WEIGHT TOP GLOVE CORPORATION 0.0713 $G$163<=0.1 Not Binding 0.02865
$H$163 WEIGHT FRASER & NEAVE HOLDINGS 0.1000 $H$163<=0.1 Binding 0
$I$163 WEIGHT MY EG SERVICES 0.0702 $I$163<=0.1 Not Binding 0.02981
$J$163 WEIGHT HONG LEONG BANK 0.1000 $J$163<=0.1 Binding 0
$K$163 WEIGHT DIALOG GROUP 0.1000 $K$163<=0.1 Binding 0
$L$163 WEIGHT AMMB HOLDINGS 0.0100 $L$163<=0.1 Not Binding 0.09
$M$163 WEIGHT PETRONAS GAS 0.0100 $M$163<=0.1 Not Binding 0.09
$N$163 WEIGHT MALAYSIA AIRPORTS HDG. 0.0100 $N$163<=0.1 Not Binding 0.09
$O$163 WEIGHT ALLIANCE BANK MALAYSIA 0.0100 $O$163<=0.1 Not Binding 0.09
$P$163 WEIGHT KUALA LUMPUR KEPONG 0.0100 $P$163<=0.1 Not Binding 0.09
$Q$163 WEIGHT HONG LEONG FINL.GP. 0.0944 $Q$163<=0.1 Not Binding 0.00558
$R$163 WEIGHT GENTING 0.0100 $R$163<=0.1 Not Binding 0.09
$S$163 WEIGHT PPB GROUP 0.0100 $S$163<=0.1 Not Binding 0.09
$T$163 WEIGHT AIRASIA GROUP 0.0100 $T$163<=0.1 Not Binding 0.09
$U$163 WEIGHT UMW HOLDINGS 0.0100 $U$163<=0.1 Not Binding 0.09
$V$163 WEIGHT SP SETIA 0.0100 $V$163<=0.1 Not Binding 0.09
Microsoft Excel 16.0 Sensitivity Report
Worksheet: [PORTFOLIO 20 (1) (1).xlsx]low
Report Created: 19/2/2021 2:38:00 pm
Variable Cells
Cell Name Final Value Reduced Gradient $C$163 WEIGHT NESTLE (MALAYSIA) 0.1 1.375981254 $D$163 WEIGHT HAP SENG CONSOLIDATED 0.1 2.94350737 $E$163 WEIGHT HARTALEGA HOLDINGS 0.1 4.905703782 $F$163 WEIGHT PRESS METAL ALUMINIUM HOLDINGS 0.064051071 0 $G$163 WEIGHT TOP GLOVE CORPORATION 0.071346012 0 $H$163 WEIGHT FRASER & NEAVE HOLDINGS 0.1 1.24871875 $I$163 WEIGHT MY EG SERVICES 0.070185637 0 $J$163 WEIGHT HONG LEONG BANK 0.1 0.366397401 $K$163 WEIGHT DIALOG GROUP 0.1 0.107519249 $L$163 WEIGHT AMMB HOLDINGS 0.01 0 $M$163 WEIGHT PETRONAS GAS 0.01 0 $N$163 WEIGHT MALAYSIA AIRPORTS HDG. 0.01 0 $O$163 WEIGHT ALLIANCE BANK MALAYSIA 0.01 0 $P$163 WEIGHT KUALA LUMPUR KEPONG 0.01 0 $Q$163 WEIGHT HONG LEONG FINL.GP. 0.09441728 0 $R$163 WEIGHT GENTING 0.01 0 $S$163 WEIGHT PPB GROUP 0.01 0 $T$163 WEIGHT AIRASIA GROUP 0.01 0 $U$163 WEIGHT UMW HOLDINGS 0.01 0 $V$163 WEIGHT SP SETIA 0.01 0 Cell Name Final Value Lagrange Multiplier $C$163 WEIGHT NESTLE (MALAYSIA) 0.1 0 $D$163 WEIGHT HAP SENG CONSOLIDATED 0.1 0 $E$163 WEIGHT HARTALEGA HOLDINGS 0.1 0 $F$163 WEIGHT PRESS METAL ALUMINIUM HOLDINGS 0.064051071 0 $G$163 WEIGHT TOP GLOVE CORPORATION 0.071346012 0 $H$163 WEIGHT FRASER & NEAVE HOLDINGS 0.1 0 $I$163 WEIGHT MY EG SERVICES 0.070185637 0 $J$163 WEIGHT HONG LEONG BANK 0.1 0
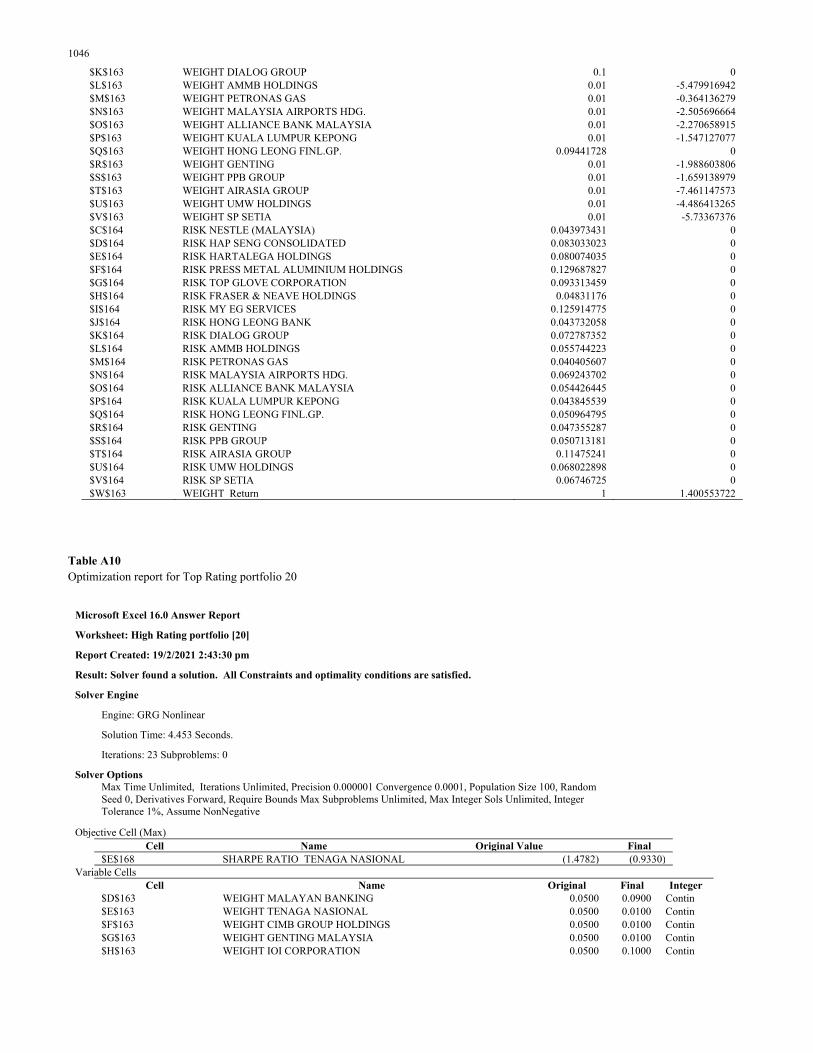
1046
$K$163 WEIGHT DIALOG GROUP 0.1 0 $L$163 WEIGHT AMMB HOLDINGS 0.01 -5.479916942 $M$163 WEIGHT PETRONAS GAS 0.01 -0.364136279 $N$163 WEIGHT MALAYSIA AIRPORTS HDG. 0.01 -2.505696664 $O$163 WEIGHT ALLIANCE BANK MALAYSIA 0.01 -2.270658915 $P$163 WEIGHT KUALA LUMPUR KEPONG 0.01 -1.547127077 $Q$163 WEIGHT HONG LEONG FINL.GP. 0.09441728 0 $R$163 WEIGHT GENTING 0.01 -1.988603806 $S$163 WEIGHT PPB GROUP 0.01 -1.659138979 $T$163 WEIGHT AIRASIA GROUP 0.01 -7.461147573 $U$163 WEIGHT UMW HOLDINGS 0.01 -4.486413265 $V$163 WEIGHT SP SETIA 0.01 -5.73367376 $C$164 RISK NESTLE (MALAYSIA) 0.043973431 0 $D$164 RISK HAP SENG CONSOLIDATED 0.083033023 0 $E$164 RISK HARTALEGA HOLDINGS 0.080074035 0 $F$164 RISK PRESS METAL ALUMINIUM HOLDINGS 0.129687827 0 $G$164 RISK TOP GLOVE CORPORATION 0.093313459 0 $H$164 RISK FRASER & NEAVE HOLDINGS 0.04831176 0 $I$164 RISK MY EG SERVICES 0.125914775 0 $J$164 RISK HONG LEONG BANK 0.043732058 0 $K$164 RISK DIALOG GROUP 0.072787352 0 $L$164 RISK AMMB HOLDINGS 0.055744223 0 $M$164 RISK PETRONAS GAS 0.040405607 0 $N$164 RISK MALAYSIA AIRPORTS HDG. 0.069243702 0 $O$164 RISK ALLIANCE BANK MALAYSIA 0.054426445 0 $P$164 RISK KUALA LUMPUR KEPONG 0.043845539 0 $Q$164 RISK HONG LEONG FINL.GP. 0.050964795 0 $R$164 RISK GENTING 0.047355287 0 $S$164 RISK PPB GROUP 0.050713181 0 $T$164 RISK AIRASIA GROUP 0.11475241 0 $U$164 RISK UMW HOLDINGS 0.068022898 0 $V$164 RISK SP SETIA 0.06746725 0 $W$163 WEIGHT Return 1 1.400553722
Table A10 Optimization report for Top Rating portfolio 20
Microsoft Excel 16.0 Answer Report
Worksheet: High Rating portfolio [20]
Report Created: 19/2/2021 2:43:30 pm
Result: Solver found a solution. All Constraints and optimality conditions are satisfied.
Solver Engine
Engine: GRG Nonlinear
Solution Time: 4.453 Seconds.
Iterations: 23 Subproblems: 0
Solver Options
Max Time Unlimited, Iterations Unlimited, Precision 0.000001 Convergence 0.0001, Population Size 100, Random Seed 0, Derivatives Forward, Require Bounds Max Subproblems Unlimited, Max Integer Sols Unlimited, Integer Tolerance 1%, Assume NonNegative
Objective Cell (Max) Cell Name Original Value Final $E$168 SHARPE RATIO TENAGA NASIONAL (1.4782) (0.9330) Variable Cells Cell Name Original Final Integer $D$163 WEIGHT MALAYAN BANKING 0.0500 0.0900 Contin $E$163 WEIGHT TENAGA NASIONAL 0.0500 0.0100 Contin $F$163 WEIGHT CIMB GROUP HOLDINGS 0.0500 0.0100 Contin $G$163 WEIGHT GENTING MALAYSIA 0.0500 0.0100 Contin $H$163 WEIGHT IOI CORPORATION 0.0500 0.1000 Contin
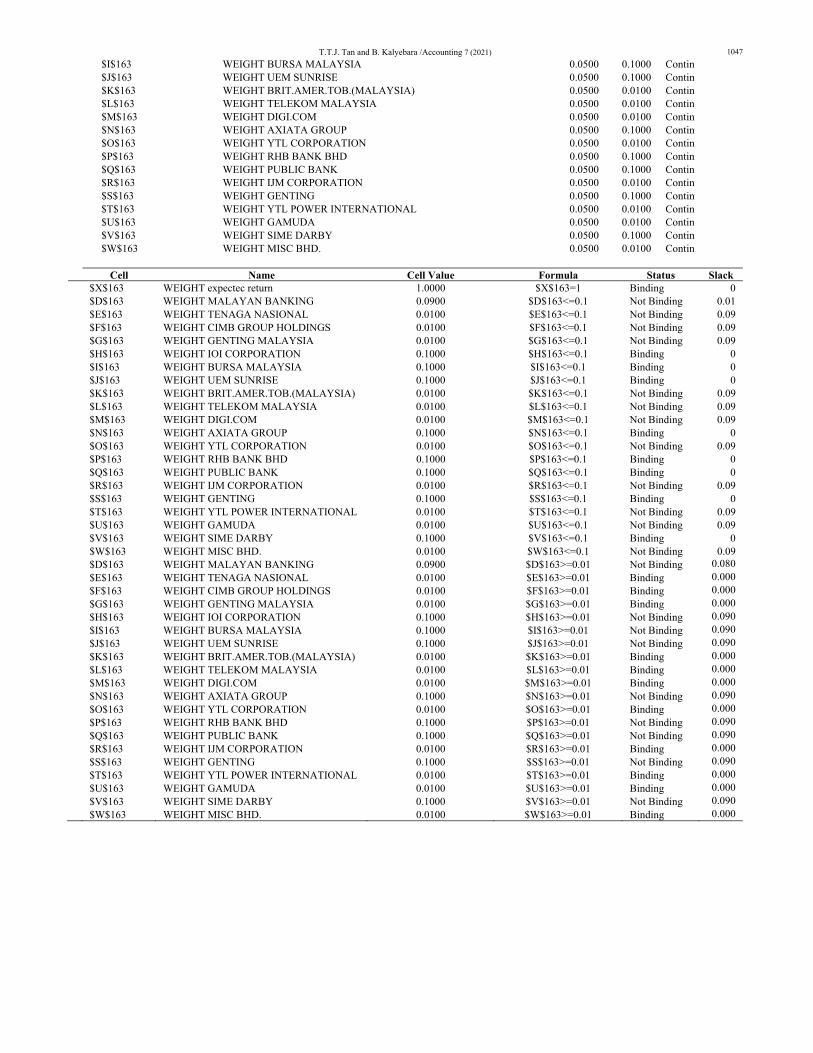
T.T.J. Tan and B. Kalyebara /Accounting 7 (2021) 1047 $I$163 WEIGHT BURSA MALAYSIA 0.0500 0.1000 Contin $J$163 WEIGHT UEM SUNRISE 0.0500 0.1000 Contin $K$163 WEIGHT BRIT.AMER.TOB.(MALAYSIA) 0.0500 0.0100 Contin $L$163 WEIGHT TELEKOM MALAYSIA 0.0500 0.0100 Contin $M$163 WEIGHT DIGI.COM 0.0500 0.0100 Contin $N$163 WEIGHT AXIATA GROUP 0.0500 0.1000 Contin $O$163 WEIGHT YTL CORPORATION 0.0500 0.0100 Contin $P$163 WEIGHT RHB BANK BHD 0.0500 0.1000 Contin $Q$163 WEIGHT PUBLIC BANK 0.0500 0.1000 Contin $R$163 WEIGHT IJM CORPORATION 0.0500 0.0100 Contin $S$163 WEIGHT GENTING 0.0500 0.1000 Contin $T$163 WEIGHT YTL POWER INTERNATIONAL 0.0500 0.0100 Contin $U$163 WEIGHT GAMUDA 0.0500 0.0100 Contin $V$163 WEIGHT SIME DARBY 0.0500 0.1000 Contin $W$163 WEIGHT MISC BHD. 0.0500 0.0100 Contin Cell Name Cell Value Formula Status Slack $X$163 WEIGHT expectec return 1.0000 $X$163=1 Binding 0 $D$163 WEIGHT MALAYAN BANKING 0.0900 $D$163<=0.1 Not Binding 0.01 $E$163 WEIGHT TENAGA NASIONAL 0.0100 $E$163<=0.1 Not Binding 0.09 $F$163 WEIGHT CIMB GROUP HOLDINGS 0.0100 $F$163<=0.1 Not Binding 0.09 $G$163 WEIGHT GENTING MALAYSIA 0.0100 $G$163<=0.1 Not Binding 0.09 $H$163 WEIGHT IOI CORPORATION 0.1000 $H$163<=0.1 Binding 0 $I$163 WEIGHT BURSA MALAYSIA 0.1000 $I$163<=0.1 Binding 0 $J$163 WEIGHT UEM SUNRISE 0.1000 $J$163<=0.1 Binding 0 $K$163 WEIGHT BRIT.AMER.TOB.(MALAYSIA) 0.0100 $K$163<=0.1 Not Binding 0.09 $L$163 WEIGHT TELEKOM MALAYSIA 0.0100 $L$163<=0.1 Not Binding 0.09 $M$163 WEIGHT DIGI.COM 0.0100 $M$163<=0.1 Not Binding 0.09 $N$163 WEIGHT AXIATA GROUP 0.1000 $N$163<=0.1 Binding 0 $O$163 WEIGHT YTL CORPORATION 0.0100 $O$163<=0.1 Not Binding 0.09 $P$163 WEIGHT RHB BANK BHD 0.1000 $P$163<=0.1 Binding 0 $Q$163 WEIGHT PUBLIC BANK 0.1000 $Q$163<=0.1 Binding 0 $R$163 WEIGHT IJM CORPORATION 0.0100 $R$163<=0.1 Not Binding 0.09 $S$163 WEIGHT GENTING 0.1000 $S$163<=0.1 Binding 0 $T$163 WEIGHT YTL POWER INTERNATIONAL 0.0100 $T$163<=0.1 Not Binding 0.09 $U$163 WEIGHT GAMUDA 0.0100 $U$163<=0.1 Not Binding 0.09 $V$163 WEIGHT SIME DARBY 0.1000 $V$163<=0.1 Binding 0 $W$163 WEIGHT MISC BHD. 0.0100 $W$163<=0.1 Not Binding 0.09 $D$163 WEIGHT MALAYAN BANKING 0.0900 $D$163>=0.01 Not Binding 0.080 $E$163 WEIGHT TENAGA NASIONAL 0.0100 $E$163>=0.01 Binding 0.000 $F$163 WEIGHT CIMB GROUP HOLDINGS 0.0100 $F$163>=0.01 Binding 0.000 $G$163 WEIGHT GENTING MALAYSIA 0.0100 $G$163>=0.01 Binding 0.000 $H$163 WEIGHT IOI CORPORATION 0.1000 $H$163>=0.01 Not Binding 0.090 $I$163 WEIGHT BURSA MALAYSIA 0.1000 $I$163>=0.01 Not Binding 0.090 $J$163 WEIGHT UEM SUNRISE 0.1000 $J$163>=0.01 Not Binding 0.090 $K$163 WEIGHT BRIT.AMER.TOB.(MALAYSIA) 0.0100 $K$163>=0.01 Binding 0.000 $L$163 WEIGHT TELEKOM MALAYSIA 0.0100 $L$163>=0.01 Binding 0.000 $M$163 WEIGHT DIGI.COM 0.0100 $M$163>=0.01 Binding 0.000 $N$163 WEIGHT AXIATA GROUP 0.1000 $N$163>=0.01 Not Binding 0.090 $O$163 WEIGHT YTL CORPORATION 0.0100 $O$163>=0.01 Binding 0.000 $P$163 WEIGHT RHB BANK BHD 0.1000 $P$163>=0.01 Not Binding 0.090 $Q$163 WEIGHT PUBLIC BANK 0.1000 $Q$163>=0.01 Not Binding 0.090 $R$163 WEIGHT IJM CORPORATION 0.0100 $R$163>=0.01 Binding 0.000 $S$163 WEIGHT GENTING 0.1000 $S$163>=0.01 Not Binding 0.090 $T$163 WEIGHT YTL POWER INTERNATIONAL 0.0100 $T$163>=0.01 Binding 0.000 $U$163 WEIGHT GAMUDA 0.0100 $U$163>=0.01 Binding 0.000 $V$163 WEIGHT SIME DARBY 0.1000 $V$163>=0.01 Not Binding 0.090 $W$163 WEIGHT MISC BHD. 0.0100 $W$163>=0.01 Binding 0.000
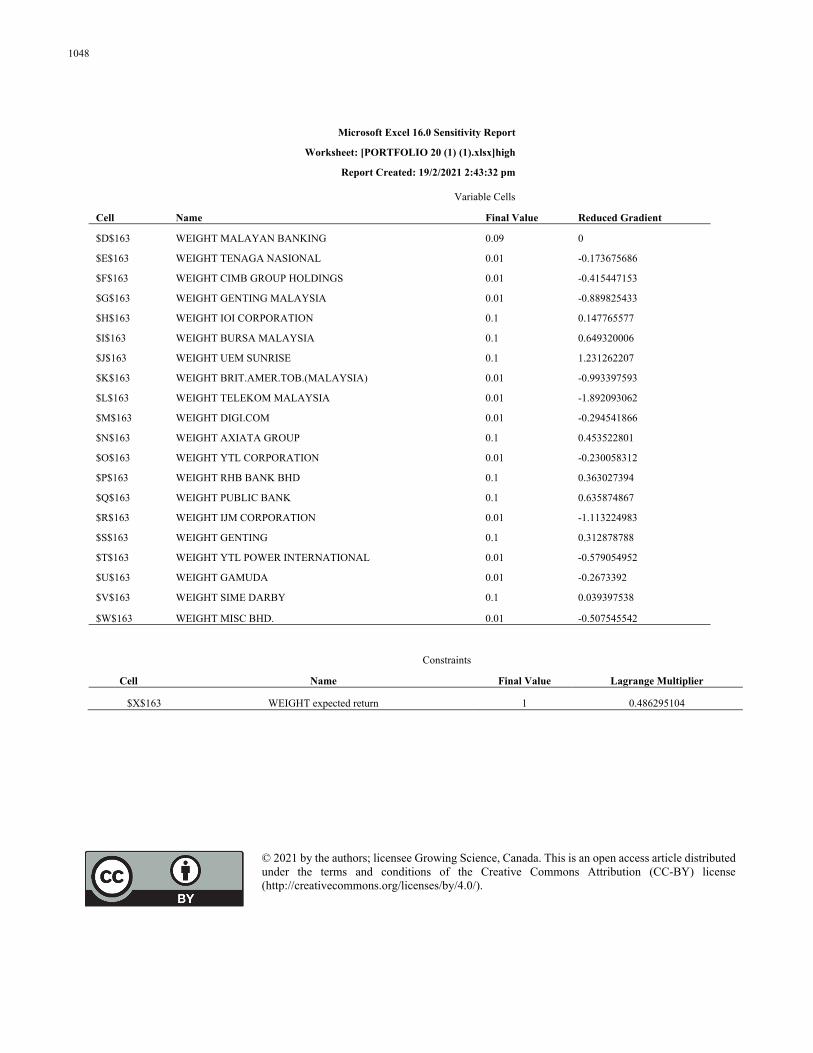
1048
Microsoft Excel 16.0 Sensitivity Report
Worksheet: [PORTFOLIO 20 (1) (1).xlsx]high
Report Created: 19/2/2021 2:43:32 pm
Variable Cells
Cell Name Final Value Reduced Gradient
$D$163 WEIGHT MALAYAN BANKING 0.09 0
$E$163 WEIGHT TENAGA NASIONAL 0.01 -0.173675686
$F$163 WEIGHT CIMB GROUP HOLDINGS 0.01 -0.415447153
$G$163 WEIGHT GENTING MALAYSIA 0.01 -0.889825433
$H$163 WEIGHT IOI CORPORATION 0.1 0.147765577
$I$163 WEIGHT BURSA MALAYSIA 0.1 0.649320006
$J$163 WEIGHT UEM SUNRISE 0.1 1.231262207
$K$163 WEIGHT BRIT.AMER.TOB.(MALAYSIA) 0.01 -0.993397593
$L$163 WEIGHT TELEKOM MALAYSIA 0.01 -1.892093062
$M$163 WEIGHT DIGI.COM 0.01 -0.294541866
$N$163 WEIGHT AXIATA GROUP 0.1 0.453522801
$O$163 WEIGHT YTL CORPORATION 0.01 -0.230058312
$P$163 WEIGHT RHB BANK BHD 0.1 0.363027394
$Q$163 WEIGHT PUBLIC BANK 0.1 0.635874867
$R$163 WEIGHT IJM CORPORATION 0.01 -1.113224983
$S$163 WEIGHT GENTING 0.1 0.312878788
$T$163 WEIGHT YTL POWER INTERNATIONAL 0.01 -0.579054952
$U$163 WEIGHT GAMUDA 0.01 -0.2673392
$V$163 WEIGHT SIME DARBY 0.1 0.039397538
$W$163 WEIGHT MISC BHD. 0.01 -0.507545542
Constraints
Cell Name Final Value Lagrange Multiplier
$X$163 WEIGHT expected return 1 0.486295104
© 2021 by the authors; licensee Growing Science, Canada. This is an open access article distributed under the terms and conditions of the Creative Commons Attribution (CC-BY) license (http://creativecommons.org/licenses/by/4.0/).