AKAUN NEGARA PERANGKAAN STOK MODAL ...andaluciatijara.com/descargas-malasia/informe-datos.pdfAKAUN...
127
AKAUN NEGARA PERANGKAAN STOK MODAL NATIONAL ACCOUNTS CAPITAL STOCK STATISTICS 2017 Jabatan Perangkaan Malaysia Department of Statistics, Malaysia MALAYSIA Pemakluman/ Announcement: Kerajaan Malaysia telah mengisytiharkan Hari Statistik Negara (MyStats Day) pada 20 Oktober setiap tahun. Tema sambutan MyStats Day 2018 adalah “Data Berkualiti, Kehidupan Sejahtera”. The Government of Malaysia has declared National Statistics Day on 20 th October each year. MyStats Day 2018 theme is “Better Data, Better Lives”.
Transcript of AKAUN NEGARA PERANGKAAN STOK MODAL ...andaluciatijara.com/descargas-malasia/informe-datos.pdfAKAUN...
AKAUN NEGARA PERANGKAAN STOK MODAL
NATIONAL ACCOUNTS CAPITAL STOCK STATISTICS
2017
Jabatan Perangkaan Malaysia Department of Statistics, Malaysia
MALAYSIA
Pemakluman/ Announcement:
Kerajaan Malaysia telah mengisytiharkan Hari Statistik Negara (MyStats Day) pada 20 Oktober setiap tahun. Tema sambutan MyStats Day 2018 adalah
“Data Berkualiti, Kehidupan Sejahtera”.
The Government of Malaysia has declared National Statistics Day on 20th October each year. MyStats Day 2018 theme is
“Better Data, Better Lives”.
Diterbitkan dan dicetak oleh:
Jabatan Perangkaan Malaysia
Blok C6, Kompleks C,
Pusat Pentadbiran Kerajaan Persekutuan,
62514 Putrajaya,
MALAYSIA
Tel. : 03-8885 7000
Faks : 03-8888 9248
Portal : https://www.dosm.gov.my
Facebook : www.facebook.com/StatsMalaysia
Twitter : https://twitter.com/StatsMalaysia
Harga/Price : RM25.00
Diterbitkan pada November 2018
Hakcipta terpelihara
Tiada bahagian daripada terbitan ini boleh diterbitkan semula, disimpan untuk pengeluaran atau ditukar dalam
apa-apa bentuk atau alat apa jua pun kecuali setelah mendapat kebenaran daripada Jabatan Perangkaan
Malaysia.
Pengguna yang mengeluarkan sebarang maklumat dari terbitan ini sama ada yang asal atau diolah semula
hendaklah meletakkan kenyataan berikut:
“Sumber: Jabatan Perangkaan Malaysia”.
Published and printed by:
Department of Statistics, Malaysia
Block C6, Complex C,
Federal Government Administrative Centre,
62514 Putrajaya,
MALAYSIA
Tel. : 03-8885 7000
Fax : 03-8888 9248
Portal : https://www.dosm.gov.my
Facebook : www.facebook.com/StatsMalaysia
Twitter : https://twitter.com/StatsMalaysia
Published in November 2018
All rights reserved
No part of this publication may be reproduced or distributed in any form or by any means or stored in data base
without the prior written permission from Department of Statistics, Malaysia.
Users reproducing content of this publication with or without adaptation should quote the following:
“Source: Department of Statistics, Malaysia”.
ISSN 2289-1056
i
KATA PENGANTAR
Penerbitan ini membentangkan maklumat perangkaan Stok Modal di Malaysia bagi tahun
2017. Statistik dalam penerbitan ini meliputi Stok Modal Kasar, Stok Modal Bersih, Stok
Modal Produktif dan Penggunaan Modal Tetap pada kedua-dua harga semasa dan harga
malar (2010=100). Penyusunan perangkaan ini adalah berdasarkan rangka kerja
Measuring Capital OECD Manual 2009 dan System of National Accounts 2008.
Perangkaan ini mencerminkan aset tetap terkumpul yang penting untuk menganggarkan
produktiviti modal serta output potensi masa hadapan.
Ringkasan penemuan dan jadual statistik disediakan pada dua bahagian pertama
penerbitan ini. Nota teknikal bagi konsep, definisi, metodologi dan sumber data turut
dimuatkan bagi memudahkan pemahaman terhadap statistik ini.
Jabatan merakamkan setinggi-tinggi penghargaan atas kerjasama dan sumbangan yang
diberikan oleh semua pihak dalam menjayakan penerbitan ini. Setiap maklumbalas dan
cadangan untuk penambahbaikan penerbitan ini pada masa akan datang amatlah
dihargai.
DATO’ SRI DR. MOHD UZIR MAHIDIN
Ketua Perangkawan Malaysia
November 2018
ii
PREFACE
This publication presents statistics on Capital Stock in Malaysia for the year 2017.
Statistics in this publication covers Gross Capital Stock, Net Capital Stock, Productive
Capital Stock and Consumption of Fixed Capital at both current and constant prices
(2010=100). The compilation of this statistics is based on the framework of Measuring
Capital OECD Manual 2009 and System of National Accounts 2008. The statistics
reflects accumulated fixed assets which is essential to estimate capital productivity as
well as future potential output.
Summary of findings and statistical tables are provided in the first two parts of this
publication. Technical notes on concepts, definitions, methodology and data sources are
provided to facilitate better understanding of the statistics.
The Department gratefully acknowledges all the parties concerned for their cooperation in
realizing this publication. All comments and suggestions towards improving future
publication are appreciated.
DATO’ SRI DR. MOHD UZIR MAHIDIN
Chief Statistician Malaysia
November 2018
iii
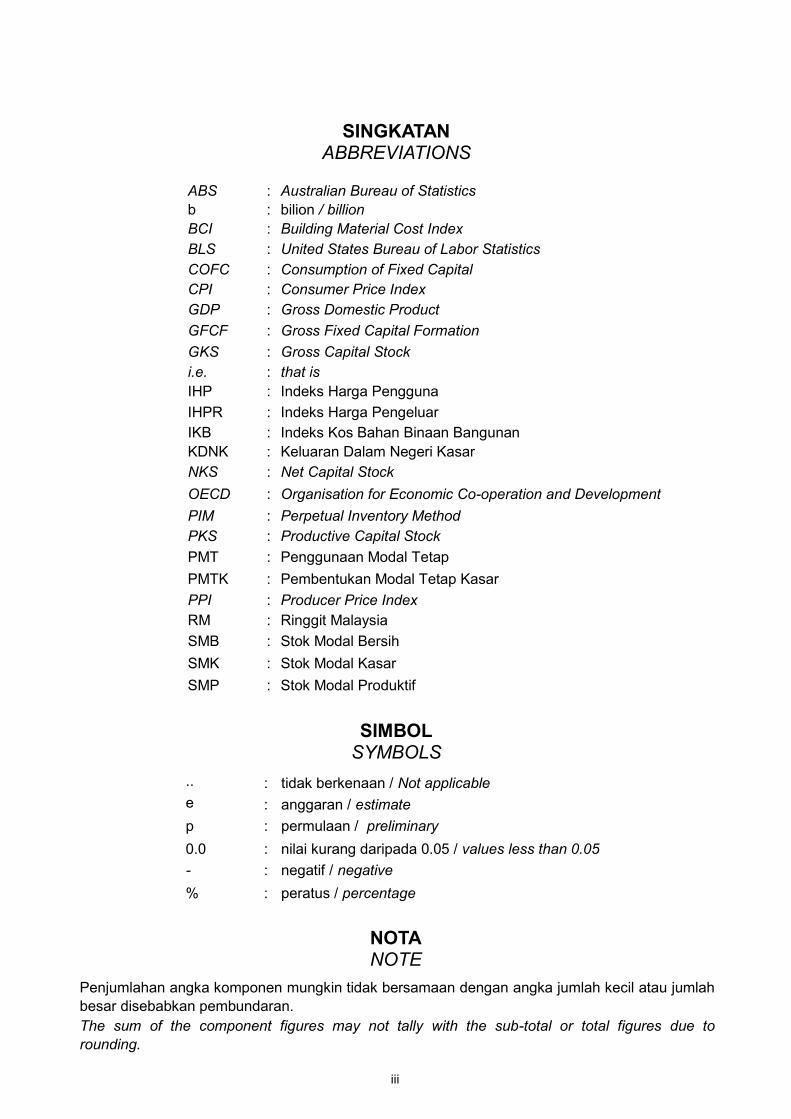
SINGKATAN ABBREVIATIONS
SIMBOL SYMBOLS
NOTA NOTE
ABS : Australian Bureau of Statistics
b : bilion / billion
BCI : Building Material Cost Index
BLS : United States Bureau of Labor Statistics
COFC : Consumption of Fixed Capital
CPI : Consumer Price Index
GDP : Gross Domestic Product
GFCF : Gross Fixed Capital Formation
GKS : Gross Capital Stock
i.e. : that is
IHP : Indeks Harga Pengguna
IHPR : Indeks Harga Pengeluar
IKB : Indeks Kos Bahan Binaan Bangunan
KDNK : Keluaran Dalam Negeri Kasar
NKS : Net Capital Stock
OECD : Organisation for Economic Co-operation and Development
PIM : Perpetual Inventory Method
PKS : Productive Capital Stock
PMT : Penggunaan Modal Tetap
PMTK : Pembentukan Modal Tetap Kasar
PPI : Producer Price Index
RM : Ringgit Malaysia
SMB : Stok Modal Bersih
SMK : Stok Modal Kasar
SMP : Stok Modal Produktif
.. : tidak berkenaan / Not applicable
e : anggaran / estimate
p : permulaan / preliminary
0.0 : nilai kurang daripada 0.05 / values less than 0.05
- : negatif / negative
% : peratus / percentage
Penjumlahan angka komponen mungkin tidak bersamaan dengan angka jumlah kecil atau jumlah
besar disebabkan pembundaran.
The sum of the component figures may not tally with the sub-total or total figures due to
rounding.
iv
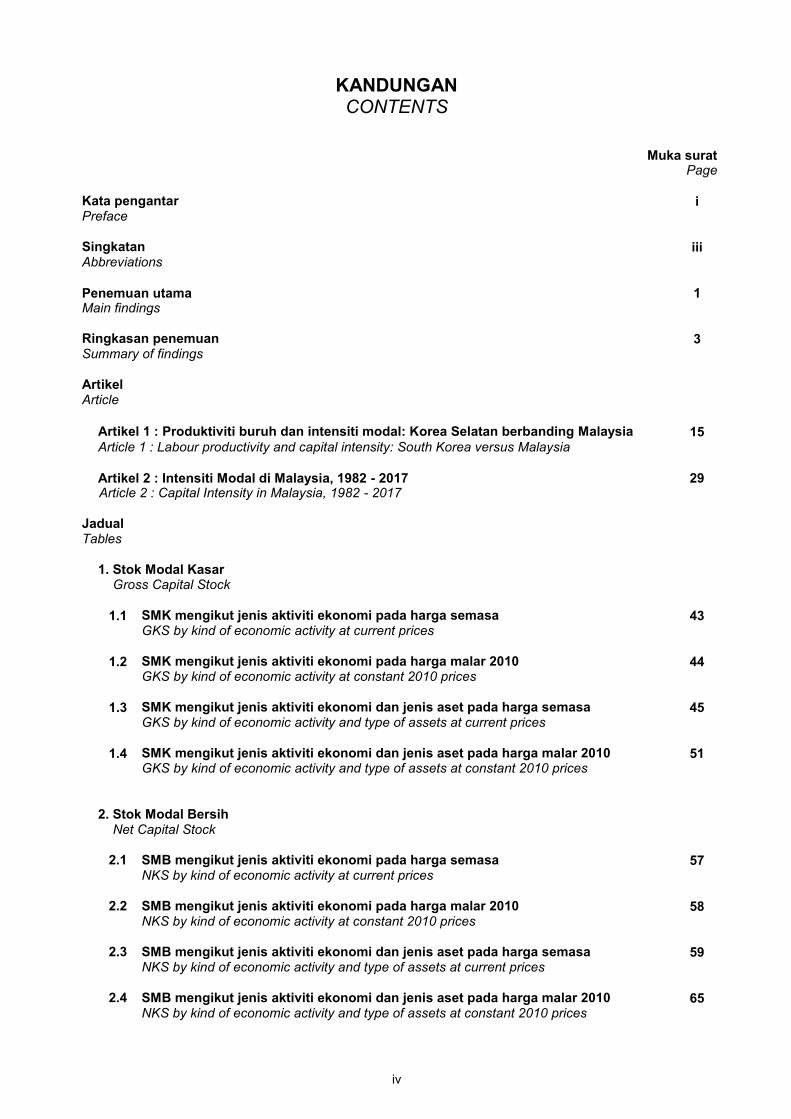
KANDUNGAN CONTENTS
Muka surat Page Kata pengantar i Preface Singkatan iii Abbreviations Penemuan utama 1 Main findings Ringkasan penemuan 3 Summary of findings Artikel Article
Artikel 1 : Produktiviti buruh dan intensiti modal: Korea Selatan berbanding Malaysia 15 Article 1 : Labour productivity and capital intensity: South Korea versus Malaysia Artikel 2 : Intensiti Modal di Malaysia, 1982 - 2017 29 Article 2 : Capital Intensity in Malaysia, 1982 - 2017 Jadual Tables
1. Stok Modal Kasar Gross Capital Stock 1.1 SMK mengikut jenis aktiviti ekonomi pada harga semasa 43 GKS by kind of economic activity at current prices 1.2 SMK mengikut jenis aktiviti ekonomi pada harga malar 2010 44 GKS by kind of economic activity at constant 2010 prices 1.3 SMK mengikut jenis aktiviti ekonomi dan jenis aset pada harga semasa 45 GKS by kind of economic activity and type of assets at current prices 1.4 SMK mengikut jenis aktiviti ekonomi dan jenis aset pada harga malar 2010 51 GKS by kind of economic activity and type of assets at constant 2010 prices 2. Stok Modal Bersih Net Capital Stock
2.1 SMB mengikut jenis aktiviti ekonomi pada harga semasa 57 NKS by kind of economic activity at current prices
2.2 SMB mengikut jenis aktiviti ekonomi pada harga malar 2010 58 NKS by kind of economic activity at constant 2010 prices
2.3 SMB mengikut jenis aktiviti ekonomi dan jenis aset pada harga semasa 59 NKS by kind of economic activity and type of assets at current prices
2.4 SMB mengikut jenis aktiviti ekonomi dan jenis aset pada harga malar 2010 65 NKS by kind of economic activity and type of assets at constant 2010 prices
v
Muka surat Page
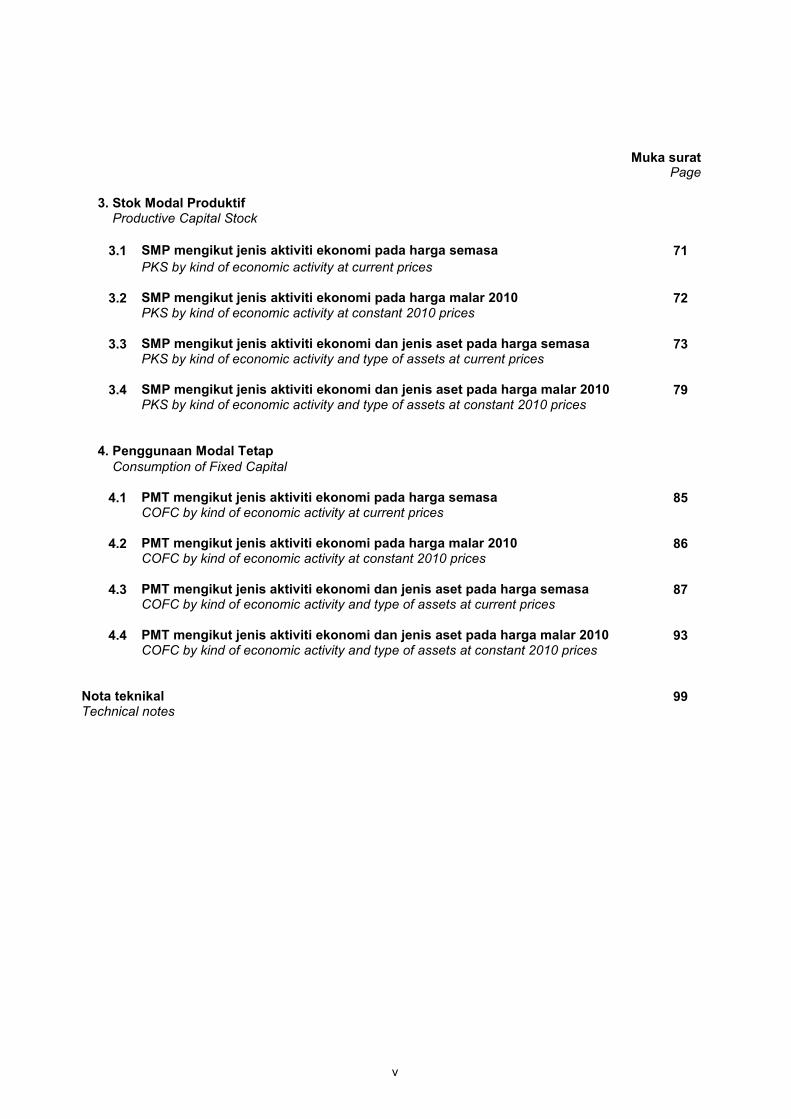
3. Stok Modal Produktif Productive Capital Stock
3.1 SMP mengikut jenis aktiviti ekonomi pada harga semasa 71
PKS by kind of economic activity at current prices 3.2 SMP mengikut jenis aktiviti ekonomi pada harga malar 2010 72 PKS by kind of economic activity at constant 2010 prices 3.3 SMP mengikut jenis aktiviti ekonomi dan jenis aset pada harga semasa 73 PKS by kind of economic activity and type of assets at current prices 3.4 SMP mengikut jenis aktiviti ekonomi dan jenis aset pada harga malar 2010 79 PKS by kind of economic activity and type of assets at constant 2010 prices 4. Penggunaan Modal Tetap Consumption of Fixed Capital 4.1 PMT mengikut jenis aktiviti ekonomi pada harga semasa 85 COFC by kind of economic activity at current prices 4.2 PMT mengikut jenis aktiviti ekonomi pada harga malar 2010 86 COFC by kind of economic activity at constant 2010 prices 4.3 PMT mengikut jenis aktiviti ekonomi dan jenis aset pada harga semasa 87 COFC by kind of economic activity and type of assets at current prices 4.4 PMT mengikut jenis aktiviti ekonomi dan jenis aset pada harga malar 2010 93 COFC by kind of economic activity and type of assets at constant 2010 prices Nota teknikal 99 Technical notes
vi
Muka surat ini sengaja dibiarkan kosong.
This page is deliberately left blank.
1

2
3
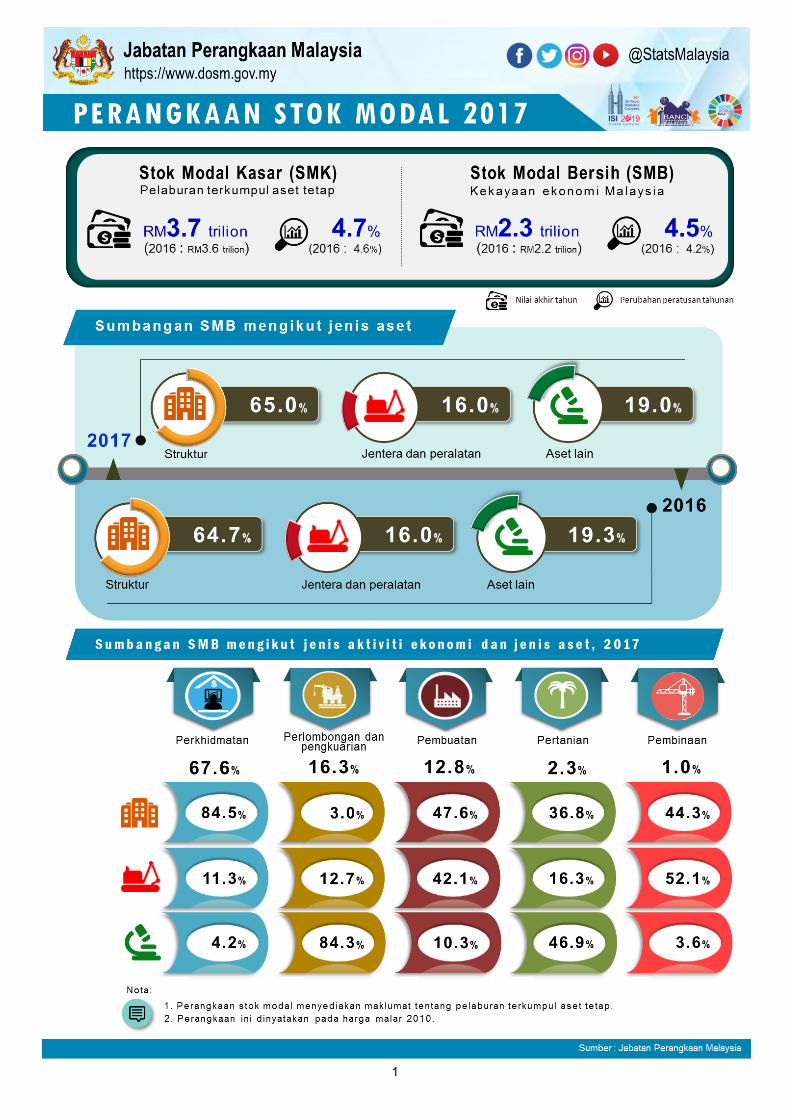
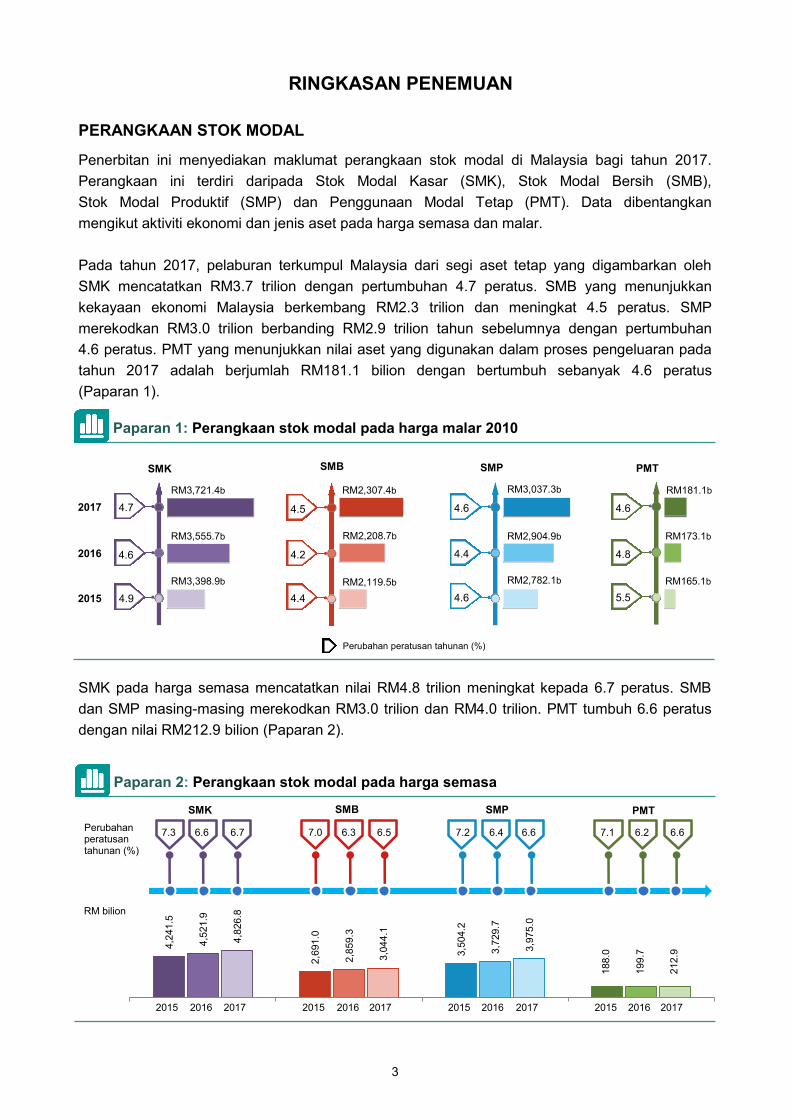
RINGKASAN PENEMUAN
PERANGKAAN STOK MODAL
Penerbitan ini menyediakan maklumat perangkaan stok modal di Malaysia bagi tahun 2017.
Perangkaan ini terdiri daripada Stok Modal Kasar (SMK), Stok Modal Bersih (SMB),
Stok Modal Produktif (SMP) dan Penggunaan Modal Tetap (PMT). Data dibentangkan
mengikut aktiviti ekonomi dan jenis aset pada harga semasa dan malar.
Pada tahun 2017, pelaburan terkumpul Malaysia dari segi aset tetap yang digambarkan oleh
SMK mencatatkan RM3.7 trilion dengan pertumbuhan 4.7 peratus. SMB yang menunjukkan
kekayaan ekonomi Malaysia berkembang RM2.3 trilion dan meningkat 4.5 peratus. SMP
merekodkan RM3.0 trilion berbanding RM2.9 trilion tahun sebelumnya dengan pertumbuhan
4.6 peratus. PMT yang menunjukkan nilai aset yang digunakan dalam proses pengeluaran pada
tahun 2017 adalah berjumlah RM181.1 bilion dengan bertumbuh sebanyak 4.6 peratus
(Paparan 1).
SMK pada harga semasa mencatatkan nilai RM4.8 trilion meningkat kepada 6.7 peratus. SMB
dan SMP masing-masing merekodkan RM3.0 trilion dan RM4.0 trilion. PMT tumbuh 6.6 peratus
dengan nilai RM212.9 bilion (Paparan 2).
SMK SMB PMT SMP
Paparan 2: Perangkaan stok modal pada harga semasa
4,2
41.5
2,6
91.0
3,5
04.2
1,1
88.0
4,5
21.9
2,8
59.3
3,7
29.7
1,1
99
.7
4,8
26.8
3,0
44.1
3,9
75.0
1,2
12.9
6.66.47.2 6.66.27.17.0 6.56.37.3 6.6 6.7Perubahan peratusan tahunan (%)
RM bilion
2015 2016 2017 2015 2016 2017 2015 2016 2017 2015 2016 2017
188.0
199.7
212.9
Paparan 1: Perangkaan stok modal pada harga malar 2010
Perubahan peratusan tahunan (%)
2015
2016
2017
4.9
RM3,398.9b
RM3,555.7b
RM3,721.4b
4.6
4.7
SMK SMB
RM2,307.4b
4.4
4.2
4.5
SMP
4.6
4.4
4.6
RM2,782.1b
5.5
4.8
4.6
RM165.1b
RM173.1b
RM181.1b
PMT
RM2,208.7b
RM2,119.5b
RM2,904.9b
RM3,037.3b
4
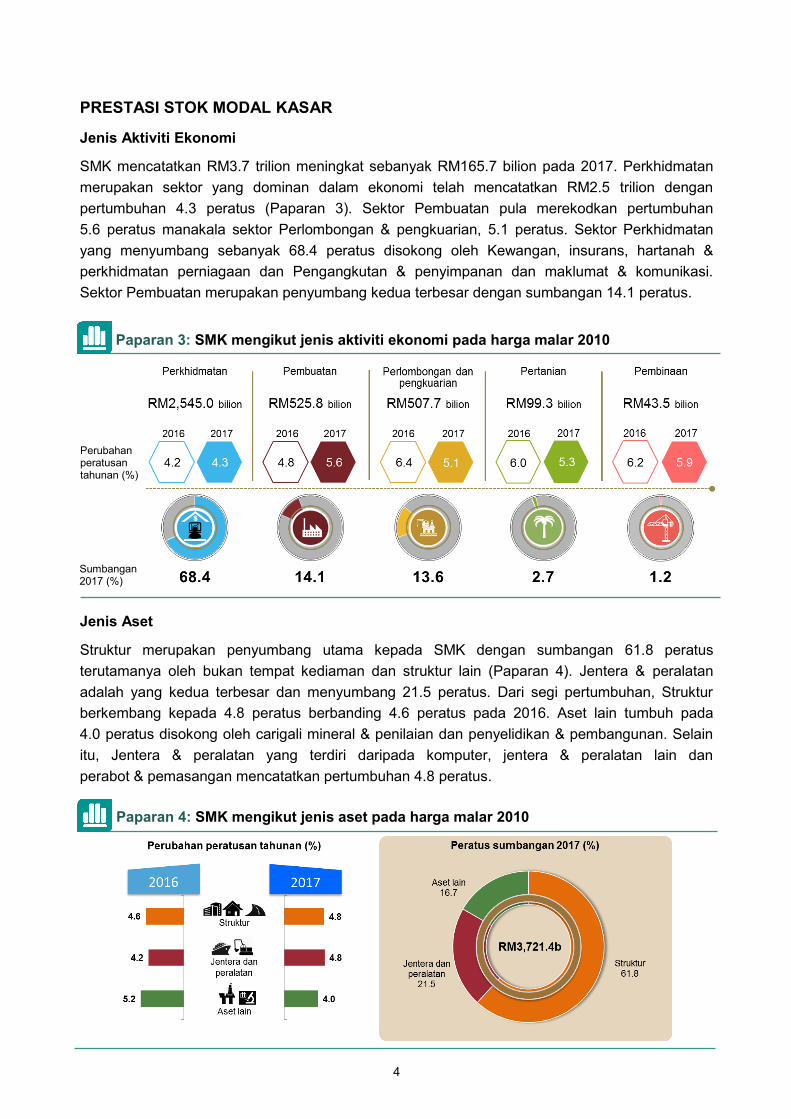
PRESTASI STOK MODAL KASAR
Jenis Aktiviti Ekonomi
SMK mencatatkan RM3.7 trilion meningkat sebanyak RM165.7 bilion pada 2017. Perkhidmatan
merupakan sektor yang dominan dalam ekonomi telah mencatatkan RM2.5 trilion dengan
pertumbuhan 4.3 peratus (Paparan 3). Sektor Pembuatan pula merekodkan pertumbuhan
5.6 peratus manakala sektor Perlombongan & pengkuarian, 5.1 peratus. Sektor Perkhidmatan
yang menyumbang sebanyak 68.4 peratus disokong oleh Kewangan, insurans, hartanah &
perkhidmatan perniagaan dan Pengangkutan & penyimpanan dan maklumat & komunikasi.
Sektor Pembuatan merupakan penyumbang kedua terbesar dengan sumbangan 14.1 peratus.
Jenis Aset
Struktur merupakan penyumbang utama kepada SMK dengan sumbangan 61.8 peratus
terutamanya oleh bukan tempat kediaman dan struktur lain (Paparan 4). Jentera & peralatan
adalah yang kedua terbesar dan menyumbang 21.5 peratus. Dari segi pertumbuhan, Struktur
berkembang kepada 4.8 peratus berbanding 4.6 peratus pada 2016. Aset lain tumbuh pada
4.0 peratus disokong oleh carigali mineral & penilaian dan penyelidikan & pembangunan. Selain
itu, Jentera & peralatan yang terdiri daripada komputer, jentera & peralatan lain dan
perabot & pemasangan mencatatkan pertumbuhan 4.8 peratus.
Paparan 3: SMK mengikut jenis aktiviti ekonomi pada harga malar 2010
Sumbangan 2017 (%)
Perubahan peratusan tahunan (%)
Paparan 4: SMK mengikut jenis aset pada harga malar 2010
5
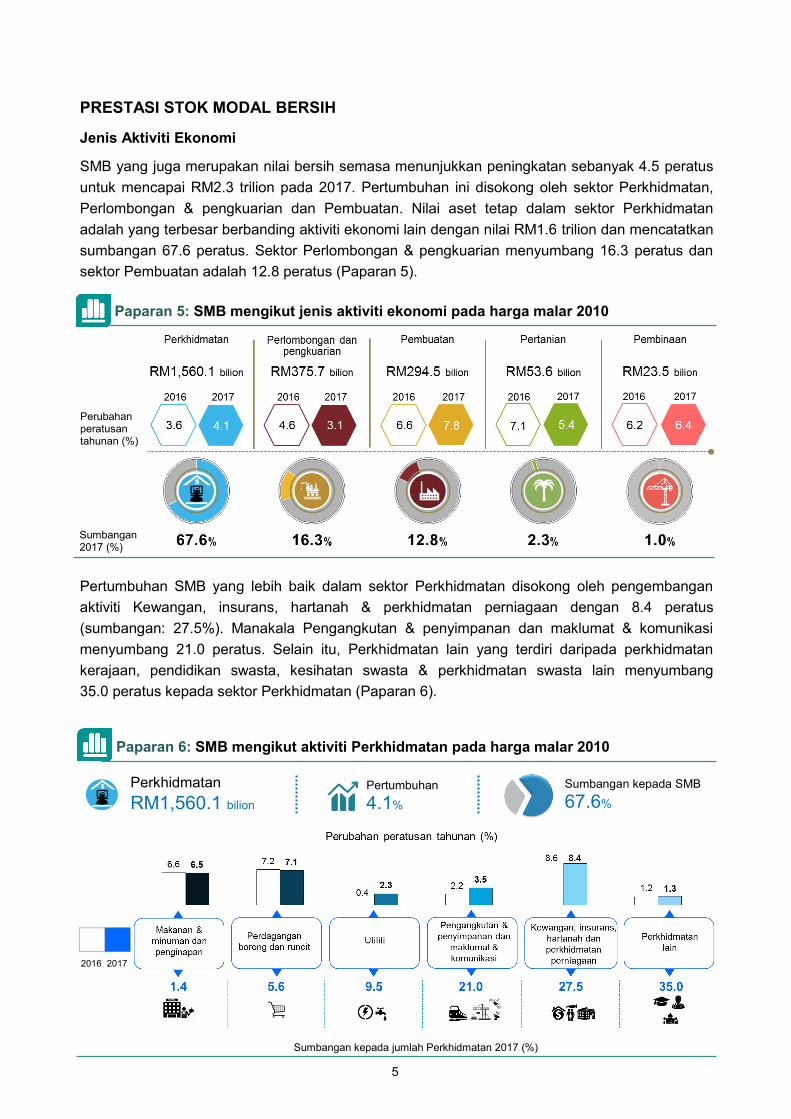
PRESTASI STOK MODAL BERSIH
Jenis Aktiviti Ekonomi
SMB yang juga merupakan nilai bersih semasa menunjukkan peningkatan sebanyak 4.5 peratus
untuk mencapai RM2.3 trilion pada 2017. Pertumbuhan ini disokong oleh sektor Perkhidmatan,
Perlombongan & pengkuarian dan Pembuatan. Nilai aset tetap dalam sektor Perkhidmatan
adalah yang terbesar berbanding aktiviti ekonomi lain dengan nilai RM1.6 trilion dan mencatatkan
sumbangan 67.6 peratus. Sektor Perlombongan & pengkuarian menyumbang 16.3 peratus dan
sektor Pembuatan adalah 12.8 peratus (Paparan 5).
Pertumbuhan SMB yang lebih baik dalam sektor Perkhidmatan disokong oleh pengembangan
aktiviti Kewangan, insurans, hartanah & perkhidmatan perniagaan dengan 8.4 peratus
(sumbangan: 27.5%). Manakala Pengangkutan & penyimpanan dan maklumat & komunikasi
menyumbang 21.0 peratus. Selain itu, Perkhidmatan lain yang terdiri daripada perkhidmatan
kerajaan, pendidikan swasta, kesihatan swasta & perkhidmatan swasta lain menyumbang
35.0 peratus kepada sektor Perkhidmatan (Paparan 6).
Paparan 6: SMB mengikut aktiviti Perkhidmatan pada harga malar 2010
Perkhidmatan
RM1,560.1 bilion Sumbangan kepada SMB
67.6% Pertumbuhan
4.1%
2016 2017
Sumbangan kepada jumlah Perkhidmatan 2017 (%)
Paparan 5: SMB mengikut jenis aktiviti ekonomi pada harga malar 2010
Sumbangan 2017 (%)
Perubahan peratusan tahunan (%)
6
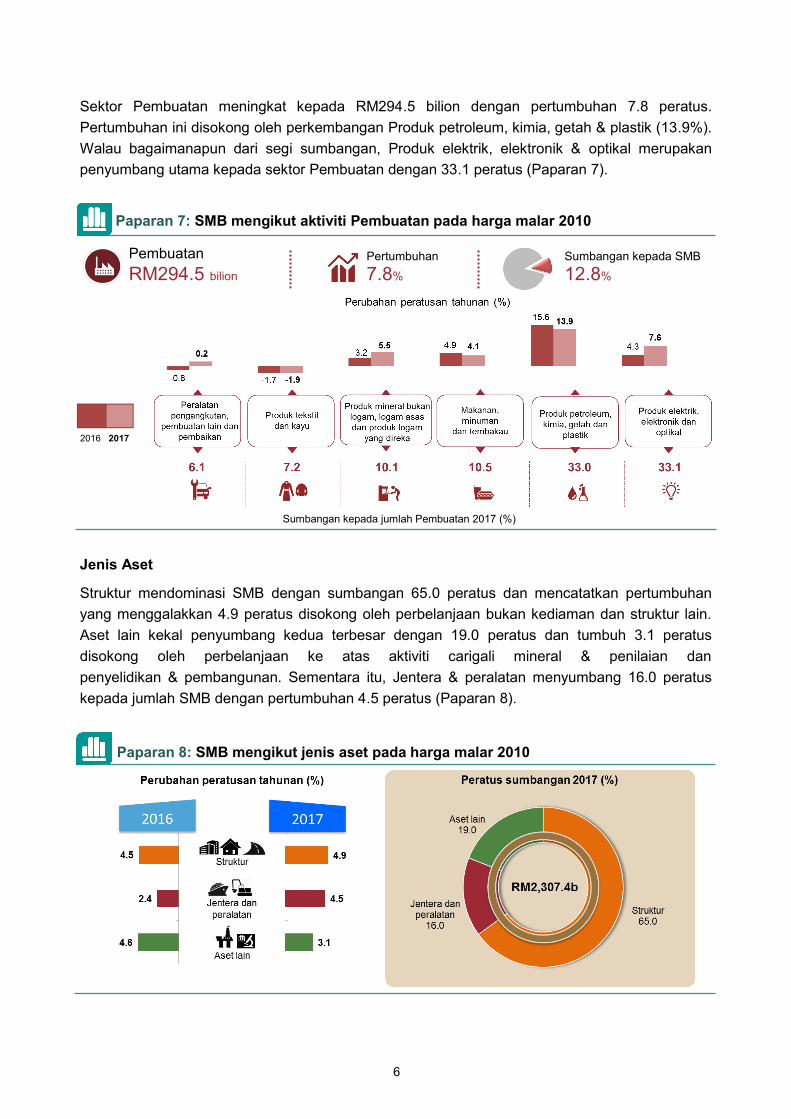
Sektor Pembuatan meningkat kepada RM294.5 bilion dengan pertumbuhan 7.8 peratus.
Pertumbuhan ini disokong oleh perkembangan Produk petroleum, kimia, getah & plastik (13.9%).
Walau bagaimanapun dari segi sumbangan, Produk elektrik, elektronik & optikal merupakan
penyumbang utama kepada sektor Pembuatan dengan 33.1 peratus (Paparan 7).
Jenis Aset
Struktur mendominasi SMB dengan sumbangan 65.0 peratus dan mencatatkan pertumbuhan
yang menggalakkan 4.9 peratus disokong oleh perbelanjaan bukan kediaman dan struktur lain.
Aset lain kekal penyumbang kedua terbesar dengan 19.0 peratus dan tumbuh 3.1 peratus
disokong oleh perbelanjaan ke atas aktiviti carigali mineral & penilaian dan
penyelidikan & pembangunan. Sementara itu, Jentera & peralatan menyumbang 16.0 peratus
kepada jumlah SMB dengan pertumbuhan 4.5 peratus (Paparan 8).
Paparan 7: SMB mengikut aktiviti Pembuatan pada harga malar 2010
Pembuatan
RM294.5 bilion Sumbangan kepada SMB
12.8% Pertumbuhan
7.8%
2016 2017
Sumbangan kepada jumlah Pembuatan 2017 (%)
Paparan 8: SMB mengikut jenis aset pada harga malar 2010
7
PRESTASI STOK MODAL PRODUKTIF
Jenis Aktiviti Ekonomi
SMP menjana nilai sebanyak RM3.0 trilion pada tahun 2017 berbanding RM2.9 trilion pada tahun
sebelumnya dan tumbuh sebanyak 4.6 peratus. Dari segi sumbangan, sektor Perkhidmatan
mencatatkan 67.3 peratus diikuti oleh sektor Perlombongan & pengkuarian sebanyak
15.6 peratus. Sektor Pembuatan menyumbang 13.5 peratus dengan pertumbuhan 6.8 peratus
berbanding 5.8 peratus pada 2016 (Paparan 9).
Jenis Aset
Struktur dan Aset lain merupakan penyumbang utama kepada SMP dengan masing-masing
menyumbang 62.9 peratus dan 18.7 peratus (Paparan 10). Jentera & peralatan yang terdiri
daripada komputer, jentera & peralatan lain dan perabot & pemasangan mencatatkan
sumbangan sebanyak 18.4 peratus. Pertumbuhan Struktur meningkat kepada 4.7 peratus
berbanding 4.4 peratus pada 2016. Aset lain tumbuh pada 4.0 peratus disokong oleh tanaman
modal dan penyelidikan & pembangunan. Selain itu, Jentera & peralatan mencatatkan
4.6 peratus berbanding 3.4 peratus pada 2016.
Paparan 9: SMP mengikut jenis aktiviti ekonomi pada harga malar 2010
Sumbangan 2017 (%)
Perubahan peratusan tahunan (%)
Paparan 10: SMP mengikut jenis aset pada harga malar 2010

8
Muka surat ini sengaja dibiarkan kosong.
This page is deliberately left blank.
9
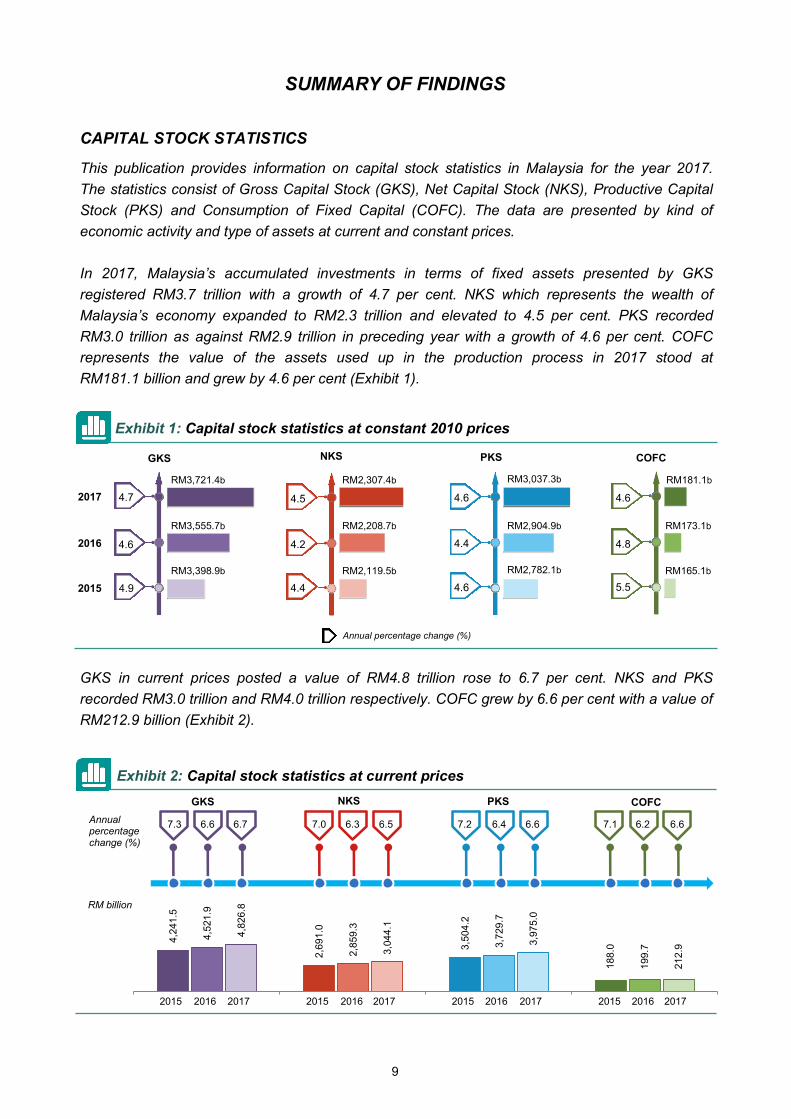
SUMMARY OF FINDINGS
CAPITAL STOCK STATISTICS
This publication provides information on capital stock statistics in Malaysia for the year 2017.
The statistics consist of Gross Capital Stock (GKS), Net Capital Stock (NKS), Productive Capital
Stock (PKS) and Consumption of Fixed Capital (COFC). The data are presented by kind of
economic activity and type of assets at current and constant prices.
In 2017, Malaysia’s accumulated investments in terms of fixed assets presented by GKS
registered RM3.7 trillion with a growth of 4.7 per cent. NKS which represents the wealth of
Malaysia’s economy expanded to RM2.3 trillion and elevated to 4.5 per cent. PKS recorded
RM3.0 trillion as against RM2.9 trillion in preceding year with a growth of 4.6 per cent. COFC
represents the value of the assets used up in the production process in 2017 stood at
RM181.1 billion and grew by 4.6 per cent (Exhibit 1).
GKS in current prices posted a value of RM4.8 trillion rose to 6.7 per cent. NKS and PKS
recorded RM3.0 trillion and RM4.0 trillion respectively. COFC grew by 6.6 per cent with a value of
RM212.9 billion (Exhibit 2).
Exhibit 1: Capital stock statistics at constant 2010 prices
Annual percentage change (%)
RM2,119.5b
RM2,208.7b RM2,904.9b
RM3,037.3b
2015
2016
2017
4.9
RM3,398.9b
RM3,555.7b
RM3,721.4b
4.6
4.7
GKS NKS
RM2,307.4b
4.4
4.2
4.5
PKS
4.6
4.4
4.6
RM2,782.1b
5.5
4.8
4.6
RM165.1b
RM173.1b
RM181.1b
COFC
Exhibit 2: Capital stock statistics at current prices
GKS NKS COFC PKS
4,2
41.5
2,6
91.0
3,5
04.2
1,1
88.0
4,5
21.9
2,8
59.3
3,7
29.7
1,1
99.7
4,8
26.8
3,0
44.1
3,9
75.0
1,2
12
.9
6.66.47.2 6.66.27.17.0 6.56.37.3 6.6 6.7Annual percentage change (%)
RM billion
2015 2016 2017 2015 2016 2017 2015 2016 2017 2015 2016 2017
18
8.0
199.7
188.0
199.7
21
2.9
10
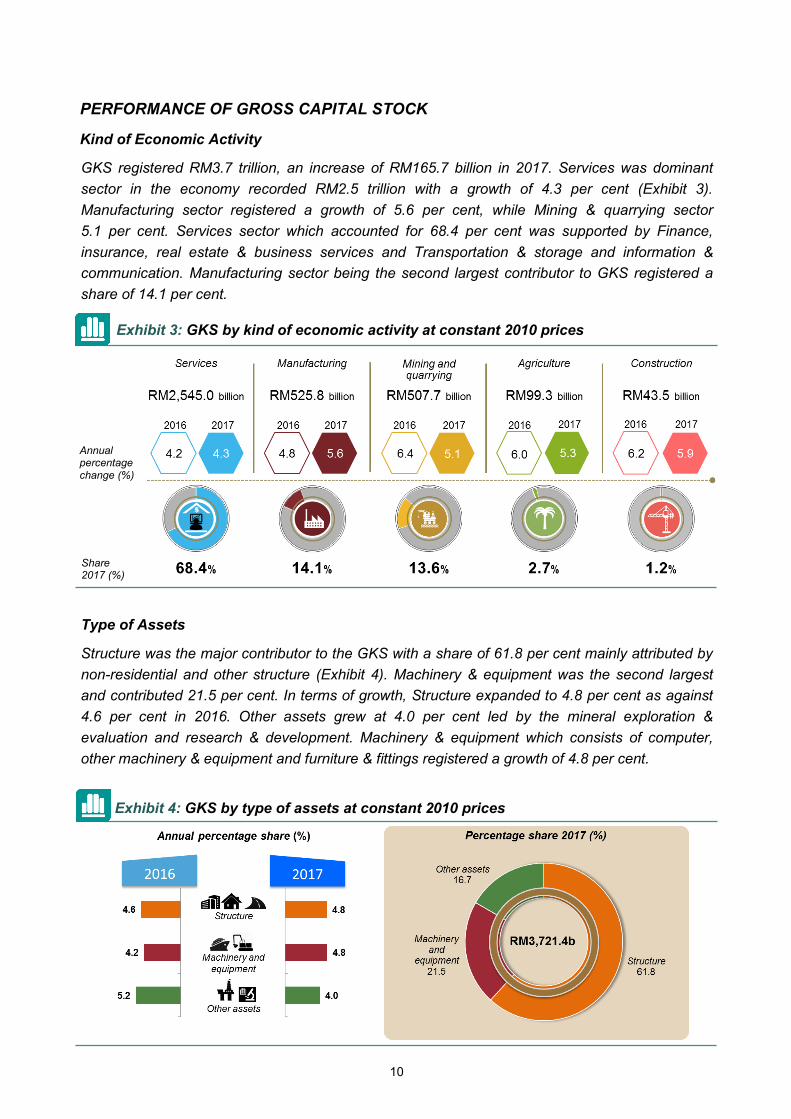
PERFORMANCE OF GROSS CAPITAL STOCK
Kind of Economic Activity
GKS registered RM3.7 trillion, an increase of RM165.7 billion in 2017. Services was dominant
sector in the economy recorded RM2.5 trillion with a growth of 4.3 per cent (Exhibit 3).
Manufacturing sector registered a growth of 5.6 per cent, while Mining & quarrying sector
5.1 per cent. Services sector which accounted for 68.4 per cent was supported by Finance,
insurance, real estate & business services and Transportation & storage and information &
communication. Manufacturing sector being the second largest contributor to GKS registered a
share of 14.1 per cent.
Type of Assets
Structure was the major contributor to the GKS with a share of 61.8 per cent mainly attributed by
non-residential and other structure (Exhibit 4). Machinery & equipment was the second largest
and contributed 21.5 per cent. In terms of growth, Structure expanded to 4.8 per cent as against
4.6 per cent in 2016. Other assets grew at 4.0 per cent led by the mineral exploration &
evaluation and research & development. Machinery & equipment which consists of computer,
other machinery & equipment and furniture & fittings registered a growth of 4.8 per cent.
Exhibit 3: GKS by kind of economic activity at constant 2010 prices
Annual percentage change (%)
Share 2017 (%)
Exhibit 4: GKS by type of assets at constant 2010 prices
11
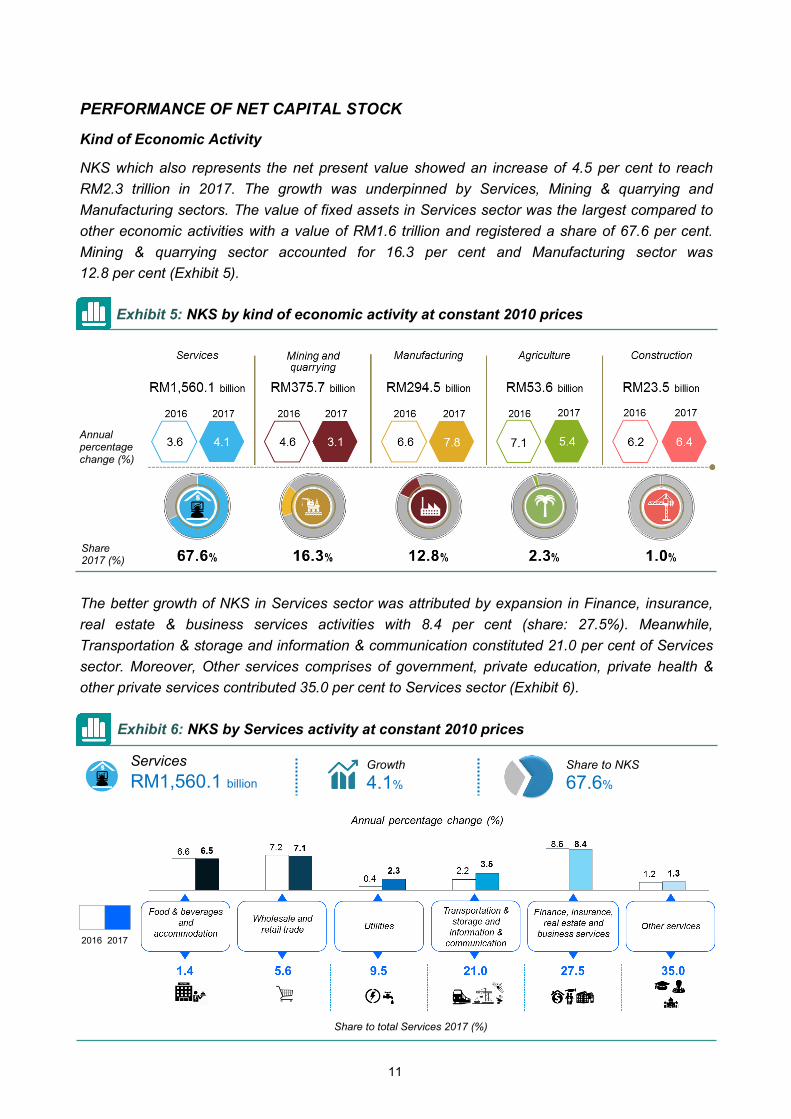
PERFORMANCE OF NET CAPITAL STOCK
Kind of Economic Activity
NKS which also represents the net present value showed an increase of 4.5 per cent to reach
RM2.3 trillion in 2017. The growth was underpinned by Services, Mining & quarrying and
Manufacturing sectors. The value of fixed assets in Services sector was the largest compared to
other economic activities with a value of RM1.6 trillion and registered a share of 67.6 per cent.
Mining & quarrying sector accounted for 16.3 per cent and Manufacturing sector was
12.8 per cent (Exhibit 5).
The better growth of NKS in Services sector was attributed by expansion in Finance, insurance,
real estate & business services activities with 8.4 per cent (share: 27.5%). Meanwhile,
Transportation & storage and information & communication constituted 21.0 per cent of Services
sector. Moreover, Other services comprises of government, private education, private health &
other private services contributed 35.0 per cent to Services sector (Exhibit 6).
Exhibit 5: NKS by kind of economic activity at constant 2010 prices
Annual percentage change (%)
Share 2017 (%)
Exhibit 6: NKS by Services activity at constant 2010 prices
Services
RM1,560.1 billion Share to NKS
67.6% Growth
4.1%
2016 2017
Share to total Services 2017 (%)
12
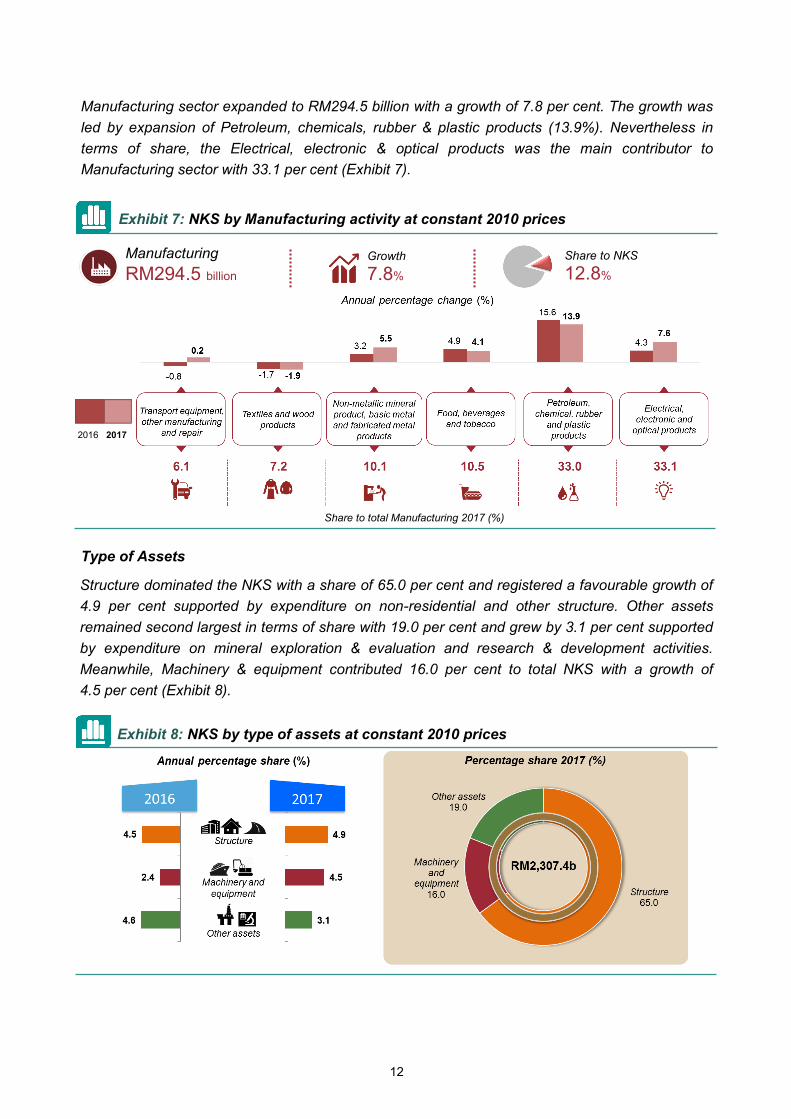
Manufacturing sector expanded to RM294.5 billion with a growth of 7.8 per cent. The growth was
led by expansion of Petroleum, chemicals, rubber & plastic products (13.9%). Nevertheless in
terms of share, the Electrical, electronic & optical products was the main contributor to
Manufacturing sector with 33.1 per cent (Exhibit 7).
Type of Assets
Structure dominated the NKS with a share of 65.0 per cent and registered a favourable growth of
4.9 per cent supported by expenditure on non-residential and other structure. Other assets
remained second largest in terms of share with 19.0 per cent and grew by 3.1 per cent supported
by expenditure on mineral exploration & evaluation and research & development activities.
Meanwhile, Machinery & equipment contributed 16.0 per cent to total NKS with a growth of
4.5 per cent (Exhibit 8).
Exhibit 7: NKS by Manufacturing activity at constant 2010 prices
Manufacturing
RM294.5 billion Share to NKS
12.8% Growth
7.8%
2016 2017
Share to total Manufacturing 2017 (%)
Exhibit 8: NKS by type of assets at constant 2010 prices
13
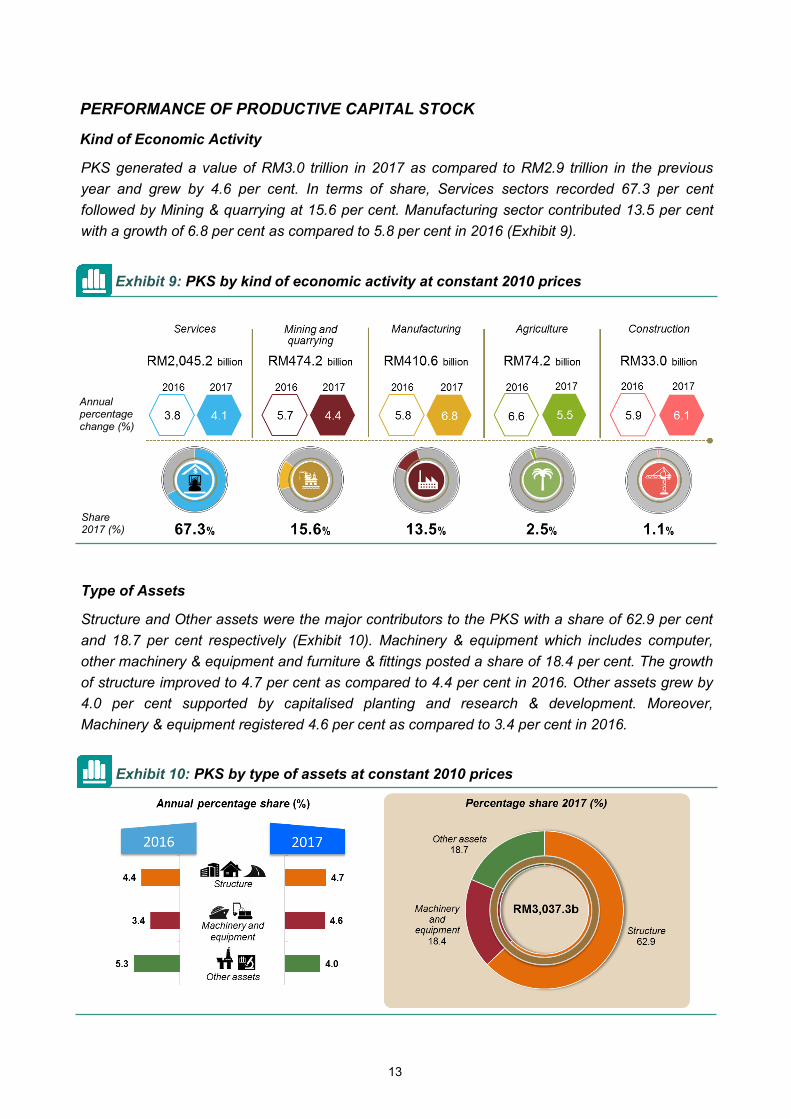
PERFORMANCE OF PRODUCTIVE CAPITAL STOCK
Kind of Economic Activity
PKS generated a value of RM3.0 trillion in 2017 as compared to RM2.9 trillion in the previous
year and grew by 4.6 per cent. In terms of share, Services sectors recorded 67.3 per cent
followed by Mining & quarrying at 15.6 per cent. Manufacturing sector contributed 13.5 per cent
with a growth of 6.8 per cent as compared to 5.8 per cent in 2016 (Exhibit 9).
Type of Assets
Structure and Other assets were the major contributors to the PKS with a share of 62.9 per cent
and 18.7 per cent respectively (Exhibit 10). Machinery & equipment which includes computer,
other machinery & equipment and furniture & fittings posted a share of 18.4 per cent. The growth
of structure improved to 4.7 per cent as compared to 4.4 per cent in 2016. Other assets grew by
4.0 per cent supported by capitalised planting and research & development. Moreover,
Machinery & equipment registered 4.6 per cent as compared to 3.4 per cent in 2016.
Exhibit 9: PKS by kind of economic activity at constant 2010 prices
Annual percentage change (%)
Share 2017 (%)
Exhibit 10: PKS by type of assets at constant 2010 prices

14
Muka surat ini sengaja dibiarkan kosong.
This page is deliberately left blank.
15
Artikel 1:
Produktiviti buruh dan intensiti modal: Korea Selatan berbanding Malaysia1
Oleh: Ahmad Redzuan Abdul Hadi, Mohd Firdaus Zaini dan Mohd Fahmi Mohd Arupin
Pengenalan
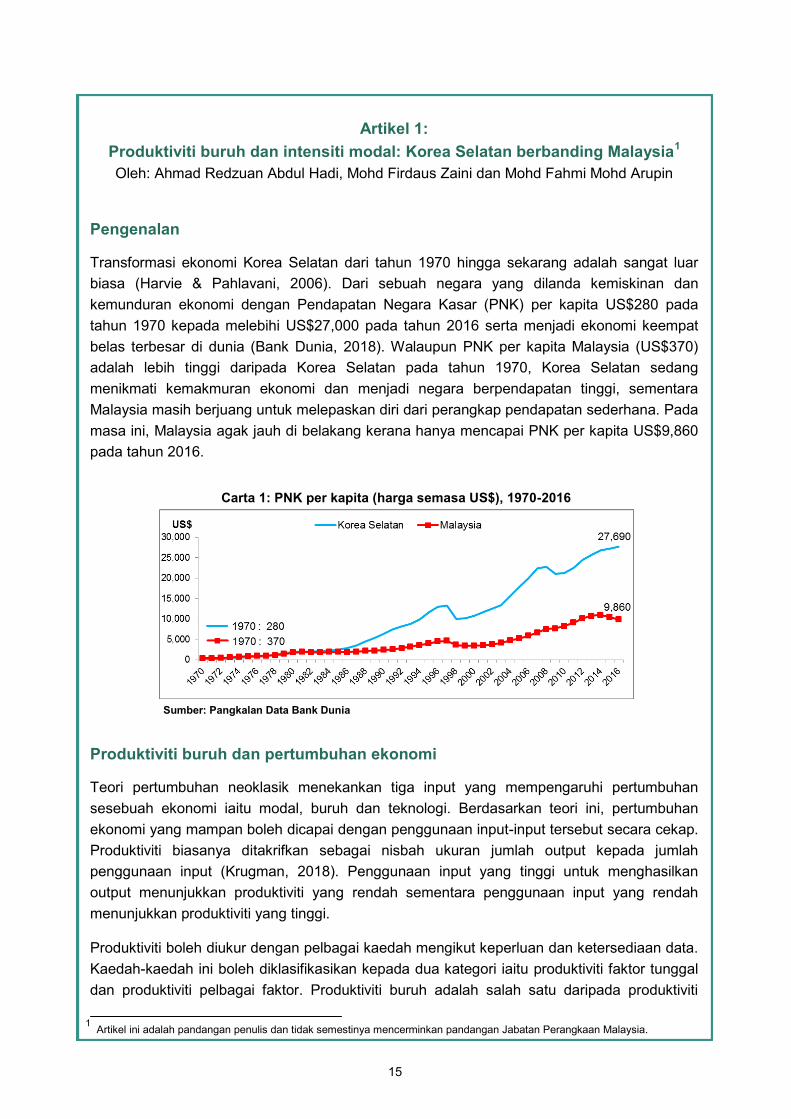
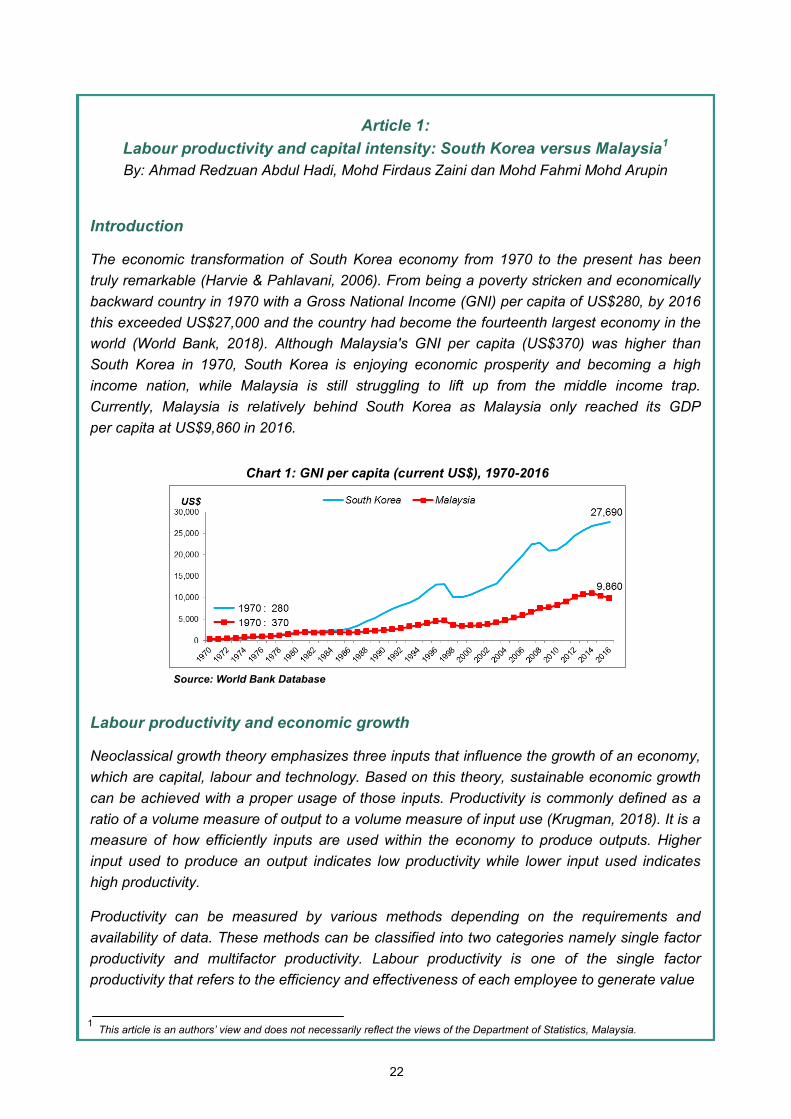
Transformasi ekonomi Korea Selatan dari tahun 1970 hingga sekarang adalah sangat luar
biasa (Harvie & Pahlavani, 2006). Dari sebuah negara yang dilanda kemiskinan dan
kemunduran ekonomi dengan Pendapatan Negara Kasar (PNK) per kapita US$280 pada
tahun 1970 kepada melebihi US$27,000 pada tahun 2016 serta menjadi ekonomi keempat
belas terbesar di dunia (Bank Dunia, 2018). Walaupun PNK per kapita Malaysia (US$370)
adalah lebih tinggi daripada Korea Selatan pada tahun 1970, Korea Selatan sedang
menikmati kemakmuran ekonomi dan menjadi negara berpendapatan tinggi, sementara
Malaysia masih berjuang untuk melepaskan diri dari perangkap pendapatan sederhana. Pada
masa ini, Malaysia agak jauh di belakang kerana hanya mencapai PNK per kapita US$9,860
pada tahun 2016.
Produktiviti buruh dan pertumbuhan ekonomi
Teori pertumbuhan neoklasik menekankan tiga input yang mempengaruhi pertumbuhan
sesebuah ekonomi iaitu modal, buruh dan teknologi. Berdasarkan teori ini, pertumbuhan
ekonomi yang mampan boleh dicapai dengan penggunaan input-input tersebut secara cekap.
Produktiviti biasanya ditakrifkan sebagai nisbah ukuran jumlah output kepada jumlah
penggunaan input (Krugman, 2018). Penggunaan input yang tinggi untuk menghasilkan
output menunjukkan produktiviti yang rendah sementara penggunaan input yang rendah
menunjukkan produktiviti yang tinggi.
Produktiviti boleh diukur dengan pelbagai kaedah mengikut keperluan dan ketersediaan data.
Kaedah-kaedah ini boleh diklasifikasikan kepada dua kategori iaitu produktiviti faktor tunggal
dan produktiviti pelbagai faktor. Produktiviti buruh adalah salah satu daripada produktiviti
1 Artikel ini adalah pandangan penulis dan tidak semestinya mencerminkan pandangan Jabatan Perangkaan Malaysia.
Carta 1: PNK per kapita (harga semasa US$), 1970-2016
Sumber: Pangkalan Data Bank Dunia
16
faktor tunggal yang merujuk kepada kecekapan dan keberkesanan setiap pekerja untuk
menjana nilai ditambah atau output keseluruhan (Produktiviti Buruh, 2018). Ia dikira
menggunakan nisbah nilai ditambah kepada bilangan pekerja.
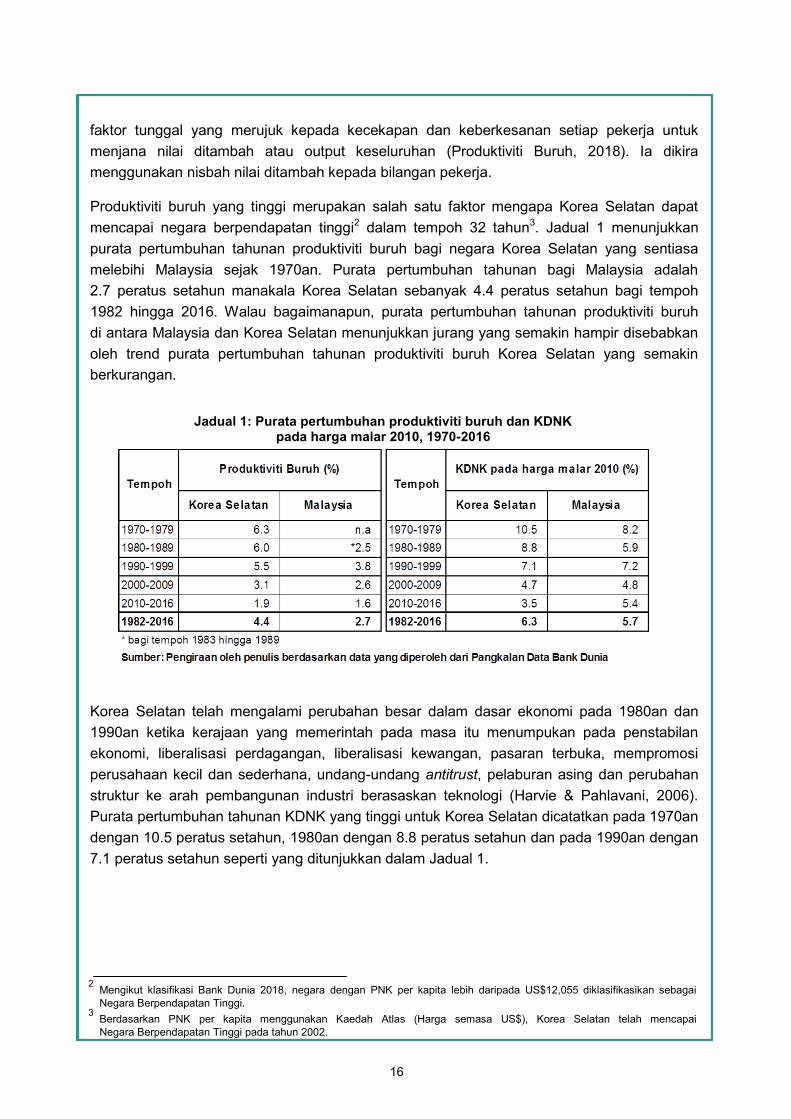
Produktiviti buruh yang tinggi merupakan salah satu faktor mengapa Korea Selatan dapat
mencapai negara berpendapatan tinggi2 dalam tempoh 32 tahun3. Jadual 1 menunjukkan
purata pertumbuhan tahunan produktiviti buruh bagi negara Korea Selatan yang sentiasa
melebihi Malaysia sejak 1970an. Purata pertumbuhan tahunan bagi Malaysia adalah
2.7 peratus setahun manakala Korea Selatan sebanyak 4.4 peratus setahun bagi tempoh
1982 hingga 2016. Walau bagaimanapun, purata pertumbuhan tahunan produktiviti buruh
di antara Malaysia dan Korea Selatan menunjukkan jurang yang semakin hampir disebabkan
oleh trend purata pertumbuhan tahunan produktiviti buruh Korea Selatan yang semakin
berkurangan.
Korea Selatan telah mengalami perubahan besar dalam dasar ekonomi pada 1980an dan
1990an ketika kerajaan yang memerintah pada masa itu menumpukan pada penstabilan
ekonomi, liberalisasi perdagangan, liberalisasi kewangan, pasaran terbuka, mempromosi
perusahaan kecil dan sederhana, undang-undang antitrust, pelaburan asing dan perubahan
struktur ke arah pembangunan industri berasaskan teknologi (Harvie & Pahlavani, 2006).
Purata pertumbuhan tahunan KDNK yang tinggi untuk Korea Selatan dicatatkan pada 1970an
dengan 10.5 peratus setahun, 1980an dengan 8.8 peratus setahun dan pada 1990an dengan
7.1 peratus setahun seperti yang ditunjukkan dalam Jadual 1.
2 Mengikut klasifikasi Bank Dunia 2018, negara dengan PNK per kapita lebih daripada US$12,055 diklasifikasikan sebagai
Negara Berpendapatan Tinggi. 3 Berdasarkan PNK per kapita menggunakan Kaedah Atlas (Harga semasa US$), Korea Selatan telah mencapai
Negara Berpendapatan Tinggi pada tahun 2002.
Jadual 1: Purata pertumbuhan produktiviti buruh dan KDNK pada harga malar 2010, 1970-2016
17
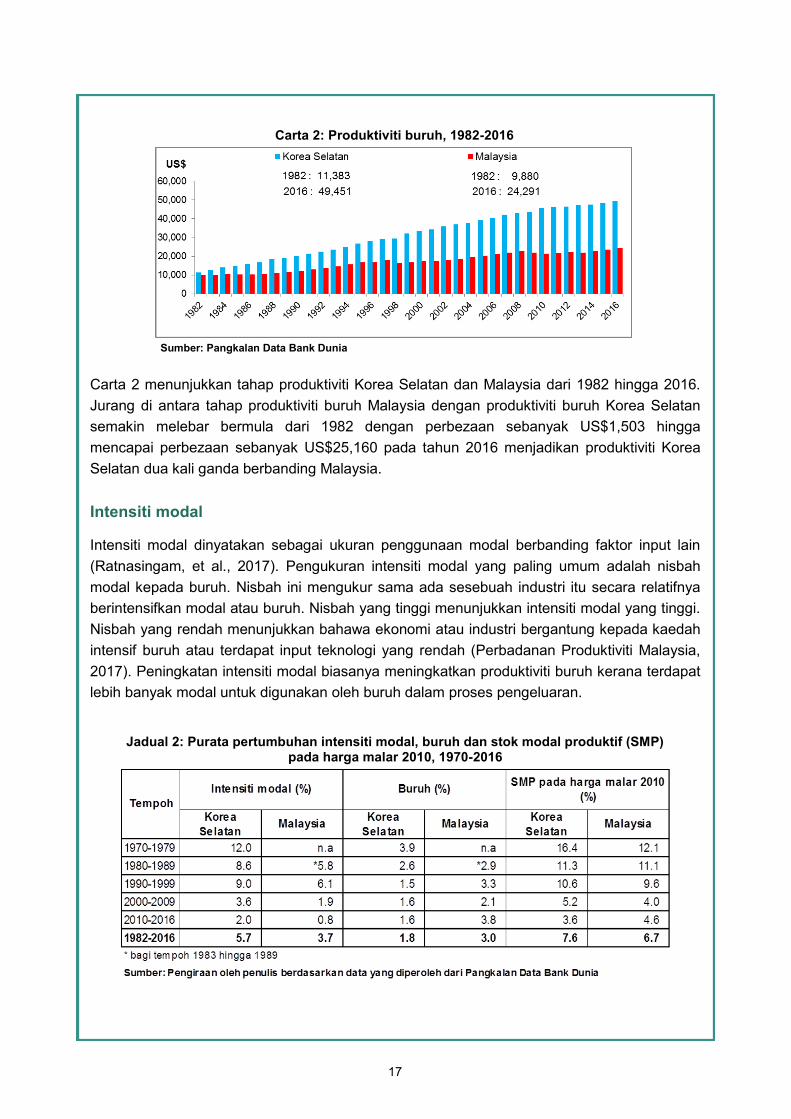
Carta 2 menunjukkan tahap produktiviti Korea Selatan dan Malaysia dari 1982 hingga 2016.
Jurang di antara tahap produktiviti buruh Malaysia dengan produktiviti buruh Korea Selatan
semakin melebar bermula dari 1982 dengan perbezaan sebanyak US$1,503 hingga
mencapai perbezaan sebanyak US$25,160 pada tahun 2016 menjadikan produktiviti Korea
Selatan dua kali ganda berbanding Malaysia.
Intensiti modal
Intensiti modal dinyatakan sebagai ukuran penggunaan modal berbanding faktor input lain
(Ratnasingam, et al., 2017). Pengukuran intensiti modal yang paling umum adalah nisbah
modal kepada buruh. Nisbah ini mengukur sama ada sesebuah industri itu secara relatifnya
berintensifkan modal atau buruh. Nisbah yang tinggi menunjukkan intensiti modal yang tinggi.
Nisbah yang rendah menunjukkan bahawa ekonomi atau industri bergantung kepada kaedah
intensif buruh atau terdapat input teknologi yang rendah (Perbadanan Produktiviti Malaysia,
2017). Peningkatan intensiti modal biasanya meningkatkan produktiviti buruh kerana terdapat
lebih banyak modal untuk digunakan oleh buruh dalam proses pengeluaran.
Jadual 2: Purata pertumbuhan intensiti modal, buruh dan stok modal produktif (SMP) pada harga malar 2010, 1970-2016
Carta 2: Produktiviti buruh, 1982-2016
Sumber: Pangkalan Data Bank Dunia
18
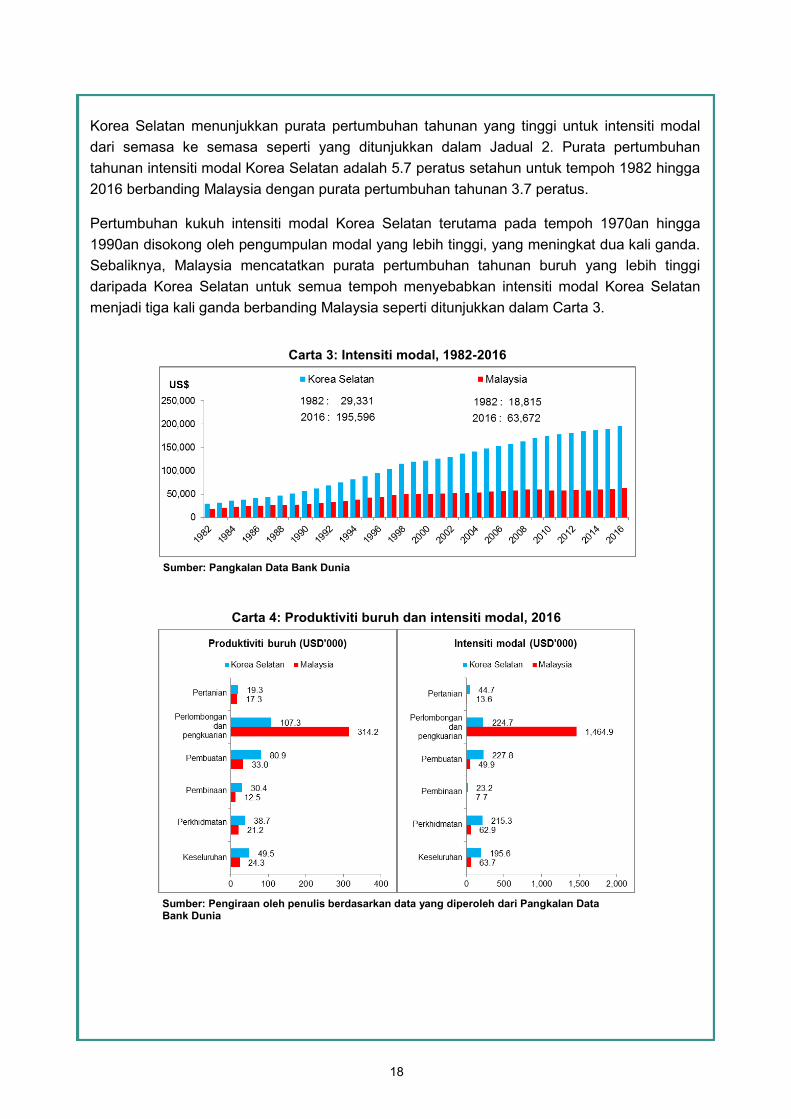
Korea Selatan menunjukkan purata pertumbuhan tahunan yang tinggi untuk intensiti modal
dari semasa ke semasa seperti yang ditunjukkan dalam Jadual 2. Purata pertumbuhan
tahunan intensiti modal Korea Selatan adalah 5.7 peratus setahun untuk tempoh 1982 hingga
2016 berbanding Malaysia dengan purata pertumbuhan tahunan 3.7 peratus.
Pertumbuhan kukuh intensiti modal Korea Selatan terutama pada tempoh 1970an hingga
1990an disokong oleh pengumpulan modal yang lebih tinggi, yang meningkat dua kali ganda.
Sebaliknya, Malaysia mencatatkan purata pertumbuhan tahunan buruh yang lebih tinggi
daripada Korea Selatan untuk semua tempoh menyebabkan intensiti modal Korea Selatan
menjadi tiga kali ganda berbanding Malaysia seperti ditunjukkan dalam Carta 3.
Sumber: Pangkalan Data Bank Dunia
Carta 3: Intensiti modal, 1982-2016
Carta 4: Produktiviti buruh dan intensiti modal, 2016
Sumber: Pengiraan oleh penulis berdasarkan data yang diperoleh dari Pangkalan Data Bank Dunia
19
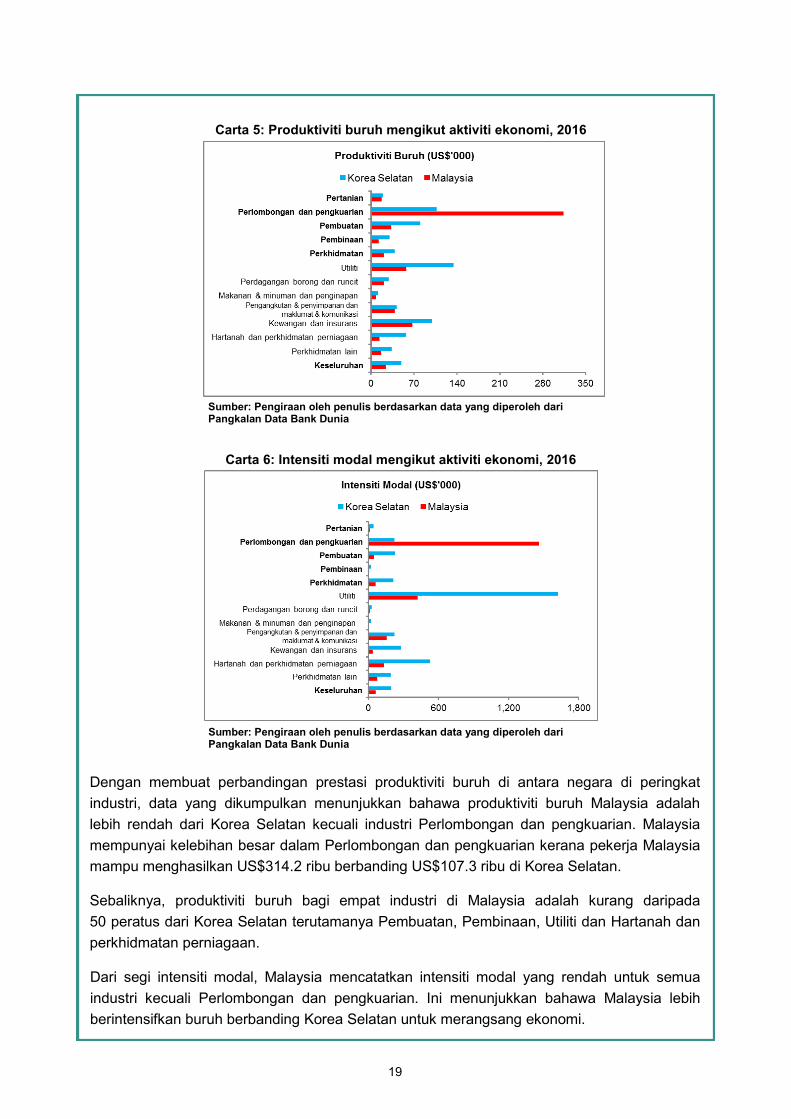
Dengan membuat perbandingan prestasi produktiviti buruh di antara negara di peringkat
industri, data yang dikumpulkan menunjukkan bahawa produktiviti buruh Malaysia adalah
lebih rendah dari Korea Selatan kecuali industri Perlombongan dan pengkuarian. Malaysia
mempunyai kelebihan besar dalam Perlombongan dan pengkuarian kerana pekerja Malaysia
mampu menghasilkan US$314.2 ribu berbanding US$107.3 ribu di Korea Selatan.
Sebaliknya, produktiviti buruh bagi empat industri di Malaysia adalah kurang daripada
50 peratus dari Korea Selatan terutamanya Pembuatan, Pembinaan, Utiliti dan Hartanah dan
perkhidmatan perniagaan.
Dari segi intensiti modal, Malaysia mencatatkan intensiti modal yang rendah untuk semua
industri kecuali Perlombongan dan pengkuarian. Ini menunjukkan bahawa Malaysia lebih
berintensifkan buruh berbanding Korea Selatan untuk merangsang ekonomi.
Carta 5: Produktiviti buruh mengikut aktiviti ekonomi, 2016
Sumber: Pengiraan oleh penulis berdasarkan data yang diperoleh dari Pangkalan Data Bank Dunia
Carta 6: Intensiti modal mengikut aktiviti ekonomi, 2016
Sumber: Pengiraan oleh penulis berdasarkan data yang diperoleh dari Pangkalan Data Bank Dunia
20
Kesimpulan
Produktiviti buruh dan intensiti modal Korea Selatan yang lebih tinggi telah menghasilkan
prestasi ekonomi yang kukuh berbanding Malaysia. Korea Selatan telah melaksanakan
pelbagai program dan dasar ekonomi bagi meningkatkan produktiviti buruh dan intensiti
modal sejak dari 1970an. Segala usaha mereka telah membuahkan hasil apabila mencapai
taraf negara maju pada tahun 2002 dan menjadi ekonomi keempat belas terbesar di dunia.
Bagi kes Malaysia, analisis menunjukkan bahawa semua industri mencatatkan produktiviti
buruh yang lebih rendah kecuali Perlombongan dan pengkuarian. Keputusan dari analisis
intensiti modal juga menyokong bahawa majoriti industri di Korea Selatan lebih berintensifkan
modal berbanding Malaysia. Kerajaan Malaysia dalam Rancangan Malaysia Kesebelas
(RMK11) turut menggariskan keperluan dalam meningkatkan pertumbuhan produktiviti yang
menjadi pemangkin kepada pertumbuhan ekonomi. Pertumbuhan produktiviti yang tinggi
dapat dicapai melalui inisiatif yang komprehensif di semua peringkat dan diterajui oleh pemain
industri. Keupayaan Malaysia untuk meningkatkan kadar pertumbuhan produktiviti buruh dan
intensiti modal bergantung kepada kapasiti negara untuk menjana peningkatan kecekapan
daripada modal insan dan penggunaan automasi yang lebih meluas dalam proses
pengeluaran. Peningkatan dalam kecekapan modal secara relatifnya turut meningkatkan
produktiviti buruh kerana terdapat lebih banyak modal untuk digunakan oleh buruh dalam
proses pengeluaran. Oleh itu, peningkatan pelaburan modal perlu menjadi tumpuan utama
industri-industri Malaysia terutamanya sektor Pembuatan dan Perkhidmatan bagi
meningkatkan tahap produktiviti buruh dan mencapai kemajuan ekonomi seperti yang
dinikmati oleh Korea Selatan.
21
Bibliografi
Bank Dunia. (2018, October 15). World Bank Open Data. Diperoleh dari
https://data.worldbank.org/?locations=KR-MY
Harvie, C., & Pahlavani, M. (2006). Sources of economic growth in South Korea: an
application of the ARDL analysis in the presence of structural breaks – 1980-2005#.
Seoul, Korea.
Jabatan Perangkaan Malaysia. (2018). Produktiviti Buruh, Suku Tahun Pertama 2018.
Putrajaya: Jabatan Perangkaan Malaysia.
Krugman, P. (2018, October). Organisation for Economic Co-operation and Development.
Diperoleh dari Defining and Measuring Productivity:
https://www.oecd.org/sdd/productivity-stats/40526851.pdf
Kunio, Y. (2004, June). The Comparative Economic Performance of Malaysia: An Analysis.
Southeast Asian Studies, Vol. 42, No. 1.
OECD. (2001). Measuring Productivity OECD Manual, Measurement of Aggregate and
Industry-level Productivity Growth. Paris: OECD Publishing.
OECD. (2009). Measuring Capital OECD Manual. Paris: OECD Publishing.
Perbadanan Produktiviti Malaysia. (2017). Laporan Produktiviti 2016/2017. Selangor:
Perbadanan Produktiviti Malaysia.
Ratnasingam, J., Ark, C. K., Mohamed, S., Liat, L. C., Ramasamy, G., & Senin, A. L. (2017,
January 12). An Analysis of Labor and Capital Productivity in the Malaysian Timber
Sector. Diperoleh dari BioResources:
http://ojs.cnr.ncsu.edu/index.php/BioRes/article/view/
BioRes_12_1_1430_Ratnasingam_Analysis_Labor_Capital_Productivity
Unit Perancang Ekonomi. (2015). Bab 2: Memperkukuh Daya Tahan Ekonomi Makro untuk
Pertumbuhan Mampan. Dalam Rancangan Malaysia Kesebelas 2016-2020:
Pertumbuhan Berpaksikan Rakyat (pp. 2-5). Putrajaya: Unit Perancang Ekonomi.
Unit Perancang Ekonomi. (2018, October 19). Laman Web Rasmi Kementerian Hal Ehwal
Ekonomi. Diperoleh dari Unit Perancang Ekonomi: http://www.epu.gov.my/ms/dasar/
sejarah-ekonomi
22
Article 1:
Labour productivity and capital intensity: South Korea versus Malaysia1
By: Ahmad Redzuan Abdul Hadi, Mohd Firdaus Zaini dan Mohd Fahmi Mohd Arupin
Introduction
The economic transformation of South Korea economy from 1970 to the present has been
truly remarkable (Harvie & Pahlavani, 2006). From being a poverty stricken and economically
backward country in 1970 with a Gross National Income (GNI) per capita of US$280, by 2016
this exceeded US$27,000 and the country had become the fourteenth largest economy in the
world (World Bank, 2018). Although Malaysia's GNI per capita (US$370) was higher than
South Korea in 1970, South Korea is enjoying economic prosperity and becoming a high
income nation, while Malaysia is still struggling to lift up from the middle income trap.
Currently, Malaysia is relatively behind South Korea as Malaysia only reached its GDP
per capita at US$9,860 in 2016.
Labour productivity and economic growth
Neoclassical growth theory emphasizes three inputs that influence the growth of an economy,
which are capital, labour and technology. Based on this theory, sustainable economic growth
can be achieved with a proper usage of those inputs. Productivity is commonly defined as a
ratio of a volume measure of output to a volume measure of input use (Krugman, 2018). It is a
measure of how efficiently inputs are used within the economy to produce outputs. Higher
input used to produce an output indicates low productivity while lower input used indicates
high productivity.
Productivity can be measured by various methods depending on the requirements and
availability of data. These methods can be classified into two categories namely single factor
productivity and multifactor productivity. Labour productivity is one of the single factor
productivity that refers to the efficiency and effectiveness of each employee to generate value
1 This article is an authors’ view and does not necessarily reflect the views of the Department of Statistics, Malaysia.
Chart 1: GNI per capita (current US$), 1970-2016
Source: World Bank Database
23
added or overall output (Labour Productivity, 2018). It is calculated by using a value added
ratio and number of employees.
Higher labour productivity is one of the factors why South Korea able to achieve a high
income nation2 within 32 years3. Table 1 shows the average annual growth for labour
productivity indicates that South Korea has always exceeded Malaysia since 1970s. The
annual average growth for Malaysia is 2.7 per cent per annum while South Korea is
4.4 per cent per annum for the period 1982 to 2016. However, the average annual growth for
labour productivity between Malaysia and South Korea indicates a closer gap between
Malaysia and South Korea due to South Korea’s annual average growth of labour productivity
grew at diminishing trend.
South Korea has experienced major shifts in economic policy during the 1980s and 1990s as
the ruling government at that time focused on economic stabilization, trade liberalization,
financial liberalization, market opening, promotion of small and medium enterprises, antitrust
legislation, foreign investments and structural change towards the development of technology
based industries (Harvie & Pahlavani, 2006). Average annual growth of GDP which is high for
South Korea was recorded during the 1970s with 10.5 per cent per annum, 1980s with
8.8 per cent per annum and 1990s with 7.1 per cent per annum as shown in Table 1.
2 According to World Bank‘s classification 2018, a country with GNI per capita more than US$12,055 is classified as High
Income Nation. 3 Based on GNI per capita using Atlas Method (Current prices US$), South Korea has reached a High Income Nation in 2002.
Table 1: Average growth of labour productivity and GDP at constant 2010 prices, 1970-2016
24
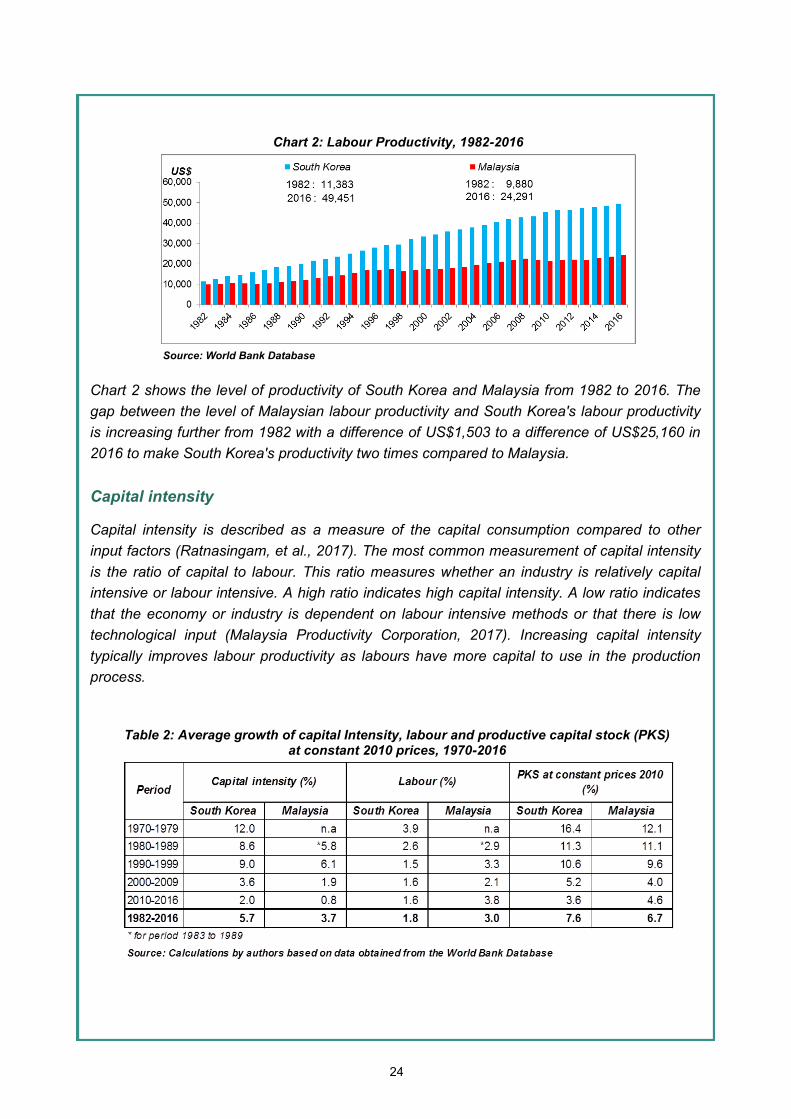
Chart 2 shows the level of productivity of South Korea and Malaysia from 1982 to 2016. The
gap between the level of Malaysian labour productivity and South Korea's labour productivity
is increasing further from 1982 with a difference of US$1,503 to a difference of US$25,160 in
2016 to make South Korea's productivity two times compared to Malaysia.
Capital intensity
Capital intensity is described as a measure of the capital consumption compared to other
input factors (Ratnasingam, et al., 2017). The most common measurement of capital intensity
is the ratio of capital to labour. This ratio measures whether an industry is relatively capital
intensive or labour intensive. A high ratio indicates high capital intensity. A low ratio indicates
that the economy or industry is dependent on labour intensive methods or that there is low
technological input (Malaysia Productivity Corporation, 2017). Increasing capital intensity
typically improves labour productivity as labours have more capital to use in the production
process.
Chart 2: Labour Productivity, 1982-2016
Source: World Bank Database
Table 2: Average growth of capital Intensity, labour and productive capital stock (PKS) at constant 2010 prices, 1970-2016
25
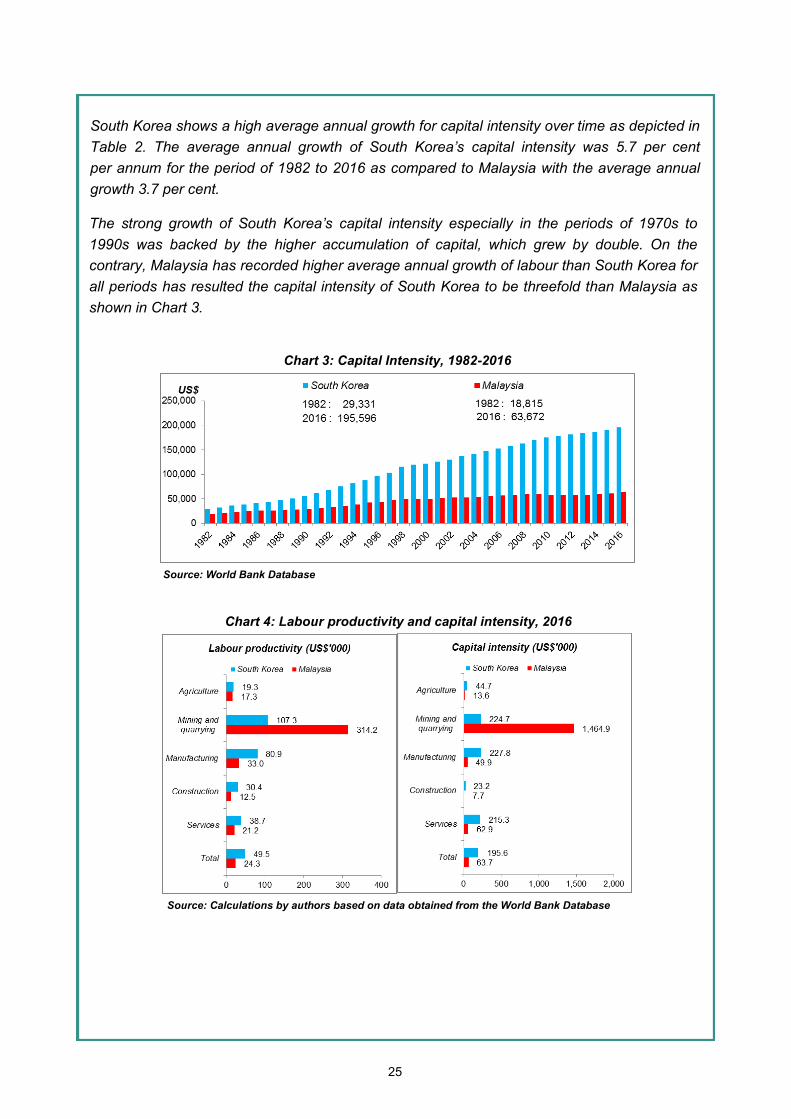
South Korea shows a high average annual growth for capital intensity over time as depicted in
Table 2. The average annual growth of South Korea’s capital intensity was 5.7 per cent
per annum for the period of 1982 to 2016 as compared to Malaysia with the average annual
growth 3.7 per cent.
The strong growth of South Korea’s capital intensity especially in the periods of 1970s to
1990s was backed by the higher accumulation of capital, which grew by double. On the
contrary, Malaysia has recorded higher average annual growth of labour than South Korea for
all periods has resulted the capital intensity of South Korea to be threefold than Malaysia as
shown in Chart 3.
Chart 4: Labour productivity and capital intensity, 2016
Source: Calculations by authors based on data obtained from the World Bank Database
Chart 3: Capital Intensity, 1982-2016
Source: World Bank Database
26
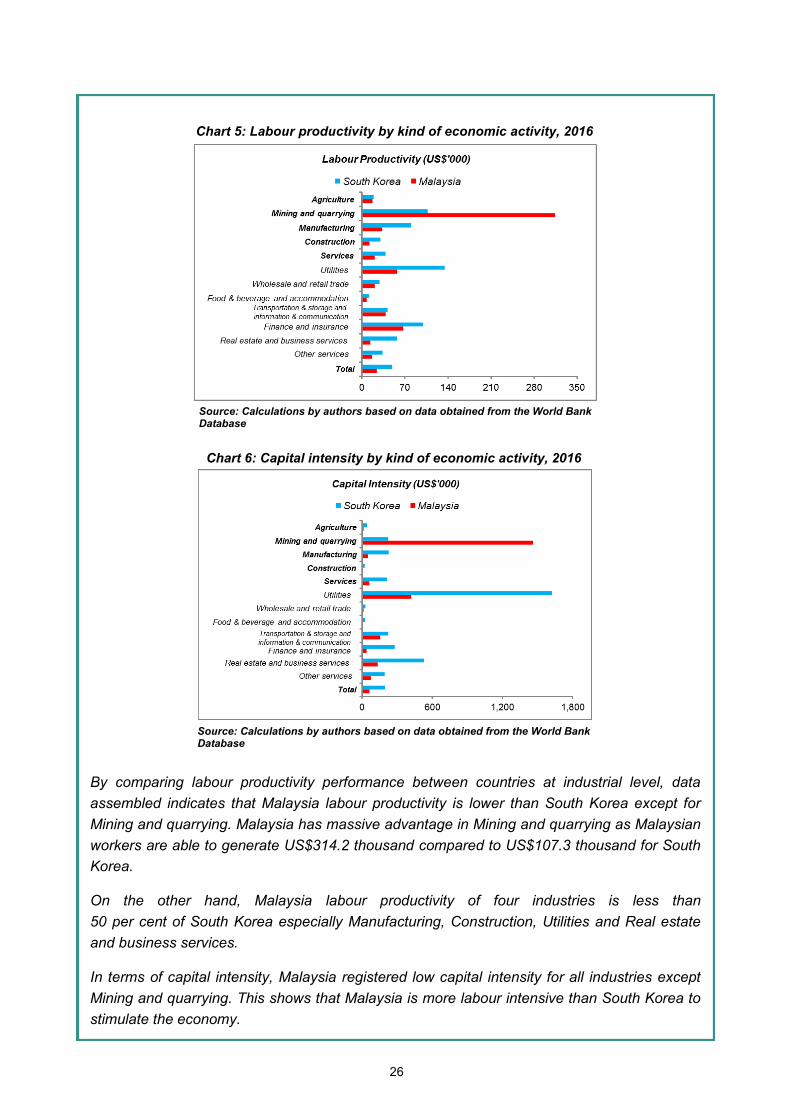
By comparing labour productivity performance between countries at industrial level, data
assembled indicates that Malaysia labour productivity is lower than South Korea except for
Mining and quarrying. Malaysia has massive advantage in Mining and quarrying as Malaysian
workers are able to generate US$314.2 thousand compared to US$107.3 thousand for South
Korea.
On the other hand, Malaysia labour productivity of four industries is less than
50 per cent of South Korea especially Manufacturing, Construction, Utilities and Real estate
and business services.
In terms of capital intensity, Malaysia registered low capital intensity for all industries except
Mining and quarrying. This shows that Malaysia is more labour intensive than South Korea to
stimulate the economy.
Chart 6: Capital intensity by kind of economic activity, 2016
Source: Calculations by authors based on data obtained from the World Bank Database
Chart 5: Labour productivity by kind of economic activity, 2016
Source: Calculations by authors based on data obtained from the World Bank Database
27
Conclusion
The higher labour productivity and capital intensity of South Korea has resulted a strong
economic performance, as compared to Malaysia. South Korea has implemented various
programs and economic policies to increase labour productivity and capital intensity since the
1970s. All their efforts have paid off when they reach developed nation status in 2002 and
became the fourteenth largest economy in the world. In the case of Malaysia, analysis showed
that all industries recorded lower labour productivity except Mining & quarrying. The results of
the analysis of capital intensity also support that the majority of industries in South Korea are
more capital-intensive than Malaysia. The government of Malaysia in the Eleventh Malaysia
Plan (11 MP) also outlines the need to increase productivity growth which is a catalyst for
economic growth. High productivity growth can be achieved through a comprehensive
initiative at all levels and led by industry players. Malaysia's ability to increase labour
productivity growth rates and capital intensity is dependent on national capacity to generate
greater efficiency of human capital and greater use of automation in the production process.
The increase in capital efficiency has relatively increased labour productivity as there is more
capital to be used by labour in the production process. Therefore, the increase in capital
investment should be the main focus of the Malaysian industries, particularly the
Manufacturing and Services sectors to increase the level of labour productivity and achieve
economic progress as enjoyed by South Korea.
28
Bibliography
Department of Statistics, Malaysia. (2018). Labour Productivity, First Quarter 2018. Putrajaya:
Department of Statistics, Malaysia.
Economic Planning Unit. (2015). Chapter 2: Strengthening macroeconomic resilience for
sustained growth. In Eleven Malaysia Plan 2016-2020: Anchoring Growth On People
(pp. 2-5). Putrajaya: Economic Planning Unit.
Economic Planning Unit. (2018, October 19). Official Website of Ministry of Economic Affairs.
Retrieved from http://epu.gov.my/en/policies/economic-history
Harvie, C., & Pahlavani, M. (2006). Sources of economic growth in South Korea: an
application of the ARDL analysis in the presence of structural breaks – 1980-2005#.
Seoul, Korea.
Krugman, P. (2018, October). Organisation for Economic Co-operation and Development.
Retrieved from Defining and Measuring Productivity: https://www.oecd.org/sdd/
productivity-stats/40526851.pdf
Kunio, Y. (2004, June). The Comparative Economic Performance of Malaysia: An Analysis.
Southeast Asian Studies, Vol. 42, No. 1.
Malaysia Productivity Corporation. (2017). Productivity Report 2017/2018. Selangor: Malaysia
Productivity Corporation.
OECD. (2001). Measuring Productivity OECD Manual, Measurement of Aggregate and
Industry-level Productivity Growth. Paris: OECD Publishing.
OECD. (2009). Measuring Capital OECD Manual. Paris: OECD Publishing.
Ratnasingam, J., Ark, C. K., Mohamed, S., Liat, L. C., Ramasamy, G., & Senin, A. L. (2017,
January 12). An Analysis of Labor and Capital Productivity in the Malaysian Timber
Sector. Retrieved from BioResources:
http://ojs.cnr.ncsu.edu/index.php/BioRes/article/view/
BioRes_12_1_1430_Ratnasingam_Analysis_Labor_Capital_Productivity
World Bank. (2018, October 15). World Bank Open Data. Retrieved from
https://data.worldbank.org/?locations=KR-MY
29
Artikel 2:
Intensiti Modal di Malaysia, 1982 - 20171
Oleh: Syahron Helmy Abdullah Halim, Salmah Salleh dan Farihin Rosni
Pengenalan
Ekonomi Malaysia telah menunjukkan daya tahan beberapa tahun kebelakangan ini
walaupun terdapat kejutan luaran dan kekal dengan prestasi yang baik. Kemajuan telah
dibuat ke arah mencapai status berpendapatan tinggi. Dalam menentukan pertumbuhan
ekonomi jangka panjang, intensiti modal memainkan peranan penting di mana kaedah yang
berintensifkan modal membolehkan peningkatan dalam pengeluaran dan standard hidup
yang lebih tinggi.
Intensiti modal secara amnya didefinisikan sebagai nisbah modal kepada buruh yang
digunakan dalam proses pengeluaran atau industri pada suatu masa tertentu, semakin tinggi
nisbah semakin tinggi intensiti modal dan sebaliknya (Kalim, 2001). Umumnya, negara yang
sedang membangun mengalami kekurangan modal, oleh itu meminimumkan intensiti modal
sebagai kriteria pelaburan adalah dianggap wajar. Untuk mengukur tahap faktor intensiti, dua
indikator iaitu nisbah modal buruh dan nisbah modal nilai ditambah digunakan dengan
maksud yang lebih meluas.
Artikel ini membincangkan mengenai intensiti modal di Malaysia dari tahun 1982 hingga 2017
berdasarkan nisbah modal buruh. Analisis ini bermula pada tahun 1982 kerana ini
merupakan data terawal yang tersedia berdasarkan Survei Guna Tenaga yang dilaksanakan
oleh Jabatan Perangkaan Malaysia. Stok Modal Bersih (SMB) pada harga malar 2010 dan
bilangan pekerja yang bekerja dalam negara digunakan dalam analisis artikel ini. Objektif
artikel ini adalah untuk menjelaskan intensiti modal dalam pelbagai sektor ekonomi. Pertama,
artikel ini akan membincangkan SMB dan pekerja secara umum dalam tempoh yang
dibincangkan. Seterusnya, artikel ini akan menjelaskan intensiti modal di peringkat nasional
diikuti dengan intensiti modal pelbagai sektor dari tahun 1982 hingga 2017.
Stok Modal Bersih dan Pekerja
SMB merupakan pelaburan terkumpul ditolak dengan nilai aset yang telah bersara dan susut
nilai terkumpul bagi aset yang masih beroperasi. Ia juga merupakan nilai bersih semasa bagi
menjana perkhidmatan modal di masa depan yang akan diberikan oleh aset terkumpul
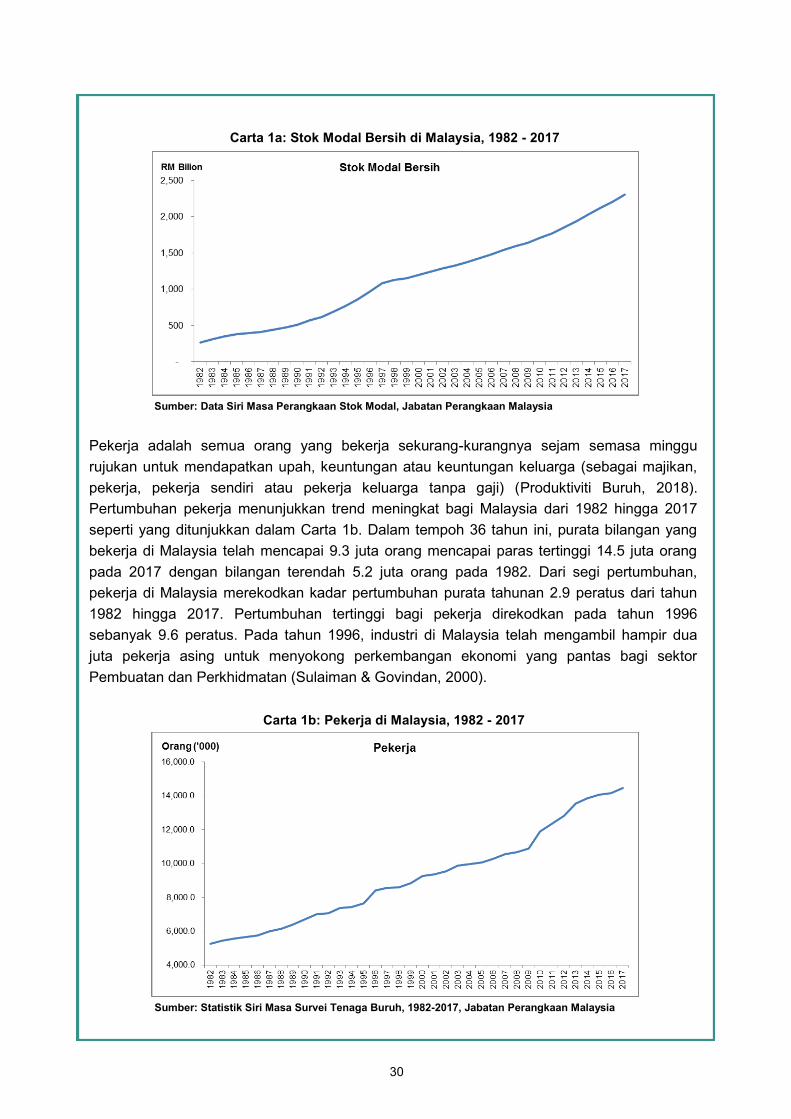
tersebut dan menggambarkan kekayaan ekonomi Malaysia (OECD, 2009). Sepanjang
tempoh 36 tahun (1982 hingga 2017) SMB tumbuh daripada RM0.3 trilion kepada
RM2.3 trilion (Carta 1a), dengan purata pertumbuhan tahunan 6.3 peratus. Pada
pertengahan 1990an, SMB merekodkan pertumbuhan dua-digit bagi lima tahun berturut-turut
disebabkan oleh suntikan modal yang besar terutamanya bagi sektor Perkhidmatan selari
dengan perkembangan industri ini dalam tempoh tersebut.
1 Artikel ini adalah pandangan penulis dan tidak semestinya mencerminkan pandangan Jabatan Perangkaan Malaysia.
30
Pekerja adalah semua orang yang bekerja sekurang-kurangnya sejam semasa minggu
rujukan untuk mendapatkan upah, keuntungan atau keuntungan keluarga (sebagai majikan,
pekerja, pekerja sendiri atau pekerja keluarga tanpa gaji) (Produktiviti Buruh, 2018).
Pertumbuhan pekerja menunjukkan trend meningkat bagi Malaysia dari 1982 hingga 2017
seperti yang ditunjukkan dalam Carta 1b. Dalam tempoh 36 tahun ini, purata bilangan yang
bekerja di Malaysia telah mencapai 9.3 juta orang mencapai paras tertinggi 14.5 juta orang
pada 2017 dengan bilangan terendah 5.2 juta orang pada 1982. Dari segi pertumbuhan,
pekerja di Malaysia merekodkan kadar pertumbuhan purata tahunan 2.9 peratus dari tahun
1982 hingga 2017. Pertumbuhan tertinggi bagi pekerja direkodkan pada tahun 1996
sebanyak 9.6 peratus. Pada tahun 1996, industri di Malaysia telah mengambil hampir dua
juta pekerja asing untuk menyokong perkembangan ekonomi yang pantas bagi sektor
Pembuatan dan Perkhidmatan (Sulaiman & Govindan, 2000).
Carta 1b: Pekerja di Malaysia, 1982 - 2017
Sumber: Statistik Siri Masa Survei Tenaga Buruh, 1982-2017, Jabatan Perangkaan Malaysia
Carta 1a: Stok Modal Bersih di Malaysia, 1982 - 2017
Sumber: Data Siri Masa Perangkaan Stok Modal, Jabatan Perangkaan Malaysia
31
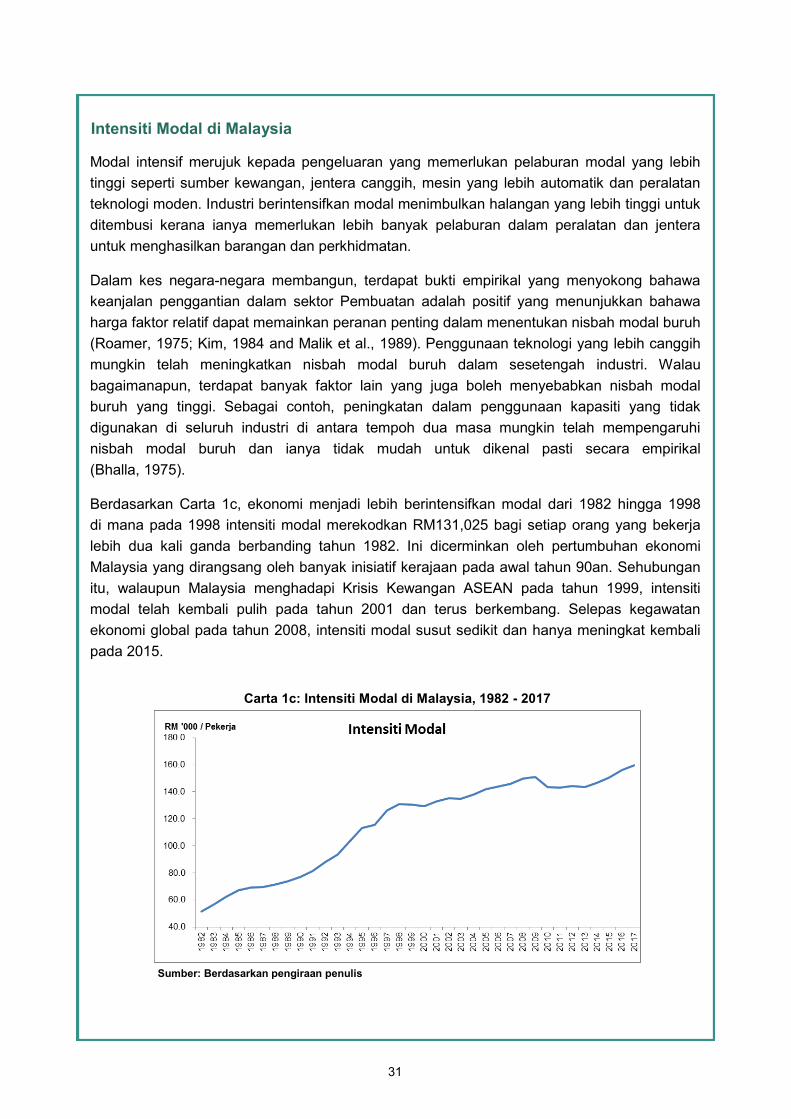
Intensiti Modal di Malaysia
Modal intensif merujuk kepada pengeluaran yang memerlukan pelaburan modal yang lebih
tinggi seperti sumber kewangan, jentera canggih, mesin yang lebih automatik dan peralatan
teknologi moden. Industri berintensifkan modal menimbulkan halangan yang lebih tinggi untuk
ditembusi kerana ianya memerlukan lebih banyak pelaburan dalam peralatan dan jentera
untuk menghasilkan barangan dan perkhidmatan.
Dalam kes negara-negara membangun, terdapat bukti empirikal yang menyokong bahawa
keanjalan penggantian dalam sektor Pembuatan adalah positif yang menunjukkan bahawa
harga faktor relatif dapat memainkan peranan penting dalam menentukan nisbah modal buruh
(Roamer, 1975; Kim, 1984 and Malik et al., 1989). Penggunaan teknologi yang lebih canggih
mungkin telah meningkatkan nisbah modal buruh dalam sesetengah industri. Walau
bagaimanapun, terdapat banyak faktor lain yang juga boleh menyebabkan nisbah modal
buruh yang tinggi. Sebagai contoh, peningkatan dalam penggunaan kapasiti yang tidak
digunakan di seluruh industri di antara tempoh dua masa mungkin telah mempengaruhi
nisbah modal buruh dan ianya tidak mudah untuk dikenal pasti secara empirikal
(Bhalla, 1975).
Berdasarkan Carta 1c, ekonomi menjadi lebih berintensifkan modal dari 1982 hingga 1998
di mana pada 1998 intensiti modal merekodkan RM131,025 bagi setiap orang yang bekerja
lebih dua kali ganda berbanding tahun 1982. Ini dicerminkan oleh pertumbuhan ekonomi
Malaysia yang dirangsang oleh banyak inisiatif kerajaan pada awal tahun 90an. Sehubungan
itu, walaupun Malaysia menghadapi Krisis Kewangan ASEAN pada tahun 1999, intensiti
modal telah kembali pulih pada tahun 2001 dan terus berkembang. Selepas kegawatan
ekonomi global pada tahun 2008, intensiti modal susut sedikit dan hanya meningkat kembali
pada 2015.
Carta 1c: Intensiti Modal di Malaysia, 1982 - 2017
Sumber: Berdasarkan pengiraan penulis
32
Intensiti Modal mengikut Sektor Ekonomi, 1982-2017
Ekonomi menjadi lebih berintensifkan modal merentas kebanyakan sektor ekonomi, seperti
yang digambarkan oleh peningkatan stok modal bersih kepada bilangan pekerja yang bekerja.
Manjappa & Mahesha (2008) mengklasifikasikan aktiviti ekonomi berintensifkan modal dan
tenaga kerja berdasarkan nisbah modal buruh. Jika nisbah modal buruh lebih tinggi dari paras
min, industri akan diklasifikasikan sebagai industri yang berintensifkan modal dan jika
nisbahnya lebih rendah daripada nisbah modal buruh keseluruhan ekonomi, industri akan
dikelaskan sebagai industri berintensifkan buruh.
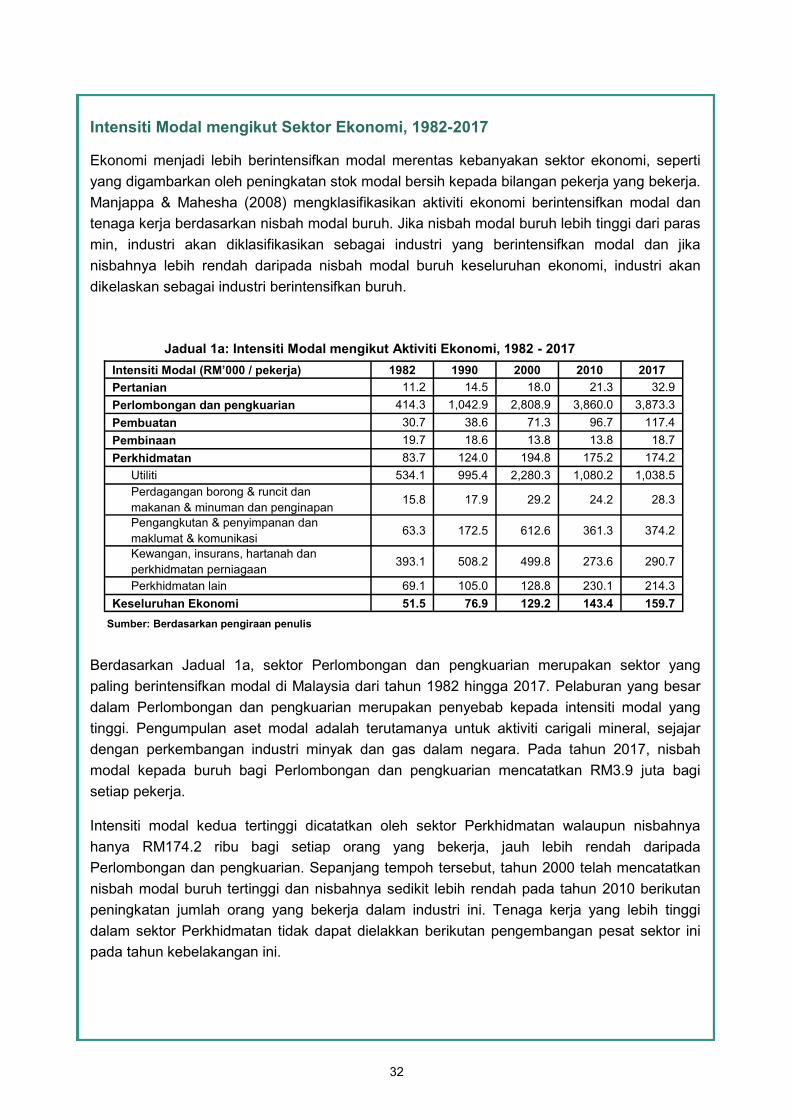
Berdasarkan Jadual 1a, sektor Perlombongan dan pengkuarian merupakan sektor yang
paling berintensifkan modal di Malaysia dari tahun 1982 hingga 2017. Pelaburan yang besar
dalam Perlombongan dan pengkuarian merupakan penyebab kepada intensiti modal yang
tinggi. Pengumpulan aset modal adalah terutamanya untuk aktiviti carigali mineral, sejajar
dengan perkembangan industri minyak dan gas dalam negara. Pada tahun 2017, nisbah
modal kepada buruh bagi Perlombongan dan pengkuarian mencatatkan RM3.9 juta bagi
setiap pekerja.
Intensiti modal kedua tertinggi dicatatkan oleh sektor Perkhidmatan walaupun nisbahnya
hanya RM174.2 ribu bagi setiap orang yang bekerja, jauh lebih rendah daripada
Perlombongan dan pengkuarian. Sepanjang tempoh tersebut, tahun 2000 telah mencatatkan
nisbah modal buruh tertinggi dan nisbahnya sedikit lebih rendah pada tahun 2010 berikutan
peningkatan jumlah orang yang bekerja dalam industri ini. Tenaga kerja yang lebih tinggi
dalam sektor Perkhidmatan tidak dapat dielakkan berikutan pengembangan pesat sektor ini
pada tahun kebelakangan ini.
Jadual 1a: Intensiti Modal mengikut Aktiviti Ekonomi, 1982 - 2017
Sumber: Berdasarkan pengiraan penulis
Intensiti Modal (RM’000 / pekerja) 1982 1990 2000 2010 2017
Pertanian 11.2 14.5 18.0 21.3 32.9
Perlombongan dan pengkuarian 414.3 1,042.9 2,808.9 3,860.0 3,873.3
Pembuatan 30.7 38.6 71.3 96.7 117.4
Pembinaan 19.7 18.6 13.8 13.8 18.7
Perkhidmatan 83.7 124.0 194.8 175.2 174.2
Utiliti 534.1 995.4 2,280.3 1,080.2 1,038.5
Perdagangan borong & runcit dan
makanan & minuman dan penginapan 15.8 17.9 29.2 24.2 28.3
Pengangkutan & penyimpanan dan
maklumat & komunikasi 63.3 172.5 612.6 361.3 374.2
Kewangan, insurans, hartanah dan
perkhidmatan perniagaan 393.1 508.2 499.8 273.6 290.7
Perkhidmatan lain 69.1 105.0 128.8 230.1 214.3
Keseluruhan Ekonomi 51.5 76.9 129.2 143.4 159.7
33
Utiliti menunjukkan nisbah modal buruh yang tertinggi dalam sektor Perkhidmatan. Nisbah
modal buruh pada tahun 2000 adalah lebih dua kali ganda berbanding pada tahun 1990
disebabkan oleh pengenalan Independent Power Producer (IPP) pada tahun 1993.
Pelaksanaan IPP di Malaysia telah mendorong pelaburan modal yang tinggi oleh syarikat
swasta. Sementara itu, Kewangan, insurans, hartanah dan perkhidmatan perniagaan
merekodkan nisbah modal buruh yang kedua tertinggi bagi tempoh 1982 hingga 1990 tetapi
Pengangkutan & penyimpanan dan maklumat & komunikasi telah melepasi aktiviti tersebut
pada tahun 2000. Pada tahun 2000, nisbah modal buruh untuk aktiviti Pengangkutan &
penyimpanan dan maklumat & komunikasi telah mencecah RM612.6 ribu bagi setiap orang
yang bekerja. Pelaburan dalam projek pengangkutan dan pendedahan teknologi maklumat
pada awal 2000 telah mendorong kepada modal yang lebih tinggi dalam aktiviti ini.
Perdagangan borong & runcit dan makanan & minuman dan penginapan merupakan
sub-sektor dalam sektor Perkhidmatan yang boleh diklasifikasikan sebagai industri
berintensifkan buruh kerana bilangan pekerja yang tinggi terutamanya dalam aktiviti
peruncitan dan makanan & minuman.
Sektor Pertanian dan Pembinaan diklasifikasikan sebagai industri berintensifkan buruh
disebabkan oleh nisbah modal buruh yang rendah daripada nisbah modal buruh bagi
keseluruhan ekonomi walaupun kedua-dua sektor ini menunjukkan peningkatan nisbah modal
buruh dari tahun ke tahun. Perkara ini dapat difahami memandangkan sektor Pertanian tidak
memerlukan pelaburan kewangan yang besar atau mesin yang berteknologi maju dalam
pengeluaran manakala sektor Pembinaan di negara ini sangat bergantung kepada pekerja
(Marhani et al., 2012).
Nisbah modal buruh bagi sektor Pembuatan semakin meningkat daripada tahun 1982 hingga
2017 walaupun ianya masih rendah daripada nisbah modal buruh bagi keseluruhan ekonomi.
Nisbah modal buruh yang rendah adalah disebabkan oleh bilangan pekerja yang tinggi dalam
industri ini. Walau bagaimanapun, terdapat bukti yang sebahagian industri dalam sektor
Pembuatan mempunyai intensiti modal yang tinggi (Kalim, 2001). Black et al. (2017) telah
membahagikan sektor Pembuatan kepada empat kategori iaitu, berintensifkan modal,
berintensifkan modal pertengahan, berintensifkan buruh dan berintensifkan ultra buruh untuk
memperjelaskan kepelbagaian dalam sektor Pembuatan. Sehubungan itu, adalah tidak
konklusif sektor Pembuatan Malaysia adalah berintensifkan buruh dan adalah penting untuk
dikaji dengan lebih lanjut bagi kefahaman yang lebih baik berkaitan dengan sektor ini.
34
Kesimpulan
Intensiti modal memainkan peranan penting dalam menentukan pertumbuhan jangka masa
panjang di mana kaedah berintensifkan modal membolehkan peningkatan pengeluaran dan
standard kehidupan yang lebih tinggi. Stok Modal Bersih pada harga malar 2010 dan
bilangan pekerja yang bekerja digunakan dalam analisis ini yang hanya fokus kepada intensiti
modal dalam pelbagai sektor ekonomi di Malaysia daripada tahun 1982 hingga 2017.
Pasaran industri berintensifkan modal adalah sukar ditembusi berikutan industri ini
memerlukan pelaburan yang besar dalam peralatan dan mesin dalam pengeluaran barangan
dan perkhidmatan. Ekonomi telah menjadi lebih berintensifkan modal bermula tahun 1982
hingga 1998. Ini dicerminkan oleh ekonomi Malaysia yang dipertingkatkan dengan banyak
inisiatif kerajaan pada awal tahun 90an. Dalam analisis ini, industri yang paling
berintensifkan modal adalah sektor Perlombongan dan pengkuarian daripada tahun 1982
hingga 2017 di mana pengumpulan aset modal adalah untuk aktiviti carigali mineral. Sektor
Perkhidmatan telah merekodkan intensiti modal yang kedua tertinggi. Sektor Pertanian dan
Pembinaan diklasifikasikan sebagai berintensifkan buruh disebabkan oleh nisbah modal
buruh yang rendah daripada nisbah modal buruh bagi keseluruhan ekonomi. Nisbah modal
buruh bagi sektor Pembuatan adalah semakin meningkat daripada tahun 1982 hingga 2017
walaupun ianya masih rendah daripada nisbah modal buruh bagi keseluruhan ekonomi.
Memandangkan ekonomi mengalami transformasi ke arah nilai ditambah yang tinggi,
ekonomi berpendapatan yang tinggi, menambahbaik kualiti stok modal dan kecekapan
penggunaannya merupakan faktor kejayaan yang kritikal. Penambahbaikan dalam kecekapan
modal dan produktiviti adalah komponen yang kritikal dalam memastikan pelaburan baru
projek bagi meningkatkan pertumbuhan ekonomi.
35
Bibliografi
Black, A., Craig S., & Dunne, P. (2017). Capital intensity, employment and sustainability in
the South African manufacturing sector. Paper for TIPS Conference, June 2017.
Jabatan Perangkaan Malaysia (2018). Produktiviti Buruh Suku Pertama. Putrajaya.
Kalim, Rukhsana (2001). Capital Intensity in the Large-Scale Manufacturing of Pakistan.
Pakistan Economic and Social Review. Volume XXXIX,
No. 2 (Winter 2001). p.p. 135-151.
Kim, A.W. (1984). CES production function in manufacturing and problems of industrialization
in LDCs: Evidence from Korea.
Malik, S. I, M. Mushtaq and H. Nazli (1989). An analysis of production relations in the
large-scale textiles manufacturing sector of Pakistan. The Pakistan Development
Review, Volume 28, No.1, 27-42.
Manjappa, D. H., & Mahesha, M. (2008). Measurement of productivity growth, efficiency
change and technical progress of selected capital-intensive and labour-intensive
industries during reform period in India. Indian Journal of Economics and Business,
7(1), 167.
Marhani, M. A., Adnan, H., Baharuddin, H. E., Esa, M. R., & Hassan, A. A. (2012).
Dependency of foreign workers in Malaysian construction industry. Built Environment
Journal, 9(1), 39-50.
Roamer, M. (1975). The neoclassical model applied to Ghanian manufacturing. The Journal
of Development Studies, Volume 11, No. 2, 1975-1990.
Statistik Siri Masa Survei Tenaga Buruh, 1982-2017. Retrive from:https://www.dosm.gov.my/
v1/index.php?r=column/ctimeseries&menu_id=NHJlaGc2Rlg4ZXlGTjh1SU1kaWY5UT09
Sulaiman, M., & Govindan, K. (2000, June). Macroeconomic fundamentals of the Malaysian
economy: before and after the crisis. In National Seminar on Strengthening the
Macroeconomic Fundamentals of the Malaysian Economy, organized by UUM and UKM,
June (pp. 5-6).
OECD. (2009). Measuring Capital OECD Manual. Paris: OECD Publishing.
36
Article 2:
Capital Intensity in Malaysia, 1982 - 20171
By: Syahron Helmy Abdullah Halim, Salmah Salleh dan Farihin Rosni
Introduction
The Malaysian economy has shown resilience in recent years in spite of external shocks and
has sustained to perform well. Progress was made toward achieving high income status. In
determining long run economic growth, capital intensity plays an important role where more
capital intensive methods enable increased output and higher living standards.
Capital intensity is generally defined as the ratio of capital to labour used in a production
process or industry at a given time, the higher the ratio the more is the capital intensity and
vice versa (Kalim, 2001). Generally, developing countries are in shortage of capital hence,
minimizing capital intensity as an investment criterion is considered desirable. For measuring
the degree of factor intensity, two indicators namely capital labour ratios and capital value
added ratios are used in a broader sense.
This article discussed on the capital intensity in Malaysia from 1982 to 2017 based on capital
labour ratio. The analysis starts from 1982 as this was the earliest data available for
employment based on Labour Force Survey conducted by Department of Statistics, Malaysia.
The Net Capital Stock (NKS) at constant 2010 prices and the total number of employed
persons in the country are used in the analysis of this article. The objective of this
article is to elucidate capital intensive in various sector of the economy. First, this article will
have an overview of NKS and employment across the period discussed. Then, this article will
dwell on the capital intensity at national level followed by capital intensity of various sectors
from 1982 to 2017.
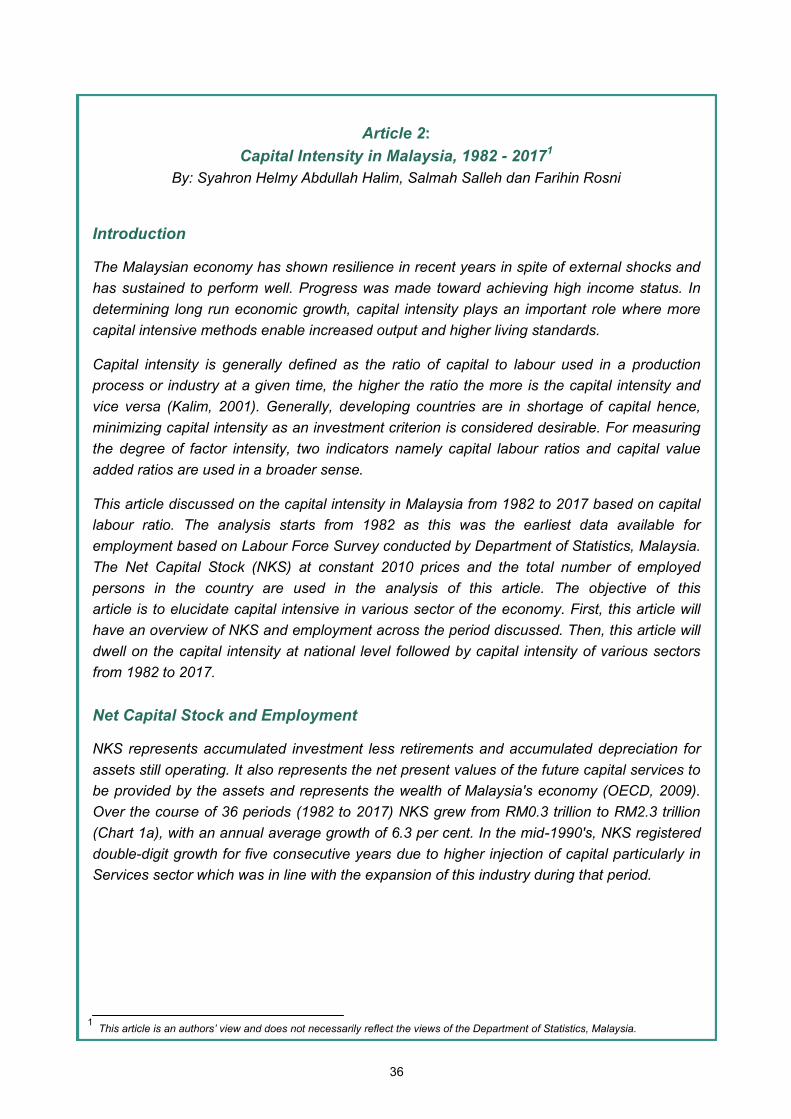
Net Capital Stock and Employment
NKS represents accumulated investment less retirements and accumulated depreciation for
assets still operating. It also represents the net present values of the future capital services to
be provided by the assets and represents the wealth of Malaysia's economy (OECD, 2009).
Over the course of 36 periods (1982 to 2017) NKS grew from RM0.3 trillion to RM2.3 trillion
(Chart 1a), with an annual average growth of 6.3 per cent. In the mid-1990's, NKS registered
double-digit growth for five consecutive years due to higher injection of capital particularly in
Services sector which was in line with the expansion of this industry during that period.
1 This article is an authors’ view and does not necessarily reflect the views of the Department of Statistics, Malaysia.
37
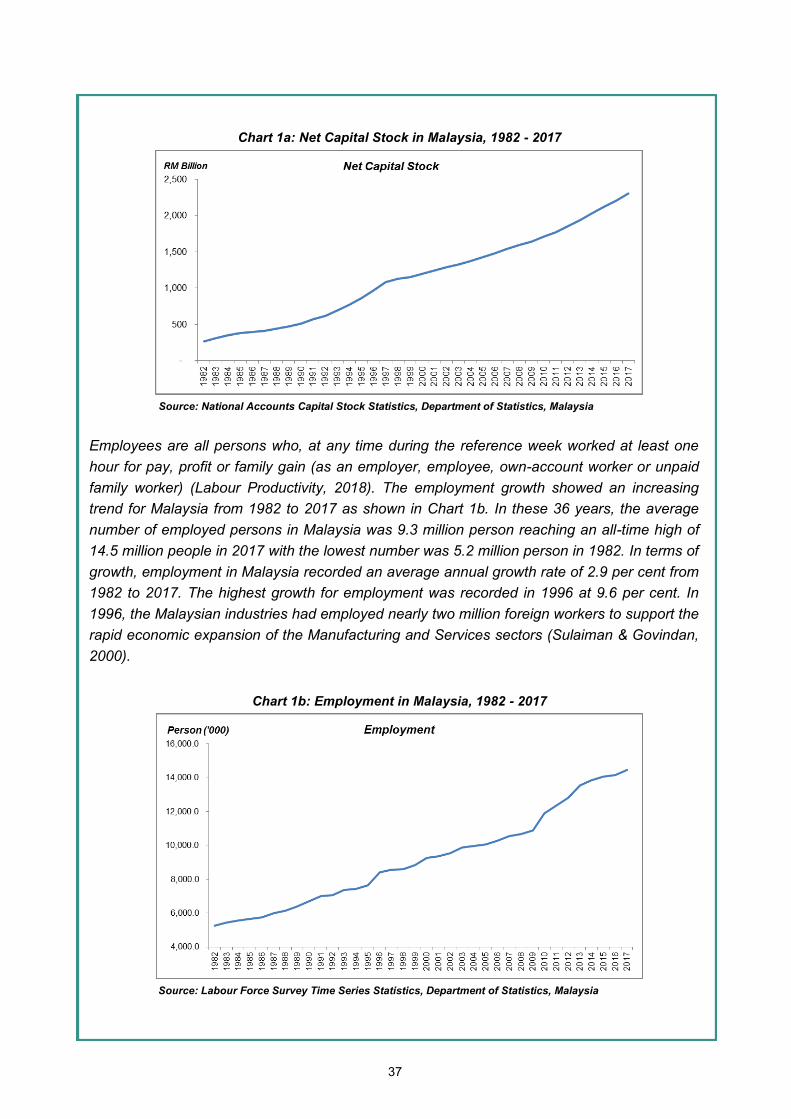
Employees are all persons who, at any time during the reference week worked at least one
hour for pay, profit or family gain (as an employer, employee, own-account worker or unpaid
family worker) (Labour Productivity, 2018). The employment growth showed an increasing
trend for Malaysia from 1982 to 2017 as shown in Chart 1b. In these 36 years, the average
number of employed persons in Malaysia was 9.3 million person reaching an all-time high of
14.5 million people in 2017 with the lowest number was 5.2 million person in 1982. In terms of
growth, employment in Malaysia recorded an average annual growth rate of 2.9 per cent from
1982 to 2017. The highest growth for employment was recorded in 1996 at 9.6 per cent. In
1996, the Malaysian industries had employed nearly two million foreign workers to support the
rapid economic expansion of the Manufacturing and Services sectors (Sulaiman & Govindan,
2000).
Chart 1a: Net Capital Stock in Malaysia, 1982 - 2017
Source: National Accounts Capital Stock Statistics, Department of Statistics, Malaysia
Chart 1b: Employment in Malaysia, 1982 - 2017
Source: Labour Force Survey Time Series Statistics, Department of Statistics, Malaysia
38
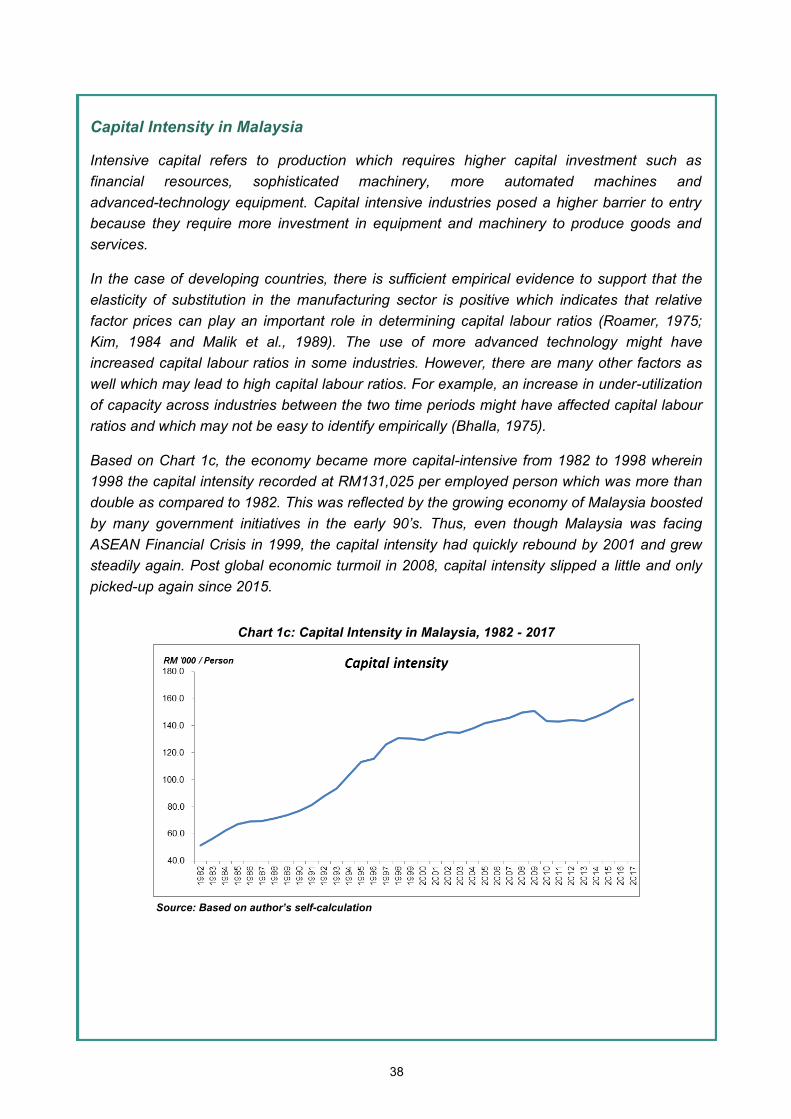
Capital Intensity in Malaysia
Intensive capital refers to production which requires higher capital investment such as
financial resources, sophisticated machinery, more automated machines and
advanced-technology equipment. Capital intensive industries posed a higher barrier to entry
because they require more investment in equipment and machinery to produce goods and
services.
In the case of developing countries, there is sufficient empirical evidence to support that the
elasticity of substitution in the manufacturing sector is positive which indicates that relative
factor prices can play an important role in determining capital labour ratios (Roamer, 1975;
Kim, 1984 and Malik et al., 1989). The use of more advanced technology might have
increased capital labour ratios in some industries. However, there are many other factors as
well which may lead to high capital labour ratios. For example, an increase in under-utilization
of capacity across industries between the two time periods might have affected capital labour
ratios and which may not be easy to identify empirically (Bhalla, 1975).
Based on Chart 1c, the economy became more capital-intensive from 1982 to 1998 wherein
1998 the capital intensity recorded at RM131,025 per employed person which was more than
double as compared to 1982. This was reflected by the growing economy of Malaysia boosted
by many government initiatives in the early 90’s. Thus, even though Malaysia was facing
ASEAN Financial Crisis in 1999, the capital intensity had quickly rebound by 2001 and grew
steadily again. Post global economic turmoil in 2008, capital intensity slipped a little and only
picked-up again since 2015.
Chart 1c: Capital Intensity in Malaysia, 1982 - 2017
Source: Based on author’s self-calculation
39
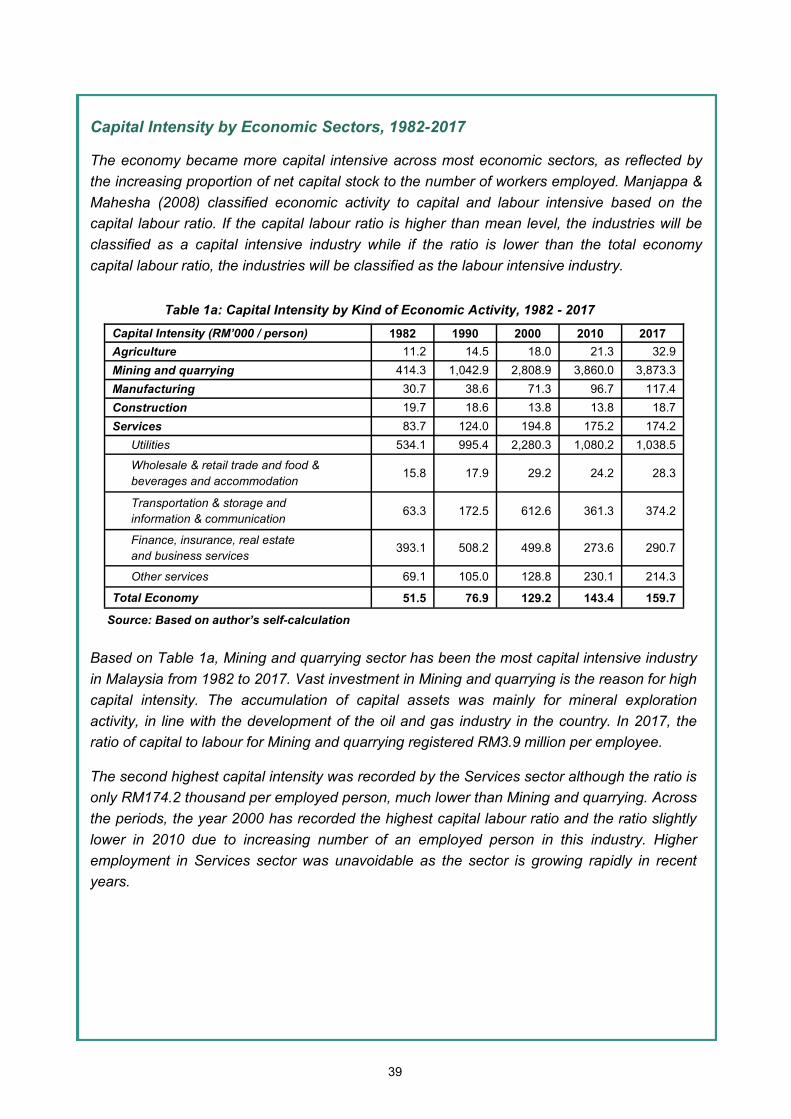
Capital Intensity by Economic Sectors, 1982-2017
The economy became more capital intensive across most economic sectors, as reflected by
the increasing proportion of net capital stock to the number of workers employed. Manjappa &
Mahesha (2008) classified economic activity to capital and labour intensive based on the
capital labour ratio. If the capital labour ratio is higher than mean level, the industries will be
classified as a capital intensive industry while if the ratio is lower than the total economy
capital labour ratio, the industries will be classified as the labour intensive industry.
Based on Table 1a, Mining and quarrying sector has been the most capital intensive industry
in Malaysia from 1982 to 2017. Vast investment in Mining and quarrying is the reason for high
capital intensity. The accumulation of capital assets was mainly for mineral exploration
activity, in line with the development of the oil and gas industry in the country. In 2017, the
ratio of capital to labour for Mining and quarrying registered RM3.9 million per employee.
The second highest capital intensity was recorded by the Services sector although the ratio is
only RM174.2 thousand per employed person, much lower than Mining and quarrying. Across
the periods, the year 2000 has recorded the highest capital labour ratio and the ratio slightly
lower in 2010 due to increasing number of an employed person in this industry. Higher
employment in Services sector was unavoidable as the sector is growing rapidly in recent
years.
Table 1a: Capital Intensity by Kind of Economic Activity, 1982 - 2017
Source: Based on author’s self-calculation
Capital Intensity (RM’000 / person) 1982 1990 2000 2010 2017
Agriculture 11.2 14.5 18.0 21.3 32.9
Mining and quarrying 414.3 1,042.9 2,808.9 3,860.0 3,873.3
Manufacturing 30.7 38.6 71.3 96.7 117.4
Construction 19.7 18.6 13.8 13.8 18.7
Services 83.7 124.0 194.8 175.2 174.2
Utilities 534.1 995.4 2,280.3 1,080.2 1,038.5
Wholesale & retail trade and food &
beverages and accommodation 15.8 17.9 29.2 24.2 28.3
Transportation & storage and
information & communication 63.3 172.5 612.6 361.3 374.2
Finance, insurance, real estate
and business services 393.1 508.2 499.8 273.6 290.7
Other services 69.1 105.0 128.8 230.1 214.3
Total Economy 51.5 76.9 129.2 143.4 159.7
40
Utilities showed the highest capital labour ratios in the Services sector. The capital labour ratio
in 2000 was more than double as compared to 1990 due to the introduction of Independent
Power Producer (IPP) in 1993. The implementation of IPP in Malaysia has induced high
capital investment by private companies. Meanwhile, Finance, insurance, real estate and
business services recorded the second highest capital labour ratio for the period 1982 to 1990
but Transportation & storage and information & communication has surpassed the former
activities in 2000. In 2000, the capital labour ratio for Transportation & storage and information
& communication has reached RM612.6 thousand per employed person. The investment in
transportation projects and the exposure of technology of communication in early 2000 has led
to the higher capital in these activities. Wholesale & retail trade and food & beverages and
accommodation were the only sub-sector in Services sector which can be classified as the
labour intensive industry due to the high number of employment particularly in retail and food
& beverages activities.
Agriculture and Construction sectors was classified as labour intensive industries due to lower
capital labour ratio than the total economy capital labour ratio although both sectors showed
an increasing capital labour ratio across the years. This was understandable as the Agriculture
sector did not require large financial investment or advanced technology machines in the
production while Construction sector in this country was highly dependent on labour
(Marhani et al., 2012).
Capital labour ratio for the Manufacturing sector was steadily increasing from 1982 to 2017
despite it is still lower than the total economy capital labour ratio. The lower capital labour ratio
was due to the high number of an employed person in this industry. However, there is
evidence that some of the industries in the Manufacturing sector have high capital intensity
(Kalim, 2001). Black et al (2017) have divided the Manufacturing sector into four categories
namely capital intensive, intermediate capital intensive, labour intensive and ultra-labour
intensive to explain the diversities in the Manufacturing sector. Thus, it was not conclusive in
Malaysia case that the Manufacturing sector was the labour intensive sector and it was
necessary to examine further for better understanding regarding this sector.
41
Conclusion
Capital intensity plays a vital role in determining long-run economic growth where more
capital intensive methods allow increased output and higher living standards. Net Capital
Stock at constant 2010 prices and the total number of employed are used in the analysis
which focussed on the capital intensity in various sector of the economy in Malaysia from
1982 to 2017. A higher barrier to entry is posed by the capital intensive industries as they
require more investment in equipment and machinery to produce goods and services. The
economy turned out to be more capital intensive from 1982 to 1998. This was reflected by the
emergent economy of Malaysia enhanced by many government initiatives in the early 90’s. In
the analysis, the most capital intensive industry in Malaysia from 1982 to 2017 is
Mining and quarrying sector where the accumulation of capital assets was mainly for mineral
exploration activity. Services sector recorded the second highest capital intensity. Agriculture
and Construction sectors was classified as labour intensive industries due to lower capital
labour ratio than the total economy capital labour ratio. Capital labour ratio for the
Manufacturing sector was steadily increasing from 1982 to 2017 even though it is still lower
than the total economy capital labour ratio. As the economy undergoes a transformation
towards a high value-added, high income economy, improving the quality of the capital stock
and the efficiency of its utilisation would be critical success factors. Improvement in capital
efficiency and productivity is a critical component to ensure the new investment projects in
enhancing economic growth.
42
Bibliography
Black, A., Craig S., & Dunne, P. (2017). Capital intensity, employment and sustainability in
the South African manufacturing sector. Paper for TIPS Conference, June 2017.
Jabatan Perangkaan Malaysia (2018). Produktiviti Buruh Suku Pertama. Putrajaya.
Kalim, Rukhsana (2001). Capital Intensity in the Large-Scale Manufacturing of Pakistan.
Pakistan Economic and Social Review. Volume XXXIX,
No. 2 (Winter 2001). p.p. 135-151.
Kim, A.W. (1984). CES production function in manufacturing and problems of industrialization
in LDCs: Evidence from Korea.
Malik, S. I, M. Mushtaq and H. Nazli (1989). An analysis of production relations in the
large-scale textiles manufacturing sector of Pakistan. The Pakistan Development
Review, Volume 28, No.1, 27-42.
Manjappa, D. H., & Mahesha, M. (2008). Measurement of productivity growth, efficiency
change and technical progress of selected capital-intensive and labour-intensive
industries during reform period in India. Indian Journal of Economics and Business,
7(1), 167.
Marhani, M. A., Adnan, H., Baharuddin, H. E., Esa, M. R., & Hassan, A. A. (2012).
Dependency of foreign workers in Malaysian construction industry. Built Environment
Journal, 9(1), 39-50.
Roamer, M. (1975). The neoclassical model applied to Ghanian manufacturing. The Journal
of Development Studies, Volume 11, No. 2, 1975-1990.
Statistik Siri Masa Survei Tenaga Buruh, 1982-2017. Retrive from:https://www.dosm.gov.my/
v1/index.php?r=column/ctimeseries&menu_id=NHJlaGc2Rlg4ZXlGTjh1SU1kaWY5UT09
Sulaiman, M., & Govindan, K. (2000, June). Macroeconomic fundamentals of the Malaysian
economy: before and after the crisis. In National Seminar on Strengthening the
Macroeconomic Fundamentals of the Malaysian Economy, organized by UUM and UKM,
June (pp. 5-6).
OECD. (2009). Measuring Capital OECD Manual. Paris: OECD Publishing.


Jadual SMK mengikut jenis aktiviti ekonomi pada harga semasa
Table GKS by kind of economic activity at current prices
Jenis aktiviti ekonomi
Kind of economic activity Nilai akhir tahun (RM juta) Perubahan peratusan tahunan
End year value (RM million) Annual percentage change
1. Pertanian 107,382 109,702 120,841 7.6 2.2 10.2
Agriculture
2. Perlombongan dan pengkuarian 637,549 680,766 716,203 10.8 6.8 5.2
Mining and quarrying
3. Pembuatan 539,836 577,804 620,722 6.2 7.0 7.4
Manufacturing
3.1 Makanan, minuman dan tembakau 56,496 60,838 64,837 9.8 7.7 6.6
Food, beverages and tobacco
3.2 Produk tekstil dan kayu 54,535 55,368 55,913 1.7 1.5 1.0
Textiles and wood products
3.3 Produk petroleum, kimia, getah dan plastik 145,685 165,306 186,482 10.7 13.5 12.8
Petroleum, chemicals, rubber and plastic products
3.4 Produk mineral bukan logam, logam asas dan produk logam yang direka 59,038 62,046 65,682 5.4 5.1 5.9
Non-metallic mineral products, basic metal and fabricated metal products
3.5 Produk elektrik, elektronik dan optikal 184,418 193,662 206,225 4.5 5.0 6.5
Electrical, electronic and optical products
3.6 Peralatan pengangkutan, pembuatan lain dan pembaikan 39,664 40,584 41,584 2.3 2.3 2.5
Transport equipment, other manufacturing and repair
4. Pembinaan 44,216 47,891 51,614 8.5 8.3 7.8
Construction
5. Perkhidmatan 2,912,554 3,105,783 3,317,416 6.8 6.6 6.8
Services
5.1 Utiliti 339,760 352,498 369,851 5.5 3.7 4.9
Utilities
5.2 Perdagangan borong dan runcit 152,293 166,721 181,994 8.5 9.5 9.2
Wholesale and retail trade
5.3 Makanan & minuman dan penginapan 41,029 44,453 48,193 8.1 8.3 8.4
Food & beverage and accommodation
5.4 Pengangkutan & penyimpanan dan maklumat & komunikasi 626,670 664,528 711,825 6.8 6.0 7.1
Transportation & storage and information & communication
5.5 Kewangan, insurans, hartanah dan perkhidmatan perniagaan 769,328 845,107 924,252 9.1 9.9 9.4
Finance, insurance, real estate and business services
5.6 Perkhidmatan lain 983,474 1,032,476 1,081,300 5.2 5.0 4.7
Other services
Jumlah SMK
Total GKS
Jenis aktiviti ekonomi
Kind of economic activity Peratus sumbangan SMK
Percentage share of GKS
1. Pertanian 2.5 2.4 2.5
Agriculture
2. Perlombongan dan pengkuarian 15.0 15.1 14.8
Mining and quarrying
3. Pembuatan 12.7 12.8 12.9
Manufacturing
3.1 Makanan, minuman dan tembakau 1.3 1.3 1.3
Food, beverages and tobacco
3.2 Produk tekstil dan kayu 1.3 1.2 1.2
Textiles and wood products
3.3 Produk petroleum, kimia, getah dan plastik 3.4 3.7 3.9
Petroleum, chemicals, rubber and plastic products
3.4 Produk mineral bukan logam, logam asas dan produk logam yang direka 1.4 1.4 1.4
Non-metallic mineral products, basic metal and fabricated metal products
3.5 Produk elektrik, elektronik dan optikal 4.3 4.3 4.3
Electrical, electronic and optical products
3.6 Peralatan pengangkutan, pembuatan lain dan pembaikan 0.9 0.9 0.9
Transport equipment, other manufacturing and repair
4. Pembinaan 1.0 1.1 1.1
Construction
5. Perkhidmatan 68.7 68.7 68.7
Services
5.1 Utiliti 8.0 7.8 7.7
Utilities
5.2 Perdagangan borong dan runcit 3.6 3.7 3.8
Wholesale and retail trade
5.3 Makanan & minuman dan penginapan 1.0 1.0 1.0
Food & beverage and accommodation
5.4 Pengangkutan & penyimpanan dan maklumat & komunikasi 14.8 14.7 14.7
Transportation & storage and information & communication
5.5 Kewangan, insurans, hartanah dan perkhidmatan perniagaan 18.1 18.7 19.1
Finance, insurance, real estate and business services
5.6 Perkhidmatan lain 23.2 22.8 22.4
Other services
Jumlah SMK
Total GKS
2017p
2016e
7.3
2015
6.76.6
2017p
4,826,795
2017p
100.0
4,241,536 4,521,945
2015 2016e
1.1
100.0 100.0
2015 2016e
43

Jadual SMK mengikut jenis aktiviti ekonomi pada harga malar 2010
Table GKS by kind of economic activity at constant 2010 prices
Jenis aktiviti ekonomi
Kind of economic activity Nilai akhir tahun (RM juta) Perubahan peratusan tahunan
End year value (RM million) Annual percentage change
1. Pertanian 89,009 94,311 99,308 5.6 6.0 5.3
Agriculture
2. Perlombongan dan pengkuarian 454,127 483,329 507,718 8.6 6.4 5.0
Mining and quarrying
3. Pembuatan 475,094 497,804 525,800 4.4 4.8 5.6
Manufacturing
3.1 Makanan, minuman dan tembakau 50,100 53,023 55,695 8.3 5.8 5.0
Food, beverages and tobacco
3.2 Produk tekstil dan kayu 46,356 45,942 45,451 -0.6 -0.9 -1.1
Textiles and wood products
3.3 Produk petroleum, kimia, getah dan plastik 128,920 143,088 158,611 8.5 11.0 10.8
Petroleum, chemicals, rubber and plastic products
3.4 Produk mineral bukan logam, logam asas dan produk logam yang direka 51,915 53,464 55,740 3.6 3.0 4.3
Non-metallic mineral products, basic metal and fabricated metal products
3.5 Produk elektrik, elektronik dan optikal 163,026 167,491 175,320 2.8 2.7 4.7
Electrical, electronic and optical products
3.6 Peralatan pengangkutan, pembuatan lain dan pembaikan 34,776 34,795 34,983 0.6 0.1 0.5
Transport equipment, other manufacturing and repair
4. Pembinaan 38,698 41,108 43,542 7.1 6.2 5.9
Construction
5. Perkhidmatan 2,341,952 2,439,143 2,545,022 4.2 4.1 4.3
Services
5.1 Utiliti 274,093 279,933 287,308 2.8 2.1 2.6
Utilities
5.2 Perdagangan borong dan runcit 122,325 130,501 138,720 7.3 6.7 6.3
Wholesale and retail trade
5.3 Makanan & minuman dan penginapan 34,009 36,243 38,719 6.0 6.6 6.8
Food & beverage and accommodation
5.4 Pengangkutan & penyimpanan dan maklumat & komunikasi 518,133 539,044 562,989 4.4 4.0 4.4
Transportation & storage and information & communication
5.5 Kewangan, insurans, hartanah dan perkhidmatan perniagaan 606,516 648,852 694,265 6.4 7.0 7.0
Finance, insurance, real estate and business services
5.6 Perkhidmatan lain 786,876 804,570 823,021 2.4 2.2 2.3
Other services
Jumlah SMK
Total GKS
Jenis aktiviti ekonomi
Kind of economic activity Peratus sumbangan SMK
Percentage share of GKS
1. Pertanian 2.6 2.7 2.7
Agriculture
2. Perlombongan dan pengkuarian 13.4 13.6 13.6
Mining and quarrying
3. Pembuatan 14.0 14.0 14.1
Manufacturing
3.1 Makanan, minuman dan tembakau 1.5 1.5 1.5
Food, beverages and tobacco
3.2 Produk tekstil dan kayu 1.4 1.3 1.2
Textiles and wood products
3.3 Produk petroleum, kimia, getah dan plastik 3.8 4.0 4.3
Petroleum, chemicals, rubber and plastic products
3.4 Produk mineral bukan logam, logam asas dan produk logam yang direka 1.5 1.5 1.5
Non-metallic mineral products, basic metal and fabricated metal products
3.5 Produk elektrik, elektronik dan optikal 4.8 4.7 4.7
Electrical, electronic and optical products
3.6 Peralatan pengangkutan, pembuatan lain dan pembaikan 1.0 1.0 0.9
Transport equipment, other manufacturing and repair
4. Pembinaan 1.1 1.2 1.2
Construction
5. Perkhidmatan 68.9 68.6 68.4
Services
5.1 Utiliti 8.1 7.9 7.7
Utilities
5.2 Perdagangan borong dan runcit 3.6 3.7 3.7
Wholesale and retail trade
5.3 Makanan & minuman dan penginapan 1.0 1.0 1.0
Food & beverage and accommodation
5.4 Pengangkutan & penyimpanan dan maklumat & komunikasi 15.2 15.2 15.1
Transportation & storage and information & communication
5.5 Kewangan, insurans, hartanah dan perkhidmatan perniagaan 17.8 18.2 18.7
Finance, insurance, real estate and business services
5.6 Perkhidmatan lain 23.2 22.6 22.1
Other services
Jumlah SMK
Total GKS
2017p
3,721,390
2017p
100.0
1.2
3,398,880 3,555,695
2015 2016e
100.0 100.0
2016e2015
2015
4.9
2017p
4.7
2016e
4.6
44
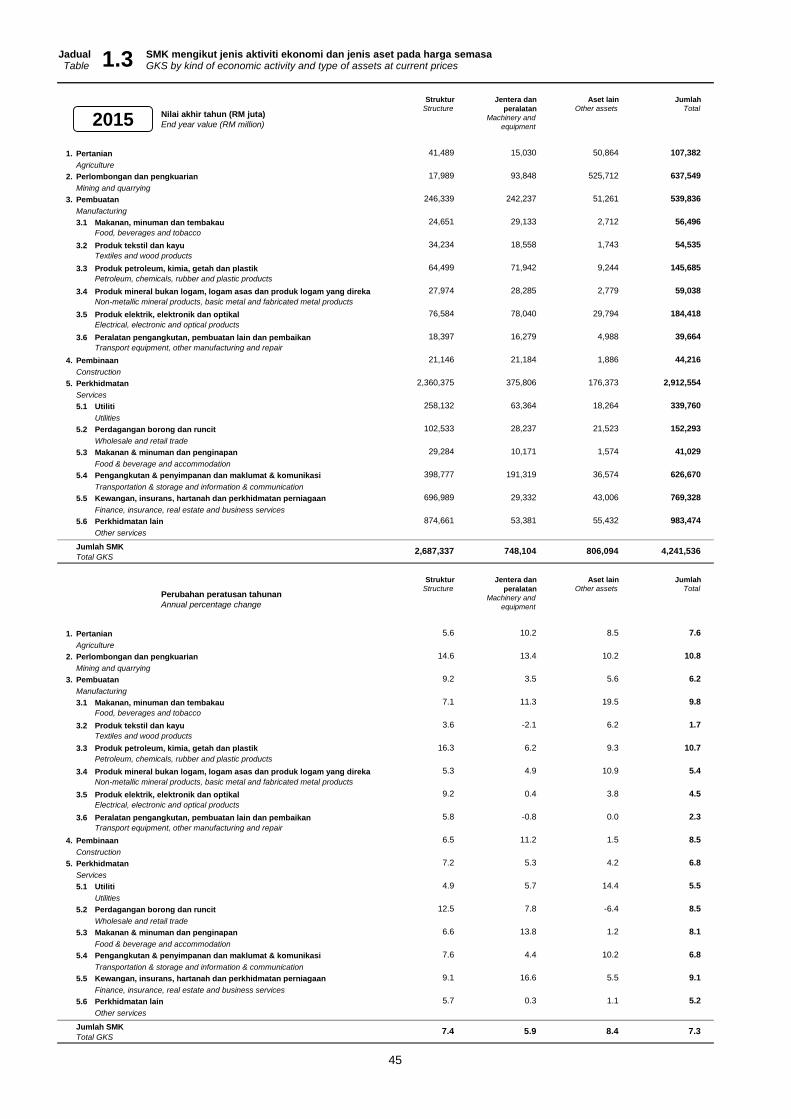
Jadual SMK mengikut jenis aktiviti ekonomi dan jenis aset pada harga semasaTable GKS by kind of economic activity and type of assets at current prices
Struktur
Structure
Jentera dan
peralatan
Machinery and
equipment
Aset lain
Other assets
Jumlah
Total
1. Pertanian 41,489 15,030 50,864 107,382
Agriculture
2. Perlombongan dan pengkuarian 17,989 93,848 525,712 637,549
Mining and quarrying
3. Pembuatan 246,339 242,237 51,261 539,836
Manufacturing
3.1 Makanan, minuman dan tembakau 24,651 29,133 2,712 56,496
Food, beverages and tobacco
3.2 Produk tekstil dan kayu 34,234 18,558 1,743 54,535
Textiles and wood products
3.3 Produk petroleum, kimia, getah dan plastik 64,499 71,942 9,244 145,685
Petroleum, chemicals, rubber and plastic products
3.4 Produk mineral bukan logam, logam asas dan produk logam yang direka 27,974 28,285 2,779 59,038
Non-metallic mineral products, basic metal and fabricated metal products
3.5 Produk elektrik, elektronik dan optikal 76,584 78,040 29,794 184,418
Electrical, electronic and optical products
3.6 Peralatan pengangkutan, pembuatan lain dan pembaikan 18,397 16,279 4,988 39,664
Transport equipment, other manufacturing and repair
4. Pembinaan 21,146 21,184 1,886 44,216
Construction
5. Perkhidmatan 2,360,375 375,806 176,373 2,912,554
Services
5.1 Utiliti 258,132 63,364 18,264 339,760
Utilities
5.2 Perdagangan borong dan runcit 102,533 28,237 21,523 152,293
Wholesale and retail trade
5.3 Makanan & minuman dan penginapan 29,284 10,171 1,574 41,029
Food & beverage and accommodation
5.4 Pengangkutan & penyimpanan dan maklumat & komunikasi 398,777 191,319 36,574 626,670
Transportation & storage and information & communication
5.5 Kewangan, insurans, hartanah dan perkhidmatan perniagaan 696,989 29,332 43,006 769,328
Finance, insurance, real estate and business services
5.6 Perkhidmatan lain 874,661 53,381 55,432 983,474
Other services
Jumlah SMK
Total GKS
Struktur
Structure
Jentera dan
peralatan
Machinery and
equipment
Aset lain
Other assets
Jumlah
Total
1. Pertanian 5.6 10.2 8.5 7.6
Agriculture
2. Perlombongan dan pengkuarian 14.6 13.4 10.2 10.8
Mining and quarrying
3. Pembuatan 9.2 3.5 5.6 6.2
Manufacturing
3.1 Makanan, minuman dan tembakau 7.1 11.3 19.5 9.8
Food, beverages and tobacco
3.2 Produk tekstil dan kayu 3.6 -2.1 6.2 1.7
Textiles and wood products
3.3 Produk petroleum, kimia, getah dan plastik 16.3 6.2 9.3 10.7
Petroleum, chemicals, rubber and plastic products
3.4 Produk mineral bukan logam, logam asas dan produk logam yang direka 5.3 4.9 10.9 5.4
Non-metallic mineral products, basic metal and fabricated metal products
3.5 Produk elektrik, elektronik dan optikal 9.2 0.4 3.8 4.5
Electrical, electronic and optical products
3.6 Peralatan pengangkutan, pembuatan lain dan pembaikan 5.8 -0.8 0.0 2.3
Transport equipment, other manufacturing and repair
4. Pembinaan 6.5 11.2 1.5 8.5
Construction
5. Perkhidmatan 7.2 5.3 4.2 6.8
Services
5.1 Utiliti 4.9 5.7 14.4 5.5
Utilities
5.2 Perdagangan borong dan runcit 12.5 7.8 -6.4 8.5
Wholesale and retail trade
5.3 Makanan & minuman dan penginapan 6.6 13.8 1.2 8.1
Food & beverage and accommodation
5.4 Pengangkutan & penyimpanan dan maklumat & komunikasi 7.6 4.4 10.2 6.8
Transportation & storage and information & communication
5.5 Kewangan, insurans, hartanah dan perkhidmatan perniagaan 9.1 16.6 5.5 9.1
Finance, insurance, real estate and business services
5.6 Perkhidmatan lain 5.7 0.3 1.1 5.2
Other services
Jumlah SMK
Total GKS
Perubahan peratusan tahunan
Annual percentage change
7.4 5.9 8.4 7.3
4,241,536
1.3
Nilai akhir tahun (RM juta)
End year value (RM million)
2,687,337 748,104 806,094
2015
45

Jadual SMK mengikut jenis aktiviti ekonomi dan jenis aset pada harga semasaTable GKS by kind of economic activity and type of assets at current prices 1.3
Struktur
Structure
Jentera dan
peralatan
Machinery and
equipment
Aset lain
Other assets
Jumlah
Total
1. Pertanian 1.5 2.0 6.3 2.5
Agriculture
2. Perlombongan dan pengkuarian 0.7 12.5 65.2 15.0
Mining and quarrying
3. Pembuatan 9.2 32.4 6.4 12.7
Manufacturing
3.1 Makanan, minuman dan tembakau 0.9 3.9 0.3 1.3
Food, beverages and tobacco
3.2 Produk tekstil dan kayu 1.3 2.5 0.2 1.3
Textiles and wood products
3.3 Produk petroleum, kimia, getah dan plastik 2.4 9.6 1.1 3.4
Petroleum, chemicals, rubber and plastic products
3.4 Produk mineral bukan logam, logam asas dan produk logam yang direka 1.0 3.8 0.3 1.4
Non-metallic mineral products, basic metal and fabricated metal products
3.5 Produk elektrik, elektronik dan optikal 2.8 10.4 3.7 4.3
Electrical, electronic and optical products
3.6 Peralatan pengangkutan, pembuatan lain dan pembaikan 0.7 2.2 0.6 0.9
Transport equipment, other manufacturing and repair
4. Pembinaan 0.8 2.8 0.2 1.0
Construction
5. Perkhidmatan 87.8 50.2 21.9 68.7
Services
5.1 Utiliti 9.6 8.5 2.3 8.0
Utilities
5.2 Perdagangan borong dan runcit 3.8 3.8 2.7 3.6
Wholesale and retail trade
5.3 Makanan & minuman dan penginapan 1.1 1.4 0.2 1.0
Food & beverage and accommodation
5.4 Pengangkutan & penyimpanan dan maklumat & komunikasi 14.8 25.6 4.5 14.8
Transportation & storage and information & communication
5.5 Kewangan, insurans, hartanah dan perkhidmatan perniagaan 25.9 3.9 5.3 18.1
Finance, insurance, real estate and business services
5.6 Perkhidmatan lain 32.5 7.1 6.9 23.2
Other services
Jumlah SMK
Total GKS
Struktur
Structure
Jentera dan
peralatan
Machinery and
equipment
Aset lain
Other assets
Jumlah
Total
1. Pertanian 38.6 14.0 47.4 100.0
Agriculture
2. Perlombongan dan pengkuarian 2.8 14.7 82.5 100.0
Mining and quarrying
3. Pembuatan 45.6 44.9 9.5 100.0
Manufacturing
3.1 Makanan, minuman dan tembakau 43.6 51.6 4.8 100.0
Food, beverages and tobacco
3.2 Produk tekstil dan kayu 62.8 34.0 3.2 100.0
Textiles and wood products
3.3 Produk petroleum, kimia, getah dan plastik 44.3 49.4 6.3 100.0
Petroleum, chemicals, rubber and plastic products
3.4 Produk mineral bukan logam, logam asas dan produk logam yang direka 47.4 47.9 4.7 100.0
Non-metallic mineral products, basic metal and fabricated metal products
3.5 Produk elektrik, elektronik dan optikal 41.5 42.3 16.2 100.0
Electrical, electronic and optical products
3.6 Peralatan pengangkutan, pembuatan lain dan pembaikan 46.4 41.0 12.6 100.0
Transport equipment, other manufacturing and repair
4. Pembinaan 47.8 47.9 4.3 100.0
Construction
5. Perkhidmatan 81.0 12.9 6.1 100.0
Services
5.1 Utiliti 76.0 18.6 5.4 100.0
Utilities
5.2 Perdagangan borong dan runcit 67.3 18.5 14.1 100.0
Wholesale and retail trade
5.3 Makanan & minuman dan penginapan 71.4 24.8 3.8 100.0
Food & beverage and accommodation
5.4 Pengangkutan & penyimpanan dan maklumat & komunikasi 63.6 30.5 5.8 100.0
Transportation & storage and information & communication
5.5 Kewangan, insurans, hartanah dan perkhidmatan perniagaan 90.6 3.8 5.6 100.0
Finance, insurance, real estate and business services
5.6 Perkhidmatan lain 88.9 5.4 5.6 100.0
Other services
Jumlah SMK
Total GKS63.4 17.6 19.0 100.0
100.0 100.0 100.0 100.0
Peratus sumbangan mengikut jenis aset
Percentage share by type of assets
Peratus sumbangan mengikut jenis aktiviti ekonomi
Percentage share by kind of economic activity2015
46
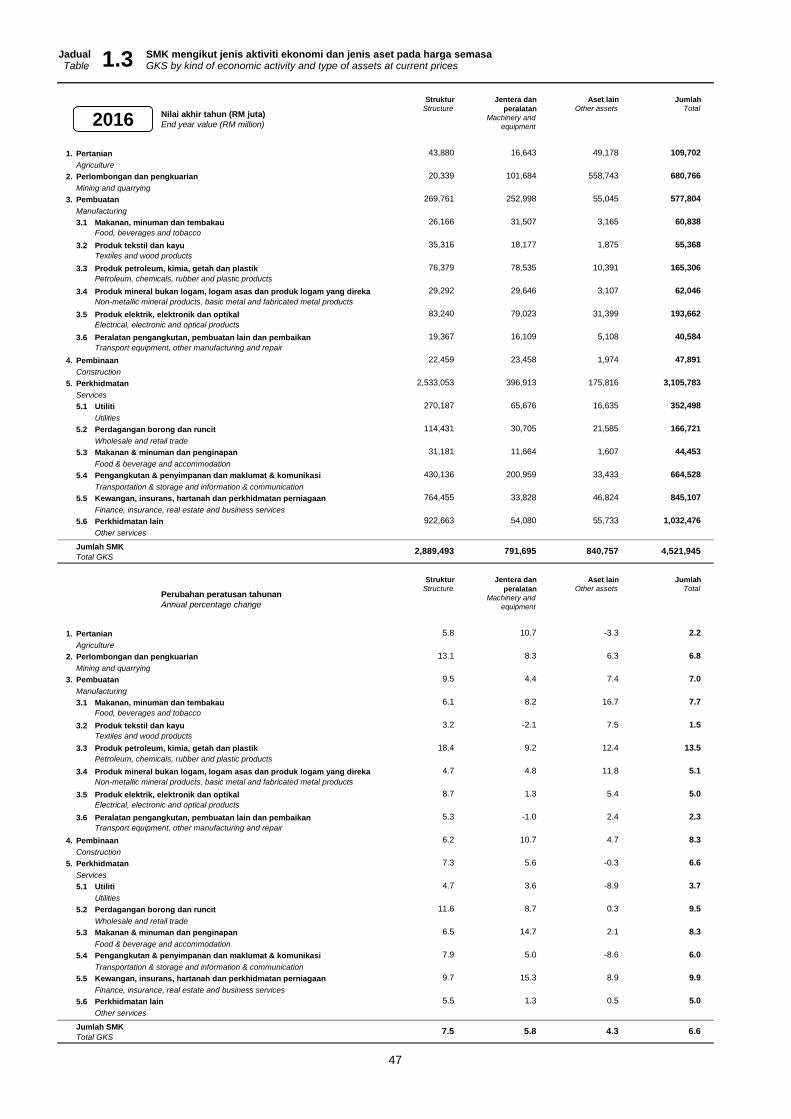
Jadual SMK mengikut jenis aktiviti ekonomi dan jenis aset pada harga semasaTable GKS by kind of economic activity and type of assets at current prices
Struktur
Structure
Jentera dan
peralatan
Machinery and
equipment
Aset lain
Other assets
Jumlah
Total
1. Pertanian 43,880 16,643 49,178 109,702
Agriculture
2. Perlombongan dan pengkuarian 20,339 101,684 558,743 680,766
Mining and quarrying
3. Pembuatan 269,761 252,998 55,045 577,804
Manufacturing
3.1 Makanan, minuman dan tembakau 26,166 31,507 3,165 60,838
Food, beverages and tobacco
3.2 Produk tekstil dan kayu 35,316 18,177 1,875 55,368
Textiles and wood products
3.3 Produk petroleum, kimia, getah dan plastik 76,379 78,535 10,391 165,306
Petroleum, chemicals, rubber and plastic products
3.4 Produk mineral bukan logam, logam asas dan produk logam yang direka 29,292 29,646 3,107 62,046
Non-metallic mineral products, basic metal and fabricated metal products
3.5 Produk elektrik, elektronik dan optikal 83,240 79,023 31,399 193,662
Electrical, electronic and optical products
3.6 Peralatan pengangkutan, pembuatan lain dan pembaikan 19,367 16,109 5,108 40,584
Transport equipment, other manufacturing and repair
4. Pembinaan 22,459 23,458 1,974 47,891
Construction
5. Perkhidmatan 2,533,053 396,913 175,816 3,105,783
Services
5.1 Utiliti 270,187 65,676 16,635 352,498
Utilities
5.2 Perdagangan borong dan runcit 114,431 30,705 21,585 166,721
Wholesale and retail trade
5.3 Makanan & minuman dan penginapan 31,181 11,664 1,607 44,453
Food & beverage and accommodation
5.4 Pengangkutan & penyimpanan dan maklumat & komunikasi 430,136 200,959 33,433 664,528
Transportation & storage and information & communication
5.5 Kewangan, insurans, hartanah dan perkhidmatan perniagaan 764,455 33,828 46,824 845,107
Finance, insurance, real estate and business services
5.6 Perkhidmatan lain 922,663 54,080 55,733 1,032,476
Other services
Jumlah SMK
Total GKS
Struktur
Structure
Jentera dan
peralatan
Machinery and
equipment
Aset lain
Other assets
Jumlah
Total
1. Pertanian 5.8 10.7 -3.3 2.2
Agriculture
2. Perlombongan dan pengkuarian 13.1 8.3 6.3 6.8
Mining and quarrying
3. Pembuatan 9.5 4.4 7.4 7.0
Manufacturing
3.1 Makanan, minuman dan tembakau 6.1 8.2 16.7 7.7
Food, beverages and tobacco
3.2 Produk tekstil dan kayu 3.2 -2.1 7.5 1.5
Textiles and wood products
3.3 Produk petroleum, kimia, getah dan plastik 18.4 9.2 12.4 13.5
Petroleum, chemicals, rubber and plastic products
3.4 Produk mineral bukan logam, logam asas dan produk logam yang direka 4.7 4.8 11.8 5.1
Non-metallic mineral products, basic metal and fabricated metal products
3.5 Produk elektrik, elektronik dan optikal 8.7 1.3 5.4 5.0
Electrical, electronic and optical products
3.6 Peralatan pengangkutan, pembuatan lain dan pembaikan 5.3 -1.0 2.4 2.3
Transport equipment, other manufacturing and repair
4. Pembinaan 6.2 10.7 4.7 8.3
Construction
5. Perkhidmatan 7.3 5.6 -0.3 6.6
Services
5.1 Utiliti 4.7 3.6 -8.9 3.7
Utilities
5.2 Perdagangan borong dan runcit 11.6 8.7 0.3 9.5
Wholesale and retail trade
5.3 Makanan & minuman dan penginapan 6.5 14.7 2.1 8.3
Food & beverage and accommodation
5.4 Pengangkutan & penyimpanan dan maklumat & komunikasi 7.9 5.0 -8.6 6.0
Transportation & storage and information & communication
5.5 Kewangan, insurans, hartanah dan perkhidmatan perniagaan 9.7 15.3 8.9 9.9
Finance, insurance, real estate and business services
5.6 Perkhidmatan lain 5.5 1.3 0.5 5.0
Other services
Jumlah SMK
Total GKS6.6
1.3
Nilai akhir tahun (RM juta)
End year value (RM million)
2,889,493 791,695 840,757 4,521,945
Perubahan peratusan tahunan
Annual percentage change
7.5 5.8 4.3
2016
47

Jadual SMK mengikut jenis aktiviti ekonomi dan jenis aset pada harga semasaTable GKS by kind of economic activity and type of assets at current prices1.3
Struktur
Structure
Jentera dan
peralatan
Machinery and
equipment
Aset lain
Other assets
Jumlah
Total
1. Pertanian 1.5 2.1 5.8 2.4
Agriculture
2. Perlombongan dan pengkuarian 0.7 12.8 66.5 15.1
Mining and quarrying
3. Pembuatan 9.3 32.0 6.5 12.8
Manufacturing
3.1 Makanan, minuman dan tembakau 0.9 4.0 0.4 1.3
Food, beverages and tobacco
3.2 Produk tekstil dan kayu 1.2 2.3 0.2 1.2
Textiles and wood products
3.3 Produk petroleum, kimia, getah dan plastik 2.6 9.9 1.2 3.7
Petroleum, chemicals, rubber and plastic products
3.4 Produk mineral bukan logam, logam asas dan produk logam yang direka 1.0 3.7 0.4 1.4
Non-metallic mineral products, basic metal and fabricated metal products
3.5 Produk elektrik, elektronik dan optikal 2.9 10.0 3.7 4.3
Electrical, electronic and optical products
3.6 Peralatan pengangkutan, pembuatan lain dan pembaikan 0.7 2.0 0.6 0.9
Transport equipment, other manufacturing and repair
4. Pembinaan 0.8 3.0 0.2 1.1
Construction
5. Perkhidmatan 87.7 50.1 20.9 68.7
Services
5.1 Utiliti 9.4 8.3 2.0 7.8
Utilities
5.2 Perdagangan borong dan runcit 4.0 3.9 2.6 3.7
Wholesale and retail trade
5.3 Makanan & minuman dan penginapan 1.1 1.5 0.2 1.0
Food & beverage and accommodation
5.4 Pengangkutan & penyimpanan dan maklumat & komunikasi 14.9 25.4 4.0 14.7
Transportation & storage and information & communication
5.5 Kewangan, insurans, hartanah dan perkhidmatan perniagaan 26.5 4.3 5.6 18.7
Finance, insurance, real estate and business services
5.6 Perkhidmatan lain 31.9 6.8 6.6 22.8
Other services
Jumlah SMK
Total GKS
Struktur
Structure
Jentera dan
peralatan
Machinery and
equipment
Aset lain
Other assets
Jumlah
Total
1. Pertanian 40.0 15.2 44.8 100.0
Agriculture
2. Perlombongan dan pengkuarian 3.0 14.9 82.1 100.0
Mining and quarrying
3. Pembuatan 46.7 43.8 9.5 100.0
Manufacturing
3.1 Makanan, minuman dan tembakau 43.0 51.8 5.2 100.0
Food, beverages and tobacco
3.2 Produk tekstil dan kayu 63.8 32.8 3.4 100.0
Textiles and wood products
3.3 Produk petroleum, kimia, getah dan plastik 46.2 47.5 6.3 100.0
Petroleum, chemicals, rubber and plastic products
3.4 Produk mineral bukan logam, logam asas dan produk logam yang direka 47.2 47.8 5.0 100.0
Non-metallic mineral products, basic metal and fabricated metal products
3.5 Produk elektrik, elektronik dan optikal 43.0 40.8 16.2 100.0
Electrical, electronic and optical products
3.6 Peralatan pengangkutan, pembuatan lain dan pembaikan 47.7 39.7 12.6 100.0
Transport equipment, other manufacturing and repair
4. Pembinaan 46.9 49.0 4.1 100.0
Construction
5. Perkhidmatan 81.6 12.8 5.7 100.0
Services
5.1 Utiliti 76.6 18.6 4.7 100.0
Utilities
5.2 Perdagangan borong dan runcit 68.6 18.4 12.9 100.0
Wholesale and retail trade
5.3 Makanan & minuman dan penginapan 70.1 26.2 3.6 100.0
Food & beverage and accommodation
5.4 Pengangkutan & penyimpanan dan maklumat & komunikasi 64.7 30.2 5.0 100.0
Transportation & storage and information & communication
5.5 Kewangan, insurans, hartanah dan perkhidmatan perniagaan 90.5 4.0 5.5 100.0
Finance, insurance, real estate and business services
5.6 Perkhidmatan lain 89.4 5.2 5.4 100.0
Other services
Jumlah SMK
Total GKS63.9 17.5 18.6 100.0
Peratus sumbangan mengikut jenis aset
Percentage share by type of assets
Peratus sumbangan mengikut jenis aktiviti ekonomi
Percentage share by kind of economic activity
100.0 100.0 100.0 100.0
2016
48

Jadual SMK mengikut jenis aktiviti ekonomi dan jenis aset pada harga semasaTable GKS by kind of economic activity and type of assets at current prices
Struktur
Structure
Jentera dan
peralatan
Machinery and
equipment
Aset lain
Other assets
Jumlah
Total
1. Pertanian 46,348 18,301 56,192 120,841
Agriculture
2. Perlombongan dan pengkuarian 23,846 108,627 583,730 716,203
Mining and quarrying
3. Pembuatan 292,683 268,407 59,633 620,722
Manufacturing
3.1 Makanan, minuman dan tembakau 27,575 33,577 3,685 64,837
Food, beverages and tobacco
3.2 Produk tekstil dan kayu 36,146 17,707 2,059 55,913
Textiles and wood products
3.3 Produk petroleum, kimia, getah dan plastik 88,101 86,587 11,794 186,482
Petroleum, chemicals, rubber and plastic products
3.4 Produk mineral bukan logam, logam asas dan produk logam yang direka 30,659 31,490 3,533 65,682
Non-metallic mineral products, basic metal and fabricated metal products
3.5 Produk elektrik, elektronik dan optikal 89,905 83,009 33,311 206,225
Electrical, electronic and optical products
3.6 Peralatan pengangkutan, pembuatan lain dan pembaikan 20,297 16,036 5,251 41,584
Transport equipment, other manufacturing and repair
4. Pembinaan 23,698 25,767 2,149 51,614
Construction
5. Perkhidmatan 2,710,522 419,283 187,611 3,317,416
Services
5.1 Utiliti 283,949 67,991 17,912 369,851
Utilities
5.2 Perdagangan borong dan runcit 126,760 32,925 22,310 181,994
Wholesale and retail trade
5.3 Makanan & minuman dan penginapan 33,155 13,307 1,732 48,193
Food & beverage and accommodation
5.4 Pengangkutan & penyimpanan dan maklumat & komunikasi 465,666 210,945 35,215 711,825
Transportation & storage and information & communication
5.5 Kewangan, insurans, hartanah dan perkhidmatan perniagaan 831,165 38,976 54,111 924,252
Finance, insurance, real estate and business services
5.6 Perkhidmatan lain 969,829 55,139 56,332 1,081,300
Other services
Jumlah SMK
Total GKS
Struktur
Structure
Jentera dan
peralatan
Machinery and
equipment
Aset lain
Other assets
Jumlah
Total
1. Pertanian 5.6 10.0 14.3 10.2
Agriculture
2. Perlombongan dan pengkuarian 17.2 6.8 4.5 5.2
Mining and quarrying
3. Pembuatan 8.5 6.1 8.3 7.4
Manufacturing
3.1 Makanan, minuman dan tembakau 5.4 6.6 16.4 6.6
Food, beverages and tobacco
3.2 Produk tekstil dan kayu 2.4 -2.6 9.8 1.0
Textiles and wood products
3.3 Produk petroleum, kimia, getah dan plastik 15.3 10.3 13.5 12.8
Petroleum, chemicals, rubber and plastic products
3.4 Produk mineral bukan logam, logam asas dan produk logam yang direka 4.7 6.2 13.7 5.9
Non-metallic mineral products, basic metal and fabricated metal products
3.5 Produk elektrik, elektronik dan optikal 8.0 5.0 6.1 6.5
Electrical, electronic and optical products
3.6 Peralatan pengangkutan, pembuatan lain dan pembaikan 4.8 -0.5 2.8 2.5
Transport equipment, other manufacturing and repair
4. Pembinaan 5.5 9.8 8.8 7.8
Construction
5. Perkhidmatan 7.0 5.6 6.7 6.8
Services
5.1 Utiliti 5.1 3.5 7.7 4.9
Utilities
5.2 Perdagangan borong dan runcit 10.8 7.2 3.4 9.2
Wholesale and retail trade
5.3 Makanan & minuman dan penginapan 6.3 14.1 7.7 8.4
Food & beverage and accommodation
5.4 Pengangkutan & penyimpanan dan maklumat & komunikasi 8.3 5.0 5.3 7.1
Transportation & storage and information & communication
5.5 Kewangan, insurans, hartanah dan perkhidmatan perniagaan 8.7 15.2 15.6 9.4
Finance, insurance, real estate and business services
5.6 Perkhidmatan lain 5.1 2.0 1.1 4.7
Other services
Jumlah SMK
Total GKS
Perubahan peratusan tahunan
Annual percentage change
7.2 6.1 5.8
1.3
Nilai akhir tahun (RM juta)
End year value (RM million)
3,097,096 840,384 889,315 4,826,795
6.7
2017
49

Jadual SMK mengikut jenis aktiviti ekonomi dan jenis aset pada harga semasaTable GKS by kind of economic activity and type of assets at current prices 1.3
Struktur
Structure
Jentera dan
peralatan
Machinery and
equipment
Aset lain
Other assets
Jumlah
Total
1. Pertanian 1.5 2.2 6.3 2.5
Agriculture
2. Perlombongan dan pengkuarian 0.8 12.9 65.6 14.8
Mining and quarrying
3. Pembuatan 9.5 31.9 6.7 12.9
Manufacturing
3.1 Makanan, minuman dan tembakau 0.9 4.0 0.4 1.3
Food, beverages and tobacco
3.2 Produk tekstil dan kayu 1.2 2.1 0.2 1.2
Textiles and wood products
3.3 Produk petroleum, kimia, getah dan plastik 2.8 10.3 1.3 3.9
Petroleum, chemicals, rubber and plastic products
3.4 Produk mineral bukan logam, logam asas dan produk logam yang direka 1.0 3.7 0.4 1.4
Non-metallic mineral products, basic metal and fabricated metal products
3.5 Produk elektrik, elektronik dan optikal 2.9 9.9 3.7 4.3
Electrical, electronic and optical products
3.6 Peralatan pengangkutan, pembuatan lain dan pembaikan 0.7 1.9 0.6 0.9
Transport equipment, other manufacturing and repair
4. Pembinaan 0.8 3.1 0.2 1.1
Construction
5. Perkhidmatan 87.5 49.9 21.1 68.7
Services
5.1 Utiliti 9.2 8.1 2.0 7.7
Utilities
5.2 Perdagangan borong dan runcit 4.1 3.9 2.5 3.8
Wholesale and retail trade
5.3 Makanan & minuman dan penginapan 1.1 1.6 0.2 1.0
Food & beverage and accommodation
5.4 Pengangkutan & penyimpanan dan maklumat & komunikasi 15.0 25.1 4.0 14.7
Transportation & storage and information & communication
5.5 Kewangan, insurans, hartanah dan perkhidmatan perniagaan 26.8 4.6 6.1 19.1
Finance, insurance, real estate and business services
5.6 Perkhidmatan lain 31.3 6.6 6.3 22.4
Other services
Jumlah SMK
Total GKS
Struktur
Structure
Jentera dan
peralatan
Machinery and
equipment
Aset lain
Other assets
Jumlah
Total
1. Pertanian 38.4 15.1 46.5 100.0
Agriculture
2. Perlombongan dan pengkuarian 3.3 15.2 81.5 100.0
Mining and quarrying
3. Pembuatan 47.2 43.2 9.6 100.0
Manufacturing
3.1 Makanan, minuman dan tembakau 42.5 51.8 5.7 100.0
Food, beverages and tobacco
3.2 Produk tekstil dan kayu 64.6 31.7 3.7 100.0
Textiles and wood products
3.3 Produk petroleum, kimia, getah dan plastik 47.2 46.4 6.3 100.0
Petroleum, chemicals, rubber and plastic products
3.4 Produk mineral bukan logam, logam asas dan produk logam yang direka 46.7 47.9 5.4 100.0
Non-metallic mineral products, basic metal and fabricated metal products
3.5 Produk elektrik, elektronik dan optikal 43.6 40.3 16.2 100.0
Electrical, electronic and optical products
3.6 Peralatan pengangkutan, pembuatan lain dan pembaikan 48.8 38.6 12.6 100.0
Transport equipment, other manufacturing and repair
4. Pembinaan 45.9 49.9 4.2 100.0
Construction
5. Perkhidmatan 81.7 12.6 5.7 100.0
Services
5.1 Utiliti 76.8 18.4 4.8 100.0
Utilities
5.2 Perdagangan borong dan runcit 69.7 18.1 12.3 100.0
Wholesale and retail trade
5.3 Makanan & minuman dan penginapan 68.8 27.6 3.6 100.0
Food & beverage and accommodation
5.4 Pengangkutan & penyimpanan dan maklumat & komunikasi 65.4 29.6 4.9 100.0
Transportation & storage and information & communication
5.5 Kewangan, insurans, hartanah dan perkhidmatan perniagaan 89.9 4.2 5.9 100.0
Finance, insurance, real estate and business services
5.6 Perkhidmatan lain 89.7 5.1 5.2 100.0
Other services
Jumlah SMK
Total GKS
100.0
Peratus sumbangan mengikut jenis aset
Percentage share by type of assets
64.2 17.4 18.4 100.0
100.0
Peratus sumbangan mengikut jenis aktiviti ekonomi
Percentage share by kind of economic activity
100.0 100.0
2017
50

Jadual SMK mengikut jenis aktiviti ekonomi dan jenis aset pada harga malar 2010Table GKS by kind of economic activity and type of assets at constant 2010 prices
Struktur
Structure
Jentera dan
peralatan
Machinery and
equipment
Aset lain
Other assets
Jumlah
Total
1. Pertanian 32,315 14,706 41,987 89,009
Agriculture
2. Perlombongan dan pengkuarian 14,006 92,113 348,008 454,127
Mining and quarrying
3. Pembuatan 192,859 238,037 44,198 475,094
Manufacturing
3.1 Makanan, minuman dan tembakau 19,301 28,619 2,181 50,100
Food, beverages and tobacco
3.2 Produk tekstil dan kayu 26,813 18,232 1,311 46,356
Textiles and wood products
3.3 Produk petroleum, kimia, getah dan plastik 50,478 70,730 7,712 128,920
Petroleum, chemicals, rubber and plastic products
3.4 Produk mineral bukan logam, logam asas dan produk logam yang direka 21,914 27,779 2,222 51,915
Non-metallic mineral products, basic metal and fabricated metal products
3.5 Produk elektrik, elektronik dan optikal 59,956 76,683 26,387 163,026
Electrical, electronic and optical products
3.6 Peralatan pengangkutan, pembuatan lain dan pembaikan 14,397 15,993 4,385 34,776
Transport equipment, other manufacturing and repair
4. Pembinaan 16,570 20,758 1,371 38,698
Construction
5. Perkhidmatan 1,843,727 366,555 131,670 2,341,952
Services
5.1 Utiliti 200,658 62,335 11,100 274,093
Utilities
5.2 Perdagangan borong dan runcit 80,334 27,587 14,404 122,325
Wholesale and retail trade
5.3 Makanan & minuman dan penginapan 22,937 9,986 1,086 34,009
Food & beverage and accommodation
5.4 Pengangkutan & penyimpanan dan maklumat & komunikasi 309,787 185,585 22,761 518,133
Transportation & storage and information & communication
5.5 Kewangan, insurans, hartanah dan perkhidmatan perniagaan 547,711 28,857 29,949 606,516
Finance, insurance, real estate and business services
5.6 Perkhidmatan lain 682,300 52,206 52,370 786,876
Other services
Jumlah SMK
Total GKS
Struktur
Structure
Jentera dan
peralatan
Machinery and
equipment
Aset lain
Other assets
Jumlah
Total
1. Pertanian 2.8 9.3 6.5 5.6
Agriculture
2. Perlombongan dan pengkuarian 11.6 12.7 7.4 8.6
Mining and quarrying
3. Pembuatan 5.9 2.6 7.8 4.4
Manufacturing
3.1 Makanan, minuman dan tembakau 3.9 10.3 25.3 8.3
Food, beverages and tobacco
3.2 Produk tekstil dan kayu 0.5 -3.0 10.1 -0.6
Textiles and wood products
3.3 Produk petroleum, kimia, getah dan plastik 12.8 5.2 12.1 8.5
Petroleum, chemicals, rubber and plastic products
3.4 Produk mineral bukan logam, logam asas dan produk logam yang direka 2.1 3.9 15.4 3.6
Non-metallic mineral products, basic metal and fabricated metal products
3.5 Produk elektrik, elektronik dan optikal 6.0 -0.6 5.7 2.8
Electrical, electronic and optical products
3.6 Peralatan pengangkutan, pembuatan lain dan pembaikan 2.7 -1.7 2.2 0.6
Transport equipment, other manufacturing and repair
4. Pembinaan 3.3 10.4 5.2 7.1
Construction
5. Perkhidmatan 4.2 4.8 2.9 4.2
Services
5.1 Utiliti 2.2 4.8 3.6 2.8
Utilities
5.2 Perdagangan borong dan runcit 9.1 7.3 -1.9 7.3
Wholesale and retail trade
5.3 Makanan & minuman dan penginapan 3.3 13.0 3.5 6.0
Food & beverage and accommodation
5.4 Pengangkutan & penyimpanan dan maklumat & komunikasi 4.8 4.0 2.7 4.4
Transportation & storage and information & communication
5.5 Kewangan, insurans, hartanah dan perkhidmatan perniagaan 5.8 15.7 9.0 6.4
Finance, insurance, real estate and business services
5.6 Perkhidmatan lain 2.7 -0.5 1.0 2.4
Other services
Jumlah SMK
Total GKS
Perubahan peratusan tahunan
Annual percentage change
4.4 5.2 6.3 4.9
3,398,880
1.4
Nilai akhir tahun (RM juta)
End year value (RM million)
2,099,477 732,169 567,233
2015
51

Jadual SMK mengikut jenis aktiviti ekonomi dan jenis aset pada harga malar 2010Table GKS by kind of economic activity and type of assets at constant 2010 prices 1.4
Struktur
Structure
Jentera dan
peralatan
Machinery and
equipment
Aset lain
Other assets
Jumlah
Total
1. Pertanian 1.5 2.0 7.4 2.6
Agriculture
2. Perlombongan dan pengkuarian 0.7 12.6 61.4 13.4
Mining and quarrying
3. Pembuatan 9.2 32.5 7.8 14.0
Manufacturing
3.1 Makanan, minuman dan tembakau 0.9 3.9 0.4 1.5
Food, beverages and tobacco
3.2 Produk tekstil dan kayu 1.3 2.5 0.2 1.4
Textiles and wood products
3.3 Produk petroleum, kimia, getah dan plastik 2.4 9.7 1.4 3.8
Petroleum, chemicals, rubber and plastic products
3.4 Produk mineral bukan logam, logam asas dan produk logam yang direka 1.0 3.8 0.4 1.5
Non-metallic mineral products, basic metal and fabricated metal products
3.5 Produk elektrik, elektronik dan optikal 2.9 10.5 4.7 4.8
Electrical, electronic and optical products
3.6 Peralatan pengangkutan, pembuatan lain dan pembaikan 0.7 2.2 0.8 1.0
Transport equipment, other manufacturing and repair
4. Pembinaan 0.8 2.8 0.2 1.1
Construction
5. Perkhidmatan 87.8 50.1 23.2 68.9
Services
5.1 Utiliti 9.6 8.5 2.0 8.1
Utilities
5.2 Perdagangan borong dan runcit 3.8 3.8 2.5 3.6
Wholesale and retail trade
5.3 Makanan & minuman dan penginapan 1.1 1.4 0.2 1.0
Food & beverage and accommodation
5.4 Pengangkutan & penyimpanan dan maklumat & komunikasi 14.8 25.3 4.0 15.2
Transportation & storage and information & communication
5.5 Kewangan, insurans, hartanah dan perkhidmatan perniagaan 26.1 3.9 5.3 17.8
Finance, insurance, real estate and business services
5.6 Perkhidmatan lain 32.5 7.1 9.2 23.2
Other services
Jumlah SMK
Total GKS
Struktur
Structure
Jentera dan
peralatan
Machinery and
equipment
Aset lain
Other assets
Jumlah
Total
1. Pertanian 36.3 16.5 47.2 100.0
Agriculture
2. Perlombongan dan pengkuarian 3.1 20.3 76.6 100.0
Mining and quarrying
3. Pembuatan 40.6 50.1 9.3 100.0
Manufacturing
3.1 Makanan, minuman dan tembakau 38.5 57.1 4.4 100.0
Food, beverages and tobacco
3.2 Produk tekstil dan kayu 57.8 39.3 2.8 100.0
Textiles and wood products
3.3 Produk petroleum, kimia, getah dan plastik 39.2 54.9 6.0 100.0
Petroleum, chemicals, rubber and plastic products
3.4 Produk mineral bukan logam, logam asas dan produk logam yang direka 42.2 53.5 4.3 100.0
Non-metallic mineral products, basic metal and fabricated metal products
3.5 Produk elektrik, elektronik dan optikal 36.8 47.0 16.2 100.0
Electrical, electronic and optical products
3.6 Peralatan pengangkutan, pembuatan lain dan pembaikan 41.4 46.0 12.6 100.0
Transport equipment, other manufacturing and repair
4. Pembinaan 42.8 53.6 3.5 100.0
Construction
5. Perkhidmatan 78.7 15.7 5.6 100.0
Services
5.1 Utiliti 73.2 22.7 4.0 100.0
Utilities
5.2 Perdagangan borong dan runcit 65.7 22.6 11.8 100.0
Wholesale and retail trade
5.3 Makanan & minuman dan penginapan 67.4 29.4 3.2 100.0
Food & beverage and accommodation
5.4 Pengangkutan & penyimpanan dan maklumat & komunikasi 59.8 35.8 4.4 100.0
Transportation & storage and information & communication
5.5 Kewangan, insurans, hartanah dan perkhidmatan perniagaan 90.3 4.8 4.9 100.0
Finance, insurance, real estate and business services
5.6 Perkhidmatan lain 86.7 6.6 6.7 100.0
Other services
Jumlah SMK
Total GKS61.8 21.5 16.7 100.0
100.0 100.0 100.0 100.0
Peratus sumbangan mengikut jenis aset
Percentage share by type of assets
Peratus sumbangan mengikut jenis aktiviti ekonomi
Percentage share by kind of economic activity2015
52

Jadual SMK mengikut jenis aktiviti ekonomi dan jenis aset pada harga malar 2010Table GKS by kind of economic activity and type of assets at constant 2010 prices
Struktur
Structure
Jentera dan
peralatan
Machinery and
equipment
Aset lain
Other assets
Jumlah
Total
1. Pertanian 33,275 16,004 45,032 94,311
Agriculture
2. Perlombongan dan pengkuarian 15,426 99,061 368,843 483,329
Mining and quarrying
3. Pembuatan 205,361 245,414 47,029 497,804
Manufacturing
3.1 Makanan, minuman dan tembakau 19,920 30,536 2,568 53,023
Food, beverages and tobacco
3.2 Produk tekstil dan kayu 26,894 17,627 1,421 45,942
Textiles and wood products
3.3 Produk petroleum, kimia, getah dan plastik 58,129 76,353 8,606 143,088
Petroleum, chemicals, rubber and plastic products
3.4 Produk mineral bukan logam, logam asas dan produk logam yang direka 22,309 28,664 2,491 53,464
Non-metallic mineral products, basic metal and fabricated metal products
3.5 Produk elektrik, elektronik dan optikal 63,370 76,612 27,509 167,491
Electrical, electronic and optical products
3.6 Peralatan pengangkutan, pembuatan lain dan pembaikan 14,739 15,623 4,433 34,795
Transport equipment, other manufacturing and repair
4. Pembinaan 17,108 22,567 1,434 41,108
Construction
5. Perkhidmatan 1,924,629 380,158 134,356 2,439,143
Services
5.1 Utiliti 204,588 63,982 11,364 279,933
Utilities
5.2 Perdagangan borong dan runcit 87,162 29,231 14,108 130,501
Wholesale and retail trade
5.3 Makanan & minuman dan penginapan 23,744 11,386 1,112 36,243
Food & beverage and accommodation
5.4 Pengangkutan & penyimpanan dan maklumat & komunikasi 325,523 190,550 22,971 539,044
Transportation & storage and information & communication
5.5 Kewangan, insurans, hartanah dan perkhidmatan perniagaan 583,224 32,969 32,660 648,852
Finance, insurance, real estate and business services
5.6 Perkhidmatan lain 700,388 52,039 52,142 804,570
Other services
Jumlah SMK
Total GKS
Struktur
Structure
Jentera dan
peralatan
Machinery and
equipment
Aset lain
Other assets
Jumlah
Total
1. Pertanian 3.0 8.8 7.3 6.0
Agriculture
2. Perlombongan dan pengkuarian 10.1 7.5 6.0 6.4
Mining and quarrying
3. Pembuatan 6.5 3.1 6.4 4.8
Manufacturing
3.1 Makanan, minuman dan tembakau 3.2 6.7 17.8 5.8
Food, beverages and tobacco
3.2 Produk tekstil dan kayu 0.3 -3.3 8.4 -0.9
Textiles and wood products
3.3 Produk petroleum, kimia, getah dan plastik 15.2 7.9 11.6 11.0
Petroleum, chemicals, rubber and plastic products
3.4 Produk mineral bukan logam, logam asas dan produk logam yang direka 1.8 3.2 12.1 3.0
Non-metallic mineral products, basic metal and fabricated metal products
3.5 Produk elektrik, elektronik dan optikal 5.7 -0.1 4.3 2.7
Electrical, electronic and optical products
3.6 Peralatan pengangkutan, pembuatan lain dan pembaikan 2.4 -2.3 1.1 0.1
Transport equipment, other manufacturing and repair
4. Pembinaan 3.2 8.7 4.6 6.2
Construction
5. Perkhidmatan 4.4 3.7 2.0 4.1
Services
5.1 Utiliti 2.0 2.6 2.4 2.1
Utilities
5.2 Perdagangan borong dan runcit 8.5 6.0 -2.1 6.7
Wholesale and retail trade
5.3 Makanan & minuman dan penginapan 3.5 14.0 2.4 6.6
Food & beverage and accommodation
5.4 Pengangkutan & penyimpanan dan maklumat & komunikasi 5.1 2.7 0.9 4.0
Transportation & storage and information & communication
5.5 Kewangan, insurans, hartanah dan perkhidmatan perniagaan 6.5 14.3 9.1 7.0
Finance, insurance, real estate and business services
5.6 Perkhidmatan lain 2.7 -0.3 -0.4 2.2
Other services
Jumlah SMK
Total GKS
Perubahan peratusan tahunan
Annual percentage change
4.6 4.2 5.2 4.6
3,555,695
1.4
Nilai akhir tahun (RM juta)
End year value (RM million)
2,195,798 763,204 596,693
2016
53

Jadual SMK mengikut jenis aktiviti ekonomi dan jenis aset pada harga malar 2010Table GKS by kind of economic activity and type of assets at constant 2010 prices 1.4
Struktur
Structure
Jentera dan
peralatan
Machinery and
equipment
Aset lain
Other assets
Jumlah
Total
1. Pertanian 1.5 2.1 7.5 2.7
Agriculture
2. Perlombongan dan pengkuarian 0.7 13.0 61.8 13.6
Mining and quarrying
3. Pembuatan 9.4 32.2 7.9 14.0
Manufacturing
3.1 Makanan, minuman dan tembakau 0.9 4.0 0.4 1.5
Food, beverages and tobacco
3.2 Produk tekstil dan kayu 1.2 2.3 0.2 1.3
Textiles and wood products
3.3 Produk petroleum, kimia, getah dan plastik 2.6 10.0 1.4 4.0
Petroleum, chemicals, rubber and plastic products
3.4 Produk mineral bukan logam, logam asas dan produk logam yang direka 1.0 3.8 0.4 1.5
Non-metallic mineral products, basic metal and fabricated metal products
3.5 Produk elektrik, elektronik dan optikal 2.9 10.0 4.6 4.7
Electrical, electronic and optical products
3.6 Peralatan pengangkutan, pembuatan lain dan pembaikan 0.7 2.0 0.7 1.0
Transport equipment, other manufacturing and repair
4. Pembinaan 0.8 3.0 0.2 1.2
Construction
5. Perkhidmatan 87.7 49.8 22.5 68.6
Services
5.1 Utiliti 9.3 8.4 1.9 7.9
Utilities
5.2 Perdagangan borong dan runcit 4.0 3.8 2.4 3.7
Wholesale and retail trade
5.3 Makanan & minuman dan penginapan 1.1 1.5 0.2 1.0
Food & beverage and accommodation
5.4 Pengangkutan & penyimpanan dan maklumat & komunikasi 14.8 25.0 3.8 15.2
Transportation & storage and information & communication
5.5 Kewangan, insurans, hartanah dan perkhidmatan perniagaan 26.6 4.3 5.5 18.2
Finance, insurance, real estate and business services
5.6 Perkhidmatan lain 31.9 6.8 8.7 22.6
Other services
Jumlah SMK
Total GKS
Struktur
Structure
Jentera dan
peralatan
Machinery and
equipment
Aset lain
Other assets
Jumlah
Total
1. Pertanian 35.3 17.0 47.7 100.0
Agriculture
2. Perlombongan dan pengkuarian 3.2 20.5 76.3 100.0
Mining and quarrying
3. Pembuatan 41.3 49.3 9.4 100.0
Manufacturing
3.1 Makanan, minuman dan tembakau 37.6 57.6 4.8 100.0
Food, beverages and tobacco
3.2 Produk tekstil dan kayu 58.5 38.4 3.1 100.0
Textiles and wood products
3.3 Produk petroleum, kimia, getah dan plastik 40.6 53.4 6.0 100.0
Petroleum, chemicals, rubber and plastic products
3.4 Produk mineral bukan logam, logam asas dan produk logam yang direka 41.7 53.6 4.7 100.0
Non-metallic mineral products, basic metal and fabricated metal products
3.5 Produk elektrik, elektronik dan optikal 37.8 45.7 16.4 100.0
Electrical, electronic and optical products
3.6 Peralatan pengangkutan, pembuatan lain dan pembaikan 42.4 44.9 12.7 100.0
Transport equipment, other manufacturing and repair
4. Pembinaan 41.6 54.9 3.5 100.0
Construction
5. Perkhidmatan 78.9 15.6 5.5 100.0
Services
5.1 Utiliti 73.1 22.9 4.1 100.0
Utilities
5.2 Perdagangan borong dan runcit 66.8 22.4 10.8 100.0
Wholesale and retail trade
5.3 Makanan & minuman dan penginapan 65.5 31.4 3.1 100.0
Food & beverage and accommodation
5.4 Pengangkutan & penyimpanan dan maklumat & komunikasi 60.4 35.3 4.3 100.0
Transportation & storage and information & communication
5.5 Kewangan, insurans, hartanah dan perkhidmatan perniagaan 89.9 5.1 5.0 100.0
Finance, insurance, real estate and business services
5.6 Perkhidmatan lain 87.1 6.5 6.5 100.0
Other services
Jumlah SMK
Total GKS61.8 21.5 16.8 100.0
100.0 100.0 100.0 100.0
Peratus sumbangan mengikut jenis aset
Percentage share by type of assets
Peratus sumbangan mengikut jenis aktiviti ekonomi
Percentage share by kind of economic activity2016
54

Jadual SMK mengikut jenis aktiviti ekonomi dan jenis aset pada harga malar 2010 Table GKS by kind of economic activity and type of assets at constant 2010 prices
Struktur
Structure
Jentera dan
peralatan
Machinery and
equipment
Aset lain
Other assets
Jumlah
Total
1. Pertanian 34,332 17,322 47,655 99,308
Agriculture
2. Perlombongan dan pengkuarian 17,662 104,739 385,316 507,718
Mining and quarrying
3. Pembuatan 217,729 258,292 49,779 525,800
Manufacturing
3.1 Makanan, minuman dan tembakau 20,516 32,246 2,933 55,695
Food, beverages and tobacco
3.2 Produk tekstil dan kayu 26,901 17,032 1,517 45,451
Textiles and wood products
3.3 Produk petroleum, kimia, getah dan plastik 65,512 83,585 9,513 158,611
Petroleum, chemicals, rubber and plastic products
3.4 Produk mineral bukan logam, logam asas dan produk logam yang direka 22,820 30,147 2,773 55,740
Non-metallic mineral products, basic metal and fabricated metal products
3.5 Produk elektrik, elektronik dan optikal 66,883 79,856 28,581 175,320
Electrical, electronic and optical products
3.6 Peralatan pengangkutan, pembuatan lain dan pembaikan 15,095 15,426 4,461 34,983
Transport equipment, other manufacturing and repair
4. Pembinaan 17,648 24,401 1,493 43,542
Construction
5. Perkhidmatan 2,013,378 395,257 136,386 2,545,022
Services
5.1 Utiliti 209,918 65,825 11,565 287,308
Utilities
5.2 Perdagangan borong dan runcit 94,357 30,567 13,796 138,720
Wholesale and retail trade
5.3 Makanan & minuman dan penginapan 24,670 12,910 1,138 38,719
Food & beverage and accommodation
5.4 Pengangkutan & penyimpanan dan maklumat & komunikasi 344,000 195,893 23,096 562,989
Transportation & storage and information & communication
5.5 Kewangan, insurans, hartanah dan perkhidmatan perniagaan 621,341 37,625 35,298 694,265
Finance, insurance, real estate and business services
5.6 Perkhidmatan lain 719,092 52,436 51,493 823,021
Other services
Jumlah SMK
Total GKS
Struktur
Structure
Jentera dan
peralatan
Machinery and
equipment
Aset lain
Other assets
Jumlah
Total
1. Pertanian 3.2 8.2 5.8 5.3
Agriculture
2. Perlombongan dan pengkuarian 14.5 5.7 4.5 5.0
Mining and quarrying
3. Pembuatan 6.0 5.2 5.8 5.6
Manufacturing
3.1 Makanan, minuman dan tembakau 3.0 5.6 14.2 5.0
Food, beverages and tobacco
3.2 Produk tekstil dan kayu 0.0 -3.4 6.7 -1.1
Textiles and wood products
3.3 Produk petroleum, kimia, getah dan plastik 12.7 9.5 10.5 10.8
Petroleum, chemicals, rubber and plastic products
3.4 Produk mineral bukan logam, logam asas dan produk logam yang direka 2.3 5.2 11.3 4.3
Non-metallic mineral products, basic metal and fabricated metal products
3.5 Produk elektrik, elektronik dan optikal 5.5 4.2 3.9 4.7
Electrical, electronic and optical products
3.6 Peralatan pengangkutan, pembuatan lain dan pembaikan 2.4 -1.3 0.6 0.5
Transport equipment, other manufacturing and repair
4. Pembinaan 3.2 8.1 4.1 5.9
Construction
5. Perkhidmatan 4.6 4.0 1.5 4.3
Services
5.1 Utiliti 2.6 2.9 1.8 2.6
Utilities
5.2 Perdagangan borong dan runcit 8.3 4.6 -2.2 6.3
Wholesale and retail trade
5.3 Makanan & minuman dan penginapan 3.9 13.4 2.3 6.8
Food & beverage and accommodation
5.4 Pengangkutan & penyimpanan dan maklumat & komunikasi 5.7 2.8 0.5 4.4
Transportation & storage and information & communication
5.5 Kewangan, insurans, hartanah dan perkhidmatan perniagaan 6.5 14.1 8.1 7.0
Finance, insurance, real estate and business services
5.6 Perkhidmatan lain 2.7 0.8 -1.2 2.3
Other services
Jumlah SMK
Total GKS
620,629 3,721,390
Perubahan peratusan tahunan
Annual percentage change
4.8 4.8 4.0 4.7
1.4
Nilai akhir tahun (RM juta)
End year value (RM million)
2,300,749 800,011
2017
55

Jadual SMK mengikut jenis aktiviti ekonomi dan jenis aset pada harga malar 2010 Table GKS by kind of economic activity and type of assets at constant 2010 prices 1.4
Struktur
Structure
Jentera dan
peralatan
Machinery and
equipment
Aset lain
Other assets
Jumlah
Total
1. Pertanian 1.5 2.2 7.7 2.7
Agriculture
2. Perlombongan dan pengkuarian 0.8 13.1 62.1 13.6
Mining and quarrying
3. Pembuatan 9.5 32.3 8.0 14.1
Manufacturing
3.1 Makanan, minuman dan tembakau 0.9 4.0 0.5 1.5
Food, beverages and tobacco
3.2 Produk tekstil dan kayu 1.2 2.1 0.2 1.2
Textiles and wood products
3.3 Produk petroleum, kimia, getah dan plastik 2.8 10.4 1.5 4.3
Petroleum, chemicals, rubber and plastic products
3.4 Produk mineral bukan logam, logam asas dan produk logam yang direka 1.0 3.8 0.4 1.5
Non-metallic mineral products, basic metal and fabricated metal products
3.5 Produk elektrik, elektronik dan optikal 2.9 10.0 4.6 4.7
Electrical, electronic and optical products
3.6 Peralatan pengangkutan, pembuatan lain dan pembaikan 0.7 1.9 0.7 0.9
Transport equipment, other manufacturing and repair
4. Pembinaan 0.8 3.1 0.2 1.2
Construction
5. Perkhidmatan 87.5 49.4 22.0 68.4
Services
5.1 Utiliti 9.1 8.2 1.9 7.7
Utilities
5.2 Perdagangan borong dan runcit 4.1 3.8 2.2 3.7
Wholesale and retail trade
5.3 Makanan & minuman dan penginapan 1.1 1.6 0.2 1.0
Food & beverage and accommodation
5.4 Pengangkutan & penyimpanan dan maklumat & komunikasi 15.0 24.5 3.7 15.1
Transportation & storage and information & communication
5.5 Kewangan, insurans, hartanah dan perkhidmatan perniagaan 27.0 4.7 5.7 18.7
Finance, insurance, real estate and business services
5.6 Perkhidmatan lain 31.3 6.6 8.3 22.1
Other services
Jumlah SMK
Total GKS
Struktur
Structure
Jentera dan
peralatan
Machinery and
equipment
Aset lain
Other assets
Jumlah
Total
1. Pertanian 34.6 17.4 48.0 100.0
Agriculture
2. Perlombongan dan pengkuarian 3.5 20.6 75.9 100.0
Mining and quarrying
3. Pembuatan 41.4 49.1 9.5 100.0
Manufacturing
3.1 Makanan, minuman dan tembakau 36.8 57.9 5.3 100.0
Food, beverages and tobacco
3.2 Produk tekstil dan kayu 59.2 37.5 3.3 100.0
Textiles and wood products
3.3 Produk petroleum, kimia, getah dan plastik 41.3 52.7 6.0 100.0
Petroleum, chemicals, rubber and plastic products
3.4 Produk mineral bukan logam, logam asas dan produk logam yang direka 40.9 54.1 5.0 100.0
Non-metallic mineral products, basic metal and fabricated metal products
3.5 Produk elektrik, elektronik dan optikal 38.1 45.5 16.3 100.0
Electrical, electronic and optical products
3.6 Peralatan pengangkutan, pembuatan lain dan pembaikan 43.2 44.1 12.8 100.0
Transport equipment, other manufacturing and repair
4. Pembinaan 40.5 56.0 3.4 100.0
Construction
5. Perkhidmatan 79.1 15.5 5.4 100.0
Services
5.1 Utiliti 73.1 22.9 4.0 100.0
Utilities
5.2 Perdagangan borong dan runcit 68.0 22.0 9.9 100.0
Wholesale and retail trade
5.3 Makanan & minuman dan penginapan 63.7 33.3 2.9 100.0
Food & beverage and accommodation
5.4 Pengangkutan & penyimpanan dan maklumat & komunikasi 61.1 34.8 4.1 100.0
Transportation & storage and information & communication
5.5 Kewangan, insurans, hartanah dan perkhidmatan perniagaan 89.5 5.4 5.1 100.0
Finance, insurance, real estate and business services
5.6 Perkhidmatan lain 87.4 6.4 6.3 100.0
Other services
Jumlah SMK
Total GKS
100.0
Peratus sumbangan mengikut jenis aset
Percentage share by type of assets
61.8 21.5 16.7 100.0
100.0
Peratus sumbangan mengikut jenis aktiviti ekonomi
Percentage share by kind of economic activity
100.0 100.0
2017
56


Jadual SMB mengikut jenis aktiviti ekonomi pada harga semasa
Table NKS by kind of economic activity at current prices
Jenis aktiviti ekonomi
Kind of economic activity Nilai akhir tahun (RM juta) Perubahan peratusan tahunan
End year value (RM million) Annual percentage change
1. Pertanian 57,658 59,509 65,705 8.9 3.2 10.4
Agriculture
2. Perlombongan dan pengkuarian 500,287 526,266 544,638 9.6 5.2 3.5
Mining and quarrying
3. Pembuatan 296,719 323,204 353,856 7.8 8.9 9.5
Manufacturing
3.1 Makanan, minuman dan tembakau 32,431 34,654 36,622 10.1 6.9 5.7
Food, beverages and tobacco
3.2 Produk tekstil dan kayu 26,126 26,264 26,261 0.6 0.5 0.0
Textiles and wood products
3.3 Produk petroleum, kimia, getah dan plastik 85,255 100,832 116,964 14.4 18.3 16.0
Petroleum, chemicals, rubber and plastic products
3.4 Produk mineral bukan logam, logam asas dan produk logam yang direka 31,506 33,158 35,436 5.6 5.2 6.9
Non-metallic mineral products, basic metal and fabricated metal products
3.5 Produk elektrik, elektronik dan optikal 100,333 106,924 116,764 5.9 6.6 9.2
Electrical, electronic and optical products
3.6 Peralatan pengangkutan, pembuatan lain dan pembaikan 21,068 21,372 21,810 1.4 1.4 2.0
Transport equipment, other manufacturing and repair
4. Pembinaan 23,970 25,954 28,071 8.0 8.3 8.2
Construction
5. Perkhidmatan 1,812,387 1,924,362 2,051,841 6.2 6.2 6.6
Services
5.1 Utiliti 180,472 184,187 192,714 3.4 2.1 4.6
Utilities
5.2 Perdagangan borong dan runcit 94,442 103,913 114,110 10.1 10.0 9.8
Wholesale and retail trade
5.3 Makanan & minuman dan penginapan 22,165 24,039 26,065 8.8 8.5 8.4
Food & beverage and accommodation
5.4 Pengangkutan & penyimpanan dan maklumat & komunikasi 379,587 397,124 421,882 4.8 4.6 6.2
Transportation & storage and information & communication
5.5 Kewangan, insurans, hartanah dan perkhidmatan perniagaan 462,727 515,903 571,918 10.7 11.5 10.9
Finance, insurance, real estate and business services
5.6 Perkhidmatan lain 672,994 699,196 725,153 4.1 3.9 3.7
Other services
Jumlah SMB
Total NKS
Jenis aktiviti ekonomi
Kind of economic activity Peratus sumbangan SMB
Percentage share of NKS
1. Pertanian 2.1 2.1 2.2
Agriculture
2. Perlombongan dan pengkuarian 18.6 18.4 17.9
Mining and quarrying
3. Pembuatan 11.0 11.3 11.6
Manufacturing
3.1 Makanan, minuman dan tembakau 1.2 1.2 1.2
Food, beverages and tobacco
3.2 Produk tekstil dan kayu 1.0 0.9 0.9
Textiles and wood products
3.3 Produk petroleum, kimia, getah dan plastik 3.2 3.5 3.8
Petroleum, chemicals, rubber and plastic products
3.4 Produk mineral bukan logam, logam asas dan produk logam yang direka 1.2 1.2 1.2
Non-metallic mineral products, basic metal and fabricated metal products
3.5 Produk elektrik, elektronik dan optikal 3.7 3.7 3.8
Electrical, electronic and optical products
3.6 Peralatan pengangkutan, pembuatan lain dan pembaikan 0.8 0.7 0.7
Transport equipment, other manufacturing and repair
4. Pembinaan 0.9 0.9 0.9
Construction
5. Perkhidmatan 67.3 67.3 67.4
Services
5.1 Utiliti 6.7 6.4 6.3
Utilities
5.2 Perdagangan borong dan runcit 3.5 3.6 3.7
Wholesale and retail trade
5.3 Makanan & minuman dan penginapan 0.8 0.8 0.9
Food & beverage and accommodation
5.4 Pengangkutan & penyimpanan dan maklumat & komunikasi 14.1 13.9 13.9
Transportation & storage and information & communication
5.5 Kewangan, insurans, hartanah dan perkhidmatan perniagaan 17.2 18.0 18.8
Finance, insurance, real estate and business services
5.6 Perkhidmatan lain 25.0 24.5 23.8
Other services
Jumlah SMB
Total NKS
2015 2016e
2017p
100.0 100.0 100.0
2,691,020 2,859,295 3,044,111
2.1
2015 2016e
2017p
2017p
6.57.0 6.3
2015 2016e
57
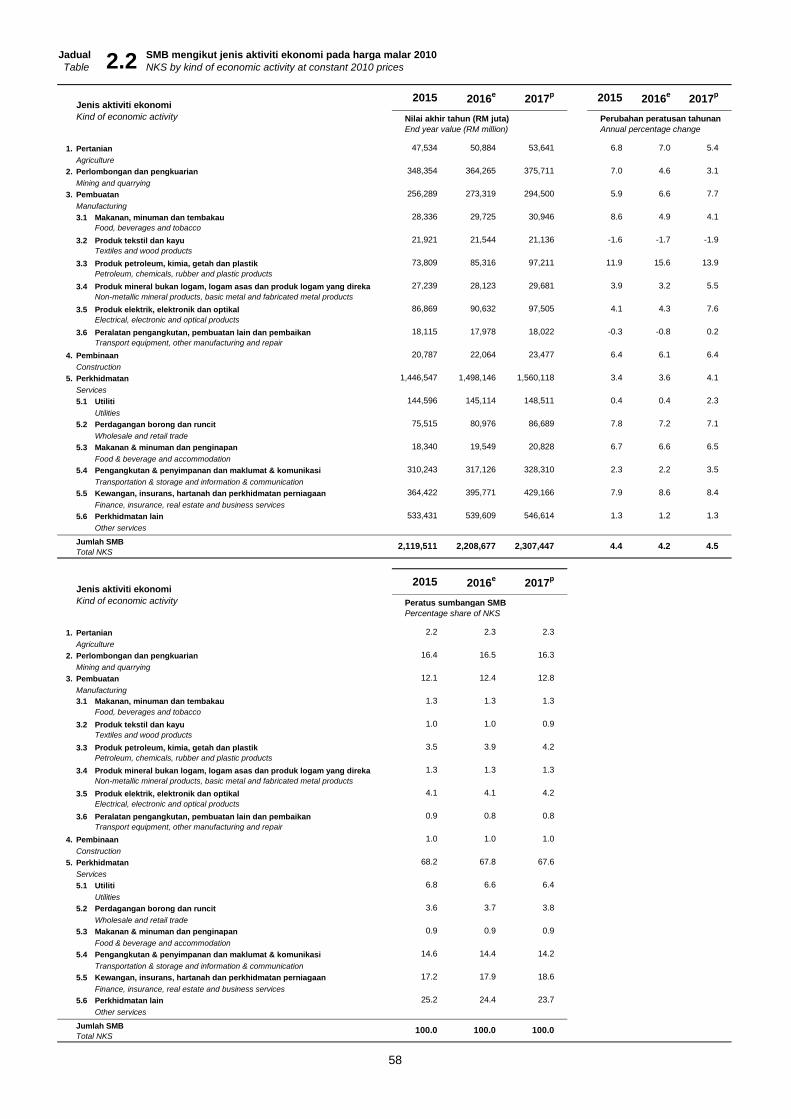
Jadual SMB mengikut jenis aktiviti ekonomi pada harga malar 2010
Table NKS by kind of economic activity at constant 2010 prices
Jenis aktiviti ekonomi
Kind of economic activity Nilai akhir tahun (RM juta) Perubahan peratusan tahunan
End year value (RM million) Annual percentage change
1. Pertanian 47,534 50,884 53,641 6.8 7.0 5.4
Agriculture
2. Perlombongan dan pengkuarian 348,354 364,265 375,711 7.0 4.6 3.1
Mining and quarrying
3. Pembuatan 256,289 273,319 294,500 5.9 6.6 7.7
Manufacturing
3.1 Makanan, minuman dan tembakau 28,336 29,725 30,946 8.6 4.9 4.1
Food, beverages and tobacco
3.2 Produk tekstil dan kayu 21,921 21,544 21,136 -1.6 -1.7 -1.9
Textiles and wood products
3.3 Produk petroleum, kimia, getah dan plastik 73,809 85,316 97,211 11.9 15.6 13.9
Petroleum, chemicals, rubber and plastic products
3.4 Produk mineral bukan logam, logam asas dan produk logam yang direka 27,239 28,123 29,681 3.9 3.2 5.5
Non-metallic mineral products, basic metal and fabricated metal products
3.5 Produk elektrik, elektronik dan optikal 86,869 90,632 97,505 4.1 4.3 7.6
Electrical, electronic and optical products
3.6 Peralatan pengangkutan, pembuatan lain dan pembaikan 18,115 17,978 18,022 -0.3 -0.8 0.2
Transport equipment, other manufacturing and repair
4. Pembinaan 20,787 22,064 23,477 6.4 6.1 6.4
Construction
5. Perkhidmatan 1,446,547 1,498,146 1,560,118 3.4 3.6 4.1
Services
5.1 Utiliti 144,596 145,114 148,511 0.4 0.4 2.3
Utilities
5.2 Perdagangan borong dan runcit 75,515 80,976 86,689 7.8 7.2 7.1
Wholesale and retail trade
5.3 Makanan & minuman dan penginapan 18,340 19,549 20,828 6.7 6.6 6.5
Food & beverage and accommodation
5.4 Pengangkutan & penyimpanan dan maklumat & komunikasi 310,243 317,126 328,310 2.3 2.2 3.5
Transportation & storage and information & communication
5.5 Kewangan, insurans, hartanah dan perkhidmatan perniagaan 364,422 395,771 429,166 7.9 8.6 8.4
Finance, insurance, real estate and business services
5.6 Perkhidmatan lain 533,431 539,609 546,614 1.3 1.2 1.3
Other services
Jumlah SMB
Total NKS
Jenis aktiviti ekonomi
Kind of economic activity Peratus sumbangan SMB
Percentage share of NKS
1. Pertanian 2.2 2.3 2.3
Agriculture
2. Perlombongan dan pengkuarian 16.4 16.5 16.3
Mining and quarrying
3. Pembuatan 12.1 12.4 12.8
Manufacturing
3.1 Makanan, minuman dan tembakau 1.3 1.3 1.3
Food, beverages and tobacco
3.2 Produk tekstil dan kayu 1.0 1.0 0.9
Textiles and wood products
3.3 Produk petroleum, kimia, getah dan plastik 3.5 3.9 4.2
Petroleum, chemicals, rubber and plastic products
3.4 Produk mineral bukan logam, logam asas dan produk logam yang direka 1.3 1.3 1.3
Non-metallic mineral products, basic metal and fabricated metal products
3.5 Produk elektrik, elektronik dan optikal 4.1 4.1 4.2
Electrical, electronic and optical products
3.6 Peralatan pengangkutan, pembuatan lain dan pembaikan 0.9 0.8 0.8
Transport equipment, other manufacturing and repair
4. Pembinaan 1.0 1.0 1.0
Construction
5. Perkhidmatan 68.2 67.8 67.6
Services
5.1 Utiliti 6.8 6.6 6.4
Utilities
5.2 Perdagangan borong dan runcit 3.6 3.7 3.8
Wholesale and retail trade
5.3 Makanan & minuman dan penginapan 0.9 0.9 0.9
Food & beverage and accommodation
5.4 Pengangkutan & penyimpanan dan maklumat & komunikasi 14.6 14.4 14.2
Transportation & storage and information & communication
5.5 Kewangan, insurans, hartanah dan perkhidmatan perniagaan 17.2 17.9 18.6
Finance, insurance, real estate and business services
5.6 Perkhidmatan lain 25.2 24.4 23.7
Other services
Jumlah SMB
Total NKS
2015 2016e
2017p
100.0 100.0 100.0
2,119,511 2,208,677 2,307,447
2.2
2015 2016e
2017p
2017p
4.54.4 4.2
2015 2016e
58

Jadual SMB mengikut jenis aktiviti ekonomi dan jenis aset pada harga semasaTable NKS by kind of economic activity and type of assets at current prices
Struktur
Structure
Jentera dan
peralatan
Machinery and
equipment
Aset lain
Other assets
Jumlah
Total
1. Pertanian 22,804 7,495 27,359 57,658
Agriculture
2. Perlombongan dan pengkuarian 10,590 50,087 439,610 500,287
Mining and quarrying
3. Pembuatan 156,762 107,701 32,256 296,719
Manufacturing
3.1 Makanan, minuman dan tembakau 16,001 14,574 1,856 32,431
Food, beverages and tobacco
3.2 Produk tekstil dan kayu 17,673 7,425 1,028 26,126
Textiles and wood products
3.3 Produk petroleum, kimia, getah dan plastik 45,323 33,653 6,278 85,255
Petroleum, chemicals, rubber and plastic products
3.4 Produk mineral bukan logam, logam asas dan produk logam yang direka 17,025 12,714 1,766 31,506
Non-metallic mineral products, basic metal and fabricated metal products
3.5 Produk elektrik, elektronik dan optikal 49,367 32,761 18,206 100,333
Electrical, electronic and optical products
3.6 Peralatan pengangkutan, pembuatan lain dan pembaikan 11,373 6,574 3,121 21,068
Transport equipment, other manufacturing and repair
4. Pembinaan 12,381 10,501 1,088 23,970
Construction
5. Perkhidmatan 1,548,142 176,379 87,866 1,812,387
Services
5.1 Utiliti 140,620 28,936 10,915 180,472
Utilities
5.2 Perdagangan borong dan runcit 74,018 12,852 7,571 94,442
Wholesale and retail trade
5.3 Makanan & minuman dan penginapan 15,989 5,325 851 22,165
Food & beverage and accommodation
5.4 Pengangkutan & penyimpanan dan maklumat & komunikasi 272,131 90,547 16,909 379,587
Transportation & storage and information & communication
5.5 Kewangan, insurans, hartanah dan perkhidmatan perniagaan 421,545 16,020 25,162 462,727
Finance, insurance, real estate and business services
5.6 Perkhidmatan lain 623,839 22,698 26,457 672,994
Other services
Jumlah SMB
Total NKS
Struktur
Structure
Jentera dan
peralatan
Machinery and
equipment
Aset lain
Other assets
Jumlah
Total
1. Pertanian 8.3 13.3 8.3 8.9
Agriculture
2. Perlombongan dan pengkuarian 21.3 6.4 9.7 9.6
Mining and quarrying
3. Pembuatan 9.5 6.4 4.1 7.8
Manufacturing
3.1 Makanan, minuman dan tembakau 6.6 12.6 23.9 10.1
Food, beverages and tobacco
3.2 Produk tekstil dan kayu 1.2 -1.5 7.1 0.6
Textiles and wood products
3.3 Produk petroleum, kimia, getah dan plastik 19.4 9.3 8.1 14.4
Petroleum, chemicals, rubber and plastic products
3.4 Produk mineral bukan logam, logam asas dan produk logam yang direka 3.6 7.7 11.8 5.6
Non-metallic mineral products, basic metal and fabricated metal products
3.5 Produk elektrik, elektronik dan optikal 9.0 3.5 2.1 5.9
Electrical, electronic and optical products
3.6 Peralatan pengangkutan, pembuatan lain dan pembaikan 3.7 0.9 -5.4 1.4
Transport equipment, other manufacturing and repair
4. Pembinaan 7.0 10.0 0.0 8.0
Construction
5. Perkhidmatan 6.8 1.6 3.8 6.2
Services
5.1 Utiliti 3.8 -1.2 10.6 3.4
Utilities
5.2 Perdagangan borong dan runcit 12.9 5.4 -6.1 10.1
Wholesale and retail trade
5.3 Makanan & minuman dan penginapan 7.4 14.7 0.8 8.8
Food & beverage and accommodation
5.4 Pengangkutan & penyimpanan dan maklumat & komunikasi 6.8 -1.2 7.1 4.8
Transportation & storage and information & communication
5.5 Kewangan, insurans, hartanah dan perkhidmatan perniagaan 10.6 18.5 8.0 10.7
Finance, insurance, real estate and business services
5.6 Perkhidmatan lain 4.4 1.6 -1.1 4.1
Other services
Jumlah SMB
Total NKS
Perubahan peratusan tahunan
Annual percentage change
7.2 4.2 8.4 7.0
2,691,020
2.3
Nilai akhir tahun (RM juta)
End year value (RM million)
1,750,679 352,163 588,179
2015
59

Jadual SMB mengikut jenis aktiviti ekonomi dan jenis aset pada harga semasaTable NKS by kind of economic activity and type of assets at current prices 2.3
Struktur
Structure
Jentera dan
peralatan
Machinery and
equipment
Aset lain
Other assets
Jumlah
Total
1. Pertanian 1.3 2.1 4.7 2.1
Agriculture
2. Perlombongan dan pengkuarian 0.6 14.2 74.7 18.6
Mining and quarrying
3. Pembuatan 9.0 30.6 5.5 11.0
Manufacturing
3.1 Makanan, minuman dan tembakau 0.9 4.1 0.3 1.2
Food, beverages and tobacco
3.2 Produk tekstil dan kayu 1.0 2.1 0.2 1.0
Textiles and wood products
3.3 Produk petroleum, kimia, getah dan plastik 2.6 9.6 1.1 3.2
Petroleum, chemicals, rubber and plastic products
3.4 Produk mineral bukan logam, logam asas dan produk logam yang direka 1.0 3.6 0.3 1.2
Non-metallic mineral products, basic metal and fabricated metal products
3.5 Produk elektrik, elektronik dan optikal 2.8 9.3 3.1 3.7
Electrical, electronic and optical products
3.6 Peralatan pengangkutan, pembuatan lain dan pembaikan 0.6 1.9 0.5 0.8
Transport equipment, other manufacturing and repair
4. Pembinaan 0.7 3.0 0.2 0.9
Construction
5. Perkhidmatan 88.4 50.1 14.9 67.3
Services
5.1 Utiliti 8.0 8.2 1.9 6.7
Utilities
5.2 Perdagangan borong dan runcit 4.2 3.6 1.3 3.5
Wholesale and retail trade
5.3 Makanan & minuman dan penginapan 0.9 1.5 0.1 0.8
Food & beverage and accommodation
5.4 Pengangkutan & penyimpanan dan maklumat & komunikasi 15.5 25.7 2.9 14.1
Transportation & storage and information & communication
5.5 Kewangan, insurans, hartanah dan perkhidmatan perniagaan 24.1 4.5 4.3 17.2
Finance, insurance, real estate and business services
5.6 Perkhidmatan lain 35.6 6.4 4.5 25.0
Other services
Jumlah SMB
Total NKS
Struktur
Structure
Jentera dan
peralatan
Machinery and
equipment
Aset lain
Other assets
Jumlah
Total
1. Pertanian 39.6 13.0 47.5 100.0
Agriculture
2. Perlombongan dan pengkuarian 2.1 10.0 87.9 100.0
Mining and quarrying
3. Pembuatan 52.8 36.3 10.9 100.0
Manufacturing
3.1 Makanan, minuman dan tembakau 49.3 44.9 5.7 100.0
Food, beverages and tobacco
3.2 Produk tekstil dan kayu 67.6 28.4 3.9 100.0
Textiles and wood products
3.3 Produk petroleum, kimia, getah dan plastik 53.2 39.5 7.4 100.0
Petroleum, chemicals, rubber and plastic products
3.4 Produk mineral bukan logam, logam asas dan produk logam yang direka 54.0 40.4 5.6 100.0
Non-metallic mineral products, basic metal and fabricated metal products
3.5 Produk elektrik, elektronik dan optikal 49.2 32.7 18.1 100.0
Electrical, electronic and optical products
3.6 Peralatan pengangkutan, pembuatan lain dan pembaikan 54.0 31.2 14.8 100.0
Transport equipment, other manufacturing and repair
4. Pembinaan 51.7 43.8 4.5 100.0
Construction
5. Perkhidmatan 85.4 9.7 4.8 100.0
Services
5.1 Utiliti 77.9 16.0 6.0 100.0
Utilities
5.2 Perdagangan borong dan runcit 78.4 13.6 8.0 100.0
Wholesale and retail trade
5.3 Makanan & minuman dan penginapan 72.1 24.0 3.8 100.0
Food & beverage and accommodation
5.4 Pengangkutan & penyimpanan dan maklumat & komunikasi 71.7 23.9 4.5 100.0
Transportation & storage and information & communication
5.5 Kewangan, insurans, hartanah dan perkhidmatan perniagaan 91.1 3.5 5.4 100.0
Finance, insurance, real estate and business services
5.6 Perkhidmatan lain 92.7 3.4 3.9 100.0
Other services
Jumlah SMB
Total NKS65.1 13.1 21.9 100.0
Peratus sumbangan mengikut jenis aktiviti ekonomi
Percentage share by kind of economic activity
100.0 100.0 100.0 100.0
Peratus sumbangan mengikut jenis aset
Percentage share by type of assets
2015
60

Jadual SMB mengikut jenis aktiviti ekonomi dan jenis aset pada harga semasaTable NKS by kind of economic activity and type of assets at current prices
Struktur
Structure
Jentera dan
peralatan
Machinery and
equipment
Aset lain
Other assets
Jumlah
Total
1. Pertanian 24,690 8,433 26,386 59,509
Agriculture
2. Perlombongan dan pengkuarian 12,464 49,910 463,891 526,266
Mining and quarrying
3. Pembuatan 172,757 116,392 34,055 323,204
Manufacturing
3.1 Makanan, minuman dan tembakau 16,851 15,634 2,169 34,654
Food, beverages and tobacco
3.2 Produk tekstil dan kayu 17,805 7,363 1,096 26,264
Textiles and wood products
3.3 Produk petroleum, kimia, getah dan plastik 55,307 38,543 6,981 100,832
Petroleum, chemicals, rubber and plastic products
3.4 Produk mineral bukan logam, logam asas dan produk logam yang direka 17,522 13,680 1,956 33,158
Non-metallic mineral products, basic metal and fabricated metal products
3.5 Produk elektrik, elektronik dan optikal 53,548 34,544 18,831 106,924
Electrical, electronic and optical products
3.6 Peralatan pengangkutan, pembuatan lain dan pembaikan 11,724 6,627 3,021 21,372
Transport equipment, other manufacturing and repair
4. Pembinaan 13,198 11,647 1,109 25,954
Construction
5. Perkhidmatan 1,658,174 179,698 86,490 1,924,362
Services
5.1 Utiliti 145,724 28,786 9,677 184,187
Utilities
5.2 Perdagangan borong dan runcit 82,770 13,736 7,407 103,913
Wholesale and retail trade
5.3 Makanan & minuman dan penginapan 17,205 5,988 846 24,039
Food & beverage and accommodation
5.4 Pengangkutan & penyimpanan dan maklumat & komunikasi 291,766 90,017 15,341 397,124
Transportation & storage and information & communication
5.5 Kewangan, insurans, hartanah dan perkhidmatan perniagaan 470,608 18,026 27,268 515,903
Finance, insurance, real estate and business services
5.6 Perkhidmatan lain 650,102 23,144 25,950 699,196
Other services
Jumlah SMB
Total NKS
Struktur
Structure
Jentera dan
peralatan
Machinery and
equipment
Aset lain
Other assets
Jumlah
Total
1. Pertanian 8.3 12.5 -3.6 3.2
Agriculture
2. Perlombongan dan pengkuarian 17.7 -0.4 5.5 5.2
Mining and quarrying
3. Pembuatan 10.2 8.1 5.6 8.9
Manufacturing
3.1 Makanan, minuman dan tembakau 5.3 7.3 16.8 6.9
Food, beverages and tobacco
3.2 Produk tekstil dan kayu 0.7 -0.8 6.6 0.5
Textiles and wood products
3.3 Produk petroleum, kimia, getah dan plastik 22.0 14.5 11.2 18.3
Petroleum, chemicals, rubber and plastic products
3.4 Produk mineral bukan logam, logam asas dan produk logam yang direka 2.9 7.6 10.8 5.2
Non-metallic mineral products, basic metal and fabricated metal products
3.5 Produk elektrik, elektronik dan optikal 8.5 5.4 3.4 6.6
Electrical, electronic and optical products
3.6 Peralatan pengangkutan, pembuatan lain dan pembaikan 3.1 0.8 -3.2 1.4
Transport equipment, other manufacturing and repair
4. Pembinaan 6.6 10.9 2.0 8.3
Construction
5. Perkhidmatan 7.1 1.9 -1.6 6.2
Services
5.1 Utiliti 3.6 -0.5 -11.3 2.1
Utilities
5.2 Perdagangan borong dan runcit 11.8 6.9 -2.2 10.0
Wholesale and retail trade
5.3 Makanan & minuman dan penginapan 7.6 12.5 -0.6 8.5
Food & beverage and accommodation
5.4 Pengangkutan & penyimpanan dan maklumat & komunikasi 7.2 -0.6 -9.3 4.6
Transportation & storage and information & communication
5.5 Kewangan, insurans, hartanah dan perkhidmatan perniagaan 11.6 12.5 8.4 11.5
Finance, insurance, real estate and business services
5.6 Perkhidmatan lain 4.2 2.0 -1.9 3.9
Other services
Jumlah SMB
Total NKS
Perubahan peratusan tahunan
Annual percentage change
7.5 4.0 4.0 6.3
2,859,295
2.3
Nilai akhir tahun (RM juta)
End year value (RM million)
1,881,283 366,080 611,932
2016
61
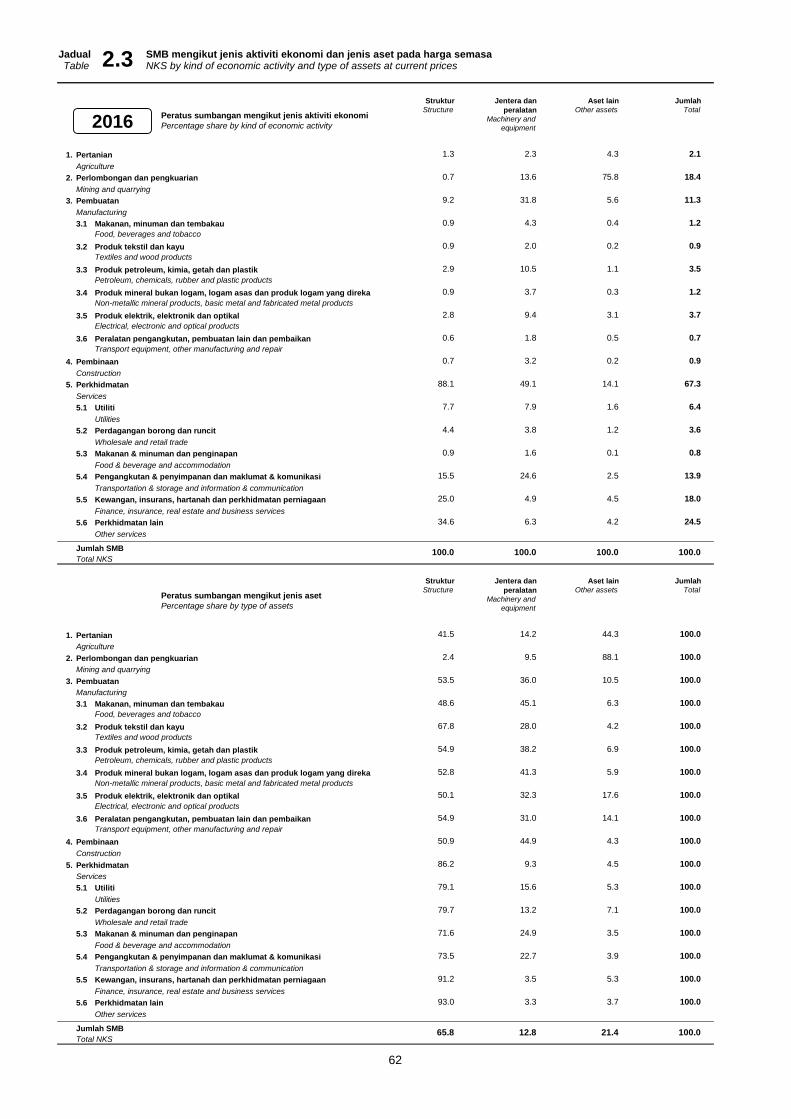
Jadual SMB mengikut jenis aktiviti ekonomi dan jenis aset pada harga semasaTable NKS by kind of economic activity and type of assets at current prices 2.3
Struktur
Structure
Jentera dan
peralatan
Machinery and
equipment
Aset lain
Other assets
Jumlah
Total
1. Pertanian 1.3 2.3 4.3 2.1
Agriculture
2. Perlombongan dan pengkuarian 0.7 13.6 75.8 18.4
Mining and quarrying
3. Pembuatan 9.2 31.8 5.6 11.3
Manufacturing
3.1 Makanan, minuman dan tembakau 0.9 4.3 0.4 1.2
Food, beverages and tobacco
3.2 Produk tekstil dan kayu 0.9 2.0 0.2 0.9
Textiles and wood products
3.3 Produk petroleum, kimia, getah dan plastik 2.9 10.5 1.1 3.5
Petroleum, chemicals, rubber and plastic products
3.4 Produk mineral bukan logam, logam asas dan produk logam yang direka 0.9 3.7 0.3 1.2
Non-metallic mineral products, basic metal and fabricated metal products
3.5 Produk elektrik, elektronik dan optikal 2.8 9.4 3.1 3.7
Electrical, electronic and optical products
3.6 Peralatan pengangkutan, pembuatan lain dan pembaikan 0.6 1.8 0.5 0.7
Transport equipment, other manufacturing and repair
4. Pembinaan 0.7 3.2 0.2 0.9
Construction
5. Perkhidmatan 88.1 49.1 14.1 67.3
Services
5.1 Utiliti 7.7 7.9 1.6 6.4
Utilities
5.2 Perdagangan borong dan runcit 4.4 3.8 1.2 3.6
Wholesale and retail trade
5.3 Makanan & minuman dan penginapan 0.9 1.6 0.1 0.8
Food & beverage and accommodation
5.4 Pengangkutan & penyimpanan dan maklumat & komunikasi 15.5 24.6 2.5 13.9
Transportation & storage and information & communication
5.5 Kewangan, insurans, hartanah dan perkhidmatan perniagaan 25.0 4.9 4.5 18.0
Finance, insurance, real estate and business services
5.6 Perkhidmatan lain 34.6 6.3 4.2 24.5
Other services
Jumlah SMB
Total NKS
Struktur
Structure
Jentera dan
peralatan
Machinery and
equipment
Aset lain
Other assets
Jumlah
Total
1. Pertanian 41.5 14.2 44.3 100.0
Agriculture
2. Perlombongan dan pengkuarian 2.4 9.5 88.1 100.0
Mining and quarrying
3. Pembuatan 53.5 36.0 10.5 100.0
Manufacturing
3.1 Makanan, minuman dan tembakau 48.6 45.1 6.3 100.0
Food, beverages and tobacco
3.2 Produk tekstil dan kayu 67.8 28.0 4.2 100.0
Textiles and wood products
3.3 Produk petroleum, kimia, getah dan plastik 54.9 38.2 6.9 100.0
Petroleum, chemicals, rubber and plastic products
3.4 Produk mineral bukan logam, logam asas dan produk logam yang direka 52.8 41.3 5.9 100.0
Non-metallic mineral products, basic metal and fabricated metal products
3.5 Produk elektrik, elektronik dan optikal 50.1 32.3 17.6 100.0
Electrical, electronic and optical products
3.6 Peralatan pengangkutan, pembuatan lain dan pembaikan 54.9 31.0 14.1 100.0
Transport equipment, other manufacturing and repair
4. Pembinaan 50.9 44.9 4.3 100.0
Construction
5. Perkhidmatan 86.2 9.3 4.5 100.0
Services
5.1 Utiliti 79.1 15.6 5.3 100.0
Utilities
5.2 Perdagangan borong dan runcit 79.7 13.2 7.1 100.0
Wholesale and retail trade
5.3 Makanan & minuman dan penginapan 71.6 24.9 3.5 100.0
Food & beverage and accommodation
5.4 Pengangkutan & penyimpanan dan maklumat & komunikasi 73.5 22.7 3.9 100.0
Transportation & storage and information & communication
5.5 Kewangan, insurans, hartanah dan perkhidmatan perniagaan 91.2 3.5 5.3 100.0
Finance, insurance, real estate and business services
5.6 Perkhidmatan lain 93.0 3.3 3.7 100.0
Other services
Jumlah SMB
Total NKS65.8 12.8 21.4 100.0
100.0 100.0 100.0 100.0
Peratus sumbangan mengikut jenis aset
Percentage share by type of assets
Peratus sumbangan mengikut jenis aktiviti ekonomi
Percentage share by kind of economic activity2016
62
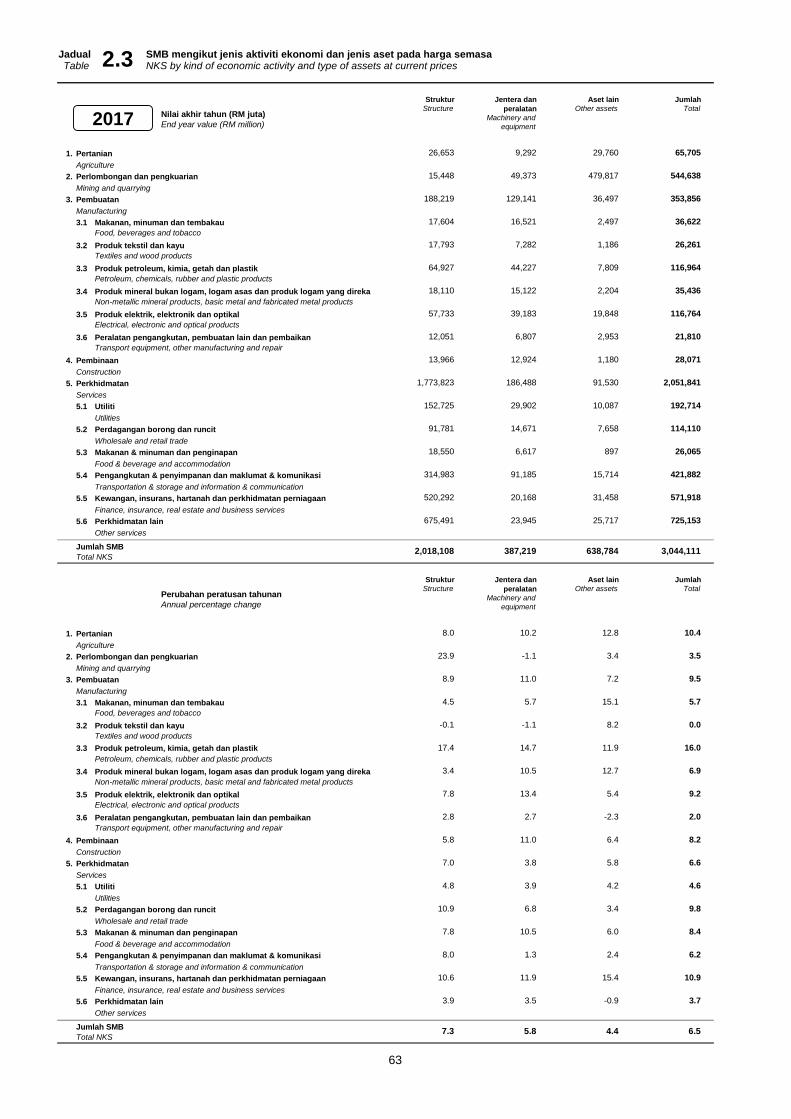
Jadual SMB mengikut jenis aktiviti ekonomi dan jenis aset pada harga semasaTable NKS by kind of economic activity and type of assets at current prices
Struktur
Structure
Jentera dan
peralatan
Machinery and
equipment
Aset lain
Other assets
Jumlah
Total
1. Pertanian 26,653 9,292 29,760 65,705
Agriculture
2. Perlombongan dan pengkuarian 15,448 49,373 479,817 544,638
Mining and quarrying
3. Pembuatan 188,219 129,141 36,497 353,856
Manufacturing
3.1 Makanan, minuman dan tembakau 17,604 16,521 2,497 36,622
Food, beverages and tobacco
3.2 Produk tekstil dan kayu 17,793 7,282 1,186 26,261
Textiles and wood products
3.3 Produk petroleum, kimia, getah dan plastik 64,927 44,227 7,809 116,964
Petroleum, chemicals, rubber and plastic products
3.4 Produk mineral bukan logam, logam asas dan produk logam yang direka 18,110 15,122 2,204 35,436
Non-metallic mineral products, basic metal and fabricated metal products
3.5 Produk elektrik, elektronik dan optikal 57,733 39,183 19,848 116,764
Electrical, electronic and optical products
3.6 Peralatan pengangkutan, pembuatan lain dan pembaikan 12,051 6,807 2,953 21,810
Transport equipment, other manufacturing and repair
4. Pembinaan 13,966 12,924 1,180 28,071
Construction
5. Perkhidmatan 1,773,823 186,488 91,530 2,051,841
Services
5.1 Utiliti 152,725 29,902 10,087 192,714
Utilities
5.2 Perdagangan borong dan runcit 91,781 14,671 7,658 114,110
Wholesale and retail trade
5.3 Makanan & minuman dan penginapan 18,550 6,617 897 26,065
Food & beverage and accommodation
5.4 Pengangkutan & penyimpanan dan maklumat & komunikasi 314,983 91,185 15,714 421,882
Transportation & storage and information & communication
5.5 Kewangan, insurans, hartanah dan perkhidmatan perniagaan 520,292 20,168 31,458 571,918
Finance, insurance, real estate and business services
5.6 Perkhidmatan lain 675,491 23,945 25,717 725,153
Other services
Jumlah SMB
Total NKS
Struktur
Structure
Jentera dan
peralatan
Machinery and
equipment
Aset lain
Other assets
Jumlah
Total
1. Pertanian 8.0 10.2 12.8 10.4
Agriculture
2. Perlombongan dan pengkuarian 23.9 -1.1 3.4 3.5
Mining and quarrying
3. Pembuatan 8.9 11.0 7.2 9.5
Manufacturing
3.1 Makanan, minuman dan tembakau 4.5 5.7 15.1 5.7
Food, beverages and tobacco
3.2 Produk tekstil dan kayu -0.1 -1.1 8.2 0.0
Textiles and wood products
3.3 Produk petroleum, kimia, getah dan plastik 17.4 14.7 11.9 16.0
Petroleum, chemicals, rubber and plastic products
3.4 Produk mineral bukan logam, logam asas dan produk logam yang direka 3.4 10.5 12.7 6.9
Non-metallic mineral products, basic metal and fabricated metal products
3.5 Produk elektrik, elektronik dan optikal 7.8 13.4 5.4 9.2
Electrical, electronic and optical products
3.6 Peralatan pengangkutan, pembuatan lain dan pembaikan 2.8 2.7 -2.3 2.0
Transport equipment, other manufacturing and repair
4. Pembinaan 5.8 11.0 6.4 8.2
Construction
5. Perkhidmatan 7.0 3.8 5.8 6.6
Services
5.1 Utiliti 4.8 3.9 4.2 4.6
Utilities
5.2 Perdagangan borong dan runcit 10.9 6.8 3.4 9.8
Wholesale and retail trade
5.3 Makanan & minuman dan penginapan 7.8 10.5 6.0 8.4
Food & beverage and accommodation
5.4 Pengangkutan & penyimpanan dan maklumat & komunikasi 8.0 1.3 2.4 6.2
Transportation & storage and information & communication
5.5 Kewangan, insurans, hartanah dan perkhidmatan perniagaan 10.6 11.9 15.4 10.9
Finance, insurance, real estate and business services
5.6 Perkhidmatan lain 3.9 3.5 -0.9 3.7
Other services
Jumlah SMB
Total NKS
638,784 3,044,111
Perubahan peratusan tahunan
Annual percentage change
7.3 5.8 4.4 6.5
2.3
Nilai akhir tahun (RM juta)
End year value (RM million)
2,018,108 387,219
2017
63

Jadual SMB mengikut jenis aktiviti ekonomi dan jenis aset pada harga semasaTable NKS by kind of economic activity and type of assets at current prices 2.3
Struktur
Structure
Jentera dan
peralatan
Machinery and
equipment
Aset lain
Other assets
Jumlah
Total
1. Pertanian 1.3 2.4 4.7 2.2
Agriculture
2. Perlombongan dan pengkuarian 0.8 12.8 75.1 17.9
Mining and quarrying
3. Pembuatan 9.3 33.4 5.7 11.6
Manufacturing
3.1 Makanan, minuman dan tembakau 0.9 4.3 0.4 1.2
Food, beverages and tobacco
3.2 Produk tekstil dan kayu 0.9 1.9 0.2 0.9
Textiles and wood products
3.3 Produk petroleum, kimia, getah dan plastik 3.2 11.4 1.2 3.8
Petroleum, chemicals, rubber and plastic products
3.4 Produk mineral bukan logam, logam asas dan produk logam yang direka 0.9 3.9 0.3 1.2
Non-metallic mineral products, basic metal and fabricated metal products
3.5 Produk elektrik, elektronik dan optikal 2.9 10.1 3.1 3.8
Electrical, electronic and optical products
3.6 Peralatan pengangkutan, pembuatan lain dan pembaikan 0.6 1.8 0.5 0.7
Transport equipment, other manufacturing and repair
4. Pembinaan 0.7 3.3 0.2 0.9
Construction
5. Perkhidmatan 87.9 48.2 14.3 67.4
Services
5.1 Utiliti 7.6 7.7 1.6 6.3
Utilities
5.2 Perdagangan borong dan runcit 4.5 3.8 1.2 3.7
Wholesale and retail trade
5.3 Makanan & minuman dan penginapan 0.9 1.7 0.1 0.9
Food & beverage and accommodation
5.4 Pengangkutan & penyimpanan dan maklumat & komunikasi 15.6 23.5 2.5 13.9
Transportation & storage and information & communication
5.5 Kewangan, insurans, hartanah dan perkhidmatan perniagaan 25.8 5.2 4.9 18.8
Finance, insurance, real estate and business services
5.6 Perkhidmatan lain 33.5 6.2 4.0 23.8
Other services
Jumlah SMB
Total NKS
Struktur
Structure
Jentera dan
peralatan
Machinery and
equipment
Aset lain
Other assets
Jumlah
Total
1. Pertanian 40.6 14.1 45.3 100.0
Agriculture
2. Perlombongan dan pengkuarian 2.8 9.1 88.1 100.0
Mining and quarrying
3. Pembuatan 53.2 36.5 10.3 100.0
Manufacturing
3.1 Makanan, minuman dan tembakau 48.1 45.1 6.8 100.0
Food, beverages and tobacco
3.2 Produk tekstil dan kayu 67.8 27.7 4.5 100.0
Textiles and wood products
3.3 Produk petroleum, kimia, getah dan plastik 55.5 37.8 6.7 100.0
Petroleum, chemicals, rubber and plastic products
3.4 Produk mineral bukan logam, logam asas dan produk logam yang direka 51.1 42.7 6.2 100.0
Non-metallic mineral products, basic metal and fabricated metal products
3.5 Produk elektrik, elektronik dan optikal 49.4 33.6 17.0 100.0
Electrical, electronic and optical products
3.6 Peralatan pengangkutan, pembuatan lain dan pembaikan 55.3 31.2 13.5 100.0
Transport equipment, other manufacturing and repair
4. Pembinaan 49.8 46.0 4.2 100.0
Construction
5. Perkhidmatan 86.5 9.1 4.5 100.0
Services
5.1 Utiliti 79.2 15.5 5.2 100.0
Utilities
5.2 Perdagangan borong dan runcit 80.4 12.9 6.7 100.0
Wholesale and retail trade
5.3 Makanan & minuman dan penginapan 71.2 25.4 3.4 100.0
Food & beverage and accommodation
5.4 Pengangkutan & penyimpanan dan maklumat & komunikasi 74.7 21.6 3.7 100.0
Transportation & storage and information & communication
5.5 Kewangan, insurans, hartanah dan perkhidmatan perniagaan 91.0 3.5 5.5 100.0
Finance, insurance, real estate and business services
5.6 Perkhidmatan lain 93.2 3.3 3.5 100.0
Other services
Jumlah SMB
Total NKS
100.0
Peratus sumbangan mengikut jenis aset
Percentage share by type of assets
66.3 12.7 21.0 100.0
100.0
Peratus sumbangan mengikut jenis aktiviti ekonomi
Percentage share by kind of economic activity
100.0 100.0
2017
64
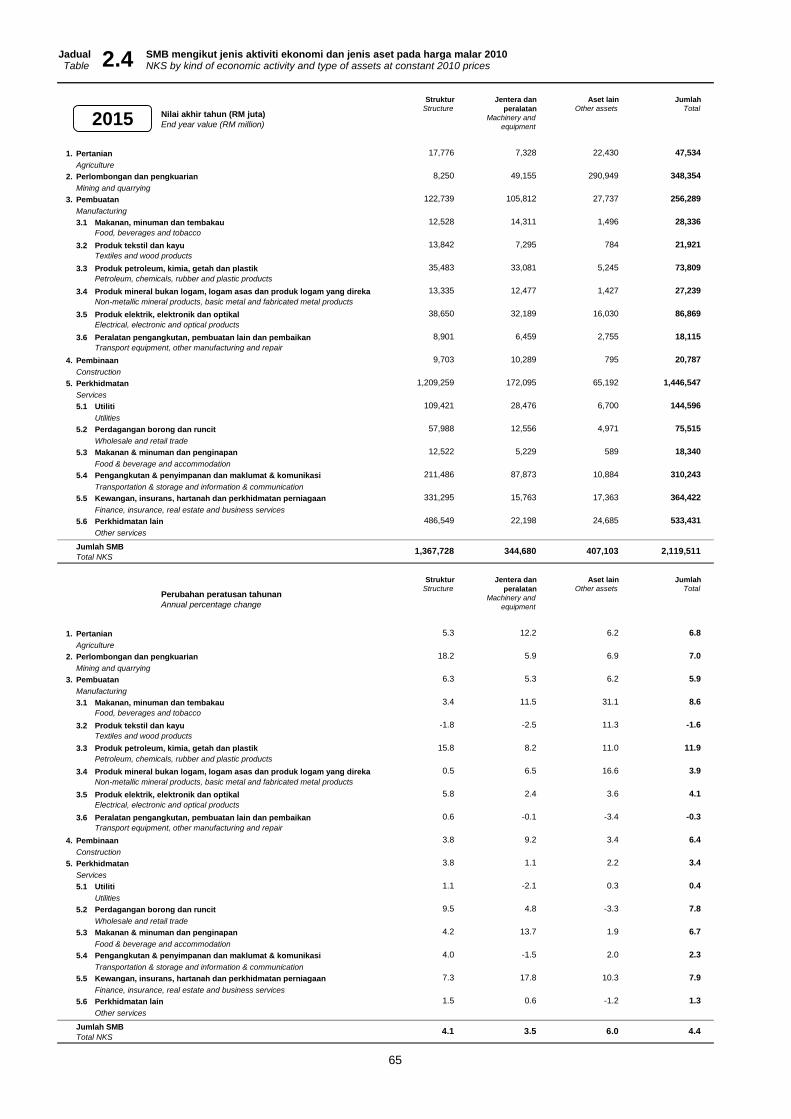
Jadual SMB mengikut jenis aktiviti ekonomi dan jenis aset pada harga malar 2010 Table NKS by kind of economic activity and type of assets at constant 2010 prices
Struktur
Structure
Jentera dan
peralatan
Machinery and
equipment
Aset lain
Other assets
Jumlah
Total
1. Pertanian 17,776 7,328 22,430 47,534
Agriculture
2. Perlombongan dan pengkuarian 8,250 49,155 290,949 348,354
Mining and quarrying
3. Pembuatan 122,739 105,812 27,737 256,289
Manufacturing
3.1 Makanan, minuman dan tembakau 12,528 14,311 1,496 28,336
Food, beverages and tobacco
3.2 Produk tekstil dan kayu 13,842 7,295 784 21,921
Textiles and wood products
3.3 Produk petroleum, kimia, getah dan plastik 35,483 33,081 5,245 73,809
Petroleum, chemicals, rubber and plastic products
3.4 Produk mineral bukan logam, logam asas dan produk logam yang direka 13,335 12,477 1,427 27,239
Non-metallic mineral products, basic metal and fabricated metal products
3.5 Produk elektrik, elektronik dan optikal 38,650 32,189 16,030 86,869
Electrical, electronic and optical products
3.6 Peralatan pengangkutan, pembuatan lain dan pembaikan 8,901 6,459 2,755 18,115
Transport equipment, other manufacturing and repair
4. Pembinaan 9,703 10,289 795 20,787
Construction
5. Perkhidmatan 1,209,259 172,095 65,192 1,446,547
Services
5.1 Utiliti 109,421 28,476 6,700 144,596
Utilities
5.2 Perdagangan borong dan runcit 57,988 12,556 4,971 75,515
Wholesale and retail trade
5.3 Makanan & minuman dan penginapan 12,522 5,229 589 18,340
Food & beverage and accommodation
5.4 Pengangkutan & penyimpanan dan maklumat & komunikasi 211,486 87,873 10,884 310,243
Transportation & storage and information & communication
5.5 Kewangan, insurans, hartanah dan perkhidmatan perniagaan 331,295 15,763 17,363 364,422
Finance, insurance, real estate and business services
5.6 Perkhidmatan lain 486,549 22,198 24,685 533,431
Other services
Jumlah SMB
Total NKS
Struktur
Structure
Jentera dan
peralatan
Machinery and
equipment
Aset lain
Other assets
Jumlah
Total
1. Pertanian 5.3 12.2 6.2 6.8
Agriculture
2. Perlombongan dan pengkuarian 18.2 5.9 6.9 7.0
Mining and quarrying
3. Pembuatan 6.3 5.3 6.2 5.9
Manufacturing
3.1 Makanan, minuman dan tembakau 3.4 11.5 31.1 8.6
Food, beverages and tobacco
3.2 Produk tekstil dan kayu -1.8 -2.5 11.3 -1.6
Textiles and wood products
3.3 Produk petroleum, kimia, getah dan plastik 15.8 8.2 11.0 11.9
Petroleum, chemicals, rubber and plastic products
3.4 Produk mineral bukan logam, logam asas dan produk logam yang direka 0.5 6.5 16.6 3.9
Non-metallic mineral products, basic metal and fabricated metal products
3.5 Produk elektrik, elektronik dan optikal 5.8 2.4 3.6 4.1
Electrical, electronic and optical products
3.6 Peralatan pengangkutan, pembuatan lain dan pembaikan 0.6 -0.1 -3.4 -0.3
Transport equipment, other manufacturing and repair
4. Pembinaan 3.8 9.2 3.4 6.4
Construction
5. Perkhidmatan 3.8 1.1 2.2 3.4
Services
5.1 Utiliti 1.1 -2.1 0.3 0.4
Utilities
5.2 Perdagangan borong dan runcit 9.5 4.8 -3.3 7.8
Wholesale and retail trade
5.3 Makanan & minuman dan penginapan 4.2 13.7 1.9 6.7
Food & beverage and accommodation
5.4 Pengangkutan & penyimpanan dan maklumat & komunikasi 4.0 -1.5 2.0 2.3
Transportation & storage and information & communication
5.5 Kewangan, insurans, hartanah dan perkhidmatan perniagaan 7.3 17.8 10.3 7.9
Finance, insurance, real estate and business services
5.6 Perkhidmatan lain 1.5 0.6 -1.2 1.3
Other services
Jumlah SMB
Total NKS
Perubahan peratusan tahunan
Annual percentage change
4.1 3.5 6.0 4.4
2,119,511
2.4
Nilai akhir tahun (RM juta)
End year value (RM million)
1,367,728 344,680 407,103
2015
65
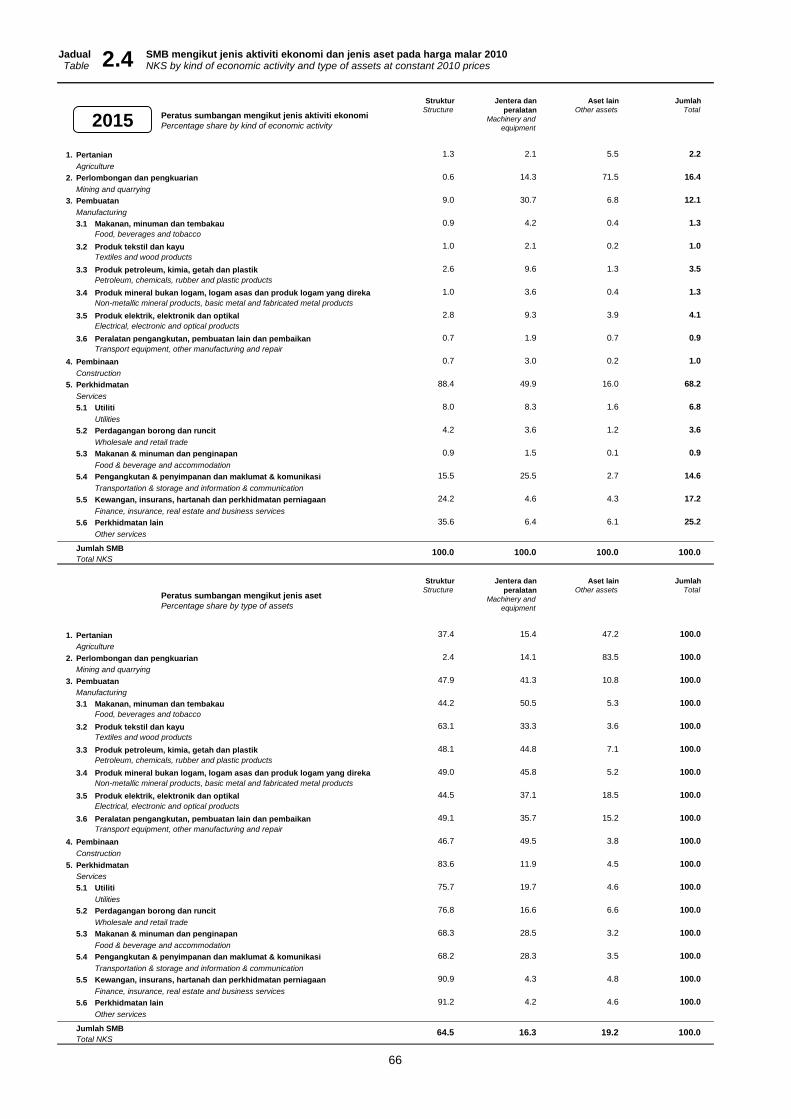
Jadual SMB mengikut jenis aktiviti ekonomi dan jenis aset pada harga malar 2010 Table NKS by kind of economic activity and type of assets at constant 2010 prices 2.4
Struktur
Structure
Jentera dan
peralatan
Machinery and
equipment
Aset lain
Other assets
Jumlah
Total
1. Pertanian 1.3 2.1 5.5 2.2
Agriculture
2. Perlombongan dan pengkuarian 0.6 14.3 71.5 16.4
Mining and quarrying
3. Pembuatan 9.0 30.7 6.8 12.1
Manufacturing
3.1 Makanan, minuman dan tembakau 0.9 4.2 0.4 1.3
Food, beverages and tobacco
3.2 Produk tekstil dan kayu 1.0 2.1 0.2 1.0
Textiles and wood products
3.3 Produk petroleum, kimia, getah dan plastik 2.6 9.6 1.3 3.5
Petroleum, chemicals, rubber and plastic products
3.4 Produk mineral bukan logam, logam asas dan produk logam yang direka 1.0 3.6 0.4 1.3
Non-metallic mineral products, basic metal and fabricated metal products
3.5 Produk elektrik, elektronik dan optikal 2.8 9.3 3.9 4.1
Electrical, electronic and optical products
3.6 Peralatan pengangkutan, pembuatan lain dan pembaikan 0.7 1.9 0.7 0.9
Transport equipment, other manufacturing and repair
4. Pembinaan 0.7 3.0 0.2 1.0
Construction
5. Perkhidmatan 88.4 49.9 16.0 68.2
Services
5.1 Utiliti 8.0 8.3 1.6 6.8
Utilities
5.2 Perdagangan borong dan runcit 4.2 3.6 1.2 3.6
Wholesale and retail trade
5.3 Makanan & minuman dan penginapan 0.9 1.5 0.1 0.9
Food & beverage and accommodation
5.4 Pengangkutan & penyimpanan dan maklumat & komunikasi 15.5 25.5 2.7 14.6
Transportation & storage and information & communication
5.5 Kewangan, insurans, hartanah dan perkhidmatan perniagaan 24.2 4.6 4.3 17.2
Finance, insurance, real estate and business services
5.6 Perkhidmatan lain 35.6 6.4 6.1 25.2
Other services
Jumlah SMB
Total NKS
Struktur
Structure
Jentera dan
peralatan
Machinery and
equipment
Aset lain
Other assets
Jumlah
Total
1. Pertanian 37.4 15.4 47.2 100.0
Agriculture
2. Perlombongan dan pengkuarian 2.4 14.1 83.5 100.0
Mining and quarrying
3. Pembuatan 47.9 41.3 10.8 100.0
Manufacturing
3.1 Makanan, minuman dan tembakau 44.2 50.5 5.3 100.0
Food, beverages and tobacco
3.2 Produk tekstil dan kayu 63.1 33.3 3.6 100.0
Textiles and wood products
3.3 Produk petroleum, kimia, getah dan plastik 48.1 44.8 7.1 100.0
Petroleum, chemicals, rubber and plastic products
3.4 Produk mineral bukan logam, logam asas dan produk logam yang direka 49.0 45.8 5.2 100.0
Non-metallic mineral products, basic metal and fabricated metal products
3.5 Produk elektrik, elektronik dan optikal 44.5 37.1 18.5 100.0
Electrical, electronic and optical products
3.6 Peralatan pengangkutan, pembuatan lain dan pembaikan 49.1 35.7 15.2 100.0
Transport equipment, other manufacturing and repair
4. Pembinaan 46.7 49.5 3.8 100.0
Construction
5. Perkhidmatan 83.6 11.9 4.5 100.0
Services
5.1 Utiliti 75.7 19.7 4.6 100.0
Utilities
5.2 Perdagangan borong dan runcit 76.8 16.6 6.6 100.0
Wholesale and retail trade
5.3 Makanan & minuman dan penginapan 68.3 28.5 3.2 100.0
Food & beverage and accommodation
5.4 Pengangkutan & penyimpanan dan maklumat & komunikasi 68.2 28.3 3.5 100.0
Transportation & storage and information & communication
5.5 Kewangan, insurans, hartanah dan perkhidmatan perniagaan 90.9 4.3 4.8 100.0
Finance, insurance, real estate and business services
5.6 Perkhidmatan lain 91.2 4.2 4.6 100.0
Other services
Jumlah SMB
Total NKS64.5 16.3 19.2 100.0
Peratus sumbangan mengikut jenis aktiviti ekonomi
Percentage share by kind of economic activity
100.0 100.0 100.0 100.0
Peratus sumbangan mengikut jenis aset
Percentage share by type of assets
2015
66
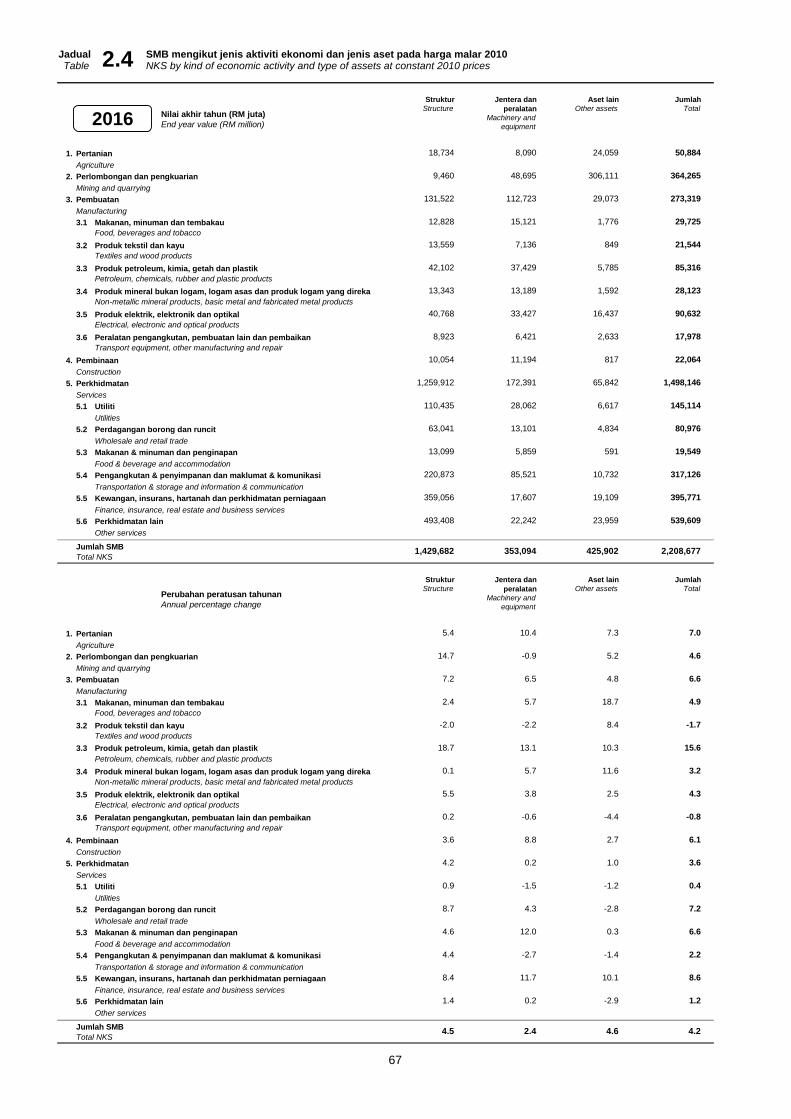
Jadual SMB mengikut jenis aktiviti ekonomi dan jenis aset pada harga malar 2010 Table NKS by kind of economic activity and type of assets at constant 2010 prices
Struktur
Structure
Jentera dan
peralatan
Machinery and
equipment
Aset lain
Other assets
Jumlah
Total
1. Pertanian 18,734 8,090 24,059 50,884
Agriculture
2. Perlombongan dan pengkuarian 9,460 48,695 306,111 364,265
Mining and quarrying
3. Pembuatan 131,522 112,723 29,073 273,319
Manufacturing
3.1 Makanan, minuman dan tembakau 12,828 15,121 1,776 29,725
Food, beverages and tobacco
3.2 Produk tekstil dan kayu 13,559 7,136 849 21,544
Textiles and wood products
3.3 Produk petroleum, kimia, getah dan plastik 42,102 37,429 5,785 85,316
Petroleum, chemicals, rubber and plastic products
3.4 Produk mineral bukan logam, logam asas dan produk logam yang direka 13,343 13,189 1,592 28,123
Non-metallic mineral products, basic metal and fabricated metal products
3.5 Produk elektrik, elektronik dan optikal 40,768 33,427 16,437 90,632
Electrical, electronic and optical products
3.6 Peralatan pengangkutan, pembuatan lain dan pembaikan 8,923 6,421 2,633 17,978
Transport equipment, other manufacturing and repair
4. Pembinaan 10,054 11,194 817 22,064
Construction
5. Perkhidmatan 1,259,912 172,391 65,842 1,498,146
Services
5.1 Utiliti 110,435 28,062 6,617 145,114
Utilities
5.2 Perdagangan borong dan runcit 63,041 13,101 4,834 80,976
Wholesale and retail trade
5.3 Makanan & minuman dan penginapan 13,099 5,859 591 19,549
Food & beverage and accommodation
5.4 Pengangkutan & penyimpanan dan maklumat & komunikasi 220,873 85,521 10,732 317,126
Transportation & storage and information & communication
5.5 Kewangan, insurans, hartanah dan perkhidmatan perniagaan 359,056 17,607 19,109 395,771
Finance, insurance, real estate and business services
5.6 Perkhidmatan lain 493,408 22,242 23,959 539,609
Other services
Jumlah SMB
Total NKS
Struktur
Structure
Jentera dan
peralatan
Machinery and
equipment
Aset lain
Other assets
Jumlah
Total
1. Pertanian 5.4 10.4 7.3 7.0
Agriculture
2. Perlombongan dan pengkuarian 14.7 -0.9 5.2 4.6
Mining and quarrying
3. Pembuatan 7.2 6.5 4.8 6.6
Manufacturing
3.1 Makanan, minuman dan tembakau 2.4 5.7 18.7 4.9
Food, beverages and tobacco
3.2 Produk tekstil dan kayu -2.0 -2.2 8.4 -1.7
Textiles and wood products
3.3 Produk petroleum, kimia, getah dan plastik 18.7 13.1 10.3 15.6
Petroleum, chemicals, rubber and plastic products
3.4 Produk mineral bukan logam, logam asas dan produk logam yang direka 0.1 5.7 11.6 3.2
Non-metallic mineral products, basic metal and fabricated metal products
3.5 Produk elektrik, elektronik dan optikal 5.5 3.8 2.5 4.3
Electrical, electronic and optical products
3.6 Peralatan pengangkutan, pembuatan lain dan pembaikan 0.2 -0.6 -4.4 -0.8
Transport equipment, other manufacturing and repair
4. Pembinaan 3.6 8.8 2.7 6.1
Construction
5. Perkhidmatan 4.2 0.2 1.0 3.6
Services
5.1 Utiliti 0.9 -1.5 -1.2 0.4
Utilities
5.2 Perdagangan borong dan runcit 8.7 4.3 -2.8 7.2
Wholesale and retail trade
5.3 Makanan & minuman dan penginapan 4.6 12.0 0.3 6.6
Food & beverage and accommodation
5.4 Pengangkutan & penyimpanan dan maklumat & komunikasi 4.4 -2.7 -1.4 2.2
Transportation & storage and information & communication
5.5 Kewangan, insurans, hartanah dan perkhidmatan perniagaan 8.4 11.7 10.1 8.6
Finance, insurance, real estate and business services
5.6 Perkhidmatan lain 1.4 0.2 -2.9 1.2
Other services
Jumlah SMB
Total NKS
Perubahan peratusan tahunan
Annual percentage change
4.5 2.4 4.6 4.2
2,208,677
2.4
Nilai akhir tahun (RM juta)
End year value (RM million)
1,429,682 353,094 425,902
2016
67

Jadual SMB mengikut jenis aktiviti ekonomi dan jenis aset pada harga malar 2010 Table NKS by kind of economic activity and type of assets at constant 2010 prices 2.4
Struktur
Structure
Jentera dan
peralatan
Machinery and
equipment
Aset lain
Other assets
Jumlah
Total
1. Pertanian 1.3 2.3 5.6 2.3
Agriculture
2. Perlombongan dan pengkuarian 0.7 13.8 71.9 16.5
Mining and quarrying
3. Pembuatan 9.2 31.9 6.8 12.4
Manufacturing
3.1 Makanan, minuman dan tembakau 0.9 4.3 0.4 1.3
Food, beverages and tobacco
3.2 Produk tekstil dan kayu 0.9 2.0 0.2 1.0
Textiles and wood products
3.3 Produk petroleum, kimia, getah dan plastik 2.9 10.6 1.4 3.9
Petroleum, chemicals, rubber and plastic products
3.4 Produk mineral bukan logam, logam asas dan produk logam yang direka 0.9 3.7 0.4 1.3
Non-metallic mineral products, basic metal and fabricated metal products
3.5 Produk elektrik, elektronik dan optikal 2.9 9.5 3.9 4.1
Electrical, electronic and optical products
3.6 Peralatan pengangkutan, pembuatan lain dan pembaikan 0.6 1.8 0.6 0.8
Transport equipment, other manufacturing and repair
4. Pembinaan 0.7 3.2 0.2 1.0
Construction
5. Perkhidmatan 88.1 48.8 15.5 67.8
Services
5.1 Utiliti 7.7 7.9 1.6 6.6
Utilities
5.2 Perdagangan borong dan runcit 4.4 3.7 1.1 3.7
Wholesale and retail trade
5.3 Makanan & minuman dan penginapan 0.9 1.7 0.1 0.9
Food & beverage and accommodation
5.4 Pengangkutan & penyimpanan dan maklumat & komunikasi 15.4 24.2 2.5 14.4
Transportation & storage and information & communication
5.5 Kewangan, insurans, hartanah dan perkhidmatan perniagaan 25.1 5.0 4.5 17.9
Finance, insurance, real estate and business services
5.6 Perkhidmatan lain 34.5 6.3 5.6 24.4
Other services
Jumlah SMB
Total NKS
Struktur
Structure
Jentera dan
peralatan
Machinery and
equipment
Aset lain
Other assets
Jumlah
Total
1. Pertanian 36.8 15.9 47.3 100.0
Agriculture
2. Perlombongan dan pengkuarian 2.6 13.4 84.0 100.0
Mining and quarrying
3. Pembuatan 48.1 41.2 10.6 100.0
Manufacturing
3.1 Makanan, minuman dan tembakau 43.2 50.9 6.0 100.0
Food, beverages and tobacco
3.2 Produk tekstil dan kayu 62.9 33.1 3.9 100.0
Textiles and wood products
3.3 Produk petroleum, kimia, getah dan plastik 49.3 43.9 6.8 100.0
Petroleum, chemicals, rubber and plastic products
3.4 Produk mineral bukan logam, logam asas dan produk logam yang direka 47.4 46.9 5.7 100.0
Non-metallic mineral products, basic metal and fabricated metal products
3.5 Produk elektrik, elektronik dan optikal 45.0 36.9 18.1 100.0
Electrical, electronic and optical products
3.6 Peralatan pengangkutan, pembuatan lain dan pembaikan 49.6 35.7 14.6 100.0
Transport equipment, other manufacturing and repair
4. Pembinaan 45.6 50.7 3.7 100.0
Construction
5. Perkhidmatan 84.1 11.5 4.4 100.0
Services
5.1 Utiliti 76.1 19.3 4.6 100.0
Utilities
5.2 Perdagangan borong dan runcit 77.9 16.2 6.0 100.0
Wholesale and retail trade
5.3 Makanan & minuman dan penginapan 67.0 30.0 3.0 100.0
Food & beverage and accommodation
5.4 Pengangkutan & penyimpanan dan maklumat & komunikasi 69.6 27.0 3.4 100.0
Transportation & storage and information & communication
5.5 Kewangan, insurans, hartanah dan perkhidmatan perniagaan 90.7 4.4 4.8 100.0
Finance, insurance, real estate and business services
5.6 Perkhidmatan lain 91.4 4.1 4.4 100.0
Other services
Jumlah SMB
Total NKS64.7 16.0 19.3 100.0
100.0 100.0 100.0 100.0
Peratus sumbangan mengikut jenis aset
Percentage share by type of assets
Peratus sumbangan mengikut jenis aktiviti ekonomi
Percentage share by kind of economic activity2016
68

Jadual SMB mengikut jenis aktiviti ekonomi dan jenis aset pada harga malar 2010Table NKS by kind of economic activity and type of assets at constant 2010 prices
Struktur
Structure
Jentera dan
peralatan
Machinery and
equipment
Aset lain
Other assets
Jumlah
Total
1. Pertanian 19,756 8,761 25,123 53,641
Agriculture
2. Perlombongan dan pengkuarian 11,449 47,681 316,580 375,711
Mining and quarrying
3. Pembuatan 140,024 124,031 30,445 294,500
Manufacturing
3.1 Makanan, minuman dan tembakau 13,099 15,833 2,015 30,946
Food, beverages and tobacco
3.2 Produk tekstil dan kayu 13,242 6,995 898 21,136
Textiles and wood products
3.3 Produk petroleum, kimia, getah dan plastik 48,289 42,622 6,299 97,211
Petroleum, chemicals, rubber and plastic products
3.4 Produk mineral bukan logam, logam asas dan produk logam yang direka 13,478 14,441 1,762 29,681
Non-metallic mineral products, basic metal and fabricated metal products
3.5 Produk elektrik, elektronik dan optikal 42,952 37,602 16,951 97,505
Electrical, electronic and optical products
3.6 Peralatan pengangkutan, pembuatan lain dan pembaikan 8,964 6,537 2,521 18,022
Transport equipment, other manufacturing and repair
4. Pembinaan 10,402 12,239 835 23,477
Construction
5. Perkhidmatan 1,317,597 176,308 66,213 1,560,118
Services
5.1 Utiliti 113,019 28,991 6,500 148,511
Utilities
5.2 Perdagangan borong dan runcit 68,315 13,650 4,724 86,689
Wholesale and retail trade
5.3 Makanan & minuman dan penginapan 13,801 6,433 594 20,828
Food & beverage and accommodation
5.4 Pengangkutan & penyimpanan dan maklumat & komunikasi 232,763 84,995 10,552 328,310
Transportation & storage and information & communication
5.5 Kewangan, insurans, hartanah dan perkhidmatan perniagaan 388,975 19,511 20,681 429,166
Finance, insurance, real estate and business services
5.6 Perkhidmatan lain 500,724 22,728 23,161 546,614
Other services
Jumlah SMB
Total NKS
Struktur
Structure
Jentera dan
peralatan
Machinery and
equipment
Aset lain
Other assets
Jumlah
Total
1. Pertanian 5.5 8.3 4.4 5.4
Agriculture
2. Perlombongan dan pengkuarian 21.0 -2.1 3.4 3.1
Mining and quarrying
3. Pembuatan 6.5 10.0 4.7 7.7
Manufacturing
3.1 Makanan, minuman dan tembakau 2.1 4.7 13.4 4.1
Food, beverages and tobacco
3.2 Produk tekstil dan kayu -2.3 -2.0 5.7 -1.9
Textiles and wood products
3.3 Produk petroleum, kimia, getah dan plastik 14.7 13.9 8.9 13.9
Petroleum, chemicals, rubber and plastic products
3.4 Produk mineral bukan logam, logam asas dan produk logam yang direka 1.0 9.5 10.7 5.5
Non-metallic mineral products, basic metal and fabricated metal products
3.5 Produk elektrik, elektronik dan optikal 5.4 12.5 3.1 7.6
Electrical, electronic and optical products
3.6 Peralatan pengangkutan, pembuatan lain dan pembaikan 0.5 1.8 -4.3 0.2
Transport equipment, other manufacturing and repair
4. Pembinaan 3.5 9.3 2.2 6.4
Construction
5. Perkhidmatan 4.6 2.3 0.6 4.1
Services
5.1 Utiliti 2.3 3.3 -1.8 2.3
Utilities
5.2 Perdagangan borong dan runcit 8.4 4.2 -2.3 7.1
Wholesale and retail trade
5.3 Makanan & minuman dan penginapan 5.4 9.8 0.6 6.5
Food & beverage and accommodation
5.4 Pengangkutan & penyimpanan dan maklumat & komunikasi 5.4 -0.6 -1.7 3.5
Transportation & storage and information & communication
5.5 Kewangan, insurans, hartanah dan perkhidmatan perniagaan 8.3 10.8 8.2 8.4
Finance, insurance, real estate and business services
5.6 Perkhidmatan lain 1.5 2.2 -3.3 1.3
Other services
Jumlah SMB
Total NKS
439,197 2,307,447
Perubahan peratusan tahunan
Annual percentage change
4.9 4.5 3.1 4.5
2.4
Nilai akhir tahun (RM juta)
End year value (RM million)
1,499,229 369,021
2017
69

Jadual SMB mengikut jenis aktiviti ekonomi dan jenis aset pada harga malar 2010Table NKS by kind of economic activity and type of assets at constant 2010 prices 2.4
Struktur
Structure
Jentera dan
peralatan
Machinery and
equipment
Aset lain
Other assets
Jumlah
Total
1. Pertanian 1.3 2.4 5.7 2.3
Agriculture
2. Perlombongan dan pengkuarian 0.8 12.9 72.1 16.3
Mining and quarrying
3. Pembuatan 9.3 33.6 6.9 12.8
Manufacturing
3.1 Makanan, minuman dan tembakau 0.9 4.3 0.5 1.3
Food, beverages and tobacco
3.2 Produk tekstil dan kayu 0.9 1.9 0.2 0.9
Textiles and wood products
3.3 Produk petroleum, kimia, getah dan plastik 3.2 11.6 1.4 4.2
Petroleum, chemicals, rubber and plastic products
3.4 Produk mineral bukan logam, logam asas dan produk logam yang direka 0.9 3.9 0.4 1.3
Non-metallic mineral products, basic metal and fabricated metal products
3.5 Produk elektrik, elektronik dan optikal 2.9 10.2 3.9 4.2
Electrical, electronic and optical products
3.6 Peralatan pengangkutan, pembuatan lain dan pembaikan 0.6 1.8 0.6 0.8
Transport equipment, other manufacturing and repair
4. Pembinaan 0.7 3.3 0.2 1.0
Construction
5. Perkhidmatan 87.9 47.8 15.1 67.6
Services
5.1 Utiliti 7.5 7.9 1.5 6.4
Utilities
5.2 Perdagangan borong dan runcit 4.6 3.7 1.1 3.8
Wholesale and retail trade
5.3 Makanan & minuman dan penginapan 0.9 1.7 0.1 0.9
Food & beverage and accommodation
5.4 Pengangkutan & penyimpanan dan maklumat & komunikasi 15.5 23.0 2.4 14.2
Transportation & storage and information & communication
5.5 Kewangan, insurans, hartanah dan perkhidmatan perniagaan 25.9 5.3 4.7 18.6
Finance, insurance, real estate and business services
5.6 Perkhidmatan lain 33.4 6.2 5.3 23.7
Other services
Jumlah SMB
Total NKS
Struktur
Structure
Jentera dan
peralatan
Machinery and
equipment
Aset lain
Other assets
Jumlah
Total
1. Pertanian 36.8 16.3 46.8 100.0
Agriculture
2. Perlombongan dan pengkuarian 3.0 12.7 84.3 100.0
Mining and quarrying
3. Pembuatan 47.5 42.1 10.3 100.0
Manufacturing
3.1 Makanan, minuman dan tembakau 42.3 51.2 6.5 100.0
Food, beverages and tobacco
3.2 Produk tekstil dan kayu 62.7 33.1 4.2 100.0
Textiles and wood products
3.3 Produk petroleum, kimia, getah dan plastik 49.7 43.8 6.5 100.0
Petroleum, chemicals, rubber and plastic products
3.4 Produk mineral bukan logam, logam asas dan produk logam yang direka 45.4 48.7 5.9 100.0
Non-metallic mineral products, basic metal and fabricated metal products
3.5 Produk elektrik, elektronik dan optikal 44.1 38.6 17.4 100.0
Electrical, electronic and optical products
3.6 Peralatan pengangkutan, pembuatan lain dan pembaikan 49.7 36.3 14.0 100.0
Transport equipment, other manufacturing and repair
4. Pembinaan 44.3 52.1 3.6 100.0
Construction
5. Perkhidmatan 84.5 11.3 4.2 100.0
Services
5.1 Utiliti 76.1 19.5 4.4 100.0
Utilities
5.2 Perdagangan borong dan runcit 78.8 15.7 5.4 100.0
Wholesale and retail trade
5.3 Makanan & minuman dan penginapan 66.3 30.9 2.9 100.0
Food & beverage and accommodation
5.4 Pengangkutan & penyimpanan dan maklumat & komunikasi 70.9 25.9 3.2 100.0
Transportation & storage and information & communication
5.5 Kewangan, insurans, hartanah dan perkhidmatan perniagaan 90.6 4.5 4.8 100.0
Finance, insurance, real estate and business services
5.6 Perkhidmatan lain 91.6 4.2 4.2 100.0
Other services
Jumlah SMB
Total NKS
100.0
Peratus sumbangan mengikut jenis aset
Percentage share by type of assets
65.0 16.0 19.0 100.0
100.0
Peratus sumbangan mengikut jenis aktiviti ekonomi
Percentage share by kind of economic activity
100.0 100.0
2017
70

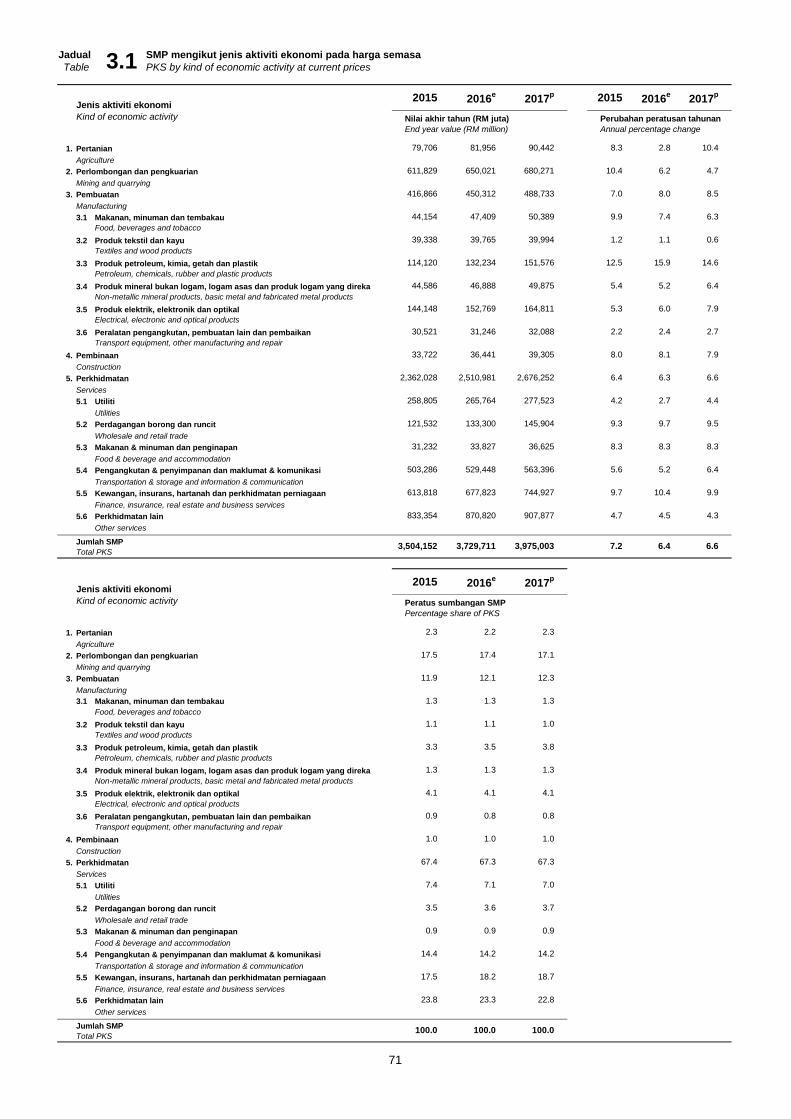
Jadual SMP mengikut jenis aktiviti ekonomi pada harga semasa
Table PKS by kind of economic activity at current prices
Jenis aktiviti ekonomi
Kind of economic activity Nilai akhir tahun (RM juta) Perubahan peratusan tahunan
End year value (RM million) Annual percentage change
1. Pertanian 79,706 81,956 90,442 8.3 2.8 10.4
Agriculture
2. Perlombongan dan pengkuarian 611,829 650,021 680,271 10.4 6.2 4.7
Mining and quarrying
3. Pembuatan 416,866 450,312 488,733 7.0 8.0 8.5
Manufacturing
3.1 Makanan, minuman dan tembakau 44,154 47,409 50,389 9.9 7.4 6.3
Food, beverages and tobacco
3.2 Produk tekstil dan kayu 39,338 39,765 39,994 1.2 1.1 0.6
Textiles and wood products
3.3 Produk petroleum, kimia, getah dan plastik 114,120 132,234 151,576 12.5 15.9 14.6
Petroleum, chemicals, rubber and plastic products
3.4 Produk mineral bukan logam, logam asas dan produk logam yang direka 44,586 46,888 49,875 5.4 5.2 6.4
Non-metallic mineral products, basic metal and fabricated metal products
3.5 Produk elektrik, elektronik dan optikal 144,148 152,769 164,811 5.3 6.0 7.9
Electrical, electronic and optical products
3.6 Peralatan pengangkutan, pembuatan lain dan pembaikan 30,521 31,246 32,088 2.2 2.4 2.7
Transport equipment, other manufacturing and repair
4. Pembinaan 33,722 36,441 39,305 8.0 8.1 7.9
Construction
5. Perkhidmatan 2,362,028 2,510,981 2,676,252 6.4 6.3 6.6
Services
5.1 Utiliti 258,805 265,764 277,523 4.2 2.7 4.4
Utilities
5.2 Perdagangan borong dan runcit 121,532 133,300 145,904 9.3 9.7 9.5
Wholesale and retail trade
5.3 Makanan & minuman dan penginapan 31,232 33,827 36,625 8.3 8.3 8.3
Food & beverage and accommodation
5.4 Pengangkutan & penyimpanan dan maklumat & komunikasi 503,286 529,448 563,396 5.6 5.2 6.4
Transportation & storage and information & communication
5.5 Kewangan, insurans, hartanah dan perkhidmatan perniagaan 613,818 677,823 744,927 9.7 10.4 9.9
Finance, insurance, real estate and business services
5.6 Perkhidmatan lain 833,354 870,820 907,877 4.7 4.5 4.3
Other services
Jumlah SMP
Total PKS
Jenis aktiviti ekonomi
Kind of economic activity Peratus sumbangan SMP
Percentage share of PKS
1. Pertanian 2.3 2.2 2.3
Agriculture
2. Perlombongan dan pengkuarian 17.5 17.4 17.1
Mining and quarrying
3. Pembuatan 11.9 12.1 12.3
Manufacturing
3.1 Makanan, minuman dan tembakau 1.3 1.3 1.3
Food, beverages and tobacco
3.2 Produk tekstil dan kayu 1.1 1.1 1.0
Textiles and wood products
3.3 Produk petroleum, kimia, getah dan plastik 3.3 3.5 3.8
Petroleum, chemicals, rubber and plastic products
3.4 Produk mineral bukan logam, logam asas dan produk logam yang direka 1.3 1.3 1.3
Non-metallic mineral products, basic metal and fabricated metal products
3.5 Produk elektrik, elektronik dan optikal 4.1 4.1 4.1
Electrical, electronic and optical products
3.6 Peralatan pengangkutan, pembuatan lain dan pembaikan 0.9 0.8 0.8
Transport equipment, other manufacturing and repair
4. Pembinaan 1.0 1.0 1.0
Construction
5. Perkhidmatan 67.4 67.3 67.3
Services
5.1 Utiliti 7.4 7.1 7.0
Utilities
5.2 Perdagangan borong dan runcit 3.5 3.6 3.7
Wholesale and retail trade
5.3 Makanan & minuman dan penginapan 0.9 0.9 0.9
Food & beverage and accommodation
5.4 Pengangkutan & penyimpanan dan maklumat & komunikasi 14.4 14.2 14.2
Transportation & storage and information & communication
5.5 Kewangan, insurans, hartanah dan perkhidmatan perniagaan 17.5 18.2 18.7
Finance, insurance, real estate and business services
5.6 Perkhidmatan lain 23.8 23.3 22.8
Other services
Jumlah SMP
Total PKS
2015 2016e
2017p
100.0 100.0 100.0
3,504,152 3,729,711 3,975,003
3.1
2015 2016e
2017p
2017p
6.67.2 6.4
2015 2016e
71
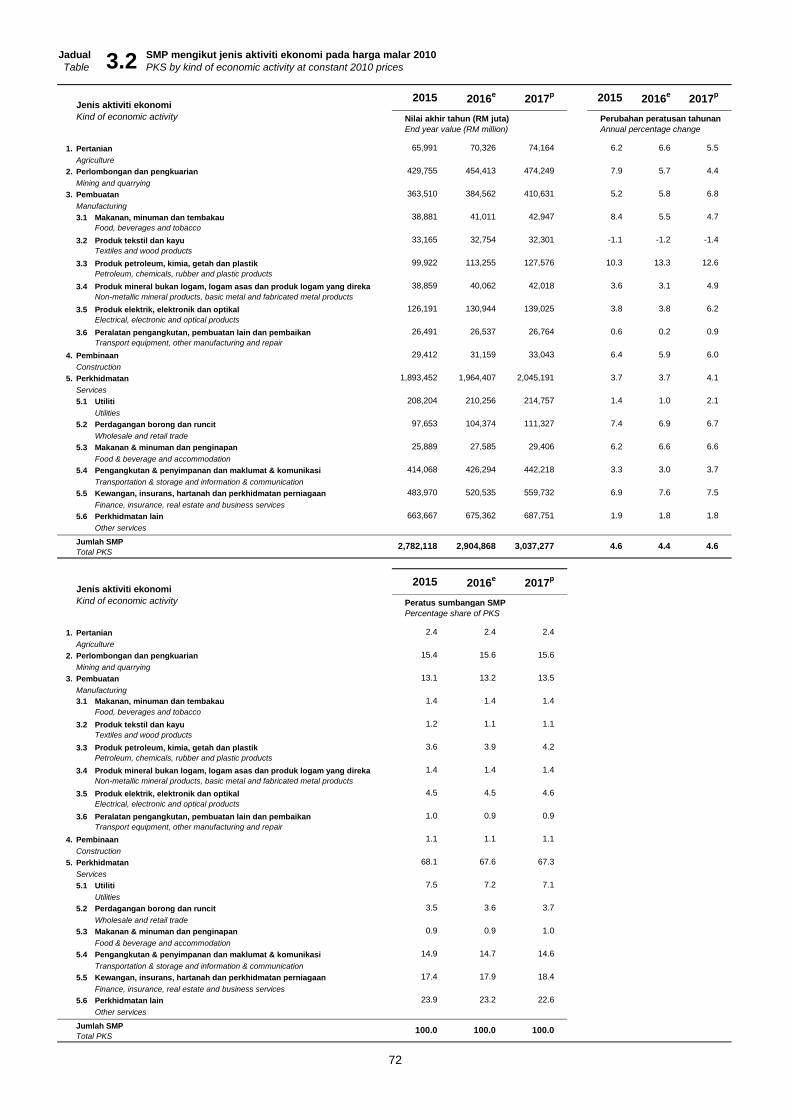
Jadual SMP mengikut jenis aktiviti ekonomi pada harga malar 2010
Table PKS by kind of economic activity at constant 2010 prices
Jenis aktiviti ekonomi
Kind of economic activity Nilai akhir tahun (RM juta) Perubahan peratusan tahunan
End year value (RM million) Annual percentage change
1. Pertanian 65,991 70,326 74,164 6.2 6.6 5.5
Agriculture
2. Perlombongan dan pengkuarian 429,755 454,413 474,249 7.9 5.7 4.4
Mining and quarrying
3. Pembuatan 363,510 384,562 410,631 5.2 5.8 6.8
Manufacturing
3.1 Makanan, minuman dan tembakau 38,881 41,011 42,947 8.4 5.5 4.7
Food, beverages and tobacco
3.2 Produk tekstil dan kayu 33,165 32,754 32,301 -1.1 -1.2 -1.4
Textiles and wood products
3.3 Produk petroleum, kimia, getah dan plastik 99,922 113,255 127,576 10.3 13.3 12.6
Petroleum, chemicals, rubber and plastic products
3.4 Produk mineral bukan logam, logam asas dan produk logam yang direka 38,859 40,062 42,018 3.6 3.1 4.9
Non-metallic mineral products, basic metal and fabricated metal products
3.5 Produk elektrik, elektronik dan optikal 126,191 130,944 139,025 3.8 3.8 6.2
Electrical, electronic and optical products
3.6 Peralatan pengangkutan, pembuatan lain dan pembaikan 26,491 26,537 26,764 0.6 0.2 0.9
Transport equipment, other manufacturing and repair
4. Pembinaan 29,412 31,159 33,043 6.4 5.9 6.0
Construction
5. Perkhidmatan 1,893,452 1,964,407 2,045,191 3.7 3.7 4.1
Services
5.1 Utiliti 208,204 210,256 214,757 1.4 1.0 2.1
Utilities
5.2 Perdagangan borong dan runcit 97,653 104,374 111,327 7.4 6.9 6.7
Wholesale and retail trade
5.3 Makanan & minuman dan penginapan 25,889 27,585 29,406 6.2 6.6 6.6
Food & beverage and accommodation
5.4 Pengangkutan & penyimpanan dan maklumat & komunikasi 414,068 426,294 442,218 3.3 3.0 3.7
Transportation & storage and information & communication
5.5 Kewangan, insurans, hartanah dan perkhidmatan perniagaan 483,970 520,535 559,732 6.9 7.6 7.5
Finance, insurance, real estate and business services
5.6 Perkhidmatan lain 663,667 675,362 687,751 1.9 1.8 1.8
Other services
Jumlah SMP
Total PKS
Jenis aktiviti ekonomi
Kind of economic activity Peratus sumbangan SMP
Percentage share of PKS
1. Pertanian 2.4 2.4 2.4
Agriculture
2. Perlombongan dan pengkuarian 15.4 15.6 15.6
Mining and quarrying
3. Pembuatan 13.1 13.2 13.5
Manufacturing
3.1 Makanan, minuman dan tembakau 1.4 1.4 1.4
Food, beverages and tobacco
3.2 Produk tekstil dan kayu 1.2 1.1 1.1
Textiles and wood products
3.3 Produk petroleum, kimia, getah dan plastik 3.6 3.9 4.2
Petroleum, chemicals, rubber and plastic products
3.4 Produk mineral bukan logam, logam asas dan produk logam yang direka 1.4 1.4 1.4
Non-metallic mineral products, basic metal and fabricated metal products
3.5 Produk elektrik, elektronik dan optikal 4.5 4.5 4.6
Electrical, electronic and optical products
3.6 Peralatan pengangkutan, pembuatan lain dan pembaikan 1.0 0.9 0.9
Transport equipment, other manufacturing and repair
4. Pembinaan 1.1 1.1 1.1
Construction
5. Perkhidmatan 68.1 67.6 67.3
Services
5.1 Utiliti 7.5 7.2 7.1
Utilities
5.2 Perdagangan borong dan runcit 3.5 3.6 3.7
Wholesale and retail trade
5.3 Makanan & minuman dan penginapan 0.9 0.9 1.0
Food & beverage and accommodation
5.4 Pengangkutan & penyimpanan dan maklumat & komunikasi 14.9 14.7 14.6
Transportation & storage and information & communication
5.5 Kewangan, insurans, hartanah dan perkhidmatan perniagaan 17.4 17.9 18.4
Finance, insurance, real estate and business services
5.6 Perkhidmatan lain 23.9 23.2 22.6
Other services
Jumlah SMP
Total PKS
2015 2016e
2017p
100.0 100.0 100.0
2,782,118 2,904,868 3,037,277
3.2
2015 2016e
2017p
2017p
4.64.6 4.4
2015 2016e
72

Jadual SMP mengikut jenis aktiviti ekonomi dan jenis aset pada harga semasaTable PKS by kind of economic activity and type of assets at current prices
Struktur
Structure
Jentera dan
peralatan
Machinery and
equipment
Aset lain
Other assets
Jumlah
Total
1. Pertanian 31,095 10,913 37,699 79,706
Agriculture
2. Perlombongan dan pengkuarian 14,319 72,116 525,394 611,829
Mining and quarrying
3. Pembuatan 203,853 164,005 49,008 416,866
Manufacturing
3.1 Makanan, minuman dan tembakau 20,460 21,198 2,496 44,154
Food, beverages and tobacco
3.2 Produk tekstil dan kayu 26,006 11,888 1,444 39,338
Textiles and wood products
3.3 Produk petroleum, kimia, getah dan plastik 55,319 50,093 8,708 114,120
Petroleum, chemicals, rubber and plastic products
3.4 Produk mineral bukan logam, logam asas dan produk logam yang direka 22,723 19,394 2,468 44,586
Non-metallic mineral products, basic metal and fabricated metal products
3.5 Produk elektrik, elektronik dan optikal 64,099 50,946 29,103 144,148
Electrical, electronic and optical products
3.6 Peralatan pengangkutan, pembuatan lain dan pembaikan 15,246 10,487 4,789 30,521
Transport equipment, other manufacturing and repair
4. Pembinaan 16,681 15,537 1,504 33,722
Construction
5. Perkhidmatan 1,968,426 266,819 126,783 2,362,028
Services
5.1 Utiliti 199,869 44,485 14,451 258,805
Utilities
5.2 Perdagangan borong dan runcit 89,543 20,016 11,973 121,532
Wholesale and retail trade
5.3 Makanan & minuman dan penginapan 22,391 7,674 1,167 31,232
Food & beverage and accommodation
5.4 Pengangkutan & penyimpanan dan maklumat & komunikasi 342,329 136,119 24,838 503,286
Transportation & storage and information & communication
5.5 Kewangan, insurans, hartanah dan perkhidmatan perniagaan 558,261 22,730 32,827 613,818
Finance, insurance, real estate and business services
5.6 Perkhidmatan lain 756,033 35,795 41,525 833,354
Other services
Jumlah SMP
Total PKS
Struktur
Structure
Jentera dan
peralatan
Machinery and
equipment
Aset lain
Other assets
Jumlah
Total
1. Pertanian 6.8 11.6 8.5 8.3
Agriculture
2. Perlombongan dan pengkuarian 16.8 10.1 10.2 10.4
Mining and quarrying
3. Pembuatan 9.2 5.0 5.5 7.0
Manufacturing
3.1 Makanan, minuman dan tembakau 6.9 11.8 20.3 9.9
Food, beverages and tobacco
3.2 Produk tekstil dan kayu 2.4 -1.8 6.7 1.2
Textiles and wood products
3.3 Produk petroleum, kimia, getah dan plastik 17.5 7.9 9.2 12.5
Petroleum, chemicals, rubber and plastic products
3.4 Produk mineral bukan logam, logam asas dan produk logam yang direka 4.5 5.8 11.6 5.4
Non-metallic mineral products, basic metal and fabricated metal products
3.5 Produk elektrik, elektronik dan optikal 8.9 2.0 3.7 5.3
Electrical, electronic and optical products
3.6 Peralatan pengangkutan, pembuatan lain dan pembaikan 4.8 -0.1 -0.3 2.2
Transport equipment, other manufacturing and repair
4. Pembinaan 6.7 10.1 1.3 8.0
Construction
5. Perkhidmatan 6.9 3.5 4.0 6.4
Services
5.1 Utiliti 4.2 2.0 12.3 4.2
Utilities
5.2 Perdagangan borong dan runcit 12.7 6.3 -6.9 9.3
Wholesale and retail trade
5.3 Makanan & minuman dan penginapan 6.6 14.8 1.6 8.3
Food & beverage and accommodation
5.4 Pengangkutan & penyimpanan dan maklumat & komunikasi 7.1 1.6 8.2 5.6
Transportation & storage and information & communication
5.5 Kewangan, insurans, hartanah dan perkhidmatan perniagaan 9.5 17.9 7.0 9.7
Finance, insurance, real estate and business services
5.6 Perkhidmatan lain 5.1 0.7 0.4 4.7
Other services
Jumlah SMP
Total PKS
Perubahan peratusan tahunan
Annual percentage change
7.2 5.1 8.7 7.2
3,504,152
3.3
Nilai akhir tahun (RM juta)
End year value (RM million)
2,234,374 529,390 740,388
2015
73
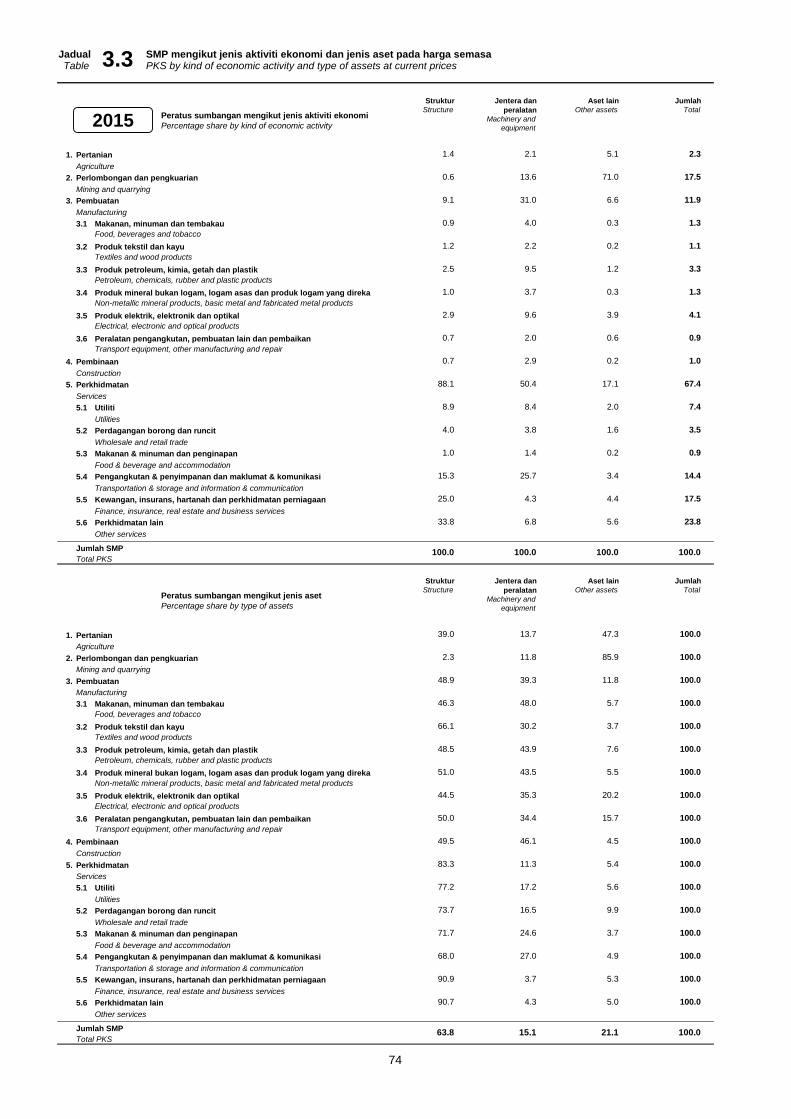
Jadual SMP mengikut jenis aktiviti ekonomi dan jenis aset pada harga semasaTable PKS by kind of economic activity and type of assets at current prices 3.3
Struktur
Structure
Jentera dan
peralatan
Machinery and
equipment
Aset lain
Other assets
Jumlah
Total
1. Pertanian 1.4 2.1 5.1 2.3
Agriculture
2. Perlombongan dan pengkuarian 0.6 13.6 71.0 17.5
Mining and quarrying
3. Pembuatan 9.1 31.0 6.6 11.9
Manufacturing
3.1 Makanan, minuman dan tembakau 0.9 4.0 0.3 1.3
Food, beverages and tobacco
3.2 Produk tekstil dan kayu 1.2 2.2 0.2 1.1
Textiles and wood products
3.3 Produk petroleum, kimia, getah dan plastik 2.5 9.5 1.2 3.3
Petroleum, chemicals, rubber and plastic products
3.4 Produk mineral bukan logam, logam asas dan produk logam yang direka 1.0 3.7 0.3 1.3
Non-metallic mineral products, basic metal and fabricated metal products
3.5 Produk elektrik, elektronik dan optikal 2.9 9.6 3.9 4.1
Electrical, electronic and optical products
3.6 Peralatan pengangkutan, pembuatan lain dan pembaikan 0.7 2.0 0.6 0.9
Transport equipment, other manufacturing and repair
4. Pembinaan 0.7 2.9 0.2 1.0
Construction
5. Perkhidmatan 88.1 50.4 17.1 67.4
Services
5.1 Utiliti 8.9 8.4 2.0 7.4
Utilities
5.2 Perdagangan borong dan runcit 4.0 3.8 1.6 3.5
Wholesale and retail trade
5.3 Makanan & minuman dan penginapan 1.0 1.4 0.2 0.9
Food & beverage and accommodation
5.4 Pengangkutan & penyimpanan dan maklumat & komunikasi 15.3 25.7 3.4 14.4
Transportation & storage and information & communication
5.5 Kewangan, insurans, hartanah dan perkhidmatan perniagaan 25.0 4.3 4.4 17.5
Finance, insurance, real estate and business services
5.6 Perkhidmatan lain 33.8 6.8 5.6 23.8
Other services
Jumlah SMP
Total PKS
Struktur
Structure
Jentera dan
peralatan
Machinery and
equipment
Aset lain
Other assets
Jumlah
Total
1. Pertanian 39.0 13.7 47.3 100.0
Agriculture
2. Perlombongan dan pengkuarian 2.3 11.8 85.9 100.0
Mining and quarrying
3. Pembuatan 48.9 39.3 11.8 100.0
Manufacturing
3.1 Makanan, minuman dan tembakau 46.3 48.0 5.7 100.0
Food, beverages and tobacco
3.2 Produk tekstil dan kayu 66.1 30.2 3.7 100.0
Textiles and wood products
3.3 Produk petroleum, kimia, getah dan plastik 48.5 43.9 7.6 100.0
Petroleum, chemicals, rubber and plastic products
3.4 Produk mineral bukan logam, logam asas dan produk logam yang direka 51.0 43.5 5.5 100.0
Non-metallic mineral products, basic metal and fabricated metal products
3.5 Produk elektrik, elektronik dan optikal 44.5 35.3 20.2 100.0
Electrical, electronic and optical products
3.6 Peralatan pengangkutan, pembuatan lain dan pembaikan 50.0 34.4 15.7 100.0
Transport equipment, other manufacturing and repair
4. Pembinaan 49.5 46.1 4.5 100.0
Construction
5. Perkhidmatan 83.3 11.3 5.4 100.0
Services
5.1 Utiliti 77.2 17.2 5.6 100.0
Utilities
5.2 Perdagangan borong dan runcit 73.7 16.5 9.9 100.0
Wholesale and retail trade
5.3 Makanan & minuman dan penginapan 71.7 24.6 3.7 100.0
Food & beverage and accommodation
5.4 Pengangkutan & penyimpanan dan maklumat & komunikasi 68.0 27.0 4.9 100.0
Transportation & storage and information & communication
5.5 Kewangan, insurans, hartanah dan perkhidmatan perniagaan 90.9 3.7 5.3 100.0
Finance, insurance, real estate and business services
5.6 Perkhidmatan lain 90.7 4.3 5.0 100.0
Other services
Jumlah SMP
Total PKS63.8 15.1 21.1 100.0
100.0 100.0 100.0 100.0
Peratus sumbangan mengikut jenis aset
Percentage share by type of assets
Peratus sumbangan mengikut jenis aktiviti ekonomi
Percentage share by kind of economic activity2015
74

Jadual SMP mengikut jenis aktiviti ekonomi dan jenis aset pada harga semasaTable PKS by kind of economic activity and type of assets at current prices
Struktur
Structure
Jentera dan
peralatan
Machinery and
equipment
Aset lain
Other assets
Jumlah
Total
1. Pertanian 33,261 12,204 36,491 81,956
Agriculture
2. Perlombongan dan pengkuarian 16,421 75,172 558,428 650,021
Mining and quarrying
3. Pembuatan 223,451 174,305 52,556 450,312
Manufacturing
3.1 Makanan, minuman dan tembakau 21,654 22,836 2,919 47,409
Food, beverages and tobacco
3.2 Produk tekstil dan kayu 26,494 11,717 1,554 39,765
Textiles and wood products
3.3 Produk petroleum, kimia, getah dan plastik 66,343 56,097 9,794 132,234
Petroleum, chemicals, rubber and plastic products
3.4 Produk mineral bukan logam, logam asas dan produk logam yang direka 23,594 20,527 2,767 46,888
Non-metallic mineral products, basic metal and fabricated metal products
3.5 Produk elektrik, elektronik dan optikal 69,478 52,658 30,633 152,769
Electrical, electronic and optical products
3.6 Peralatan pengangkutan, pembuatan lain dan pembaikan 15,889 10,470 4,888 31,246
Transport equipment, other manufacturing and repair
4. Pembinaan 17,736 17,141 1,563 36,441
Construction
5. Perkhidmatan 2,108,344 276,513 126,125 2,510,981
Services
5.1 Utiliti 207,721 44,936 13,107 265,764
Utilities
5.2 Perdagangan borong dan runcit 100,023 21,505 11,771 133,300
Wholesale and retail trade
5.3 Makanan & minuman dan penginapan 23,887 8,758 1,182 33,827
Food & beverage and accommodation
5.4 Pengangkutan & penyimpanan dan maklumat & komunikasi 367,724 139,018 22,707 529,448
Transportation & storage and information & communication
5.5 Kewangan, insurans, hartanah dan perkhidmatan perniagaan 616,027 25,996 35,800 677,823
Finance, insurance, real estate and business services
5.6 Perkhidmatan lain 792,962 36,300 41,559 870,820
Other services
Jumlah SMP
Total PKS
Struktur
Structure
Jentera dan
peralatan
Machinery and
equipment
Aset lain
Other assets
Jumlah
Total
1. Pertanian 7.0 11.8 -3.2 2.8
Agriculture
2. Perlombongan dan pengkuarian 14.7 4.2 6.3 6.2
Mining and quarrying
3. Pembuatan 9.6 6.3 7.2 8.0
Manufacturing
3.1 Makanan, minuman dan tembakau 5.8 7.7 16.9 7.4
Food, beverages and tobacco
3.2 Produk tekstil dan kayu 1.9 -1.4 7.6 1.1
Textiles and wood products
3.3 Produk petroleum, kimia, getah dan plastik 19.9 12.0 12.5 15.9
Petroleum, chemicals, rubber and plastic products
3.4 Produk mineral bukan logam, logam asas dan produk logam yang direka 3.8 5.8 12.1 5.2
Non-metallic mineral products, basic metal and fabricated metal products
3.5 Produk elektrik, elektronik dan optikal 8.4 3.4 5.3 6.0
Electrical, electronic and optical products
3.6 Peralatan pengangkutan, pembuatan lain dan pembaikan 4.2 -0.2 2.1 2.4
Transport equipment, other manufacturing and repair
4. Pembinaan 6.3 10.3 3.9 8.1
Construction
5. Perkhidmatan 7.1 3.6 -0.5 6.3
Services
5.1 Utiliti 3.9 1.0 -9.3 2.7
Utilities
5.2 Perdagangan borong dan runcit 11.7 7.4 -1.7 9.7
Wholesale and retail trade
5.3 Makanan & minuman dan penginapan 6.7 14.1 1.2 8.3
Food & beverage and accommodation
5.4 Pengangkutan & penyimpanan dan maklumat & komunikasi 7.4 2.1 -8.6 5.2
Transportation & storage and information & communication
5.5 Kewangan, insurans, hartanah dan perkhidmatan perniagaan 10.3 14.4 9.1 10.4
Finance, insurance, real estate and business services
5.6 Perkhidmatan lain 4.9 1.4 0.1 4.5
Other services
Jumlah SMP
Total PKS
Perubahan peratusan tahunan
Annual percentage change
7.4 4.9 4.7 6.4
3,729,711
3.3
Nilai akhir tahun (RM juta)
End year value (RM million)
2,399,213 555,335 775,163
2016
75

Jadual SMP mengikut jenis aktiviti ekonomi dan jenis aset pada harga semasaTable PKS by kind of economic activity and type of assets at current prices 3.3
Struktur
Structure
Jentera dan
peralatan
Machinery and
equipment
Aset lain
Other assets
Jumlah
Total
1. Pertanian 1.4 2.2 4.7 2.2
Agriculture
2. Perlombongan dan pengkuarian 0.7 13.5 72.0 17.4
Mining and quarrying
3. Pembuatan 9.3 31.4 6.8 12.1
Manufacturing
3.1 Makanan, minuman dan tembakau 0.9 4.1 0.4 1.3
Food, beverages and tobacco
3.2 Produk tekstil dan kayu 1.1 2.1 0.2 1.1
Textiles and wood products
3.3 Produk petroleum, kimia, getah dan plastik 2.8 10.1 1.3 3.5
Petroleum, chemicals, rubber and plastic products
3.4 Produk mineral bukan logam, logam asas dan produk logam yang direka 1.0 3.7 0.4 1.3
Non-metallic mineral products, basic metal and fabricated metal products
3.5 Produk elektrik, elektronik dan optikal 2.9 9.5 4.0 4.1
Electrical, electronic and optical products
3.6 Peralatan pengangkutan, pembuatan lain dan pembaikan 0.7 1.9 0.6 0.8
Transport equipment, other manufacturing and repair
4. Pembinaan 0.7 3.1 0.2 1.0
Construction
5. Perkhidmatan 87.9 49.8 16.3 67.3
Services
5.1 Utiliti 8.7 8.1 1.7 7.1
Utilities
5.2 Perdagangan borong dan runcit 4.2 3.9 1.5 3.6
Wholesale and retail trade
5.3 Makanan & minuman dan penginapan 1.0 1.6 0.2 0.9
Food & beverage and accommodation
5.4 Pengangkutan & penyimpanan dan maklumat & komunikasi 15.3 25.0 2.9 14.2
Transportation & storage and information & communication
5.5 Kewangan, insurans, hartanah dan perkhidmatan perniagaan 25.7 4.7 4.6 18.2
Finance, insurance, real estate and business services
5.6 Perkhidmatan lain 33.1 6.5 5.4 23.3
Other services
Jumlah SMP
Total PKS
Struktur
Structure
Jentera dan
peralatan
Machinery and
equipment
Aset lain
Other assets
Jumlah
Total
1. Pertanian 40.6 14.9 44.5 100.0
Agriculture
2. Perlombongan dan pengkuarian 2.5 11.6 85.9 100.0
Mining and quarrying
3. Pembuatan 49.6 38.7 11.7 100.0
Manufacturing
3.1 Makanan, minuman dan tembakau 45.7 48.2 6.2 100.0
Food, beverages and tobacco
3.2 Produk tekstil dan kayu 66.6 29.5 3.9 100.0
Textiles and wood products
3.3 Produk petroleum, kimia, getah dan plastik 50.2 42.4 7.4 100.0
Petroleum, chemicals, rubber and plastic products
3.4 Produk mineral bukan logam, logam asas dan produk logam yang direka 50.3 43.8 5.9 100.0
Non-metallic mineral products, basic metal and fabricated metal products
3.5 Produk elektrik, elektronik dan optikal 45.5 34.5 20.1 100.0
Electrical, electronic and optical products
3.6 Peralatan pengangkutan, pembuatan lain dan pembaikan 50.9 33.5 15.6 100.0
Transport equipment, other manufacturing and repair
4. Pembinaan 48.7 47.0 4.3 100.0
Construction
5. Perkhidmatan 84.0 11.0 5.0 100.0
Services
5.1 Utiliti 78.2 16.9 4.9 100.0
Utilities
5.2 Perdagangan borong dan runcit 75.0 16.1 8.8 100.0
Wholesale and retail trade
5.3 Makanan & minuman dan penginapan 70.6 25.9 3.5 100.0
Food & beverage and accommodation
5.4 Pengangkutan & penyimpanan dan maklumat & komunikasi 69.5 26.3 4.3 100.0
Transportation & storage and information & communication
5.5 Kewangan, insurans, hartanah dan perkhidmatan perniagaan 90.9 3.8 5.3 100.0
Finance, insurance, real estate and business services
5.6 Perkhidmatan lain 91.1 4.2 4.8 100.0
Other services
Jumlah SMP
Total PKS64.3 14.9 20.8 100.0
100.0 100.0 100.0 100.0
Peratus sumbangan mengikut jenis aset
Percentage share by type of assets
Peratus sumbangan mengikut jenis aktiviti ekonomi
Percentage share by kind of economic activity2016
76

Jadual SMP mengikut jenis aktiviti ekonomi dan jenis aset pada harga semasaTable PKS by kind of economic activity and type of assets at current prices
Struktur
Structure
Jentera dan
peralatan
Machinery and
equipment
Aset lain
Other assets
Jumlah
Total
1. Pertanian 35,519 13,477 41,446 90,442
Agriculture
2. Perlombongan dan pengkuarian 19,667 77,234 583,370 680,271
Mining and quarrying
3. Pembuatan 242,526 189,466 56,741 488,733
Manufacturing
3.1 Makanan, minuman dan tembakau 22,744 24,252 3,392 50,389
Food, beverages and tobacco
3.2 Produk tekstil dan kayu 26,771 11,523 1,700 39,994
Textiles and wood products
3.3 Produk petroleum, kimia, getah dan plastik 77,145 63,344 11,087 151,576
Petroleum, chemicals, rubber and plastic products
3.4 Produk mineral bukan logam, logam asas dan produk logam yang direka 24,528 22,201 3,146 49,875
Non-metallic mineral products, basic metal and fabricated metal products
3.5 Produk elektrik, elektronik dan optikal 74,849 57,545 32,418 164,811
Electrical, electronic and optical products
3.6 Peralatan pengangkutan, pembuatan lain dan pembaikan 16,490 10,601 4,998 32,088
Transport equipment, other manufacturing and repair
4. Pembinaan 18,730 18,888 1,686 39,305
Construction
5. Perkhidmatan 2,253,377 288,823 134,052 2,676,252
Services
5.1 Utiliti 217,328 46,309 13,886 277,523
Utilities
5.2 Perdagangan borong dan runcit 110,868 22,956 12,080 145,904
Wholesale and retail trade
5.3 Makanan & minuman dan penginapan 25,492 9,867 1,266 36,625
Food & beverage and accommodation
5.4 Pengangkutan & penyimpanan dan maklumat & komunikasi 396,905 142,956 23,535 563,396
Transportation & storage and information & communication
5.5 Kewangan, insurans, hartanah dan perkhidmatan perniagaan 673,901 29,567 41,459 744,927
Finance, insurance, real estate and business services
5.6 Perkhidmatan lain 828,883 37,168 41,826 907,877
Other services
Jumlah SMP
Total PKS
Struktur
Structure
Jentera dan
peralatan
Machinery and
equipment
Aset lain
Other assets
Jumlah
Total
1. Pertanian 6.8 10.4 13.6 10.4
Agriculture
2. Perlombongan dan pengkuarian 19.8 2.7 4.5 4.7
Mining and quarrying
3. Pembuatan 8.5 8.7 8.0 8.5
Manufacturing
3.1 Makanan, minuman dan tembakau 5.0 6.2 16.2 6.3
Food, beverages and tobacco
3.2 Produk tekstil dan kayu 1.0 -1.7 9.4 0.6
Textiles and wood products
3.3 Produk petroleum, kimia, getah dan plastik 16.3 12.9 13.2 14.6
Petroleum, chemicals, rubber and plastic products
3.4 Produk mineral bukan logam, logam asas dan produk logam yang direka 4.0 8.2 13.7 6.4
Non-metallic mineral products, basic metal and fabricated metal products
3.5 Produk elektrik, elektronik dan optikal 7.7 9.3 5.8 7.9
Electrical, electronic and optical products
3.6 Peralatan pengangkutan, pembuatan lain dan pembaikan 3.8 1.3 2.2 2.7
Transport equipment, other manufacturing and repair
4. Pembinaan 5.6 10.2 7.9 7.9
Construction
5. Perkhidmatan 6.9 4.5 6.3 6.6
Services
5.1 Utiliti 4.6 3.1 5.9 4.4
Utilities
5.2 Perdagangan borong dan runcit 10.8 6.7 2.6 9.5
Wholesale and retail trade
5.3 Makanan & minuman dan penginapan 6.7 12.7 7.1 8.3
Food & beverage and accommodation
5.4 Pengangkutan & penyimpanan dan maklumat & komunikasi 7.9 2.8 3.6 6.4
Transportation & storage and information & communication
5.5 Kewangan, insurans, hartanah dan perkhidmatan perniagaan 9.4 13.7 15.8 9.9
Finance, insurance, real estate and business services
5.6 Perkhidmatan lain 4.5 2.4 0.6 4.3
Other services
Jumlah SMP
Total PKS
817,295 3,975,003
Perubahan peratusan tahunan
Annual percentage change
7.1 5.9 5.4 6.6
3.3
Nilai akhir tahun (RM juta)
End year value (RM million)
2,569,820 587,888
2017
77

Jadual SMP mengikut jenis aktiviti ekonomi dan jenis aset pada harga semasaTable PKS by kind of economic activity and type of assets at current prices 3.3
Struktur
Structure
Jentera dan
peralatan
Machinery and
equipment
Aset lain
Other assets
Jumlah
Total
1. Pertanian 1.4 2.3 5.1 2.3
Agriculture
2. Perlombongan dan pengkuarian 0.8 13.1 71.4 17.1
Mining and quarrying
3. Pembuatan 9.4 32.2 6.9 12.3
Manufacturing
3.1 Makanan, minuman dan tembakau 0.9 4.1 0.4 1.3
Food, beverages and tobacco
3.2 Produk tekstil dan kayu 1.0 2.0 0.2 1.0
Textiles and wood products
3.3 Produk petroleum, kimia, getah dan plastik 3.0 10.8 1.4 3.8
Petroleum, chemicals, rubber and plastic products
3.4 Produk mineral bukan logam, logam asas dan produk logam yang direka 1.0 3.8 0.4 1.3
Non-metallic mineral products, basic metal and fabricated metal products
3.5 Produk elektrik, elektronik dan optikal 2.9 9.8 4.0 4.1
Electrical, electronic and optical products
3.6 Peralatan pengangkutan, pembuatan lain dan pembaikan 0.6 1.8 0.6 0.8
Transport equipment, other manufacturing and repair
4. Pembinaan 0.7 3.2 0.2 1.0
Construction
5. Perkhidmatan 87.7 0.0 16.4 67.3
Services
5.1 Utiliti 8.5 7.9 1.7 7.0
Utilities
5.2 Perdagangan borong dan runcit 4.3 3.9 1.5 3.7
Wholesale and retail trade
5.3 Makanan & minuman dan penginapan 1.0 1.7 0.2 0.9
Food & beverage and accommodation
5.4 Pengangkutan & penyimpanan dan maklumat & komunikasi 15.4 24.3 2.9 14.2
Transportation & storage and information & communication
5.5 Kewangan, insurans, hartanah dan perkhidmatan perniagaan 26.2 5.0 5.1 18.7
Finance, insurance, real estate and business services
5.6 Perkhidmatan lain 32.3 6.3 5.1 22.8
Other services
Jumlah SMP
Total PKS
Struktur
Structure
Jentera dan
peralatan
Machinery and
equipment
Aset lain
Other assets
Jumlah
Total
1. Pertanian 39.3 14.9 45.8 100.0
Agriculture
2. Perlombongan dan pengkuarian 2.9 11.4 85.8 100.0
Mining and quarrying
3. Pembuatan 49.6 38.8 11.6 100.0
Manufacturing
3.1 Makanan, minuman dan tembakau 45.1 48.1 6.7 100.0
Food, beverages and tobacco
3.2 Produk tekstil dan kayu 66.9 28.8 4.3 100.0
Textiles and wood products
3.3 Produk petroleum, kimia, getah dan plastik 50.9 41.8 7.3 100.0
Petroleum, chemicals, rubber and plastic products
3.4 Produk mineral bukan logam, logam asas dan produk logam yang direka 49.2 44.5 6.3 100.0
Non-metallic mineral products, basic metal and fabricated metal products
3.5 Produk elektrik, elektronik dan optikal 45.4 34.9 19.7 100.0
Electrical, electronic and optical products
3.6 Peralatan pengangkutan, pembuatan lain dan pembaikan 51.4 33.0 15.6 100.0
Transport equipment, other manufacturing and repair
4. Pembinaan 47.7 48.1 4.3 100.0
Construction
5. Perkhidmatan 84.2 10.8 5.0 100.0
Services
5.1 Utiliti 78.3 16.7 5.0 100.0
Utilities
5.2 Perdagangan borong dan runcit 76.0 15.7 8.3 100.0
Wholesale and retail trade
5.3 Makanan & minuman dan penginapan 69.6 26.9 3.5 100.0
Food & beverage and accommodation
5.4 Pengangkutan & penyimpanan dan maklumat & komunikasi 70.4 25.4 4.2 100.0
Transportation & storage and information & communication
5.5 Kewangan, insurans, hartanah dan perkhidmatan perniagaan 90.5 4.0 5.6 100.0
Finance, insurance, real estate and business services
5.6 Perkhidmatan lain 91.3 4.1 4.6 100.0
Other services
Jumlah SMP
Total PKS
100.0
Peratus sumbangan mengikut jenis aset
Percentage share by type of assets
64.6 14.8 20.6 100.0
100.0
Peratus sumbangan mengikut jenis aktiviti ekonomi
Percentage share by kind of economic activity
100.0 50.9
2017
78

Jadual SMP mengikut jenis aktiviti ekonomi dan jenis aset pada harga malar 2010 Table PKS by kind of economic activity and type of assets at constant 2010 prices
Struktur
Structure
Jentera dan
peralatan
Machinery and
equipment
Aset lain
Other assets
Jumlah
Total
1. Pertanian 24,229 10,676 31,086 65,991
Agriculture
2. Perlombongan dan pengkuarian 11,151 70,783 347,821 429,755
Mining and quarrying
3. Pembuatan 159,602 161,188 42,720 363,510
Manufacturing
3.1 Makanan, minuman dan tembakau 16,019 20,824 2,038 38,881
Food, beverages and tobacco
3.2 Produk tekstil dan kayu 20,369 11,682 1,114 33,165
Textiles and wood products
3.3 Produk petroleum, kimia, getah dan plastik 43,301 49,258 7,363 99,922
Petroleum, chemicals, rubber and plastic products
3.4 Produk mineral bukan logam, logam asas dan produk logam yang direka 17,799 19,044 2,016 38,859
Non-metallic mineral products, basic metal and fabricated metal products
3.5 Produk elektrik, elektronik dan optikal 50,183 50,074 25,935 126,191
Electrical, electronic and optical products
3.6 Peralatan pengangkutan, pembuatan lain dan pembaikan 11,932 10,306 4,253 26,491
Transport equipment, other manufacturing and repair
4. Pembinaan 13,072 15,225 1,115 29,412
Construction
5. Perkhidmatan 1,537,538 260,332 95,582 1,893,452
Services
5.1 Utiliti 155,425 43,779 9,000 208,204
Utilities
5.2 Perdagangan borong dan runcit 70,154 19,556 7,943 97,653
Wholesale and retail trade
5.3 Makanan & minuman dan penginapan 17,537 7,537 816 25,889
Food & beverage and accommodation
5.4 Pengangkutan & penyimpanan dan maklumat & komunikasi 265,972 132,086 16,011 414,068
Transportation & storage and information & communication
5.5 Kewangan, insurans, hartanah dan perkhidmatan perniagaan 438,722 22,364 22,884 483,970
Finance, insurance, real estate and business services
5.6 Perkhidmatan lain 589,728 35,010 38,928 663,667
Other services
Jumlah SMP
Total PKS
Struktur
Structure
Jentera dan
peralatan
Machinery and
equipment
Aset lain
Other assets
Jumlah
Total
1. Pertanian 3.9 10.6 6.6 6.2
Agriculture
2. Perlombongan dan pengkuarian 13.8 9.4 7.4 7.9
Mining and quarrying
3. Pembuatan 5.9 3.9 7.7 5.2
Manufacturing
3.1 Makanan, minuman dan tembakau 3.7 10.8 26.1 8.4
Food, beverages and tobacco
3.2 Produk tekstil dan kayu -0.7 -2.7 10.7 -1.1
Textiles and wood products
3.3 Produk petroleum, kimia, getah dan plastik 14.0 6.9 12.1 10.3
Petroleum, chemicals, rubber and plastic products
3.4 Produk mineral bukan logam, logam asas dan produk logam yang direka 1.3 4.7 16.2 3.6
Non-metallic mineral products, basic metal and fabricated metal products
3.5 Produk elektrik, elektronik dan optikal 5.7 1.0 5.6 3.8
Electrical, electronic and optical products
3.6 Peralatan pengangkutan, pembuatan lain dan pembaikan 1.7 -1.1 2.0 0.6
Transport equipment, other manufacturing and repair
4. Pembinaan 3.5 9.3 4.8 6.4
Construction
5. Perkhidmatan 3.9 2.9 2.8 3.7
Services
5.1 Utiliti 1.4 1.1 2.5 1.4
Utilities
5.2 Perdagangan borong dan runcit 9.3 5.8 -3.3 7.4
Wholesale and retail trade
5.3 Makanan & minuman dan penginapan 3.4 13.8 3.4 6.2
Food & beverage and accommodation
5.4 Pengangkutan & penyimpanan dan maklumat & komunikasi 4.3 1.3 2.4 3.3
Transportation & storage and information & communication
5.5 Kewangan, insurans, hartanah dan perkhidmatan perniagaan 6.2 17.1 10.0 6.9
Finance, insurance, real estate and business services
5.6 Perkhidmatan lain 2.2 -0.2 0.5 1.9
Other services
Jumlah SMP
Total PKS
Perubahan peratusan tahunan
Annual percentage change
4.1 4.4 6.5 4.6
2,782,118
3.4
Nilai akhir tahun (RM juta)
End year value (RM million)
1,745,591 518,204 518,323
2015
79

Jadual SMP mengikut jenis aktiviti ekonomi dan jenis aset pada harga malar 2010 Table PKS by kind of economic activity and type of assets at constant 2010 prices 3.4
Struktur
Structure
Jentera dan
peralatan
Machinery and
equipment
Aset lain
Other assets
Jumlah
Total
1. Pertanian 1.4 2.1 6.0 2.4
Agriculture
2. Perlombongan dan pengkuarian 0.6 13.7 67.1 15.4
Mining and quarrying
3. Pembuatan 9.1 31.1 8.2 13.1
Manufacturing
3.1 Makanan, minuman dan tembakau 0.9 4.0 0.4 1.4
Food, beverages and tobacco
3.2 Produk tekstil dan kayu 1.2 2.3 0.2 1.2
Textiles and wood products
3.3 Produk petroleum, kimia, getah dan plastik 2.5 9.5 1.4 3.6
Petroleum, chemicals, rubber and plastic products
3.4 Produk mineral bukan logam, logam asas dan produk logam yang direka 1.0 3.7 0.4 1.4
Non-metallic mineral products, basic metal and fabricated metal products
3.5 Produk elektrik, elektronik dan optikal 2.9 9.7 5.0 4.5
Electrical, electronic and optical products
3.6 Peralatan pengangkutan, pembuatan lain dan pembaikan 0.7 2.0 0.8 1.0
Transport equipment, other manufacturing and repair
4. Pembinaan 0.7 2.9 0.2 1.1
Construction
5. Perkhidmatan 88.1 50.2 18.4 68.1
Services
5.1 Utiliti 8.9 8.4 1.7 7.5
Utilities
5.2 Perdagangan borong dan runcit 4.0 3.8 1.5 3.5
Wholesale and retail trade
5.3 Makanan & minuman dan penginapan 1.0 1.5 0.2 0.9
Food & beverage and accommodation
5.4 Pengangkutan & penyimpanan dan maklumat & komunikasi 15.2 25.5 3.1 14.9
Transportation & storage and information & communication
5.5 Kewangan, insurans, hartanah dan perkhidmatan perniagaan 25.1 4.3 4.4 17.4
Finance, insurance, real estate and business services
5.6 Perkhidmatan lain 33.8 6.8 7.5 23.9
Other services
Jumlah SMP
Total PKS
Struktur
Structure
Jentera dan
peralatan
Machinery and
equipment
Aset lain
Other assets
Jumlah
Total
1. Pertanian 36.7 16.2 47.1 100.0
Agriculture
2. Perlombongan dan pengkuarian 2.6 16.5 80.9 100.0
Mining and quarrying
3. Pembuatan 43.9 44.3 11.8 100.0
Manufacturing
3.1 Makanan, minuman dan tembakau 41.2 53.6 5.2 100.0
Food, beverages and tobacco
3.2 Produk tekstil dan kayu 61.4 35.2 3.4 100.0
Textiles and wood products
3.3 Produk petroleum, kimia, getah dan plastik 43.3 49.3 7.4 100.0
Petroleum, chemicals, rubber and plastic products
3.4 Produk mineral bukan logam, logam asas dan produk logam yang direka 45.8 49.0 5.2 100.0
Non-metallic mineral products, basic metal and fabricated metal products
3.5 Produk elektrik, elektronik dan optikal 39.8 39.7 20.6 100.0
Electrical, electronic and optical products
3.6 Peralatan pengangkutan, pembuatan lain dan pembaikan 45.0 38.9 16.1 100.0
Transport equipment, other manufacturing and repair
4. Pembinaan 44.4 51.8 3.8 100.0
Construction
5. Perkhidmatan 81.2 13.7 5.0 100.0
Services
5.1 Utiliti 74.7 21.0 4.3 100.0
Utilities
5.2 Perdagangan borong dan runcit 71.8 20.0 8.1 100.0
Wholesale and retail trade
5.3 Makanan & minuman dan penginapan 67.7 29.1 3.2 100.0
Food & beverage and accommodation
5.4 Pengangkutan & penyimpanan dan maklumat & komunikasi 64.2 31.9 3.9 100.0
Transportation & storage and information & communication
5.5 Kewangan, insurans, hartanah dan perkhidmatan perniagaan 90.7 4.6 4.7 100.0
Finance, insurance, real estate and business services
5.6 Perkhidmatan lain 88.9 5.3 5.9 100.0
Other services
Jumlah SMP
Total PKS62.7 18.6 18.6 100.0
100.0 100.0 100.0 100.0
Peratus sumbangan mengikut jenis aset
Percentage share by type of assets
Peratus sumbangan mengikut jenis aktiviti ekonomi
Percentage share by kind of economic activity2015
80
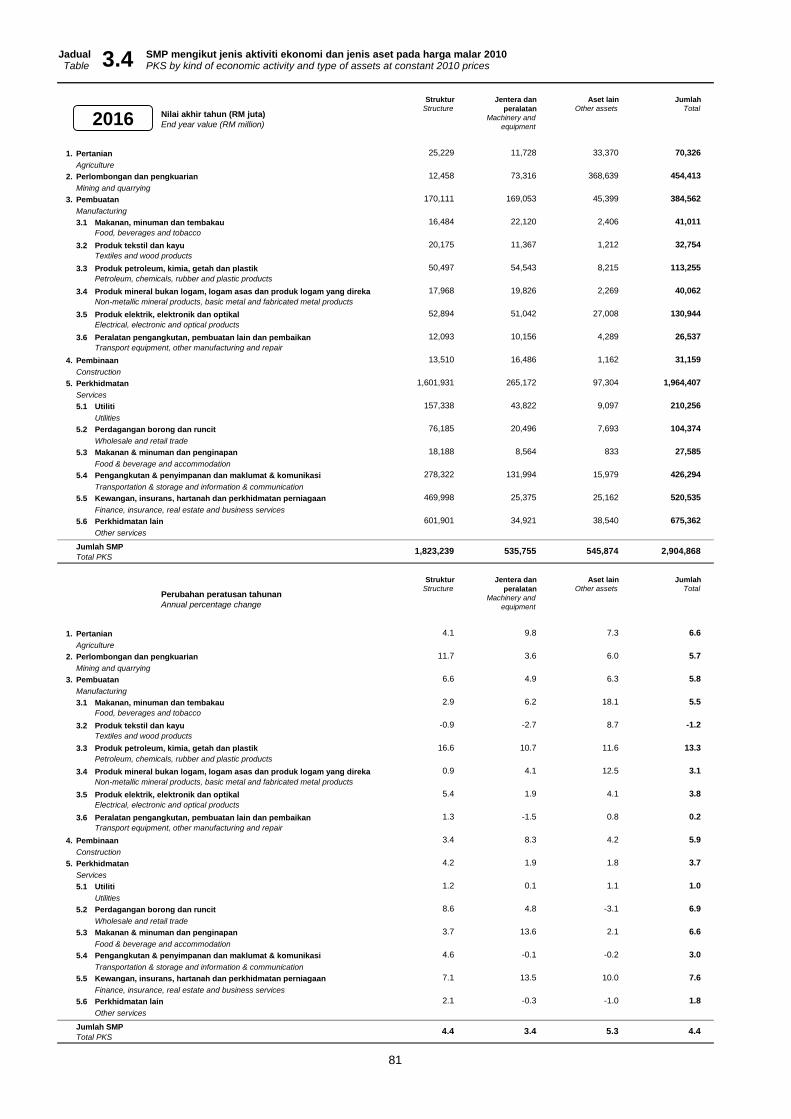
Jadual SMP mengikut jenis aktiviti ekonomi dan jenis aset pada harga malar 2010Table PKS by kind of economic activity and type of assets at constant 2010 prices
Struktur
Structure
Jentera dan
peralatan
Machinery and
equipment
Aset lain
Other assets
Jumlah
Total
1. Pertanian 25,229 11,728 33,370 70,326
Agriculture
2. Perlombongan dan pengkuarian 12,458 73,316 368,639 454,413
Mining and quarrying
3. Pembuatan 170,111 169,053 45,399 384,562
Manufacturing
3.1 Makanan, minuman dan tembakau 16,484 22,120 2,406 41,011
Food, beverages and tobacco
3.2 Produk tekstil dan kayu 20,175 11,367 1,212 32,754
Textiles and wood products
3.3 Produk petroleum, kimia, getah dan plastik 50,497 54,543 8,215 113,255
Petroleum, chemicals, rubber and plastic products
3.4 Produk mineral bukan logam, logam asas dan produk logam yang direka 17,968 19,826 2,269 40,062
Non-metallic mineral products, basic metal and fabricated metal products
3.5 Produk elektrik, elektronik dan optikal 52,894 51,042 27,008 130,944
Electrical, electronic and optical products
3.6 Peralatan pengangkutan, pembuatan lain dan pembaikan 12,093 10,156 4,289 26,537
Transport equipment, other manufacturing and repair
4. Pembinaan 13,510 16,486 1,162 31,159
Construction
5. Perkhidmatan 1,601,931 265,172 97,304 1,964,407
Services
5.1 Utiliti 157,338 43,822 9,097 210,256
Utilities
5.2 Perdagangan borong dan runcit 76,185 20,496 7,693 104,374
Wholesale and retail trade
5.3 Makanan & minuman dan penginapan 18,188 8,564 833 27,585
Food & beverage and accommodation
5.4 Pengangkutan & penyimpanan dan maklumat & komunikasi 278,322 131,994 15,979 426,294
Transportation & storage and information & communication
5.5 Kewangan, insurans, hartanah dan perkhidmatan perniagaan 469,998 25,375 25,162 520,535
Finance, insurance, real estate and business services
5.6 Perkhidmatan lain 601,901 34,921 38,540 675,362
Other services
Jumlah SMP
Total PKS
Struktur
Structure
Jentera dan
peralatan
Machinery and
equipment
Aset lain
Other assets
Jumlah
Total
1. Pertanian 4.1 9.8 7.3 6.6
Agriculture
2. Perlombongan dan pengkuarian 11.7 3.6 6.0 5.7
Mining and quarrying
3. Pembuatan 6.6 4.9 6.3 5.8
Manufacturing
3.1 Makanan, minuman dan tembakau 2.9 6.2 18.1 5.5
Food, beverages and tobacco
3.2 Produk tekstil dan kayu -0.9 -2.7 8.7 -1.2
Textiles and wood products
3.3 Produk petroleum, kimia, getah dan plastik 16.6 10.7 11.6 13.3
Petroleum, chemicals, rubber and plastic products
3.4 Produk mineral bukan logam, logam asas dan produk logam yang direka 0.9 4.1 12.5 3.1
Non-metallic mineral products, basic metal and fabricated metal products
3.5 Produk elektrik, elektronik dan optikal 5.4 1.9 4.1 3.8
Electrical, electronic and optical products
3.6 Peralatan pengangkutan, pembuatan lain dan pembaikan 1.3 -1.5 0.8 0.2
Transport equipment, other manufacturing and repair
4. Pembinaan 3.4 8.3 4.2 5.9
Construction
5. Perkhidmatan 4.2 1.9 1.8 3.7
Services
5.1 Utiliti 1.2 0.1 1.1 1.0
Utilities
5.2 Perdagangan borong dan runcit 8.6 4.8 -3.1 6.9
Wholesale and retail trade
5.3 Makanan & minuman dan penginapan 3.7 13.6 2.1 6.6
Food & beverage and accommodation
5.4 Pengangkutan & penyimpanan dan maklumat & komunikasi 4.6 -0.1 -0.2 3.0
Transportation & storage and information & communication
5.5 Kewangan, insurans, hartanah dan perkhidmatan perniagaan 7.1 13.5 10.0 7.6
Finance, insurance, real estate and business services
5.6 Perkhidmatan lain 2.1 -0.3 -1.0 1.8
Other services
Jumlah SMP
Total PKS
Perubahan peratusan tahunan
Annual percentage change
4.4 3.4 5.3 4.4
2,904,868
3.4
Nilai akhir tahun (RM juta)
End year value (RM million)
1,823,239 535,755 545,874
2016
81
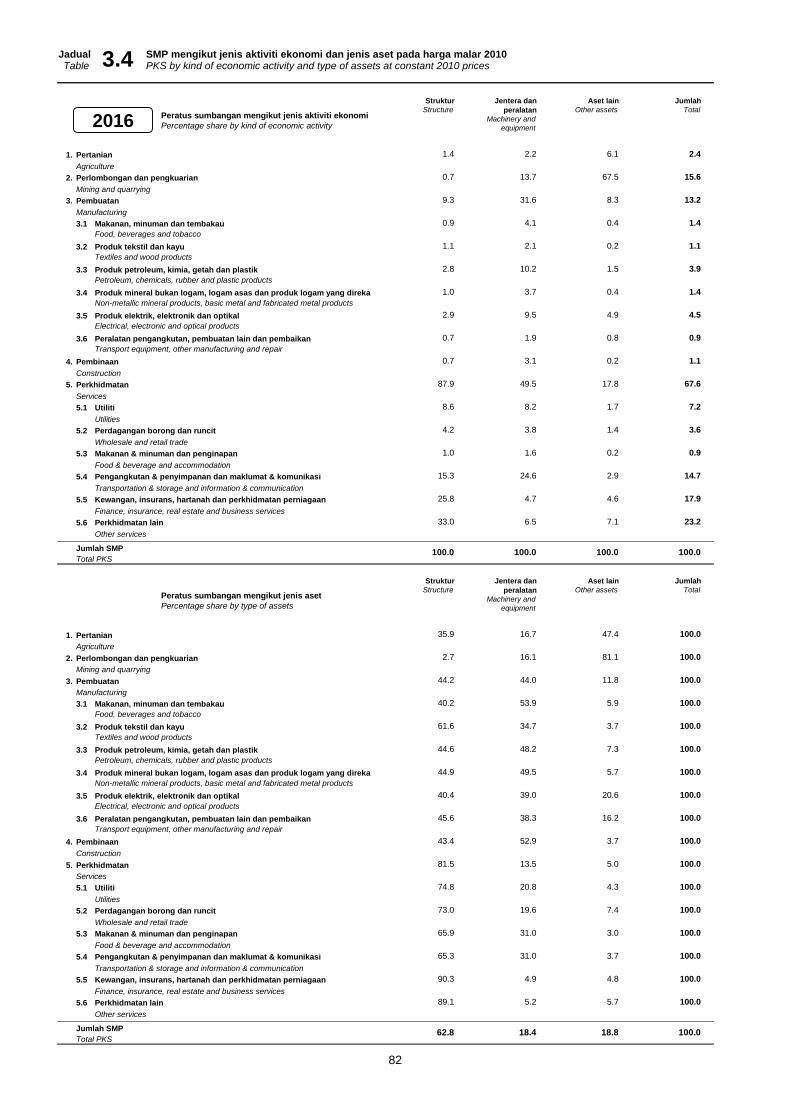
Jadual SMP mengikut jenis aktiviti ekonomi dan jenis aset pada harga malar 2010Table PKS by kind of economic activity and type of assets at constant 2010 prices 3.4
Struktur
Structure
Jentera dan
peralatan
Machinery and
equipment
Aset lain
Other assets
Jumlah
Total
1. Pertanian 1.4 2.2 6.1 2.4
Agriculture
2. Perlombongan dan pengkuarian 0.7 13.7 67.5 15.6
Mining and quarrying
3. Pembuatan 9.3 31.6 8.3 13.2
Manufacturing
3.1 Makanan, minuman dan tembakau 0.9 4.1 0.4 1.4
Food, beverages and tobacco
3.2 Produk tekstil dan kayu 1.1 2.1 0.2 1.1
Textiles and wood products
3.3 Produk petroleum, kimia, getah dan plastik 2.8 10.2 1.5 3.9
Petroleum, chemicals, rubber and plastic products
3.4 Produk mineral bukan logam, logam asas dan produk logam yang direka 1.0 3.7 0.4 1.4
Non-metallic mineral products, basic metal and fabricated metal products
3.5 Produk elektrik, elektronik dan optikal 2.9 9.5 4.9 4.5
Electrical, electronic and optical products
3.6 Peralatan pengangkutan, pembuatan lain dan pembaikan 0.7 1.9 0.8 0.9
Transport equipment, other manufacturing and repair
4. Pembinaan 0.7 3.1 0.2 1.1
Construction
5. Perkhidmatan 87.9 49.5 17.8 67.6
Services
5.1 Utiliti 8.6 8.2 1.7 7.2
Utilities
5.2 Perdagangan borong dan runcit 4.2 3.8 1.4 3.6
Wholesale and retail trade
5.3 Makanan & minuman dan penginapan 1.0 1.6 0.2 0.9
Food & beverage and accommodation
5.4 Pengangkutan & penyimpanan dan maklumat & komunikasi 15.3 24.6 2.9 14.7
Transportation & storage and information & communication
5.5 Kewangan, insurans, hartanah dan perkhidmatan perniagaan 25.8 4.7 4.6 17.9
Finance, insurance, real estate and business services
5.6 Perkhidmatan lain 33.0 6.5 7.1 23.2
Other services
Jumlah SMP
Total PKS
Struktur
Structure
Jentera dan
peralatan
Machinery and
equipment
Aset lain
Other assets
Jumlah
Total
1. Pertanian 35.9 16.7 47.4 100.0
Agriculture
2. Perlombongan dan pengkuarian 2.7 16.1 81.1 100.0
Mining and quarrying
3. Pembuatan 44.2 44.0 11.8 100.0
Manufacturing
3.1 Makanan, minuman dan tembakau 40.2 53.9 5.9 100.0
Food, beverages and tobacco
3.2 Produk tekstil dan kayu 61.6 34.7 3.7 100.0
Textiles and wood products
3.3 Produk petroleum, kimia, getah dan plastik 44.6 48.2 7.3 100.0
Petroleum, chemicals, rubber and plastic products
3.4 Produk mineral bukan logam, logam asas dan produk logam yang direka 44.9 49.5 5.7 100.0
Non-metallic mineral products, basic metal and fabricated metal products
3.5 Produk elektrik, elektronik dan optikal 40.4 39.0 20.6 100.0
Electrical, electronic and optical products
3.6 Peralatan pengangkutan, pembuatan lain dan pembaikan 45.6 38.3 16.2 100.0
Transport equipment, other manufacturing and repair
4. Pembinaan 43.4 52.9 3.7 100.0
Construction
5. Perkhidmatan 81.5 13.5 5.0 100.0
Services
5.1 Utiliti 74.8 20.8 4.3 100.0
Utilities
5.2 Perdagangan borong dan runcit 73.0 19.6 7.4 100.0
Wholesale and retail trade
5.3 Makanan & minuman dan penginapan 65.9 31.0 3.0 100.0
Food & beverage and accommodation
5.4 Pengangkutan & penyimpanan dan maklumat & komunikasi 65.3 31.0 3.7 100.0
Transportation & storage and information & communication
5.5 Kewangan, insurans, hartanah dan perkhidmatan perniagaan 90.3 4.9 4.8 100.0
Finance, insurance, real estate and business services
5.6 Perkhidmatan lain 89.1 5.2 5.7 100.0
Other services
Jumlah SMP
Total PKS62.8 18.4 18.8 100.0
100.0 100.0 100.0 100.0
Peratus sumbangan mengikut jenis aset
Percentage share by type of assets
Peratus sumbangan mengikut jenis aktiviti ekonomi
Percentage share by kind of economic activity2016
82

Jadual SMP mengikut jenis aktiviti ekonomi dan jenis aset pada harga malar 2010Table PKS by kind of economic activity and type of assets at constant 2010 prices
Struktur
Structure
Jentera dan
peralatan
Machinery and
equipment
Aset lain
Other assets
Jumlah
Total
1. Pertanian 26,319 12,736 35,109 74,164
Agriculture
2. Perlombongan dan pengkuarian 14,571 74,584 385,094 474,249
Mining and quarrying
3. Pembuatan 180,421 182,218 47,992 410,631
Manufacturing
3.1 Makanan, minuman dan tembakau 16,923 23,272 2,752 42,947
Food, beverages and tobacco
3.2 Produk tekstil dan kayu 19,924 11,082 1,295 32,301
Textiles and wood products
3.3 Produk petroleum, kimia, getah dan plastik 57,371 61,129 9,077 127,576
Petroleum, chemicals, rubber and plastic products
3.4 Produk mineral bukan logam, logam asas dan produk logam yang direka 18,255 21,228 2,534 42,018
Non-metallic mineral products, basic metal and fabricated metal products
3.5 Produk elektrik, elektronik dan optikal 55,684 55,313 28,029 139,025
Electrical, electronic and optical products
3.6 Peralatan pengangkutan, pembuatan lain dan pembaikan 12,264 10,194 4,305 26,764
Transport equipment, other manufacturing and repair
4. Pembinaan 13,950 17,887 1,205 33,043
Construction
5. Perkhidmatan 1,673,802 272,822 98,567 2,045,191
Services
5.1 Utiliti 160,731 44,899 9,128 214,757
Utilities
5.2 Perdagangan borong dan runcit 82,525 21,337 7,466 111,327
Wholesale and retail trade
5.3 Makanan & minuman dan penginapan 18,967 9,589 850 29,406
Food & beverage and accommodation
5.4 Pengangkutan & penyimpanan dan maklumat & komunikasi 293,242 133,082 15,893 442,218
Transportation & storage and information & communication
5.5 Kewangan, insurans, hartanah dan perkhidmatan perniagaan 503,805 28,596 27,331 559,732
Finance, insurance, real estate and business services
5.6 Perkhidmatan lain 614,533 35,318 37,900 687,751
Other services
Jumlah SMP
Total PKS
Struktur
Structure
Jentera dan
peralatan
Machinery and
equipment
Aset lain
Other assets
Jumlah
Total
1. Pertanian 4.3 8.6 5.2 5.5
Agriculture
2. Perlombongan dan pengkuarian 17.0 1.7 4.5 4.4
Mining and quarrying
3. Pembuatan 6.1 7.8 5.7 6.8
Manufacturing
3.1 Makanan, minuman dan tembakau 2.7 5.2 14.4 4.7
Food, beverages and tobacco
3.2 Produk tekstil dan kayu -1.2 -2.5 6.9 -1.4
Textiles and wood products
3.3 Produk petroleum, kimia, getah dan plastik 13.6 12.1 10.5 12.6
Petroleum, chemicals, rubber and plastic products
3.4 Produk mineral bukan logam, logam asas dan produk logam yang direka 1.6 7.1 11.7 4.9
Non-metallic mineral products, basic metal and fabricated metal products
3.5 Produk elektrik, elektronik dan optikal 5.3 8.4 3.8 6.2
Electrical, electronic and optical products
3.6 Peralatan pengangkutan, pembuatan lain dan pembaikan 1.4 0.4 0.4 0.9
Transport equipment, other manufacturing and repair
4. Pembinaan 3.3 8.5 3.7 6.0
Construction
5. Perkhidmatan 4.5 2.9 1.3 4.1
Services
5.1 Utiliti 2.2 2.5 0.3 2.1
Utilities
5.2 Perdagangan borong dan runcit 8.3 4.1 -3.0 6.7
Wholesale and retail trade
5.3 Makanan & minuman dan penginapan 4.3 12.0 2.1 6.6
Food & beverage and accommodation
5.4 Pengangkutan & penyimpanan dan maklumat & komunikasi 5.4 0.8 -0.5 3.7
Transportation & storage and information & communication
5.5 Kewangan, insurans, hartanah dan perkhidmatan perniagaan 7.2 12.7 8.6 7.5
Finance, insurance, real estate and business services
5.6 Perkhidmatan lain 2.1 1.1 -1.7 1.8
Other services
Jumlah SMP
Total PKS
567,967 3,037,277
Perubahan peratusan tahunan
Annual percentage change
4.7 4.6 4.0 4.6
3.4
Nilai akhir tahun (RM juta)
End year value (RM million)
1,909,063 560,247
2017
83

Jadual SMP mengikut jenis aktiviti ekonomi dan jenis aset pada harga malar 2010Table PKS by kind of economic activity and type of assets at constant 2010 prices 3.4
Struktur
Structure
Jentera dan
peralatan
Machinery and
equipment
Aset lain
Other assets
Jumlah
Total
1. Pertanian 1.4 2.3 6.2 2.4
Agriculture
2. Perlombongan dan pengkuarian 0.8 13.3 67.8 15.6
Mining and quarrying
3. Pembuatan 9.5 32.5 8.4 13.5
Manufacturing
3.1 Makanan, minuman dan tembakau 0.9 4.2 0.5 1.4
Food, beverages and tobacco
3.2 Produk tekstil dan kayu 1.0 2.0 0.2 1.1
Textiles and wood products
3.3 Produk petroleum, kimia, getah dan plastik 3.0 10.9 1.6 4.2
Petroleum, chemicals, rubber and plastic products
3.4 Produk mineral bukan logam, logam asas dan produk logam yang direka 1.0 3.8 0.4 1.4
Non-metallic mineral products, basic metal and fabricated metal products
3.5 Produk elektrik, elektronik dan optikal 2.9 9.9 4.9 4.6
Electrical, electronic and optical products
3.6 Peralatan pengangkutan, pembuatan lain dan pembaikan 0.6 1.8 0.8 0.9
Transport equipment, other manufacturing and repair
4. Pembinaan 0.7 3.2 0.2 1.1
Construction
5. Perkhidmatan 87.7 48.7 17.4 67.3
Services
5.1 Utiliti 8.4 8.0 1.6 7.1
Utilities
5.2 Perdagangan borong dan runcit 4.3 3.8 1.3 3.7
Wholesale and retail trade
5.3 Makanan & minuman dan penginapan 1.0 1.7 0.1 1.0
Food & beverage and accommodation
5.4 Pengangkutan & penyimpanan dan maklumat & komunikasi 15.4 23.8 2.8 14.6
Transportation & storage and information & communication
5.5 Kewangan, insurans, hartanah dan perkhidmatan perniagaan 26.4 5.1 4.8 18.4
Finance, insurance, real estate and business services
5.6 Perkhidmatan lain 32.2 6.3 6.7 22.6
Other services
Jumlah SMP
Total PKS
Struktur
Structure
Jentera dan
peralatan
Machinery and
equipment
Aset lain
Other assets
Jumlah
Total
1. Pertanian 35.5 17.2 47.3 100.0
Agriculture
2. Perlombongan dan pengkuarian 3.1 15.7 81.2 100.0
Mining and quarrying
3. Pembuatan 43.9 44.4 11.7 100.0
Manufacturing
3.1 Makanan, minuman dan tembakau 39.4 54.2 6.4 100.0
Food, beverages and tobacco
3.2 Produk tekstil dan kayu 61.7 34.3 4.0 100.0
Textiles and wood products
3.3 Produk petroleum, kimia, getah dan plastik 45.0 47.9 7.1 100.0
Petroleum, chemicals, rubber and plastic products
3.4 Produk mineral bukan logam, logam asas dan produk logam yang direka 43.4 50.5 6.0 100.0
Non-metallic mineral products, basic metal and fabricated metal products
3.5 Produk elektrik, elektronik dan optikal 40.1 39.8 20.2 100.0
Electrical, electronic and optical products
3.6 Peralatan pengangkutan, pembuatan lain dan pembaikan 45.8 38.1 16.1 100.0
Transport equipment, other manufacturing and repair
4. Pembinaan 42.2 54.1 3.6 100.0
Construction
5. Perkhidmatan 81.8 13.3 4.8 100.0
Services
5.1 Utiliti 74.8 20.9 4.3 100.0
Utilities
5.2 Perdagangan borong dan runcit 74.1 19.2 6.7 100.0
Wholesale and retail trade
5.3 Makanan & minuman dan penginapan 64.5 32.6 2.9 100.0
Food & beverage and accommodation
5.4 Pengangkutan & penyimpanan dan maklumat & komunikasi 66.3 30.1 3.6 100.0
Transportation & storage and information & communication
5.5 Kewangan, insurans, hartanah dan perkhidmatan perniagaan 90.0 5.1 4.9 100.0
Finance, insurance, real estate and business services
5.6 Perkhidmatan lain 89.4 5.1 5.5 100.0
Other services
Jumlah SMP
Total PKS
100.0
Peratus sumbangan mengikut jenis aset
Percentage share by type of assets
62.9 18.4 18.7 100.0
100.0
Peratus sumbangan mengikut jenis aktiviti ekonomi
Percentage share by kind of economic activity
100.0 100.0
2017
84

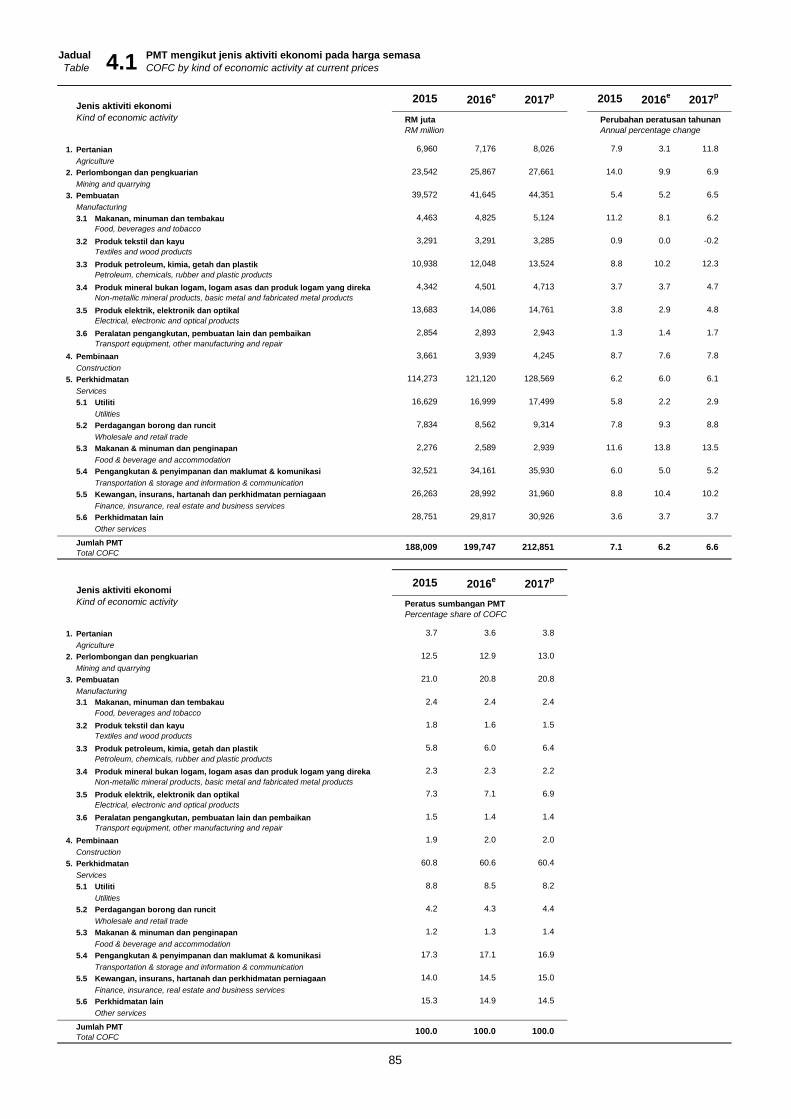
Jadual PMT mengikut jenis aktiviti ekonomi pada harga semasa
Table COFC by kind of economic activity at current prices
Jenis aktiviti ekonomi
Kind of economic activity RM juta Perubahan peratusan tahunan
RM million Annual percentage change
1. Pertanian 6,960 7,176 8,026 7.9 3.1 11.8
Agriculture
2. Perlombongan dan pengkuarian 23,542 25,867 27,661 14.0 9.9 6.9
Mining and quarrying
3. Pembuatan 39,572 41,645 44,351 5.4 5.2 6.5
Manufacturing
3.1 Makanan, minuman dan tembakau 4,463 4,825 5,124 11.2 8.1 6.2
Food, beverages and tobacco
3.2 Produk tekstil dan kayu 3,291 3,291 3,285 0.9 0.0 -0.2
Textiles and wood products
3.3 Produk petroleum, kimia, getah dan plastik 10,938 12,048 13,524 8.8 10.2 12.3
Petroleum, chemicals, rubber and plastic products
3.4 Produk mineral bukan logam, logam asas dan produk logam yang direka 4,342 4,501 4,713 3.7 3.7 4.7
Non-metallic mineral products, basic metal and fabricated metal products
3.5 Produk elektrik, elektronik dan optikal 13,683 14,086 14,761 3.8 2.9 4.8
Electrical, electronic and optical products
3.6 Peralatan pengangkutan, pembuatan lain dan pembaikan 2,854 2,893 2,943 1.3 1.4 1.7
Transport equipment, other manufacturing and repair
4. Pembinaan 3,661 3,939 4,245 8.7 7.6 7.8
Construction
5. Perkhidmatan 114,273 121,120 128,569 6.2 6.0 6.1
Services
5.1 Utiliti 16,629 16,999 17,499 5.8 2.2 2.9
Utilities
5.2 Perdagangan borong dan runcit 7,834 8,562 9,314 7.8 9.3 8.8
Wholesale and retail trade
5.3 Makanan & minuman dan penginapan 2,276 2,589 2,939 11.6 13.8 13.5
Food & beverage and accommodation
5.4 Pengangkutan & penyimpanan dan maklumat & komunikasi 32,521 34,161 35,930 6.0 5.0 5.2
Transportation & storage and information & communication
5.5 Kewangan, insurans, hartanah dan perkhidmatan perniagaan 26,263 28,992 31,960 8.8 10.4 10.2
Finance, insurance, real estate and business services
5.6 Perkhidmatan lain 28,751 29,817 30,926 3.6 3.7 3.7
Other services
Jumlah PMT
Total COFC
Jenis aktiviti ekonomi
Kind of economic activity Peratus sumbangan PMT
Percentage share of COFC
1. Pertanian 3.7 3.6 3.8
Agriculture
2. Perlombongan dan pengkuarian 12.5 12.9 13.0
Mining and quarrying
3. Pembuatan 21.0 20.8 20.8
Manufacturing
3.1 Makanan, minuman dan tembakau 2.4 2.4 2.4
Food, beverages and tobacco
3.2 Produk tekstil dan kayu 1.8 1.6 1.5
Textiles and wood products
3.3 Produk petroleum, kimia, getah dan plastik 5.8 6.0 6.4
Petroleum, chemicals, rubber and plastic products
3.4 Produk mineral bukan logam, logam asas dan produk logam yang direka 2.3 2.3 2.2
Non-metallic mineral products, basic metal and fabricated metal products
3.5 Produk elektrik, elektronik dan optikal 7.3 7.1 6.9
Electrical, electronic and optical products
3.6 Peralatan pengangkutan, pembuatan lain dan pembaikan 1.5 1.4 1.4
Transport equipment, other manufacturing and repair
4. Pembinaan 1.9 2.0 2.0
Construction
5. Perkhidmatan 60.8 60.6 60.4
Services
5.1 Utiliti 8.8 8.5 8.2
Utilities
5.2 Perdagangan borong dan runcit 4.2 4.3 4.4
Wholesale and retail trade
5.3 Makanan & minuman dan penginapan 1.2 1.3 1.4
Food & beverage and accommodation
5.4 Pengangkutan & penyimpanan dan maklumat & komunikasi 17.3 17.1 16.9
Transportation & storage and information & communication
5.5 Kewangan, insurans, hartanah dan perkhidmatan perniagaan 14.0 14.5 15.0
Finance, insurance, real estate and business services
5.6 Perkhidmatan lain 15.3 14.9 14.5
Other services
Jumlah PMT
Total COFC
2015
2015 2016e
2016e
20152017p
2017p
6.6
2016e
100.0
7.1 6.2212,851
2017p
4.1
188,009 199,747
100.0 100.0
85
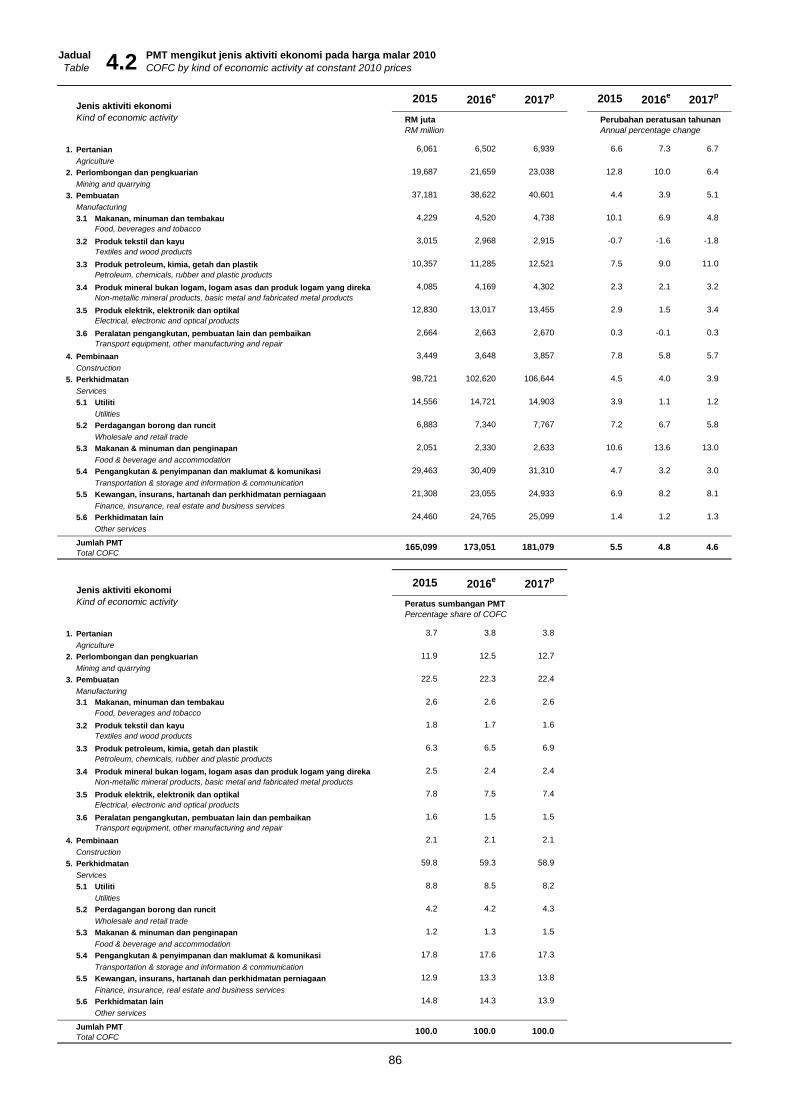
Jadual PMT mengikut jenis aktiviti ekonomi pada harga malar 2010
Table COFC by kind of economic activity at constant 2010 prices
Jenis aktiviti ekonomi
Kind of economic activity RM juta Perubahan peratusan tahunan
RM million Annual percentage change
1. Pertanian 6,061 6,502 6,939 6.6 7.3 6.7
Agriculture
2. Perlombongan dan pengkuarian 19,687 21,659 23,038 12.8 10.0 6.4
Mining and quarrying
3. Pembuatan 37,181 38,622 40,601 4.4 3.9 5.1
Manufacturing
3.1 Makanan, minuman dan tembakau 4,229 4,520 4,738 10.1 6.9 4.8
Food, beverages and tobacco
3.2 Produk tekstil dan kayu 3,015 2,968 2,915 -0.7 -1.6 -1.8
Textiles and wood products
3.3 Produk petroleum, kimia, getah dan plastik 10,357 11,285 12,521 7.5 9.0 11.0
Petroleum, chemicals, rubber and plastic products
3.4 Produk mineral bukan logam, logam asas dan produk logam yang direka 4,085 4,169 4,302 2.3 2.1 3.2
Non-metallic mineral products, basic metal and fabricated metal products
3.5 Produk elektrik, elektronik dan optikal 12,830 13,017 13,455 2.9 1.5 3.4
Electrical, electronic and optical products
3.6 Peralatan pengangkutan, pembuatan lain dan pembaikan 2,664 2,663 2,670 0.3 -0.1 0.3
Transport equipment, other manufacturing and repair
4. Pembinaan 3,449 3,648 3,857 7.8 5.8 5.7
Construction
5. Perkhidmatan 98,721 102,620 106,644 4.5 4.0 3.9
Services
5.1 Utiliti 14,556 14,721 14,903 3.9 1.1 1.2
Utilities
5.2 Perdagangan borong dan runcit 6,883 7,340 7,767 7.2 6.7 5.8
Wholesale and retail trade
5.3 Makanan & minuman dan penginapan 2,051 2,330 2,633 10.6 13.6 13.0
Food & beverage and accommodation
5.4 Pengangkutan & penyimpanan dan maklumat & komunikasi 29,463 30,409 31,310 4.7 3.2 3.0
Transportation & storage and information & communication
5.5 Kewangan, insurans, hartanah dan perkhidmatan perniagaan 21,308 23,055 24,933 6.9 8.2 8.1
Finance, insurance, real estate and business services
5.6 Perkhidmatan lain 24,460 24,765 25,099 1.4 1.2 1.3
Other services
Jumlah PMT
Total COFC
Jenis aktiviti ekonomi
Kind of economic activity Peratus sumbangan PMT
Percentage share of COFC
1. Pertanian 3.7 3.8 3.8
Agriculture
2. Perlombongan dan pengkuarian 11.9 12.5 12.7
Mining and quarrying
3. Pembuatan 22.5 22.3 22.4
Manufacturing
3.1 Makanan, minuman dan tembakau 2.6 2.6 2.6
Food, beverages and tobacco
3.2 Produk tekstil dan kayu 1.8 1.7 1.6
Textiles and wood products
3.3 Produk petroleum, kimia, getah dan plastik 6.3 6.5 6.9
Petroleum, chemicals, rubber and plastic products
3.4 Produk mineral bukan logam, logam asas dan produk logam yang direka 2.5 2.4 2.4
Non-metallic mineral products, basic metal and fabricated metal products
3.5 Produk elektrik, elektronik dan optikal 7.8 7.5 7.4
Electrical, electronic and optical products
3.6 Peralatan pengangkutan, pembuatan lain dan pembaikan 1.6 1.5 1.5
Transport equipment, other manufacturing and repair
4. Pembinaan 2.1 2.1 2.1
Construction
5. Perkhidmatan 59.8 59.3 58.9
Services
5.1 Utiliti 8.8 8.5 8.2
Utilities
5.2 Perdagangan borong dan runcit 4.2 4.2 4.3
Wholesale and retail trade
5.3 Makanan & minuman dan penginapan 1.2 1.3 1.5
Food & beverage and accommodation
5.4 Pengangkutan & penyimpanan dan maklumat & komunikasi 17.8 17.6 17.3
Transportation & storage and information & communication
5.5 Kewangan, insurans, hartanah dan perkhidmatan perniagaan 12.9 13.3 13.8
Finance, insurance, real estate and business services
5.6 Perkhidmatan lain 14.8 14.3 13.9
Other services
Jumlah PMT
Total COFC100.0 100.0 100.0
2015 2016e
2017p
165,099 173,051 181,079
4.2
2015 2016e
2017p
2017p
4.65.5 4.8
2015 2016e
86

Jadual PMT mengikut jenis aktiviti ekonomi dan jenis aset pada harga semasaTable COFC by kind of economic activity and type of assets at current prices
Struktur
Structure
Jentera dan
peralatan
Machinery and
equipment
Aset lain
Other assets
Jumlah
Total
1. Pertanian 1,143 1,888 3,929 6,960
Agriculture
2. Perlombongan dan pengkuarian 505 12,362 10,676 23,542
Mining and quarrying
3. Pembuatan 7,045 28,328 4,199 39,572
Manufacturing
3.1 Makanan, minuman dan tembakau 699 3,587 177 4,463
Food, beverages and tobacco
3.2 Produk tekstil dan kayu 1,035 2,156 100 3,291
Textiles and wood products
3.3 Produk petroleum, kimia, getah dan plastik 1,730 8,531 677 10,938
Petroleum, chemicals, rubber and plastic products
3.4 Produk mineral bukan logam, logam asas dan produk logam yang direka 819 3,342 181 4,342
Non-metallic mineral products, basic metal and fabricated metal products
3.5 Produk elektrik, elektronik dan optikal 2,211 8,839 2,633 13,683
Electrical, electronic and optical products
3.6 Peralatan pengangkutan, pembuatan lain dan pembaikan 551 1,873 430 2,854
Transport equipment, other manufacturing and repair
4. Pembinaan 604 2,950 106 3,661
Construction
5. Perkhidmatan 57,640 46,637 9,996 114,273
Services
5.1 Utiliti 7,666 8,179 784 16,629
Utilities
5.2 Perdagangan borong dan runcit 2,806 4,278 750 7,834
Wholesale and retail trade
5.3 Makanan & minuman dan penginapan 843 1,360 73 2,276
Food & beverage and accommodation
5.4 Pengangkutan & penyimpanan dan maklumat & komunikasi 8,811 21,976 1,734 32,521
Transportation & storage and information & communication
5.5 Kewangan, insurans, hartanah dan perkhidmatan perniagaan 19,691 4,174 2,397 26,263
Finance, insurance, real estate and business services
5.6 Perkhidmatan lain 17,823 6,669 4,259 28,751
Other services
Jumlah PMT
Total COFC
Struktur
Structure
Jentera dan
peralatan
Machinery and
equipment
Aset lain
Other assets
Jumlah
Total
1. Pertanian 5.4 9.8 7.7 7.9
Agriculture
2. Perlombongan dan pengkuarian 11.1 16.0 11.9 14.0
Mining and quarrying
3. Pembuatan 8.5 4.6 6.2 5.4
Manufacturing
3.1 Makanan, minuman dan tembakau 8.1 11.6 14.8 11.2
Food, beverages and tobacco
3.2 Produk tekstil dan kayu 3.4 -0.5 5.9 0.9
Textiles and wood products
3.3 Produk petroleum, kimia, getah dan plastik 14.2 7.6 10.8 8.8
Petroleum, chemicals, rubber and plastic products
3.4 Produk mineral bukan logam, logam asas dan produk logam yang direka 6.2 2.8 9.9 3.7
Non-metallic mineral products, basic metal and fabricated metal products
3.5 Produk elektrik, elektronik dan optikal 8.4 2.5 4.5 3.8
Electrical, electronic and optical products
3.6 Peralatan pengangkutan, pembuatan lain dan pembaikan 5.5 -0.8 5.5 1.3
Transport equipment, other manufacturing and repair
4. Pembinaan 6.2 9.4 3.1 8.7
Construction
5. Perkhidmatan 7.4 5.6 2.7 6.2
Services
5.1 Utiliti 4.6 6.3 11.7 5.8
Utilities
5.2 Perdagangan borong dan runcit 12.4 8.2 -8.1 7.8
Wholesale and retail trade
5.3 Makanan & minuman dan penginapan 5.7 16.2 2.3 11.6
Food & beverage and accommodation
5.4 Pengangkutan & penyimpanan dan maklumat & komunikasi 8.8 4.8 8.5 6.0
Transportation & storage and information & communication
5.5 Kewangan, insurans, hartanah dan perkhidmatan perniagaan 8.2 14.9 4.0 8.8
Finance, insurance, real estate and business services
5.6 Perkhidmatan lain 6.3 -1.2 0.3 3.6
Other services
Jumlah PMT
Total COFC
Perubahan peratusan tahunan
Annual percentage change
7.5 6.8 7.1 7.1
188,009
4.3
RM juta
RM million
66,938 92,165 28,907
2015
87

Jadual PMT mengikut jenis aktiviti ekonomi dan jenis aset pada harga semasaTable COFC by kind of economic activity and type of assets at current prices 4.3
Struktur
Structure
Jentera dan
peralatan
Machinery and
equipment
Aset lain
Other assets
Jumlah
Total
1. Pertanian 1.7 2.0 13.6 3.7
Agriculture
2. Perlombongan dan pengkuarian 0.8 13.4 36.9 12.5
Mining and quarrying
3. Pembuatan 10.5 30.7 14.5 21.0
Manufacturing
3.1 Makanan, minuman dan tembakau 1.0 3.9 0.6 2.4
Food, beverages and tobacco
3.2 Produk tekstil dan kayu 1.5 2.3 0.3 1.8
Textiles and wood products
3.3 Produk petroleum, kimia, getah dan plastik 2.6 9.3 2.3 5.8
Petroleum, chemicals, rubber and plastic products
3.4 Produk mineral bukan logam, logam asas dan produk logam yang direka 1.2 3.6 0.6 2.3
Non-metallic mineral products, basic metal and fabricated metal products
3.5 Produk elektrik, elektronik dan optikal 3.3 9.6 9.1 7.3
Electrical, electronic and optical products
3.6 Peralatan pengangkutan, pembuatan lain dan pembaikan 0.8 2.0 1.5 1.5
Transport equipment, other manufacturing and repair
4. Pembinaan 0.9 3.2 0.4 1.9
Construction
5. Perkhidmatan 86.1 50.6 34.6 60.8
Services
5.1 Utiliti 11.5 8.9 2.7 8.8
Utilities
5.2 Perdagangan borong dan runcit 4.2 4.6 2.6 4.2
Wholesale and retail trade
5.3 Makanan & minuman dan penginapan 1.3 1.5 0.3 1.2
Food & beverage and accommodation
5.4 Pengangkutan & penyimpanan dan maklumat & komunikasi 13.2 23.8 6.0 17.3
Transportation & storage and information & communication
5.5 Kewangan, insurans, hartanah dan perkhidmatan perniagaan 29.4 4.5 8.3 14.0
Finance, insurance, real estate and business services
5.6 Perkhidmatan lain 26.6 7.2 14.7 15.3
Other services
Jumlah PMT
Total COFC
Struktur
Structure
Jentera dan
peralatan
Machinery and
equipment
Aset lain
Other assets
Jumlah
Total
1. Pertanian 16.4 27.1 56.5 100.0
Agriculture
2. Perlombongan dan pengkuarian 2.1 52.5 45.3 100.0
Mining and quarrying
3. Pembuatan 17.8 71.6 10.6 100.0
Manufacturing
3.1 Makanan, minuman dan tembakau 15.7 80.4 4.0 100.0
Food, beverages and tobacco
3.2 Produk tekstil dan kayu 31.4 65.5 3.0 100.0
Textiles and wood products
3.3 Produk petroleum, kimia, getah dan plastik 15.8 78.0 6.2 100.0
Petroleum, chemicals, rubber and plastic products
3.4 Produk mineral bukan logam, logam asas dan produk logam yang direka 18.9 77.0 4.2 100.0
Non-metallic mineral products, basic metal and fabricated metal products
3.5 Produk elektrik, elektronik dan optikal 16.2 64.6 19.2 100.0
Electrical, electronic and optical products
3.6 Peralatan pengangkutan, pembuatan lain dan pembaikan 19.3 65.6 15.1 100.0
Transport equipment, other manufacturing and repair
4. Pembinaan 16.5 80.6 2.9 100.0
Construction
5. Perkhidmatan 50.4 40.8 8.7 100.0
Services
5.1 Utiliti 46.1 49.2 4.7 100.0
Utilities
5.2 Perdagangan borong dan runcit 35.8 54.6 9.6 100.0
Wholesale and retail trade
5.3 Makanan & minuman dan penginapan 37.1 59.8 3.2 100.0
Food & beverage and accommodation
5.4 Pengangkutan & penyimpanan dan maklumat & komunikasi 27.1 67.6 5.3 100.0
Transportation & storage and information & communication
5.5 Kewangan, insurans, hartanah dan perkhidmatan perniagaan 75.0 15.9 9.1 100.0
Finance, insurance, real estate and business services
5.6 Perkhidmatan lain 62.0 23.2 14.8 100.0
Other services
Jumlah PMT
Total COFC35.6 49.0 15.4 100.0
100.0 100.0 100.0 100.0
Peratus sumbangan mengikut jenis aset
Percentage share by type of assets
Peratus sumbangan mengikut jenis aktiviti ekonomi
Percentage share by kind of economic activity2015
88

Jadual PMT mengikut jenis aktiviti ekonomi dan jenis aset pada harga semasaTable COFC by kind of economic activity and type of assets at current prices
Struktur
Structure
Jentera dan
peralatan
Machinery and
equipment
Aset lain
Other assets
Jumlah
Total
1. Pertanian 1,206 2,100 3,870 7,176
Agriculture
2. Perlombongan dan pengkuarian 567 13,715 11,585 25,867
Mining and quarrying
3. Pembuatan 7,662 29,407 4,576 41,645
Manufacturing
3.1 Makanan, minuman dan tembakau 746 3,861 218 4,825
Food, beverages and tobacco
3.2 Produk tekstil dan kayu 1,066 2,113 112 3,291
Textiles and wood products
3.3 Produk petroleum, kimia, getah dan plastik 2,012 9,265 771 12,048
Petroleum, chemicals, rubber and plastic products
3.4 Produk mineral bukan logam, logam asas dan produk logam yang direka 860 3,430 212 4,501
Non-metallic mineral products, basic metal and fabricated metal products
3.5 Produk elektrik, elektronik dan optikal 2,398 8,876 2,812 14,086
Electrical, electronic and optical products
3.6 Peralatan pengangkutan, pembuatan lain dan pembaikan 581 1,861 451 2,893
Transport equipment, other manufacturing and repair
4. Pembinaan 641 3,184 114 3,939
Construction
5. Perkhidmatan 61,871 49,066 10,183 121,120
Services
5.1 Utiliti 7,996 8,259 744 16,999
Utilities
5.2 Perdagangan borong dan runcit 3,137 4,683 742 8,562
Wholesale and retail trade
5.3 Makanan & minuman dan penginapan 892 1,622 76 2,589
Food & beverage and accommodation
5.4 Pengangkutan & penyimpanan dan maklumat & komunikasi 9,537 22,914 1,710 34,161
Transportation & storage and information & communication
5.5 Kewangan, insurans, hartanah dan perkhidmatan perniagaan 21,403 4,925 2,664 28,992
Finance, insurance, real estate and business services
5.6 Perkhidmatan lain 18,906 6,663 4,248 29,817
Other services
Jumlah PMT
Total COFC
Struktur
Structure
Jentera dan
peralatan
Machinery and
equipment
Aset lain
Other assets
Jumlah
Total
1. Pertanian 5.6 11.2 -1.5 3.1
Agriculture
2. Perlombongan dan pengkuarian 12.2 10.9 8.5 9.9
Mining and quarrying
3. Pembuatan 8.8 3.8 9.0 5.2
Manufacturing
3.1 Makanan, minuman dan tembakau 6.7 7.6 23.1 8.1
Food, beverages and tobacco
3.2 Produk tekstil dan kayu 3.0 -2.0 11.8 0.0
Textiles and wood products
3.3 Produk petroleum, kimia, getah dan plastik 16.3 8.6 13.9 10.2
Petroleum, chemicals, rubber and plastic products
3.4 Produk mineral bukan logam, logam asas dan produk logam yang direka 4.9 2.6 16.7 3.7
Non-metallic mineral products, basic metal and fabricated metal products
3.5 Produk elektrik, elektronik dan optikal 8.4 0.4 6.8 2.9
Electrical, electronic and optical products
3.6 Peralatan pengangkutan, pembuatan lain dan pembaikan 5.5 -0.6 4.8 1.4
Transport equipment, other manufacturing and repair
4. Pembinaan 6.1 7.9 6.9 7.6
Construction
5. Perkhidmatan 7.3 5.2 1.9 6.0
Services
5.1 Utiliti 4.3 1.0 -5.1 2.2
Utilities
5.2 Perdagangan borong dan runcit 11.8 9.5 -1.0 9.3
Wholesale and retail trade
5.3 Makanan & minuman dan penginapan 5.7 19.3 3.9 13.8
Food & beverage and accommodation
5.4 Pengangkutan & penyimpanan dan maklumat & komunikasi 8.2 4.3 -1.4 5.0
Transportation & storage and information & communication
5.5 Kewangan, insurans, hartanah dan perkhidmatan perniagaan 8.7 18.0 11.1 10.4
Finance, insurance, real estate and business services
5.6 Perkhidmatan lain 6.1 -0.1 -0.3 3.7
Other services
Jumlah PMT
Total COFC
Perubahan peratusan tahunan
Annual percentage change
7.5 5.8 4.9 6.2
199,747
4.3
RM juta
RM million
71,947 97,471 30,328
2016
89

Jadual PMT mengikut jenis aktiviti ekonomi dan jenis aset pada harga semasaTable COFC by kind of economic activity and type of assets at current prices 4.3
Struktur
Structure
Jentera dan
peralatan
Machinery and
equipment
Aset lain
Other assets
Jumlah
Total
1. Pertanian 1.7 2.2 12.8 3.6
Agriculture
2. Perlombongan dan pengkuarian 0.8 14.1 38.2 12.9
Mining and quarrying
3. Pembuatan 10.6 30.2 15.1 20.8
Manufacturing
3.1 Makanan, minuman dan tembakau 1.0 4.0 0.7 2.4
Food, beverages and tobacco
3.2 Produk tekstil dan kayu 1.5 2.2 0.4 1.6
Textiles and wood products
3.3 Produk petroleum, kimia, getah dan plastik 2.8 9.5 2.5 6.0
Petroleum, chemicals, rubber and plastic products
3.4 Produk mineral bukan logam, logam asas dan produk logam yang direka 1.2 3.5 0.7 2.3
Non-metallic mineral products, basic metal and fabricated metal products
3.5 Produk elektrik, elektronik dan optikal 3.3 9.1 9.3 7.1
Electrical, electronic and optical products
3.6 Peralatan pengangkutan, pembuatan lain dan pembaikan 0.8 1.9 1.5 1.4
Transport equipment, other manufacturing and repair
4. Pembinaan 0.9 3.3 0.4 2.0
Construction
5. Perkhidmatan 86.0 50.3 33.6 60.6
Services
5.1 Utiliti 11.1 8.5 2.5 8.5
Utilities
5.2 Perdagangan borong dan runcit 4.4 4.8 2.4 4.3
Wholesale and retail trade
5.3 Makanan & minuman dan penginapan 1.2 1.7 0.2 1.3
Food & beverage and accommodation
5.4 Pengangkutan & penyimpanan dan maklumat & komunikasi 13.3 23.5 5.6 17.1
Transportation & storage and information & communication
5.5 Kewangan, insurans, hartanah dan perkhidmatan perniagaan 29.7 5.1 8.8 14.5
Finance, insurance, real estate and business services
5.6 Perkhidmatan lain 26.3 6.8 14.0 14.9
Other services
Jumlah PMT
Total COFC
Struktur
Structure
Jentera dan
peralatan
Machinery and
equipment
Aset lain
Other assets
Jumlah
Total
1. Pertanian 16.8 29.3 53.9 100.0
Agriculture
2. Perlombongan dan pengkuarian 2.2 53.0 44.8 100.0
Mining and quarrying
3. Pembuatan 18.4 70.6 11.0 100.0
Manufacturing
3.1 Makanan, minuman dan tembakau 15.5 80.0 4.5 100.0
Food, beverages and tobacco
3.2 Produk tekstil dan kayu 32.4 64.2 3.4 100.0
Textiles and wood products
3.3 Produk petroleum, kimia, getah dan plastik 16.7 76.9 6.4 100.0
Petroleum, chemicals, rubber and plastic products
3.4 Produk mineral bukan logam, logam asas dan produk logam yang direka 19.1 76.2 4.7 100.0
Non-metallic mineral products, basic metal and fabricated metal products
3.5 Produk elektrik, elektronik dan optikal 17.0 63.0 20.0 100.0
Electrical, electronic and optical products
3.6 Peralatan pengangkutan, pembuatan lain dan pembaikan 20.1 64.3 15.6 100.0
Transport equipment, other manufacturing and repair
4. Pembinaan 16.3 80.8 2.9 100.0
Construction
5. Perkhidmatan 51.1 40.5 8.4 100.0
Services
5.1 Utiliti 47.0 48.6 4.4 100.0
Utilities
5.2 Perdagangan borong dan runcit 36.6 54.7 8.7 100.0
Wholesale and retail trade
5.3 Makanan & minuman dan penginapan 34.4 62.6 2.9 100.0
Food & beverage and accommodation
5.4 Pengangkutan & penyimpanan dan maklumat & komunikasi 27.9 67.1 5.0 100.0
Transportation & storage and information & communication
5.5 Kewangan, insurans, hartanah dan perkhidmatan perniagaan 73.8 17.0 9.2 100.0
Finance, insurance, real estate and business services
5.6 Perkhidmatan lain 63.4 22.3 14.2 100.0
Other services
Jumlah PMT
Total COFC36.0 48.8 15.2 100.0
100.0 100.0 100.0 100.0
Peratus sumbangan mengikut jenis aset
Percentage share by type of assets
Peratus sumbangan mengikut jenis aktiviti ekonomi
Percentage share by kind of economic activity2016
90
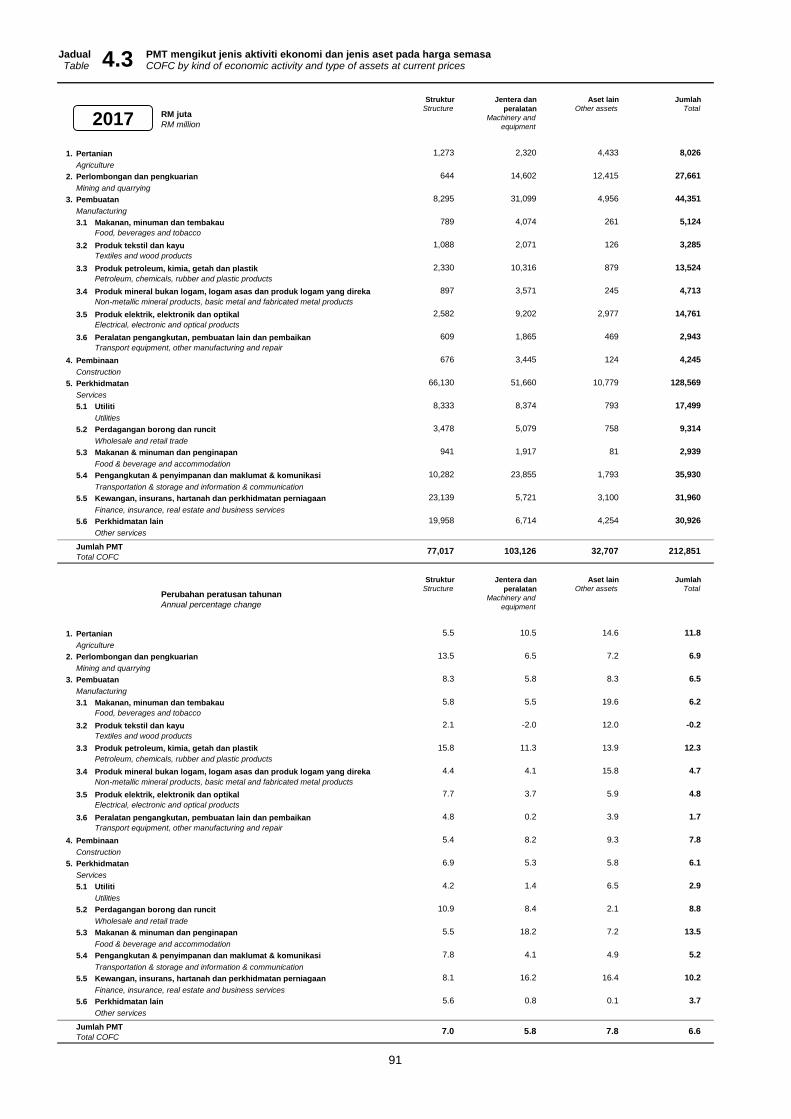
Jadual PMT mengikut jenis aktiviti ekonomi dan jenis aset pada harga semasaTable COFC by kind of economic activity and type of assets at current prices
Struktur
Structure
Jentera dan
peralatan
Machinery and
equipment
Aset lain
Other assets
Jumlah
Total
1. Pertanian 1,273 2,320 4,433 8,026
Agriculture
2. Perlombongan dan pengkuarian 644 14,602 12,415 27,661
Mining and quarrying
3. Pembuatan 8,295 31,099 4,956 44,351
Manufacturing
3.1 Makanan, minuman dan tembakau 789 4,074 261 5,124
Food, beverages and tobacco
3.2 Produk tekstil dan kayu 1,088 2,071 126 3,285
Textiles and wood products
3.3 Produk petroleum, kimia, getah dan plastik 2,330 10,316 879 13,524
Petroleum, chemicals, rubber and plastic products
3.4 Produk mineral bukan logam, logam asas dan produk logam yang direka 897 3,571 245 4,713
Non-metallic mineral products, basic metal and fabricated metal products
3.5 Produk elektrik, elektronik dan optikal 2,582 9,202 2,977 14,761
Electrical, electronic and optical products
3.6 Peralatan pengangkutan, pembuatan lain dan pembaikan 609 1,865 469 2,943
Transport equipment, other manufacturing and repair
4. Pembinaan 676 3,445 124 4,245
Construction
5. Perkhidmatan 66,130 51,660 10,779 128,569
Services
5.1 Utiliti 8,333 8,374 793 17,499
Utilities
5.2 Perdagangan borong dan runcit 3,478 5,079 758 9,314
Wholesale and retail trade
5.3 Makanan & minuman dan penginapan 941 1,917 81 2,939
Food & beverage and accommodation
5.4 Pengangkutan & penyimpanan dan maklumat & komunikasi 10,282 23,855 1,793 35,930
Transportation & storage and information & communication
5.5 Kewangan, insurans, hartanah dan perkhidmatan perniagaan 23,139 5,721 3,100 31,960
Finance, insurance, real estate and business services
5.6 Perkhidmatan lain 19,958 6,714 4,254 30,926
Other services
Jumlah PMT
Total COFC
Struktur
Structure
Jentera dan
peralatan
Machinery and
equipment
Aset lain
Other assets
Jumlah
Total
1. Pertanian 5.5 10.5 14.6 11.8
Agriculture
2. Perlombongan dan pengkuarian 13.5 6.5 7.2 6.9
Mining and quarrying
3. Pembuatan 8.3 5.8 8.3 6.5
Manufacturing
3.1 Makanan, minuman dan tembakau 5.8 5.5 19.6 6.2
Food, beverages and tobacco
3.2 Produk tekstil dan kayu 2.1 -2.0 12.0 -0.2
Textiles and wood products
3.3 Produk petroleum, kimia, getah dan plastik 15.8 11.3 13.9 12.3
Petroleum, chemicals, rubber and plastic products
3.4 Produk mineral bukan logam, logam asas dan produk logam yang direka 4.4 4.1 15.8 4.7
Non-metallic mineral products, basic metal and fabricated metal products
3.5 Produk elektrik, elektronik dan optikal 7.7 3.7 5.9 4.8
Electrical, electronic and optical products
3.6 Peralatan pengangkutan, pembuatan lain dan pembaikan 4.8 0.2 3.9 1.7
Transport equipment, other manufacturing and repair
4. Pembinaan 5.4 8.2 9.3 7.8
Construction
5. Perkhidmatan 6.9 5.3 5.8 6.1
Services
5.1 Utiliti 4.2 1.4 6.5 2.9
Utilities
5.2 Perdagangan borong dan runcit 10.9 8.4 2.1 8.8
Wholesale and retail trade
5.3 Makanan & minuman dan penginapan 5.5 18.2 7.2 13.5
Food & beverage and accommodation
5.4 Pengangkutan & penyimpanan dan maklumat & komunikasi 7.8 4.1 4.9 5.2
Transportation & storage and information & communication
5.5 Kewangan, insurans, hartanah dan perkhidmatan perniagaan 8.1 16.2 16.4 10.2
Finance, insurance, real estate and business services
5.6 Perkhidmatan lain 5.6 0.8 0.1 3.7
Other services
Jumlah PMT
Total COFC
32,707 212,851
Perubahan peratusan tahunan
Annual percentage change
7.0 5.8 7.8 6.6
4.3
RM juta
RM million
77,017 103,126
2017
91

Jadual PMT mengikut jenis aktiviti ekonomi dan jenis aset pada harga semasaTable COFC by kind of economic activity and type of assets at current prices 4.3
Struktur
Structure
Jentera dan
peralatan
Machinery and
equipment
Aset lain
Other assets
Jumlah
Total
1. Pertanian 1.7 2.2 13.6 3.8
Agriculture
2. Perlombongan dan pengkuarian 0.8 14.2 38.0 13.0
Mining and quarrying
3. Pembuatan 10.8 30.2 15.2 20.8
Manufacturing
3.1 Makanan, minuman dan tembakau 1.0 4.0 0.8 2.4
Food, beverages and tobacco
3.2 Produk tekstil dan kayu 1.4 2.0 0.4 1.5
Textiles and wood products
3.3 Produk petroleum, kimia, getah dan plastik 3.0 10.0 2.7 6.4
Petroleum, chemicals, rubber and plastic products
3.4 Produk mineral bukan logam, logam asas dan produk logam yang direka 1.2 3.5 0.7 2.2
Non-metallic mineral products, basic metal and fabricated metal products
3.5 Produk elektrik, elektronik dan optikal 3.4 8.9 9.1 6.9
Electrical, electronic and optical products
3.6 Peralatan pengangkutan, pembuatan lain dan pembaikan 0.8 1.8 1.4 1.4
Transport equipment, other manufacturing and repair
4. Pembinaan 0.9 3.3 0.4 2.0
Construction
5. Perkhidmatan 85.9 50.1 33.0 60.4
Services
5.1 Utiliti 10.8 8.1 2.4 8.2
Utilities
5.2 Perdagangan borong dan runcit 4.5 4.9 2.3 4.4
Wholesale and retail trade
5.3 Makanan & minuman dan penginapan 1.2 1.9 0.2 1.4
Food & beverage and accommodation
5.4 Pengangkutan & penyimpanan dan maklumat & komunikasi 13.4 23.1 5.5 16.9
Transportation & storage and information & communication
5.5 Kewangan, insurans, hartanah dan perkhidmatan perniagaan 30.0 5.5 9.5 15.0
Finance, insurance, real estate and business services
5.6 Perkhidmatan lain 25.9 6.5 13.0 14.5
Other services
Jumlah PMT
Total COFC
Struktur
Structure
Jentera dan
peralatan
Machinery and
equipment
Aset lain
Other assets
Jumlah
Total
1. Pertanian 15.9 28.9 55.2 100.0
Agriculture
2. Perlombongan dan pengkuarian 2.3 52.8 44.9 100.0
Mining and quarrying
3. Pembuatan 18.7 70.1 11.2 100.0
Manufacturing
3.1 Makanan, minuman dan tembakau 15.4 79.5 5.1 100.0
Food, beverages and tobacco
3.2 Produk tekstil dan kayu 33.1 63.1 3.8 100.0
Textiles and wood products
3.3 Produk petroleum, kimia, getah dan plastik 17.2 76.3 6.5 100.0
Petroleum, chemicals, rubber and plastic products
3.4 Produk mineral bukan logam, logam asas dan produk logam yang direka 19.0 75.8 5.2 100.0
Non-metallic mineral products, basic metal and fabricated metal products
3.5 Produk elektrik, elektronik dan optikal 17.5 62.3 20.2 100.0
Electrical, electronic and optical products
3.6 Peralatan pengangkutan, pembuatan lain dan pembaikan 20.7 63.4 15.9 100.0
Transport equipment, other manufacturing and repair
4. Pembinaan 15.9 81.1 2.9 100.0
Construction
5. Perkhidmatan 51.4 40.2 8.4 100.0
Services
5.1 Utiliti 47.6 47.9 4.5 100.0
Utilities
5.2 Perdagangan borong dan runcit 37.3 54.5 8.1 100.0
Wholesale and retail trade
5.3 Makanan & minuman dan penginapan 32.0 65.2 2.8 100.0
Food & beverage and accommodation
5.4 Pengangkutan & penyimpanan dan maklumat & komunikasi 28.6 66.4 5.0 100.0
Transportation & storage and information & communication
5.5 Kewangan, insurans, hartanah dan perkhidmatan perniagaan 72.4 17.9 9.7 100.0
Finance, insurance, real estate and business services
5.6 Perkhidmatan lain 64.5 21.7 13.8 100.0
Other services
Jumlah PMT
Total COFC
100.0
Peratus sumbangan mengikut jenis aset
Percentage share by type of assets
36.2 48.4 15.4 100.0
100.0
Peratus sumbangan mengikut jenis aktiviti ekonomi
Percentage share by kind of economic activity
100.0 100.0
2017
92

Jadual PMT mengikut jenis aktiviti ekonomi dan jenis aset pada harga malar 2010 Table COFC by kind of economic activity and type of assets at constant 2010 prices
Struktur
Structure
Jentera dan
peralatan
Machinery and
equipment
Aset lain
Other assets
Jumlah
Total
1. Pertanian 890 1,850 3,321 6,061
Agriculture
2. Perlombongan dan pengkuarian 393 12,169 7,124 19,687
Mining and quarrying
3. Pembuatan 5,516 27,912 3,753 37,181
Manufacturing
3.1 Makanan, minuman dan tembakau 547 3,532 150 4,229
Food, beverages and tobacco
3.2 Produk tekstil dan kayu 811 2,124 81 3,015
Textiles and wood products
3.3 Produk petroleum, kimia, getah dan plastik 1,354 8,411 592 10,357
Petroleum, chemicals, rubber and plastic products
3.4 Produk mineral bukan logam, logam asas dan produk logam yang direka 642 3,290 154 4,085
Non-metallic mineral products, basic metal and fabricated metal products
3.5 Produk elektrik, elektronik dan optikal 1,731 8,711 2,389 12,830
Electrical, electronic and optical products
3.6 Peralatan pengangkutan, pembuatan lain dan pembaikan 431 1,845 388 2,664
Transport equipment, other manufacturing and repair
4. Pembinaan 474 2,894 82 3,449
Construction
5. Perkhidmatan 45,047 45,577 8,097 98,721
Services
5.1 Utiliti 5,958 8,068 531 14,556
Utilities
5.2 Perdagangan borong dan runcit 2,199 4,179 505 6,883
Wholesale and retail trade
5.3 Makanan & minuman dan penginapan 661 1,337 53 2,051
Food & beverage and accommodation
5.4 Pengangkutan & penyimpanan dan maklumat & komunikasi 6,847 21,357 1,259 29,463
Transportation & storage and information & communication
5.5 Kewangan, insurans, hartanah dan perkhidmatan perniagaan 15,474 4,112 1,722 21,308
Finance, insurance, real estate and business services
5.6 Perkhidmatan lain 13,910 6,523 4,027 24,460
Other services
Jumlah PMT
Total COFC
Struktur
Structure
Jentera dan
peralatan
Machinery and
equipment
Aset lain
Other assets
Jumlah
Total
1. Pertanian 2.5 9.0 6.5 6.6
Agriculture
2. Perlombongan dan pengkuarian 8.2 15.1 9.3 12.8
Mining and quarrying
3. Pembuatan 5.2 3.6 8.7 4.4
Manufacturing
3.1 Makanan, minuman dan tembakau 4.9 10.6 19.0 10.1
Food, beverages and tobacco
3.2 Produk tekstil dan kayu 0.3 -1.4 9.9 -0.7
Textiles and wood products
3.3 Produk petroleum, kimia, getah dan plastik 10.8 6.6 13.8 7.5
Petroleum, chemicals, rubber and plastic products
3.4 Produk mineral bukan logam, logam asas dan produk logam yang direka 3.0 1.7 13.9 2.3
Non-metallic mineral products, basic metal and fabricated metal products
3.5 Produk elektrik, elektronik dan optikal 5.2 1.5 6.7 2.9
Electrical, electronic and optical products
3.6 Peralatan pengangkutan, pembuatan lain dan pembaikan 2.4 -1.7 8.2 0.3
Transport equipment, other manufacturing and repair
4. Pembinaan 3.0 8.6 7.4 7.8
Construction
5. Perkhidmatan 4.3 5.0 2.9 4.5
Services
5.1 Utiliti 1.9 5.4 5.5 3.9
Utilities
5.2 Perdagangan borong dan runcit 9.0 7.8 -3.5 7.2
Wholesale and retail trade
5.3 Makanan & minuman dan penginapan 2.5 15.4 5.9 10.6
Food & beverage and accommodation
5.4 Pengangkutan & penyimpanan dan maklumat & komunikasi 5.9 4.3 4.6 4.7
Transportation & storage and information & communication
5.5 Kewangan, insurans, hartanah dan perkhidmatan perniagaan 5.0 14.1 9.0 6.9
Finance, insurance, real estate and business services
5.6 Perkhidmatan lain 3.3 -2.1 0.5 1.4
Other services
Jumlah PMT
Total COFC
Perubahan peratusan tahunan
Annual percentage change
4.4 6.0 6.4 5.5
165,099
4.4
RM juta
RM million
52,320 90,402 22,377
2015
93
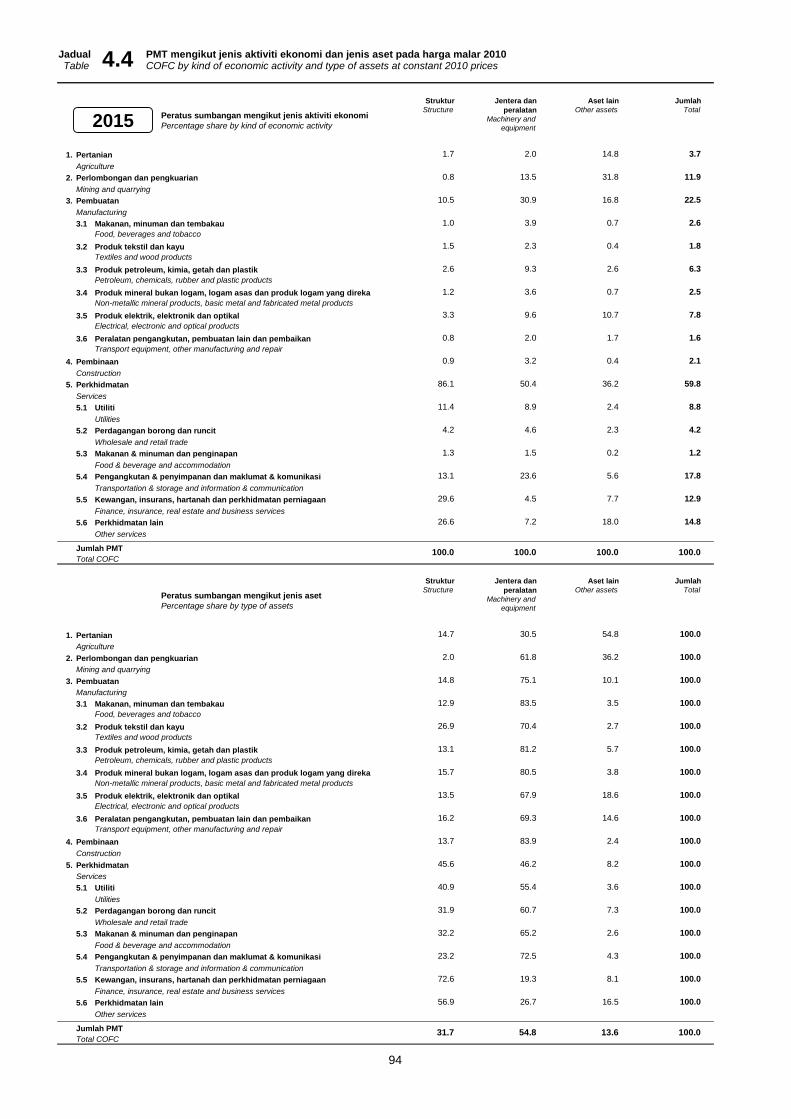
Jadual PMT mengikut jenis aktiviti ekonomi dan jenis aset pada harga malar 2010 Table COFC by kind of economic activity and type of assets at constant 2010 prices 4.4
Struktur
Structure
Jentera dan
peralatan
Machinery and
equipment
Aset lain
Other assets
Jumlah
Total
1. Pertanian 1.7 2.0 14.8 3.7
Agriculture
2. Perlombongan dan pengkuarian 0.8 13.5 31.8 11.9
Mining and quarrying
3. Pembuatan 10.5 30.9 16.8 22.5
Manufacturing
3.1 Makanan, minuman dan tembakau 1.0 3.9 0.7 2.6
Food, beverages and tobacco
3.2 Produk tekstil dan kayu 1.5 2.3 0.4 1.8
Textiles and wood products
3.3 Produk petroleum, kimia, getah dan plastik 2.6 9.3 2.6 6.3
Petroleum, chemicals, rubber and plastic products
3.4 Produk mineral bukan logam, logam asas dan produk logam yang direka 1.2 3.6 0.7 2.5
Non-metallic mineral products, basic metal and fabricated metal products
3.5 Produk elektrik, elektronik dan optikal 3.3 9.6 10.7 7.8
Electrical, electronic and optical products
3.6 Peralatan pengangkutan, pembuatan lain dan pembaikan 0.8 2.0 1.7 1.6
Transport equipment, other manufacturing and repair
4. Pembinaan 0.9 3.2 0.4 2.1
Construction
5. Perkhidmatan 86.1 50.4 36.2 59.8
Services
5.1 Utiliti 11.4 8.9 2.4 8.8
Utilities
5.2 Perdagangan borong dan runcit 4.2 4.6 2.3 4.2
Wholesale and retail trade
5.3 Makanan & minuman dan penginapan 1.3 1.5 0.2 1.2
Food & beverage and accommodation
5.4 Pengangkutan & penyimpanan dan maklumat & komunikasi 13.1 23.6 5.6 17.8
Transportation & storage and information & communication
5.5 Kewangan, insurans, hartanah dan perkhidmatan perniagaan 29.6 4.5 7.7 12.9
Finance, insurance, real estate and business services
5.6 Perkhidmatan lain 26.6 7.2 18.0 14.8
Other services
Jumlah PMT
Total COFC
Struktur
Structure
Jentera dan
peralatan
Machinery and
equipment
Aset lain
Other assets
Jumlah
Total
1. Pertanian 14.7 30.5 54.8 100.0
Agriculture
2. Perlombongan dan pengkuarian 2.0 61.8 36.2 100.0
Mining and quarrying
3. Pembuatan 14.8 75.1 10.1 100.0
Manufacturing
3.1 Makanan, minuman dan tembakau 12.9 83.5 3.5 100.0
Food, beverages and tobacco
3.2 Produk tekstil dan kayu 26.9 70.4 2.7 100.0
Textiles and wood products
3.3 Produk petroleum, kimia, getah dan plastik 13.1 81.2 5.7 100.0
Petroleum, chemicals, rubber and plastic products
3.4 Produk mineral bukan logam, logam asas dan produk logam yang direka 15.7 80.5 3.8 100.0
Non-metallic mineral products, basic metal and fabricated metal products
3.5 Produk elektrik, elektronik dan optikal 13.5 67.9 18.6 100.0
Electrical, electronic and optical products
3.6 Peralatan pengangkutan, pembuatan lain dan pembaikan 16.2 69.3 14.6 100.0
Transport equipment, other manufacturing and repair
4. Pembinaan 13.7 83.9 2.4 100.0
Construction
5. Perkhidmatan 45.6 46.2 8.2 100.0
Services
5.1 Utiliti 40.9 55.4 3.6 100.0
Utilities
5.2 Perdagangan borong dan runcit 31.9 60.7 7.3 100.0
Wholesale and retail trade
5.3 Makanan & minuman dan penginapan 32.2 65.2 2.6 100.0
Food & beverage and accommodation
5.4 Pengangkutan & penyimpanan dan maklumat & komunikasi 23.2 72.5 4.3 100.0
Transportation & storage and information & communication
5.5 Kewangan, insurans, hartanah dan perkhidmatan perniagaan 72.6 19.3 8.1 100.0
Finance, insurance, real estate and business services
5.6 Perkhidmatan lain 56.9 26.7 16.5 100.0
Other services
Jumlah PMT
Total COFC31.7 54.8 13.6 100.0
100.0 100.0 100.0 100.0
Peratus sumbangan mengikut jenis aset
Percentage share by type of assets
Peratus sumbangan mengikut jenis aktiviti ekonomi
Percentage share by kind of economic activity2015
94

Jadual PMT mengikut jenis aktiviti ekonomi dan jenis aset pada harga malar 2010 Table COFC by kind of economic activity and type of assets at constant 2010 prices
Struktur
Structure
Jentera dan
peralatan
Machinery and
equipment
Aset lain
Other assets
Jumlah
Total
1. Pertanian 915 2,031 3,556 6,502
Agriculture
2. Perlombongan dan pengkuarian 430 13,513 7,716 21,659
Mining and quarrying
3. Pembuatan 5,833 28,751 4,038 38,622
Manufacturing
3.1 Makanan, minuman dan tembakau 568 3,768 184 4,520
Food, beverages and tobacco
3.2 Produk tekstil dan kayu 812 2,065 91 2,968
Textiles and wood products
3.3 Produk petroleum, kimia, getah dan plastik 1,531 9,086 667 11,285
Petroleum, chemicals, rubber and plastic products
3.4 Produk mineral bukan logam, logam asas dan produk logam yang direka 655 3,336 179 4,169
Non-metallic mineral products, basic metal and fabricated metal products
3.5 Produk elektrik, elektronik dan optikal 1,825 8,676 2,516 13,017
Electrical, electronic and optical products
3.6 Peralatan pengangkutan, pembuatan lain dan pembaikan 442 1,820 401 2,663
Transport equipment, other manufacturing and repair
4. Pembinaan 488 3,072 87 3,648
Construction
5. Perkhidmatan 47,028 47,322 8,271 102,620
Services
5.1 Utiliti 6,053 8,121 546 14,721
Utilities
5.2 Perdagangan borong dan runcit 2,389 4,464 487 7,340
Wholesale and retail trade
5.3 Makanan & minuman dan penginapan 679 1,596 55 2,330
Food & beverage and accommodation
5.4 Pengangkutan & penyimpanan dan maklumat & komunikasi 7,220 21,870 1,319 30,409
Transportation & storage and information & communication
5.5 Kewangan, insurans, hartanah dan perkhidmatan perniagaan 16,329 4,834 1,892 23,055
Finance, insurance, real estate and business services
5.6 Perkhidmatan lain 14,357 6,437 3,971 24,765
Other services
Jumlah PMT
Total COFC
Struktur
Structure
Jentera dan
peralatan
Machinery and
equipment
Aset lain
Other assets
Jumlah
Total
1. Pertanian 2.8 9.7 7.1 7.3
Agriculture
2. Perlombongan dan pengkuarian 9.3 11.0 8.3 10.0
Mining and quarrying
3. Pembuatan 5.7 3.0 7.6 3.9
Manufacturing
3.1 Makanan, minuman dan tembakau 3.8 6.7 23.2 6.9
Food, beverages and tobacco
3.2 Produk tekstil dan kayu 0.1 -2.7 11.9 -1.6
Textiles and wood products
3.3 Produk petroleum, kimia, getah dan plastik 13.1 8.0 12.7 9.0
Petroleum, chemicals, rubber and plastic products
3.4 Produk mineral bukan logam, logam asas dan produk logam yang direka 2.0 1.4 16.3 2.1
Non-metallic mineral products, basic metal and fabricated metal products
3.5 Produk elektrik, elektronik dan optikal 5.4 -0.4 5.3 1.5
Electrical, electronic and optical products
3.6 Peralatan pengangkutan, pembuatan lain dan pembaikan 2.6 -1.4 3.3 -0.1
Transport equipment, other manufacturing and repair
4. Pembinaan 3.1 6.2 6.2 5.8
Construction
5. Perkhidmatan 4.4 3.8 2.2 4.0
Services
5.1 Utiliti 1.6 0.7 2.9 1.1
Utilities
5.2 Perdagangan borong dan runcit 8.7 6.8 -3.5 6.7
Wholesale and retail trade
5.3 Makanan & minuman dan penginapan 2.8 19.4 3.8 13.6
Food & beverage and accommodation
5.4 Pengangkutan & penyimpanan dan maklumat & komunikasi 5.4 2.4 4.8 3.2
Transportation & storage and information & communication
5.5 Kewangan, insurans, hartanah dan perkhidmatan perniagaan 5.5 17.5 9.9 8.2
Finance, insurance, real estate and business services
5.6 Perkhidmatan lain 3.2 -1.3 -1.4 1.2
Other services
Jumlah PMT
Total COFC
Perubahan peratusan tahunan
Annual percentage change
4.5 4.7 5.8 4.8
173,051
4.4
RM juta
RM million
54,693 94,690 23,669
2016
95

Jadual PMT mengikut jenis aktiviti ekonomi dan jenis aset pada harga malar 2010 Table COFC by kind of economic activity and type of assets at constant 2010 prices 4.4
Struktur
Structure
Jentera dan
peralatan
Machinery and
equipment
Aset lain
Other assets
Jumlah
Total
1. Pertanian 1.7 2.1 15.0 3.8
Agriculture
2. Perlombongan dan pengkuarian 0.8 14.3 32.6 12.5
Mining and quarrying
3. Pembuatan 10.7 30.4 17.1 22.3
Manufacturing
3.1 Makanan, minuman dan tembakau 1.0 4.0 0.8 2.6
Food, beverages and tobacco
3.2 Produk tekstil dan kayu 1.5 2.2 0.4 1.7
Textiles and wood products
3.3 Produk petroleum, kimia, getah dan plastik 2.8 9.6 2.8 6.5
Petroleum, chemicals, rubber and plastic products
3.4 Produk mineral bukan logam, logam asas dan produk logam yang direka 1.2 3.5 0.8 2.4
Non-metallic mineral products, basic metal and fabricated metal products
3.5 Produk elektrik, elektronik dan optikal 3.3 9.2 10.6 7.5
Electrical, electronic and optical products
3.6 Peralatan pengangkutan, pembuatan lain dan pembaikan 0.8 1.9 1.7 1.5
Transport equipment, other manufacturing and repair
4. Pembinaan 0.9 3.2 0.4 2.1
Construction
5. Perkhidmatan 86.0 50.0 34.9 59.3
Services
5.1 Utiliti 11.1 8.6 2.3 8.5
Utilities
5.2 Perdagangan borong dan runcit 4.4 4.7 2.1 4.2
Wholesale and retail trade
5.3 Makanan & minuman dan penginapan 1.2 1.7 0.2 1.3
Food & beverage and accommodation
5.4 Pengangkutan & penyimpanan dan maklumat & komunikasi 13.2 23.1 5.6 17.6
Transportation & storage and information & communication
5.5 Kewangan, insurans, hartanah dan perkhidmatan perniagaan 29.9 5.1 8.0 13.3
Finance, insurance, real estate and business services
5.6 Perkhidmatan lain 26.2 6.8 16.8 14.3
Other services
Jumlah PMT
Total COFC
Struktur
Structure
Jentera dan
peralatan
Machinery and
equipment
Aset lain
Other assets
Jumlah
Total
1. Pertanian 14.1 31.2 54.7 100.0
Agriculture
2. Perlombongan dan pengkuarian 2.0 62.4 35.6 100.0
Mining and quarrying
3. Pembuatan 15.1 74.4 10.5 100.0
Manufacturing
3.1 Makanan, minuman dan tembakau 12.6 83.4 4.1 100.0
Food, beverages and tobacco
3.2 Produk tekstil dan kayu 27.3 69.6 3.1 100.0
Textiles and wood products
3.3 Produk petroleum, kimia, getah dan plastik 13.6 80.5 5.9 100.0
Petroleum, chemicals, rubber and plastic products
3.4 Produk mineral bukan logam, logam asas dan produk logam yang direka 15.7 80.0 4.3 100.0
Non-metallic mineral products, basic metal and fabricated metal products
3.5 Produk elektrik, elektronik dan optikal 14.0 66.6 19.3 100.0
Electrical, electronic and optical products
3.6 Peralatan pengangkutan, pembuatan lain dan pembaikan 16.6 68.3 15.1 100.0
Transport equipment, other manufacturing and repair
4. Pembinaan 13.4 84.2 2.4 100.0
Construction
5. Perkhidmatan 45.8 46.1 8.1 100.0
Services
5.1 Utiliti 41.1 55.2 3.7 100.0
Utilities
5.2 Perdagangan borong dan runcit 32.5 60.8 6.6 100.0
Wholesale and retail trade
5.3 Makanan & minuman dan penginapan 29.1 68.5 2.4 100.0
Food & beverage and accommodation
5.4 Pengangkutan & penyimpanan dan maklumat & komunikasi 23.7 71.9 4.3 100.0
Transportation & storage and information & communication
5.5 Kewangan, insurans, hartanah dan perkhidmatan perniagaan 70.8 21.0 8.2 100.0
Finance, insurance, real estate and business services
5.6 Perkhidmatan lain 58.0 26.0 16.0 100.0
Other services
Jumlah PMT
Total COFC31.6 54.7 13.7 100.0
100.0 100.0 100.0 100.0
Peratus sumbangan mengikut jenis aset
Percentage share by type of assets
Peratus sumbangan mengikut jenis aktiviti ekonomi
Percentage share by kind of economic activity2016
96

Jadual PMT mengikut jenis aktiviti ekonomi dan jenis aset pada harga malar 2010 Table COFC by kind of economic activity and type of assets at constant 2010 prices
Struktur
Structure
Jentera dan
peralatan
Machinery and
equipment
Aset lain
Other assets
Jumlah
Total
1. Pertanian 943 2,206 3,790 6,939
Agriculture
2. Perlombongan dan pengkuarian 477 14,291 8,271 23,038
Mining and quarrying
3. Pembuatan 6,171 30,134 4,296 40,601
Manufacturing
3.1 Makanan, minuman dan tembakau 587 3,934 217 4,738
Food, beverages and tobacco
3.2 Produk tekstil dan kayu 810 2,006 100 2,915
Textiles and wood products
3.3 Produk petroleum, kimia, getah dan plastik 1,732 10,043 745 12,521
Petroleum, chemicals, rubber and plastic products
3.4 Produk mineral bukan logam, logam asas dan produk logam yang direka 668 3,431 203 4,302
Non-metallic mineral products, basic metal and fabricated metal products
3.5 Produk elektrik, elektronik dan optikal 1,921 8,914 2,621 13,455
Electrical, electronic and optical products
3.6 Peralatan pengangkutan, pembuatan lain dan pembaikan 453 1,807 410 2,670
Transport equipment, other manufacturing and repair
4. Pembinaan 503 3,261 92 3,857
Construction
5. Perkhidmatan 49,151 49,107 8,386 106,644
Services
5.1 Utiliti 6,159 8,189 554 14,903
Utilities
5.2 Perdagangan borong dan runcit 2,589 4,708 470 7,767
Wholesale and retail trade
5.3 Makanan & minuman dan penginapan 700 1,876 57 2,633
Food & beverage and accommodation
5.4 Pengangkutan & penyimpanan dan maklumat & komunikasi 7,599 22,364 1,346 31,310
Transportation & storage and information & communication
5.5 Kewangan, insurans, hartanah dan perkhidmatan perniagaan 17,298 5,571 2,064 24,933
Finance, insurance, real estate and business services
5.6 Perkhidmatan lain 14,806 6,398 3,895 25,099
Other services
Jumlah PMT
Total COFC
Struktur
Structure
Jentera dan
peralatan
Machinery and
equipment
Aset lain
Other assets
Jumlah
Total
1. Pertanian 3.1 8.6 6.6 6.7
Agriculture
2. Perlombongan dan pengkuarian 10.9 5.8 7.2 6.4
Mining and quarrying
3. Pembuatan 5.8 4.8 6.4 5.1
Manufacturing
3.1 Makanan, minuman dan tembakau 3.4 4.4 17.8 4.8
Food, beverages and tobacco
3.2 Produk tekstil dan kayu -0.2 -2.9 9.8 -1.8
Textiles and wood products
3.3 Produk petroleum, kimia, getah dan plastik 13.1 10.5 11.7 11.0
Petroleum, chemicals, rubber and plastic products
3.4 Produk mineral bukan logam, logam asas dan produk logam yang direka 2.0 2.9 13.9 3.2
Non-metallic mineral products, basic metal and fabricated metal products
3.5 Produk elektrik, elektronik dan optikal 5.3 2.7 4.2 3.4
Electrical, electronic and optical products
3.6 Peralatan pengangkutan, pembuatan lain dan pembaikan 2.4 -0.7 2.2 0.3
Transport equipment, other manufacturing and repair
4. Pembinaan 3.1 6.2 5.4 5.7
Construction
5. Perkhidmatan 4.5 3.8 1.4 3.9
Services
5.1 Utiliti 1.7 0.8 1.5 1.2
Utilities
5.2 Perdagangan borong dan runcit 8.4 5.5 -3.5 5.8
Wholesale and retail trade
5.3 Makanan & minuman dan penginapan 3.1 17.5 2.7 13.0
Food & beverage and accommodation
5.4 Pengangkutan & penyimpanan dan maklumat & komunikasi 5.3 2.3 2.1 3.0
Transportation & storage and information & communication
5.5 Kewangan, insurans, hartanah dan perkhidmatan perniagaan 5.9 15.2 9.1 8.1
Finance, insurance, real estate and business services
5.6 Perkhidmatan lain 3.1 -0.6 -1.9 1.3
Other services
Jumlah PMT
Total COFC
24,834 181,079
Perubahan peratusan tahunan
Annual percentage change
4.7 4.6 4.9 4.6
4.4
RM juta
RM million
57,245 98,999
2017
97

Jadual PMT mengikut jenis aktiviti ekonomi dan jenis aset pada harga malar 2010 Table COFC by kind of economic activity and type of assets at constant 2010 prices 4.4
Struktur
Structure
Jentera dan
peralatan
Machinery and
equipment
Aset lain
Other assets
Jumlah
Total
1. Pertanian 1.6 2.2 15.3 3.8
Agriculture
2. Perlombongan dan pengkuarian 0.8 14.4 33.3 12.7
Mining and quarrying
3. Pembuatan 10.8 30.4 17.3 22.4
Manufacturing
3.1 Makanan, minuman dan tembakau 1.0 4.0 0.9 2.6
Food, beverages and tobacco
3.2 Produk tekstil dan kayu 1.4 2.0 0.4 1.6
Textiles and wood products
3.3 Produk petroleum, kimia, getah dan plastik 3.0 10.1 3.0 6.9
Petroleum, chemicals, rubber and plastic products
3.4 Produk mineral bukan logam, logam asas dan produk logam yang direka 1.2 3.5 0.8 2.4
Non-metallic mineral products, basic metal and fabricated metal products
3.5 Produk elektrik, elektronik dan optikal 3.4 9.0 10.6 7.4
Electrical, electronic and optical products
3.6 Peralatan pengangkutan, pembuatan lain dan pembaikan 0.8 1.8 1.7 1.5
Transport equipment, other manufacturing and repair
4. Pembinaan 0.9 3.3 0.4 2.1
Construction
5. Perkhidmatan 85.9 49.6 33.8 58.9
Services
5.1 Utiliti 10.8 8.3 2.2 8.2
Utilities
5.2 Perdagangan borong dan runcit 4.5 4.8 1.9 4.3
Wholesale and retail trade
5.3 Makanan & minuman dan penginapan 1.2 1.9 0.2 1.5
Food & beverage and accommodation
5.4 Pengangkutan & penyimpanan dan maklumat & komunikasi 13.3 22.6 5.4 17.3
Transportation & storage and information & communication
5.5 Kewangan, insurans, hartanah dan perkhidmatan perniagaan 30.2 5.6 8.3 13.8
Finance, insurance, real estate and business services
5.6 Perkhidmatan lain 25.9 6.5 15.7 13.9
Other services
Jumlah PMT
Total COFC
Struktur
Structure
Jentera dan
peralatan
Machinery and
equipment
Aset lain
Other assets
Jumlah
Total
1. Pertanian 13.6 31.8 54.6 100.0
Agriculture
2. Perlombongan dan pengkuarian 2.1 62.0 35.9 100.0
Mining and quarrying
3. Pembuatan 15.2 74.2 10.6 100.0
Manufacturing
3.1 Makanan, minuman dan tembakau 12.4 83.0 4.6 100.0
Food, beverages and tobacco
3.2 Produk tekstil dan kayu 27.8 68.8 3.4 100.0
Textiles and wood products
3.3 Produk petroleum, kimia, getah dan plastik 13.8 80.2 6.0 100.0
Petroleum, chemicals, rubber and plastic products
3.4 Produk mineral bukan logam, logam asas dan produk logam yang direka 15.5 79.7 4.7 100.0
Non-metallic mineral products, basic metal and fabricated metal products
3.5 Produk elektrik, elektronik dan optikal 14.3 66.2 19.5 100.0
Electrical, electronic and optical products
3.6 Peralatan pengangkutan, pembuatan lain dan pembaikan 17.0 67.7 15.4 100.0
Transport equipment, other manufacturing and repair
4. Pembinaan 13.1 84.6 2.4 100.0
Construction
5. Perkhidmatan 46.1 46.0 7.9 100.0
Services
5.1 Utiliti 41.3 55.0 3.7 100.0
Utilities
5.2 Perdagangan borong dan runcit 33.3 60.6 6.0 100.0
Wholesale and retail trade
5.3 Makanan & minuman dan penginapan 26.6 71.3 2.2 100.0
Food & beverage and accommodation
5.4 Pengangkutan & penyimpanan dan maklumat & komunikasi 24.3 71.4 4.3 100.0
Transportation & storage and information & communication
5.5 Kewangan, insurans, hartanah dan perkhidmatan perniagaan 69.4 22.3 8.3 100.0
Finance, insurance, real estate and business services
5.6 Perkhidmatan lain 59.0 25.5 15.5 100.0
Other services
Jumlah PMT
Total COFC
100.0
Peratus sumbangan mengikut jenis aset
Percentage share by type of assets
31.6 54.7 13.7 100.0
100.0
Peratus sumbangan mengikut jenis aktiviti ekonomi
Percentage share by kind of economic activity
100.0 100.0
2017
98
99
NOTA TEKNIKAL
1. DEFINISI
1.1 Stok Modal Kasar (SMK)
SMK merupakan pelaburan terkumpul ditolak dengan nilai aset terkumpul yang tidak lagi
beroperasi (iaitu telah bersara atau dibuang).
1.2 Stok Modal Bersih (SMB)
SMB merupakan pelaburan terkumpul ditolak dengan nilai aset yang telah bersara dan
susut nilai terkumpul bagi aset yang masih beroperasi (SMK ditolak dengan susut nilai
terkumpul bagi aset masih beroperasi). Ia juga merupakan nilai bersih semasa bagi
menjana perkhidmatan modal di masa depan yang akan diberikan oleh aset terkumpul
tersebut.
1.3 Stok Modal Produktif (SMP)
SMP diperoleh daripada nilai kasar aset bagi aset yang berbeza usianya kerana
perbezaan kecekapan aset-aset tersebut.
1.4 Penggunaan Modal Tetap (PMT)
PMT merupakan aset yang digunakan dalam proses pengeluaran semasa tempoh
perakaunan.
Nilai bagi SMK, SMB dan SMP adalah merujuk kepada nilai akhir tahun manakala bagi PMT
merujuk kepada nilai tahun semasa.
2. METODOLOGI
Perpetual Inventory Method (PIM) menjana anggaran stok modal dengan mengumpul
pembelian aset-aset terdahulu mengikut anggaran hayat perkhidmatannya. Terdapat dua
pendekatan dalam melaksanakan PIM iaitu tradisional PIM dan pendekatan bersepadu.
2.1 PIM pendekatan bersepadu
PIM pendekatan bersepadu digunakan untuk menganggarkan stok modal di Malaysia.
Pendekatan bersepadu PIM dipelopori oleh United States Bureau of Labor Statistics
(BLS) dan turut digunakan oleh Australian Bureau of Statistics (ABS).
Pendekatan bersepadu mempunyai kelebihan iaitu semua data stok dan aliran perlu
konsisten antara satu sama lain. Pendekatan ini digunakan kerana ia memastikan
konsistensi antara pengukuran perkhidmatan modal, PMT dan SMB.
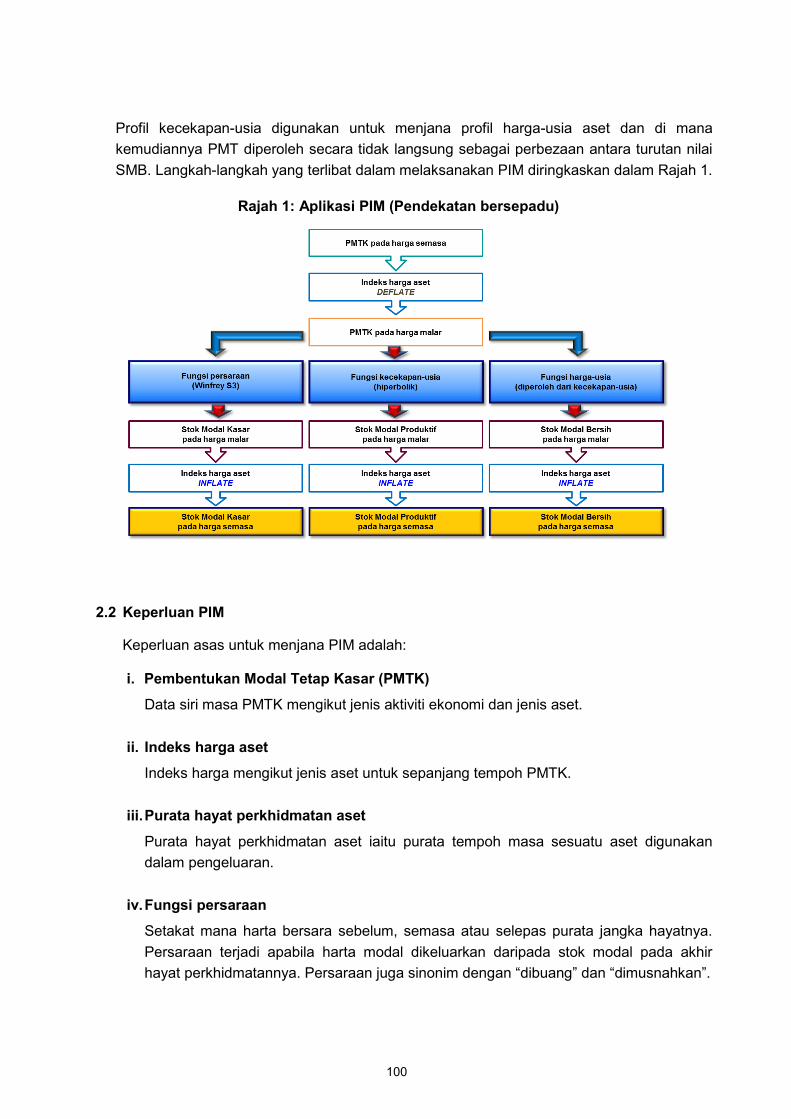
100
Profil kecekapan-usia digunakan untuk menjana profil harga-usia aset dan di mana
kemudiannya PMT diperoleh secara tidak langsung sebagai perbezaan antara turutan nilai
SMB. Langkah-langkah yang terlibat dalam melaksanakan PIM diringkaskan dalam Rajah 1.
2.2 Keperluan PIM
Keperluan asas untuk menjana PIM adalah:
i. Pembentukan Modal Tetap Kasar (PMTK)
Data siri masa PMTK mengikut jenis aktiviti ekonomi dan jenis aset.
ii. Indeks harga aset
Indeks harga mengikut jenis aset untuk sepanjang tempoh PMTK.
iii. Purata hayat perkhidmatan aset
Purata hayat perkhidmatan aset iaitu purata tempoh masa sesuatu aset digunakan
dalam pengeluaran.
iv. Fungsi persaraan
Setakat mana harta bersara sebelum, semasa atau selepas purata jangka hayatnya.
Persaraan terjadi apabila harta modal dikeluarkan daripada stok modal pada akhir
hayat perkhidmatannya. Persaraan juga sinonim dengan “dibuang” dan “dimusnahkan”.
Rajah 1: Aplikasi PIM (Pendekatan bersepadu)

101
v. Profil kecekapan-usia
Profil kecekapan-usia aset menggambarkan perubahan (biasanya penurunan) dalam
kecekapan aset apabila usia sesuatu aset meningkat. Dalam konteks ini, kecekapan
merujuk kepada kemampuan aset untuk menghasilkan kuantiti perkhidmatan modal
bagi jumlah input yang telah diberikan. Ia digunakan untuk mendapatkan anggaran
SMP.
vi. Profil harga-usia
Profil harga-usia aset menggambarkan perubahan (biasanya penurunan) dalam harga
aset apabila usia sesuatu aset meningkat. Ia digunakan untuk mendapatkan anggaran
SMB dan PMT.
2.3 Pola persaraan, fungsi kecekapan-usia dan harga-usia
i. Pola persaraan
Empat jenis pola persaraan yang disarankan dalam manual OECD iaitu:
keluar serentak
linear
linear tertangguh
bentuk loceng (Winfrey, Weibull dan Lognormal)
Winfrey S31 digunakan untuk fungsi persaraan bagi semua jenis aset kecuali aset
hiburan, kesusasteraan dan kesenian asal.
ii. Fungsi kecekapan-usia
Terdapat beberapa fungsi kecekapan-usia yang telah dibincangkan dalam manual
OECD. Fungsi hiperbolik yang digunakan adalah sama seperti yang digunakan oleh
ABS dan BLS. Fungsi kecekapan-usia hiperbolik menerangkan bahawa kecekapan
aset pada mulanya menurun dengan jumlah yang kecil dan kadar penurunan mula
meningkat apabila aset tersebut semakin meningkat usianya (Rajah 2).
%
Kecekapan-usia logistik
Kecekapan-usia hiperbolik
Jangka hayat aset (Tahun)
13 14 15 16 178 9 10 11 123 4 5 6 70 1 2 18 19 20
0
60
40
20
100
80
Sepadan kepada:
____________________________________________________
1 Keluk mortality function Winfrey S3 telah dibangunkan oleh Robley Winfrey berdasarkan kepada kajian beliau ke atas 176 kumpulan aset industri. Keluk mortality function Winfrey S3 ini telah mengandaikan bahawa “pembuangan aset” bermula pada 45% daripada purata jangka hayat dan berterusan ke 155% daripada purata, di mana semua aset bagi umur yang diberikan telah dibuang. Engineering Valuation and Depreciation, 1953, Jadual B.1 halaman 416.
Rajah 3: Fungsi harga-usia
%
Logistik
Hiperbolik
5
100
80
60
40
20
0
0 1 2 3 4 18 19 20
Jangka hayat aset (Tahun)
12 13 14 15 16 176 7 8 9 10 11
Rajah 2: Fungsi kecekapan-usia
Hiperbolik
Logistik
Jangka hayat aset (Tahun) Jangka hayat aset (Tahun)
Kecekapan-usia hiperbolik
Kecekapan-usia logistik
Sepadan kepada:
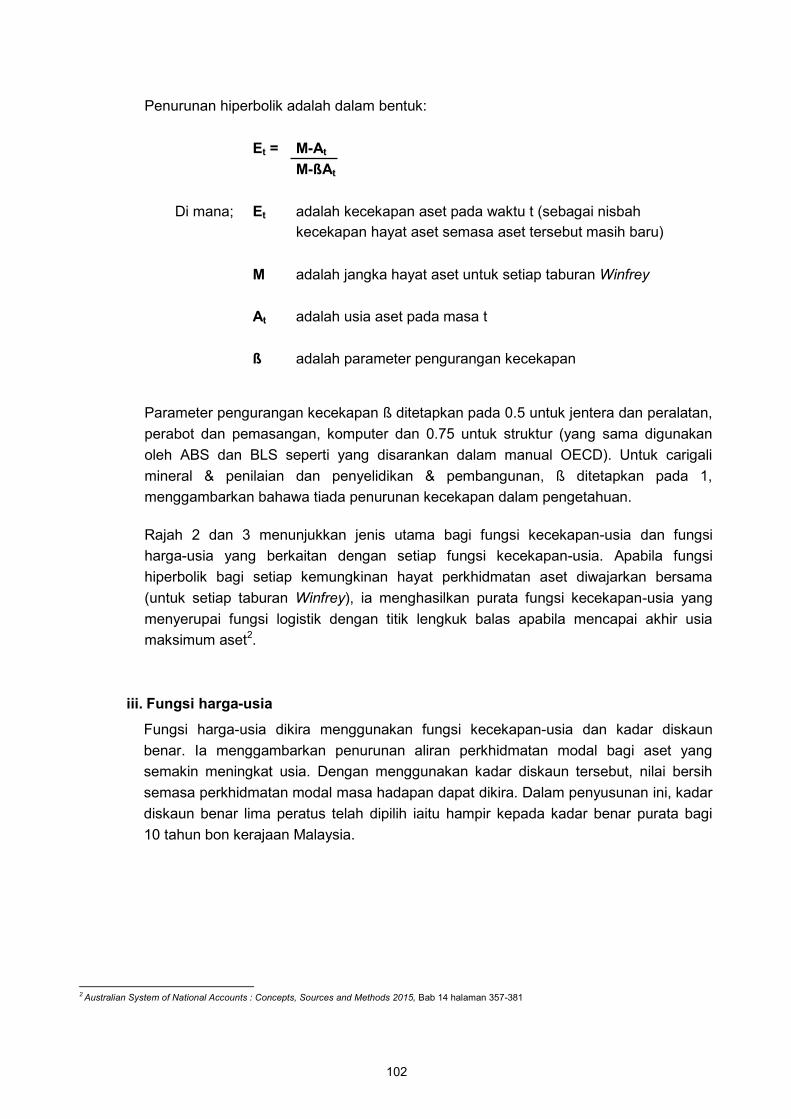
102
Penurunan hiperbolik adalah dalam bentuk:
Et = M-At
M-ßAt
Di mana; Et adalah kecekapan aset pada waktu t (sebagai nisbah
kecekapan hayat aset semasa aset tersebut masih baru)
M adalah jangka hayat aset untuk setiap taburan Winfrey
At adalah usia aset pada masa t
ß adalah parameter pengurangan kecekapan
Parameter pengurangan kecekapan ß ditetapkan pada 0.5 untuk jentera dan peralatan,
perabot dan pemasangan, komputer dan 0.75 untuk struktur (yang sama digunakan
oleh ABS dan BLS seperti yang disarankan dalam manual OECD). Untuk carigali
mineral & penilaian dan penyelidikan & pembangunan, ß ditetapkan pada 1,
menggambarkan bahawa tiada penurunan kecekapan dalam pengetahuan.
Rajah 2 dan 3 menunjukkan jenis utama bagi fungsi kecekapan-usia dan fungsi
harga-usia yang berkaitan dengan setiap fungsi kecekapan-usia. Apabila fungsi
hiperbolik bagi setiap kemungkinan hayat perkhidmatan aset diwajarkan bersama
(untuk setiap taburan Winfrey), ia menghasilkan purata fungsi kecekapan-usia yang
menyerupai fungsi logistik dengan titik lengkuk balas apabila mencapai akhir usia
maksimum aset2.
iii. Fungsi harga-usia
Fungsi harga-usia dikira menggunakan fungsi kecekapan-usia dan kadar diskaun
benar. Ia menggambarkan penurunan aliran perkhidmatan modal bagi aset yang
semakin meningkat usia. Dengan menggunakan kadar diskaun tersebut, nilai bersih
semasa perkhidmatan modal masa hadapan dapat dikira. Dalam penyusunan ini, kadar
diskaun benar lima peratus telah dipilih iaitu hampir kepada kadar benar purata bagi
10 tahun bon kerajaan Malaysia.
____________________________________________________
2 Australian System of National Accounts : Concepts, Sources and Methods 2015, Bab 14 halaman 357-381
103
3. SUMBER DATA
3.1 Pembentukan Modal Tetap Kasar (PMTK)
Data siri masa PMTK dikumpul dan disusun bermula dari tahun 1955 hingga tahun terkini
mengikut 16 jenis aset dan 24 jenis aktiviti ekonomi di Malaysia. Bagi tahun-tahun terkini,
data PMTK diperoleh daripada penyusunan PMTK tahunan.
i. Sumber data dalaman
Bagi data siri masa terdahulu, sumber data dalaman diperoleh daripada banci dan
penyiasatan ekonomi yang dijalankan oleh Jabatan, penerbitan yang mengandungi
maklumat agensi lain dan data import barangan modal.
ii. Sumber data luaran
Sumber data luaran adalah daripada rekod pentadbiran, laporan tahunan syarikat,
akaun kewangan syarikat, data yang diperoleh dan diekstrak daripada Arkib Negara
Malaysia, penerbitan agensi lain dan maklumat daripada Rancangan Malaysia. Data
siri masa terutamanya untuk sektor pengangkutan dan utiliti disusun daripada rekod
pentadbiran dan laporan tahunan syarikat yang diekstrak daripada Arkib Negara
Malaysia. Selain itu, bagi tahun di mana data PMTK tidak diperoleh, pelbagai teknik
anggaran digunakan untuk memperoleh data PMTK termasuk menggunakan
petunjuk-petunjuk seperti pengeluaran, pendapatan dan jualan.
Maklumat daripada Rancangan Malaysia dan Kajian Separuh Penggal Rancangan
Malaysia memberikan panduan nilai belanjawan yang diperuntukkan dan telah
digunakan terutama bagi projek-projek utama dalam pelbagai sektor seperti
pengangkutan, utiliti dan telekomunikasi. Maklumat ini turut merangkumi projek-projek
yang telah dilaksanakan atau ditangguhkan.
Oleh itu, Rancangan Malaysia dan Kajian Separuh Penggal juga sangat penting untuk
menyokong dan menjadi asas kepada anggaran PMTK bagi suatu tempoh masa
tertentu terutamanya pada peringkat sektor ekonomi.
3.2 Indeks harga aset
Indeks Harga Pengeluar (IHPR), Indeks Kos Bahan Binaan Bangunan (IKB), Indeks
Harga Pengguna (IHP) dan indeks upah adalah indeks harga aset yang telah dikenal pasti
untuk digunakan sebagai pendeflasi harga aset untuk anggaran stok modal. IHPR
digunakan untuk pendeflasi sebahagian besar aset seperti jentera dan peralatan,
peralatan pengangkutan, komputer dan perabot & pemasangan. IKB digunakan untuk
mendeflasi struktur, sementara carigali mineral & penilaian dan penyelidikan &
pembangunan dideflasi menggunakan indeks upah pekerja yang terlibat dalam industri.
Pendeflasi untuk hiburan, kesusasteraan dan kesenian asal adalah menggunakan IHP
dan IHPR yang relevan bagi item tersebut.
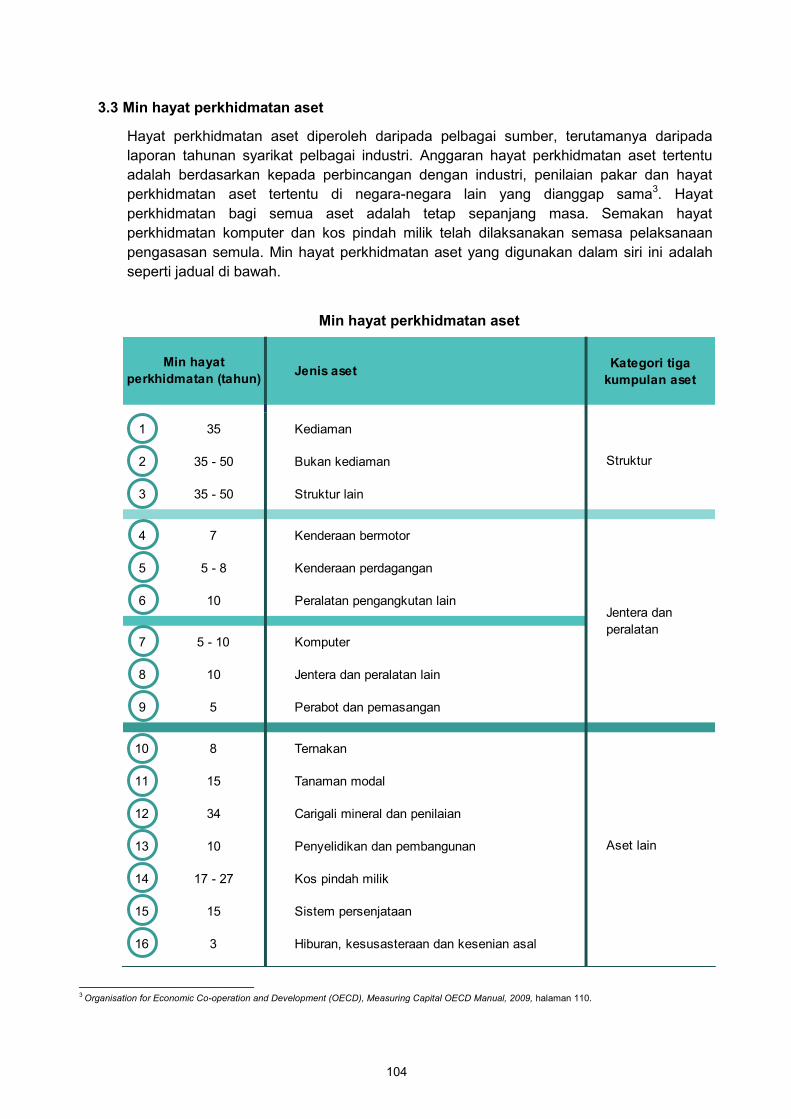
104
3.3 Min hayat perkhidmatan aset
Hayat perkhidmatan aset diperoleh daripada pelbagai sumber, terutamanya daripada
laporan tahunan syarikat pelbagai industri. Anggaran hayat perkhidmatan aset tertentu
adalah berdasarkan kepada perbincangan dengan industri, penilaian pakar dan hayat
perkhidmatan aset tertentu di negara-negara lain yang dianggap sama3. Hayat
perkhidmatan bagi semua aset adalah tetap sepanjang masa. Semakan hayat
perkhidmatan komputer dan kos pindah milik telah dilaksanakan semasa pelaksanaan
pengasasan semula. Min hayat perkhidmatan aset yang digunakan dalam siri ini adalah
seperti jadual di bawah.
Min hayat perkhidmatan aset
____________________________________________________
3 Organisation for Economic Co-operation and Development (OECD), Measuring Capital OECD Manual, 2009, halaman 110.
Jenis asetKategori tiga
kumpulan aset
1 35 Kediaman
2 35 - 50 Bukan kediaman
3 35 - 50 Struktur lain
4 7 Kenderaan bermotor
5 5 - 8 Kenderaan perdagangan
6 10 Peralatan pengangkutan lain
7 5 - 10 Komputer
8 10 Jentera dan peralatan lain
9 5 Perabot dan pemasangan
10 8 Ternakan
11 15 Tanaman modal
12 34 Carigali mineral dan penilaian
13 10 Penyelidikan dan pembangunan
14 17 - 27 Kos pindah milik
15 15 Sistem persenjataan
16 3 Hiburan, kesusasteraan dan kesenian asal
Min hayat
perkhidmatan (tahun)
Struktur
Jentera dan
peralatan
Aset lain
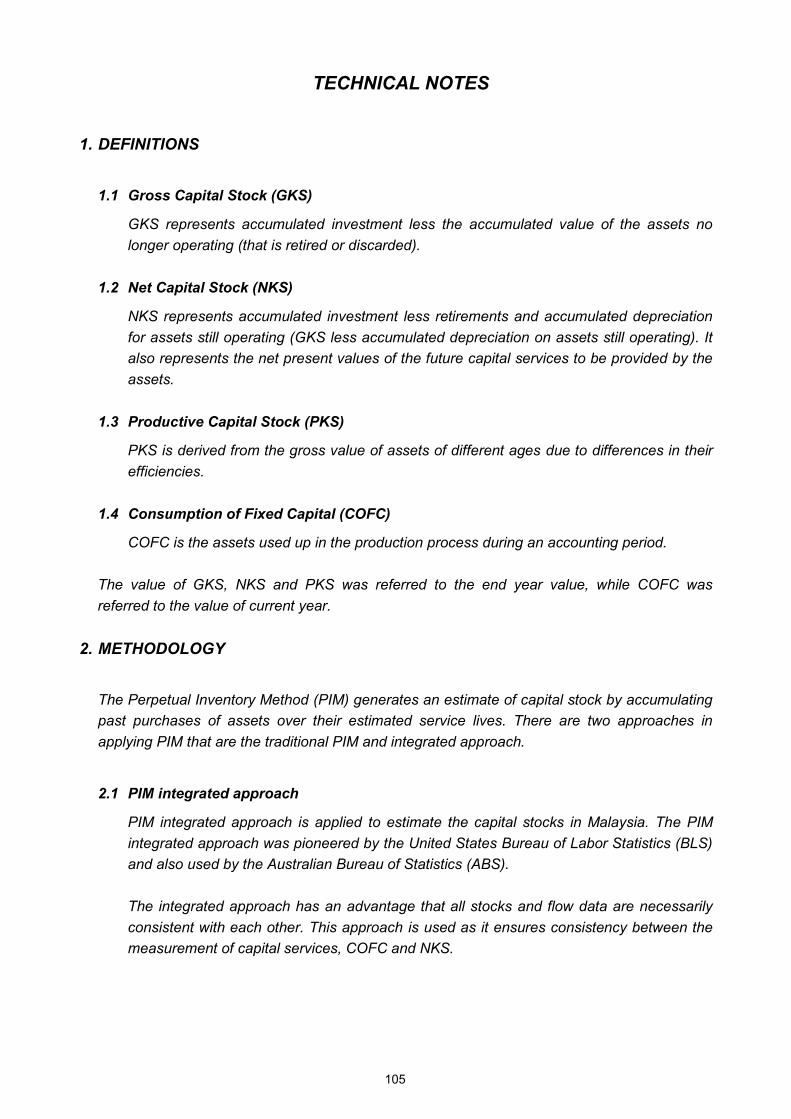
105
TECHNICAL NOTES
1. DEFINITIONS
1.1 Gross Capital Stock (GKS)
GKS represents accumulated investment less the accumulated value of the assets no
longer operating (that is retired or discarded).
1.2 Net Capital Stock (NKS)
NKS represents accumulated investment less retirements and accumulated depreciation
for assets still operating (GKS less accumulated depreciation on assets still operating). It
also represents the net present values of the future capital services to be provided by the
assets.
1.3 Productive Capital Stock (PKS)
PKS is derived from the gross value of assets of different ages due to differences in their
efficiencies.
1.4 Consumption of Fixed Capital (COFC)
COFC is the assets used up in the production process during an accounting period.
The value of GKS, NKS and PKS was referred to the end year value, while COFC was
referred to the value of current year.
2. METHODOLOGY
The Perpetual Inventory Method (PIM) generates an estimate of capital stock by accumulating
past purchases of assets over their estimated service lives. There are two approaches in
applying PIM that are the traditional PIM and integrated approach.
2.1 PIM integrated approach
PIM integrated approach is applied to estimate the capital stocks in Malaysia. The PIM
integrated approach was pioneered by the United States Bureau of Labor Statistics (BLS)
and also used by the Australian Bureau of Statistics (ABS).
The integrated approach has an advantage that all stocks and flow data are necessarily
consistent with each other. This approach is used as it ensures consistency between the
measurement of capital services, COFC and NKS.
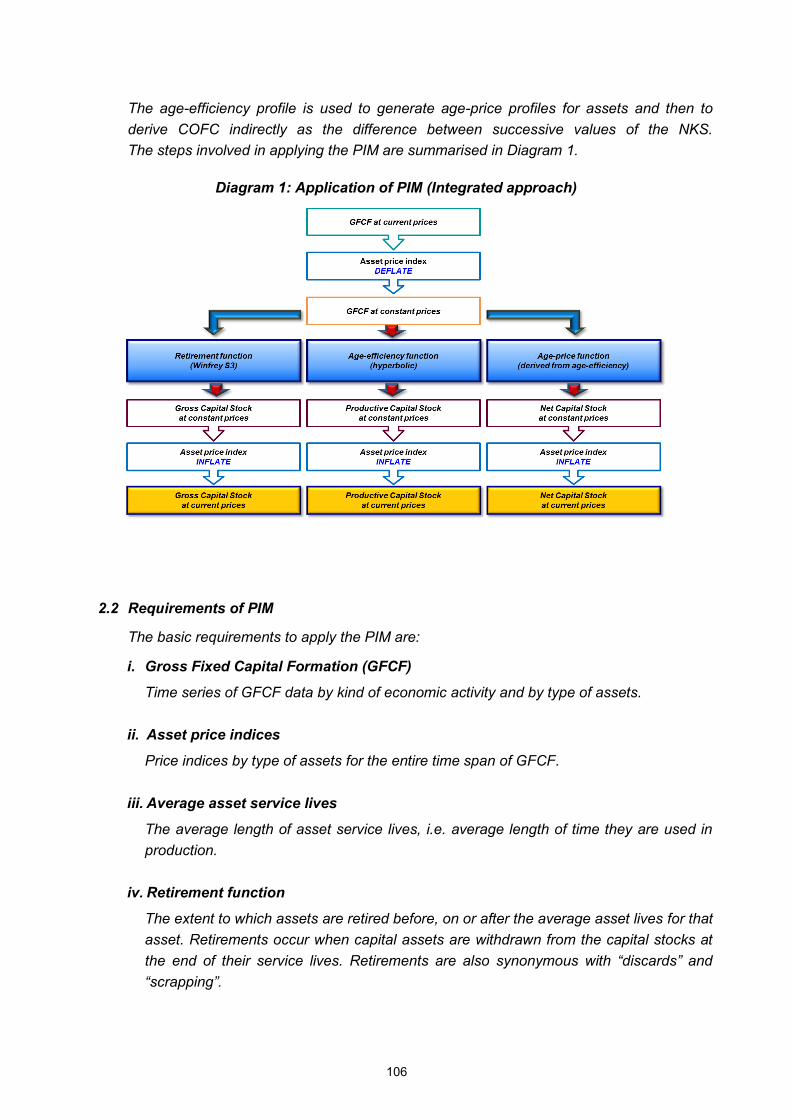
106
The age-efficiency profile is used to generate age-price profiles for assets and then to
derive COFC indirectly as the difference between successive values of the NKS.
The steps involved in applying the PIM are summarised in Diagram 1.
2.2 Requirements of PIM
The basic requirements to apply the PIM are:
i. Gross Fixed Capital Formation (GFCF)
Time series of GFCF data by kind of economic activity and by type of assets.
ii. Asset price indices
Price indices by type of assets for the entire time span of GFCF.
iii. Average asset service lives
The average length of asset service lives, i.e. average length of time they are used in
production.
iv. Retirement function
The extent to which assets are retired before, on or after the average asset lives for that
asset. Retirements occur when capital assets are withdrawn from the capital stocks at
the end of their service lives. Retirements are also synonymous with “discards” and
“scrapping”.
Diagram 1: Application of PIM (Integrated approach)
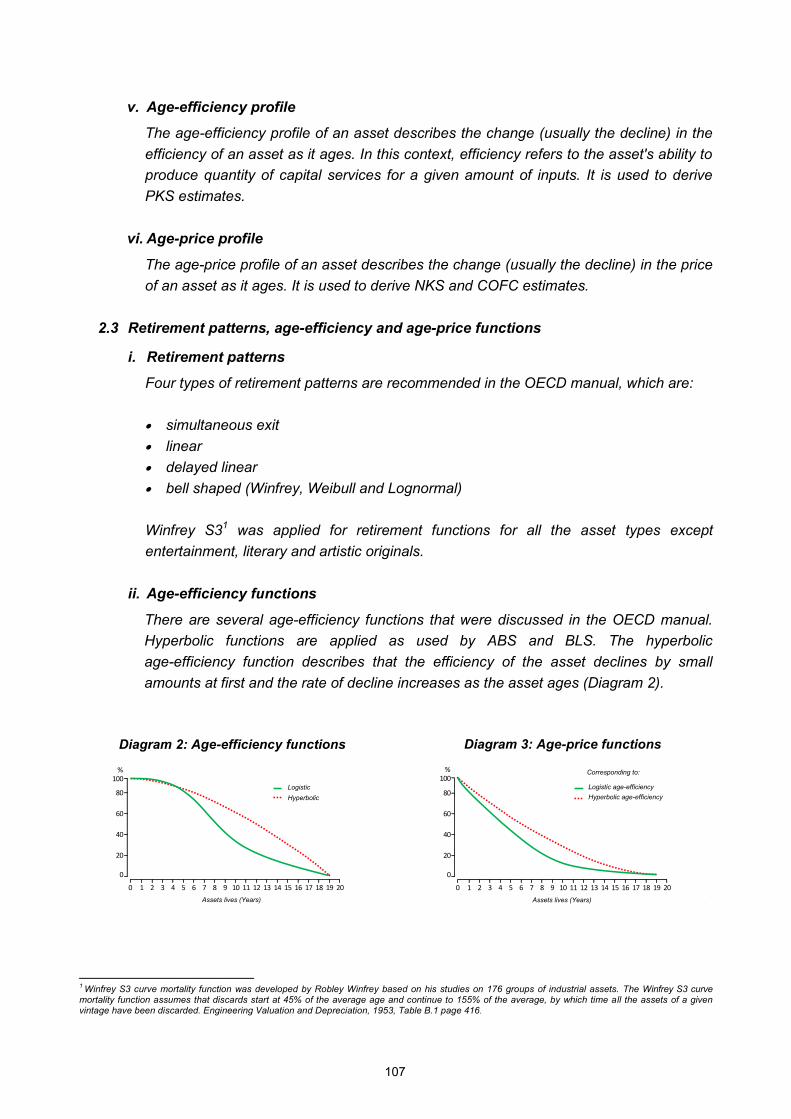
107
v. Age-efficiency profile
The age-efficiency profile of an asset describes the change (usually the decline) in the
efficiency of an asset as it ages. In this context, efficiency refers to the asset's ability to
produce quantity of capital services for a given amount of inputs. It is used to derive
PKS estimates.
vi. Age-price profile
The age-price profile of an asset describes the change (usually the decline) in the price
of an asset as it ages. It is used to derive NKS and COFC estimates.
2.3 Retirement patterns, age-efficiency and age-price functions
i. Retirement patterns
Four types of retirement patterns are recommended in the OECD manual, which are:
simultaneous exit
linear
delayed linear
bell shaped (Winfrey, Weibull and Lognormal)
Winfrey S31 was applied for retirement functions for all the asset types except
entertainment, literary and artistic originals.
ii. Age-efficiency functions
There are several age-efficiency functions that were discussed in the OECD manual.
Hyperbolic functions are applied as used by ABS and BLS. The hyperbolic
age-efficiency function describes that the efficiency of the asset declines by small
amounts at first and the rate of decline increases as the asset ages (Diagram 2).
____________________________________________________
1 Winfrey S3 curve mortality function was developed by Robley Winfrey based on his studies on 176 groups of industrial assets. The Winfrey S3 curve mortality function assumes that discards start at 45% of the average age and continue to 155% of the average, by which time all the assets of a given vintage have been discarded. Engineering Valuation and Depreciation, 1953, Table B.1 page 416.
Corresponding to : %
Logistic age-efficiency
Hyperbolic age-efficiency
Assets life (Years)
14 15 16 17 18
0
0 1 2 3 4 5 6 7 8 9 10 11 12 13 19 20
60
40
20
100
80
Diagram 3: Age-price functions
Hyperbolic age-efficiency
Logistic age-efficiency
Assets lives (Years)
Corresponding to: %100
0
20
40
60
80
0 2019181716765432 13 1514121110981
Assets lives (Years)
Hyperbolic
Logistic
Diagram 2: Age-efficiency functions
108
Hyperbolic decline in the form:
Et = M-At
M-ßAt
Where ; Et is the efficiency of the asset at time t (as a ratio of
the asset’s lives efficiency when the asset is new)
M is the asset lives as per the Winfrey distribution
At is the age of the asset at time t
ß is the efficiency reduction parameter
The efficiency reduction parameter ß is set to 0.5 for machinery and equipment,
furniture and fittings, computers and 0.75 for structure (the same being used by ABS
and BLS as recommended in the OECD Manual). For mineral exploration & evaluation
and research & development, ß is set to 1, implying that there is no efficiency decline
in knowledge.
Diagram 2 and 3 show the main types of age-efficiency functions and the age-price
functions respectively relating to each of the age-efficiency functions. When the
hyperbolic functions for each of the possible lives of an asset are weighted together
(as per the Winfrey distributions), the resulting average age-efficiency function
resembles a logistic function with a point of inflection towards the end of its maximum
lives of assets2.
iii. Age-price function
Age-price function is calculated using age-efficiency functions and a real discount rate.
It describes the decline in the flow of capital services of an asset as it ages. By using
the discount rate, the net present values of future capital services can be calculated. In
this compilation, a real discount rate of five per cent has been chosen, which is
approximately to the average real Malaysia’s 10-year government bond rate.
____________________________________________________
2 Australian System of National Accounts : Concepts, Sources and Methods 2015, Chapter 14 page 357-381
109
3. DATA SOURCES
3.1 Gross Fixed Capital Formation (GFCF)
The GFCF time series data was collected and compiled from 1955 onwards by 16 types of
assets and 24 kind of economic activities in Malaysia. In the recent years, GFCF data are
obtained from the annual GFCF compilation.
i. Internal data sources
For the historical time series data, internal data sources are obtained from the
economic censuses and surveys conducted by the Department, publications containing
information from other agencies and imported capital goods data.
ii. External data sources
External data sources are from administrative records, company annual reports,
company financial accounts, data obtained and extracted from National Archives of
Malaysia, other agencies’ publications and information from the Malaysia Plans. The
time series data particularly for transport and the utilities sectors is compiled from the
administrative records and company annual reports extracted from National Archives of
Malaysia. Other than that, for years when the GFCF data are not available, various
estimation techniques are applied to obtain GFCF data which include using indicators
such as production, revenues and sales.
Information from the Malaysia Plan and the Mid-Term Review Malaysia Plan provides
guidelines on the value of the budget allocated and used especially for key projects in
various sectors such as the transportation, utilities and telecommunication sectors. The
information also includes the projects that had been implemented or postponed.
Thus, the Malaysia Plan and Mid-Term Review Malaysia Plans are very essential to
support and to provide basis for the estimation of the GFCF data for the respective
period specifically at the level of economic sectors.
3.2 Asset price indices
The Producer Price Index (PPI), the Building Material Cost Index (BCI), the Consumer
Price Index (CPI) and wage index are the asset price indices which have been identified to
be used as the asset price deflator for capital stocks estimation. The PPI is used to deflate
most of the assets such as machinery and equipment, transport equipment, computers
and furniture & fittings. The BCI is used to deflate structure, while mineral exploration &
evaluation and research & development are deflated using wage index of employees
involved in the industries. The deflator for the entertainment, literary and artistic originals
are the relevant CPI and PPI for the items.
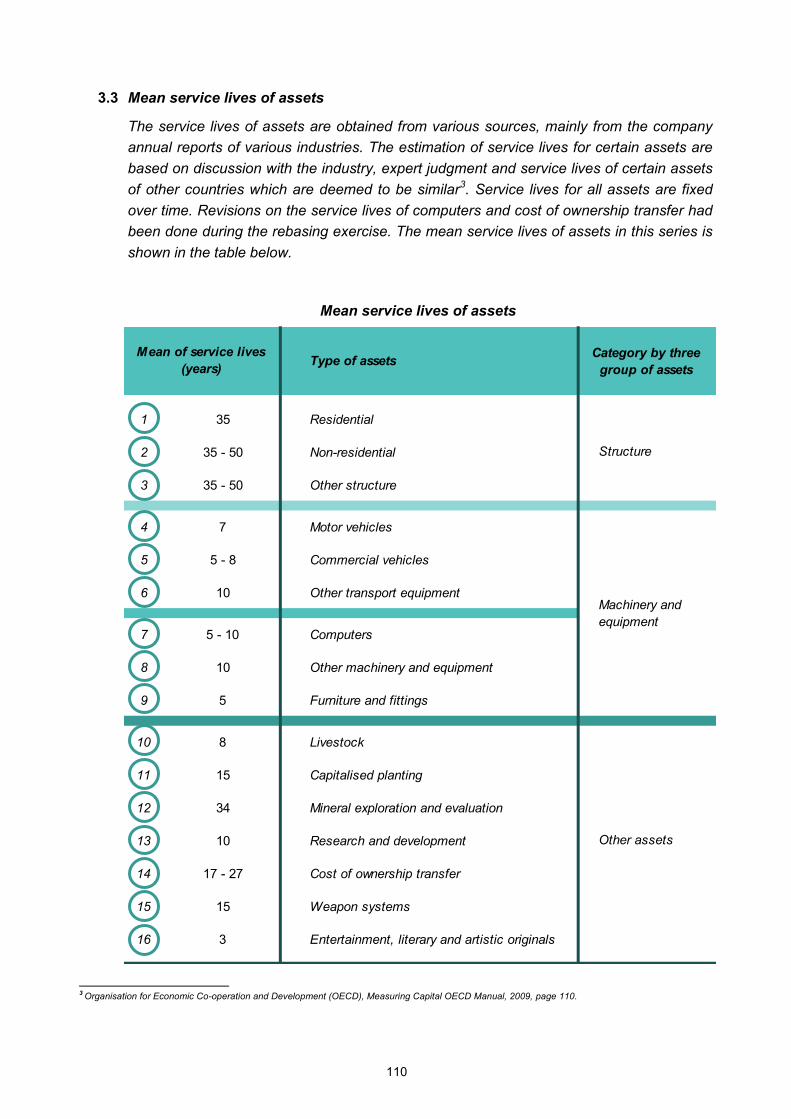
110
3.3 Mean service lives of assets
The service lives of assets are obtained from various sources, mainly from the company
annual reports of various industries. The estimation of service lives for certain assets are
based on discussion with the industry, expert judgment and service lives of certain assets
of other countries which are deemed to be similar3. Service lives for all assets are fixed
over time. Revisions on the service lives of computers and cost of ownership transfer had
been done during the rebasing exercise. The mean service lives of assets in this series is
shown in the table below.
____________________________________________________
3 Organisation for Economic Co-operation and Development (OECD), Measuring Capital OECD Manual, 2009, page 110.
Mean service lives of assets
Type of assetsCategory by three
group of assets
1 35 Residential
2 35 - 50 Non-residential
3 35 - 50 Other structure
4 7 Motor vehicles
5 5 - 8 Commercial vehicles
6 10 Other transport equipment
7 5 - 10 Computers
8 10 Other machinery and equipment
9 5 Furniture and fittings
10 8 Livestock
11 15 Capitalised planting
12 34 Mineral exploration and evaluation
13 10 Research and development
14 17 - 27 Cost of ownership transfer
15 15 Weapon systems
16 3 Entertainment, literary and artistic originals
Mean of service lives
(years)
Structure
Machinery and
equipment
Other assets
DISEMAK OLEH : TANDATANGAN :