Annual Report 2012 - Hap Seng Consolidated Berhad · Dato’ Bornhoft joined Carlsberg Brewery...
199
Annual Report 2012
Transcript of Annual Report 2012 - Hap Seng Consolidated Berhad · Dato’ Bornhoft joined Carlsberg Brewery...
Annual Report 2012
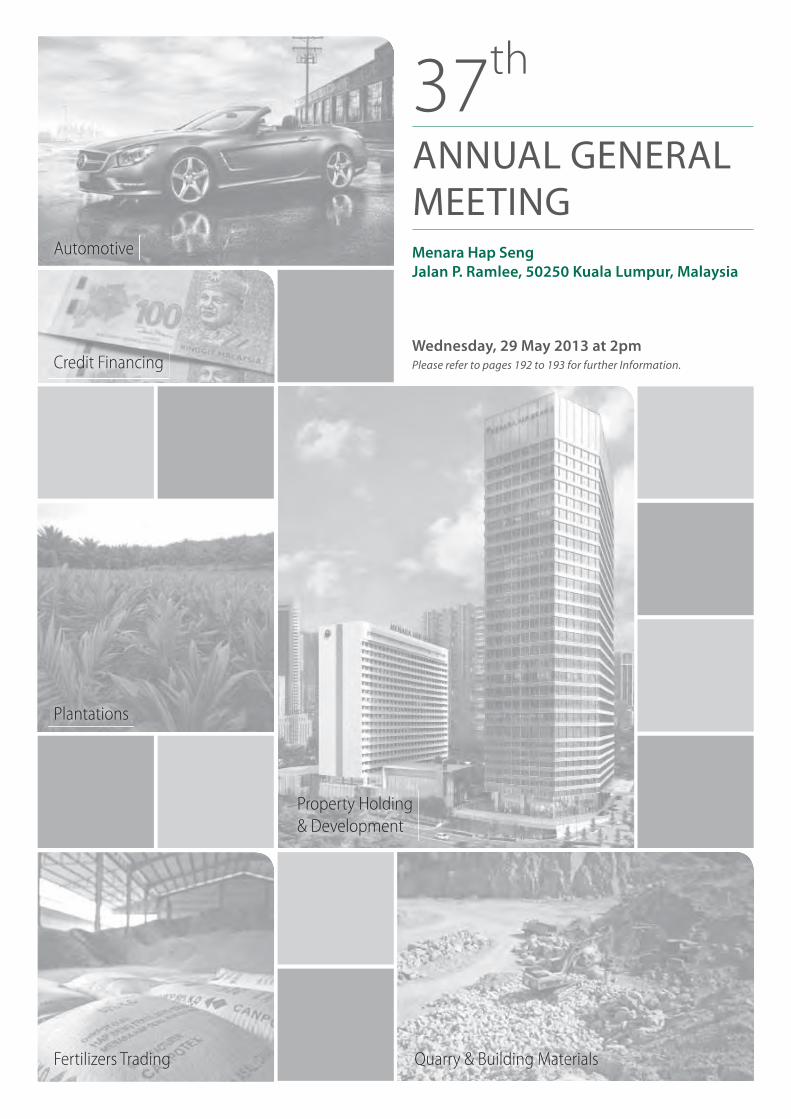
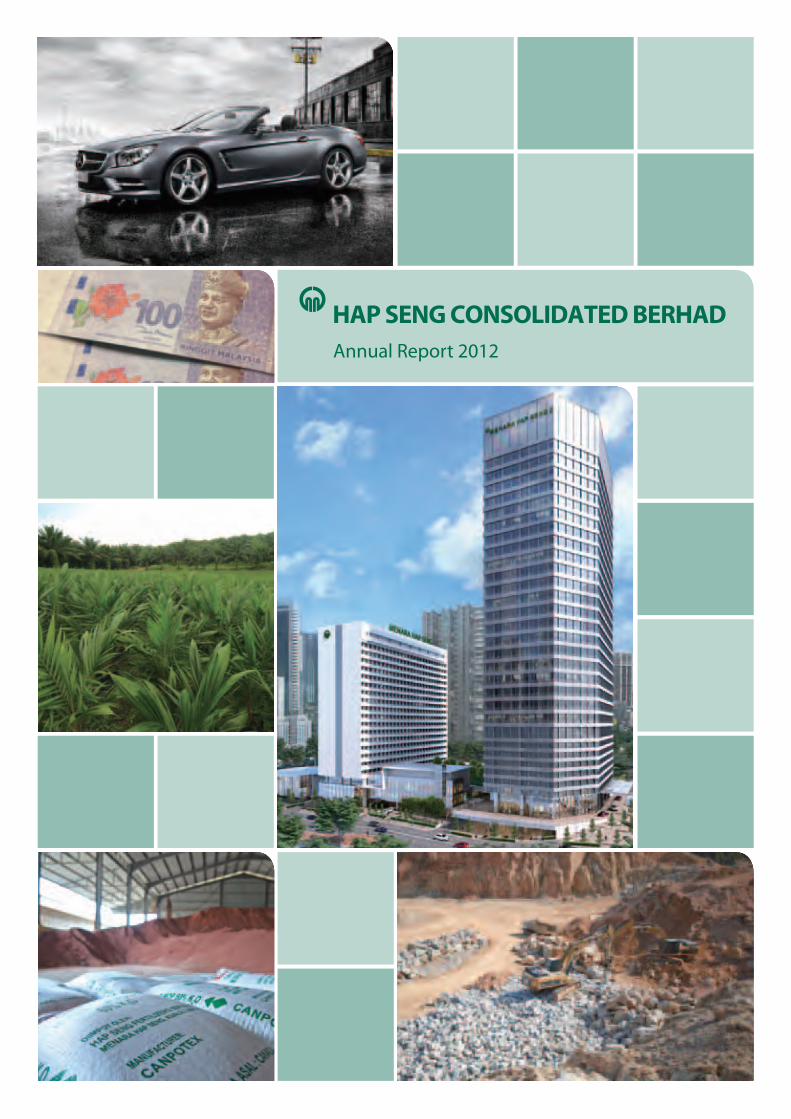
Menara Hap SengJalan P. Ramlee, 50250 Kuala Lumpur, Malaysia
ANNUAL GENERAL MEETING
Wednesday, 29 May 2013 at 2pmPlease refer to pages 192 to 193 for further Information.
37th
Automotive
Credit Financing
Plantations
Fertilizers Trading
Property Holding
& Development
Quarry & Building Materials

Annual Report 2012 1
Table of Contents
Corporate Information
Directors’ Profile
Consolidated Income Statement Summary
Group Financial Highlights
Chairman’s Statement
Review of Operations
Statement on Corporate Governance
Statement on Risk Management and Internal Control
Board Committees
Corporate Social Responsibility
Awards
Financial Statements
Additional Information
Particulars of Top Ten Properties of the Group
Plantation Statistics
Share Buy-Backs Summary
Analysis of Shareholding
Analysis of Warrantholding
Directors’ Shareholdings and Warrantholdings
Notice of Annual General Meeting
Proxy Form
2
4
12
13
16
20
51
61
66
73
76
77
179
182
184
186
187
189
191
192
Creating Value Together. To A Better Future.
To provide quality products and excellent services that differentiates us from others.
To be the preferred partner and promote win-win business relationships.
To achieve sustainable growth and returns for our shareholders over the long term.
To be the employer of choice.
To be a good corporate citizen in harmony with the environment and the communities we serve.
Plantations
Property Holding & Development
Credit Financing
Automotive
Fertilizers Trading
Quarry & Building Materials
Vision
Business
Divisions
Mission
Statement
HAP SENG CONSOLIDATED BERHAD
Annual Report 20122
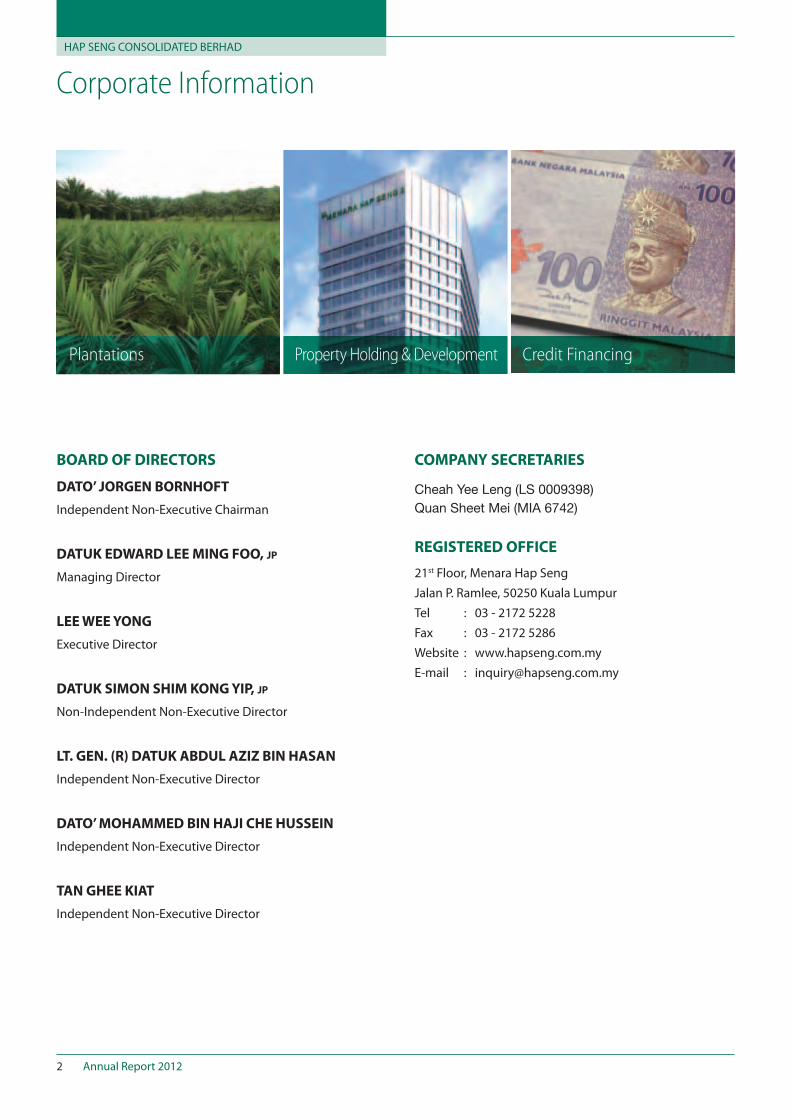
Corporate Information
BOARD OF DIRECTORS
DATO’ JORGEN BORNHOFT
Independent Non-Executive Chairman
DATUK EDWARD LEE MING FOO, JP
Managing Director
LEE WEE YONG
Executive Director
DATUK SIMON SHIM KONG YIP, JP
Non-Independent Non-Executive Director
LT. GEN. (R) DATUK ABDUL AZIZ BIN HASAN
Independent Non-Executive Director
DATO’ MOHAMMED BIN HAJI CHE HUSSEIN
Independent Non-Executive Director
TAN GHEE KIAT
Independent Non-Executive Director
COMPANY SECRETARIES
Cheah Yee Leng (LS 0009398)Quan Sheet Mei (MIA 6742)
REGISTERED OFFICE
21st Floor, Menara Hap SengJalan P. Ramlee, 50250 Kuala LumpurTel : 03 - 2172 5228 Fax : 03 - 2172 5286Website : www.hapseng.com.myE-mail : [email protected]
Credit Financing Property Holding & DevelopmentPlantations
Annual Report 2012 3
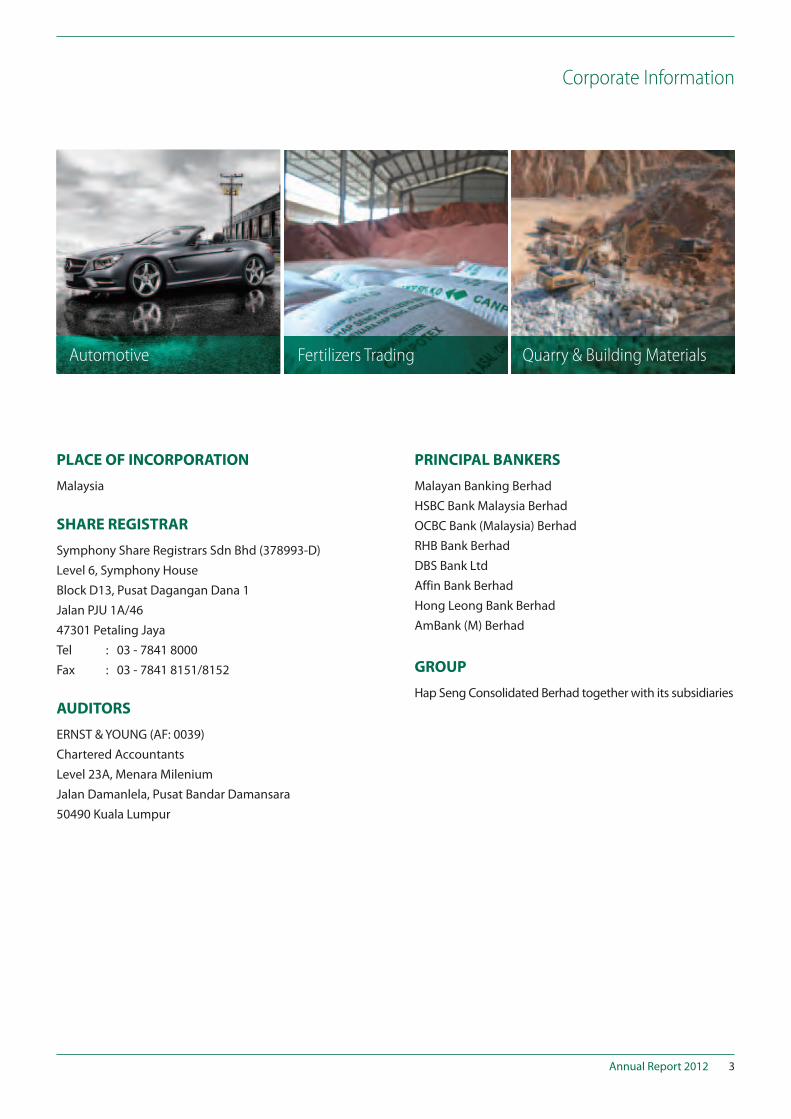
Corporate Information
PLACE OF INCORPORATION
Malaysia
SHARE REGISTRAR
Symphony Share Registrars Sdn Bhd (378993-D)Level 6, Symphony HouseBlock D13, Pusat Dagangan Dana 1Jalan PJU 1A/4647301 Petaling JayaTel : 03 - 7841 8000 Fax : 03 - 7841 8151/8152
AUDITORS
ERNST & YOUNG (AF: 0039)Chartered AccountantsLevel 23A, Menara Milenium Jalan Damanlela, Pusat Bandar Damansara50490 Kuala Lumpur
PRINCIPAL BANKERS
Malayan Banking BerhadHSBC Bank Malaysia BerhadOCBC Bank (Malaysia) BerhadRHB Bank BerhadDBS Bank LtdAffin Bank BerhadHong Leong Bank BerhadAmBank (M) Berhad
GROUP
Hap Seng Consolidated Berhad together with its subsidiaries
Quarry & Building Materials Fertilizers Trading Automotive
HAP SENG CONSOLIDATED BERHAD
Annual Report 20124
Directors’ Profile
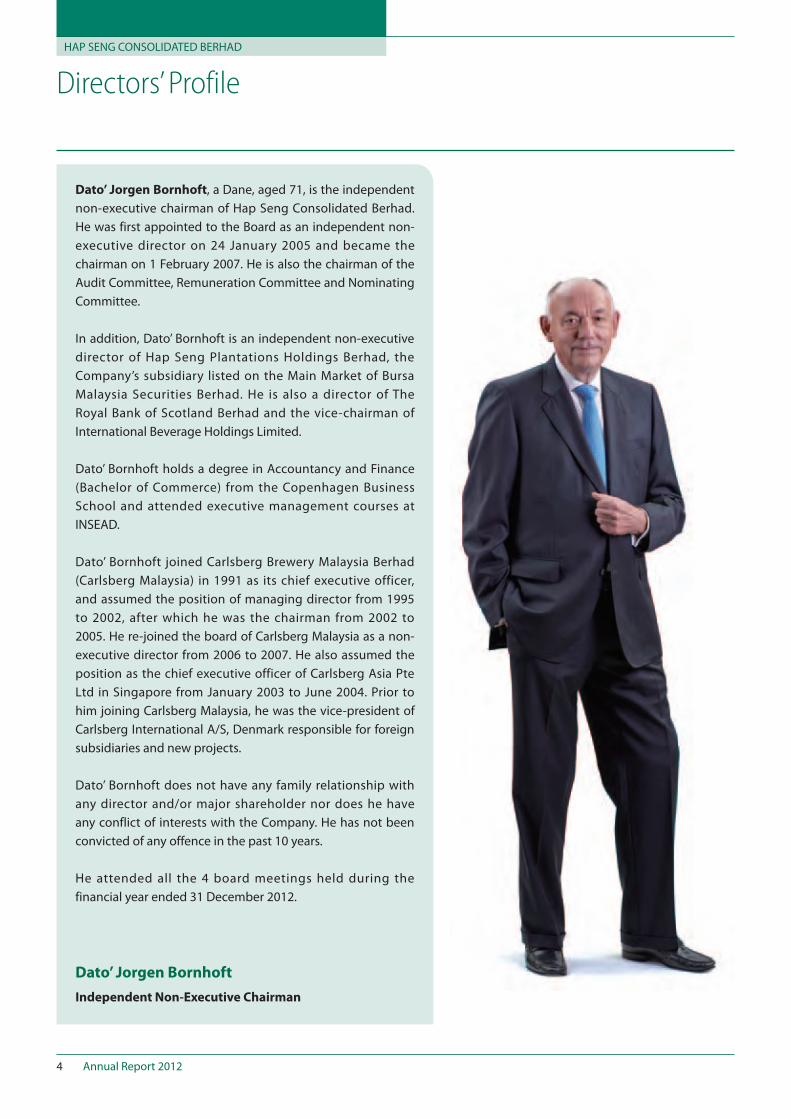
Dato’ Jorgen Bornhoft
Independent Non-Executive Chairman
Dato’ Jorgen Bornhoft, a Dane, aged 71, is the independent non-executive chairman of Hap Seng Consolidated Berhad. He was first appointed to the Board as an independent non-executive director on 24 January 2005 and became the chairman on 1 February 2007. He is also the chairman of the Audit Committee, Remuneration Committee and Nominating Committee.
In addition, Dato’ Bornhoft is an independent non-executive director of Hap Seng Plantations Holdings Berhad, the Company’s subsidiary listed on the Main Market of Bursa Malaysia Securities Berhad. He is also a director of The Royal Bank of Scotland Berhad and the vice-chairman of International Beverage Holdings Limited.
Dato’ Bornhoft holds a degree in Accountancy and Finance (Bachelor of Commerce) from the Copenhagen Business School and attended executive management courses at INSEAD.
Dato’ Bornhoft joined Carlsberg Brewery Malaysia Berhad (Carlsberg Malaysia) in 1991 as its chief executive officer, and assumed the position of managing director from 1995 to 2002, after which he was the chairman from 2002 to 2005. He re-joined the board of Carlsberg Malaysia as a non-executive director from 2006 to 2007. He also assumed the position as the chief executive officer of Carlsberg Asia Pte Ltd in Singapore from January 2003 to June 2004. Prior to him joining Carlsberg Malaysia, he was the vice-president of Carlsberg International A/S, Denmark responsible for foreign subsidiaries and new projects.
Dato’ Bornhoft does not have any family relationship with any director and/or major shareholder nor does he have any conflict of interests with the Company. He has not been convicted of any offence in the past 10 years.
He attended all the 4 board meetings held during the financial year ended 31 December 2012.
Annual Report 2012 5
Directors’ Profile
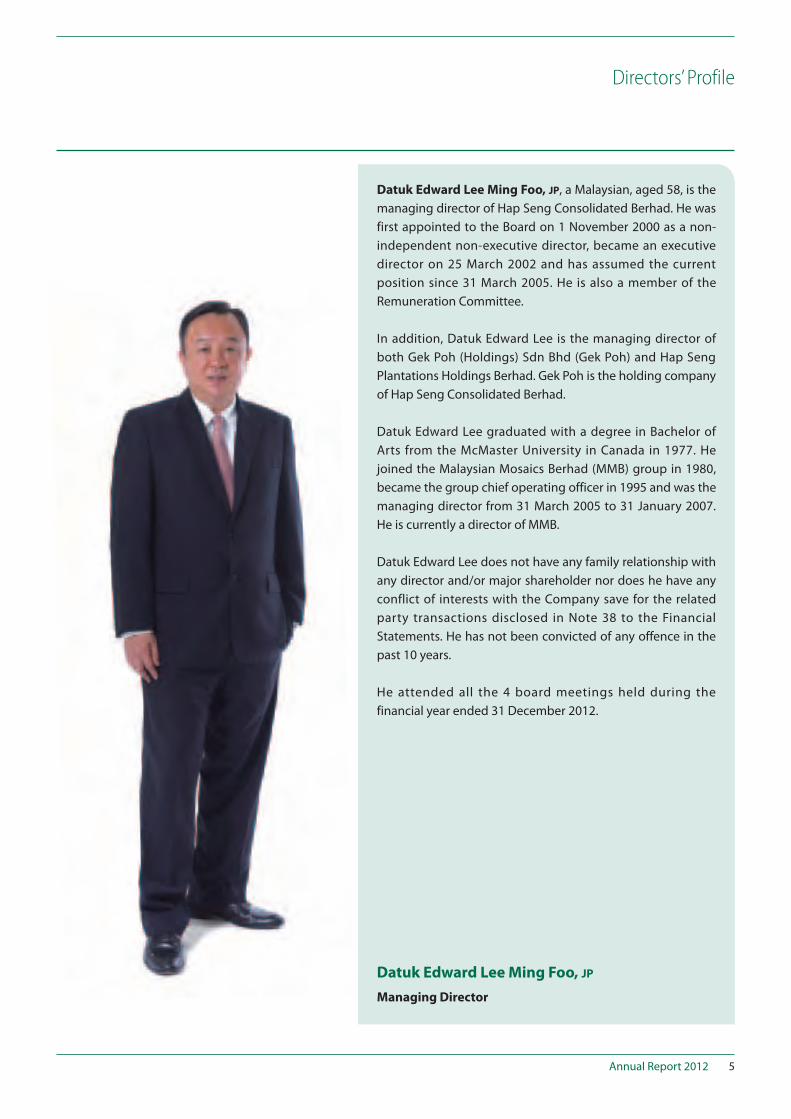
Datuk Edward Lee Ming Foo, JP
Managing Director
Datuk Edward Lee Ming Foo, JP, a Malaysian, aged 58, is the managing director of Hap Seng Consolidated Berhad. He was first appointed to the Board on 1 November 2000 as a non-independent non-executive director, became an executive director on 25 March 2002 and has assumed the current position since 31 March 2005. He is also a member of the Remuneration Committee.
In addition, Datuk Edward Lee is the managing director of both Gek Poh (Holdings) Sdn Bhd (Gek Poh) and Hap Seng Plantations Holdings Berhad. Gek Poh is the holding company of Hap Seng Consolidated Berhad.
Datuk Edward Lee graduated with a degree in Bachelor of Arts from the McMaster University in Canada in 1977. He joined the Malaysian Mosaics Berhad (MMB) group in 1980, became the group chief operating officer in 1995 and was the managing director from 31 March 2005 to 31 January 2007. He is currently a director of MMB.
Datuk Edward Lee does not have any family relationship with any director and/or major shareholder nor does he have any conflict of interests with the Company save for the related party transactions disclosed in Note 38 to the Financial Statements. He has not been convicted of any offence in the past 10 years.
He attended all the 4 board meetings held during the financial year ended 31 December 2012.
HAP SENG CONSOLIDATED BERHAD
Annual Report 20126
Directors’ Profile
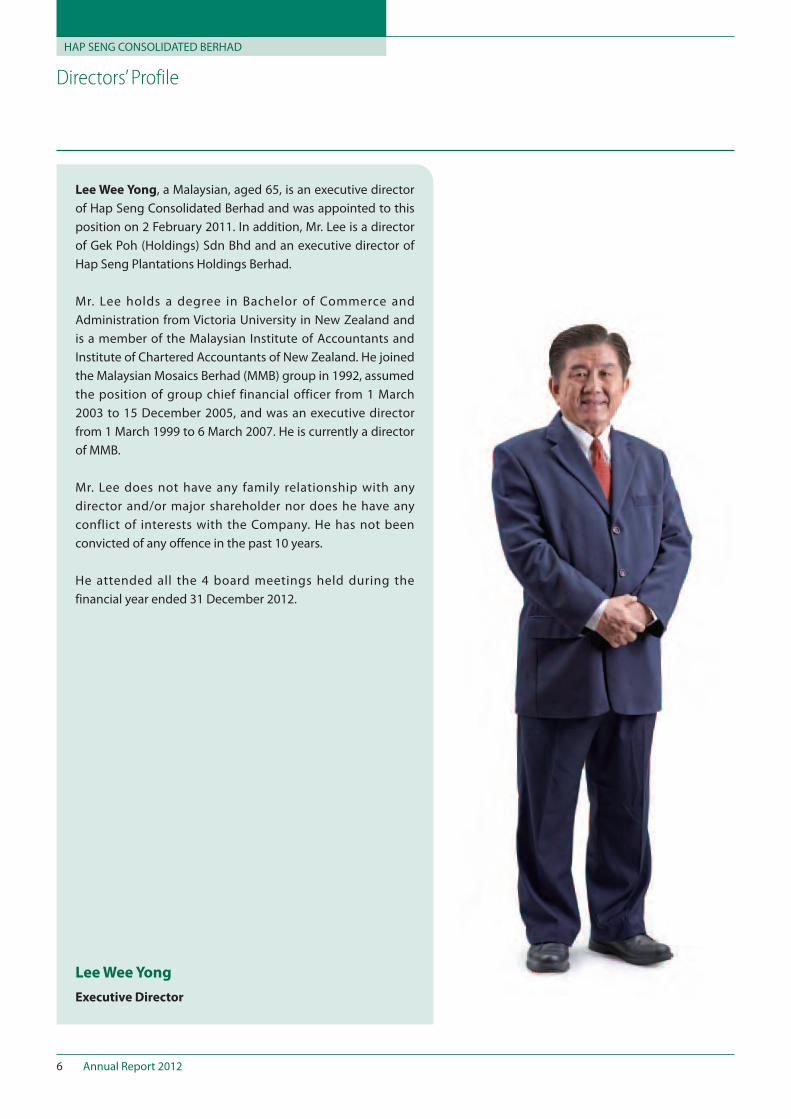
Lee Wee Yong
Executive Director
Lee Wee Yong, a Malaysian, aged 65, is an executive director of Hap Seng Consolidated Berhad and was appointed to this position on 2 February 2011. In addition, Mr. Lee is a director of Gek Poh (Holdings) Sdn Bhd and an executive director of Hap Seng Plantations Holdings Berhad.
Mr. Lee holds a degree in Bachelor of Commerce and Administration from Victoria University in New Zealand and is a member of the Malaysian Institute of Accountants and Institute of Chartered Accountants of New Zealand. He joined the Malaysian Mosaics Berhad (MMB) group in 1992, assumed the position of group chief financial officer from 1 March 2003 to 15 December 2005, and was an executive director from 1 March 1999 to 6 March 2007. He is currently a director of MMB.
Mr. Lee does not have any family relationship with any director and/or major shareholder nor does he have any conflict of interests with the Company. He has not been convicted of any offence in the past 10 years.
He attended all the 4 board meetings held during the financial year ended 31 December 2012.
Annual Report 2012 7
Directors’ Profile
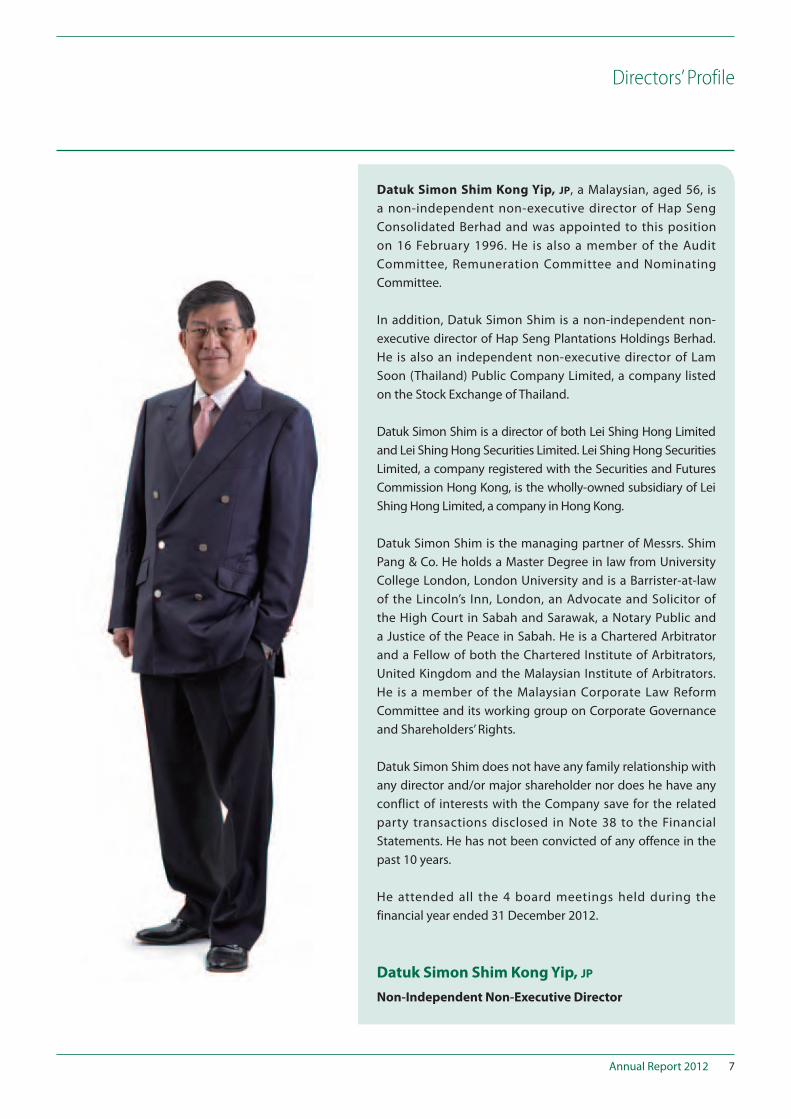
Datuk Simon Shim Kong Yip, JP
Non-Independent Non-Executive Director
Datuk Simon Shim Kong Yip, JP, a Malaysian, aged 56, is a non-independent non-executive director of Hap Seng Consolidated Berhad and was appointed to this position on 16 February 1996. He is also a member of the Audit Committee, Remuneration Committee and Nominating Committee.
In addition, Datuk Simon Shim is a non-independent non-executive director of Hap Seng Plantations Holdings Berhad. He is also an independent non-executive director of Lam Soon (Thailand) Public Company Limited, a company listed on the Stock Exchange of Thailand.
Datuk Simon Shim is a director of both Lei Shing Hong Limited and Lei Shing Hong Securities Limited. Lei Shing Hong Securities Limited, a company registered with the Securities and Futures Commission Hong Kong, is the wholly-owned subsidiary of Lei Shing Hong Limited, a company in Hong Kong.
Datuk Simon Shim is the managing partner of Messrs. Shim Pang & Co. He holds a Master Degree in law from University College London, London University and is a Barrister-at-law of the Lincoln’s Inn, London, an Advocate and Solicitor of the High Court in Sabah and Sarawak, a Notary Public and a Justice of the Peace in Sabah. He is a Chartered Arbitrator and a Fellow of both the Chartered Institute of Arbitrators, United Kingdom and the Malaysian Institute of Arbitrators. He is a member of the Malaysian Corporate Law Reform Committee and its working group on Corporate Governance and Shareholders’ Rights.
Datuk Simon Shim does not have any family relationship with any director and/or major shareholder nor does he have any conflict of interests with the Company save for the related party transactions disclosed in Note 38 to the Financial Statements. He has not been convicted of any offence in the past 10 years.
He attended all the 4 board meetings held during the financial year ended 31 December 2012.
HAP SENG CONSOLIDATED BERHAD
Annual Report 20128
Directors’ Profile
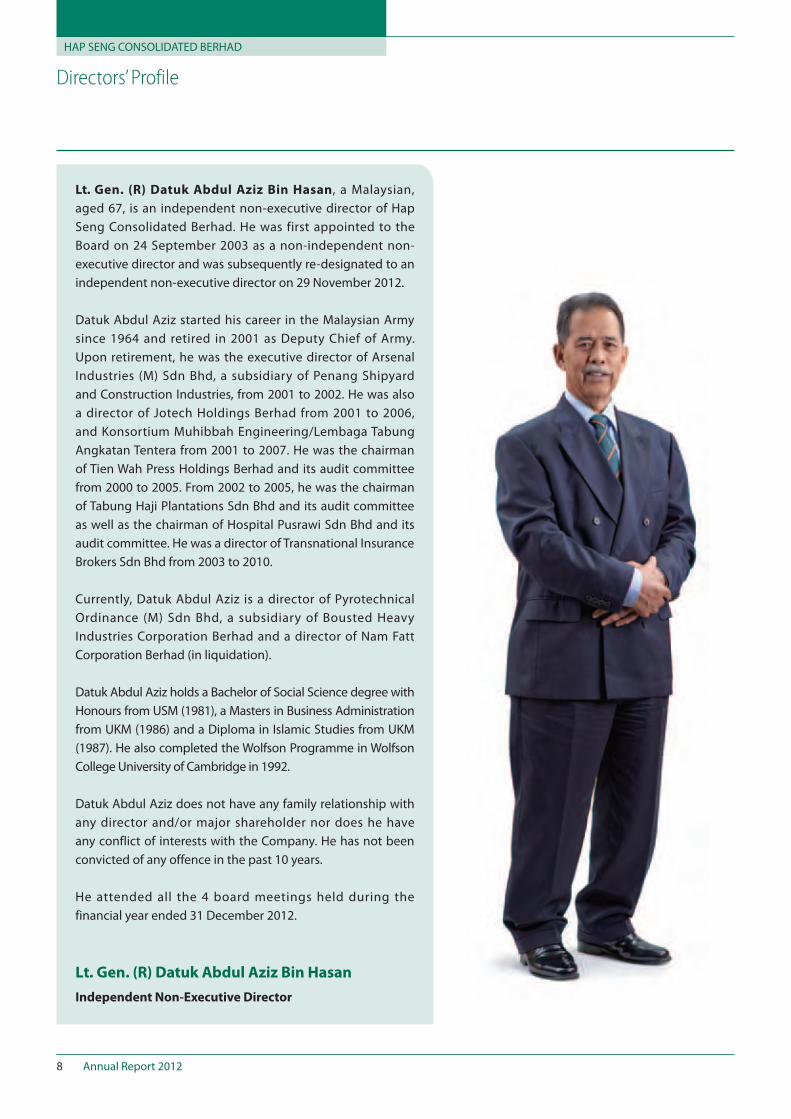
Lt. Gen. (R) Datuk Abdul Aziz Bin Hasan
Independent Non-Executive Director
Lt. Gen. (R) Datuk Abdul Aziz Bin Hasan, a Malaysian, aged 67, is an independent non-executive director of Hap Seng Consolidated Berhad. He was first appointed to the Board on 24 September 2003 as a non-independent non-executive director and was subsequently re-designated to an independent non-executive director on 29 November 2012.
Datuk Abdul Aziz started his career in the Malaysian Army since 1964 and retired in 2001 as Deputy Chief of Army. Upon retirement, he was the executive director of Arsenal Industries (M) Sdn Bhd, a subsidiary of Penang Shipyard and Construction Industries, from 2001 to 2002. He was also a director of Jotech Holdings Berhad from 2001 to 2006, and Konsortium Muhibbah Engineering/Lembaga Tabung Angkatan Tentera from 2001 to 2007. He was the chairman of Tien Wah Press Holdings Berhad and its audit committee from 2000 to 2005. From 2002 to 2005, he was the chairman of Tabung Haji Plantations Sdn Bhd and its audit committee as well as the chairman of Hospital Pusrawi Sdn Bhd and its audit committee. He was a director of Transnational Insurance Brokers Sdn Bhd from 2003 to 2010.
Currently, Datuk Abdul Aziz is a director of Pyrotechnical Ordinance (M) Sdn Bhd, a subsidiary of Bousted Heavy Industries Corporation Berhad and a director of Nam Fatt Corporation Berhad (in liquidation).
Datuk Abdul Aziz holds a Bachelor of Social Science degree with Honours from USM (1981), a Masters in Business Administration from UKM (1986) and a Diploma in Islamic Studies from UKM (1987). He also completed the Wolfson Programme in Wolfson College University of Cambridge in 1992.
Datuk Abdul Aziz does not have any family relationship with any director and/or major shareholder nor does he have any conflict of interests with the Company. He has not been convicted of any offence in the past 10 years.
He attended all the 4 board meetings held during the financial year ended 31 December 2012.
Annual Report 2012 9
Directors’ Profile
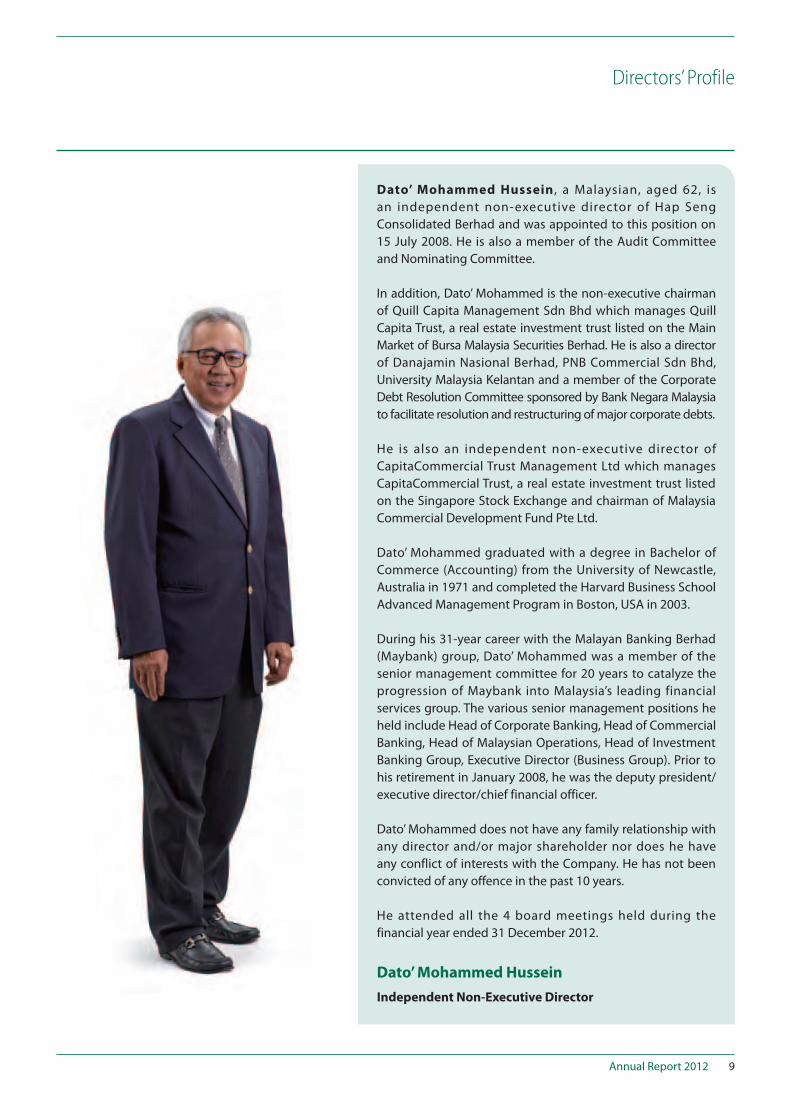
Dato’ Mohammed Hussein
Independent Non-Executive Director
Dato’ Mohammed Hussein , a Malaysian, aged 62, is an independent non-executive director of Hap Seng Consolidated Berhad and was appointed to this position on 15 July 2008. He is also a member of the Audit Committee and Nominating Committee.
In addition, Dato’ Mohammed is the non-executive chairman of Quill Capita Management Sdn Bhd which manages Quill Capita Trust, a real estate investment trust listed on the Main Market of Bursa Malaysia Securities Berhad. He is also a director of Danajamin Nasional Berhad, PNB Commercial Sdn Bhd, University Malaysia Kelantan and a member of the Corporate Debt Resolution Committee sponsored by Bank Negara Malaysia to facilitate resolution and restructuring of major corporate debts.
He is also an independent non-executive director of CapitaCommercial Trust Management Ltd which manages CapitaCommercial Trust, a real estate investment trust listed on the Singapore Stock Exchange and chairman of Malaysia Commercial Development Fund Pte Ltd.
Dato’ Mohammed graduated with a degree in Bachelor of Commerce (Accounting) from the University of Newcastle, Australia in 1971 and completed the Harvard Business School Advanced Management Program in Boston, USA in 2003.
During his 31-year career with the Malayan Banking Berhad (Maybank) group, Dato’ Mohammed was a member of the senior management committee for 20 years to catalyze the progression of Maybank into Malaysia’s leading financial services group. The various senior management positions he held include Head of Corporate Banking, Head of Commercial Banking, Head of Malaysian Operations, Head of Investment Banking Group, Executive Director (Business Group). Prior to his retirement in January 2008, he was the deputy president/executive director/chief financial officer.
Dato’ Mohammed does not have any family relationship with any director and/or major shareholder nor does he have any conflict of interests with the Company. He has not been convicted of any offence in the past 10 years.
He attended all the 4 board meetings held during the financial year ended 31 December 2012.
HAP SENG CONSOLIDATED BERHAD
Annual Report 201210
Directors’ Profile
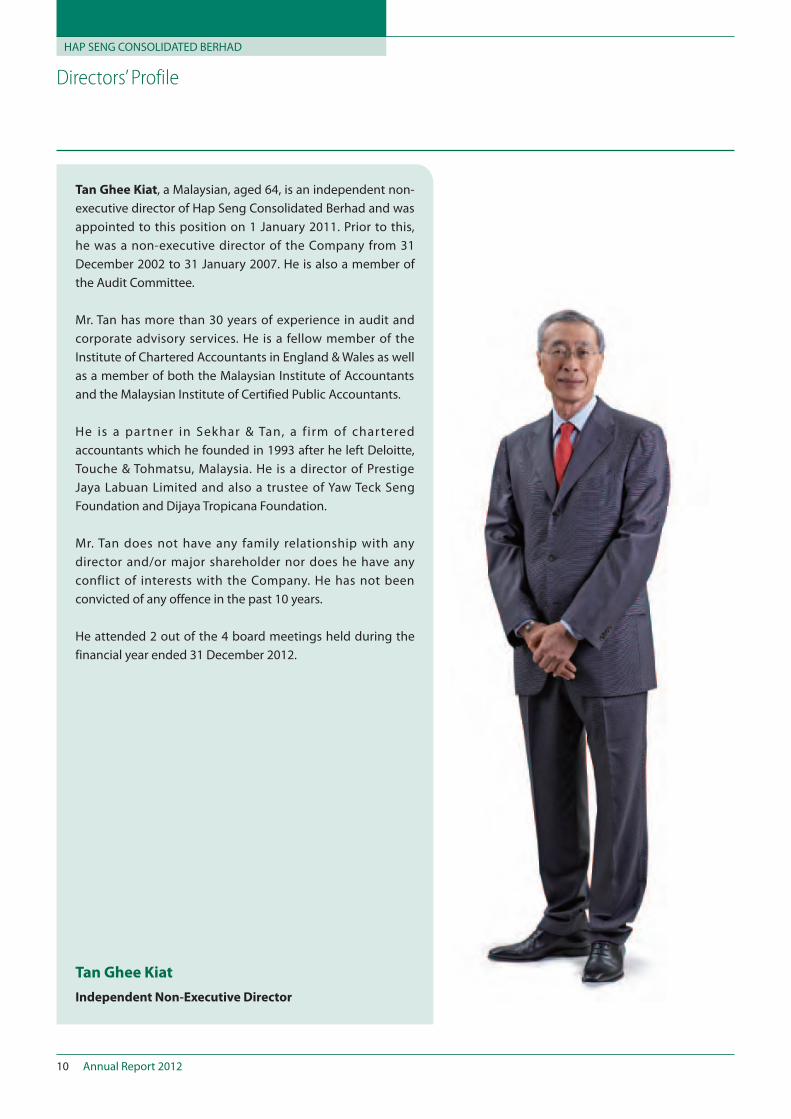
Tan Ghee Kiat
Independent Non-Executive Director
Tan Ghee Kiat, a Malaysian, aged 64, is an independent non-executive director of Hap Seng Consolidated Berhad and was appointed to this position on 1 January 2011. Prior to this, he was a non-executive director of the Company from 31 December 2002 to 31 January 2007. He is also a member of the Audit Committee.
Mr. Tan has more than 30 years of experience in audit and corporate advisory services. He is a fellow member of the Institute of Chartered Accountants in England & Wales as well as a member of both the Malaysian Institute of Accountants and the Malaysian Institute of Certified Public Accountants.
He is a partner in Sekhar & Tan, a f irm of chartered accountants which he founded in 1993 after he left Deloitte, Touche & Tohmatsu, Malaysia. He is a director of Prestige Jaya Labuan Limited and also a trustee of Yaw Teck Seng Foundation and Dijaya Tropicana Foundation.
Mr. Tan does not have any family relationship with any director and/or major shareholder nor does he have any conflict of interests with the Company. He has not been convicted of any offence in the past 10 years.
He attended 2 out of the 4 board meetings held during the financial year ended 31 December 2012.
Annual Report 2012 11
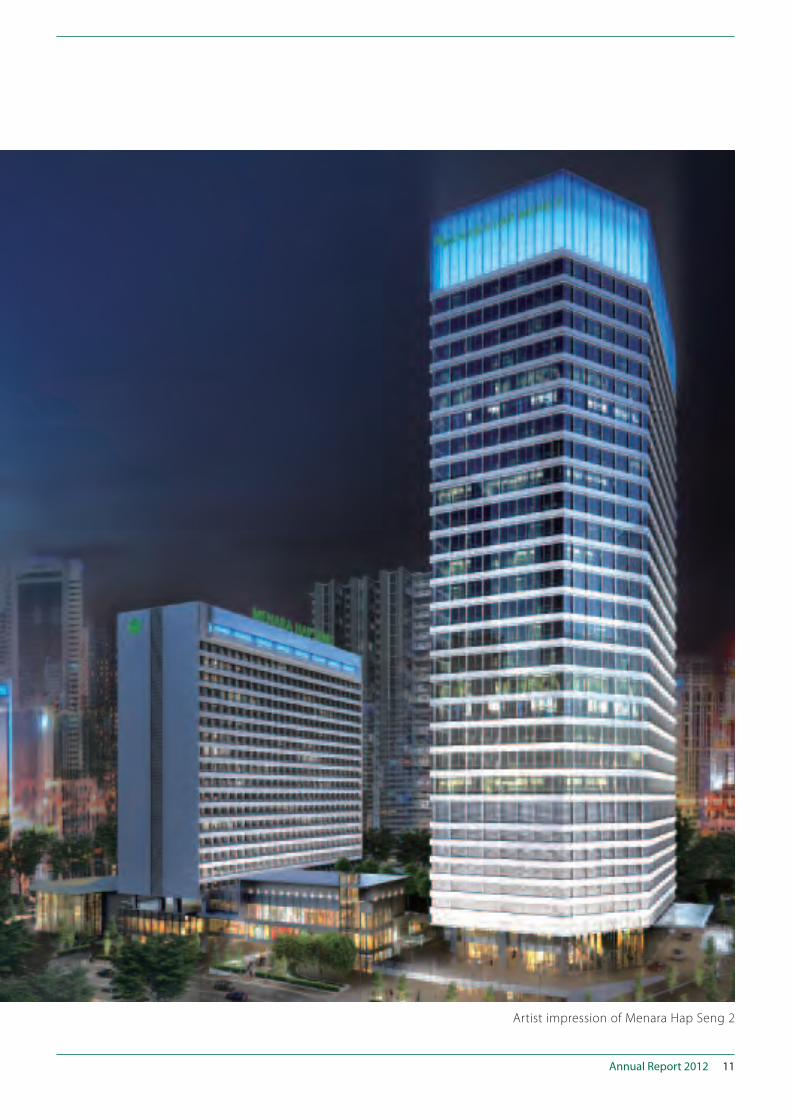
Artist impression of Menara Hap Seng 2
HAP SENG CONSOLIDATED BERHAD
Annual Report 201212
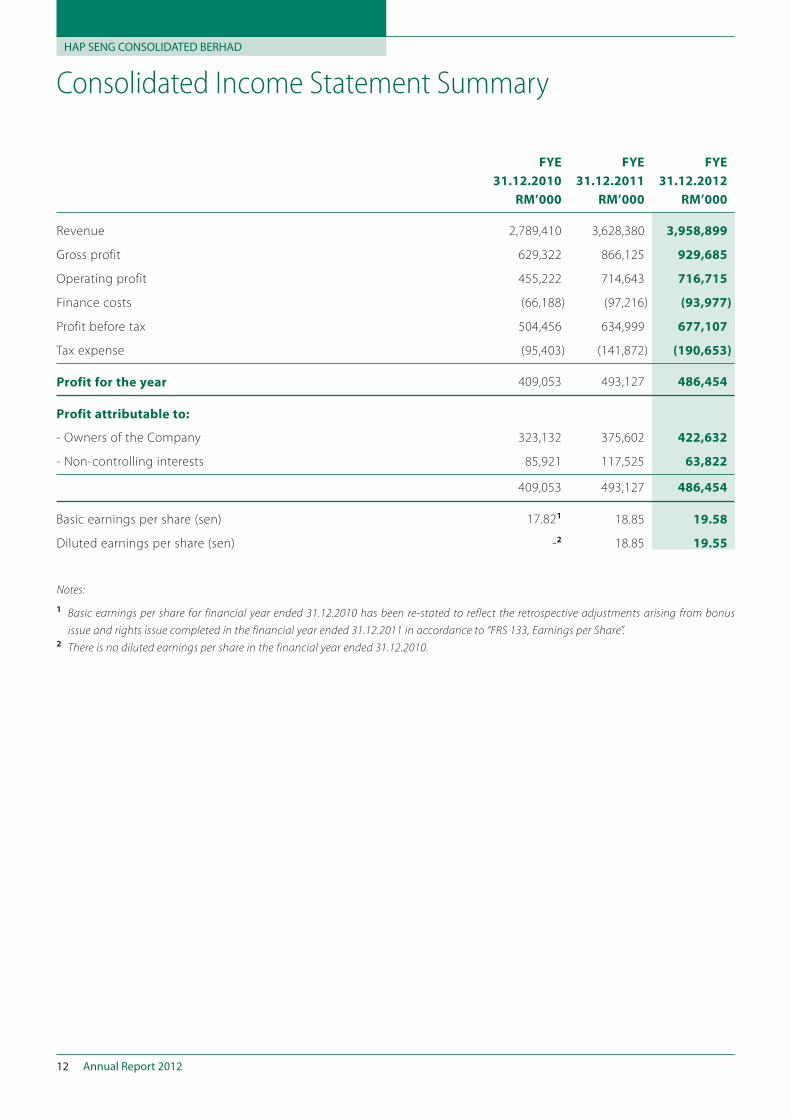
Consolidated Income Statement Summary
FYE FYE FYE
31.12.2010 31.12.2011 31.12.2012
RM’000 RM’000 RM’000
Revenue 2,789,410 3,628,380 3,958,899
Gross profit 629,322 866,125 929,685
Operating profit 455,222 714,643 716,715
Finance costs (66,188) (97,216) (93,977)
Profit before tax 504,456 634,999 677,107
Tax expense (95,403) (141,872) (190,653)
Profit for the year 409,053 493,127 486,454
Profit attributable to:
- Owners of the Company 323,132 375,602 422,632
- Non-controlling interests 85,921 117,525 63,822
409,053 493,127 486,454
Basic earnings per share (sen) 17.821 18.85 19.58
Diluted earnings per share (sen) -2 18.85 19.55
Notes:
1 Basic earnings per share for financial year ended 31.12.2010 has been re-stated to reflect the retrospective adjustments arising from bonus
issue and rights issue completed in the financial year ended 31.12.2011 in accordance to “FRS 133, Earnings per Share”.2 There is no diluted earnings per share in the financial year ended 31.12.2010.
Annual Report 2012 13
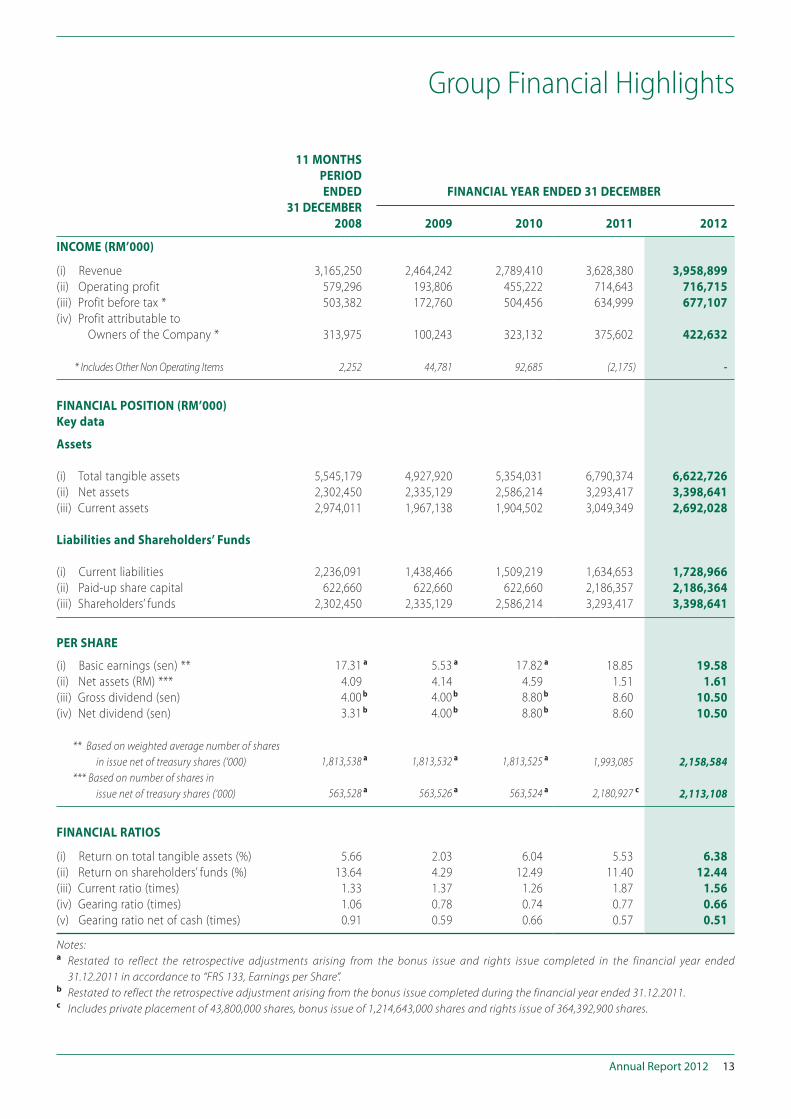
Group Financial Highlights
Notes:a Restated to reflect the retrospective adjustments arising from the bonus issue and rights issue completed in the financial year ended
31.12.2011 in accordance to “FRS 133, Earnings per Share”.b Restated to reflect the retrospective adjustment arising from the bonus issue completed during the financial year ended 31.12.2011.c Includes private placement of 43,800,000 shares, bonus issue of 1,214,643,000 shares and rights issue of 364,392,900 shares.
11 MONTHS
PERIOD
ENDED
31 DECEMBER
FINANCIAL YEAR ENDED 31 DECEMBER
2008 2009 2010 2011 2012
INCOME (RM’000)
(i) Revenue 3,165,250 2,464,242 2,789,410 3,628,380 3,958,899
(ii) Operating profit 579,296 193,806 455,222 714,643 716,715
(iii) Profit before tax * 503,382 172,760 504,456 634,999 677,107
(iv) Profit attributable to
Owners of the Company * 313,975 100,243 323,132 375,602 422,632
* Includes Other Non Operating Items 2,252 44,781 92,685 (2,175) -
FINANCIAL POSITION (RM’000)
Key data
Assets
(i) Total tangible assets 5,545,179 4,927,920 5,354,031 6,790,374 6,622,726
(ii) Net assets 2,302,450 2,335,129 2,586,214 3,293,417 3,398,641
(iii) Current assets 2,974,011 1,967,138 1,904,502 3,049,349 2,692,028
Liabilities and Shareholders’ Funds
(i) Current liabilities 2,236,091 1,438,466 1,509,219 1,634,653 1,728,966
(ii) Paid-up share capital 622,660 622,660 622,660 2,186,357 2,186,364
(iii) Shareholders’ funds 2,302,450 2,335,129 2,586,214 3,293,417 3,398,641
PER SHARE
(i) Basic earnings (sen) ** 17.31 a 5.53 a 17.82 a 18.85 19.58
(ii) Net assets (RM) *** 4.09 4.14 4.59 1.51 1.61
(iii) Gross dividend (sen) 4.00 b 4.00 b 8.80 b 8.60 10.50
(iv) Net dividend (sen) 3.31 b 4.00 b 8.80 b 8.60 10.50
** Based on weighted average number of shares
in issue net of treasury shares (‘000) 1,813,538 a 1,813,532 a 1,813,525 a 1,993,085 2,158,584 *** Based on number of shares in
issue net of treasury shares (‘000) 563,528 a 563,526 a 563,524 a 2,180,927 c 2,113,108
FINANCIAL RATIOS
(i) Return on total tangible assets (%) 5.66 2.03 6.04 5.53 6.38
(ii) Return on shareholders’ funds (%) 13.64 4.29 12.49 11.40 12.44
(iii) Current ratio (times) 1.33 1.37 1.26 1.87 1.56
(iv) Gearing ratio (times) 1.06 0.78 0.74 0.77 0.66
(v) Gearing ratio net of cash (times) 0.91 0.59 0.66 0.57 0.51
HAP SENG CONSOLIDATED BERHAD
Annual Report 201214
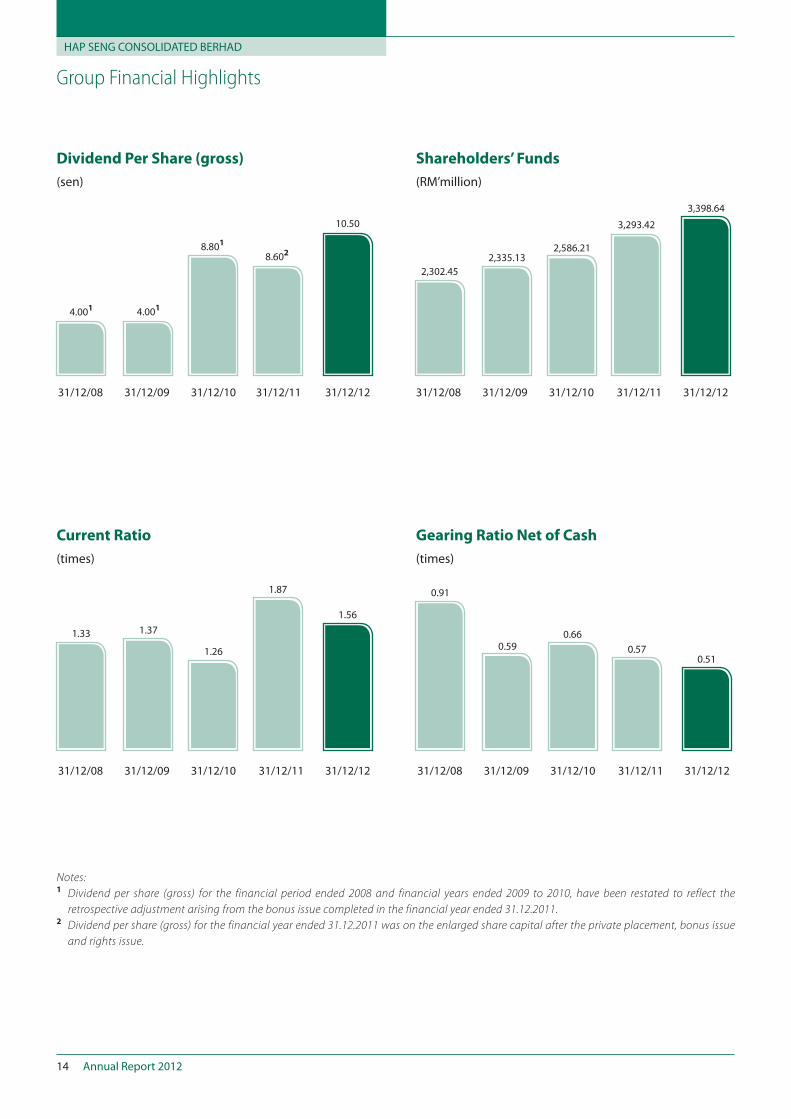
Group Financial Highlights
Dividend Per Share (gross)
(sen)
4.001
10.50
4.001
8.801
8.602
31/12/08 31/12/09 31/12/10 31/12/11 31/12/12 31/12/08 31/12/09 31/12/10 31/12/11 31/12/12
31/12/08 31/12/09 31/12/10 31/12/11 31/12/12 31/12/08 31/12/09 31/12/10 31/12/11 31/12/12
Shareholders’ Funds
(RM’million)
Current Ratio
(times)
Gearing Ratio Net of Cash
(times)
2,302.45
0.91
1.33
2,335.13
0.59
1.37
2,586.21
0.66
1.26
3,293.42
0.57
1.87
3,398.64
0.51
1.56
Notes:1 Dividend per share (gross) for the financial period ended 2008 and financial years ended 2009 to 2010, have been restated to reflect the
retrospective adjustment arising from the bonus issue completed in the financial year ended 31.12.2011.2 Dividend per share (gross) for the financial year ended 31.12.2011 was on the enlarged share capital after the private placement, bonus issue
and rights issue.
Annual Report 2012 15
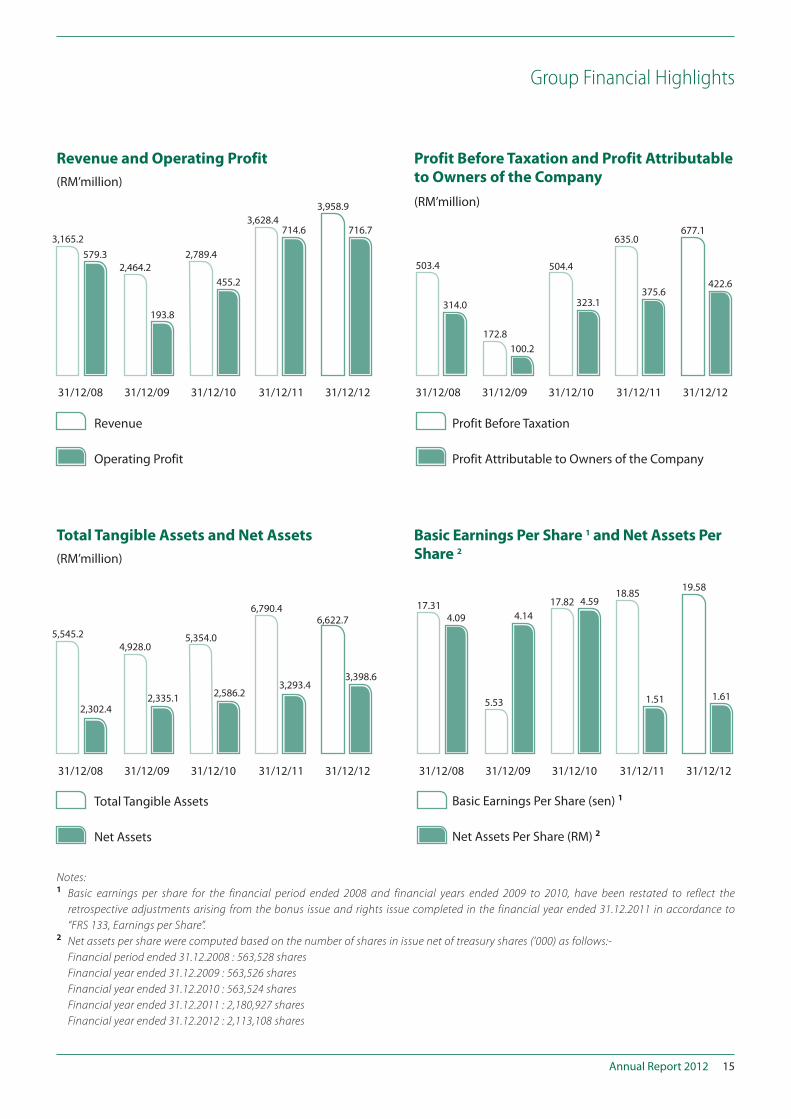
Group Financial Highlights
Revenue and Operating Profit
(RM’million)
Revenue
Operating Profit
Total Tangible Assets
Net Assets
Profit Before Taxation
Profit Attributable to Owners of the Company
Basic Earnings Per Share (sen) 1
Net Assets Per Share (RM) 2
31/12/08 31/12/09 31/12/10 31/12/11 31/12/12
31/12/08 31/12/09 31/12/10 31/12/11 31/12/12 31/12/08 31/12/09 31/12/10 31/12/11 31/12/12
31/12/08 31/12/09 31/12/10 31/12/11 31/12/12
Total Tangible Assets and Net Assets
(RM’million)
Profit Before Taxation and Profit Attributable
to Owners of the Company
(RM’million)
Basic Earnings Per Share 1 and Net Assets Per
Share 2
3,165.2
5,545.2
17.31
503.4579.3
2,302.4
4.09
314.0
2,789.4
5,354.0
17.82
504.4
2,586.2
4.59
323.1
2,464.2
4,928.0
5.53
172.8
193.8
2,335.1
4.14
100.2
3,628.4
6,790.418.85
635.0
455.2
3,293.41.51
375.6
3,958.9
6,622.7
19.58
677.1714.6
3,398.6
1.61
422.6
Notes:1 Basic earnings per share for the financial period ended 2008 and financial years ended 2009 to 2010, have been restated to reflect the
retrospective adjustments arising from the bonus issue and rights issue completed in the financial year ended 31.12.2011 in accordance to
“FRS 133, Earnings per Share”.2 Net assets per share were computed based on the number of shares in issue net of treasury shares (’000) as follows:-
Financial period ended 31.12.2008 : 563,528 shares
Financial year ended 31.12.2009 : 563,526 shares
Financial year ended 31.12.2010 : 563,524 shares
Financial year ended 31.12.2011 : 2,180,927 shares
Financial year ended 31.12.2012 : 2,113,108 shares
716.7
HAP SENG CONSOLIDATED BERHAD
Annual Report 201216
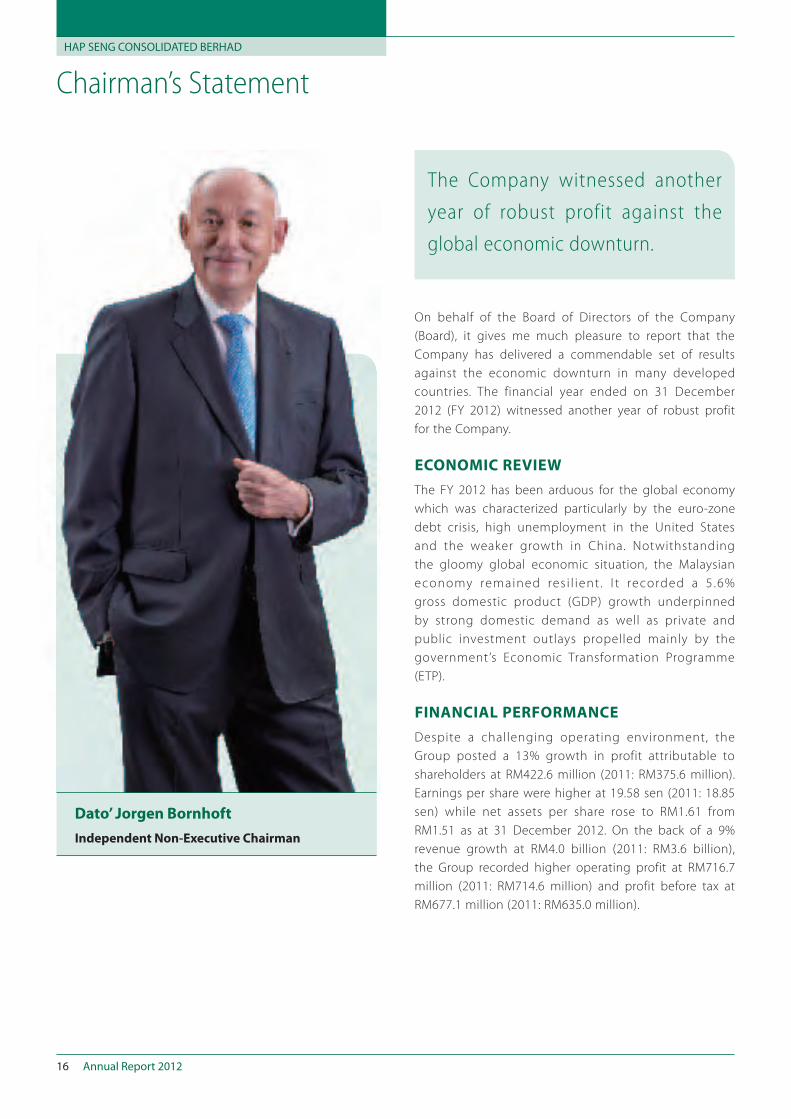
Chairman’s Statement
On behalf of the Board of Directors of the Company
(Board), it gives me much pleasure to report that the
Company has delivered a commendable set of results
against the economic downturn in many developed
countries. The financial year ended on 31 December
2012 (FY 2012) witnessed another year of robust profit
for the Company.
ECONOMIC REVIEW
The FY 2012 has been arduous for the global economy
which was characterized particularly by the euro-zone
debt crisis, high unemployment in the United States
and the weaker growth in China. Notwithstanding
the gloomy global economic situation, the Malaysian
economy remained res i l ient . I t recorded a 5 .6%
gross domestic product (GDP) growth underpinned
by strong domestic demand as well as private and
public investment outlays propelled mainly by the
government’s Economic Transformation Programme
(ETP).
FINANCIAL PERFORMANCE
Despite a challenging operating environment, the
Group posted a 13% growth in profit attributable to
shareholders at RM422.6 million (2011: RM375.6 million).
Earnings per share were higher at 19.58 sen (2011: 18.85
sen) while net assets per share rose to RM1.61 from
RM1.51 as at 31 December 2012. On the back of a 9%
revenue growth at RM4.0 billion (2011: RM3.6 billion),
the Group recorded higher operating profit at RM716.7
million (2011: RM714.6 million) and profit before tax at
RM677.1 million (2011: RM635.0 million).
Dato’ Jorgen Bornhoft
Independent Non-Executive Chairman
The Company witnessed another
year of robust profit against the
global economic downturn.
Annual Report 2012 17
Chairman’s Statement
OPERATIONS REVIEW
Plantations
The Plantations Division’s performance was adversely
impacted by both the substantially lower average crude
palm oil (CPO) price and the significant decline in the
fresh fruit bunch (FFB) production. Consequently, the
division recorded a 20% decline in revenue to RM526.5
million (2011: RM654.9 million) and a 44% decline in
operating profit to RM193.6 million (2011: RM342.9
million).
Property Holding & Development
The Property Holding & Development Division registered
a year of sterling performance with 89% growth in
revenue at RM645.0 million (2011: RM341.5 million) and
115% growth in operating profit at RM438.9 million
(2011: RM204.6 million).
Menara Hap Seng, our flagship investment property,
recorded an improved occupancy rate at 96% (2011:
94%) whilst Menara Citibank (approximately 50% held
by our Group) also recorded an improved occupancy
rate at 95% (2011: 90%). These two major investment
properties demonstrated a stable return consistent with
the industry’s average.
Credit Financing
On the back of a 12% growth in loan base to RM1.5
billion and a low gross non-performing loan ratio at
0.9%, the division registered a 15% growth in revenue at
RM111.3 million (2011: RM96.9 million) which translated
to a corresponding 15% growth in operating profit at
RM90.6 million (2011: RM79.0 million).
Automotive
Despite the highly competitive automobile trading
condition in Malaysia, the division registered a 16%
growth in revenue at RM550.1 million (2011: RM475.6
million) and garnered a 31% market share in Malaysia.
However, FY 2012 was an extremely difficult year for
the automotive business in Vietnam mainly due to
the increase in the vehicle registration taxes by the
Vietnamese government. In tandem with such market
trend, the Automotive Division in Vietnam suffered lower
revenue at RM212.6 million (2011: RM335.8 million).
Accordingly, the division posted an overall operating
loss of RM7.3 million in FY 2012 (2011: RM20.7 million
operating profit).
Fertilizers Trading
During the FY 2012, the Fertilizers Trading Division
registered a 12% growth in revenue at RM1.3 billion
(2011: RM1.2 billion), with 72% contributed by the
Malaysia market and the balance 28% contributed by the
Indonesia market (2011: 73% Malaysia; 27% Indonesia).
However, the operating profit was 64% lower at RM22.8
million (2011: RM62.4 million), impacted by adverse
trading conditions in Indonesia.
Quarry & Building Materials
The Quarry and Building Materials Division chartered
a 13% growth in revenue at RM618.5 million (2011:
RM549.1 million). However, the division suffered an
operating loss of RM3.7 million (2011: RM17.0 million
operating profit) due to the poor performance of the
trading segment within the division. A rationalization
exerc ise was subsequent ly under taken to focus
on improving product ion ef f ic ienc y and overa l l
management of the quarry and bricks operations.
ASSOCIATES
The Group’s share of profit from associates increased
significantly to RM54.4 million (2011: RM19.7 million),
primarily due to the improved contributions from both
Lam Soon ( Thailand) Public Company Limited and
Inverfin Sdn Bhd, the company which owns Menara
Citibank.
HAP SENG CONSOLIDATED BERHAD
Annual Report 201218
Chairman’s Statement
SIGNIFICANT EVENTS SUBSEQUENT TO
THE END OF FY 2012
On 8 March 2013, the Group completed the disposal
of its entire 25% equity in Lei Shing Hong (Singapore)
Pte Ltd for a cash consideration of SGD47,313,553
(approximately RM118 million) which gave rise to a gain
of approximately RM78.9 million to the Group.
As announced on 18 March 2013, the Group had on even
date entered into a conditional agreement to dispose
of its 51% equity in Hap Seng Star (Vietnam) Sdn Bhd
(HSSV) for a cash consideration of RM153 million and
to accept a put option to dispose of the remaining 49%
at the option price of RM147 million. The transactions
contemplated therein, if completed, are expected to give
rise to a gain of approximately RM209 million.
ENHANCING SHAREHOLDER VALUE
The Company is committed to creating long-term
sustainable growth and to return value to you as
our valued shareholders. As part of the Company’s
commitment to pay up to 50% of the Group’s profit
attributable to shareholders, the Company has declared
and paid two interim dividends for the FY 2012, with the
first interim dividend of 4.5 sen paid on 8 August 2012
and the second interim dividend of 6.0 sen paid on 29
March 2013. The total dividend of 10.5 sen, constitutes
approximately 53% of the Group’s profit for FY 2012,
compared favourably with the total dividend of 8.6 sen
payout in 2011.
To further enhance shareholder value, the Company
will be seeking your approval on renewing the share
buy-back mandate. This mandate, if obtained, will give
the Company the authority and flexibility to purchase
the Company’s shares, if and when the circumstances
justify, in the best interests of the Company.
LOOKING FORWARD
Malaysia’s economic outlook is expected to remain stable
in 2013 with continuing strong domestic consumption
and investments which are bolstered by improved
business environment and accommodating interest rates.
Having a wel l-diversi f ied range of core business
activities, the Group is focused on expanding the core
businesses as well as maximizing synergies among the
various businesses. In all its core businesses, the Group
will strive to address near-term challenges and to seize
opportunities to strengthen its platform for the future.
In addition, the Group will be actively pursuing the
development planning on various parcels of land
recently acquired, as part of its strategy to focus on
developments in the sought-after addresses in the Klang
Valley.
With the progression of the ETP, the Group is optimistic
of a better year for the Quarry and Building Materials
Division. The division is set to benefit from large
infrastructure projects which are the main drivers of
the ETP as well as the much touted multi-billion dollar
Iskandar Malaysia Project in Johor.
The Automotive Division in Malaysia will continue to
step up its efforts to achieve higher market penetration
through improving customer satisfaction as well as
investing into additional dealership outlets to increase its
presence in the Klang Valley.
Annual Report 2012 19
Chairman’s Statement
APPRECIATION
On behalf of the Board, I would l ike to take this
opportunity to express our sincere gratitude to all our
shareholders, business partners, suppliers and customers
for their unrelenting support and confidence. I also
put on record our appreciation for the dedication
and commitment of our staff members for enabling
the Company to witness another year of ster l ing
performance.
On 31 December 2012, both Datuk Henry Chin Poy-
Wu and Mr. Lau Teong Jin resigned from the Board as
independent directors after having served for more
than 9 years. I wish to thank them for their immense
contributions during their tenure of service.
In this challenging journey of scaling new heights, I
assure you of our unwavering focus and commitment to
improve the return to you as shareholders.
Jorgen Bornhoft
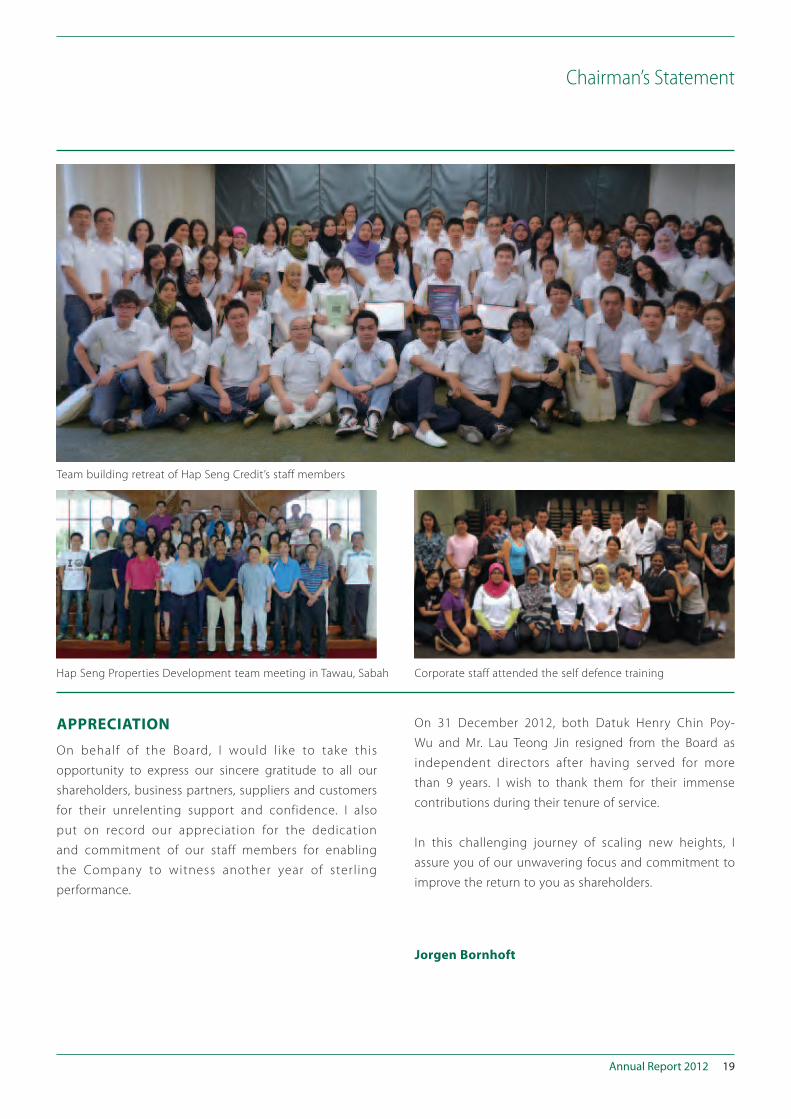
Hap Seng Properties Development team meeting in Tawau, Sabah Corporate staff attended the self defence training
Team building retreat of Hap Seng Credit’s staff members
HAP SENG CONSOLIDATED BERHAD
Annual Report 201220
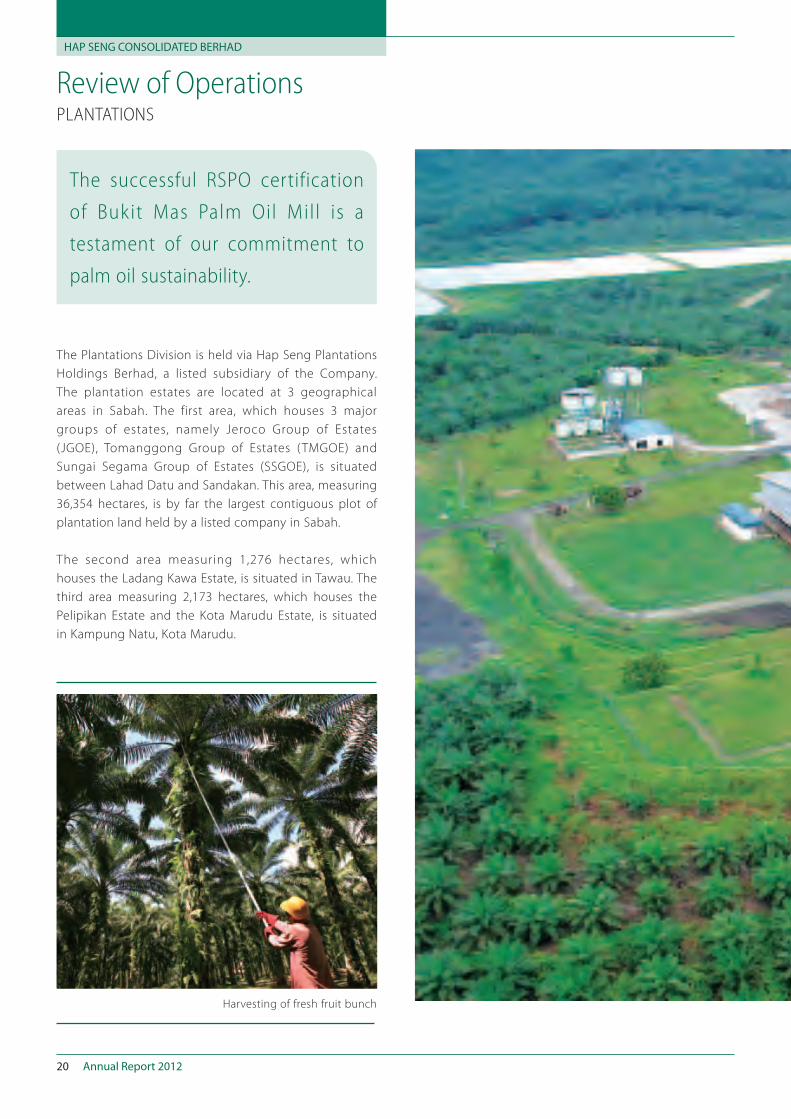
Review of Operations PLANTATIONS
The successful RSPO certification
of Bukit Mas Palm Oil Mill is a
testament of our commitment to
palm oil sustainability.
The Plantations Division is held via Hap Seng Plantations
Holdings Berhad, a listed subsidiary of the Company.
The plantation estates are located at 3 geographical
areas in Sabah. The first area, which houses 3 major
groups of estates, namely Jeroco Group of Estates
(JGOE), Tomanggong Group of Estates ( TMGOE) and
Sungai Segama Group of Estates (SSGOE), is situated
between Lahad Datu and Sandakan. This area, measuring
36,354 hectares, is by far the largest contiguous plot of
plantation land held by a listed company in Sabah.
The second area measuring 1,276 hectares, which
houses the Ladang Kawa Estate, is situated in Tawau. The
third area measuring 2,173 hectares, which houses the
Pelipikan Estate and the Kota Marudu Estate, is situated
in Kampung Natu, Kota Marudu.
Harvesting of fresh fruit bunch
Annual Report 2012 21
Review of Operations PLANTATIONS
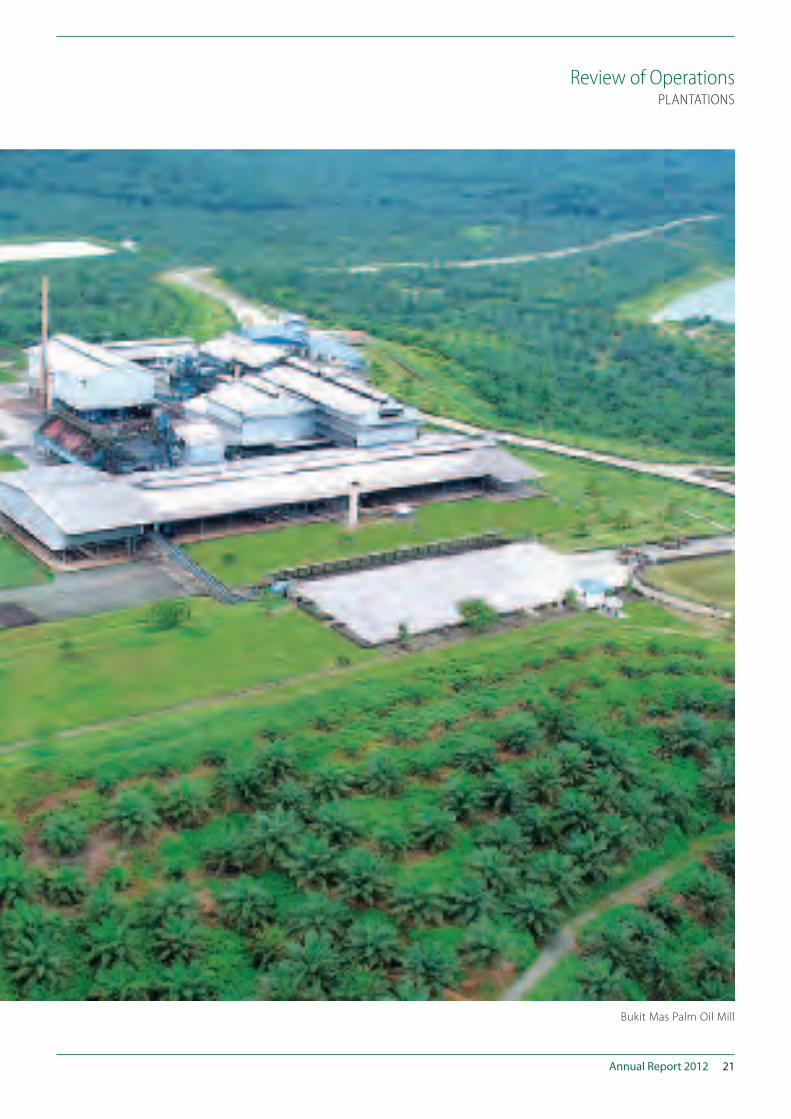
Bukit Mas Palm Oil Mill
HAP SENG CONSOLIDATED BERHAD
Annual Report 201222
Review of Operations PLANTATIONS
FY 2012 was indeed a challenging year for the palm
oil industry in Malaysia due to the much weaker CPO
prices and lower CPO production.
The world demand for CPO weakened considerably
in the face of prolonged euro-zone crisis and the
slowdown in the China’s economy as well as the
overall weaker vegetable oil prices. Coupled with the
higher crop production in the second half of the year,
the CPO inventory level in Malaysia hit a historical
high of 2.63 million tonnes at the end of FY 2012.
Accordingly, from its peak at RM3,600 per tonne in the
beginning of FY 2012, CPO prices plummeted to its
lowest at RM1,970 per tonne in early December before
finishing the year at an average of RM2,764 per tonne
(2011: RM3,219 per tonne).
The substantially depressed CPO prices had spurred the
Malaysian government to announce a staggered reduction
in CPO export taxes as well as a removal of duty-free CPO
export quota. In spite of this, any significant strengthening
of CPO prices was limited by softer world demand for CPO
and weaker vegetable oil prices as well as the lingering
concern over the build-up of CPO inventory. On the back
of such weak sentiments, the division achieved an average
CPO price realisation of RM2,773 per tonne (2011: RM3,226
per tonne) which compared favourably with the average
CPO price realisation of RM2,690 per tonne for Sabah.
Due to biological palm stress and heavy rainfall in the early
part of FY 2012, total fresh fruit bunches (FFB) production was
lower at 665,812 tonnes (2011: 738,969 tonnes) with yield at
21.86 tonnes per hectare (2011: 23.79 tonnes per hectare).
This has resulted in a lower CPO production at 154,595 tonnes
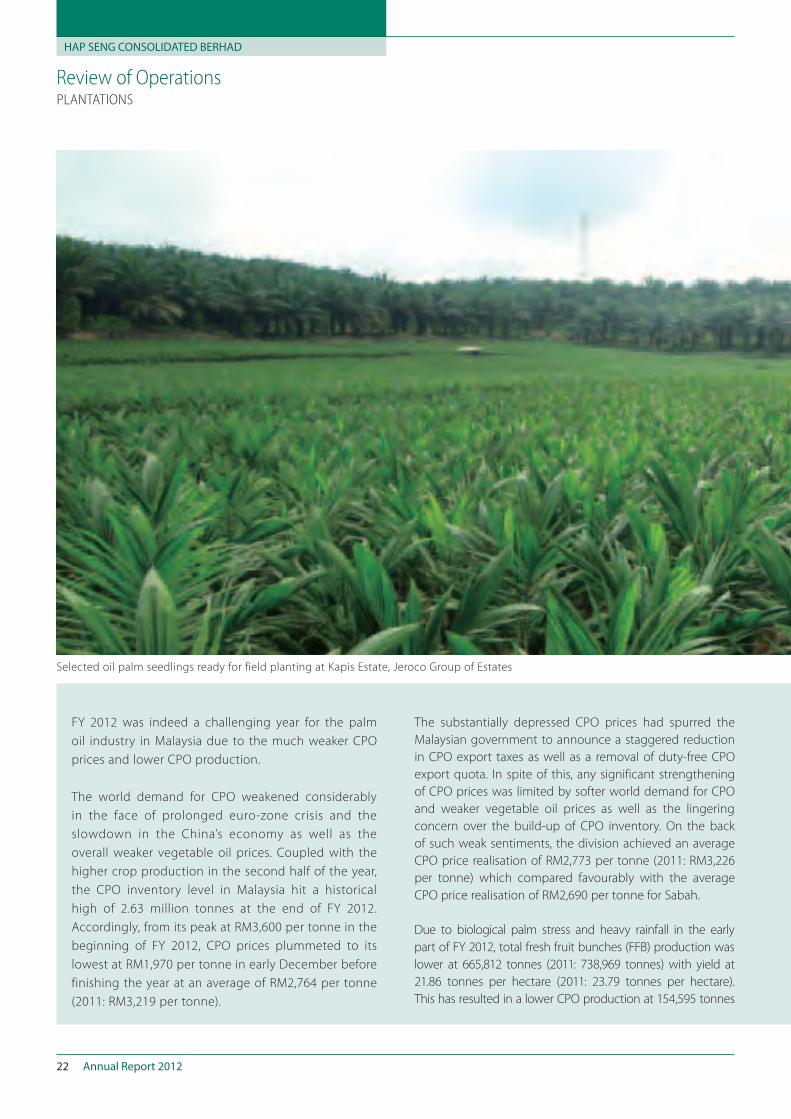
Selected oil palm seedlings ready for field planting at Kapis Estate, Jeroco Group of Estates
Annual Report 2012 23
Review of Operations PLANTATIONS
(2011: 168,025 tonnes) and lower palm kernel production at
34,587 tonnes (2011: 37,050 tonnes).
Against such adverse operating environment, the division
recorded a lower revenue at RM526.5 million (2011: RM654.9
million) and lower operating profit at RM193.6 million (2011:
RM342.9 million).
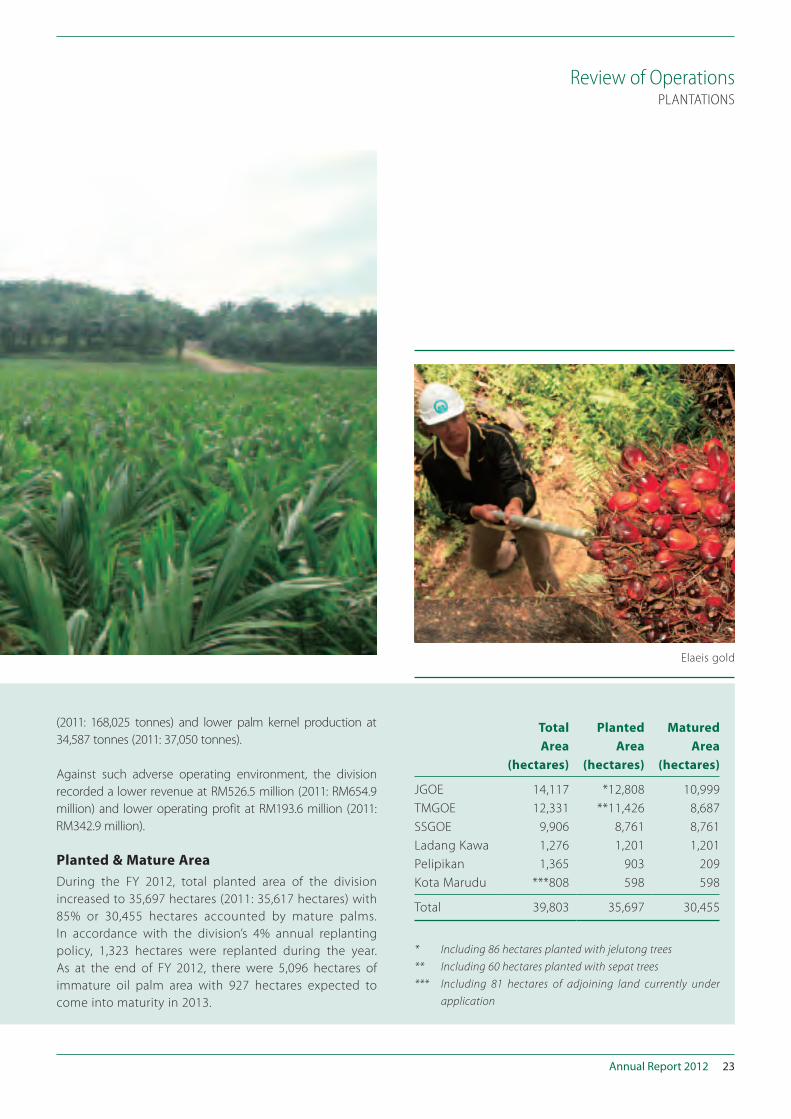
Planted & Mature Area
During the FY 2012, total planted area of the division
increased to 35,697 hectares (2011: 35,617 hectares) with
85% or 30,455 hectares accounted by mature palms.
In accordance with the division’s 4% annual replanting
policy, 1,323 hectares were replanted during the year.
As at the end of FY 2012, there were 5,096 hectares of
immature oil palm area with 927 hectares expected to
come into maturity in 2013.
Total
Area
Planted
Area
Matured
Area
(hectares) (hectares) (hectares)
JGOE 14,117 *12,808 10,999
TMGOE 12,331 **11,426 8,687
SSGOE 9,906 8,761 8,761
Ladang Kawa 1,276 1,201 1,201
Pelipikan 1,365 903 209
Kota Marudu ***808 598 598
Total 39,803 35,697 30,455
* Including 86 hectares planted with jelutong trees
** Including 60 hectares planted with sepat trees
*** Including 81 hectares of adjoining land currently under
application
Elaeis gold
HAP SENG CONSOLIDATED BERHAD
Annual Report 201224
Review of Operations
Oil Extraction Rate & Milling
The average oil extraction rate (OER) during FY 2012
improved marginally to 21.29% (2011: 20.96%) due to
better weather. Oil per mature hectare was lower at
4.65 tonnes (2011: 4.99 tonnes) due to lower FFB yield
which however compared favourably with the average
oil per mature hectare of 4.29 tonnes for Sabah.
Milling operations are carried out at the division’s 4
mills with a total milling capacity of 175 FFB tonnes
per hour. However, the average utilisation of such
milling capacity was lower at 68% in FY 2012 (2011:
75%) due to the lower FFB processed.
Milling capacity of the 4 mills:–
FFB tonnes per hour
Jeroco Palm Oil Mill 1 60
Jeroco Palm Oil Mill 2 30
Tomanggong Palm Oil Mill 40
Bukit Mas Palm Oil Mill 45
175
Roundtable on Sustainable Palm Oil (RSPO) Certification
The division embraces good agricultural practices
for sustainability and is a member of the RSPO that
promotes the growth and use of sustainable oil palm
products through credible global standards and
engagement of stakeholders.
PLANTATIONS
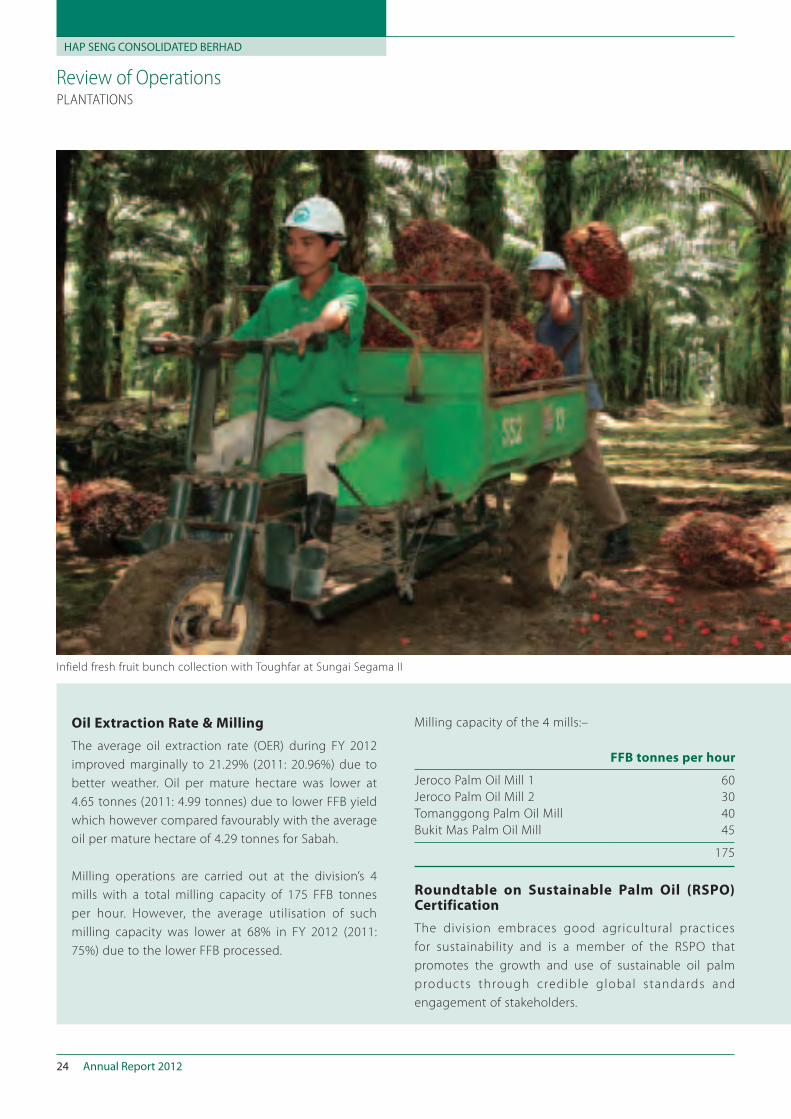
Infield fresh fruit bunch collection with Toughfar at Sungai Segama II
Annual Report 2012 25
Review of Operations
The division has made signif icant progress in its
initiatives towards the production of sustainable palm
oil. This has culminated in our Bukit Mas Palm Oil Mill
achieving the RSPO certification in May 2012, with which
both the Sungai Segama Group of Estates and Bukit
Mas Palm Oil Mill are now internationally accredited as
sustainable palm oil producers in compliance with global
standards of production. The division has also embarked
on similar certification exercise for the other 3 oil mills.
Outlook
The record high stockpile of 2.63 million tonnes in
FY 2012 has come off slightly with exports to-date
exceeding production output. With the expectation of
lower FFB output evident in recent weeks, the overall
inventory level is anticipated to be on the decline.
This trend may be further supported by the various
biodiesel initiatives undertaken by the government.
However, any significant strengthening of the CPO
price may be limited as the CPO stockpile remains
high despite the easing off, and such recovery
may also be weighed down by the overall weaker
vegetable oil price.
Accordingly, it is envisaged that year 2013 is likely
to be a challenging year and the division would
continue its relentless efforts to maximize operational
efficiencies to mitigate the impact of such challenges.
PLANTATIONS
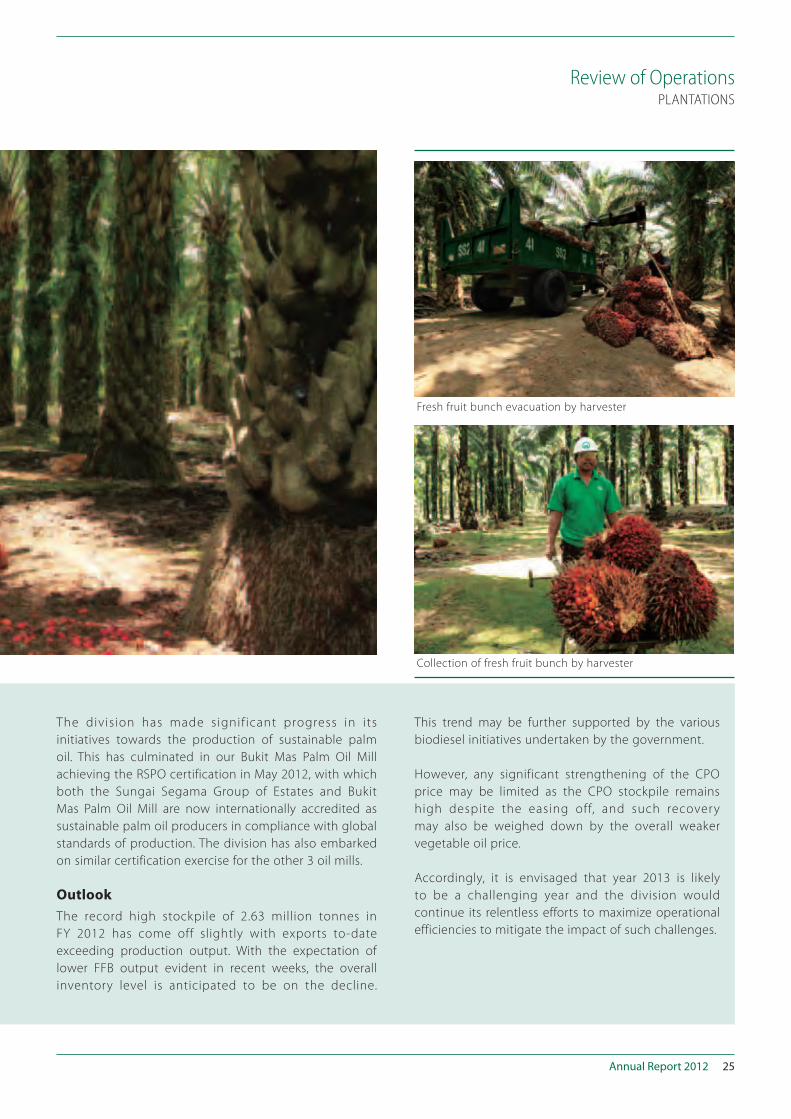
Fresh fruit bunch evacuation by harvester
Collection of fresh fruit bunch by harvester
HAP SENG CONSOLIDATED BERHAD
Annual Report 201226
Review of Operations PROPERTY HOLDING & DEVELOPMENT
Annual Report 2012 27
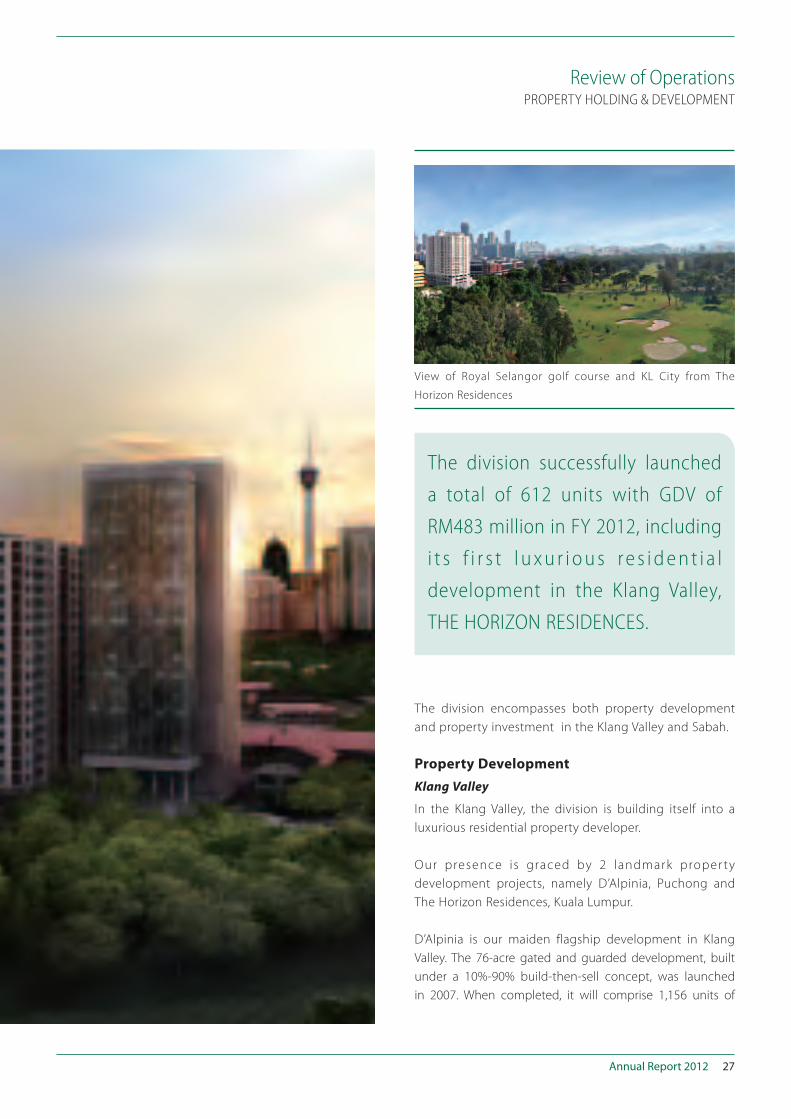
Review of Operations
View of Royal Selangor golf course and KL City from The
Horizon Residences
PROPERTY HOLDING & DEVELOPMENT
The division encompasses both property development
and property investment in the Klang Valley and Sabah.
Property Development
Klang Valley
In the Klang Valley, the division is building itself into a
luxurious residential property developer.
Our presence is graced by 2 landmark proper ty
development projects, namely D’Alpinia, Puchong and
The Horizon Residences, Kuala Lumpur.
D’Alpinia is our maiden flagship development in Klang
Valley. The 76-acre gated and guarded development, built
under a 10%-90% build-then-sell concept, was launched
in 2007. When completed, it will comprise 1,156 units of
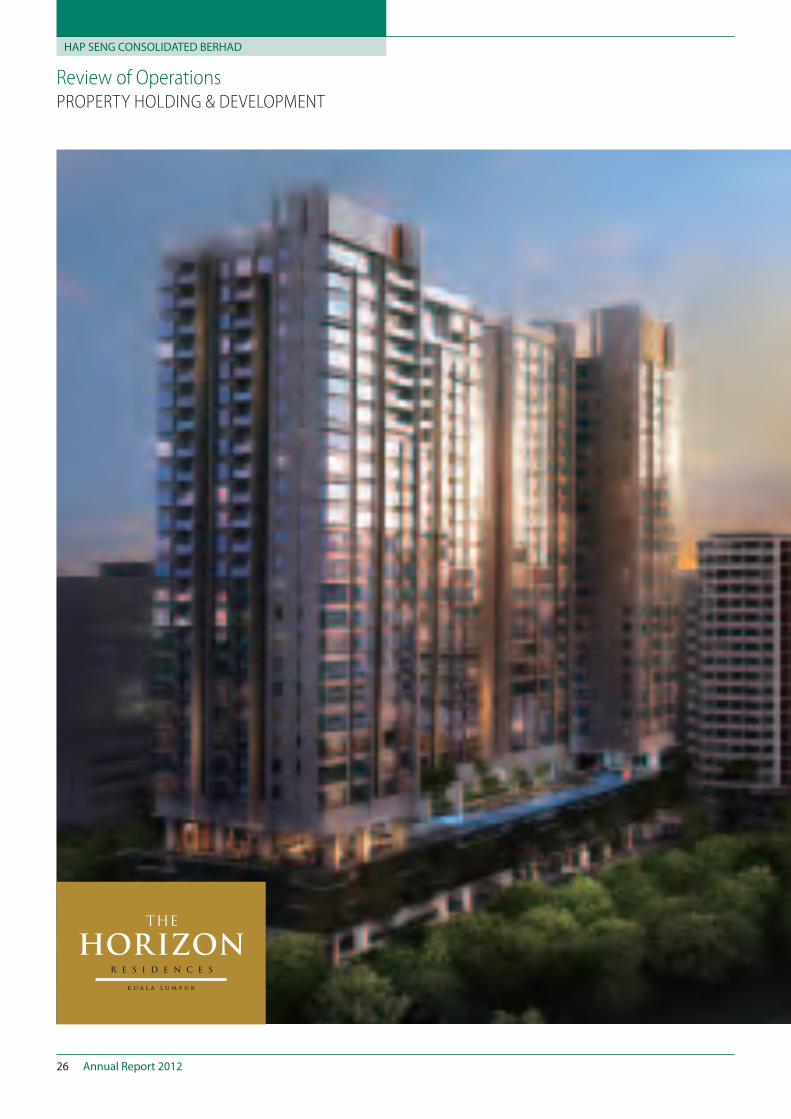
The division successfully launched
a total of 612 units with GDV of
RM483 million in FY 2012, including
i t s f i r s t l u x u r i o u s r e s i d e n t i a l
development in the Klang Valley,
THE HORIZON RESIDENCES.
HAP SENG CONSOLIDATED BERHAD
Annual Report 201228
Review of Operations
landed and high-rise residential and shop office. To
date, 538 units of landed properties with GDV of RM383
million has been completed including the Urbana
comprising 64 units of bungalow and link-bungalow
with GDV of RM120 million which was completed in
FY 2012. Projects under planning in D’Alpinia include
the Andana Condominium and Villa, consisting of 116
condominium units and 30 villas; and Phase 1 of Business
Park D’Alpinia, consisting of 34 units of shop offices.
The Horizon Residences marked the division’s first
foray into the luxurious condominium market in the
Klang Valley. The Horizon Residences, strategically
located a long Ja lan Tun R azak border ing the
prestigious Royal Selangor Golf Club, features 2
blocks of 26-storey serviced residence with 335 well
appointed residential units boasting unparallel view of
the KL city skyline and the lush greens of the golf course.
With a total GDV of RM380 million, the development is
targeted to be completed in early 2015. During FY 2012,
The Horizon Residences registered excellent take up-rate
among local and overseas buyers.
Sabah
In Sabah, the division is a leading integrated township
developer with many successful developments in Kota
Kinabalu, Tawau, Sandakan and Lahad Datu.
The developments in Kota Kinabalu include Plaza
Kingfisher, Kingfisher Park and Kingfisher Sulaman.
Plaza Kingfisher comprises commercial development of
148 units of shop and shop-office with a GDV of RM83
million. Kingfisher Park is a residential development
PROPERTY HOLDING & DEVELOPMENT
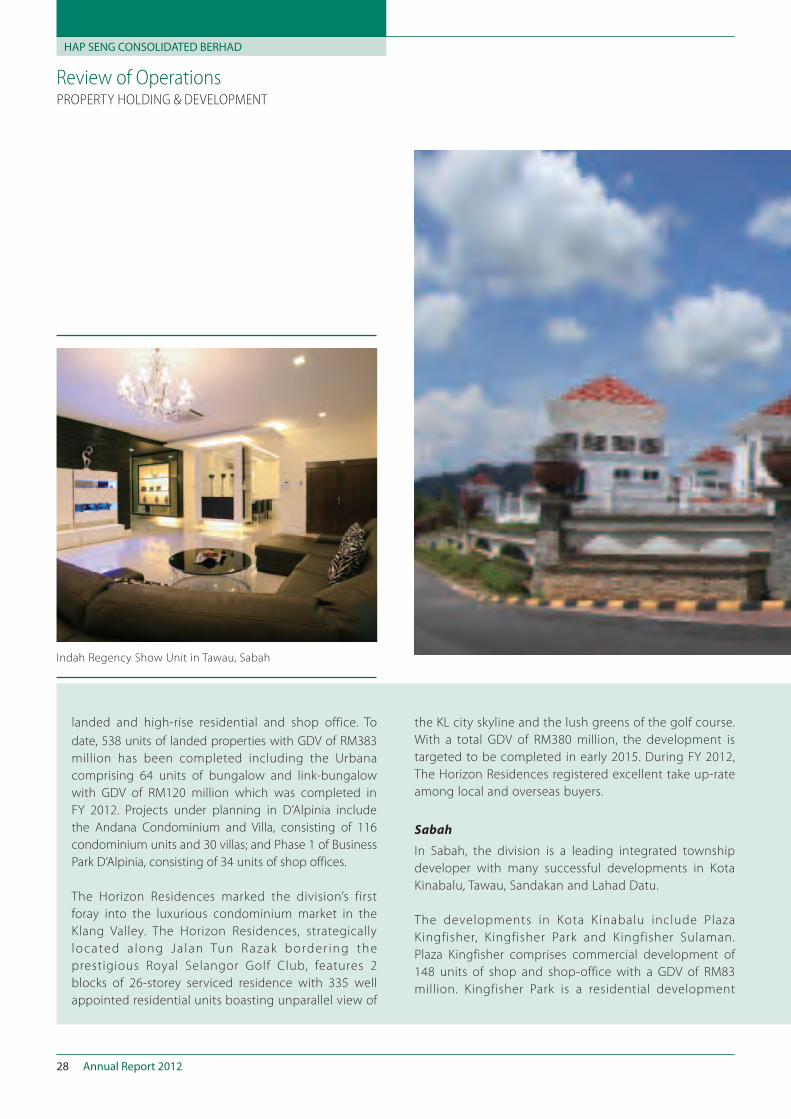
Indah Regency Show Unit in Tawau, Sabah
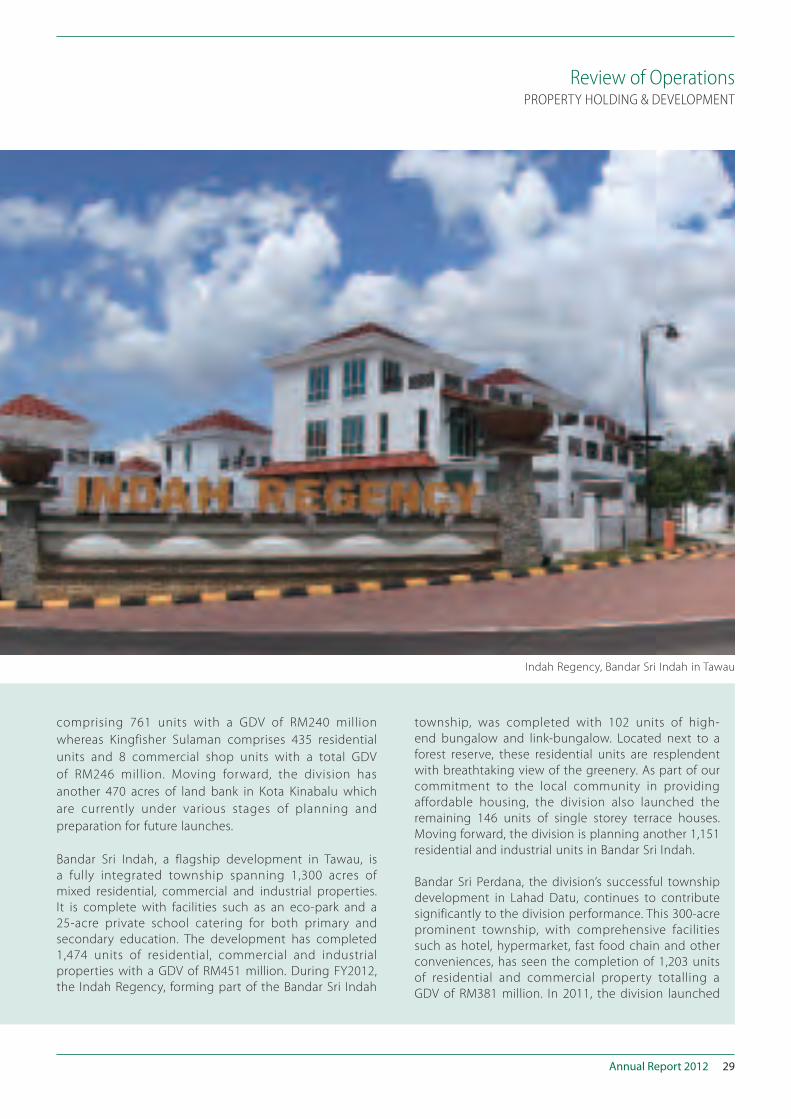
Annual Report 2012 29
Review of Operations
comprising 761 units with a GDV of RM240 million
whereas Kingfisher Sulaman comprises 435 residential
units and 8 commercial shop units with a total GDV
of RM246 million. Moving forward, the division has
another 470 acres of land bank in Kota Kinabalu which
are currently under various stages of planning and
preparation for future launches.
Bandar Sri Indah, a flagship development in Tawau, is
a fully integrated township spanning 1,300 acres of
mixed residential, commercial and industrial properties.
It is complete with facilities such as an eco-park and a
25-acre private school catering for both primary and
secondary education. The development has completed
1,474 units of residential, commercial and industrial
properties with a GDV of RM451 million. During FY2012,
the Indah Regency, forming part of the Bandar Sri Indah
township, was completed with 102 units of high-
end bungalow and link-bungalow. Located next to a
forest reserve, these residential units are resplendent
with breathtaking view of the greenery. As part of our
commitment to the local community in providing
affordable housing, the division also launched the
remaining 146 units of single storey terrace houses.
Moving forward, the division is planning another 1,151
residential and industrial units in Bandar Sri Indah.
Bandar Sri Perdana, the division’s successful township
development in Lahad Datu, continues to contribute
significantly to the division performance. This 300-acre
prominent township, with comprehensive facilities
such as hotel, hypermarket, fast food chain and other
conveniences, has seen the completion of 1,203 units
of residential and commercial property totalling a
GDV of RM381 million. In 2011, the division launched
PROPERTY HOLDING & DEVELOPMENT
Indah Regency, Bandar Sri Indah in Tawau
HAP SENG CONSOLIDATED BERHAD
Annual Report 201230
Review of Operations
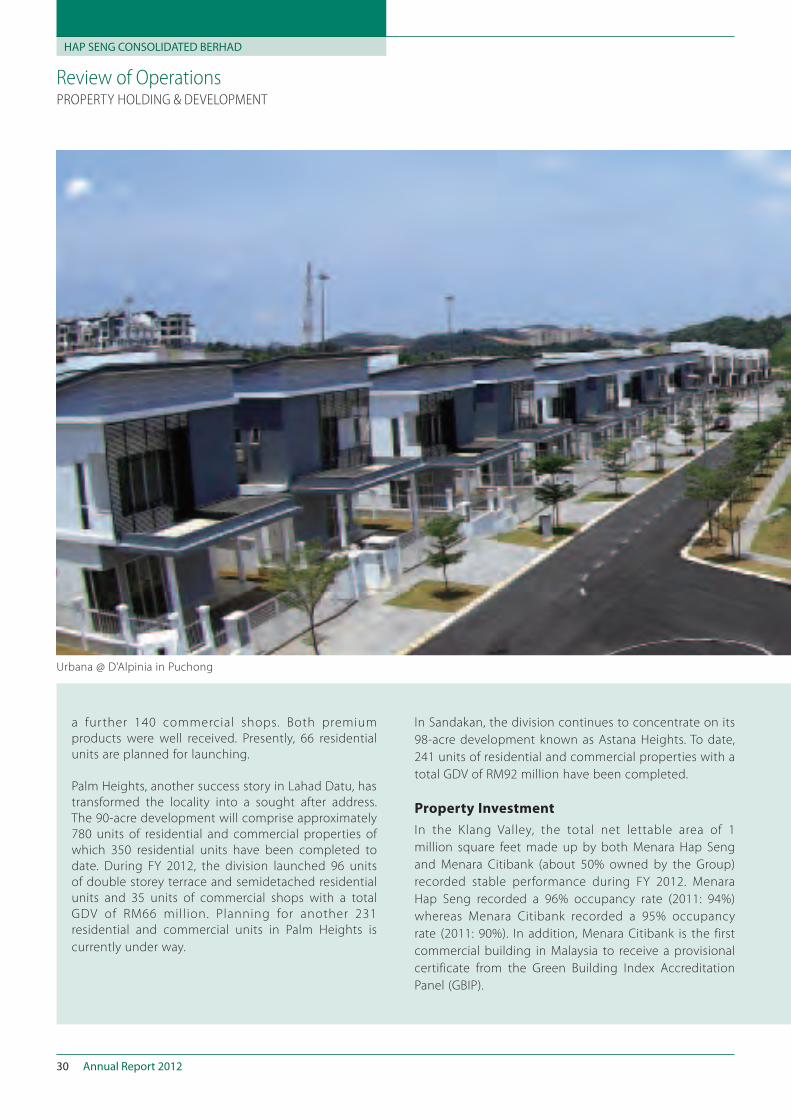
a further 140 commercial shops. Both premium
products were well received. Presently, 66 residential
units are planned for launching.
Palm Heights, another success story in Lahad Datu, has
transformed the locality into a sought after address.
The 90-acre development will comprise approximately
780 units of residential and commercial properties of
which 350 residential units have been completed to
date. During FY 2012, the division launched 96 units
of double storey terrace and semidetached residential
units and 35 units of commercial shops with a total
GDV of RM66 million. Planning for another 231
residential and commercial units in Palm Heights is
currently under way.
In Sandakan, the division continues to concentrate on its
98-acre development known as Astana Heights. To date,
241 units of residential and commercial properties with a
total GDV of RM92 million have been completed.
Property Investment
In the Klang Valley, the total net lettable area of 1
million square feet made up by both Menara Hap Seng
and Menara Citibank (about 50% owned by the Group)
recorded stable performance during FY 2012. Menara
Hap Seng recorded a 96% occupancy rate (2011: 94%)
whereas Menara Citibank recorded a 95% occupancy
rate (2011: 90%). In addition, Menara Citibank is the first
commercial building in Malaysia to receive a provisional
certificate from the Green Building Index Accreditation
Panel (GBIP).
PROPERTY HOLDING & DEVELOPMENT
Urbana @ D’Alpinia in Puchong
Annual Report 2012 31
Review of Operations
The division also undertook a rationalisation exercise
to position itself into prime locations within the Klang
Val ley. Accordingly, the divis ion divested several
properties not within the strategic locations at a total net
gain of RM256 million, the sale proceeds of which are to
be utilised to pursue acquisition opportunities within
the prime areas of the Klang Valley.
To cement our presence in the Kuala Lumpur central
business district (CBD), the division has commenced
the construction of its second flagship commercial
building, Menara Hap Seng 2. It is a 30-storey Grade A
green building index-compliant office tower which upon
completion, will elevate the division’s image besides
positively changing the landscape and skyline of the
CBD.
Division Performance
The division recorded a 89% revenue growth to
RM645.0 million (2011: RM341.5 million) and 115%
operating profit growth to RM438.9 million (2011:
RM204.6 million).
The property market in Malaysia is likely to remain
buoyant in 2013, particularly for strategically-located
properties. With the active progression of our Menara
Hap Seng 2 and the re-positioning of our property
developments in prime locations of the Klang Valley,
we believe the division is well-placed to benefit from
such upward trend.
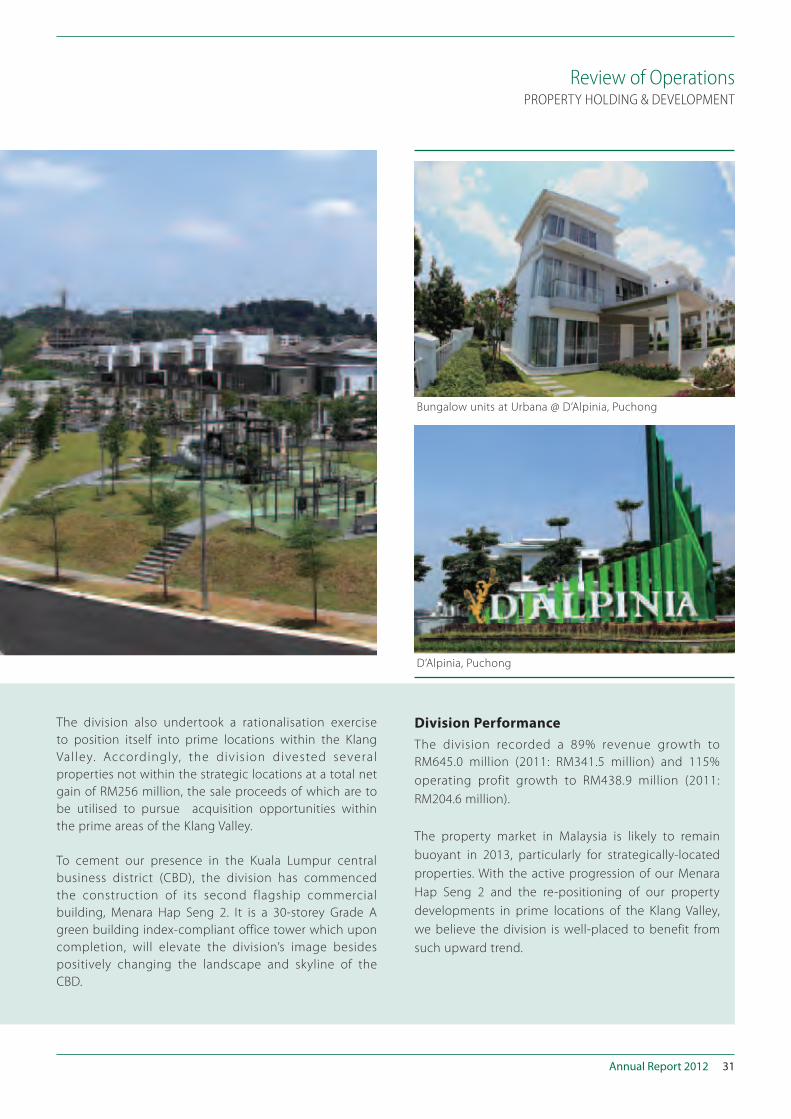
PROPERTY HOLDING & DEVELOPMENT
Bungalow units at Urbana @ D’Alpinia, Puchong
D’Alpinia, Puchong
HAP SENG CONSOLIDATED BERHAD
Annual Report 201232
Review of Operations CREDIT FINANCING
The credit financing business is principally involved in
the provision of industrial hire-purchase, leasing and
term loans mainly for small and medium enterprises
(SME) and is one of the top three lenders in the non-
bank sector in Malaysia.
The division recorded a 15% growth in gross operating
revenue at RM111.3 million for FY2012 (2011: RM96.9
million). This was achieved on the back of a 12% loan
growth to RM1.5 billion (2011: RM1.4 billion) which
exceeded the banking industry system loan growth of 10%.
Credit Financing Division achieved
15% growth in gross operating
revenue and 12% growth in loan
base.
Annual Report 2012 33
Review of Operations CREDIT FINANCING
Hap Seng Credit office in Miri, Sarawak
HAP SENG CONSOLIDATED BERHAD
Annual Report 201234
Review of Operations CREDIT FINANCING
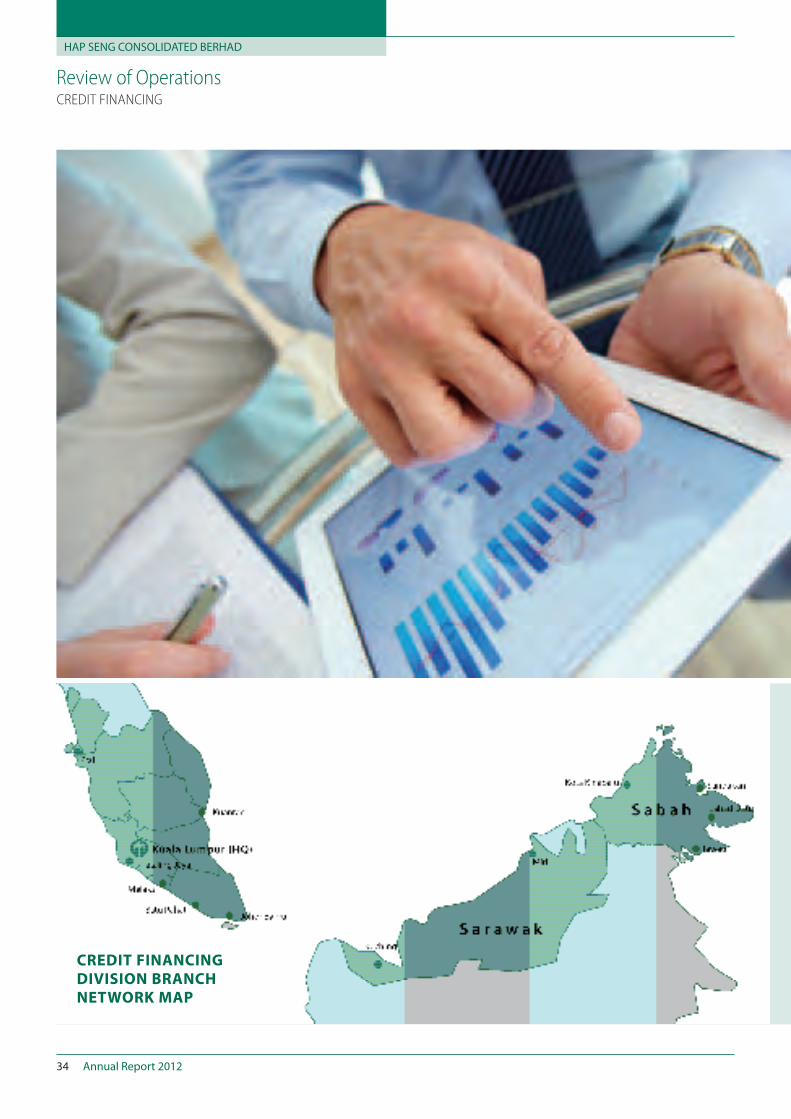
CREDIT FINANCING
DIVISION BRANCH
NETWORK MAP
Annual Report 2012 35
Review of Operations CREDIT FINANCING
Over the years, the division has built up a diversified
portfolio which includes manufacturing, business
services, landed property and agriculture. To date, the
division has approximately 10,000 active accounts.
Quality of loans has improved with gross non-performing
loan (NPL) ratio of 0.9% (2011: 1.1%) which compared
favourably with the industry average of 2.0%, a testament
to the robust and resilient loan sector the division has
identified and will continue to pursue in its growth
strategy.
The better turnover and lower NPL ratio have resulted
in an improved operating profit at RM90.6 million in FY
2012 (2011: RM79.0 million).
The Group strives to steer the division to greater heights
and profitability. In addition to its continuing efforts
to further position itself as the leading credit financier
for the SME sector, the division seeks to increase its
presence in the short or medium term loan sector for
non-residential properties to improve its overall yield.
With sustained domestic demand supported by the
various Government-initiated economic programmes,
the Malaysian economy is projected to grow between 5%
– 6% in 2013. These programmes will provide impetus
to the growth of the infrastructure and SME sectors,
which would translate into increased business lending
activities. The manufacturing industry is also expected to
benefit from the recovery of exports to global markets
which appeared to have stabilized since the third
quarter of 2012. These would further enhanced lending
opportunities for the credit financing business.
The division operates a network of 12 branches
with 6 in Peninsular Malaysia, 4 in Sabah and 2 in
Sarawak.
Our primary focus is on SMEs requiring working capital
and equipment financing. The SME sector forms the
bedrock of private sector activities, contributing up
to 32% of the Malaysia’s GDP and employs 56% of the
country’s workforce.
HAP SENG CONSOLIDATED BERHAD
Annual Report 201236
Review of Operations AUTOMOTIVE
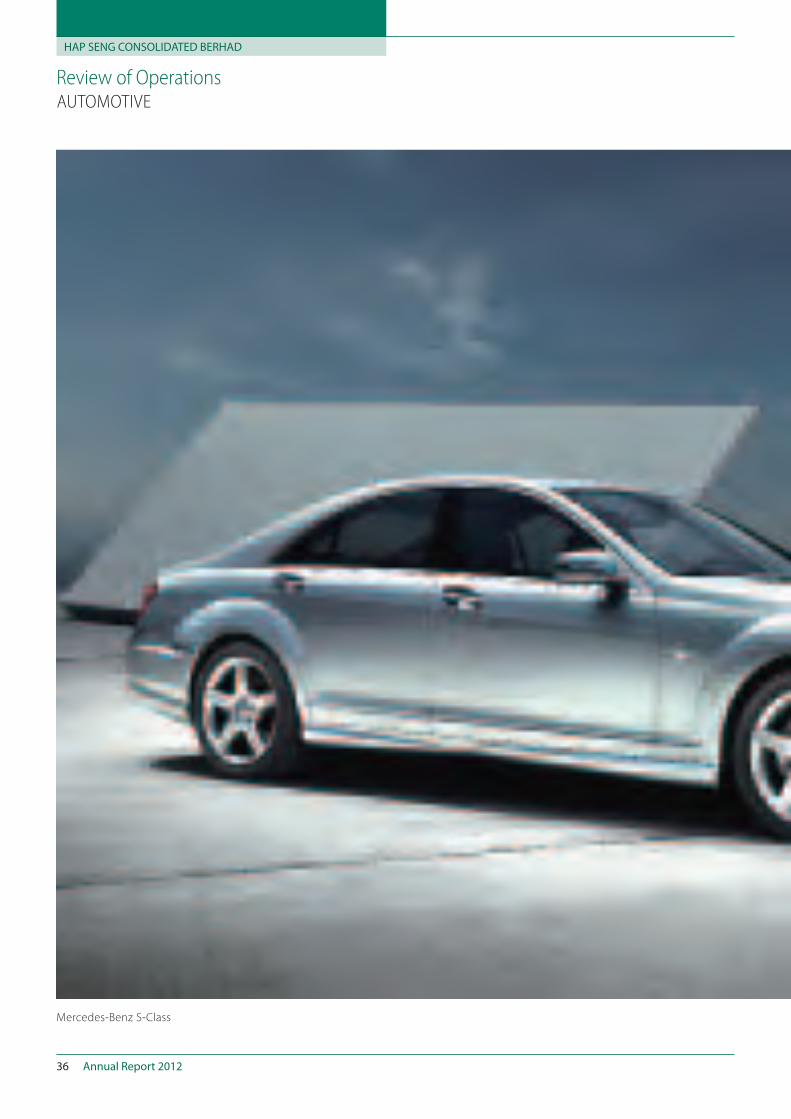
Mercedes-Benz S-Class
Annual Report 2012 37
Review of Operations AUTOMOTIVE
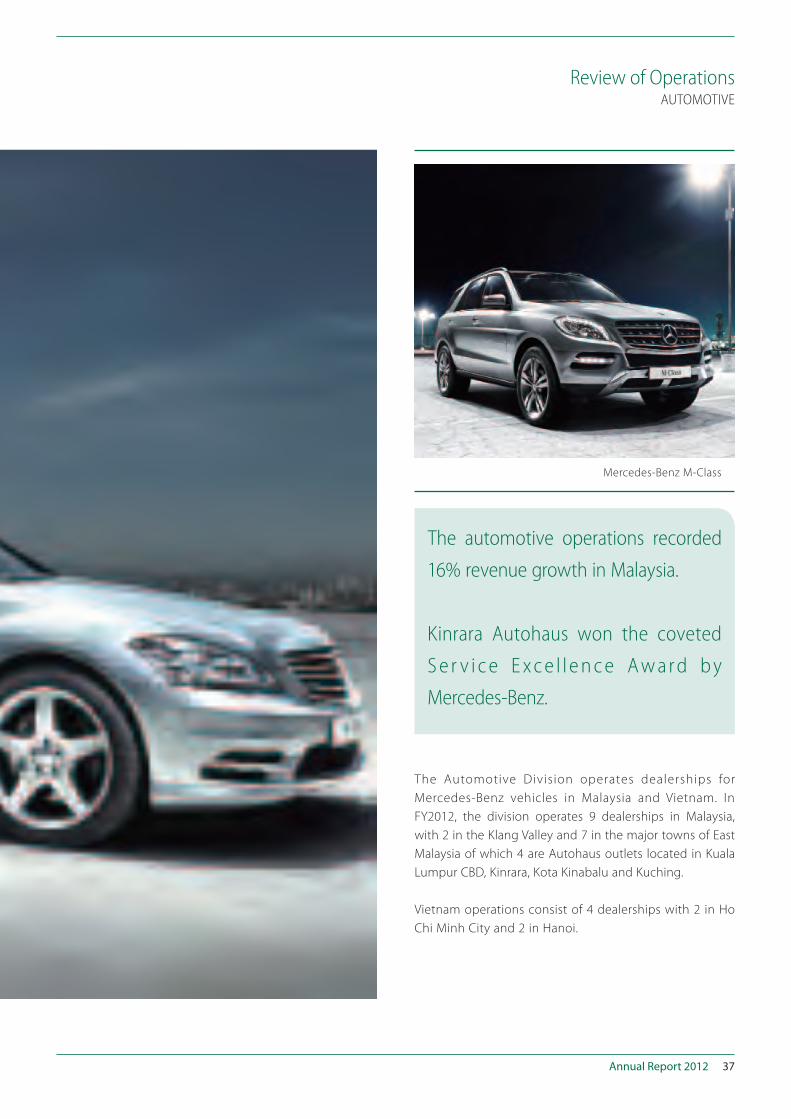
The automotive operations recorded
16% revenue growth in Malaysia.
Kinrara Autohaus won the coveted
S e r v i c e E x c e l l e n c e A w a r d b y
Mercedes-Benz.
The Automotive Division operates dealerships for
Mercedes-Benz vehicles in Malaysia and Vietnam. In
FY2012, the division operates 9 dealerships in Malaysia,
with 2 in the Klang Valley and 7 in the major towns of East
Malaysia of which 4 are Autohaus outlets located in Kuala
Lumpur CBD, Kinrara, Kota Kinabalu and Kuching.
Vietnam operations consist of 4 dealerships with 2 in Ho
Chi Minh City and 2 in Hanoi.
Mercedes-Benz M-Class
HAP SENG CONSOLIDATED BERHAD
Annual Report 201238
Review of Operations
Operations in Malaysia
Despite the highly competitive trading condition,
our operations in Malaysia recorded a 16% growth
in revenue at RM550.1 mil l ion (2011: RM475.6
million). Such robust trend was supported by the
53% growth in the number of Mercedes-Benz
vehicles registered by the division at 1,806 units
(2011: 1,176 units), with which the division garnered
a 31% market share in Malaysia.
FY 2012 also saw the launches of 6 new Mercedes-
Benz models into the Malaysian market, namely the
B-Class, C-Class Coupe, CLS, SLK, SL and M-Class
models.
The division continues to commit and focus on providing
excellent after-sales service to our customers. We have
expanded our Kinrara Autohaus after-sales facilities in
FY 2012. The expanded Autohaus now prides itself
with 76 service bays including a full body and paint
department which is ISO 9001 & 14001 certified. With
the expansion of Kinrara after-sales facilities, the division
now operates one of the largest Mercedes-Benz service
centres in the South East Asia region. In FY 2012, the
status of Kinrara Autohaus has been upgraded to sell
new Mercedes-Benz cars in addition to the pre-owned
cars under the Mercedes-Benz “Proven Exclusivity ”
program. It is worth noting that our Kinrara Autohaus
serves as the only service centre nationwide fitted to
service Maybach.
AUTOMOTIVE
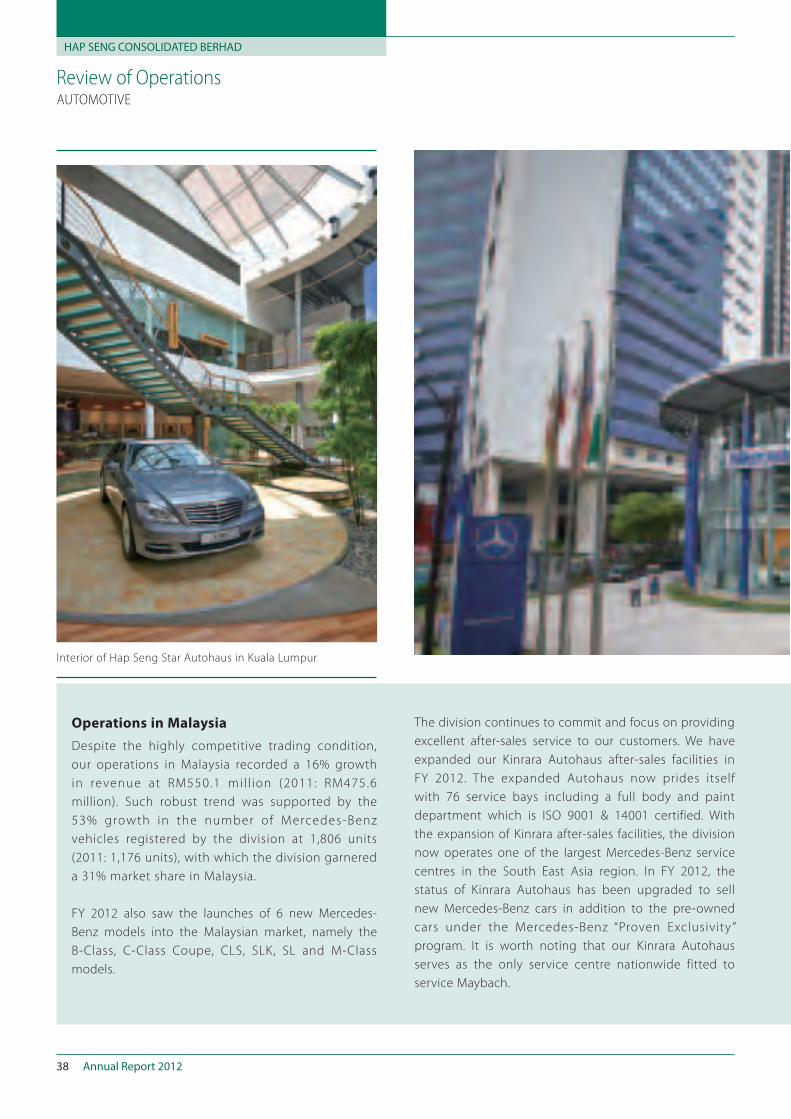
Interior of Hap Seng Star Autohaus in Kuala Lumpur
Annual Report 2012 39
Review of Operations
As a testament to its excellent service, the division won the
coveted Service Excellence Award (SEAward) by Mercedes-
Benz for 2012.
These outstanding achievements have enabled us to
secure additional Mercedes-Benz dealerships in the Klang
Valley. We have launched two new outlets in Balakong
and Segambut in the first half of 2013. This augurs well for
the division premised on the 12% volume growth charted
by the luxury car segment against the 4% industry volume
growth in Malaysia for FY 2012.
The division continues to invest in human capital
development through training programmes by
Mercedes-Benz Malaysia specifically designed to refine
and enhance the skills of our employees. Such efforts
have yielded exemplary results evidenced by the
division emerging as champions in both the Certified
Diagnosis Technician and Certified System Technician
categories of the 2012 Mercedes-Benz Malaysia Skill
Competition.
The division will continue to nurture new talents
to meet future challenges and strive to create new
heights in service benchmark in Malaysia.
AUTOMOTIVE
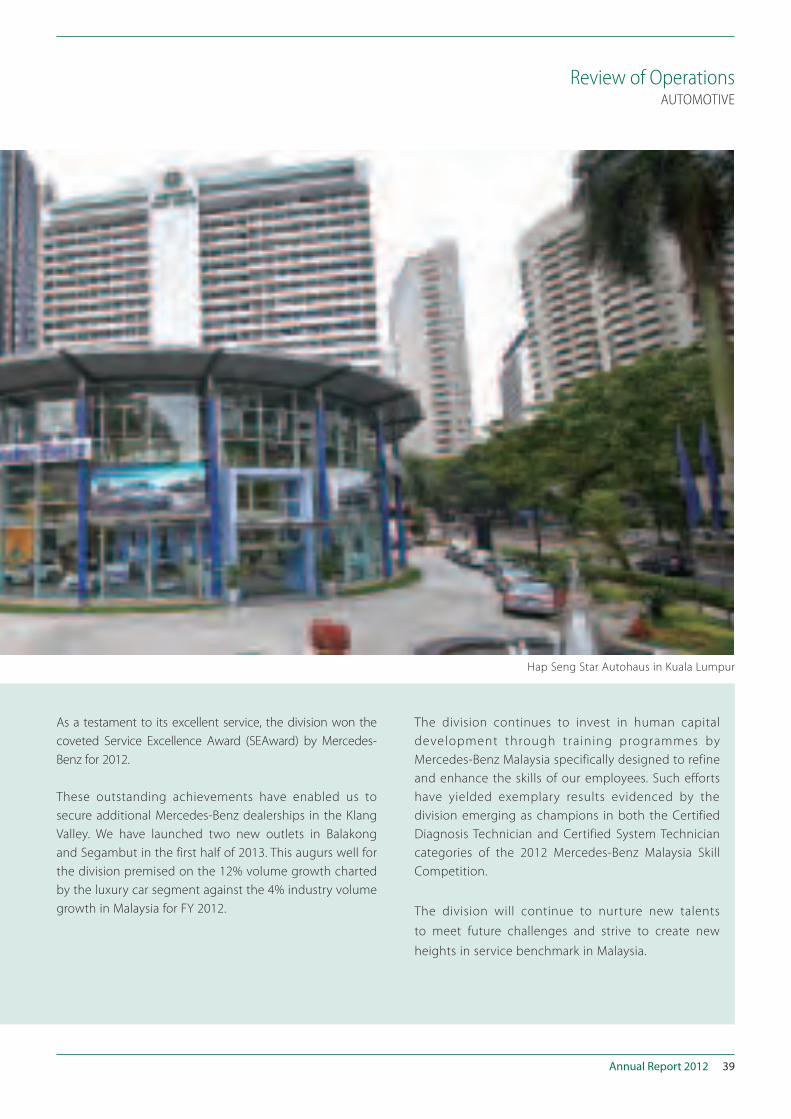
Hap Seng Star Autohaus in Kuala Lumpur
HAP SENG CONSOLIDATED BERHAD
Annual Report 201240
Review of Operations
Operations in Vietnam
The year under review was particularly difficult for the
automotive business in Vietnam with the introduction
of increased government fees and registration
taxes on car ownership. The challenging economic
conditions in Vietnam in 2012 further aggravated the
difficult automotive business. Against this backdrop,
the Automotive Division in Vietnam suffered lower
revenue at RM212.6 million (2011: RM335.8 million)
and lower vehicle sales of 552 units (2011: 1,168 units).
Division Performance
In FY 2012, the division recorded a total revenue of
RM762.7 million (2011: RM811.4 million) and operating
loss of RM7.3 million (2011: Operating Profit of RM20.7
million). Total vehicle volume sold for the division was
3,100 units (2011: 3,281 unit). The operating loss was
primarily attributable to the difficult trading conditions
in Vietnam.
AUTOMOTIVE
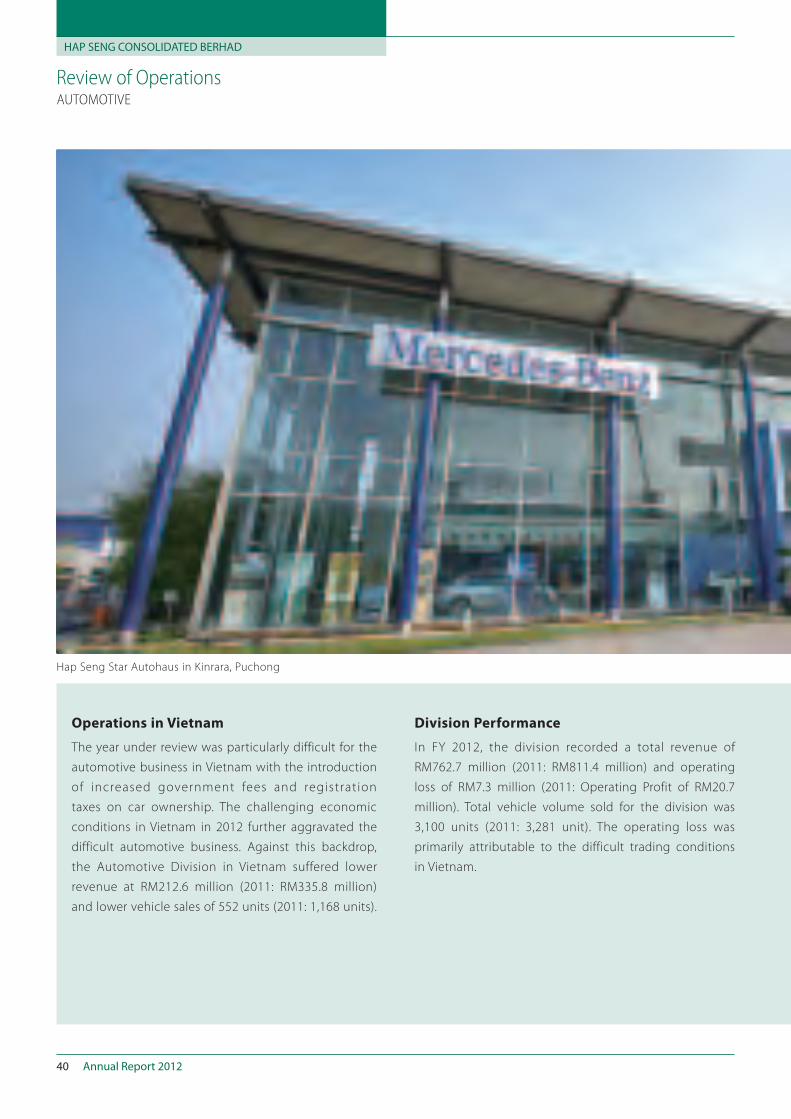
Hap Seng Star Autohaus in Kinrara, Puchong
Annual Report 2012 41
Review of Operations
Moving Forward
2013 will be another exciting year for our Automotive
business in Malaysia with the expected launch of 2
additional entry models, the A-Class and CLA-Class.
In addition, the highly acclaimed new facelift E-Class
scheduled to be launched in 2013 is bound to excite
the Malaysian automobile market.
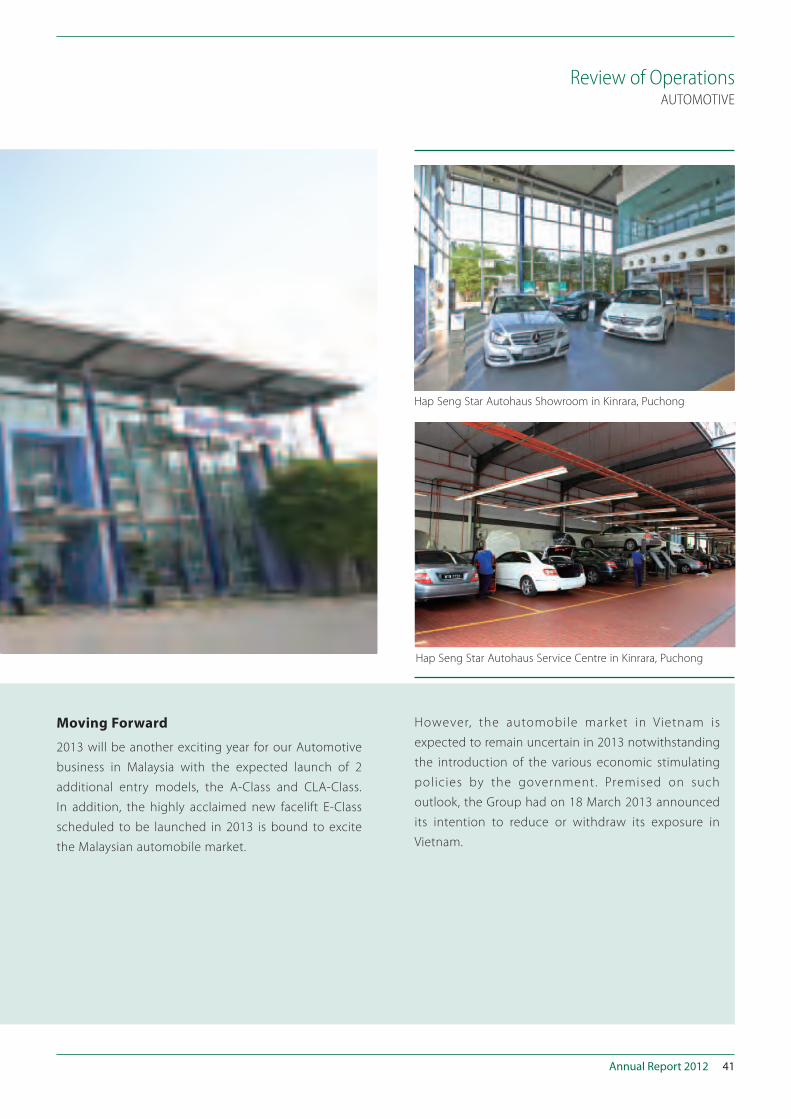
AUTOMOTIVE
Hap Seng Star Autohaus Service Centre in Kinrara, Puchong
Hap Seng Star Autohaus Showroom in Kinrara, Puchong
However, the automobile market in Vietnam is
expected to remain uncertain in 2013 notwithstanding
the introduction of the various economic stimulating
policies by the government. Premised on such
outlook, the Group had on 18 March 2013 announced
its intention to reduce or withdraw its exposure in
Vietnam.
HAP SENG CONSOLIDATED BERHAD
Annual Report 201242
Review of Operations FERTILIZERS TRADING
The Fertilizers Trading Division, operating through
Hap Seng Fertilizers Sdn Bhd in Malaysia and PT Sasco
indonesia in Indonesia, is one of the leading fertilizers
distributors in Malaysia and Indonesia. Renowned for
its quality and reliability, the division services all major
oil palm plantations in Malaysia and Indonesia via its
14 strategically located warehouse facilities, of which
8 are in Malaysia and 6 are in Indonesia. In addition
to its main products of muriate of potash (MOP),
ammonium sulphate and rock phosphate, the division
also caters to other fertilizers requirements such as
urea, natural kieserite, fused magnesium phosphate, tri
super phosphate, ammonium sulphate nitrate, copper
sulphate, zinc sulphate, and borate.
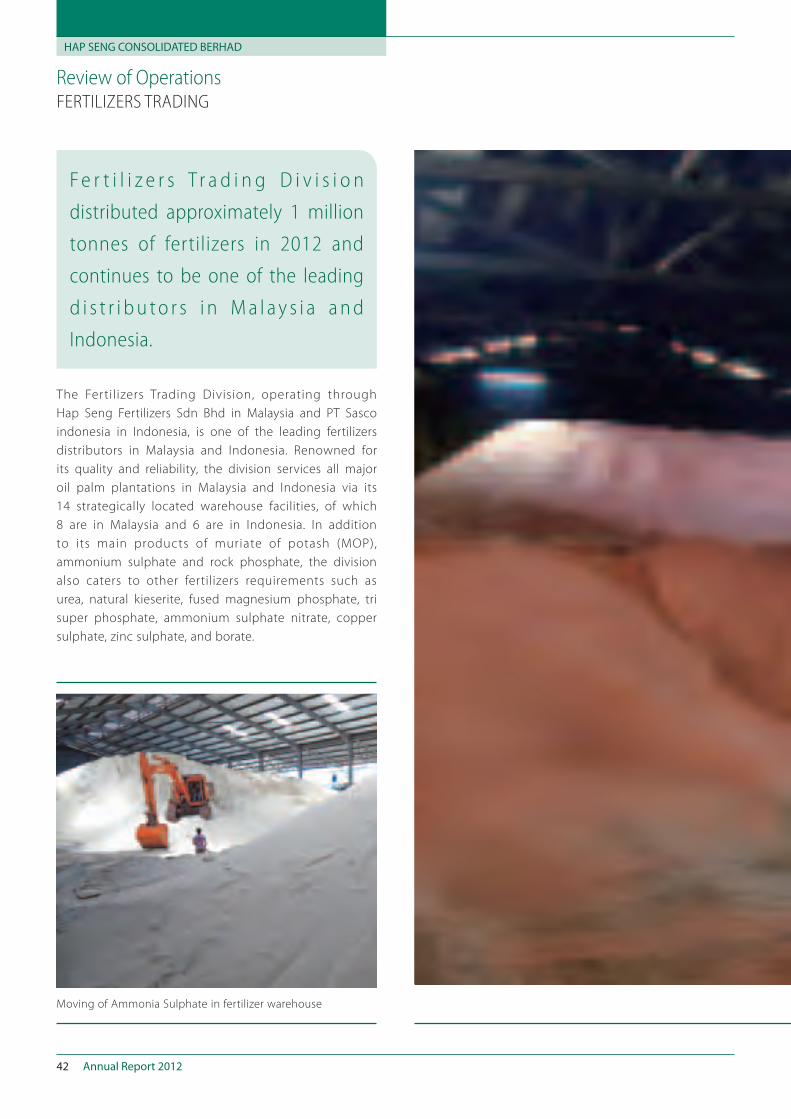
F e r t i l i z e r s T r a d i n g D i v i s i o n
distributed approximately 1 million
tonnes of fertilizers in 2012 and
continues to be one of the leading
d i s t r i b u t o r s i n M a l a y s i a a n d
Indonesia.
Moving of Ammonia Sulphate in fertilizer warehouse
Annual Report 2012 43
Review of Operations FERTILIZERS TRADING
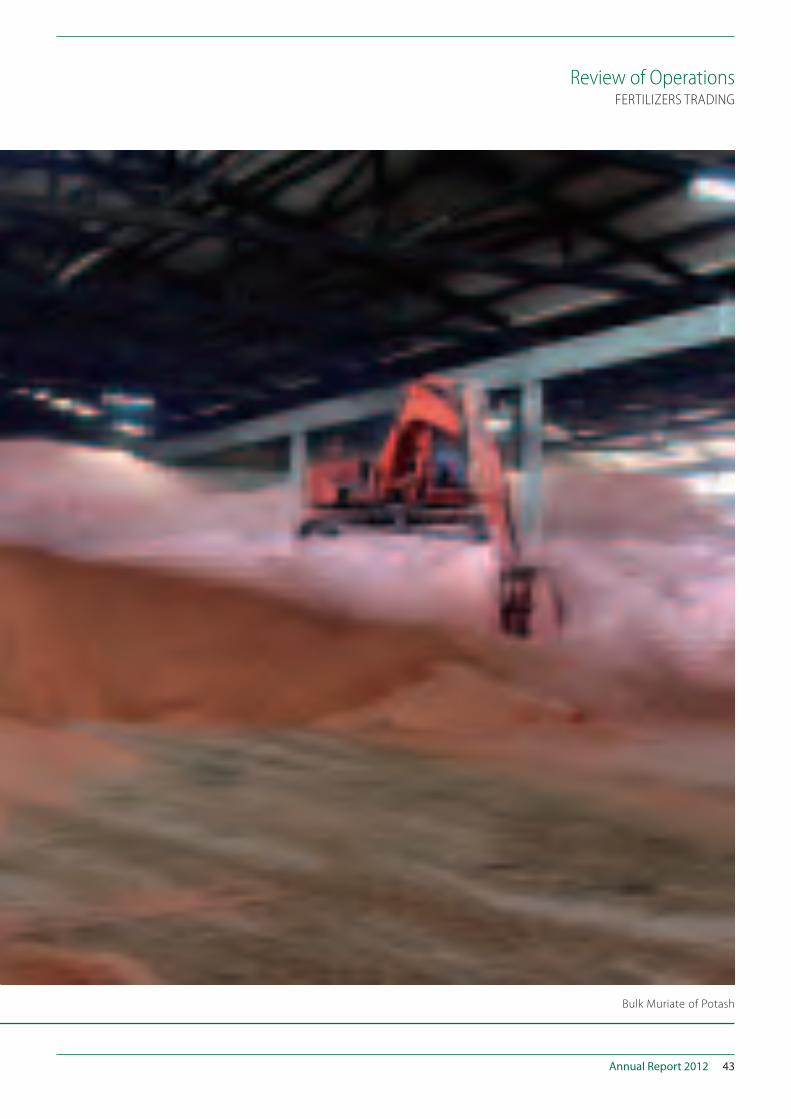
Bulk Muriate of Potash
HAP SENG CONSOLIDATED BERHAD
Annual Report 201244
Review of Operations
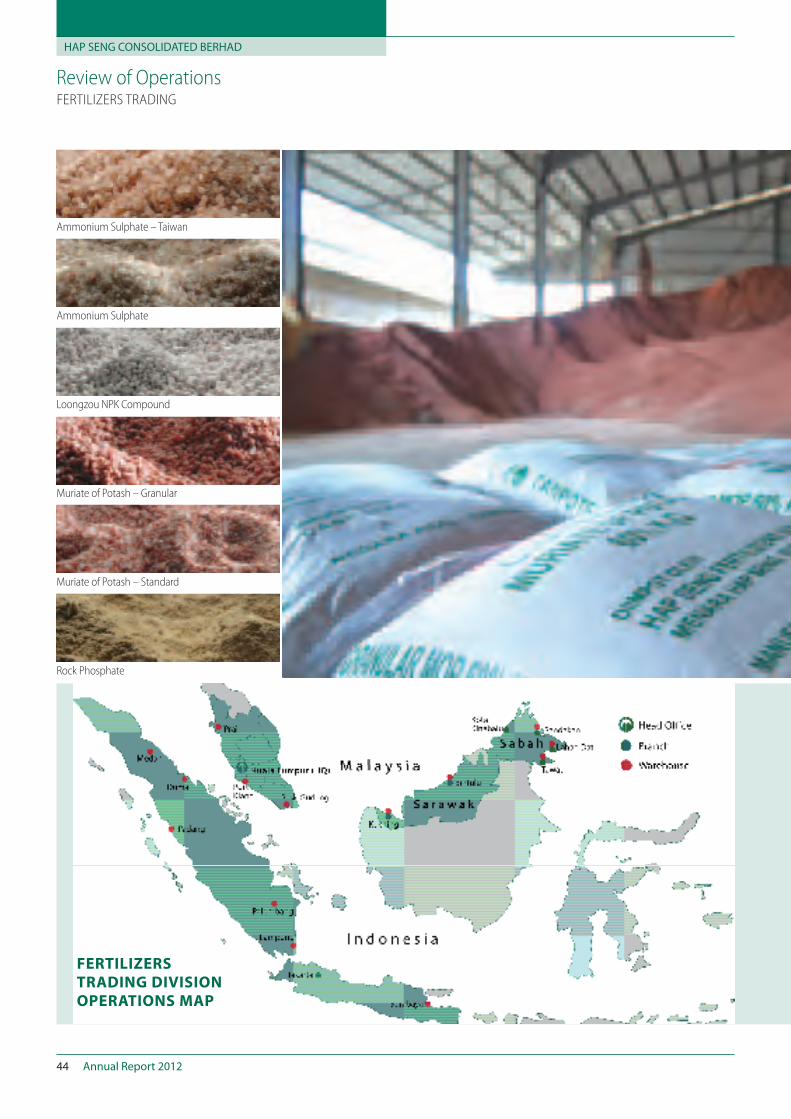
Ammonium Sulphate – Taiwan
Ammonium Sulphate
Loongzou NPK Compound
Muriate of Potash – Granular
Muriate of Potash – Standard
Rock Phosphate
FERTILIZERS
TRADING DIVISION
OPERATIONS MAP
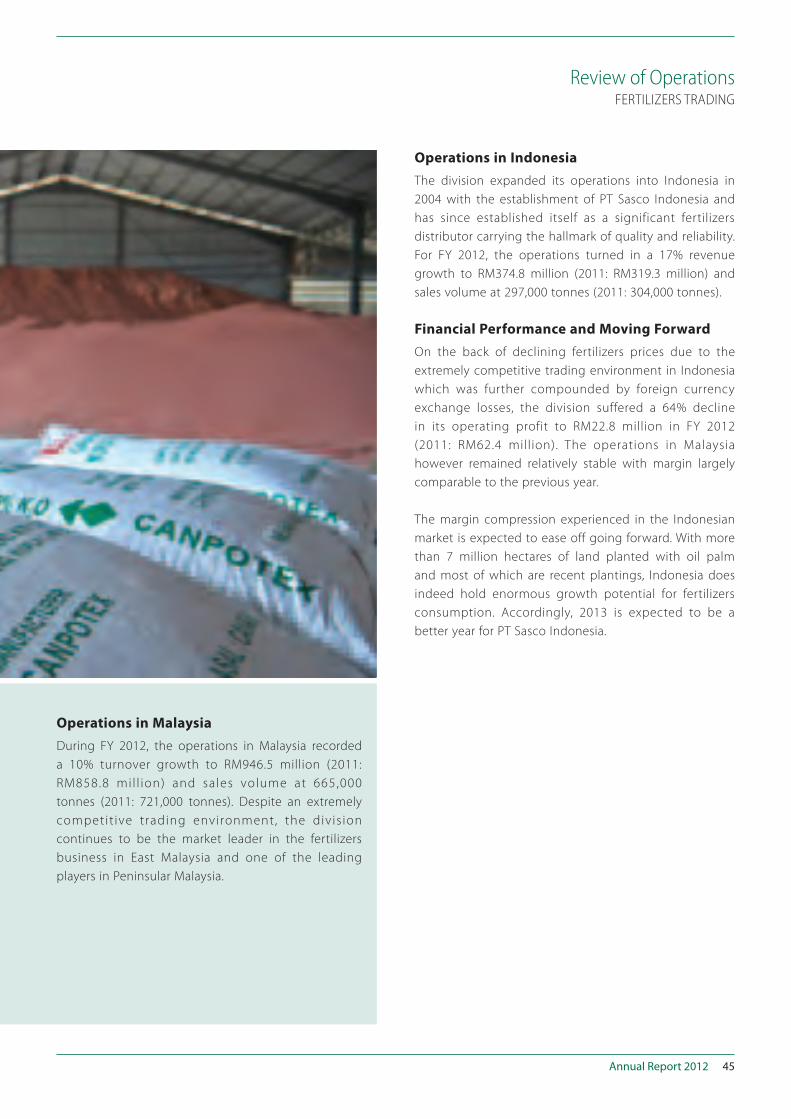
FERTILIZERS TRADING
Munate of potash
Annual Report 2012 45
Review of Operations
Operations in Malaysia
During FY 2012, the operations in Malaysia recorded
a 10% turnover growth to RM946.5 million (2011:
RM858.8 mil l ion) and sales volume at 665,000
tonnes (2011: 721,000 tonnes). Despite an extremely
competit ive trading environment, the divis ion
continues to be the market leader in the fertilizers
business in East Malaysia and one of the leading
players in Peninsular Malaysia.
Operations in Indonesia
The division expanded its operations into Indonesia in
2004 with the establishment of PT Sasco Indonesia and
has since established itself as a significant fertilizers
distributor carrying the hallmark of quality and reliability.
For FY 2012, the operations turned in a 17% revenue
growth to RM374.8 million (2011: RM319.3 million) and
sales volume at 297,000 tonnes (2011: 304,000 tonnes).
Financial Performance and Moving Forward
On the back of declining fertilizers prices due to the
extremely competitive trading environment in Indonesia
which was further compounded by foreign currency
exchange losses, the division suffered a 64% decline
in its operating profit to RM22.8 million in FY 2012
(2011: RM62.4 million). The operations in Malaysia
however remained relatively stable with margin largely
comparable to the previous year.
The margin compression experienced in the Indonesian
market is expected to ease off going forward. With more
than 7 million hectares of land planted with oil palm
and most of which are recent plantings, Indonesia does
indeed hold enormous growth potential for fertilizers
consumption. Accordingly, 2013 is expected to be a
better year for PT Sasco Indonesia.
FERTILIZERS TRADING
HAP SENG CONSOLIDATED BERHAD
Annual Report 201246
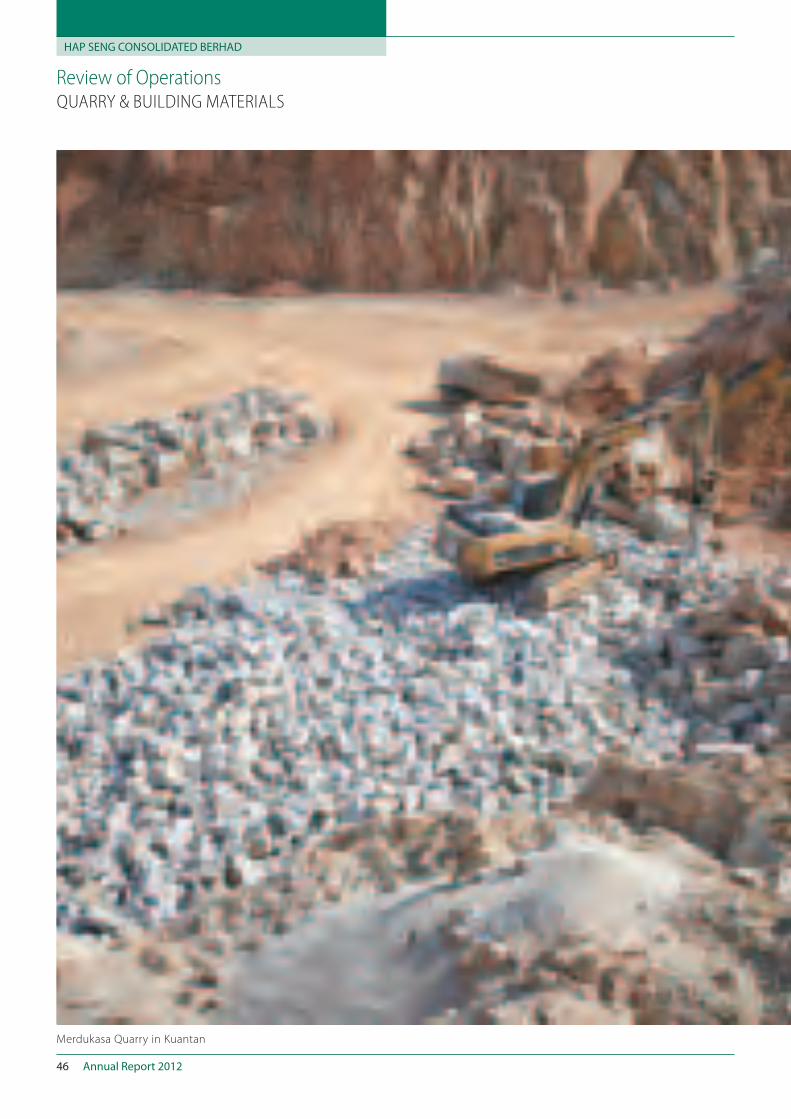
Review of Operations QUARRY & BUILDING MATERIALS
Merdukasa Quarry in Kuantan
Annual Report 2012 47
Review of Operations
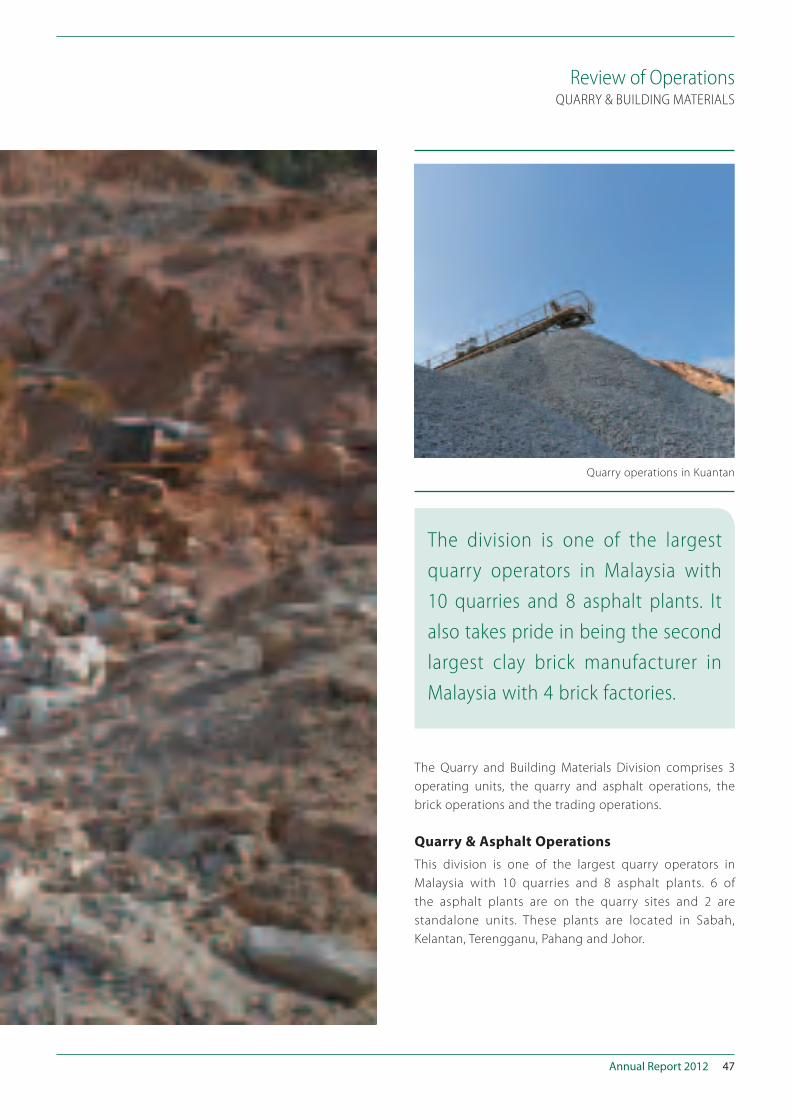
The Quarry and Building Materials Division comprises 3
operating units, the quarry and asphalt operations, the
brick operations and the trading operations.
Quarry & Asphalt Operations
This division is one of the largest quarry operators in
Malaysia with 10 quarries and 8 asphalt plants. 6 of
the asphalt plants are on the quarry sites and 2 are
standalone units. These plants are located in Sabah,
Kelantan, Terengganu, Pahang and Johor.
The division is one of the largest
quarry operators in Malaysia with
10 quarries and 8 asphalt plants. It
also takes pride in being the second
largest clay brick manufacturer in
Malaysia with 4 brick factories.
QUARRY & BUILDING MATERIALS
Quarry operations in Kuantan
HAP SENG CONSOLIDATED BERHAD
Annual Report 201248
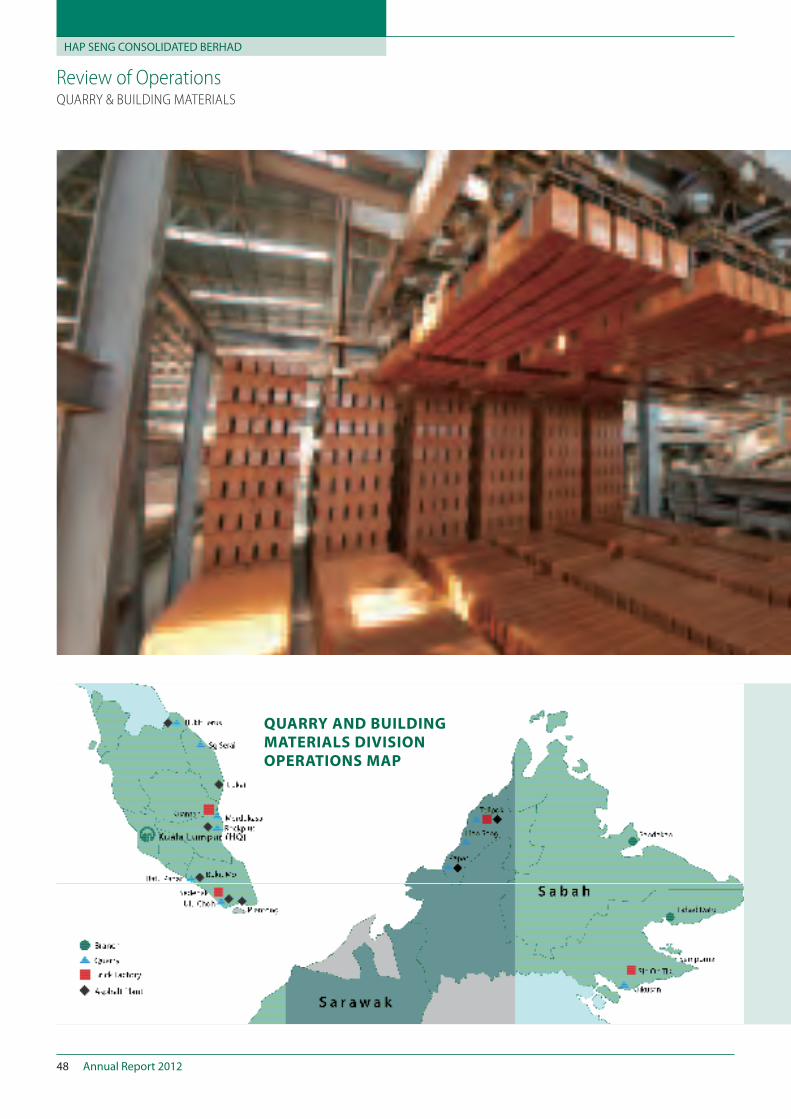
Review of Operations QUARRY & BUILDING MATERIALS
QUARRY AND BUILDING
MATERIALS DIVISION
OPERATIONS MAP
Annual Report 2012 49
Review of Operations QUARRY & BUILDING MATERIALS
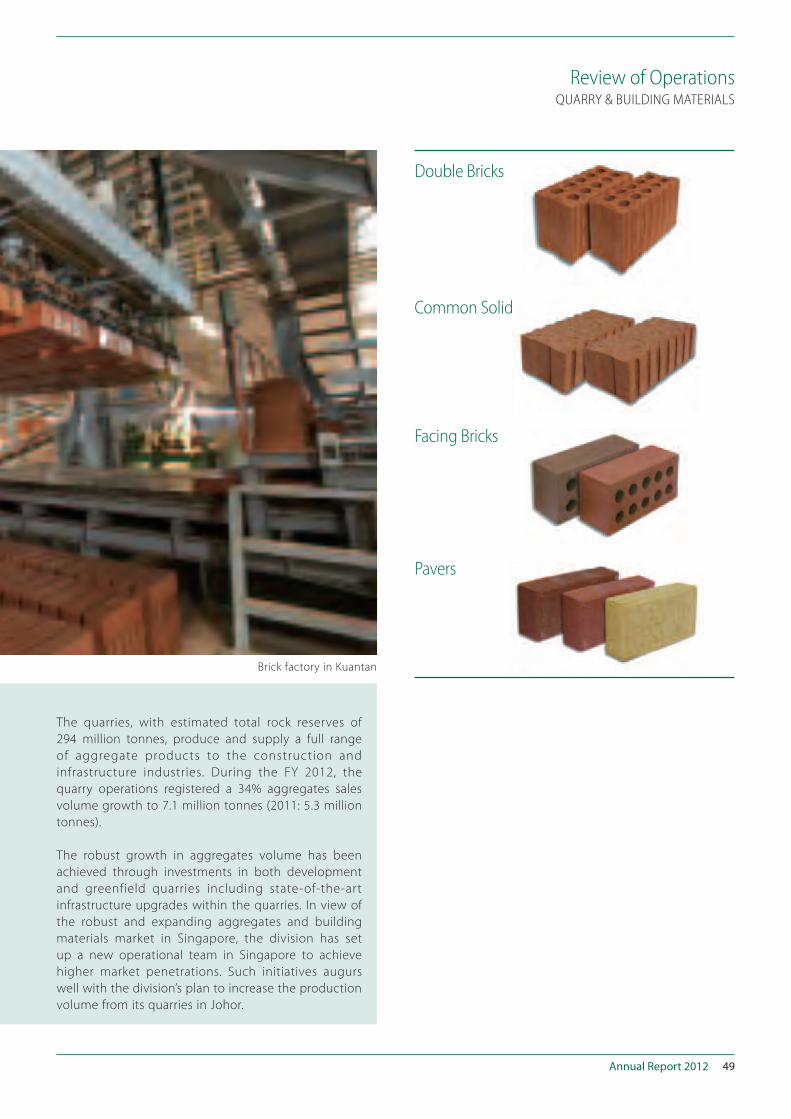
The quarries, with estimated total rock reserves of
294 million tonnes, produce and supply a full range
of aggregate products to the construction and
infrastructure industries. During the FY 2012, the
quarry operations registered a 34% aggregates sales
volume growth to 7.1 million tonnes (2011: 5.3 million
tonnes).
The robust growth in aggregates volume has been
achieved through investments in both development
and greenfield quarries including state-of-the-art
infrastructure upgrades within the quarries. In view of
the robust and expanding aggregates and building
materials market in Singapore, the division has set
up a new operational team in Singapore to achieve
higher market penetrations. Such initiatives augurs
well with the division’s plan to increase the production
volume from its quarries in Johor.
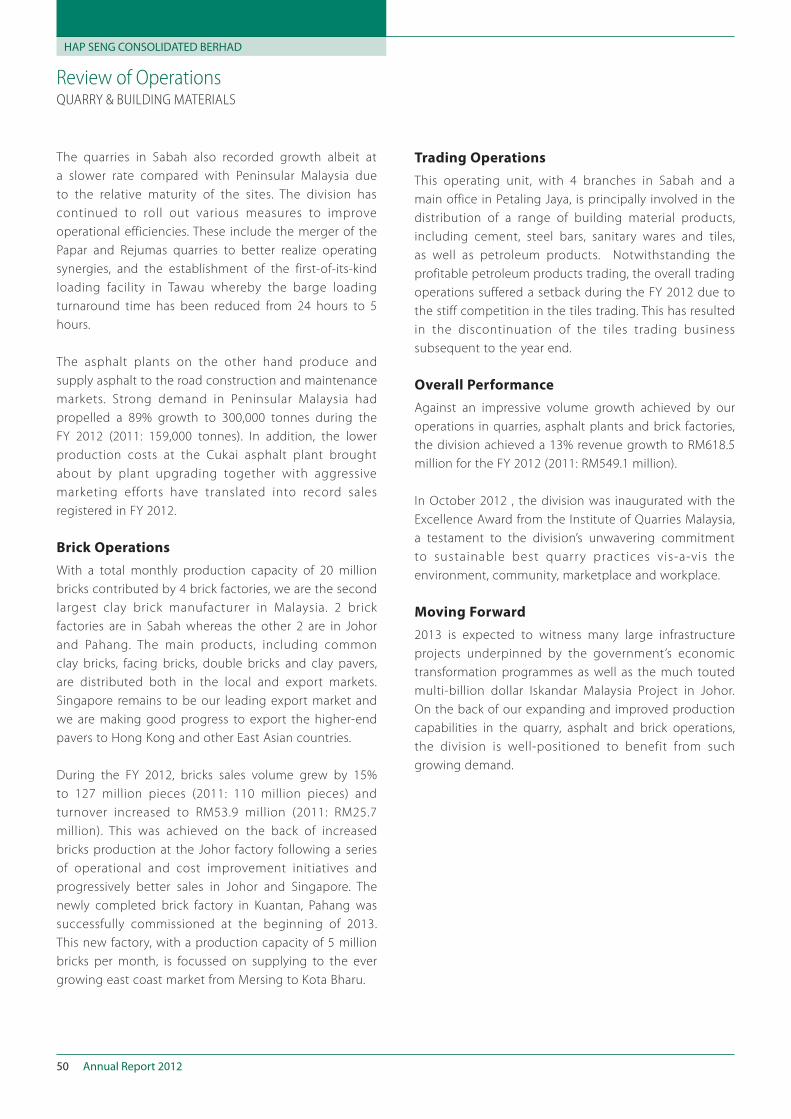
Double Bricks
Pavers
Facing Bricks
Common Solid
Brick factory in Kuantan
HAP SENG CONSOLIDATED BERHAD
Annual Report 201250
Review of Operations
The quarries in Sabah also recorded growth albeit at
a slower rate compared with Peninsular Malaysia due
to the relative maturity of the sites. The division has
continued to roll out various measures to improve
operational efficiencies. These include the merger of the
Papar and Rejumas quarries to better realize operating
synergies, and the establishment of the first-of-its-kind
loading facility in Tawau whereby the barge loading
turnaround time has been reduced from 24 hours to 5
hours.
The asphalt plants on the other hand produce and
supply asphalt to the road construction and maintenance
markets. Strong demand in Peninsular Malaysia had
propelled a 89% growth to 300,000 tonnes during the
FY 2012 (2011: 159,000 tonnes). In addition, the lower
production costs at the Cukai asphalt plant brought
about by plant upgrading together with aggressive
marketing efforts have translated into record sales
registered in FY 2012.
Brick Operations
With a total monthly production capacity of 20 million
bricks contributed by 4 brick factories, we are the second
largest clay brick manufacturer in Malaysia. 2 brick
factories are in Sabah whereas the other 2 are in Johor
and Pahang. The main products, including common
clay bricks, facing bricks, double bricks and clay pavers,
are distributed both in the local and export markets.
Singapore remains to be our leading export market and
we are making good progress to export the higher-end
pavers to Hong Kong and other East Asian countries.
During the FY 2012, bricks sales volume grew by 15%
to 127 million pieces (2011: 110 million pieces) and
turnover increased to RM53.9 million (2011: RM25.7
million). This was achieved on the back of increased
bricks production at the Johor factory following a series
of operational and cost improvement initiatives and
progressively better sales in Johor and Singapore. The
newly completed brick factory in Kuantan, Pahang was
successfully commissioned at the beginning of 2013.
This new factory, with a production capacity of 5 million
bricks per month, is focussed on supplying to the ever
growing east coast market from Mersing to Kota Bharu.
Trading Operations
This operating unit, with 4 branches in Sabah and a
main office in Petaling Jaya, is principally involved in the
distribution of a range of building material products,
including cement, steel bars, sanitary wares and tiles,
as well as petroleum products. Notwithstanding the
profitable petroleum products trading, the overall trading
operations suffered a setback during the FY 2012 due to
the stiff competition in the tiles trading. This has resulted
in the discontinuation of the tiles trading business
subsequent to the year end.
Overall Performance
Against an impressive volume growth achieved by our
operations in quarries, asphalt plants and brick factories,
the division achieved a 13% revenue growth to RM618.5
million for the FY 2012 (2011: RM549.1 million).
In October 2012 , the division was inaugurated with the
Excellence Award from the Institute of Quarries Malaysia,
a testament to the division’s unwavering commitment
to sustainable best quarr y practices vis-a-vis the
environment, community, marketplace and workplace.
Moving Forward
2013 is expected to witness many large infrastructure
projects underpinned by the government’s economic
transformation programmes as well as the much touted
multi-billion dollar Iskandar Malaysia Project in Johor.
On the back of our expanding and improved production
capabilities in the quarry, asphalt and brick operations,
the division is well-positioned to benefit from such
growing demand.
QUARRY & BUILDING MATERIALS
Annual Report 2012 51
Statement on Corporate Governance
The Board is pleased to report on the manner in which
the 8 principles and recommendations as set out in the
Malaysian Code on Corporate Governance 2012 (Code)
are applied to the affairs of the Group and the extent of
compliance pursuant to paragraph 15.25 and Practice
Note 9 of the Main Market Listing Requirements of Bursa
Malaysia Securities Berhad (Listing Requirements).
It is the policy of the Company to manage the affairs of
the Group in accordance with the appropriate standards
for good corporate governance.
The Board is committed to ensuring that appropriate
standards of corporate governance are practised
throughout the Group as a fundamental par t of
discharging its responsibilities to protect and enhance
shareholder value and the financial performance of the
Group and Company.
BOARD OF DIRECTORS
Board Charter
The Board has formulated and adopted a charter
(Board Charter) on 3 April 2013 to define inter-alia the
following:–
Board Composition
Board Appointments
Meetings and Board Attendance
Role of the Chairman, Managing Director and
Company Secretary
Board Function
Board Committees comprising the Audit, Nominating
and Remuneration Committee
Dichotomy between the Board and Management’s
role and responsibilities
Code of Conduct
Gender Diversity
Sustainability
This Board Charter, which is subject to periodic review
by the Board after taking into the latest legal, regulatory
and ethical requirements, is accessible through the
Company’s website at www.hapseng.com.my.
Board Responsibilities
The Board is responsible for overseeing the management
of the business and affairs of the Company, including
the commitment to sustainability, in the best long-term
interest of the Company. The Board has clear roles and
responsibilities in discharging its fiduciary and leadership
functions and has established clear functions reserved
for the Board and those that were delegated to the
management which are embodied in the Board Charter.
All directors are to act in the best interest of the
Company and shall disclose to the Board of any interest
or potential interest as soon as he becomes aware of
such interest. The company secretary shall keep a register
of such declarations of interest.
Board Meetings
The directors meet at least 4 times a year. During the
FY 2012, 4 board meetings were held with the directors
having attended at least 50% of the board meetings.
Based on the recommendation of the Nominating
Committee, Datuk Abdul Aziz Hasan was re-designated
from a non-independent non-executive director to an
independent non-executive director on 29 November
2012.
On 31 December 2012, Datuk Henry Chin Poy-Wu and
Mr. Lau Teong Jin resigned from the Board as they had
served as independent directors for more than 9 years.
Minutes, proceedings and decisions taken during the
board meetings are recorded by the company secretary
and would be circulated to the Board members within 2
weeks of the relevant meeting.
HAP SENG CONSOLIDATED BERHAD
Annual Report 201252
Statement on Corporate Governance
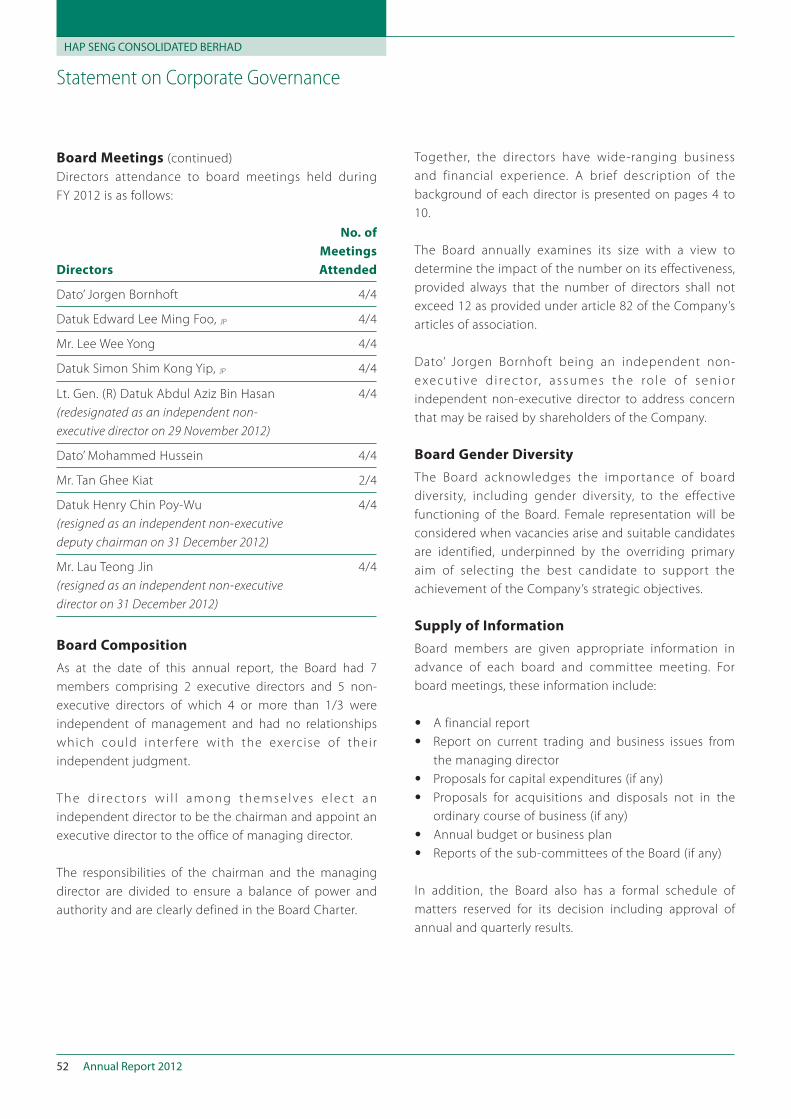
Board Meetings (continued)
Directors attendance to board meetings held during
FY 2012 is as follows:
Directors
No. of
Meetings
Attended
Dato’ Jorgen Bornhoft 4/4
Datuk Edward Lee Ming Foo, JP 4/4
Mr. Lee Wee Yong 4/4
Datuk Simon Shim Kong Yip, JP 4/4
Lt. Gen. (R) Datuk Abdul Aziz Bin Hasan
(redesignated as an independent non-
executive director on 29 November 2012)
4/4
Dato’ Mohammed Hussein 4/4
Mr. Tan Ghee Kiat 2/4
Datuk Henry Chin Poy-Wu
(resigned as an independent non-executive
deputy chairman on 31 December 2012)
4/4
Mr. Lau Teong Jin
(resigned as an independent non-executive
director on 31 December 2012)
4/4
Board Composition
As at the date of this annual report, the Board had 7
members comprising 2 executive directors and 5 non-
executive directors of which 4 or more than 1/3 were
independent of management and had no relationships
which could inter fere with the exercise of their
independent judgment.
T h e d i re c to r s w i l l a m o n g t h e m s e l ve s e l e c t a n
independent director to be the chairman and appoint an
executive director to the office of managing director.
The responsibilities of the chairman and the managing
director are divided to ensure a balance of power and
authority and are clearly defined in the Board Charter.
Together, the directors have wide-ranging business
and financial experience. A brief description of the
background of each director is presented on pages 4 to
10.
The Board annually examines its size with a view to
determine the impact of the number on its effectiveness,
provided always that the number of directors shall not
exceed 12 as provided under article 82 of the Company’s
articles of association.
Dato’ Jorgen Bornhoft being an independent non-
e xe c u t i ve d i re c to r, a s s u m e s t h e ro l e o f s e n i o r
independent non-executive director to address concern
that may be raised by shareholders of the Company.
Board Gender Diversity
The Board acknowledges the importance of board
diversity, including gender diversity, to the effective
functioning of the Board. Female representation will be
considered when vacancies arise and suitable candidates
are identified, underpinned by the overriding primary
aim of selecting the best candidate to support the
achievement of the Company’s strategic objectives.
Supply of Information
Board members are given appropriate information in
advance of each board and committee meeting. For
board meetings, these information include:
A financial report
Report on current trading and business issues from
the managing director
Proposals for capital expenditures (if any)
Proposals for acquisitions and disposals not in the
ordinary course of business (if any)
Annual budget or business plan
Reports of the sub-committees of the Board (if any)
In addition, the Board also has a formal schedule of
matters reserved for its decision including approval of
annual and quarterly results.
Annual Report 2012 53
Statement on Corporate Governance
Supply of Information (continued)
The Board is supported by suitably qualif ied and
competent company secretary, who is responsible
alongside with Board members, for various legal and
compliance obligations under the laws. The role of the
company secretary is detailed in the Board Charter.
The company secretary together with the managing
director normally assist the chairman to organise the
information necessary for the Board to deal with the
agenda and providing the relevant information to the
directors on a timely basis.
T h e B o a r d a l s o a u t h o r i s e s d i r e c t o r s t o s e e k
independent professional advice if necessary at the
Company’s expense in the furtherance of their duties.
Prior to incurring the professional fees, the directors
shall refer to the managing director on the nature
and the fees of the professional advice sought.
All information within the Group are accessible to
the directors in the furtherance of their duties and all
directors have access to the services of the company
secretary.
Board Committees
Speci f ic responsibi l i t ies are delegated to board
committees which comprise the Audit Committee,
Nominating Committee and Remuneration Committee
which shall report to the Board regularly. The board
committees are limited to making recommendation to
the Board as the Board is not empowered to delegate its
decision-making authorities to the board committees.
The primary responsibilities of these board committees
are approved by the Board and are detailed in pages 66
to 72 of the annual report.
Minutes of proceedings and resolutions of all meetings
including attendance of members of the committee
are recorded by the company secretary and circulated
promptly to the members of the board committee and
once agreed, to all members of the Board.
The board committees have access to relevant resources to
facilitate the carrying out of its duties including obtaining, at
the Company’s expense, outside legal or other professional
advice on any matters within its term of reference.
Appointments to the Board
Appointments to the Board are decided by the members
of the Board based on the recommendations of the
Nominating Committee. The Nominating Committee,
which comprises 3 non-executive directors of which 2
are independent non-executive directors, is responsible
for proposing new nominees to the Board on an on-
going basis and annually, assessing the contribution of
each individual director, (including independent non-
executive directors as well as the managing director) and
also the effective discharge by the members of the board
committees.
The Nominating Committee has reviewed and is satisfied
that:
the size of the Board is optimum for the effective
discharge of the Board’s function and that there is
appropriate mix of skills and core competencies in
the composition of the Board;
all the members of the Board are suitably qualified
to hold their positions as directors in view of
the i r respec t ive academic and profess iona l
q u a l i f i c a t i o n s , c o m p e t e n c i e s , e x p e r i e n c e s ,
commitment, contribution and performance;
all the directors at the date of this annual report
have updated their knowledge and enhance their
skills through appropriate continuing education
programmes during the FY 2012; and
all the independent directors as at the date of this
annual report have not exceeded the term of 9 years
tenure.
Company secretaries are appointed by the Board and
are persons who are capable of carrying out the duties
which the post entails, providing effective support to
the chairman to ensure the effective functioning of the
Board. Their removal is a matter for the Board as a whole.
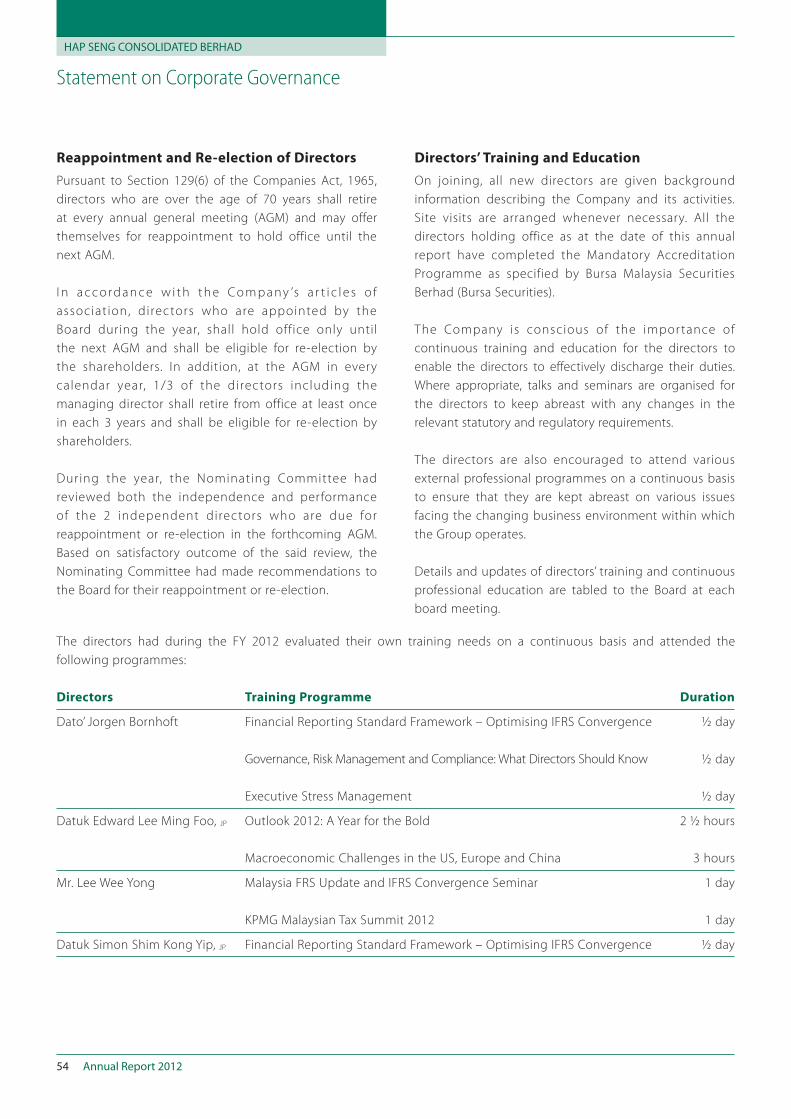
HAP SENG CONSOLIDATED BERHAD
Annual Report 201254
Statement on Corporate Governance
Reappointment and Re-election of Directors
Pursuant to Section 129(6) of the Companies Act, 1965,
directors who are over the age of 70 years shall retire
at every annual general meeting (AGM) and may offer
themselves for reappointment to hold office until the
next AGM.
I n a c c o rd a n c e w i t h t h e C o m p a ny ’s a r t i c l e s o f
associat ion, directors who are appointed by the
Board during the year, shall hold office only until
the next AGM and shall be eligible for re-election by
the shareholders. In addition, at the AGM in every
calendar year, 1/3 of the directors including the
managing director shall retire from office at least once
in each 3 years and shall be eligible for re-election by
shareholders.
During the year, the Nominating Committee had
reviewed both the independence and performance
of the 2 independent directors who are due for
reappointment or re-election in the forthcoming AGM.
Based on satisfactory outcome of the said review, the
Nominating Committee had made recommendations to
the Board for their reappointment or re-election.
Directors’ Training and Education
On joining, all new directors are given background
information describing the Company and its activities.
Site visits are arranged whenever necessary. All the
directors holding office as at the date of this annual
report have completed the Mandatory Accreditation
Programme as specified by Bursa Malaysia Securities
Berhad (Bursa Securities).
The Company is conscious of the importance of
continuous training and education for the directors to
enable the directors to effectively discharge their duties.
Where appropriate, talks and seminars are organised for
the directors to keep abreast with any changes in the
relevant statutory and regulatory requirements.
The directors are also encouraged to attend various
external professional programmes on a continuous basis
to ensure that they are kept abreast on various issues
facing the changing business environment within which
the Group operates.
Details and updates of directors’ training and continuous
professional education are tabled to the Board at each
board meeting.
The directors had during the FY 2012 evaluated their own training needs on a continuous basis and attended the
following programmes:
Directors Training Programme Duration
Dato’ Jorgen Bornhoft Financial Reporting Standard Framework – Optimising IFRS Convergence ½ day
Governance, Risk Management and Compliance: What Directors Should Know ½ day
Executive Stress Management ½ day
Datuk Edward Lee Ming Foo, JP Outlook 2012: A Year for the Bold 2 ½ hours
Macroeconomic Challenges in the US, Europe and China 3 hours
Mr. Lee Wee Yong Malaysia FRS Update and IFRS Convergence Seminar 1 day
KPMG Malaysian Tax Summit 2012 1 day
Datuk Simon Shim Kong Yip, JP Financial Reporting Standard Framework – Optimising IFRS Convergence ½ day
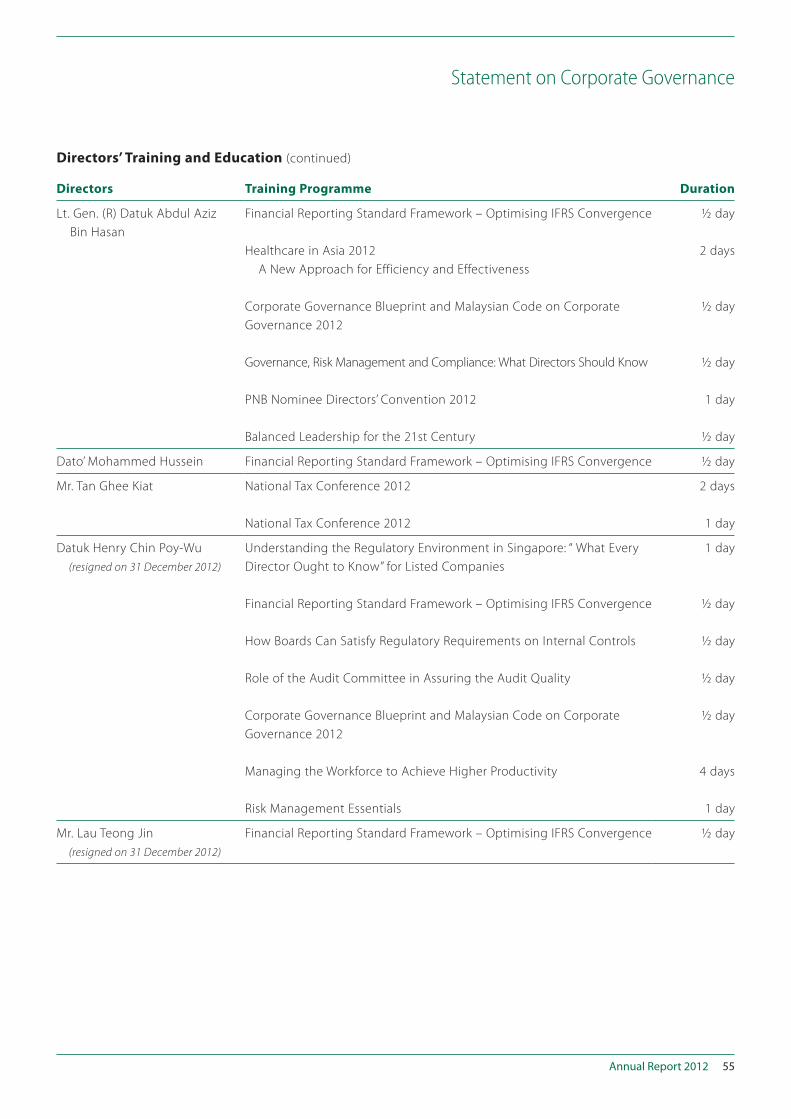
Annual Report 2012 55
Statement on Corporate Governance
Directors Training Programme Duration
Lt. Gen. (R) Datuk Abdul Aziz
Bin Hasan
Financial Reporting Standard Framework – Optimising IFRS Convergence ½ day
Healthcare in Asia 2012
A New Approach for Efficiency and Effectiveness
2 days
Corporate Governance Blueprint and Malaysian Code on Corporate
Governance 2012
½ day
Governance, Risk Management and Compliance: What Directors Should Know ½ day
PNB Nominee Directors’ Convention 2012 1 day
Balanced Leadership for the 21st Century ½ day
Dato’ Mohammed Hussein Financial Reporting Standard Framework – Optimising IFRS Convergence ½ day
Mr. Tan Ghee Kiat National Tax Conference 2012 2 days
National Tax Conference 2012 1 day
Datuk Henry Chin Poy-Wu
(resigned on 31 December 2012)
Understanding the Regulatory Environment in Singapore: “ What Every
Director Ought to Know” for Listed Companies
1 day
Financial Reporting Standard Framework – Optimising IFRS Convergence ½ day
How Boards Can Satisfy Regulatory Requirements on Internal Controls ½ day
Role of the Audit Committee in Assuring the Audit Quality ½ day
Corporate Governance Blueprint and Malaysian Code on Corporate
Governance 2012
½ day
Managing the Workforce to Achieve Higher Productivity 4 days
Risk Management Essentials 1 day
Mr. Lau Teong Jin
(resigned on 31 December 2012)
Financial Reporting Standard Framework – Optimising IFRS Convergence ½ day
Directors’ Training and Education (continued)
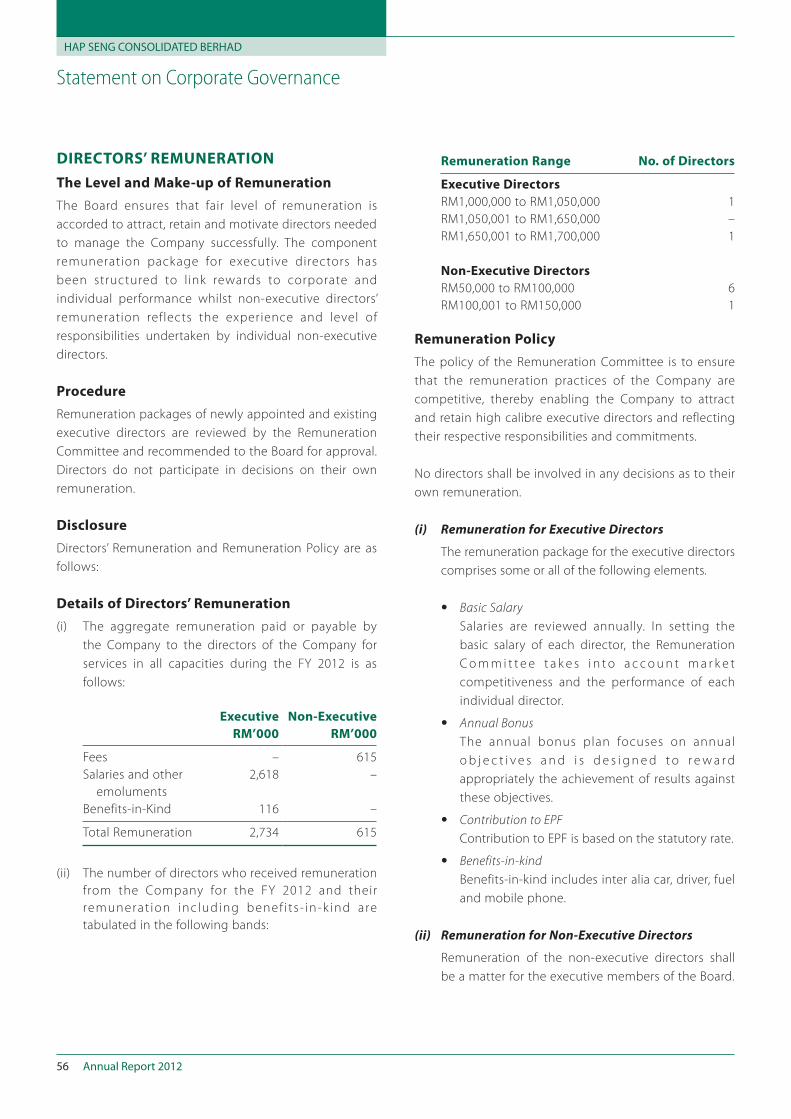
HAP SENG CONSOLIDATED BERHAD
Annual Report 201256
Statement on Corporate Governance
DIRECTORS’ REMUNERATION
The Level and Make-up of Remuneration
The Board ensures that fair level of remuneration is
accorded to attract, retain and motivate directors needed
to manage the Company successfully. The component
remuneration package for executive directors has
been structured to l ink rewards to corporate and
individual performance whilst non-executive directors’
remuneration reflects the experience and level of
responsibilities undertaken by individual non-executive
directors.
Procedure
Remuneration packages of newly appointed and existing
executive directors are reviewed by the Remuneration
Committee and recommended to the Board for approval.
Directors do not participate in decisions on their own
remuneration.
Disclosure
Directors’ Remuneration and Remuneration Policy are as
follows:
Details of Directors’ Remuneration
(i) The aggregate remuneration paid or payable by
the Company to the directors of the Company for
services in all capacities during the FY 2012 is as
follows:
Executive Non-Executive
RM’000 RM’000
Fees – 615
Salaries and other
emoluments
2,618 –
Benefits-in-Kind 116 –
Total Remuneration 2,734 615
(ii) The number of directors who received remuneration
from the Company for the FY 2012 and their
remunerat ion inc luding benef i ts - in-k ind are
tabulated in the following bands:
Remuneration Range No. of Directors
Executive Directors
RM1,000,000 to RM1,050,000 1
RM1,050,001 to RM1,650,000 –
RM1,650,001 to RM1,700,000 1
Non-Executive Directors
RM50,000 to RM100,000 6
RM100,001 to RM150,000 1
Remuneration Policy
The policy of the Remuneration Committee is to ensure
that the remuneration practices of the Company are
competitive, thereby enabling the Company to attract
and retain high calibre executive directors and reflecting
their respective responsibilities and commitments.
No directors shall be involved in any decisions as to their
own remuneration.
(i) Remuneration for Executive Directors
The remuneration package for the executive directors
comprises some or all of the following elements.
Basic Salary
Salaries are reviewed annually. In setting the
basic salary of each director, the Remuneration
C o m m i t t e e t a k e s i n t o a c c o u n t m a r k e t
competitiveness and the performance of each
individual director.
Annual Bonus
The annual bonus plan focuses on annual
o b j e c t i v e s a n d i s d e s i g n e d t o r e w a r d
appropriately the achievement of results against
these objectives.
Contribution to EPF
Contribution to EPF is based on the statutory rate.
Benefits-in-kind
Benefits-in-kind includes inter alia car, driver, fuel
and mobile phone.
(ii) Remuneration for Non-Executive Directors
Remuneration of the non-executive directors shall
be a matter for the executive members of the Board.
Annual Report 2012 57
Statement on Corporate Governance
SHAREHOLDERS
Dialogue between Company and Investors
T h e Co m p a ny i s c o m m i t te d to e n s u re t h a t a l l
shareholders have timely access to all publicly available
information of the Company, with which shareholders
are enabled to actively participate in the affairs of the
Company in an informed manner.
Toward this end, the Board is guided by the disclosure
policy enshrined in the Listing Requirement in making
immediate announcement of all material information
save in the permitted exceptional circumstances, which
information is also made available on the Company’s
website at www.hapseng.com.my after the release of the
announcement.
The Board views the AGM as an ideal opportunity
to communicate with both institutional and private
shareholders. In addition, the Company has a website at
www.hapseng.com.my which provides shareholders and
investors at large with up-to-date information. Amongst
others, the quarterly financial results, annual report,
corporate announcements and the like are downloaded
onto the website as soon as practicable after such
information is released by the Company to Bursa
Securities. While the Company endeavours to provide
as much information as possible to its shareholders, it is
mindful of the legal and regulatory framework governing
the release of material and price-sensitive information.
I n a d d i t i o n , t h e C o m p a n y ’s a n n o u n c e m e n t s ,
including full version of its quarterly financial results
announcements and annual report can be accessed
through Bursa Securities’ website at www.bursamalaysia.
com.
The Annual General Meeting (“AGM”)
Notice of AGM which is contained in the annual report is
sent out at least 21 days prior to the date of the meeting.
There wi l l be commentar y by the chairman and
managing director at the AGM regarding the Company’s
performance for each financial year and a brief review on
current trading conditions.
At each AGM, a platform is available to shareholders to
participate in the question and answer session. Where
appropriate, the chairman and managing director will
provide written answers to any significant question that
cannot be readily answered.
Each item of special business included in the Notice of
AGM will be accompanied by a full explanation of the
proposed resolution.
Whenever appropriate, press conference is held at the
end of each AGM where the chairman and managing
director advise the press on the resolutions passed and
answer questions in respect of the Group as well as to
clarify and explain any issues.
The Board has also formulated a policy to encourage
constructive and effective engagement, dialogue and
other forms of communication with shareholders,
stakeholders, investors and/or the community as
contained in the Company’s shareholder communication
policy which is included in the Board Charter.
HAP SENG CONSOLIDATED BERHAD
Annual Report 201258
Statement on Corporate Governance
CODE OF CONDUCT
In its aspiration to instill and promote appropriate
standards of conduct and ethical practices, the Board
has established this code of business conduct (Code of
Conduct) to be strictly complied with by the directors
and members of the management. For the avoidance
of doubt, the provisions of this Code of Conduct is
in addition to any other obligations imposed on the
directors by any applicable rules, laws and regulations.
The Board reviews the Code of Conduct periodically.
The Code of Conduct covers the following areas:
Honesty and Integrity
The success of our business is built on the foundation
of trust and confidence. Hence, directors must act
honestly and fairly in their business dealings with all
stakeholders.
Compliance with Laws
Directors shall comply and satisfy themselves that
appropriate policies and procedures are in place for
compliance by employees and officers, with all laws,
rules and regulations applicable to the Company
and themselves, including insider trading laws. In
the event of dealing with the Company’s shares both
within and outside the closed periods, to comply
with the disclosure requirements.
Conflict of Interests
Directors are to avoid situations that present or create
the appearance of a potential conflict between
their own interests and those of the Company.
Any situation that involves, or may reasonably be
expected to involve a conflict of interests must be
disclosed promptly to the fellow Board members by
notifying the company secretary.
Confidentiality
Directors must maintain the confidential ity of
information entrusted to them by the Company and
any other information about the Company which
comes to them in their capacity as a director. In
addition, a director must not make use of non-public
price-sensitive information to advance or pursue his/
her personal opportunities, gains or interests, such as
the buying or selling of the Company’s shares.
Whistle-Blowing
The Board has formulated a whistle-blowing policy to
encourage employees to disclose any malpractice or
misconduct of which they become aware of and to
provide protection for the reporting of such alleged
malpractice or misconduct. The full text of the
whistle-blowing policy of the Company is found in
the corporate website.
This Code of conduct has been published on the
Company’s website www.hapseng.com.my.
Annual Report 2012 59
Statement on Corporate Governance
STRATEGIES FOR SUSTAINABILITY
The Board aspires to strengthen its commitment and
investment in corporate sustainability to the mutual
benefit of both the Company and the public at large.
To this end, various initiatives have been undertaken
to harness the market ’s potential for sustainability
products and ser v ices on the one hand and to
minimize sustainability costs and risks on the other
hand.
Summarised below are the various methodologies
undertaken as part of the Group’s on-going commitment
to sustainability:
In addition to providing safe working environment
for all its employees, the Company promotes and
implements all aspects of occupational safety and
health policies;
In its management of human resources to maintain
workforce capabilities, the Company places great
impor tance on employee satisfaction through
cont inuous t ra in ings, workshops, k nowledge -
management practices and competitive remuneration
and benefits programmes. Employees are therefore able
to grow and advance in their career for brighter future;
According respect to human rights and ensuring
non-existence of discrimination in any form, be it
religion, race, nationality, background or others;
Meeting shareholders’ demand for sound financial
returns through regular dividend stream, economic
growth, open communication and transparent
financial reporting;
Establishing and complying with high standards
of corporate governance and engagement with
shareholders;
Adopting innovative technologies to minimise or
control negative impact on the environment in
its business operations. For example, the usage
of 3-dimensional laser technology in the Quarry
Division has eliminated fly rock projections, improved
fragmentation and minimised the quantity of
explosives used;
H e l m i n g , s u p p o r t i n g a n d c o n t r i b u t i n g t o
environmental friendly projects or programmes; for
example RM2 million has been contributed to the
Sabah Forestry Ministry to support tree replanting
project, rehabilitation programmes implemented
on quarry sites to re-create sites of ecological value
through restoration;
Taking proactive steps towards reducing carbon
footprint, including engaging measures to improve
energy per formance of office buildings, better
management of energy use for office equipment,
raising awareness among employees, customers,
suppliers through “Reduce, Reuse, and Recycle”
campaign, reducing overseas or outstation travelling
by encouraging par t ic ipat ion in meet ings by
telephone or video conferencing; and
Participating in community involvement programs
to reach out to the needs of the communities such
as making contributions for community hall repair
and refurbishment, Crime Awareness Day, and Sports
Day and establishing scholarship programs for
underprivileged students.
HAP SENG CONSOLIDATED BERHAD
Annual Report 201260
Statement on Corporate Governance
ACCOUNTABILITY AND AUDIT
Financial Reporting
The Company operates, and attaches importance to
clear principles and procedures designed to achieve
accountability and control appropriate to the businesses
of the Group. In presenting the annual f inancial
statements and quarterly reports, the directors aim to
present a balanced and understandable assessment of
the Group’s position and prospects.
Statement of Directors’ Responsibility for
preparing the Annual Audited Financial
Statements
The directors are responsible for the preparation and
fair presentation of the Financial Statements for each
financial year that is in accordance with applicable
Financial Reporting Standards and the Companies Act,
1965, so as to give a true and fair view of the financial
position of the Group and of the Company as at the end
of the financial year and of their financial performance
and cash flows for the financial year then ended.
The directors consider that in preparing the financial
statements, the Group and the Company have used
appropriate accounting policies, consistently applied
and supported by reasonable and prudent judgments
and estimates, and that all applicable Financial Reporting
Standards have been followed. Their responsibilities
includes ensuring that the Group and Company maintain
internal controls relevant to the preparation and fair
presentation of financial statements that are free from
material misstatement, whether due to fraud or error.
Internal Control
The Group’s Statement on Risk Management and Internal
Control is set out on pages 61 to 65.
Relationship with Auditors
The Audit Committee and the Board have established
formal and transparent arrangements to maintain an
appropriate relationship with the Company’s auditors as
stated on pages 66 to 69.
External auditors are invited at least twice a year to
attend the Audit Committee meetings as well as the
AGM. Dialogue between the Audit Committee and the
external auditors are also conducted in the absence of
management. The Audit Committee has also received
written assurance from the external auditors confirming
their independence.
This Statement on Corporate Governance is made in
accordance with a Board resolution.
DATO’ JORGEN BORNHOFT DATUK EDWARD LEE MING FOO, JP
Independent Non-Executive Chairman Managing Director
Annual Report 2012 61
Statement on Risk Management and Internal Control
The Board is committed to maintaining a sound system
of risk management and internal control in the Group
and is pleased to provide the following Statement on
Risk Management and Internal Control which outlines
the nature of internal control of the Group during
the financial year ended 31 December 2012 pursuant
to paragraph 15.26(b) of the Listing Requirements.
In making this statement, the Board is guided by the
“Statement on Risk Management and Internal Control:
Guidelines for Directors of Listed Issuers” (“SRMIC”) which
is issued by the Taskforce on Internal Control with the
support and endorsement of the Bursa Securities.
For the purposes of this statement, associates are not
dealt with as part of the Group, and therefore not
covered by this statement.
Board’s Responsibility
The Board recognizes the importance of a sound
framework of risk management and internal control is
fundamental to good corporate governance and an
effective risk management process helps the Group
to achieve its performance and profitability targets by
providing risk information to enable better decisions in
the formulating Group’s strategies and decision making.
The Board acknowledges its responsibil ity for the
Group’s risk management and system of internal controls
covering not only financial controls but also operational,
environmental and compliance controls as well as risk
management including the review of the effectiveness of
the risk management process and internal control system.
The risk management process and system of internal
control involve every business units and their respective
key management, including the Board, and are designed
to meet the Group’s particular needs and to manage the
risks to which it is exposed.
The risk management process and system of internal
control, by their nature, can only provide reasonable but
not absolute assurance against material loss or against
the Group failing to achieve its objectives.
Toward this end, the Group had, since June 2001,
implemented a formal approach towards identifying,
evaluating, monitoring and managing the significant
risks affecting the achievement of its business objectives
and is an ongoing process.
This f ramework is designed to be responsive to
changes in the business environment and is clearly
communicated to all levels through the setup of a Risk
Management Committee.
The Audit Committee and Risk Management Committee
assist the Board in the reviewing process, however,
the Board as a whole remains responsible for all the
actions of the Audit Committee and Risk Management
Committee with regard to the execut ion of the
delegated role and include the outcome of the review
and disclosure on key risks and internal control in this
annual report.
HAP SENG CONSOLIDATED BERHAD
Annual Report 201262
Statement on Risk Management and Internal Control
Risk Management Committee
The Group Risk Management Committee was formed to
take formal executive responsibility for risk management,
building upon already established structures and
mechanism. Presently, the Group Managing Director
heads the Group Risk Management Committee. Each
business unit ’s risk management function is led by
the respective Chief Executive who is the head of the
respective business unit.
The Committee had been estab l i shed wi th the
responsibility to identify and communicate to the Board
of Directors the critical strategic business risks (both
present and potential) the Group faces, their changes
and the management action plans to manage the risks.
The Committee together with the respective division’s
management are responsible for implementing the
processes for identifying, evaluating, monitoring and
reporting of risks and internal control, taking appropriate
and timely corrective actions as needed.
To this end, a Group’s Risk Methodology had been issued
to the heads of the Group’s business units who will
identify the risks inherent to their respective business
units and the appropriate measures and strategies to
achieve the overall objectives of the business units.
A database of strategic risks identified and appropriate
controls has been created and the information filtered to
produce a detailed risk register/scorecard and individual
risk profiles for the respective business units, which is
continuously updated.
Key risks to each business unit’s objectives aligned with
the Group’s strategic objectives are identified and scored
for likelihood of the risks occurring and the magnitude of
the impact.
Risk Assessment interviews have been conducted by the
Head of Internal Audit Department with the head and
operational managers of the respective business units.
The risks profile of the relevant business units have been
tabled to the Group Risk Management Committee with
highlights on the key business risk, their causes and
management action plans thereon.
Any major changes to risk or emerging significant risk for
any of the business units in the Group with the appropriate
actions and/or strategies to be taken will be brought to the
attention of the Board by the Managing Director.
Internal Control
The Board places emphasis on a sound system of internal
control to facilitate the effective and efficient operation
of the Group’s businesses by enabling the Board and the
management to respond promptly and appropriately to
any significant business, operational, compliance and
other risks in the achieving of the Group’s objectives.
Never theless, the Board also recognises that the
system of internal control can only reduces, but
cannot eliminate, the possibility of poor judgement in
decision-making; human error; control processes being
deliberately circumvented by employees and others;
management overriding controls; and the occurrence
of unforeseeable circumstances. As such, the Board
reiterates that the system of internal control, by its
nature, can only provide reasonable but not absolute
assurance against material loss or against the Group
failing to achieve its objectives.
Annual Report 2012 63
Statement on Risk Management and Internal Control
Internal Control (continued)
The key elements of the Group’s internal control system
are described below:
Clearly defined delegation of responsibilities to
committees of the full Board and to operating units,
including authorisation levels for all aspects of the
business.
Documented internal procedures and/or processes
of individual business units, where applicable, which
include processes to generate timely, relevant and
reliable information and proper record keeping
as well as compliances with applicable laws and
regulations and internal policies for the conduct of
business.
R e g u l a r i n t e r n a l a u d i t v i s i t s w h i c h m o n i t o r
compliance with procedures and assess the integrity
of financial information.
Regular and comprehensive information provided to
management, covering financial performance and
key business indicators.
A detailed budgeting process where operating units
prepare budgets for the coming year which are
approved both at operating unit level and by the full
Board.
A monthly monitoring of results against budget, with
major variances being followed up and management
action taken, where necessary.
Regular visits to operating units by senior management
whenever appropriate.
Regular review of business processes to assess the
effectiveness of internal controls by the Internal
Audit Department and the highlighting of significant
risks impacting the Group to the Audit Committee.
Annual internal audit plan is reviewed by the Audit
Committee.
In the presence of the Managing Director, Finance
Director and Chief Financial Officer for the purpose
of ascertaining the state of internal control and to
obtain assurance of the internal control system as
to its effectiveness and adequacies in all material
aspects, the Audit Committee reviews and holds
discussion on significant internal control issues
identified in reports prepared by the Internal Audit
Department.
Code of Conduct as set out in the Board Charter.
Internal Audit Function
The Group has an in-house Internal Audit Department
which is independent of the activities or operations
of other operating units in the Group, which provides
the Audit Committee and the Board with much of
the assurance it requires regarding the adequacy and
integrity of the system of internal control.
The head of Internal Audit Department is a member of
Malaysian Institute of Accountants and The Institute of
Internal Auditors of Malaysia and he is assisted by a team
of qualified personnels.
The internal audit functions of the department are
carried out using a risk based, systematic and disciplined
approach, guided by the standards recommended by
recognized professional bodies.
The head of internal audit, whenever deemed necessary,
meet with the Audit Committee without the management
being present.
The head of internal audit has direct access to the
chairman of the board and to the committee.
Its principal responsibility is to undertake regular and
systematic reviews of the system of internal controls,
risk management and governance processes so as to
provide reasonable assurance that such system operates
satisfactorily and effectively within the Company and
the Group and reports to the Audit Committee on a
quarterly basis.
Internal audit strategy and a detailed annual internal
audit plan are presented to the Audit Committee for
approval. The internal audit function adopts a risk-based
approach and prepares its audit strategy and plan based
on the risk profiles of the business units of the Group.
HAP SENG CONSOLIDATED BERHAD
Annual Report 201264
Statement on Risk Management and Internal Control
Internal Audit Function (continued)
The activities of the Internal Audit Department that were
carried out are as follows:
Undertook internal audit based on the audit plan
that had been reviewed and approved by the Audit
Committee which includes the review of operational
and environmental compliance with established
internal control procedures, management efficiency,
risk assessment and reliability of financial records as
well as governance processes.
Attended business review meetings held regularly
by the Group’s senior management to keep abreast
wi th the s t ra tegic and operat iona l p lanning
and development issues. Discussions relating to
strategic business risks in particular are recorded
and forwarded to the members of the Group Risk
Management Committee.
Conducted investigations with regard to various
specific areas of concern as directed by the Audit
Committee and the management.
Formalised approach towards risk assessment in
compliance with the guidance on the “Statement on
Risk Management and Internal Control: Guidelines
for Directors of Listed Issuers” which was issued by
the Task Force on Internal Control with the support
and endorsement of Bursa Securities and to facilitate
enhancement, where appropriate.
Assessment of key business risks at each business
units which were identified by risk analysis and
continuous monitor ing of control compliance
through data extraction and analysis techniques.
Faci l i tated strategic business r isks assessment
covering the Group’s Plantations, Property Holding
& Development, Credit Financing, Automotive,
Fertilizers Trading and Quarry and Building Materials
Divisions.
Issued a total of thirty-seven (37) internal audit reports
to the Audit Committee on the major business units
which encompassed identification and assessment of
business risks.
The total costs incurred for the Internal Audit
Department in respect of the financial year ended 31
December 2012 was approximately RM2.5 million.
Annual Report 2012 65
Statement on Risk Management and Internal Control
Other Risks and Control Processes
Apart from risk assessment and internal audit, the
Group also has in place an organisational structure with
defined lines of responsibility, delegation of authority
and a process of hierarchical reporting. The existence
of formalised Limits of Authority which provides the
authority limits of the employees in the approval of
various transactions and an Employees Handbook
which highlights policies on Group’s objectives, terms
and conditions of employment, remuneration, training
and development, per formance review, safety and
misconduct are relevant across the Group’s operations.
The Board is also supported by Board Committees with
specific delegated responsibilities. These Committees
have the authority to examine all matters within
their scope and responsibilities, as provided in the
Board Charter, and report to the Board with their
recommendations. (For more details on the various
Committees, please refer to the Statement on Corporate
Governance on pages 66 to 72 in this annual report).
The Managing Director repor ts to the Board on
signif icant changes in the business and external
environment which can affect significant risks. The Board
is provided with financial information on a quarterly
basis which includes key performance and risk indicators
and amongst others, the monitoring of results against
budget.
CONCLUSION
Based on the foregoing as well as the inquiries and
information provided, the Board is assured that the
risk management process, system of internal control
and other processes put in place through its Board
Committees were operating adequately and effectively
in all material aspects to meet the Group’s objectives for
the year under review and up to the date of approval of
this Statement on Risk Management and Internal Control.
REVIEW OF THE STATEMENT BY EXTERNAL
AUDITORS
As required by paragraph 15.23 of the Listing Requirements,
the external auditors have reviewed this Statement on
Risk Management and Internal Control. Their review was
performed in accordance with Recommended Practice
Guide 5 (RPG 5) issued by the Malaysian Institute of
Accountants. Based on their review, the external auditors
have reported to the Board that nothing has come to their
attention that causes them to believe that this Statement
is inconsistent with their understanding of the process
the Board has adopted in the review of the adequacy and
integrity of internal control of the Group.
HAP SENG CONSOLIDATED BERHAD
Annual Report 201266
Board Committees
AUDIT COMMITTEE
Members of the Audit Committee
Dato’ Jorgen Bornhoft (Independent Non-Executive Director) – Chairman
Dato’ Mohammed Hussein (Independent Non-Executive Director) – appointed on 1 January 2013
Mr. Tan Ghee Kiat (Independent Non-Executive Director) – appointed on 1 January 2013
Datuk Simon Shim Kong Yip, JP (Non-Independent Non-Executive Director)
Datuk Henry Chin Poy-Wu (Independent Non-Executive Director) – resigned on 31 December 2012
Mr. Lau Teong Jin (Independent Non-Executive Director) – resigned on 31 December 2012
Terms of Reference of Audit Committee
Membership
The Committee shall be appointed by the Board
from amongst the directors of the Company on the
recommendation of the Nominating Committee
and shall consist of not less than 3 members. All the
Audit Committee members must be non-executive
directors with a majority of them being independent
directors.
A member shall not have any family relationship with
any executive director or any related company or
relationship which would interfere with independent
judgment.
Independent director shall be one who fulfills the
requirement as provided in Listing Requirements.
At least one member of the Audit Committee shall be
a member of the Malaysian Institute of Accountants
or a person approved under Section 15.09(1)(c)(ii) and
(iii) of the Listing Requirements.
No alternate director shall be appointed as a member
of the Audit Committee.
The chairman of the Committee who shall be
an independent director shall be elected by the
members of the Committee.
In the event the number of Audit Committee
members are less than the required number of 3
due to resignation or for any reason ceases to be a
member, the Board shall within 3 months appoint
new member(s) to fill up the vacancy. All members
of Audit Committee shall hold office until otherwise
determined by the Board or until they cease to be a
director of the Company.
Attendance at Meetings
The quorum necessar y for the transactions of
business shall be 2 members.
The company secretary shall act as the secretary of
the Committee.
Frequency of Meetings
The Audit Committee shall meet as often as it requires
but at least once for every financial quarter.
During the FY 2012, 4 meetings were held. The details of
directors’ attendance at these meetings are as follows:
Directors No. of Meetings
Dato’ Jorgen Bornhoft 4/4
Datuk Simon Shim Kong Yip, JP 4/4
Datuk Henry Chin Poy-Wu
(resigned on 31 December 2012)
4/4
Mr. Lau Teong Jin
(resigned on 31 December 2012)
4/4
Dato’ Mohammed Hussein
(appointed on 1 January 2013)
– *
Mr. Tan Ghee Kiat
(appointed on 1 January 2013)
– *
* Appointed as members of the Audit Committee subsequent to
the FY 2012.
The details of training by the above directors are
tabulated on pages 54 to 55 of the annual report.
Annual Report 2012 67
Board Committees
Proceedings of Meetings
In the absence of the chairman, the Committee shall
appoint one of the independent members present to
chair the meeting.
Questions arising at any meeting where a quorum is
present shall be decided by a majority of votes of the
members present, each member having 1 vote.
Scope of Authority
The chairman of the Audit Committee may engage
on a continuous basis with senior management such
as the chairman of the Board, the managing director,
the group finance director, chief financial officer,
head of internal audit department and the external
auditors in order to be kept informed of matters
affecting the Company.
The Committee is authorised by the Board to
investigate any activity within its terms of reference.
It is authorised to seek any information it requires
from any employee and all employees are required to
comply with any request made by the Committee.
The Committee is authorised by the Board to obtain
outside legal or other independent professional
advice and to secure the attendance of outsiders
with relevant experience and expertise if it considers
necessary.
The terms of reference of the Audit Committee
shall not limit in any way the responsibilities and
authorities of the managing director to institute or
instruct internal audits and reviews to be undertaken
from time to time.
The chairman of Audit Committee, upon the request
of the external auditor, shall convene a meeting of
the committee to consider any matter which the
external auditors believe should be brought to the
attention of the directors or shareholders.
The Committee may invite other directors, any
employee and a representative of the external
auditors to attend any particular Audit Committee
meeting, specific to the relevant meeting(s). The
group finance director, chief financial officer and
the head of internal audit department, upon the
invitation by the Committee, normally attend the
meeting(s).
Primary Responsibilities of the Audit Committee
Assisting the Board in the discharge of its statutory
duties and responsibilities in the following areas:
To monitor the integrity of the Group’s financial
statements, review its annual accounts and quarterly
results to be released to Bursa Securities and any
other announcements relating to the Group’s financial
performance as well as significant financial reporting
issues.
To review the effectiveness of the Group’s internal
controls and r isk management systems and to
review and approve statement to be include in the
annual report concerning internal controls and risk
management.
To review and report to the Board any related party
transaction and conflict of interest situation that may
arise within the Group including any transaction,
procedure or course of conduct that raises questions
of management integrity.
To monitor and review the effectiveness of the
Group’s internal audit function in the context of the
Group’s overall risk management system.
To approve the appointment and removal of the head
of the internal audit function.
To consider and approve the remit of the internal
audit function and ensure it has adequate resources
and appropriate access to information to enable it
to perform its function effectively and in accordance
with the relevant professional standards, particularly
to ensure that the internal audit function has
adequate standing and is free from management or
other restrictions.
To review and assess the annual internal audit master
plan.
To review promptly all reports on the Group from the
internal auditors.
To r e v i e w a n d m o n i t o r t h e m a n a g e m e n t ’s
responsiveness to the findings and recommendations
of the internal auditor.
HAP SENG CONSOLIDATED BERHAD
Annual Report 201268
Board Committees
Primary Responsibilities of the Audit Committee (continued)
To meet the head of the internal audit whenever
deemed necessary, to discuss their remit and any
issues arising from the internal audits carried out
without management being present. The head of
internal audit shall be given the right of direct access
to the chairman of the Board and to the Committee.
To consider and make recommendations to the Board
in relation to the appointment, reappointment or
removal of the company’s external auditors, so that
the same could be put to shareholders for approval
at the annual general meeting.
To oversee the selection process of new auditors and
if an auditor resigns, to investigate the issues to the
resignation.
To oversee the relationship with the external auditor
including:
Approval of their remuneration;
Approval of their terms of engagement;
Assessing annually their independence and
objectivity taking into account the regulatory
requirements and the relationship with the auditor
as a whole;
Formulating a policy governing the provision of
non-audit services by the external auditor and
regularly monitoring the compliance therewith;
and
Assessing annually their qualifications, expertise
and resources and the effectiveness of the audit
process.
To review with the external auditors, the audit plan,
their evaluation of the system of internal controls, the
audit report and any issues arising from the audit.
To meet regularly with the external auditors, at least
twice a year, without management being present,
to discuss their remit and any issues arising from the
audit, including the adequacy of the assistance given
by the employees of the Company to the external
auditors.
To review the quarterly and year end financial
statements before tabling to the Board focusing
particularly on:
any changes in accounting policies and practices,
significant adjustments arising from the audit and
other unusual events (if any),
compliance with Accounting Standards, relevant
legislative framework and other legal requirements,
compliance with the Listing Requirements and all
other applicable rules and regulations.
Review of the Audit Committee
The term of office and performance of the Committee
and each member shall be reviewed by the Board at
least once every 3 years to determine whether the Audit
Committee and its members have carried out their duties
effectively in accordance with their terms of reference.
Annually the Nominating Committee will evaluate
performance of the board committees collectively as
well as performance of members individually.
Reporting Procedures
The chairman of the Committee will brief the Board
on the various deliberations and/or issues of concern
raised during the course of meeting together with a
list of recommendations and/or other matters for the
deliberation of the Board.
Secretary shall circulate the minutes of meetings of the
Committee to all members of the Board.
Annual Report 2012 69
Board Committees
Reporting of Breaches to the Bursa Securities
The Audit Committee is to report promptly to Bursa
Securities on any matter reported to the Board which has
not been satisfactorily resolved resulting in a breach of
the Listing Requirements.
Summary of Audit Committee Activities during the FY 2012
The activities of the Audit Committee during the FY
2012, are summarised below:
Reviewed internal audit plan for the financial year
which includes review of operational compliance
with established control procedures, management
efficiency, risk assessment and reliability of financial
records.
Authorised internal audit department to undertake
specific investigation on specific areas of concern,
reviewed outcome of investigation and deliberated
on appropriate actions and/or recommendations
arising therefrom.
Received and reviewed a total of 37 internal audit
reports covering the business processes of the
Group’s plantations, property holding & development,
credit financing, automotive, fertilizers trading and
quarry and building materials divisions.
R e v i e w e d a n n u a l a u d i t p l a n s o f t h e G r o u p
and Company with the external auditors and
recommendation of their audit fees to the Board.
Reviewed and discussed annual audited financial
statements with the external auditors prior to
recommending the same to the Board for approval;
after noting specific points or pertinent issues raised
by the external auditors.
T h e A u d i t C o m m i t t e e h e l d 2 s e p a r a t e a n d
independent meetings with the external auditors
in the absence of the executive board members
and management representatives during which the
external auditors informed that they had received
full co-operation from the management as well as
unrestricted access to all information required for
purpose of their audit and there were no special audit
concerns to be highlighted to the Audit Committee.
Reviewed the suitabil ity and independence of
external auditors and have received written assurance
from external auditors confirming that they are, and
have been, independent throughout the conduct
of the audit engagement in accordance with the
terms of all relevant professional and regulatory
requirements.
Reviewed the Group’s quarterly report prepared in
compliance with Financial Reporting Standard (“FRS”)
134 “Interim Financial Reporting” and Chapter 9 of
the Listing Requirements and press announcements
( i f any) pr ior to submiss ion to the Board for
consideration and approval where the chairman
of the Audit Committee will brief the Board on the
pertinent points and the recommendations of the
Audit Committee.
Reviewed and considered the disclosure of related
party transactions in the financial statements and
the recurrent related party transactions circular to
shareholders.
Reviewed the Statement on Corporate Governance
and Statement on Risk Management and Internal
Control prepared in accordance with the principles
set out under the Malaysian Code on Corporate
Governance 2012, the extent of compliance with the
said Code and recommended to the Board action
plans to address identified gaps (if any) between the
Group’s existing corporate governance practices and
the prescribed corporate governance principles and
recommendations under the Code.
HAP SENG CONSOLIDATED BERHAD
Annual Report 201270
Board Committees
REMUNERATION COMMITTEE
The Remuneration Committee was set up on 27 March 2001 and presently its members are as
follows:
Dato’ Jorgen Bornhoft (Independent Non-Executive Director) – Chairman
Datuk Simon Shim Kong Yip, JP (Non-Independent Non-Executive Director)
Datuk Edward Lee Ming Foo, JP (Executive Director)
Datuk Henry Chin Poy-Wu (Independent Non-Executive Director) – resigned on 31 December 2012
Terms of Reference of Remuneration Committee
Membership
The Committee shall be appointed by the Board from
amongst the directors of the Company upon the
recommendation of the Nominating Committee and
shall consist not less than 3 directors, a majority of whom
must be non-executive.
Frequency of Meetings
The Remuneration Committee shall meet as often as it
requires but at least once per financial year.
Attendance at Meetings
The quorum necessary for the transaction of business shall
be 2 members and decisions are by majority votes.
Proceeding of Meetings
The chairman of the Committee may invite personnel
such as the chief executives of the business division,
the head of the human resources department as and
when appropriate and necessary.
In the absence of the chairman, the Remuneration
Committee shall appoint one of the non-executive
members present to chair the meeting.
Questions arising at any meeting where a quorum is
present shall be decided by a majority of votes of the
members present, each member having 1 vote.
Reporting Procedure
The secretary shall circulate the minutes of meetings of the
Remuneration Committee to all members of the Board.
Scope of Authority
The Remuneration Committee does not have the
delegated authority from the Board to implement
its recommendations but is obliged to report its
recommendations to the full Board for its consideration
and implementation.
Interest of Remuneration Committee Members
Members of the Remuneration Committee shall not
participate or be involved in the deliberations or
discussions of their own remuneration.
The remuneration of the non-executive directors shall be
a matter for the executive members of the Board.
Primary Responsibilities of Remuneration Committee
To determine and agree with the Board the broad
policy for the remuneration of the executive directors
of the Company, after taking into account all relevant
factors to ensure that the executive directors
are adequately incentivized and remunerated to
encourage enhance performance.
To constantly review the ongoing appropriateness
and relevance of the remuneration policy.
Within the terms of the agreed policy and in
consultation with the chairman, to determine the
total individual remuneration package of each
executive director including bonuses and yearly
increment.
Summary of Activities
The Remuneration Committee met on 29 November
2012:
To review the remuneration policy of the Group and
noted the industry forecast for 2012/2013 for the
average salary increment; and
To recommend to the Board, the proposed bonus of
the executive directors for the financial year ended
31 December 2012 and their respective proposed
increments for the financial year commencing from 1
January 2013.
Annual Report 2012 71
Board Committees
NOMINATING COMMITTEE
The Nominating Committee was set up on 27 March 2001 and presently its members are as follows:
Dato’ Jorgen Bornhoft (Independent Non-Executive Director) – Chairman
Datuk Simon Shim Kong Yip, JP (Non-Independent Non-Executive Director)
Dato’ Mohammed Hussein (Independent Non-Executive Director) – appointed on 1 January 2013
Datuk Henry Chin Poy-Wu (Independent Non-Executive Director) – resigned on 31 December 2012
Terms of Reference of Nominating Committee
Membership
The Committee shall be appointed by the Board from
amongst the directors of the Company of not less
than 3 non-executive directors, a majority of whom
are independent.
The chairman of the Committee is also the senior
independent director of the Company.
Frequency of Meetings
The Nominating Committee shall meet as often as it
requires but at least once per financial year.
Attendance at Meetings
The quorum necessary for the transaction of business
shall be 2 members and decisions are by majority votes.
Proceeding of Meetings
The Committee shall have access to suff icient
resources to facilitate the carrying out of its duties,
including obtaining, at the Company’s expense,
outside legal or other professional advice on any
matters within its term of reference.
In the absence of the chairman, the Nominating
Committee shall appoint one of the independent
non-executive members present to chair the meeting.
Questions arising at any meeting where a quorum is
present shall be decided by a majority of votes of the
members present, each member having 1 vote.
Reporting Procedure
The secretary shall circulate the minutes of meetings of
the Nominating Committee to all members of the Board.
Scope of Authority
The Nominat ing Committee does not have the
delegated authority from the Board to implement
its recommendations but is obliged to report its
recommendations to the full Board for its consideration
and implementation. The actual decision as to who shall
be appointed is the responsibility of the full Board after
considering the recommendations of the Committee.
Primary Responsibilities of Nominating Committee
To consider and recommend candidates onto the
Board and board committees and guided by the
selection cr iter ia amongst others are integrity
and professionalism, expertise and experience,
independence and objectivity, personal attributes,
dedication and commitment and board diversity.
Details of the selection criteria is set out in the Board
Charter.
To annually evaluate performance of the Board and
board committees collectively as well as performance
of members individually.
To f a c i l i t a t e b o a r d i n d u c t i o n a n d t r a i n i n g
programmes.
Assessing directors’ training needs periodically
and devising relevant professional development
p ro gr a m m e s b a s e d o n s u c h a s s e s s m e n t fo r
recommendation to the Board.
To develop a proper succession plan for the Board so
as to ensure a smooth transition when directors leave
the Board, and that positions are filled and skill gaps
addressed.
To monitor and recommend the functions to be
undertaken by the various board committees.
To review and reassess the adequacy of the Board
Charter and Code of Conduct annually.
HAP SENG CONSOLIDATED BERHAD
Annual Report 201272
Board Committees
Primary Responsibilities of Nominating Committee (continued)
To evaluate the independence of each independent
director on a year ly basis. In this regard, the
Committee is guided by the criteria as set out in the
Board Charter.
To recommend directors for reappointment or re-
election subject to satisfactory outcome of the
evaluation of their performance.
Summary of Activities
Reviewed the current Audit Committee size and
composition and was of the view that the members
were aptly qualified to discharge their respective
duties and responsibilities after taking into account
their professional qualifications and experiences.
Reviewed the current Remuneration Committee
size and composition and was satisfied that the
Remuneration Committee was effective in the
discharge of its function.
Evaluated the performance of each Board and board
committees collectively as well as per formance
of members individually and was satisfied that all
members of the Board are suitably qualified to
hold their positions as directors in view of their
respective academic and professional qualifications,
competencies, exper iences, commitment and
contribution to the Board.
Reviewed the adequacy of the Board Charter for
adoption by the Board.
Rev iewed that a l l d i rec tors o f the Company
had received appropr iate continuous training
p ro g r a m m e s i n o rd e r t o k e e p a b re a s t w i t h
developments in the relevant industry to enhance
their sk ills in a dynamic and complex business
environment and with changes in the relevant
statutory and regulatory requirements.
Evaluated the independence of each independent
director taking into account both the quantitative
and qua l i ta t ive c r i te r ion . I n addi t ion a l l the
independent directors at the date of this annual
report has served in the Board with a tenure less than
the term of 9 years.
Eva luated the per for mance of the fo l lowing
independent directors standing for reappointment
and/or re-election at the annual general meeting:–
(i) Dato’ Jorgen Bornhoft on his reappointment
pursuant to Section 129(6) of the Companies Act,
1965
(ii) Mr. Tan Ghee Kiat on his re-election pursuant to
Article 97 of the Company’s articles of association
Recommended the appointment of Dato’ Jorgen
Bornhoft as a senior independent director of the
Company on 1 January 2013.
Recommended the redesignation of Lt. Gen. (R)
Datuk Abdul Aziz Bin Hasan as an independent non-
executive director of the Company on 29 November
2012.
Noted the resignation of Datuk Henry Chin Poy-Wu of
the following positions on 31 December 2012.
(i) member of the Board;
(ii) member of Audit Committee;
(iii) member of Remuneration Committee;
(iv) member of Nominating Committee; and
(v) senior independent non-executive director
Noted the resignation of Mr. Lau Teong Jin as a
member of Audit Committee and a director of the
Company on 31 December 2012.
Recommended the appointment of Mr. Tan Ghee Kiat
as a member of Audit Committee on 1 January 2013.
Recommended the appointment of Dato’ Mohammed
Hussein as a member of Audit Committee and
Nominating Committee on 1 January 2013.
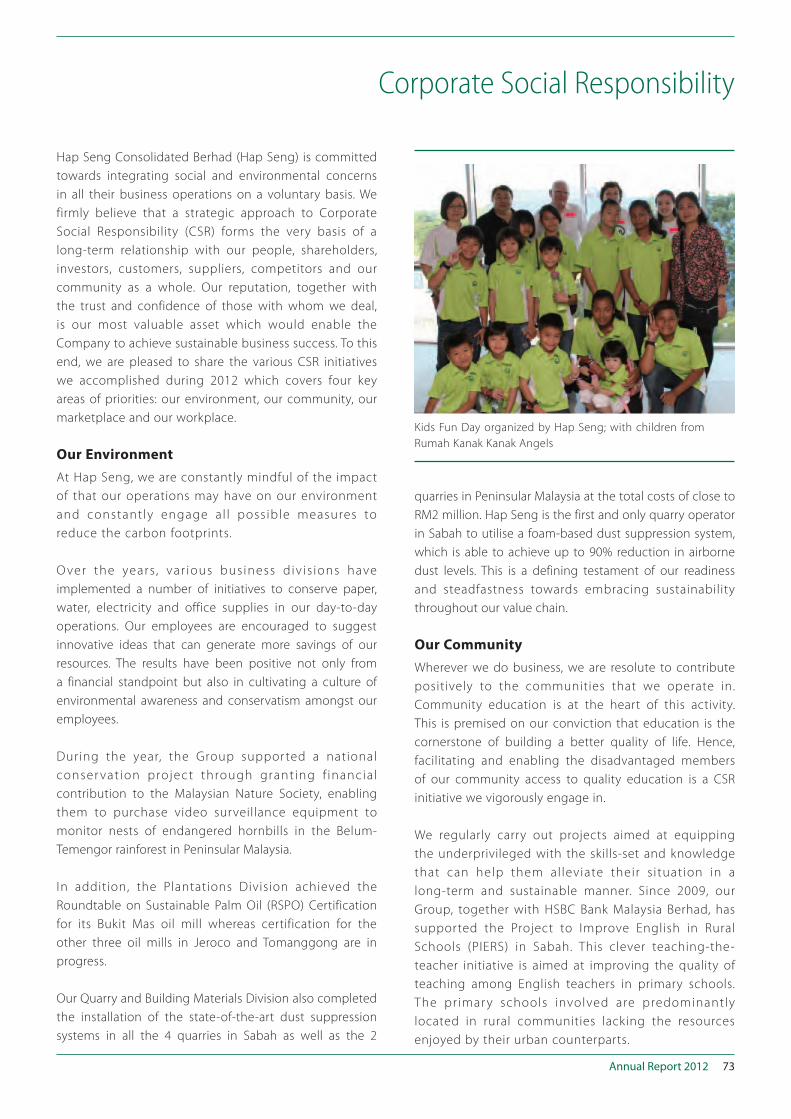
Annual Report 2012 73
Corporate Social Responsibility
Hap Seng Consolidated Berhad (Hap Seng) is committed
towards integrating social and environmental concerns
in all their business operations on a voluntary basis. We
firmly believe that a strategic approach to Corporate
Social Responsibility (CSR) forms the very basis of a
long-term relationship with our people, shareholders,
investors, customers, suppliers, competitors and our
community as a whole. Our reputation, together with
the trust and confidence of those with whom we deal,
is our most valuable asset which would enable the
Company to achieve sustainable business success. To this
end, we are pleased to share the various CSR initiatives
we accomplished during 2012 which covers four key
areas of priorities: our environment, our community, our
marketplace and our workplace.
Our Environment
At Hap Seng, we are constantly mindful of the impact
of that our operations may have on our environment
and constantly engage al l possible measures to
reduce the carbon footprints.
O ver the years , var ious bus iness d iv is ions have
implemented a number of initiatives to conserve paper,
water, electricity and office supplies in our day-to-day
operations. Our employees are encouraged to suggest
innovative ideas that can generate more savings of our
resources. The results have been positive not only from
a financial standpoint but also in cultivating a culture of
environmental awareness and conservatism amongst our
employees.
During the year, the Group supported a national
conser vat ion project through grant ing f inancia l
contribution to the Malaysian Nature Society, enabling
them to purchase video surveillance equipment to
monitor nests of endangered hornbills in the Belum-
Temengor rainforest in Peninsular Malaysia.
In addition, the Plantations Division achieved the
Roundtable on Sustainable Palm Oil (RSPO) Certification
for its Bukit Mas oil mill whereas certification for the
other three oil mills in Jeroco and Tomanggong are in
progress.
Our Quarry and Building Materials Division also completed
the installation of the state-of-the-art dust suppression
systems in all the 4 quarries in Sabah as well as the 2
quarries in Peninsular Malaysia at the total costs of close to
RM2 million. Hap Seng is the first and only quarry operator
in Sabah to utilise a foam-based dust suppression system,
which is able to achieve up to 90% reduction in airborne
dust levels. This is a defining testament of our readiness
and steadfastness towards embracing sustainability
throughout our value chain.
Our Community
Wherever we do business, we are resolute to contribute
positively to the communities that we operate in.
Community education is at the heart of this activity.
This is premised on our conviction that education is the
cornerstone of building a better quality of life. Hence,
facilitating and enabling the disadvantaged members
of our community access to quality education is a CSR
initiative we vigorously engage in.
We regularly carry out projects aimed at equipping
the underprivileged with the skills-set and knowledge
that can help them al leviate their s ituation in a
long-term and sustainable manner. Since 2009, our
Group, together with HSBC Bank Malaysia Berhad, has
supported the Project to Improve English in Rural
Schools (PIERS) in Sabah. This clever teaching-the-
teacher initiative is aimed at improving the quality of
teaching among English teachers in primary schools.
The pr imar y schools involved are predominantly
located in rural communities lacking the resources
enjoyed by their urban counterparts.
Kids Fun Day organized by Hap Seng; with children from
Rumah Kanak Kanak Angels
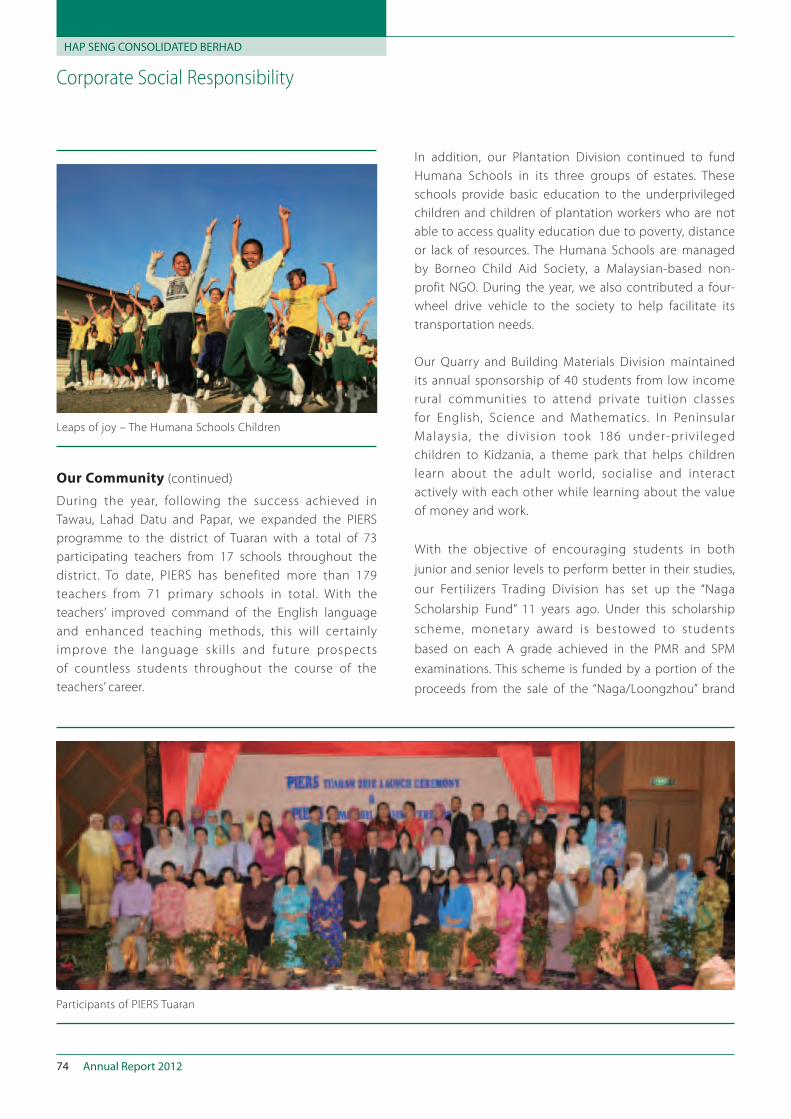
HAP SENG CONSOLIDATED BERHAD
Annual Report 201274
Corporate Social Responsibility
Our Community (continued)
During the year, following the success achieved in
Tawau, Lahad Datu and Papar, we expanded the PIERS
programme to the district of Tuaran with a total of 73
participating teachers from 17 schools throughout the
district. To date, PIERS has benefited more than 179
teachers from 71 primary schools in total. With the
teachers’ improved command of the English language
and enhanced teaching methods, this will certainly
improve the language sk il ls and future prospects
of countless students throughout the course of the
teachers’ career.
In addition, our Plantation Division continued to fund
Humana Schools in its three groups of estates. These
schools provide basic education to the underprivileged
children and children of plantation workers who are not
able to access quality education due to poverty, distance
or lack of resources. The Humana Schools are managed
by Borneo Child Aid Society, a Malaysian-based non-
profit NGO. During the year, we also contributed a four-
wheel drive vehicle to the society to help facilitate its
transportation needs.
Our Quarry and Building Materials Division maintained
its annual sponsorship of 40 students from low income
rural communities to attend private tuition classes
for English, Science and Mathematics. In Peninsular
Malaysia , the divis ion took 186 under-pr iv i leged
children to Kidzania, a theme park that helps children
learn about the adult world, socialise and interact
actively with each other while learning about the value
of money and work.
With the objective of encouraging students in both
junior and senior levels to perform better in their studies,
our Fertilizers Trading Division has set up the “Naga
Scholarship Fund” 11 years ago. Under this scholarship
scheme, monetary award is bestowed to students
based on each A grade achieved in the PMR and SPM
examinations. This scheme is funded by a portion of the
proceeds from the sale of the “Naga/Loongzhou” brand
Leaps of joy – The Humana Schools Children
Participants of PIERS Tuaran
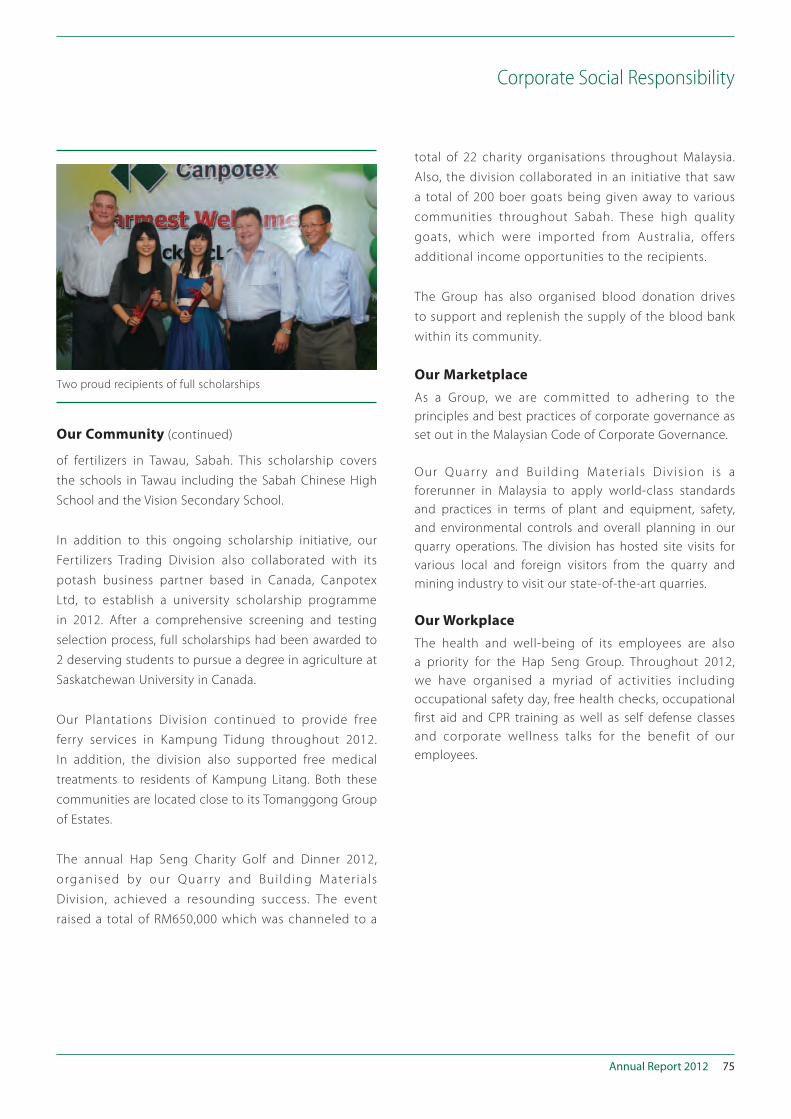
Annual Report 2012 75
Corporate Social Responsibility
of fertilizers in Tawau, Sabah. This scholarship covers
the schools in Tawau including the Sabah Chinese High
School and the Vision Secondary School.
In addition to this ongoing scholarship initiative, our
Fertilizers Trading Division also collaborated with its
potash business partner based in Canada, Canpotex
Ltd, to establish a university scholarship programme
in 2012. After a comprehensive screening and testing
selection process, full scholarships had been awarded to
2 deserving students to pursue a degree in agriculture at
Saskatchewan University in Canada.
Our Plantations Division continued to provide free
ferry services in Kampung Tidung throughout 2012.
In addition, the division also supported free medical
treatments to residents of Kampung Litang. Both these
communities are located close to its Tomanggong Group
of Estates.
The annual Hap Seng Charity Golf and Dinner 2012,
organised by our Quarr y and Bui lding Mater ia ls
Division, achieved a resounding success. The event
raised a total of RM650,000 which was channeled to a
total of 22 charity organisations throughout Malaysia.
Also, the division collaborated in an initiative that saw
a total of 200 boer goats being given away to various
communities throughout Sabah. These high quality
goats, which were imported from Australia, offers
additional income opportunities to the recipients.
The Group has also organised blood donation drives
to support and replenish the supply of the blood bank
within its community.
Our Marketplace
As a Group, we are committed to adhering to the
principles and best practices of corporate governance as
set out in the Malaysian Code of Corporate Governance.
Our Quarr y and Bui ld ing Mater ia ls Div is ion is a
forerunner in Malaysia to apply world-class standards
and practices in terms of plant and equipment, safety,
and environmental controls and overall planning in our
quarry operations. The division has hosted site visits for
various local and foreign visitors from the quarry and
mining industry to visit our state-of-the-art quarries.
Our Workplace
The health and well-being of its employees are also
a priority for the Hap Seng Group. Throughout 2012,
we have organised a myriad of activities including
occupational safety day, free health checks, occupational
first aid and CPR training as well as self defense classes
and corporate wellness talks for the benefit of our
employees.
Two proud recipients of full scholarships
Our Community (continued)
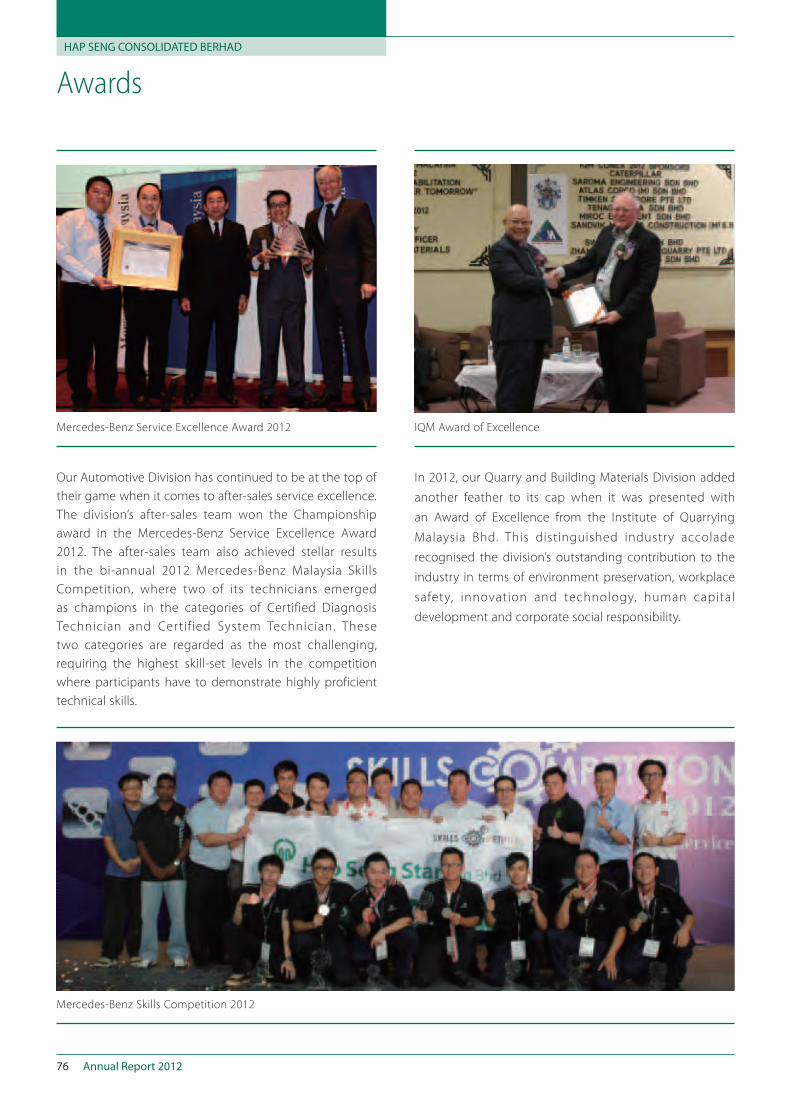
HAP SENG CONSOLIDATED BERHAD
Annual Report 201276
Awards
Our Automotive Division has continued to be at the top of
their game when it comes to after-sales service excellence.
The division’s after-sales team won the Championship
award in the Mercedes-Benz Service Excellence Award
2012. The after-sales team also achieved stellar results
in the bi-annual 2012 Mercedes-Benz Malaysia Skills
Competition, where two of its technicians emerged
as champions in the categories of Certified Diagnosis
Technician and Certified System Technician. These
two categories are regarded as the most challenging,
requiring the highest skill-set levels in the competition
where participants have to demonstrate highly proficient
technical skills.
In 2012, our Quarry and Building Materials Division added
another feather to its cap when it was presented with
an Award of Excellence from the Institute of Quarrying
Malaysia Bhd. This distinguished industry accolade
recognised the division’s outstanding contribution to the
industry in terms of environment preservation, workplace
safety, innovation and technology, human capital
development and corporate social responsibility.
IQM Award of Excellence
Mercedes-Benz Skills Competition 2012
Mercedes-Benz Service Excellence Award 2012
78 Directors’ Report
84 Statement by Directors
85 Statutory Declaration
86 Independent Auditors’ Report
88 Statements of Financial Position
90 Income Statements
91 Statements of Comprehensive Income
92 Statements of Changes in Equity
94 Statements of Cash Flows
96 Notes to the Financial Statements
178 Supplementary Information
– Disclosure of Realised and Unrealised Profits
Financial Statements
HAP SENG CONSOLIDATED BERHAD
Annual Report 201278
Directors’ Report
The directors have pleasure in presenting their report together with the audited financial statements of the Group and of
the Company for the financial year ended 31 December 2012.
PRINCIPAL ACTIVITIES
The Company is an investment holding company.
The principal activities of the subsidiaries and associates are disclosed in Notes 7 and 8 to the financial statements,
respectively. There have been no significant changes in the nature of these activities during the financial year.
RESULTS
The results of the Group and of the Company for the financial year ended 31 December 2012 are as follows:
Group Company
RM’000 RM’000
Profit before tax 677,107 216,842
Tax expense (190,653) (5,426)
Profit for the year 486,454 211,416
Attributable to:
Owners of the Company 422,632 211,416
Non-controlling interests 63,822 –
Profit for the year 486,454 211,416
In the opinion of the directors, the results of the operations of the Group and of the Company during the financial year
were not substantially affected by any item, transaction or event of a material and unusual nature.
RESERVES AND PROVISIONS
There were no material transfers to or from reserves or provisions during the financial year other than as disclosed in the
financial statements.
ISSUE OF SHARES
There were no changes in the authorised, issued and paid-up share capital of the Company except for the issuance of
shares pursuant to the exercise of warrants as disclosed below.
WARRANTS
The warrants are constituted by the deed poll dated 6 July 2011 [“Deed Poll”].
On 15 August 2011, the 364,392,900 warrants issued free by the Company pursuant to the Rights Issue with Warrants
Exercise on the basis of one (1) warrant for every one (1) rights share subscribed were listed and quoted on the Main
Market of Bursa Securities.
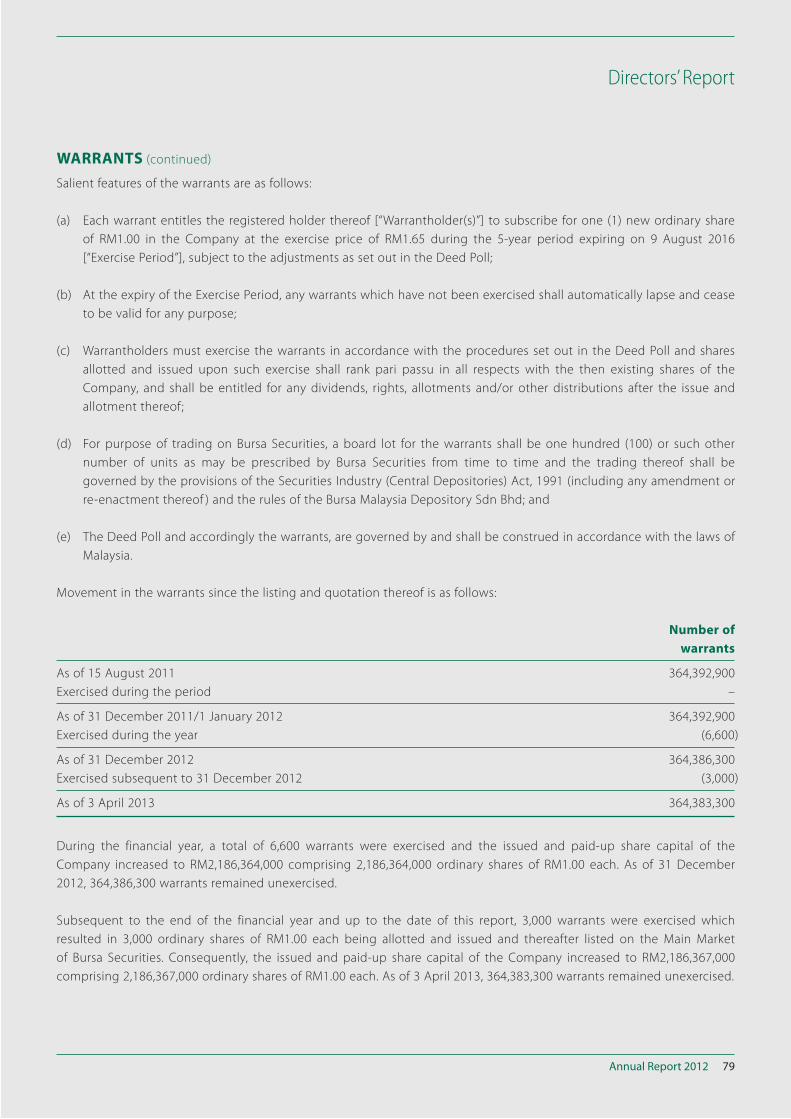
Annual Report 2012 79
Directors’ Report
WARRANTS (continued)
Salient features of the warrants are as follows:
(a) Each warrant entitles the registered holder thereof [“Warrantholder(s)”] to subscribe for one (1) new ordinary share
of RM1.00 in the Company at the exercise price of RM1.65 during the 5-year period expiring on 9 August 2016
[“Exercise Period”], subject to the adjustments as set out in the Deed Poll;
(b) At the expiry of the Exercise Period, any warrants which have not been exercised shall automatically lapse and cease
to be valid for any purpose;
(c) Warrantholders must exercise the warrants in accordance with the procedures set out in the Deed Poll and shares
allotted and issued upon such exercise shall rank pari passu in all respects with the then existing shares of the
Company, and shall be entitled for any dividends, rights, allotments and/or other distributions after the issue and
allotment thereof;
(d) For purpose of trading on Bursa Securities, a board lot for the warrants shall be one hundred (100) or such other
number of units as may be prescribed by Bursa Securities from time to time and the trading thereof shall be
governed by the provisions of the Securities Industry (Central Depositories) Act, 1991 (including any amendment or
re-enactment thereof ) and the rules of the Bursa Malaysia Depository Sdn Bhd; and
(e) The Deed Poll and accordingly the warrants, are governed by and shall be construed in accordance with the laws of
Malaysia.
Movement in the warrants since the listing and quotation thereof is as follows:
Number of
warrants
As of 15 August 2011 364,392,900
Exercised during the period –
As of 31 December 2011/1 January 2012 364,392,900
Exercised during the year (6,600)
As of 31 December 2012 364,386,300
Exercised subsequent to 31 December 2012 (3,000)
As of 3 April 2013 364,383,300
During the financial year, a total of 6,600 warrants were exercised and the issued and paid-up share capital of the
Company increased to RM2,186,364,000 comprising 2,186,364,000 ordinary shares of RM1.00 each. As of 31 December
2012, 364,386,300 warrants remained unexercised.
Subsequent to the end of the financial year and up to the date of this report, 3,000 warrants were exercised which
resulted in 3,000 ordinary shares of RM1.00 each being allotted and issued and thereafter listed on the Main Market
of Bursa Securities. Consequently, the issued and paid-up share capital of the Company increased to RM2,186,367,000
comprising 2,186,367,000 ordinary shares of RM1.00 each. As of 3 April 2013, 364,383,300 warrants remained unexercised.
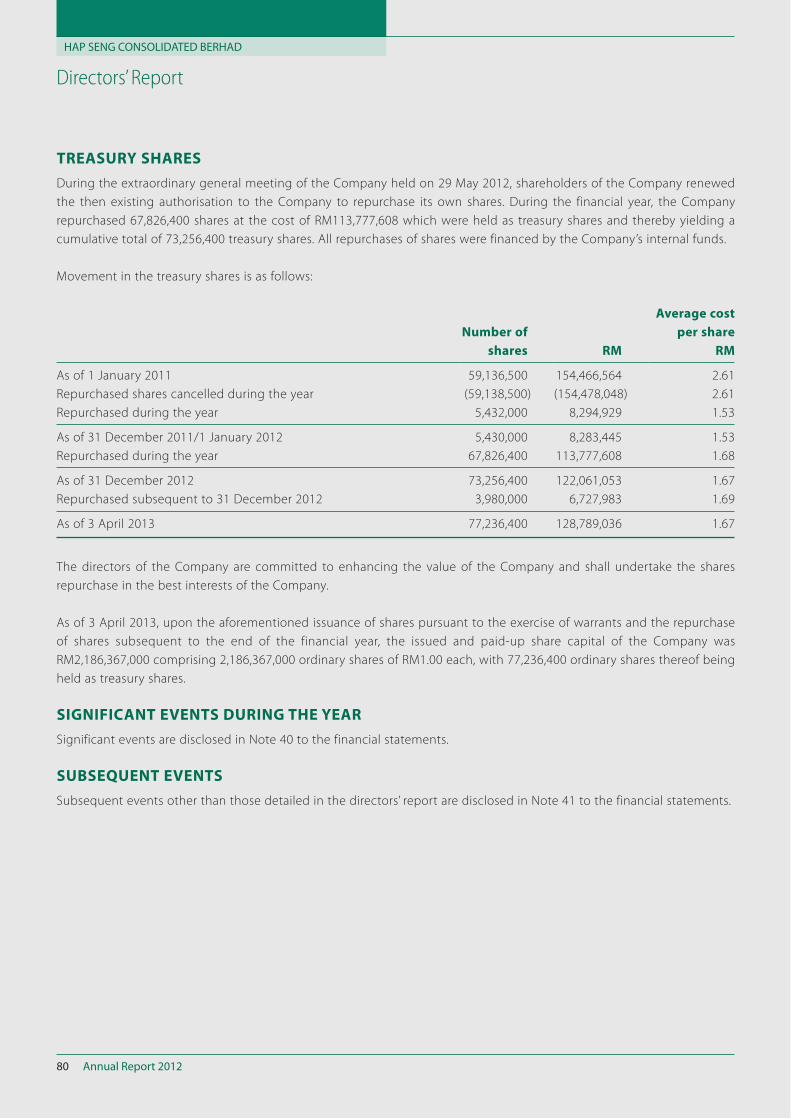
HAP SENG CONSOLIDATED BERHAD
Annual Report 201280
Directors’ Report
TREASURY SHARES
During the extraordinary general meeting of the Company held on 29 May 2012, shareholders of the Company renewed
the then existing authorisation to the Company to repurchase its own shares. During the financial year, the Company
repurchased 67,826,400 shares at the cost of RM113,777,608 which were held as treasury shares and thereby yielding a
cumulative total of 73,256,400 treasury shares. All repurchases of shares were financed by the Company’s internal funds.
Movement in the treasury shares is as follows:
Number of
shares RM
Average cost
per share
RM
As of 1 January 2011 59,136,500 154,466,564 2.61
Repurchased shares cancelled during the year (59,138,500) (154,478,048) 2.61
Repurchased during the year 5,432,000 8,294,929 1.53
As of 31 December 2011/1 January 2012 5,430,000 8,283,445 1.53
Repurchased during the year 67,826,400 113,777,608 1.68
As of 31 December 2012 73,256,400 122,061,053 1.67
Repurchased subsequent to 31 December 2012 3,980,000 6,727,983 1.69
As of 3 April 2013 77,236,400 128,789,036 1.67
The directors of the Company are committed to enhancing the value of the Company and shall undertake the shares
repurchase in the best interests of the Company.
As of 3 April 2013, upon the aforementioned issuance of shares pursuant to the exercise of warrants and the repurchase
of shares subsequent to the end of the financial year, the issued and paid-up share capital of the Company was
RM2,186,367,000 comprising 2,186,367,000 ordinary shares of RM1.00 each, with 77,236,400 ordinary shares thereof being
held as treasury shares.
SIGNIFICANT EVENTS DURING THE YEAR
Significant events are disclosed in Note 40 to the financial statements.
SUBSEQUENT EVENTS
Subsequent events other than those detailed in the directors’ report are disclosed in Note 41 to the financial statements.
Annual Report 2012 81
Directors’ Report
DIVIDENDS
During the financial year, the following dividends were paid by the Company:
RM’000
(i) In respect of the financial year ended 31 December 2011:
– Second interim dividend of 4.7 sen per share under the single tier system approved by
the Board of Directors on 14 February 2012 and paid on 13 March 2012 102,490
(ii) In respect of the financial year ended 31 December 2012:
– First interim dividend of 4.5 sen per share under the single tier system approved by
the Board of Directors on 10 July 2012 and paid on 8 August 2012 97,084
199,574
On 28 February 2013, the Board of Directors approved a second interim dividend of 6.0 sen per share under the single
tier system in respect of the financial year ended 31 December 2012, amounted to RM126,786,636 and was paid on 29
March 2013. The financial statements for the current financial year do not reflect this dividend and will be accounted for
in equity as an appropriation of retained profits in the financial year ending 31 December 2013.
The Board of Directors did not recommend any final dividend to be paid for the financial year ended 31 December 2012.
No dividend is payable for treasury shares held or cancelled.
MATERIAL LITIGATIONS
Details of material litigations are disclosed in Note 34 to the financial statements.
DIRECTORS
The names of the directors of the Company in office since the date of the last report and at the date of this report are:
Dato’ Jorgen Bornhoft
Datuk Edward Lee Ming Foo, JP
Lee Wee Yong
Datuk Simon Shim Kong Yip, JP
Lt. Gen. (R) Datuk Abdul Aziz Bin Hasan
Dato’ Mohammed Bin Haji Che Hussein
Tan Ghee Kiat
Datuk Henry Chin Poy-Wu (resigned on 31 December 2012)
Lau Teong Jin (resigned on 31 December 2012)
HAP SENG CONSOLIDATED BERHAD
Annual Report 201282
Directors’ Report
DIRECTORS’ INTERESTS
According to the register of directors’ shareholdings, the interests of directors in office at the end of the financial year in
shares and warrants in the Company and its related corporations during the financial year were as follows:
Number of ordinary shares of RM1.00 each
Name of director
As at
1.1.2012 Acquired Sold
As at
31.12.2012
Hap Seng Consolidated Berhad
Dato’ Jorgen Bornhoft 180,000 – (80,000) 100,000
Dato’ Mohammed Bin Haji Che Hussein 288,000 – – 288,000
Hap Seng Plantations Holdings Berhad [“HSP”], a listed
subsidiary
Dato’ Jorgen Bornhoft 10,000 – – 10,000
Lee Wee Yong 70,000 – (70,000) –
Datuk Simon Shim Kong Yip, JP 180,000 – – 180,000
Lt. Gen. (R) Datuk Abdul Aziz Bin Hasan 10,000 – (5,000) 5,000
Number of warrants
Name of director
As at
1.1.2012 Acquired Sold
As at
31.12.2012
Hap Seng Consolidated Berhad
Dato’ Jorgen Bornhoft 30,000 – – 30,000
Dato’ Mohammed Bin Haji Che Hussein 48,000 – – 48,000
None of the other directors in office at the end of the financial year had any interest in shares and warrants in the
Company or its related corporations during the financial year.
DIRECTORS’ BENEFITS
Neither at the end of the financial year, nor at any time during that year, did there subsist any arrangement to which
the Company was a party, whereby the directors might acquire benefits by means of the acquisition of shares in or
debentures of the Company or any other body corporate.
Since the end of the previous financial year, no director has received or become entitled to receive a benefit (other than
benefits included in the aggregate amount of emoluments received or due and receivable by the directors as disclosed
in Note 25 to the financial statements) by reason of a contract made by the Company or a related corporation with
any director or with a firm of which the director is a member or with a company in which the director has a substantial
financial interest, other than as disclosed in Note 38 to the financial statements.
HOLDING COMPANY
The holding company is Gek Poh (Holdings) Sdn Bhd, a company incorporated in Malaysia.
Annual Report 2012 83
Directors’ Report
OTHER STATUTORY INFORMATION
(a) Before the income statements, statements of comprehensive income and statements of financial position of the
Group and of the Company were made out, the directors took reasonable steps:
(i) to ascertain that proper action had been taken in relation to the writing off of bad debts and the making of
allowance for impairment of trade and other receivables and satisfied themselves that all known bad debts had
been written off and that adequate allowance for impairment had been made for trade and other receivables;
and
(ii) to ensure that any current assets which were unlikely to realise their values as shown in the accounting records
in the ordinary course of business had been written down to an amount which they might be expected so to
realise.
(b) At the date of this report, the directors are not aware of any circumstances which would render:
(i) the amount written off for bad debts or the amount of the allowance for impairment of trade and other
receivables in the financial statements of the Group and of the Company inadequate to any substantial extent;
and
(ii) the values attributed to the current assets in the financial statements of the Group and of the Company
misleading.
(c) At the date of this report, the directors are not aware of any circumstances which have arisen which would render
adherence to the existing method of valuation of assets or liabilities of the Group and of the Company misleading
or inappropriate.
(d) At the date of this report, the directors are not aware of any circumstances not otherwise dealt with in this report
or financial statements of the Group and of the Company which would render any amount stated in the financial
statements misleading.
(e) As at the date of this report, there does not exist:
(i) any charge on the assets of the Group or of the Company which has arisen since the end of the financial year
which secures the liabilities of any other person; or
(ii) any contingent liability in respect of the Group or of the Company which has arisen since the end of the
financial year.
(f ) In the opinion of the directors:
(i) no contingent liability or other liability has become enforceable or is likely to become enforceable within the
period of twelve months after the end of the financial year which will or may affect the ability of the Group or
of the Company to meet their obligations when they fall due; and
(ii) no item, transaction or event of a material and unusual nature has arisen in the interval between the end of the
financial year and the date of this report which is likely to affect substantially the results of the operations of
the Group or of the Company for the financial year in which this report is made.
AUDITORS
The auditors, Ernst & Young, have expressed their willingness to continue in office.
Signed on behalf of the Board in accordance with a resolution of the directors dated 3 April 2013.
DATO’ JORGEN BORNHOFT DATUK EDWARD LEE MING FOO, JP
HAP SENG CONSOLIDATED BERHAD
Annual Report 201284
Statement by DirectorsPURSUANT TO SECTION 169(15) OF THE COMPANIES ACT, 1965
We, DATO’ JORGEN BORNHOFT and DATUK EDWARD LEE MING FOO, JP, being two of the directors of HAP SENG
CONSOLIDATED BERHAD, do hereby state that, in the opinion of the directors, the accompanying financial statements
set out on pages 88 to 177 are drawn up in accordance with Financial Reporting Standards and the Companies Act,
1965 in Malaysia so as to give a true and fair view of the financial position of the Group and of the Company as at 31
December 2012 and of their financial performance and cash flows for the year then ended.
The information set out in Note 42 to the financial statements on page 178 have been prepared in accordance with the
Guidance on Special Matter No. 1, Determination of Realised and Unrealised Profits or Losses in the Context of Disclosure
Pursuant to Bursa Malaysia Securities Berhad Listing Requirements, as issued by the Malaysian Institute of Accountants
and the directive of Bursa Malaysia Securities Berhad.
Signed on behalf of the Board in accordance with a resolution of the directors dated 3 April 2013.
DATO’ JORGEN BORNHOFT DATUK EDWARD LEE MING FOO, JP
Annual Report 2012 85
Statutory DeclarationPURSUANT TO SECTION 169(16) OF THE COMPANIES ACT, 1965
I, LEE WEE YONG, being the director primarily responsible for the financial management of HAP SENG CONSOLIDATED
BERHAD, do solemnly and sincerely declare that the accompanying financial statements set out on pages 88 to 178 are
in my opinion correct, and I make this solemn declaration conscientiously believing the same to be true and by virtue of
the provisions of the Statutory Declarations Act, 1960.
Subscribed and solemnly declared by the
abovementioned LEE WEE YONG
at Kuala Lumpur in the Federal Territory
on 3 April 2013. LEE WEE YONG
Before me,
P. Valliamah
(No: W594)
Commissioner of Oaths
HAP SENG CONSOLIDATED BERHAD
Annual Report 201286
Independent Auditors’ Report TO THE MEMBERS OF HAP SENG CONSOLIDATED BERHAD
(Incorporated in Malaysia)
Report on the financial statements
We have audited the financial statements of Hap Seng Consolidated Berhad, which comprise the statements of
financial position as at 31 December 2012 of the Group and of the Company, and the income statements, statements of
comprehensive income, statements of changes in equity and statements of cash flows of the Group and of the Company
for the year then ended, and a summary of significant accounting policies and other explanatory notes, as set out on
pages 88 to 177.
Directors’ responsibility for the financial statements
The directors of the Company are responsible for the preparation of financial statements that give a true and fair view in
accordance with Financial Reporting Standards and the Companies Act, 1965 in Malaysia, and for such internal controls
as the directors determine are necessary to enable the preparation of financial statements that are free from material
misstatement, whether due to fraud or error.
Auditors’ responsibility
Our responsibility is to express an opinion on these financial statements based on our audit. We conducted our audit
in accordance with approved standards on auditing in Malaysia. Those standards require that we comply with ethical
requirements and plan and perform the audit to obtain reasonable assurance whether the financial statements are free
from material misstatement.
An audit involves performing procedures to obtain audit evidence about the amounts and disclosures in the financial
statements. The procedures selected depend on our judgement, including the assessment of risks of material
misstatement of the financial statements, whether due to fraud or error. In making those risk assessments, we consider
internal control relevant to the entity’s preparation of financial statements that give a true and fair view in order to
design audit procedures that are appropriate in the circumstances, but not for the purpose of expressing an opinion on
the effectiveness of the entity’s internal control. An audit also includes evaluating the appropriateness of the accounting
policies used and the reasonableness of accounting estimates made by the directors, as well as evaluating the overall
presentation of the financial statements.
We believe that the audit evidence we have obtained is sufficient and appropriate to provide a basis for our audit
opinion.
Opinion
In our opinion, the financial statements have been properly drawn up in accordance with Financial Reporting Standards
and the Companies Act, 1965 in Malaysia so as to give a true and fair view of the financial position of the Group and of
the Company as at 31 December 2012 and of their financial performance and cash flows for the year then ended.
Annual Report 2012 87
Independent Auditors’ Report TO THE MEMBERS OF HAP SENG CONSOLIDATED BERHAD
Report on other legal and regulatory requirements
In accordance with the requirements of the Companies Act, 1965 [“Act”] in Malaysia, we also report the following:
(a) In our opinion, the accounting and other records and the registers required by the Act to be kept by the Company
and its subsidiaries of which we have acted as auditors have been properly kept in accordance with the provisions
of the Act.
(b) We have considered the financial statements and the auditors’ reports of all the subsidiaries of which we have not
acted as auditors, which are indicated in Note 7 to the financial statements, being financial statements that have
been included in the consolidated financial statements.
(c) We are satisfied that the financial statements of the subsidiaries that have been consolidated with the financial
statements of the Company are in form and content appropriate and proper for the purposes of the preparation of
the consolidated financial statements and we have received satisfactory information and explanations required by
us for those purposes.
(d) The auditors’ reports on the financial statements of the subsidiaries were not subject to any qualification and did not
include any comment required to be made under Section 174(3) of the Act.
Other reporting responsibilities
The supplementary information set out in Note 42 to the financial statements on page 178 is disclosed to meet the
requirement of Bursa Malaysia Securities Berhad. The directors are responsible for the preparation of the supplementary
information in accordance with Guidance on Special Matter No. 1, Determination of Realised and Unrealised Profits or
Losses in the Context of Disclosure Pursuant to Bursa Malaysia Securities Berhad Listing Requirements, as issued by the
Malaysian Institute of Accountants (“MIA Guidance”) and the directive of Bursa Malaysia Securities Berhad. In our opinion,
the supplementary information is prepared, in all material respects, in accordance with the MIA Guidance and the
directive of Bursa Malaysia Securities Berhad.
Other matters
This report is made solely to the members of the Company, as a body, in accordance with Section 174 of the Companies
Act, 1965 in Malaysia and for no other purpose. We do not assume responsibility to any other person for the content of
this report.
Ernst & Young Lee Seng Huat
AF: 0039 No. 2518/12/13(J)
Chartered Accountants Chartered Accountant
Kuala Lumpur, Malaysia
3 April 2013
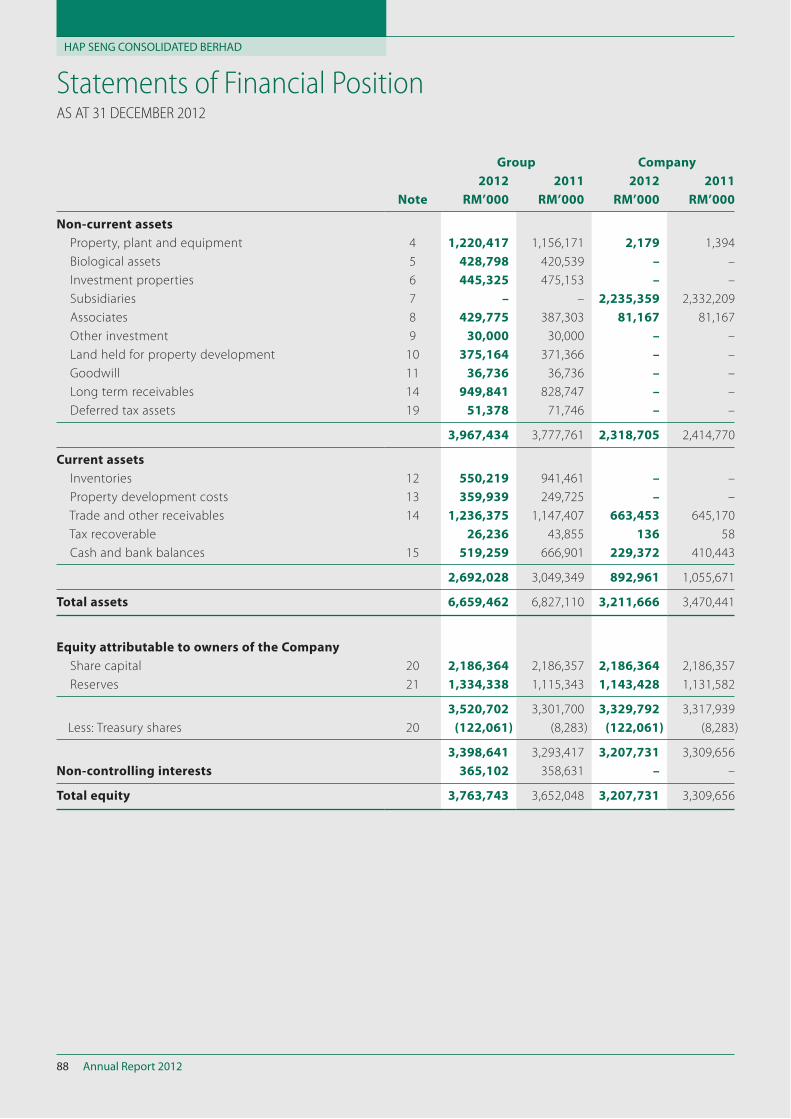
HAP SENG CONSOLIDATED BERHAD
Annual Report 201288
Statements of Financial Position AS AT 31 DECEMBER 2012
Group Company
2012 2011 2012 2011
Note RM’000 RM’000 RM’000 RM’000
Non-current assets
Property, plant and equipment 4 1,220,417 1,156,171 2,179 1,394
Biological assets 5 428,798 420,539 – –
Investment properties 6 445,325 475,153 – –
Subsidiaries 7 – – 2,235,359 2,332,209
Associates 8 429,775 387,303 81,167 81,167
Other investment 9 30,000 30,000 – –
Land held for property development 10 375,164 371,366 – –
Goodwill 11 36,736 36,736 – –
Long term receivables 14 949,841 828,747 – –
Deferred tax assets 19 51,378 71,746 – –
3,967,434 3,777,761 2,318,705 2,414,770
Current assets
Inventories 12 550,219 941,461 – –
Property development costs 13 359,939 249,725 – –
Trade and other receivables 14 1,236,375 1,147,407 663,453 645,170
Tax recoverable 26,236 43,855 136 58
Cash and bank balances 15 519,259 666,901 229,372 410,443
2,692,028 3,049,349 892,961 1,055,671
Total assets 6,659,462 6,827,110 3,211,666 3,470,441
Equity attributable to owners of the Company
Share capital 20 2,186,364 2,186,357 2,186,364 2,186,357
Reserves 21 1,334,338 1,115,343 1,143,428 1,131,582
3,520,702 3,301,700 3,329,792 3,317,939
Less: Treasury shares 20 (122,061) (8,283) (122,061) (8,283)
3,398,641 3,293,417 3,207,731 3,309,656
Non-controlling interests 365,102 358,631 – –
Total equity 3,763,743 3,652,048 3,207,731 3,309,656
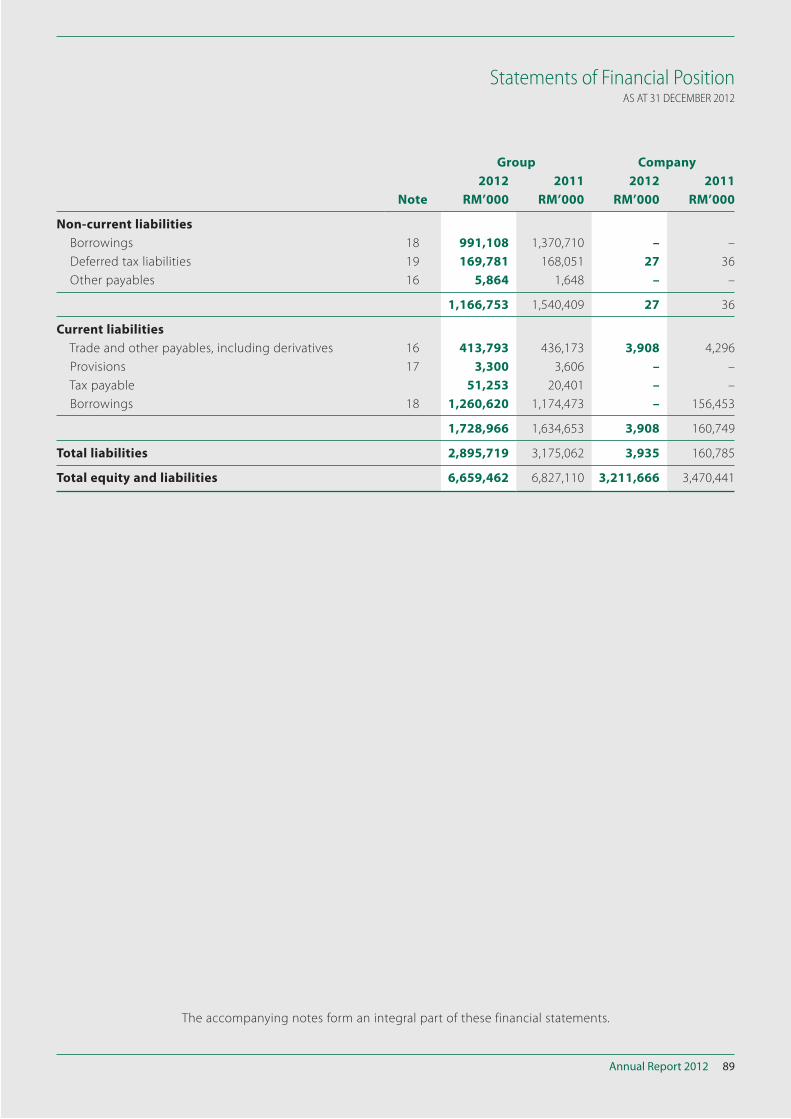
Annual Report 2012 89
Statements of Financial Position AS AT 31 DECEMBER 2012
Group Company
2012 2011 2012 2011
Note RM’000 RM’000 RM’000 RM’000
Non-current liabilities
Borrowings 18 991,108 1,370,710 – –
Deferred tax liabilities 19 169,781 168,051 27 36
Other payables 16 5,864 1,648 – –
1,166,753 1,540,409 27 36
Current liabilities
Trade and other payables, including derivatives 16 413,793 436,173 3,908 4,296
Provisions 17 3,300 3,606 – –
Tax payable 51,253 20,401 – –
Borrowings 18 1,260,620 1,174,473 – 156,453
1,728,966 1,634,653 3,908 160,749
Total liabilities 2,895,719 3,175,062 3,935 160,785
Total equity and liabilities 6,659,462 6,827,110 3,211,666 3,470,441
The accompanying notes form an integral part of these financial statements.
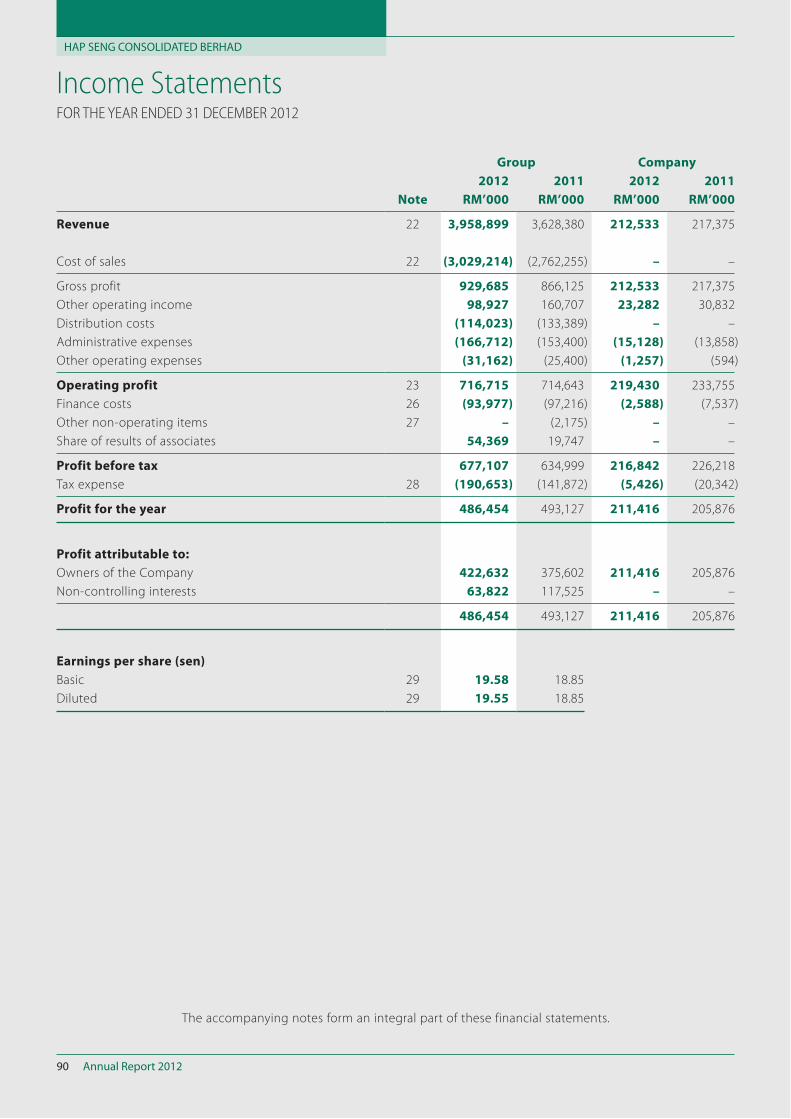
HAP SENG CONSOLIDATED BERHAD
Annual Report 201290
Income StatementsFOR THE YEAR ENDED 31 DECEMBER 2012
Group Company
2012 2011 2012 2011
Note RM’000 RM’000 RM’000 RM’000
Revenue 22 3,958,899 3,628,380 212,533 217,375
Cost of sales 22 (3,029,214) (2,762,255) – –
Gross profit 929,685 866,125 212,533 217,375
Other operating income 98,927 160,707 23,282 30,832
Distribution costs (114,023) (133,389) – –
Administrative expenses (166,712) (153,400) (15,128) (13,858)
Other operating expenses (31,162) (25,400) (1,257) (594)
Operating profit 23 716,715 714,643 219,430 233,755
Finance costs 26 (93,977) (97,216) (2,588) (7,537)
Other non-operating items 27 – (2,175) – –
Share of results of associates 54,369 19,747 – –
Profit before tax 677,107 634,999 216,842 226,218
Tax expense 28 (190,653) (141,872) (5,426) (20,342)
Profit for the year 486,454 493,127 211,416 205,876
Profit attributable to:
Owners of the Company 422,632 375,602 211,416 205,876
Non-controlling interests 63,822 117,525 – –
486,454 493,127 211,416 205,876
Earnings per share (sen)
Basic 29 19.58 18.85
Diluted 29 19.55 18.85
The accompanying notes form an integral part of these financial statements.
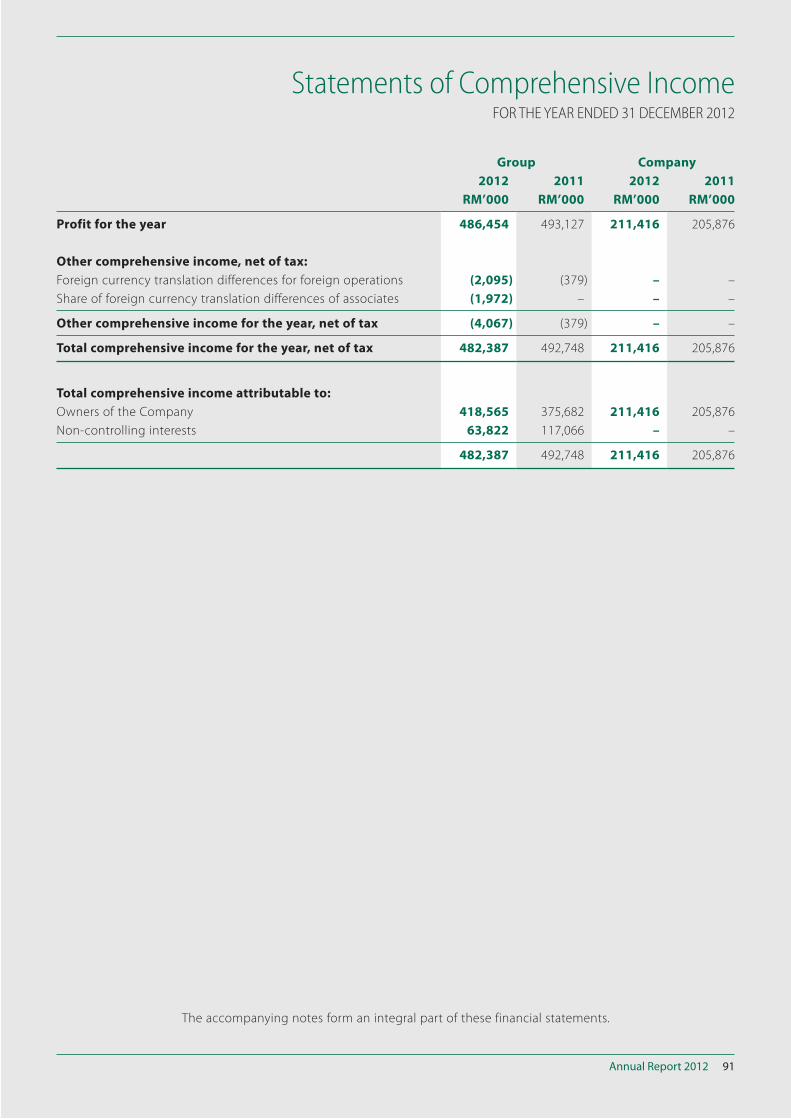
Annual Report 2012 91
Statements of Comprehensive IncomeFOR THE YEAR ENDED 31 DECEMBER 2012
Group Company
2012 2011 2012 2011
RM’000 RM’000 RM’000 RM’000
Profit for the year 486,454 493,127 211,416 205,876
Other comprehensive income, net of tax:
Foreign currency translation differences for foreign operations (2,095) (379) – –
Share of foreign currency translation differences of associates (1,972) – – –
Other comprehensive income for the year, net of tax (4,067) (379) – –
Total comprehensive income for the year, net of tax 482,387 492,748 211,416 205,876
Total comprehensive income attributable to:
Owners of the Company 418,565 375,682 211,416 205,876
Non-controlling interests 63,822 117,066 – –
482,387 492,748 211,416 205,876
The accompanying notes form an integral part of these financial statements.
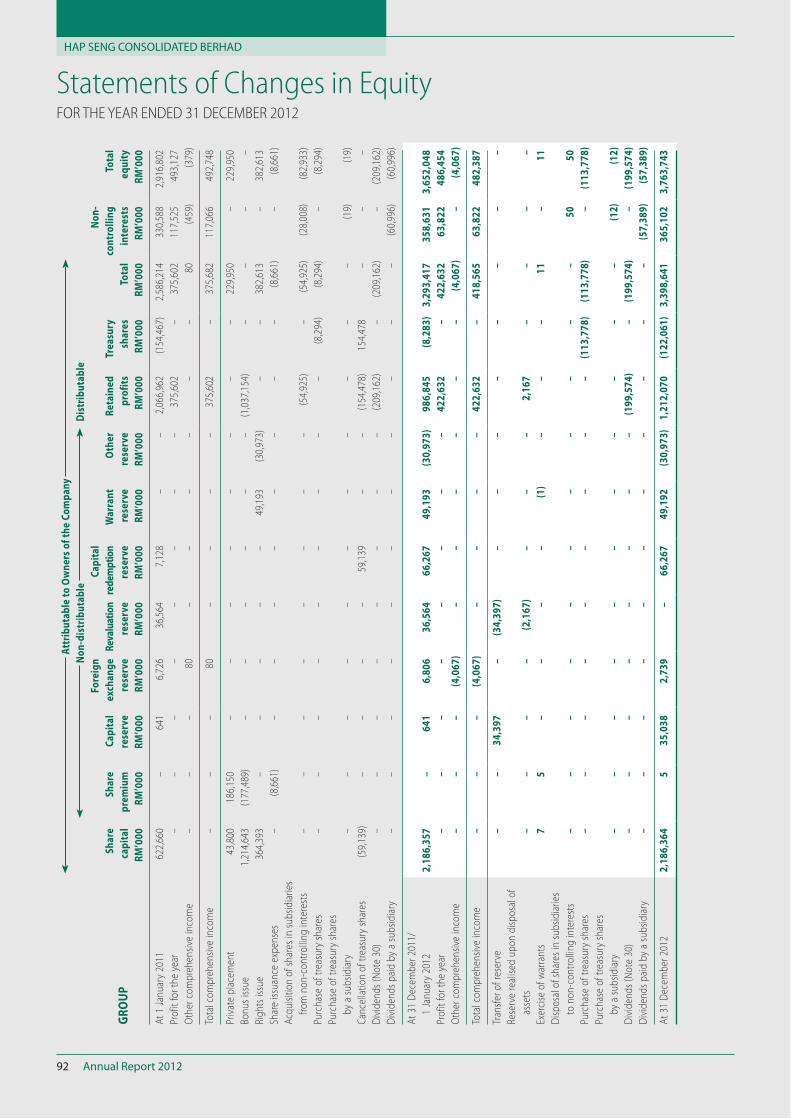
HAP SENG CONSOLIDATED BERHAD
Annual Report 201292
Statements of Changes in EquityFOR THE YEAR ENDED 31 DECEMBER 2012
Att
rib
uta
ble
to
Ow
ne
rs o
f th
e C
om
pa
ny
No
n-d
istr
ibu
tab
le
Dis
trib
uta
ble
GR
OU
PS
ha
re
cap
ita
l
Sh
are
pre
miu
m
Ca
pit
al
rese
rve
Fore
ign
exc
ha
ng
e
rese
rve
Rev
alu
atio
n
rese
rve
Ca
pit
al
red
emp
tio
n
rese
rve
Wa
rra
nt
rese
rve
Oth
er
rese
rve
Re
tain
ed
pro
fits
Tre
asu
ry
sha
res
Tota
l
No
n-
con
tro
llin
g
inte
rest
s
Tota
l
eq
uit
y
RM
’00
0R
M’0
00
RM
’00
0R
M’0
00
RM
’00
0R
M’0
00
RM
’00
0R
M’0
00
RM
’00
0R
M’0
00
RM
’00
0R
M’0
00
RM
’00
0
At
1 Ja
nu
ary
2011
622,
660
–64
16,
726
36,5
647,
128
––
2,06
6,96
2(1
54,4
67)
2,58
6,21
433
0,58
82,
916,
802
Pro
fit f
or
the
year
––
––
––
––
375,
602
–37
5,60
211
7,52
549
3,12
7
Oth
er c
om
pre
hen
sive
inco
me
––
–80
––
––
––
80(4
59)
(379
)
Tota
l co
mp
reh
ensi
ve in
com
e–
––
80–
––
–37
5,60
2–
375,
682
117,
066
492,
748
Priv
ate
pla
cem
ent
43,8
0018
6,15
0–
––
––
––
–22
9,95
0–
229,
950
Bon
us
issu
e1,
214,
643
(177
,489
)–
––
––
–(1
,037
,154
)–
––
–
Rig
hts
issu
e36
4,39
3–
––
––
49,1
93(3
0,97
3)–
–38
2,61
3–
382,
613
Shar
e is
suan
ce e
xpen
ses
–(8
,661
)–
––
––
––
–(8
,661
)–
(8,6
61)
Acq
uis
itio
n o
f sh
ares
in s
ub
sid
iari
es
fr
om
no
n-c
on
tro
llin
g in
tere
sts
––
––
––
––
(54,
925)
–(5
4,92
5)(2
8,00
8)(8
2,93
3)
Purc
has
e o
f tr
easu
ry s
har
es–
––
––
––
––
(8,2
94)
(8,2
94)
–(8
,294
)
Purc
has
e o
f tr
easu
ry s
har
es
b
y a
sub
sid
iary
––
––
––
––
––
–(1
9)(1
9)
Can
cella
tio
n o
f tr
easu
ry s
har
es(5
9,13
9)–
––
–59
,139
––
(154
,478
)15
4,47
8–
––
Div
iden
ds
(No
te 3
0)–
––
––
––
–(2
09,1
62)
–(2
09,1
62)
–(2
09,1
62)
Div
iden
ds
pai
d b
y a
sub
sid
iary
––
––
––
––
––
–(6
0,99
6)(6
0,99
6)
At
31 D
ecem
ber
201
1/
1
Jan
uar
y 20
122
,18
6,3
57
–6
41
6,8
06
36
,56
46
6,2
67
49
,19
3(3
0,9
73
)9
86
,84
5(8
,28
3)
3,2
93
,41
73
58
,63
13
,65
2,0
48
Pro
fit f
or
the
year
––
––
––
––
42
2,6
32
–4
22
,63
26
3,8
22
48
6,4
54
Oth
er c
om
pre
hen
sive
inco
me
––
–(4
,06
7)
––
––
––
(4,0
67
)–
(4,0
67
)
Tota
l co
mp
reh
ensi
ve in
com
e–
––
(4,0
67
)–
––
–4
22
,63
2–
41
8,5
65
63
,82
24
82
,38
7
Tran
sfer
of
rese
rve
––
34
,39
7–
(34
,39
7)
––
––
––
––
Rese
rve
real
ised
up
on
dis
po
sal o
f
as
sets
––
––
(2,1
67
)–
––
2,1
67
––
––
Exer
cise
of
war
ran
ts7
5–
––
–(1
)–
––
11
–1
1
Dis
po
sal o
f sh
ares
in s
ub
sid
iari
es
to
no
n-c
on
tro
llin
g in
tere
sts
––
––
––
––
––
–5
05
0
Purc
has
e o
f tr
easu
ry s
har
es–
––
––
––
––
(11
3,7
78
)(1
13
,77
8)
–(1
13
,77
8)
Purc
has
e o
f tr
easu
ry s
har
es
b
y a
sub
sid
iary
––
––
––
––
––
–(1
2)
(12
)
Div
iden
ds
(No
te 3
0)–
––
––
––
–(1
99
,57
4)
–(1
99
,57
4)
–(1
99
,57
4)
Div
iden
ds
pai
d b
y a
sub
sid
iary
––
––
––
––
––
–(5
7,3
89
)(5
7,3
89
)
At
31 D
ecem
ber
201
22
,18
6,3
64
53
5,0
38
2,7
39
–6
6,2
67
49
,19
2(3
0,9
73
)1
,21
2,0
70
(12
2,0
61
)3
,39
8,6
41
36
5,1
02
3,7
63
,74
3
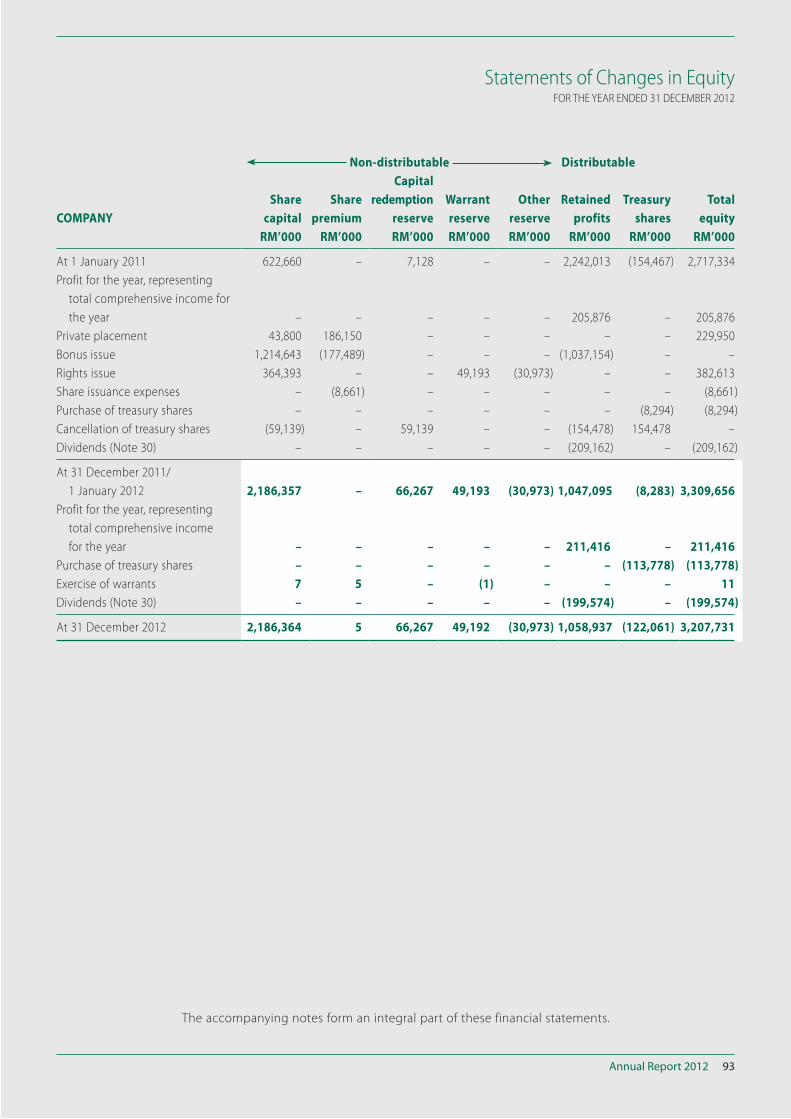
Annual Report 2012 93
Statements of Changes in EquityFOR THE YEAR ENDED 31 DECEMBER 2012
Non-distributable Distributable
COMPANY
Share
capital
Share
premium
Capital
redemption
reserve
Warrant
reserve
Other
reserve
Retained
profits
Treasury
shares
Total
equity
RM’000 RM’000 RM’000 RM’000 RM’000 RM’000 RM’000 RM’000
At 1 January 2011 622,660 – 7,128 – – 2,242,013 (154,467) 2,717,334
Profit for the year, representing
total comprehensive income for
the year – – – – – 205,876 – 205,876
Private placement 43,800 186,150 – – – – – 229,950
Bonus issue 1,214,643 (177,489) – – – (1,037,154) – –
Rights issue 364,393 – – 49,193 (30,973) – – 382,613
Share issuance expenses – (8,661) – – – – – (8,661)
Purchase of treasury shares – – – – – – (8,294) (8,294)
Cancellation of treasury shares (59,139) – 59,139 – – (154,478) 154,478 –
Dividends (Note 30) – – – – – (209,162) – (209,162)
At 31 December 2011/
1 January 2012 2,186,357 – 66,267 49,193 (30,973) 1,047,095 (8,283) 3,309,656
Profit for the year, representing
total comprehensive income
for the year – – – – – 211,416 – 211,416
Purchase of treasury shares – – – – – – (113,778) (113,778)
Exercise of warrants 7 5 – (1) – – – 11
Dividends (Note 30) – – – – – (199,574) – (199,574)
At 31 December 2012 2,186,364 5 66,267 49,192 (30,973) 1,058,937 (122,061) 3,207,731
The accompanying notes form an integral part of these financial statements.
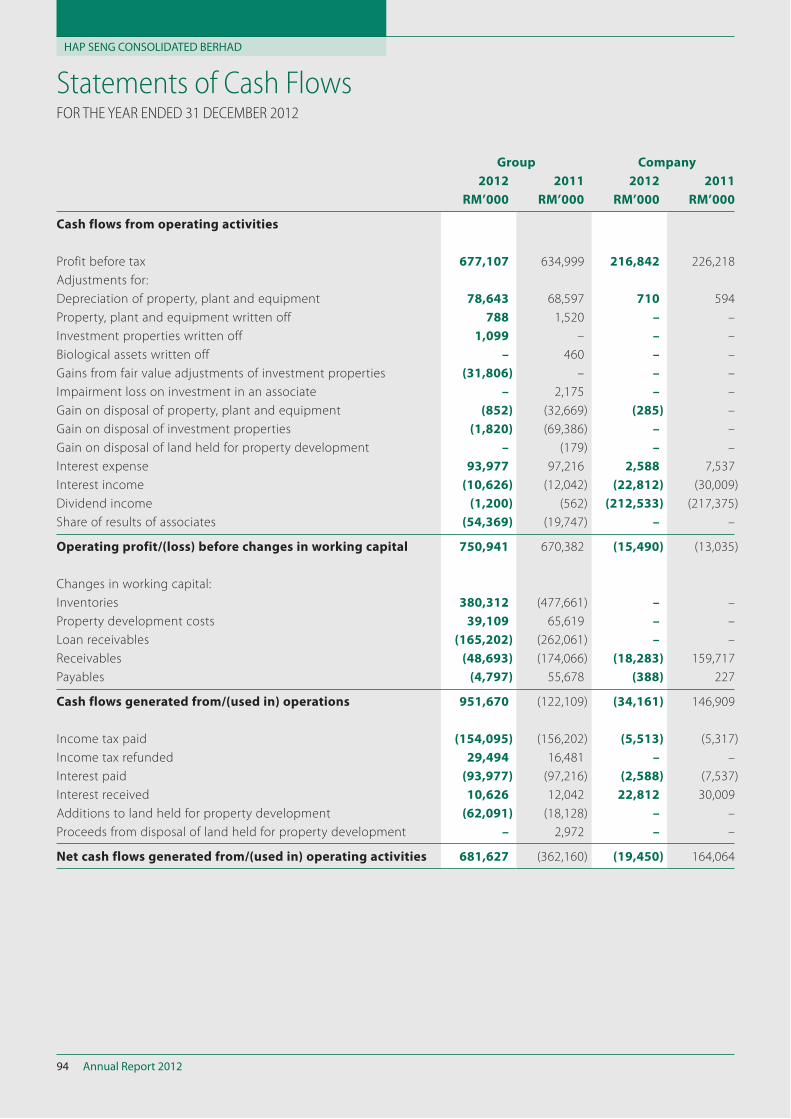
HAP SENG CONSOLIDATED BERHAD
Annual Report 201294
Statements of Cash FlowsFOR THE YEAR ENDED 31 DECEMBER 2012
Group Company
2012 2011 2012 2011
RM’000 RM’000 RM’000 RM’000
Cash flows from operating activities
Profit before tax 677,107 634,999 216,842 226,218
Adjustments for:
Depreciation of property, plant and equipment 78,643 68,597 710 594
Property, plant and equipment written off 788 1,520 – –
Investment properties written off 1,099 – – –
Biological assets written off – 460 – –
Gains from fair value adjustments of investment properties (31,806) – – –
Impairment loss on investment in an associate – 2,175 – –
Gain on disposal of property, plant and equipment (852) (32,669) (285) –
Gain on disposal of investment properties (1,820) (69,386) – –
Gain on disposal of land held for property development – (179) – –
Interest expense 93,977 97,216 2,588 7,537
Interest income (10,626) (12,042) (22,812) (30,009)
Dividend income (1,200) (562) (212,533) (217,375)
Share of results of associates (54,369) (19,747) – –
Operating profit/(loss) before changes in working capital 750,941 670,382 (15,490) (13,035)
Changes in working capital:
Inventories 380,312 (477,661) – –
Property development costs 39,109 65,619 – –
Loan receivables (165,202) (262,061) – –
Receivables (48,693) (174,066) (18,283) 159,717
Payables (4,797) 55,678 (388) 227
Cash flows generated from/(used in) operations 951,670 (122,109) (34,161) 146,909
Income tax paid (154,095) (156,202) (5,513) (5,317)
Income tax refunded 29,494 16,481 – –
Interest paid (93,977) (97,216) (2,588) (7,537)
Interest received 10,626 12,042 22,812 30,009
Additions to land held for property development (62,091) (18,128) – –
Proceeds from disposal of land held for property development – 2,972 – –
Net cash flows generated from/(used in) operating activities 681,627 (362,160) (19,450) 164,064
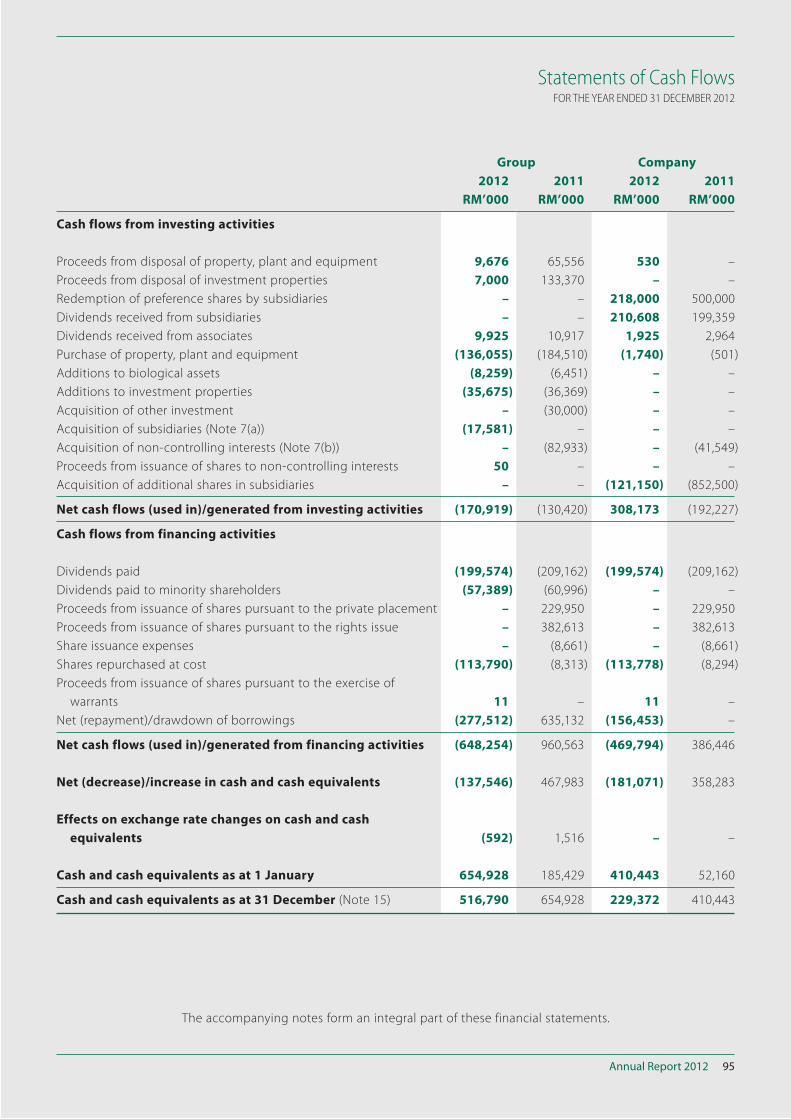
Annual Report 2012 95
Statements of Cash FlowsFOR THE YEAR ENDED 31 DECEMBER 2012
Group Company
2012 2011 2012 2011
RM’000 RM’000 RM’000 RM’000
Cash flows from investing activities
Proceeds from disposal of property, plant and equipment 9,676 65,556 530 –
Proceeds from disposal of investment properties 7,000 133,370 – –
Redemption of preference shares by subsidiaries – – 218,000 500,000
Dividends received from subsidiaries – – 210,608 199,359
Dividends received from associates 9,925 10,917 1,925 2,964
Purchase of property, plant and equipment (136,055) (184,510) (1,740) (501)
Additions to biological assets (8,259) (6,451) – –
Additions to investment properties (35,675) (36,369) – –
Acquisition of other investment – (30,000) – –
Acquisition of subsidiaries (Note 7(a)) (17,581) – – –
Acquisition of non-controlling interests (Note 7(b)) – (82,933) – (41,549)
Proceeds from issuance of shares to non-controlling interests 50 – – –
Acquisition of additional shares in subsidiaries – – (121,150) (852,500)
Net cash flows (used in)/generated from investing activities (170,919) (130,420) 308,173 (192,227)
Cash flows from financing activities
Dividends paid (199,574) (209,162) (199,574) (209,162)
Dividends paid to minority shareholders (57,389) (60,996) – –
Proceeds from issuance of shares pursuant to the private placement – 229,950 – 229,950
Proceeds from issuance of shares pursuant to the rights issue – 382,613 – 382,613
Share issuance expenses – (8,661) – (8,661)
Shares repurchased at cost (113,790) (8,313) (113,778) (8,294)
Proceeds from issuance of shares pursuant to the exercise of
warrants 11 – 11 –
Net (repayment)/drawdown of borrowings (277,512) 635,132 (156,453) –
Net cash flows (used in)/generated from financing activities (648,254) 960,563 (469,794) 386,446
Net (decrease)/increase in cash and cash equivalents (137,546) 467,983 (181,071) 358,283
Effects on exchange rate changes on cash and cash
equivalents (592) 1,516 – –
Cash and cash equivalents as at 1 January 654,928 185,429 410,443 52,160
Cash and cash equivalents as at 31 December (Note 15) 516,790 654,928 229,372 410,443
The accompanying notes form an integral part of these financial statements.
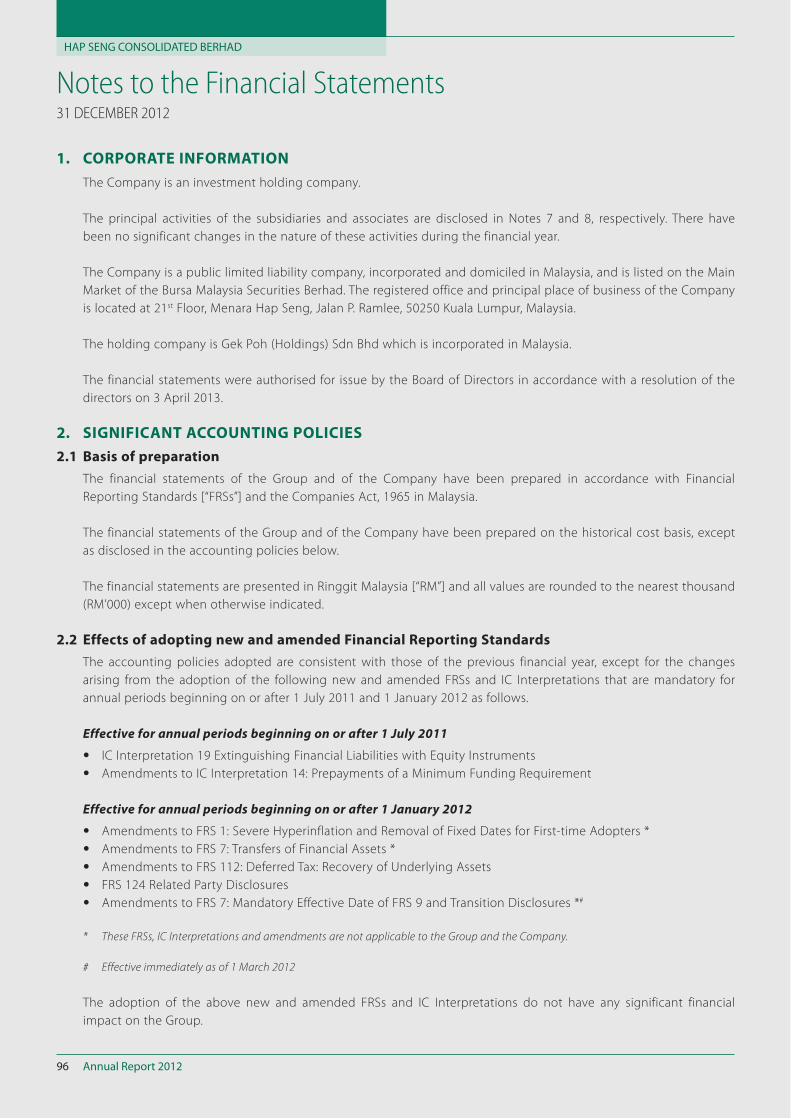
HAP SENG CONSOLIDATED BERHAD
Annual Report 201296
Notes to the Financial Statements31 DECEMBER 2012
1. CORPORATE INFORMATION
The Company is an investment holding company.
The principal activities of the subsidiaries and associates are disclosed in Notes 7 and 8, respectively. There have
been no significant changes in the nature of these activities during the financial year.
The Company is a public limited liability company, incorporated and domiciled in Malaysia, and is listed on the Main
Market of the Bursa Malaysia Securities Berhad. The registered office and principal place of business of the Company
is located at 21st Floor, Menara Hap Seng, Jalan P. Ramlee, 50250 Kuala Lumpur, Malaysia.
The holding company is Gek Poh (Holdings) Sdn Bhd which is incorporated in Malaysia.
The financial statements were authorised for issue by the Board of Directors in accordance with a resolution of the
directors on 3 April 2013.
2. SIGNIFICANT ACCOUNTING POLICIES
2.1 Basis of preparation
The financial statements of the Group and of the Company have been prepared in accordance with Financial
Reporting Standards [“FRSs”] and the Companies Act, 1965 in Malaysia.
The financial statements of the Group and of the Company have been prepared on the historical cost basis, except
as disclosed in the accounting policies below.
The financial statements are presented in Ringgit Malaysia [“RM”] and all values are rounded to the nearest thousand
(RM’000) except when otherwise indicated.
2.2 Effects of adopting new and amended Financial Reporting Standards
The accounting policies adopted are consistent with those of the previous financial year, except for the changes
arising from the adoption of the following new and amended FRSs and IC Interpretations that are mandatory for
annual periods beginning on or after 1 July 2011 and 1 January 2012 as follows.
Effective for annual periods beginning on or after 1 July 2011
IC Interpretation 19 Extinguishing Financial Liabilities with Equity Instruments
Amendments to IC Interpretation 14: Prepayments of a Minimum Funding Requirement
Effective for annual periods beginning on or after 1 January 2012
Amendments to FRS 1: Severe Hyperinflation and Removal of Fixed Dates for First-time Adopters *
Amendments to FRS 7: Transfers of Financial Assets *
Amendments to FRS 112: Deferred Tax: Recovery of Underlying Assets
FRS 124 Related Party Disclosures
Amendments to FRS 7: Mandatory Effective Date of FRS 9 and Transition Disclosures *#
* These FRSs, IC Interpretations and amendments are not applicable to the Group and the Company.
# Effective immediately as of 1 March 2012
The adoption of the above new and amended FRSs and IC Interpretations do not have any significant financial
impact on the Group.
Annual Report 2012 97
Notes to the Financial Statements31 DECEMBER 2012
2. SIGNIFICANT ACCOUNTING POLICIES (continued)
2.3 Standards issued but not yet effective
The Group and the Company have not adopted the following standards and interpretations of the FRS framework
which have been issued but are only effective for future financial periods:
Effective for annual periods
beginning on or after
Amendments to FRS 101: Presentation of Items of Other Comprehensive Income 1 July 2012
FRS 10 Consolidated Financial Statements 1 January 2013
FRS 11 Joint Arrangements 1 January 2013
FRS 12 Disclosure of Interests in Other Entities 1 January 2013
FRS 13 Fair Value Measurement 1 January 2013
FRS 119 Employee Benefits 1 January 2013
FRS 127 Separate Financial Statements 1 January 2013
FRS 128 Investment in Associates and Joint Ventures 1 January 2013
IC Interpretation 20 Stripping Costs in the Production Phase of a Surface Mine 1 January 2013
Amendments to FRS 1: Government Loans 1 January 2013
Amendments to FRS 7: Disclosures – Offsetting Financial Assets and Financial
Liabilities
1 January 2013
Amendments to FRS 10, FRS 11 and FRS 12: Transition Guidance 1 January 2013
Amendments to FRSs contained in the document entitled “Improvements to FRSs
(2012)”
1 January 2013
Amendments to FRS 10, FRS 12 and FRS 127: Investment Entities 1 January 2014
Amendments to FRS 132: Offsetting Financial Assets and Financial Liabilities 1 January 2014
FRS 9 Financial Instruments 1 January 2015
The Group and the Company plan to adopt the above pronouncements when they become effective in the
respective financial periods. These pronouncements are expected to have no impact on the financial statements of
the Group and of the Company upon their initial application, except as discussed below:
Amendments to FRS 101: Presentation of Items of Other Comprehensive Income
The amendments to FRS 101 change the grouping of items presented in other comprehensive income. Items that
could be reclassified (or “recycled”) to profit or loss at a future point in time (for example, upon derecognition
or settlement) would be presented separately from items that will never be reclassified. The amendment affects
presentation only and has no financial impact on the Group’s financial position or performance.
FRS 9 Financial Instruments
FRS 9 reflects the first phase of work on the replacement of FRS 139 and applies to classification and measurement
of financial assets and financial liabilities as defined in FRS 139. The adoption of the first phase of FRS 9 will have an
effect on the classification and measurement of the Group’s financial assets. The Group is in the process of making
an assessment of the impact of adoption of FRS 9.
FRS 12 Disclosure of Interests in Other Entities
FRS 12 includes all disclosure requirements for interests in subsidiaries, joint arrangements, associates and structured
entities. A number of new disclosures are required. This standard affects disclosures only and has no financial impact
on the Group’s financial position or performance.
HAP SENG CONSOLIDATED BERHAD
Annual Report 201298
Notes to the Financial Statements31 DECEMBER 2012
2. SIGNIFICANT ACCOUNTING POLICIES (continued)
2.3 Standards issued but not yet effective (continued)
FRS 13 Fair Value Measurement
FRS 13 establishes a single source of guidance under FRS for all fair value measurements. FRS 13 does not change
when an entity is required to use fair value, but rather provides guidance on how to measure fair value under FRS
when fair value is required or permitted. The Group is currently assessing the impact of adoption of FRS 13.
Amendments to FRS 7: Disclosures – Offsetting Financial Assets and Financial Liabilities
The amendments require additional information to be disclosed to enable users of financial statements to evaluate
the effect or potential effect of netting arrangements, including rights of set-off associated with the entity’s
recognised financial assets and recognised financial liabilities, on the entity’s financial position. The amendment
affects disclosure only and has no financial impact on the Group’s financial position or performance.
Malaysian Financial Reporting Standards (MFRS Framework)
On 19 November 2011, the Malaysian Accounting Standards Board (MASB) issued a new MASB approved accounting
framework, the Malaysian Financial Reporting Standards (MFRS Framework).
The MFRS Framework is to be applied by all Entities Other Than Private Entities for annual periods beginning on or
after 1 January 2012, with the exception of entities that are within the scope of MFRS 141 Agriculture (MFRS 141)
and IC Interpretation 15 Agreements for Construction of Real Estate (IC 15), including its parent, significant investor
and venturer (herein called ‘Transitioning Entities’).
Transitioning Entities will be allowed to defer adoption of the new MFRS Framework for an additional two years.
Consequently, adoption of the MFRS Framework by Transitioning Entities will be mandatory for annual periods
beginning on or after 1 January 2014.
The Group falls within the definition of Transitioning Entities and have opted to defer adoption of the new MFRS
Framework. Accordingly, the Group will be required to prepare its financial statements using the MFRS Framework
in its first MFRS financial statements for the financial year ending 31 December 2014. In presenting its first MFRS
financial statements, the Group will be required to restate the comparative financial statements to amounts
reflecting the application of MFRS Framework. The majority of the adjustments required on transition will be made,
retrospectively, against opening retained profits.
2.4 Basis of consolidation
The consolidated financial statements comprise the financial statements of the Company and its subsidiaries as at
the reporting date. The financial statements of the subsidiaries used in the preparation of the consolidated financial
statements are prepared for the same reporting date as the Company. Consistent accounting policies are applied to
like transactions and events in similar circumstances.
All intra-group balances, income and expenses and unrealised gains and losses resulting from intra-group
transactions are eliminated in full. Intra-group losses may indicate impairment that requires recognition in the
consolidated financial statements.
Total comprehensive income within a subsidiary is attributed to the non-controlling interest even if it results in a
deficit balance.
Annual Report 2012 99
Notes to the Financial Statements31 DECEMBER 2012
2. SIGNIFICANT ACCOUNTING POLICIES (continued)
2.4 Basis of consolidation (continued)
Acquisitions of subsidiaries are accounted for by applying the acquisition method. Identifiable assets acquired and
liabilities and contingent liabilities assumed in a business combination are measured initially at their fair values
at the acquisition date. Acquisition-related costs are recognised as expenses in the periods in which the costs are
incurred and the services are received.
In business combinations achieved in stages, previously held equity interests in the acquiree are re-measured to fair
value at the acquisition date and any corresponding gain or loss is recognised in profit or loss.
The Group elects for each individual business combination, whether non-controlling interest in the acquiree (if any)
is recognised on the acquisition date at fair value, or at the non-controlling interest’s proportionate share of the
acquiree net identifiable assets.
Any excess of the sum of the fair value of the consideration transferred in the business combination, the amount of
non-controlling interest in the acquiree (if any), and the fair value of the Group’s previously held equity interest in
the acquiree (if any), over the net fair value of the acquiree’s identifiable assets and liabilities is recorded as goodwill
in the statement of financial position. The accounting policy for goodwill is set out in Note 2.13. In instances where
the latter amount exceeds the former, the excess is recognised as a gain on bargain purchase in profit or loss on the
acquisition date.
Subsidiaries are consolidated from the date of acquisition, being the date on which the Group obtains control, and
continue to be consolidated until the date that such control ceases.
2.5 Transactions with non-controlling interests
Non-controlling interests represent the equity in subsidiaries not attributable, directly or indirectly, to owners of the
Company, and is presented separately in consolidated income statement, consolidated statement of comprehensive
income and within equity in the consolidated statement of financial position, separately from equity attributable to
owners of the Company.
Changes in the Company owners’ ownership interest in a subsidiary that do not result in a loss of control are
accounted for as equity transactions. In such circumstances, the carrying amounts of the controlling and non-
controlling interests are adjusted to reflect the changes in their relative interests in the subsidiary. Any difference
between the amount by which the non-controlling interests are adjusted and the fair value of the consideration
paid or received is recognised directly in equity and attributed to owners of the Company.
2.6 Foreign currency
(a) Functional and presentation currency
The individual financial statements of each entity in the Group are measured using the currency of the primary
economic environment in which the entity operates [“the functional currency”]. The consolidated financial
statements are presented in RM, which is also the Company’s functional currency.
HAP SENG CONSOLIDATED BERHAD
Annual Report 2012100
Notes to the Financial Statements31 DECEMBER 2012
2. SIGNIFICANT ACCOUNTING POLICIES (continued)
2.6 Foreign currency (continued)
(b) Foreign currency transactions
Transactions in foreign currencies are measured in the respective functional currencies of the Company and its
subsidiaries and are recorded on initial recognition in the functional currencies at exchange rates approximating
those ruling at the transaction dates. Monetary assets and liabilities denominated in foreign currencies are
translated at the rate of exchange ruling at the reporting date. Non-monetary items denominated in foreign
currencies that are measured at historical cost are translated using the exchange rates as at the dates of the
initial transactions. Non-monetary items denominated in foreign currencies measured at fair value are translated
using the exchange rates at the date when the fair value was determined.
Exchange difference arising on the settlement of monetary items or on translating monetary items at the
reporting date are recognised in profit or loss except for exchange differences arising on monetary items
that form part of the Group’s net investment in foreign operations, which are recognised initially in other
comprehensive income and accumulated under foreign currency translation reserve in equity. The foreign
currency translation reserve is reclassified from equity to profit or loss of the Group on disposal of the foreign
operation.
Exchange differences arising on the translation of non-monetary items carried at fair value are included in profit
or loss for the period except for the differences arising on the translation of non-monetary items in respect of
which gains and losses are recognised directly in equity. Exchange differences arising from such non-monetary
items are also recognised directly in equity.
(c) Foreign operations
The assets and liabilities of foreign operations are translated into RM at the rate of exchange ruling at the
reporting date and income and expenses are translated at average exchange rates for the year, which
approximates the exchange rates at the dates of the transactions. The exchange differences arising on
the translation are taken directly to other comprehensive income. On disposal of a foreign operation, the
cumulative amount recognised in other comprehensive income and accumulated in equity under foreign
currency translation reserve relating to that particular foreign operation is recognised in the profit or loss.
Goodwill and fair value adjustments arising on the acquisition of foreign operations are treated as assets and
liabilities of the foreign operations and are recorded in the functional currency of the foreign operations and
translated at the closing rate at the reporting date.
2.7 Property, plant and equipment
(a) Assets
All items of property, plant and equipment are initially recorded at cost. Subsequent costs are included in the
asset’s carrying amount or recognised as a separate asset, as appropriate, only when it is probable that future
economic benefits associated with the item will flow to the Group and the cost of the item can be measured
reliably. The cost of property, plant and equipment comprises their purchase price and any directly attributable
costs including interest costs capitalised in bringing the property, plant and equipment to working condition.
The carrying amount of the replaced part is derecognised. All other repairs and maintenance costs are
recognised in profit or loss during the financial period in which they are incurred.
Subsequent to recognition, property, plant and equipment except for freehold land are stated at cost less
accumulated depreciation and any accumulated impairment losses.
Annual Report 2012 101
Notes to the Financial Statements31 DECEMBER 2012
2. SIGNIFICANT ACCOUNTING POLICIES (continued)
2.7 Property, plant and equipment (continued)
(a) Assets (continued)
The carrying values of property, plant and equipment are reviewed for impairment when events or changes in
circumstances indicate that the carrying value may not be recoverable.
Depreciation
Freehold land and assets under construction are not depreciated. Depreciation of other property, plant and
equipment is provided for on a straight-line basis to write off the cost of each asset to its residual value over
the estimated useful life. The estimated useful lives are:
Leasehold land 23 to 999 years
Buildings 10 to 60 years
Road and infrastructure 25 to 83 years
Plant and equipment
– Plant and machinery 4 to 20 years
– Office equipment, furniture, fixtures and fittings 3 to 10 years
– Motor vehicles 4 to 7 years
The residual value, useful life and depreciation method are reviewed at each financial year end to ensure that
the amount, method and period of depreciation are consistent with previous estimates and the expected
pattern of consumption of the future economic benefits embodied in the items of property, plant and
equipment.
(b) Disposal of property, plant and equipment
An item of property, plant and equipment is derecognised upon disposal or when no future economic benefits
are expected from its use or disposal. The difference between the net disposal proceeds, if any and the net
carrying amount is recognised in profit or loss and the revaluation surplus included in the revaluation reserve in
respect of the asset is transferred directly to retained profits.
2.8 Biological assets
In accordance with paragraph 54 of FRS 101, the Group has presented plantation development expenditure as
biological assets.
New planting which include land clearing, planting, field upkeep and maintenance of oil palm plantings to maturity
are capitalised as plantation development expenditure. Oil palm plantings are considered mature 30 months after
the date of planting. Expenditures incurred after maturity of crops are charged to profit or loss. Estate overhead
expenditure is apportioned to revenue and plantation development expenditure on the basis of the proportion of
mature and immature areas.
Net income from scout harvesting prior to maturity is offset against plantation development expenditure.
No amortisation is considered necessary for plantation development expenditure as the estate is maintained
through replanting programmes and replanting expenditure is written off to profit or loss during the year when it is
incurred.
HAP SENG CONSOLIDATED BERHAD
Annual Report 2012102
Notes to the Financial Statements31 DECEMBER 2012
2. SIGNIFICANT ACCOUNTING POLICIES (continued)
2.9 Investment properties
Investment properties are properties which are held either to earn rental income or for capital appreciation or for
both. Properties that are occupied by the companies in the Group are accounted for as owner-occupied rather than
as investment properties.
Investment properties are initially measured at cost, including transaction costs. Subsequent to initial recognition,
investment properties are measured at fair value which reflects market conditions at the reporting date. Fair value is
arrived at by reference to market evidence of transaction prices for similar properties and is performed by registered
independent valuers and/or management. In the absence of current prices in an active market, alternative methods
such as recent prices on a less active market or discounted cash flow projections are used. Gains or losses arising
from changes in the fair values of investment properties are included in profit or loss in the year in which they arise.
Subsequent expenditure is included in the investment property’s carrying amount only when it is probable that
future economic benefits associated with the item will flow to the Group and the cost of the item can be measured
reliably. All other repairs and maintenance costs are recognised in profit or loss during the financial period in which
they are incurred.
A property interest under an operating lease is classified and accounted for as an investment property on a
property-by-property basis when the Group holds it to earn rentals or for capital appreciation or both. Any such
property interest under an operating lease classified as an investment property is carried at fair value.
Investment properties are derecognised when either they have been disposed of or when the investment property
is permanently withdrawn from use and no future economic benefit is expected from its disposal. Any gain or loss
on the retirement or disposal of an investment property is recognised in profit or loss in the year of retirement or
disposal.
Transfers are made to or from investment property only when there is a change in use. For a transfer from
investment property to owner-occupied property, the deemed cost for subsequent accounting is the fair value at
the date of change in use. For a transfer from owner-occupied property to investment property, the property is
accounted for in accordance with the accounting policy for property, plant and equipment set out in Note 2.7 up to
the date of change in use.
Investment property under construction [“IPUC”]
IPUC is measured at fair value (when the fair value is reliably determinable). The fair values of IPUC were determined
based on the opinion of a qualified independent valuer and/or assessment performed by the management.
Fair value is arrived at by reference to market evidence of transaction prices for similar properties. Each IPUC is
individually assessed.
IPUC for which fair value cannot be determined reliably is measured at cost less impairment.
2.10 Subsidiaries
A subsidiary is an entity over which the Group has the power to govern the financial and operating policies so as to
obtain benefits from its activities.
In the Company’s separate financial statements, investments in subsidiaries are accounted for at cost less
impairment losses. On disposal of such investments, the difference between net disposal proceeds and their
carrying amounts is included in profit or loss.
Annual Report 2012 103
Notes to the Financial Statements31 DECEMBER 2012
2. SIGNIFICANT ACCOUNTING POLICIES (continued)
2.11 Associates
An associate is an entity, not being a subsidiary or a joint venture, in which the Group has significant influence. An
associate is equity accounted for from the date the Group obtains significant influence until the date the Group
ceases to have significant influence over the associate.
The Group’s investments in associates are accounted for in the consolidated financial statements using the equity
method of accounting. Under the equity method, the investment in associate is measured in the consolidated
statements of financial position at cost plus post-acquisition changes in the Group’s share of net assets of the
associate. Goodwill relating to an associate is included in the carrying amount of the investment. Any excess of the
Group’s share of the net fair value of the associate’s identifiable assets, liabilities and contingent liabilities over the
cost of the investment is excluded from the carrying amount of the investment and is instead included as income
in the determination of the Group’s share of the associate’s profit or loss in the period in which the investment is
acquired.
When the Group’s share of losses in an associate equals or exceeds its interest in the associate, the Group does not
recognise further losses, unless it has incurred obligations or made payments on behalf of the associate.
After application of the equity method, the Group determines whether it is necessary to recognise any additional
impairment loss on the Group’s net investment in the associate. The Group determine at each reporting date
whether there is any objective evidence that the investment in the associate is impaired. If this is the case, the
Group calculates the amount of impairment as the difference between the recoverable amount of the associate and
its carrying value and recognises the amount in profit or loss.
The financial statements of the associates are prepared as of the same reporting date as the Company. Where
necessary, adjustments are made to bring the accounting policies in line with those of the Group. Uniform
accounting policies are adopted for like transactions and events in similar circumstances.
In the Company’s separate financial statements, investments in associates are stated at cost less impairment losses.
On disposal of such investments, the difference between net disposal proceeds and their carrying amounts is
included in profit or loss.
2.12 Land held for property development
Land held for property development consists of land where no development activities have been carried out or
where development activities are not expected to be completed within the normal operating cycle. Such land is
classified within non-current assets and is stated at cost less any accumulated impairment losses.
Land held for property development is reclassified as property development costs (classified within current assets)
when development activities have commenced and where it can be demonstrated that the development activities
can be completed within the normal operating cycle.
Land held for property development comprise cost associated with the acquisition of land and all cost incurred
subsequent to the acquisition but prior to the transfer to property development costs on activities necessary to
prepare the land for its intended use.
Cost associated with the acquisition of land includes the purchase price of the land, professional fees, stamp duties,
commissions, conversion fees and other relevant levies. Where the Group had previously recorded the land at
revalued amount, it continues to retain this amount as its surrogate cost as allowed by FRS 2012004.
HAP SENG CONSOLIDATED BERHAD
Annual Report 2012104
Notes to the Financial Statements31 DECEMBER 2012
2. SIGNIFICANT ACCOUNTING POLICIES (continued)
2.13 Goodwill
Goodwill is initially measured at cost. Following initial recognition, goodwill is measured at cost less accumulated
impairment losses.
For the purpose of impairment testing, goodwill acquired is allocated, from the acquisition date, to each of the
Group’s cash-generating units that are expected to benefit from the synergies of the combination.
The cash-generating unit to which goodwill has been allocated is tested for impairment at each reporting date and
whenever there is an indication that the cash-generating unit may be impaired, by comparing the carrying amount
of the cash-generating unit, including the allocated goodwill, with the recoverable amount of the cash-generating
unit. Where the recoverable amount of the cash-generating unit is less than the carrying amount, an impairment
loss is recognised in the profit or loss. Impairment losses recognised for goodwill are not reversed in subsequent
periods.
2.14 Impairment of non-financial assets
The Group assesses at each reporting date whether there is an indication that an asset may be impaired. If any such
indication exists, or when an annual impairment assessment for an asset is required, the Group makes an estimate of
the asset’s recoverable amount.
An asset’s recoverable amount is the higher of an asset’s fair value less costs to sell and its value in use. For the
purpose of assessing impairment, assets are grouped at the lowest levels for which there are separately identifiable
cash flows (cash-generating units [“CGU”]).
In assessing value in use, the estimated future cash flows expected to be generated by the asset are discounted to
their present value using a pre-tax discount rate that reflects current market assessments of the time value of money
and the risks specific to the asset. Where the carrying amount of an asset exceeds its recoverable amount, the asset
is written down to its recoverable amount. Impairment losses recognised in respect of a CGU or groups of CGUs are
allocated first to reduce the carrying amount of any goodwill allocated to those units or groups of units and then, to
reduce the carrying amount of the other assets in the unit or groups of units on a pro-rata basis.
Impairment losses are recognised in profit or loss except for assets that are previously revalued where the
revaluation was taken to other comprehensive income. In this case the impairment is also recognised in other
comprehensive income up to the amount of any previous revaluation.
An assessment is made at each reporting date as to whether there is any indication that previously recognised
impairment losses may no longer exist or may have decreased. A previously recognised impairment loss is reversed
only if there has been a change in the estimates used to determine the asset’s recoverable amount since the last
impairment loss was recognised. If that is the case, the carrying amount of the asset is increased to its recoverable
amount. That increase cannot exceed the carrying amount that would have been determined, net of depreciation,
had no impairment loss been recognised previously. Such reversal is recognised in profit or loss unless the asset is
measured at revalued amount, in which case the reversal is treated as a revaluation increase. Impairment loss on
goodwill is not reversed in a subsequent period.
Annual Report 2012 105
Notes to the Financial Statements31 DECEMBER 2012
2. SIGNIFICANT ACCOUNTING POLICIES (continued)
2.15 Financial assets
Financial assets are recognised in the statements of financial position when, and only when, the Group and the
Company become a party to the contractual provisions of the financial instrument.
When financial assets are recognised initially, they are measured at fair value, plus, in the case of financial assets not
at fair value through profit and loss, directly attributable transaction costs.
A financial asset is derecognised when the contractual right to receive cash flows from the asset has expired. On
derecognition of a financial asset in its entirety, the difference between the carrying amount and the sum of the
consideration received and any cumulative gain or loss that had been recognised in other comprehensive income is
recognised in profit or loss.
The Group and the Company determine the classification of their financial assets at initial recognition, and the
categories include financial assets at fair value through profit or loss, loans and receivables and available-for-sale
financial assets.
(a) Financial assets at fair value through profit or loss
Financial assets are classified as financial assets at fair value through profit or loss if they are held for trading
or are designated as such upon initial recognition. Financial assets held for trading are derivatives (including
separated embedded derivatives) or financial assets acquired principally for the purpose of selling in the near
term.
Subsequent to initial recognition, financial assets at fair value through profit or loss are measured at fair value.
Any gains or losses arising from changes in fair value are recognised in profit or loss.
Financial assets at fair value through profit or loss could be presented as current or non-current. Financial assets
that are held primarily for trading purposes are presented as current whereas financial assets that are not held
primarily for trading purposes are presented as current or non-current based on the settlement date.
(b) Loans and receivables
Financial assets with fixed or determinable payments that are not quoted in an active market are classified as
loans and receivables.
Subsequent to initial recognition, loans and receivables are measured at amortised cost using the effective
interest method. Gains and losses are recognised in profit or loss when the loans and receivables are
derecognised or impaired, and through the amortisation process.
Loans and receivables are classified as current assets, except for those having maturity dates later than 12
months after the reporting date which are classified as non-current.
HAP SENG CONSOLIDATED BERHAD
Annual Report 2012106
Notes to the Financial Statements31 DECEMBER 2012
2. SIGNIFICANT ACCOUNTING POLICIES (continued)
2.15 Financial assets (continued)
(c) Available-for-sale financial assets
Available-for-sale financial assets are financial assets that are designated as available for sale or are not classified
as financial assets at fair value through profit or loss, loans and receivables or held-to-maturity investments.
After initial recognition, available-for-sale financial assets are measured at fair value. Any gains or losses from
changes in fair value of the financial assets are recognised in other comprehensive income, except that
impairment losses, foreign exchange gains and losses on monetary instruments and interest calculated using
the effective interest method are recognised in profit or loss. The cumulative gain or loss previously recognised
in other comprehensive income is reclassified from equity to profit or loss as a reclassification adjustment when
the financial asset is derecognised. Interest income calculated using the effective interest method is recognised
in profit or loss. Dividends on an available-for-sale equity instrument are recognised in profit or loss when the
Group and the Company’s right to receive payment is established.
Investments in equity instruments whose fair value cannot be reliably measured are measured at cost less
impairment loss.
Available-for-sale financial assets are classified as non-current assets unless they are expected to be realised
within 12 months after the reporting date.
2.16 Impairment of financial assets
The Group and the Company assess at each reporting date whether there is any objective evidence that a financial
asset is impaired.
(a) Trade and other receivables and other financial assets carried at amortised cost
To determine whether there is objective evidence that an impairment loss on financial assets has been
incurred, the Group and the Company consider factors such as the probability of insolvency or significant
financial difficulties of the debtor and default or significant delay in payments. For certain categories of financial
assets, such as trade receivables, receivables that are assessed not to be impaired individually are subsequently
assessed for impairment on a collective basis based on similar risk characteristics. Objective evidence of
impairment for a portfolio of receivables could include the Group’s and the Company’s past experience of
collecting payments, an increase in the number of delayed payments in the portfolio past the average credit
period and observable changes in national or local economic conditions that correlate with default on
receivables.
If any such evidence exists, the amount of impairment loss is measured as the difference between the asset’s
carrying amount and the present value of estimated future cash flows discounted at the financial asset’s
original effective interest rate. The impairment loss is recognised in profit or loss.
The carrying amount of the financial asset is reduced by the impairment loss directly for all financial assets with
the exception of trade receivables, where the carrying amount is reduced through the use of an allowance
account. When a trade receivable becomes uncollectible, it is written off against the allowance account.
If in a subsequent period, the amount of the impairment loss decreases and the decrease can be related
objectively to an event occurring after the impairment was recognised, the previously recognised impairment
loss is reversed to the extent that the carrying amount of the asset does not exceed its amortised cost at the
reversal date. The amount of reversal is recognised in profit or loss.
Annual Report 2012 107
Notes to the Financial Statements31 DECEMBER 2012
2. SIGNIFICANT ACCOUNTING POLICIES (continued)
2.16 Impairment of financial assets (continued)
(b) Unquoted equity securities carried at cost
If there is objective evidence (such as significant adverse changes in the business environment where the
issuer operates, probability of insolvency or significant financial difficulties of the issuer) that an impairment
loss on financial assets carried at cost has been incurred, the amount of the loss is measured as the difference
between the asset’s carrying amount and the present value of estimated future cash flows discounted at the
current market rate of return for a similar financial asset. Such impairment losses are not reversed in subsequent
periods.
2.17 Inventories
Inventories are stated at the lower of cost and net realisable value. Cost is determined principally as follows:
Properties held for sale – specific identification method
Quarry reserves – specific identification method
Raw materials – weighted average cost method
Produce inventories – weighted average cost method
Work-in-progress – weighted average cost method
Livestocks – weighted average cost method
Finished goods
– vehicle and equipment – specific identification method
– others – weighted average cost method
Properties held for sale include costs of land, construction and appropriate development overheads.
Quarry reserves arising from the acquisition of subsidiaries are amortised over the lease extraction of 20 years.
Cost of produce inventories includes estate production costs, processing and transport charges.
Costs of work-in-progress and finished goods produced by the Group include costs of direct materials, labour and a
proportion of production overheads.
Livestocks are measured at the lower of cost and net realisable value using the weighted average method as the
main basis for cost. Cost of livestocks includes direct production costs and attributable production overheads.
Net realisable value is the estimated selling price in the ordinary course of business, less estimated costs of
completion and the estimated costs necessary to make the sales.
2.18 Property development costs
Property development costs comprise all costs that are directly attributable to development activities or that can be
allocated on a reasonable basis to such activities.
When the financial outcome of a development activity can be reliably estimated, property development revenue
and expenses are recognised in profit or loss by using the stage of completion method. The stage of completion is
determined by the proportion that property development costs incurred for work performed to date bear to the
estimated total property development costs.
HAP SENG CONSOLIDATED BERHAD
Annual Report 2012108
Notes to the Financial Statements31 DECEMBER 2012
2. SIGNIFICANT ACCOUNTING POLICIES (continued)
2.18 Property development costs (continued)
Where the financial outcome of a development activity cannot be reliably estimated, property development revenue
is recognised only to the extent of property development costs incurred that is probable will be recoverable, and
property development costs on properties sold are recognised as an expense in the period in which they are
incurred.
Any expected loss on a development project, including costs to be incurred over the defects liability period, is
recognised as an expense immediately.
Property development costs not recognised as an expense are recognised as an asset, which is measured at the
lower of cost and net realisable value.
The excess of revenue recognised in the profit or loss over billings to purchasers is classified as accrued billings
within trade receivables and the excess of billings to purchasers over revenue recognised in profit or loss is classified
as progress billings within trade payables.
2.19 Cash and cash equivalents
Cash and cash equivalents comprise cash at bank and on hand, and deposits with licensed financial institutions.
These also include bank overdrafts that form an integral part of the Group’s cash management.
2.20 Provisions
Provisions are recognised when the Group has a present obligation (legal or constructive) as a result of a past event,
it is probable that an outflow of economic resources will be required to settle the obligation and the amount of the
obligation can be estimated reliably.
Provisions are reviewed at each reporting date and adjusted to reflect the current best estimate. If it is no longer
probable that an outflow of economic resources will be required to settle the obligation, the provision is reversed. If
the effect of the time value of money is material, provisions are discounted using a current pre tax rate that reflects,
where appropriate, the risks specific to the liability. When discounting is used, the increase in the provision due to
the passage of time is recognised as a finance cost.
2.21 Revenue recognition
Revenue is recognised to the extent that it is probable that the economic benefits will flow to the Group and the
revenue can be reliably measured. Revenue is measured at the fair value of consideration received or receivable.
(a) Dividend income
Dividend income is recognised when the Group’s right to receive payment is established.
(b) Interest income
Interest income is recognised using the effective interest method.
(c) Sale of goods
Revenue on sales of goods is recognised upon the transfer of significant risk and rewards of ownership of
the goods to the customer. Revenue is not recognised to the extent where there are significant uncertainties
regarding recovery of the consideration due, associated costs or the possible return of goods.
Annual Report 2012 109
Notes to the Financial Statements31 DECEMBER 2012
2. SIGNIFICANT ACCOUNTING POLICIES (continued)
2.21 Revenue recognition (continued)
(d) Rental income
Rental income is accounted for on a straight-line basis over the lease terms. The aggregate costs of incentives
provided to lessees are recognised as a reduction of rental income over the lease term on a straight-line basis.
(e) Hire purchase, finance lease and loan receivables
Income on hire purchase and finance leases is recognised using the “sum-of-digit” method. Interest income on
term loan is accounted for on an accrual basis by reference to rest periods as stipulated in the loan agreements,
which are either daily or monthly. Where the repayment of an account is in arrears for three months or more,
the uncollected interest from that account is suspended until it is realised on a cash basis.
(f) Sale of properties
Revenue from sale of properties under development is accounted for by the stage of completion method as
described in Note 2.18.
Revenue from sale of completed properties held for resale is recognised in profit or loss when the significant
risks and rewards of ownership have been transferred to the buyer.
2.22 Employee benefits
(a) Short term benefits
Wages, salaries, bonuses and social security contributions are recognised as an expense in the year in which
the associated services are rendered by the employees of the Group. Short term accumulated compensated
absences such as paid annual leave are recognised when services are rendered by employees that increase
their entitlement to future compensated absences, and short term non-accumulating compensated absences
such as sick leave are recognised when the absences occur.
(b) Defined contribution plans
The Group participates in the national pension schemes as defined by the laws of the countries in which it has
operations. The Malaysian companies in the Group make contributions to the Employees Provident Fund in
Malaysia, a defined contribution pension scheme. Contributions to defined contribution pension schemes are
recognised as an expense in the period in which the related service is performed.
2.23 Income tax
(a) Current tax
Current tax assets and liabilities are measured at the amount expected to be recovered from or paid to the
taxation authorities. The tax rates and tax laws used to compute the amount are those that are enacted or
substantively enacted by the reporting date.
Current taxes are recognised in profit or loss except to the extent that the tax relates to items recognised
outside profit or loss, either in other comprehensive income or directly in equity.
HAP SENG CONSOLIDATED BERHAD
Annual Report 2012110
Notes to the Financial Statements31 DECEMBER 2012
2. SIGNIFICANT ACCOUNTING POLICIES (continued)
2.23 Income tax (continued)
(b) Deferred tax
Deferred tax is provided using the liability method on temporary differences at the reporting date between the
tax bases of assets and liabilities and their carrying amounts for financial reporting purposes.
Deferred tax liabilities are recognised for all temporary differences, except:
– where the deferred tax liability arises from the initial recognition of goodwill or of an asset or liability in
a transaction that is not a business combination and, at the time of the transaction, affects neither the
accounting profit nor taxable profit or loss; and
– in respect of taxable temporary differences associated with investments in subsidiaries, associates and
interests in joint ventures, where the timing of the reversal of the temporary differences can be controlled
and it is probable that the temporary differences will not reverse in the foreseeable future.
Deferred tax assets are recognised for all deductible temporary differences, carry forward of unused tax credits
and unused tax losses, to the extent that it is probable that taxable profit will be available against which the
deductible temporary differences, and the carry forward of unused tax credits and unused tax losses can be
utilised except:
– where the deferred tax asset relating to the deductible temporary difference arises from the initial
recognition of an asset or liability in a transaction that is not a business combination and, at the time of
the transaction, affects neither the accounting profit nor taxable profit or loss; and
– in respect of deductible temporary differences associated with investments in subsidiaries, associates and
interests in joint ventures, deferred tax assets are recognised only to the extent that it is probable that
the temporary differences will reverse in the foreseeable future and taxable profit will be available against
which the temporary differences can be utilised.
The carrying amount of deferred tax assets is reviewed at each reporting date and reduced to the extent that it
is no longer probable that sufficient taxable profit will be available to allow all or part of the deferred tax asset
to be utilised. Unrecognised deferred tax assets are reassessed at each reporting date and are recognised to the
extent that it has become probable that future taxable profit will allow the deferred tax assets to be utilised.
Where investment properties are carried at their fair value in accordance with the accounting policy set out in
Note 2.9, the amount of deferred tax recognised is measured using the tax rates that would apply on sale of
those assets at their carrying value at the reporting date unless the property is depreciable and is held within
the objective to consume substantially all of the economic benefits embodied in the property over time, rather
than through sale. In all other cases, the amount of deferred tax assets and liabilities are measured at the tax
rates that are expected to apply to the year when the asset is realised or the liability is settled, based on tax
rates and tax laws that have been enacted or substantively enacted at the reporting date.
Deferred tax relating to items recognised outside profit or loss is recognised outside profit or loss. Deferred
tax items are recognised in correlation to the underlying transaction either in other comprehensive income
or directly in equity and deferred tax arising from a business combination is adjusted against goodwill on
acquisition.
Deferred tax assets and deferred tax liabilities are offset, if a legally enforceable right exists to set off current
tax assets against current tax liabilities and the deferred taxes relate to the same taxable entity and the same
taxation authority.
Annual Report 2012 111
Notes to the Financial Statements31 DECEMBER 2012
2. SIGNIFICANT ACCOUNTING POLICIES (continued)
2.24 Financial liabilities
Financial liabilities are classified according to the substance of the contractual arrangements entered into and the
definitions of a financial liability.
Financial liabilities, within the scope of FRS 139, are recognised in the statements of financial position when, and
only when, the Group and the Company become a party to the contractual provisions of the financial instrument.
Financial liabilities are classified as either financial liabilities at fair value through profit or loss or other financial
liabilities.
A financial liability is derecognised when the obligation under the liability is extinguished. When an existing financial
liability is replaced by another from the same lender on substantially different terms, or the terms of an existing
liability are substantially modified, such an exchange or modification is treated as a derecognition of the original
liability and the recognition of a new liability, and the difference in the respective carrying amounts is recognised in
profit or loss.
(a) Financial liabilities at fair value through profit or loss
Financial liabilities at fair value through profit or loss include financial liabilities held for trading and financial
liabilities designated upon initial recognition at fair value through profit or loss. Financial liabilities held for
trading include derivatives entered into by the Group and the Company that do not meet the hedge accounting
criteria. Derivative liabilities are initially measured at fair value and subsequently stated at fair value, with
any resultant gains or losses recognised in profit or loss. Net gains or losses on derivatives include exchange
differences.
(b) Other financial liabilities
The Group’s and the Company’s other financial liabilities include trade payables, other payables and borrowings.
Trade and other payables are recognised initially at fair value plus directly attributable transaction costs and
subsequently measured at amortised cost using the effective interest method.
Borrowings are recognised initially at fair value, net of transaction costs incurred, and subsequently measured
at amortised cost using the effective interest method. Borrowings are classified as current liabilities unless the
Group has an unconditional right to defer settlement of the liability for at least 12 months after the reporting
date.
For other financial liabilities, gains and losses are recognised in profit or loss when the liabilities are
derecognised, and through the amortisation process.
2.25 Borrowing costs
Borrowing costs are capitalised as part of the cost of a qualifying assets if they are directly attributable to the
acquisition, construction or production of that asset. Capitalisation of borrowing costs commences when the
activities to prepare the asset for its intended use or sale are in progress and the expenditures and borrowing costs
are incurred. Borrowing costs are capitalised until the assets are substantially completed for their intended use or
sale. Capitalisation of borrowing costs shall cease when substantially all the activities to prepare the asset for its
intended use or sale are completed.
All other borrowing costs are recognised in profit or loss in the period they are incurred. Borrowing costs consist of
interest and other costs that the Group and the Company incurred in connection with the borrowing of funds.
HAP SENG CONSOLIDATED BERHAD
Annual Report 2012112
Notes to the Financial Statements31 DECEMBER 2012
2. SIGNIFICANT ACCOUNTING POLICIES (continued)
2.26 Hedge accounting
The Group uses derivatives to manage its exposure to foreign exchange risk and applies hedge accounting for
certain hedging relationships which qualify for hedge accounting. The Group’s hedging relationships are mainly
classified as fair value hedge.
A fair value hedge is a hedge of the exposure to changes in fair value of a recognised asset or liability or an
unrecognised firm commitment, or an identified portion of such an asset, liability or firm commitment, that is
attributable to a particular risk and could affect the profit and loss.
At the inception of a hedge relationship, the Group formally designates and documents the hedge relationship
to which the Group wishes to apply hedge accounting and the risk management objective and strategy for
undertaking the hedge. The documentation includes identification of the hedging instrument, the hedged item
or transaction, the nature of the risk being hedged and how the entity will assess the hedging instrument’s
effectiveness in offsetting the exposure to changes in the hedged item’s fair value attributable to the hedged risk.
Such hedges are expected to be highly effective in achieving offsetting changes in fair value and are assessed on an
ongoing basis to determine that they actually have been highly effective throughout the financial reporting periods
for which they were designated.
Hedges which meet the strict criteria for hedge accounting are accounted for as fair value hedges.
Fair value hedges
The change in the fair value of a foreign exchange derivative is recognised in the profit or loss. The change in the fair
value of the hedged item attributable to the risk hedged is recorded as a part of the carrying value of the hedged
item and is also recognised in profit or loss.
When an unrecognised firm commitment is designated as a hedged item, the subsequent cumulative change in
the fair value of the firm commitment attributable to the hedged risk is recognised as an asset or liability with a
corresponding gain or loss recognised in profit or loss.
Fair value hedge accounting is discontinued if the hedging instrument expires or sold, terminated or exercised, the
hedge no longer meets the criteria for hedge accounting or the Group revokes the designation.
Derivatives that are not designated or do not qualify for hedge accounting
Any gains or losses arising from changes in fair value on derivatives during the year that do not qualify for hedge
accounting are directly recognised in profit or loss.
2.27 Share capital and share issuance expenses
An equity instrument is any contract that evidences a residual interest in the assets of the Group and of the
Company after deducting all of its liabilities. Ordinary shares are equity instruments.
Ordinary shares are recorded at the proceeds received, net of directly attributable incremental transaction costs.
Ordinary shares are classified as equity. Dividends on ordinary shares are recognised in equity in the period in which
they are declared.
Annual Report 2012 113
Notes to the Financial Statements31 DECEMBER 2012
2. SIGNIFICANT ACCOUNTING POLICIES (continued)
2.28 Treasury shares
When issued shares of the Company are reacquired, the amount of consideration paid is recognised directly
in equity. Reacquired shares that have not been cancelled are classified as treasury shares and presented as a
deduction from total equity. No gain or loss is recognised in profit or loss on the purchase, sale, issue or cancellation
of treasury shares. When treasury shares are reissued by resale, the difference between the sales consideration and
the carrying amount is recognised in equity.
2.29 Segment reporting
For management purposes, the Group is organised into operating segments based on their products and services
which are independently managed by the respective segment managers responsible for the performance of the
respective segments under their charge. The segment managers report directly to the management of the Company
who regularly review the segment results in order to allocate resources to the segments and to assess the segment
performance.
Additional disclosures on each of these segments are shown in Note 39, including the factors used to identify the
reportable segments and the measurement basis of segment information.
2.30 Contingencies
A contingent liability or asset is a possible obligation or asset that arises from past events and whose existence will
be confirmed only by the occurrence or non-occurrence of uncertain future event(s) not wholly within the control
of the Group.
Contingent liabilities and assets are not recognised in the statements of financial position of the Group.
2.31 Financial guarantee contracts
A financial guarantee contract is a contract that requires the issuer to make specified payments to reimburse the
holder for a loss it incurs because a specified debtor fails to make payment when due.
Financial guarantee contracts are recognised initially as a liability at fair value, net of transaction costs. Subsequent
to initial recognition, financial guarantee contracts are recognised as income in profit or loss over the period of the
guarantee. If the debtor fails to make payment relating to financial guarantee contract when it is due and the Group,
as the issuer, is required to reimburse the holder for the associated loss, the liability is measured at the higher of the
best estimate of the expenditure required to settle the present obligation at the reporting date and the amount
initially recognised less cumulative amortisation.
Where financial guarantees in relation to loans or payables of subsidiaries are provided by the Company for no
compensation, the fair values are accounted for as contributions and recognised as part of the cost of investment in
subsidiaries.
HAP SENG CONSOLIDATED BERHAD
Annual Report 2012114
Notes to the Financial Statements31 DECEMBER 2012
3. SIGNIFICANT ACCOUNTING ESTIMATES AND JUDGEMENTS
3.1 Judgements made in applying accounting policies
In the process of applying the Group’s accounting policies, management has made the following judgement, apart
from those involving estimations, which have the most significant effect on the amounts recognised in the financial
statements:
Classification between investment properties and property, plant and equipment
The Group has developed certain criteria based on FRS 140 in making judgement as to whether a property qualifies
as an investment property. Investment property is a property held to earn rentals or for capital appreciation or both.
Some properties comprise a portion that is held to earn rentals or for capital appreciation and another portion that
is held for use in the production or supply of goods or services or for administrative purposes. If these portions
could be sold separately (or leased out separately under a finance lease), the Group would account for the portions
separately. If the portions could not be sold separately, the property is an investment property only if an insignificant
portion is held for use in the production or supply of goods or services or for administrative purposes. Judgement is
made on an individual property basis to determine whether ancillary services are so significant that a property does
not qualify as investment property.
3.2 Key sources of estimation uncertainty
The key assumptions concerning the future and other key sources of estimation uncertainty at the reporting date
that have a significant risk of causing a material adjustment to the carrying amounts of assets and liabilities within
the next financial year are discussed below.
(a) Useful lives of plant and machinery
The cost of plant and machinery is depreciated on a straight-line basis over the assets’ estimated economic
useful lives. Management estimates the useful lives of these plant and machinery to be within 4 to 20 years.
These are common life expectancies applied in the industries that the subsidiaries are operating in. Changes
in the expected level of usage could impact the economic useful lives and the residual values of these
assets, therefore, future depreciation charges could be revised. The carrying amount of the Group’s plant and
machinery at the reporting date is disclosed in Note 4.
(b) Taxes
Uncertainties exist with respect to the interpretation of complex tax regulations, changes in tax laws, and the
amount of timing of future taxable income. Given the variety of businesses in various countries, differences
arising between the actual results and the assumptions made, or future changes to such assumptions, could
necessitate future adjustments to tax income and expenses already recorded. The Group establishes provisions,
based on reasonable estimates, for possible consequences of audits by the tax authorities of the respective tax
countries in which it operates. The amount of such provisions is based on various factors, such as experience of
previous tax audits and differing interpretations of tax regulations by the taxable entity and the responsible tax
authority. Such differences of interpretation may arise on a wide variety of issues depending on the conditions
prevailing in the respective domicile of the Group companies.
Annual Report 2012 115
Notes to the Financial Statements31 DECEMBER 2012
3. SIGNIFICANT ACCOUNTING ESTIMATES AND JUDGEMENTS (continued)
3.2 Key sources of estimation uncertainty (continued)
(b) Taxes (continued)
Deferred tax assets are recognised for all unused tax losses, unabsorbed capital allowances and other
deductible temporary differences to the extent that it is probable that taxable profit will be available against
which the tax losses and capital allowances and other deductible temporary differences can be utilised.
Significant management judgement is required to determine the amount of deferred tax assets that can be
recognised, based upon the likely timing and level of future taxable profits together with future tax planning
strategies. As of 31 December 2012, the Group has deferred tax assets of RM51,378,000 (2011: RM71,746,000).
(c) Write-down of inventories
A review is made periodically on inventory for excess inventory obsolescence and declines in net realisable
value below cost and a reversal or an allowance is recorded against the inventory balance for any such excess
or declines. Possible changes in these estimates would result in revisions to the valuation of inventory.
(d) Property development
The Group recognises property development revenue and expenses in the profit or loss by using the stage
of completion method. The stage of completion is determined by the proportion that property development
costs incurred for work performed to date bear to the estimated total property development costs.
Significant judgement is required in determining the stage of completion, the extent of the property
development costs incurred, the estimated total property development revenue and costs, as well as the
recoverability of the property development costs. In making the judgement, the Group evaluates based on past
experience and by relying on the work of specialists. The carrying amounts of assets and liabilities of the Group
arising from property development activities are disclosed in Note 13.
(e) Impairment of loans and receivables
The Group assesses at each reporting date whether there is any objective evidence that a financial asset is
impaired. To determine whether there is objective evidence of impairment, the Group considers factors such as
the probability of insolvency or significant financial difficulties of the debtor and default or significant delay in
payments.
Where there is objective evidence of impairment, the amount and timing of future cash flows are estimated
based on historical loss experience for assets with similar credit risk characteristics. The carrying amount of
the Group’s loans and receivables at the reporting date is disclosed in Note 14. As at 31 December 2012, the
allowance for impairment of the Group is RM12,942,000 (2011: RM15,093,000).
(f) Material litigation
The Group determines whether a present obligation in relation to a material litigation exists at the reporting
date by taking into account all available evidence, including the opinion of its solicitors and subsequent
events after the reporting date. On the basis of such evidence, the Group evaluates if a provision needs to
be recognised in the financial statements. Further details of the material litigation involving the Group are
disclosed in Note 34.
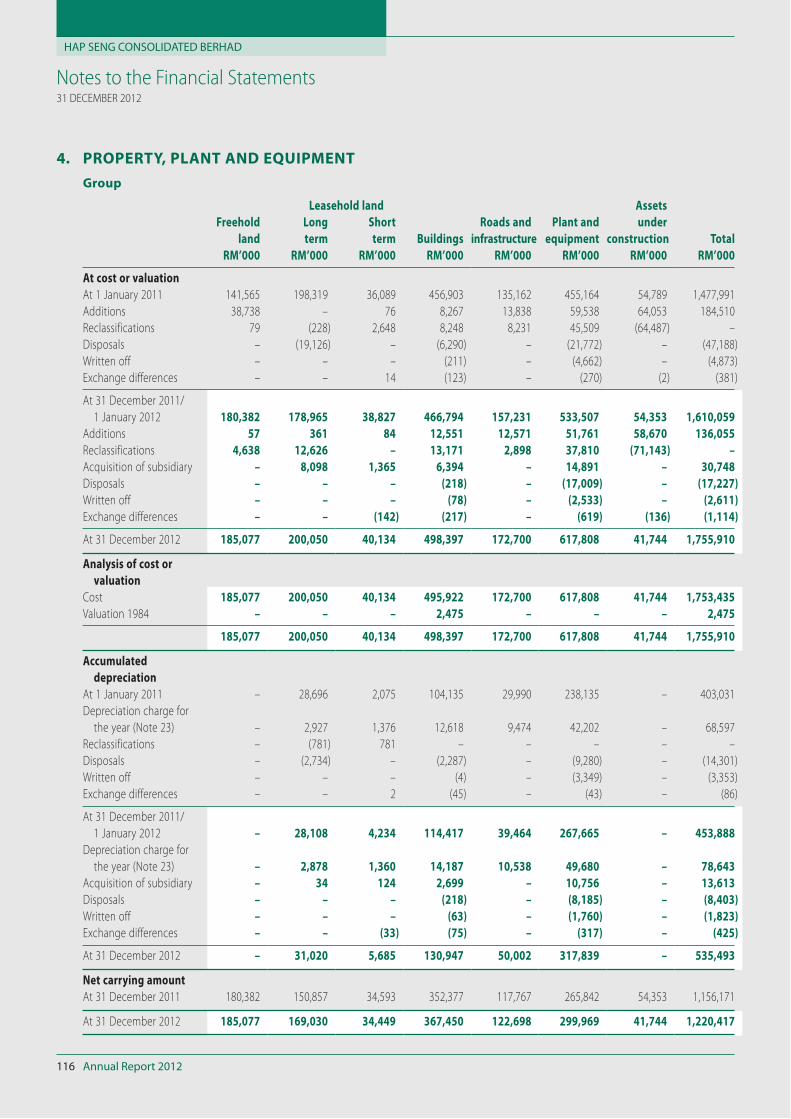
HAP SENG CONSOLIDATED BERHAD
Annual Report 2012116
Notes to the Financial Statements31 DECEMBER 2012
4. PROPERTY, PLANT AND EQUIPMENT
Group
Leasehold land Assets
Freehold Long Short Roads and Plant and under
land term term Buildings infrastructure equipment construction Total
RM’000 RM’000 RM’000 RM’000 RM’000 RM’000 RM’000 RM’000
At cost or valuation
At 1 January 2011 141,565 198,319 36,089 456,903 135,162 455,164 54,789 1,477,991
Additions 38,738 – 76 8,267 13,838 59,538 64,053 184,510
Reclassifications 79 (228) 2,648 8,248 8,231 45,509 (64,487) –
Disposals – (19,126) – (6,290) – (21,772) – (47,188)
Written off – – – (211) – (4,662) – (4,873)
Exchange differences – – 14 (123) – (270) (2) (381)
At 31 December 2011/
1 January 2012 180,382 178,965 38,827 466,794 157,231 533,507 54,353 1,610,059
Additions 57 361 84 12,551 12,571 51,761 58,670 136,055
Reclassifications 4,638 12,626 – 13,171 2,898 37,810 (71,143) –
Acquisition of subsidiary – 8,098 1,365 6,394 – 14,891 – 30,748
Disposals – – – (218) – (17,009) – (17,227)
Written off – – – (78) – (2,533) – (2,611)
Exchange differences – – (142) (217) – (619) (136) (1,114)
At 31 December 2012 185,077 200,050 40,134 498,397 172,700 617,808 41,744 1,755,910
Analysis of cost or
valuation
Cost 185,077 200,050 40,134 495,922 172,700 617,808 41,744 1,753,435
Valuation 1984 – – – 2,475 – – – 2,475
185,077 200,050 40,134 498,397 172,700 617,808 41,744 1,755,910
Accumulated
depreciation
At 1 January 2011 – 28,696 2,075 104,135 29,990 238,135 – 403,031
Depreciation charge for
the year (Note 23) – 2,927 1,376 12,618 9,474 42,202 – 68,597
Reclassifications – (781) 781 – – – – –
Disposals – (2,734) – (2,287) – (9,280) – (14,301)
Written off – – – (4) – (3,349) – (3,353)
Exchange differences – – 2 (45) – (43) – (86)
At 31 December 2011/
1 January 2012 – 28,108 4,234 114,417 39,464 267,665 – 453,888
Depreciation charge for
the year (Note 23) – 2,878 1,360 14,187 10,538 49,680 – 78,643
Acquisition of subsidiary – 34 124 2,699 – 10,756 – 13,613
Disposals – – – (218) – (8,185) – (8,403)
Written off – – – (63) – (1,760) – (1,823)
Exchange differences – – (33) (75) – (317) – (425)
At 31 December 2012 – 31,020 5,685 130,947 50,002 317,839 – 535,493
Net carrying amount
At 31 December 2011 180,382 150,857 34,593 352,377 117,767 265,842 54,353 1,156,171
At 31 December 2012 185,077 169,030 34,449 367,450 122,698 299,969 41,744 1,220,417
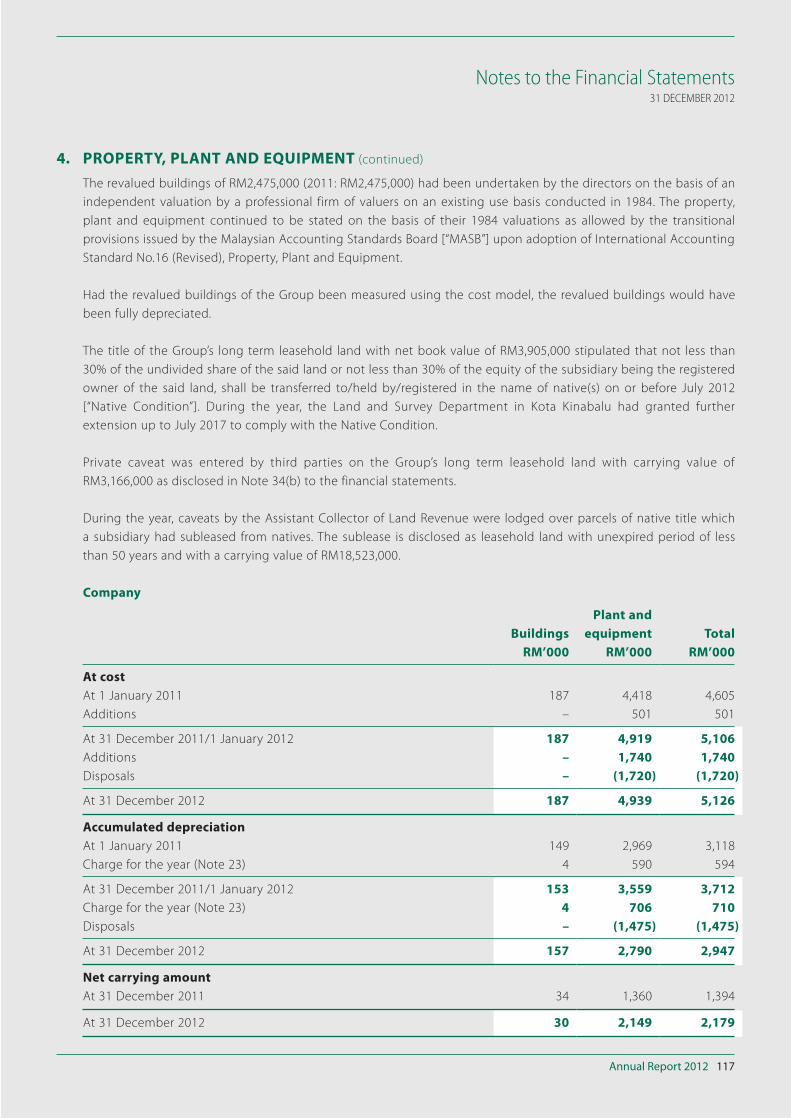
Annual Report 2012 117
Notes to the Financial Statements31 DECEMBER 2012
4. PROPERTY, PLANT AND EQUIPMENT (continued)
The revalued buildings of RM2,475,000 (2011: RM2,475,000) had been undertaken by the directors on the basis of an
independent valuation by a professional firm of valuers on an existing use basis conducted in 1984. The property,
plant and equipment continued to be stated on the basis of their 1984 valuations as allowed by the transitional
provisions issued by the Malaysian Accounting Standards Board [“MASB”] upon adoption of International Accounting
Standard No.16 (Revised), Property, Plant and Equipment.
Had the revalued buildings of the Group been measured using the cost model, the revalued buildings would have
been fully depreciated.
The title of the Group’s long term leasehold land with net book value of RM3,905,000 stipulated that not less than
30% of the undivided share of the said land or not less than 30% of the equity of the subsidiary being the registered
owner of the said land, shall be transferred to/held by/registered in the name of native(s) on or before July 2012
[“Native Condition”]. During the year, the Land and Survey Department in Kota Kinabalu had granted further
extension up to July 2017 to comply with the Native Condition.
Private caveat was entered by third parties on the Group’s long term leasehold land with carrying value of
RM3,166,000 as disclosed in Note 34(b) to the financial statements.
During the year, caveats by the Assistant Collector of Land Revenue were lodged over parcels of native title which
a subsidiary had subleased from natives. The sublease is disclosed as leasehold land with unexpired period of less
than 50 years and with a carrying value of RM18,523,000.
Company
Buildings
Plant and
equipment Total
RM’000 RM’000 RM’000
At cost
At 1 January 2011 187 4,418 4,605
Additions – 501 501
At 31 December 2011/1 January 2012 187 4,919 5,106
Additions – 1,740 1,740
Disposals – (1,720) (1,720)
At 31 December 2012 187 4,939 5,126
Accumulated depreciation
At 1 January 2011 149 2,969 3,118
Charge for the year (Note 23) 4 590 594
At 31 December 2011/1 January 2012 153 3,559 3,712
Charge for the year (Note 23) 4 706 710
Disposals – (1,475) (1,475)
At 31 December 2012 157 2,790 2,947
Net carrying amount
At 31 December 2011 34 1,360 1,394
At 31 December 2012 30 2,149 2,179
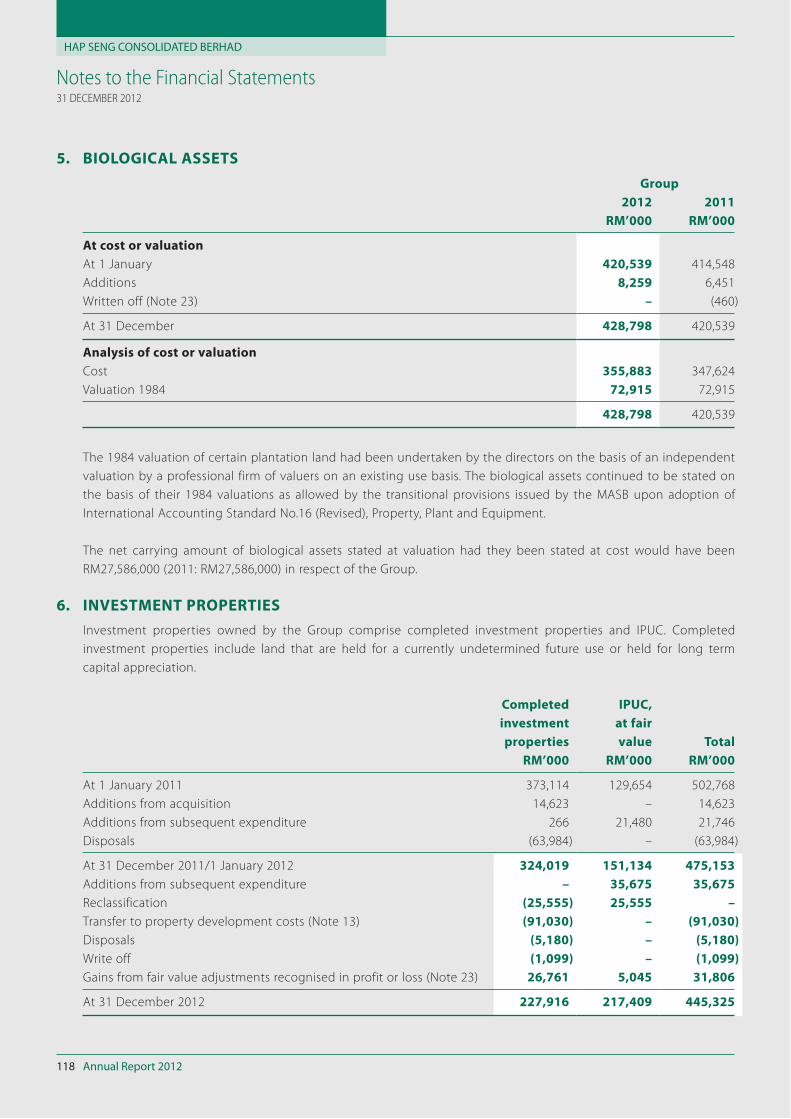
HAP SENG CONSOLIDATED BERHAD
Annual Report 2012118
Notes to the Financial Statements31 DECEMBER 2012
5. BIOLOGICAL ASSETS
Group
2012 2011
RM’000 RM’000
At cost or valuation
At 1 January 420,539 414,548
Additions 8,259 6,451
Written off (Note 23) – (460)
At 31 December 428,798 420,539
Analysis of cost or valuation
Cost 355,883 347,624
Valuation 1984 72,915 72,915
428,798 420,539
The 1984 valuation of certain plantation land had been undertaken by the directors on the basis of an independent
valuation by a professional firm of valuers on an existing use basis. The biological assets continued to be stated on
the basis of their 1984 valuations as allowed by the transitional provisions issued by the MASB upon adoption of
International Accounting Standard No.16 (Revised), Property, Plant and Equipment.
The net carrying amount of biological assets stated at valuation had they been stated at cost would have been
RM27,586,000 (2011: RM27,586,000) in respect of the Group.
6. INVESTMENT PROPERTIES
Investment properties owned by the Group comprise completed investment properties and IPUC. Completed
investment properties include land that are held for a currently undetermined future use or held for long term
capital appreciation.
Completed
investment
properties
IPUC,
at fair
value Total
RM’000 RM’000 RM’000
At 1 January 2011 373,114 129,654 502,768
Additions from acquisition 14,623 – 14,623
Additions from subsequent expenditure 266 21,480 21,746
Disposals (63,984) – (63,984)
At 31 December 2011/1 January 2012 324,019 151,134 475,153
Additions from subsequent expenditure – 35,675 35,675
Reclassification (25,555) 25,555 –
Transfer to property development costs (Note 13) (91,030) – (91,030)
Disposals (5,180) – (5,180)
Write off (1,099) – (1,099)
Gains from fair value adjustments recognised in profit or loss (Note 23) 26,761 5,045 31,806
At 31 December 2012 227,916 217,409 445,325
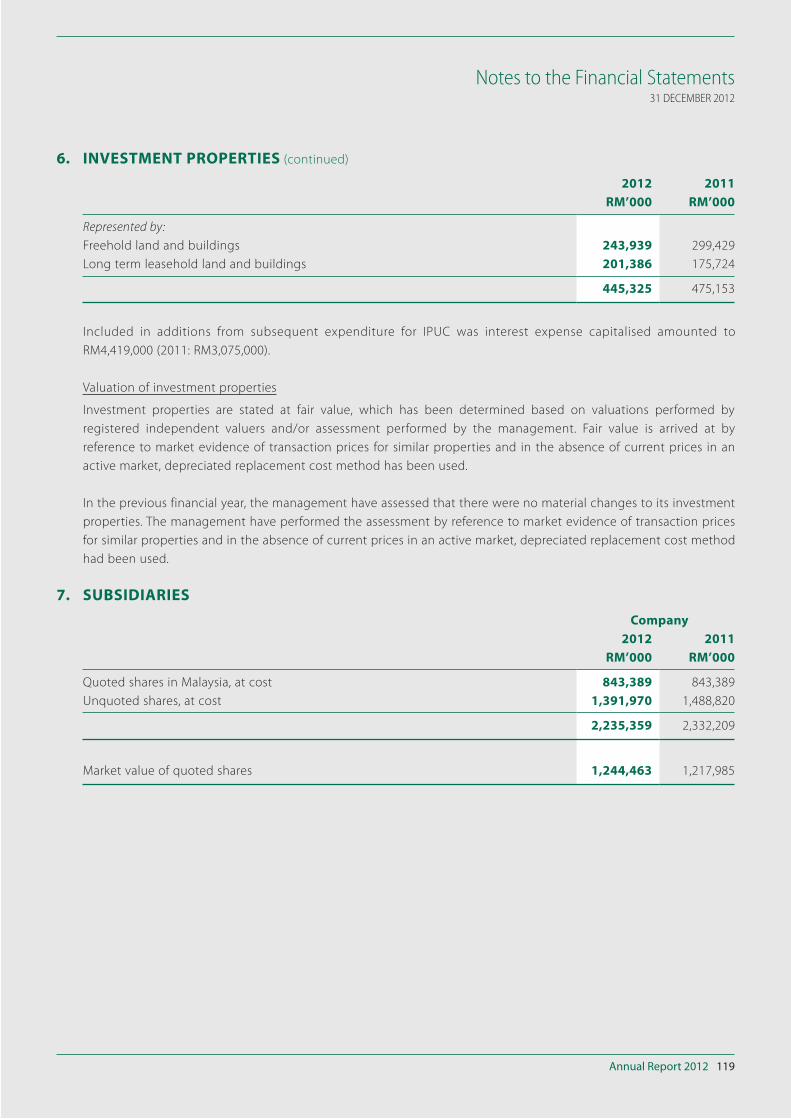
Annual Report 2012 119
Notes to the Financial Statements31 DECEMBER 2012
6. INVESTMENT PROPERTIES (continued)
2012 2011
RM’000 RM’000
Represented by:
Freehold land and buildings 243,939 299,429
Long term leasehold land and buildings 201,386 175,724
445,325 475,153
Included in additions from subsequent expenditure for IPUC was interest expense capitalised amounted to
RM4,419,000 (2011: RM3,075,000).
Valuation of investment properties
Investment properties are stated at fair value, which has been determined based on valuations performed by
registered independent valuers and/or assessment performed by the management. Fair value is arrived at by
reference to market evidence of transaction prices for similar properties and in the absence of current prices in an
active market, depreciated replacement cost method has been used.
In the previous financial year, the management have assessed that there were no material changes to its investment
properties. The management have performed the assessment by reference to market evidence of transaction prices
for similar properties and in the absence of current prices in an active market, depreciated replacement cost method
had been used.
7. SUBSIDIARIES
Company
2012 2011
RM’000 RM’000
Quoted shares in Malaysia, at cost 843,389 843,389
Unquoted shares, at cost 1,391,970 1,488,820
2,235,359 2,332,209
Market value of quoted shares 1,244,463 1,217,985
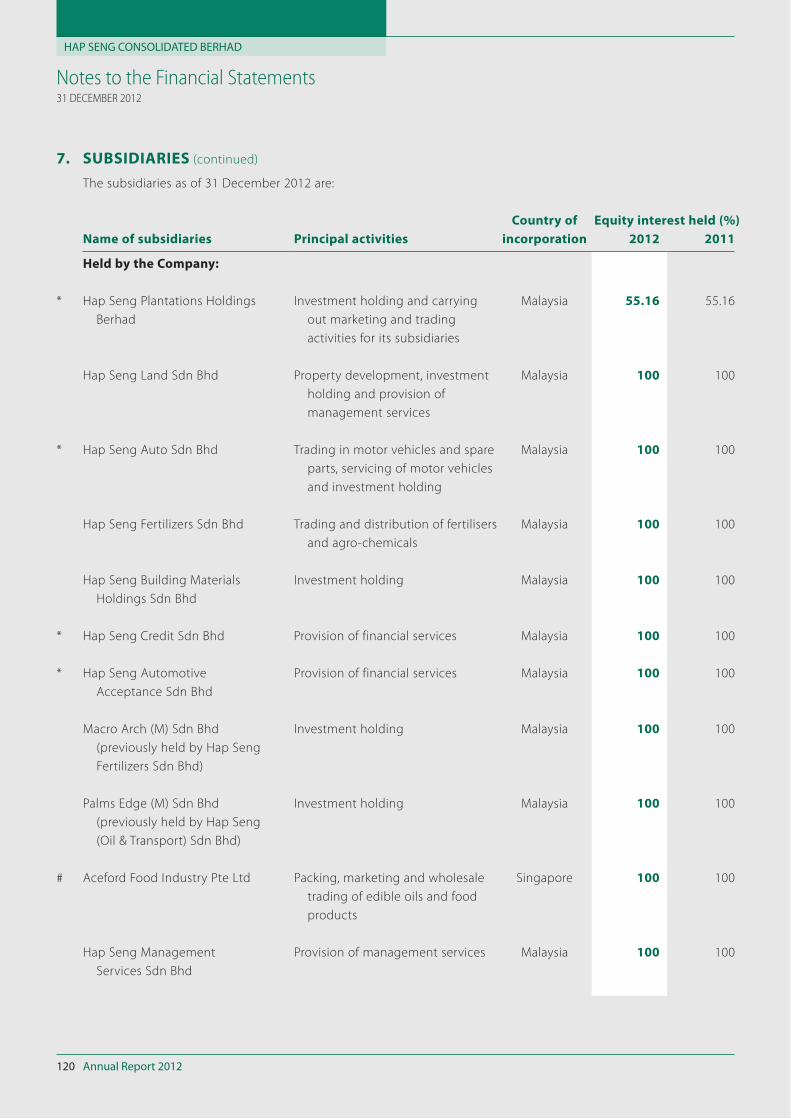
HAP SENG CONSOLIDATED BERHAD
Annual Report 2012120
Notes to the Financial Statements31 DECEMBER 2012
7. SUBSIDIARIES (continued)
The subsidiaries as of 31 December 2012 are:
Name of subsidiaries Principal activities
Country of
incorporation
Equity interest held (%)
2012 2011
Held by the Company:
* Hap Seng Plantations Holdings
Berhad
Investment holding and carrying
out marketing and trading
activities for its subsidiaries
Malaysia 55.16 55.16
Hap Seng Land Sdn Bhd Property development, investment
holding and provision of
management services
Malaysia 100 100
* Hap Seng Auto Sdn Bhd Trading in motor vehicles and spare
parts, servicing of motor vehicles
and investment holding
Malaysia 100 100
Hap Seng Fertilizers Sdn Bhd Trading and distribution of fertilisers
and agro-chemicals
Malaysia 100 100
Hap Seng Building Materials
Holdings Sdn Bhd
Investment holding Malaysia 100 100
* Hap Seng Credit Sdn Bhd Provision of financial services Malaysia 100 100
* Hap Seng Automotive
Acceptance Sdn Bhd
Provision of financial services Malaysia 100 100
Macro Arch (M) Sdn Bhd
(previously held by Hap Seng
Fertilizers Sdn Bhd)
Investment holding Malaysia 100 100
Palms Edge (M) Sdn Bhd
(previously held by Hap Seng
(Oil & Transport) Sdn Bhd)
Investment holding Malaysia 100 100
# Aceford Food Industry Pte Ltd Packing, marketing and wholesale
trading of edible oils and food
products
Singapore 100 100
Hap Seng Management
Services Sdn Bhd
Provision of management services Malaysia 100 100
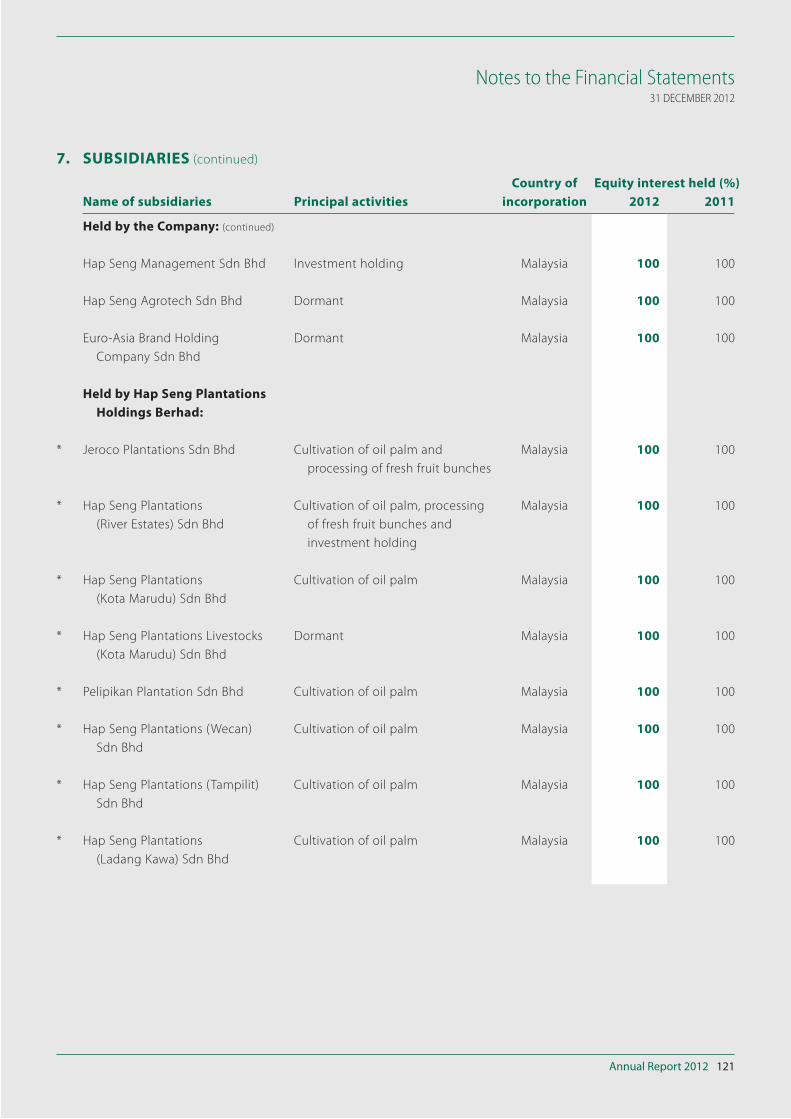
Annual Report 2012 121
Notes to the Financial Statements31 DECEMBER 2012
Name of subsidiaries Principal activities
Country of
incorporation
Equity interest held (%)
2012 2011
Held by the Company: (continued)
Hap Seng Management Sdn Bhd Investment holding Malaysia 100 100
Hap Seng Agrotech Sdn Bhd Dormant Malaysia 100 100
Euro-Asia Brand Holding
Company Sdn Bhd
Dormant Malaysia 100 100
Held by Hap Seng Plantations
Holdings Berhad:
* Jeroco Plantations Sdn Bhd Cultivation of oil palm and
processing of fresh fruit bunches
Malaysia 100 100
* Hap Seng Plantations
(River Estates) Sdn Bhd
Cultivation of oil palm, processing
of fresh fruit bunches and
investment holding
Malaysia 100 100
* Hap Seng Plantations
(Kota Marudu) Sdn Bhd
Cultivation of oil palm Malaysia 100 100
* Hap Seng Plantations Livestocks
(Kota Marudu) Sdn Bhd
Dormant Malaysia 100 100
* Pelipikan Plantation Sdn Bhd Cultivation of oil palm Malaysia 100 100
* Hap Seng Plantations (Wecan)
Sdn Bhd
Cultivation of oil palm Malaysia 100 100
* Hap Seng Plantations (Tampilit)
Sdn Bhd
Cultivation of oil palm Malaysia 100 100
* Hap Seng Plantations
(Ladang Kawa) Sdn Bhd
Cultivation of oil palm Malaysia 100 100
7. SUBSIDIARIES (continued)
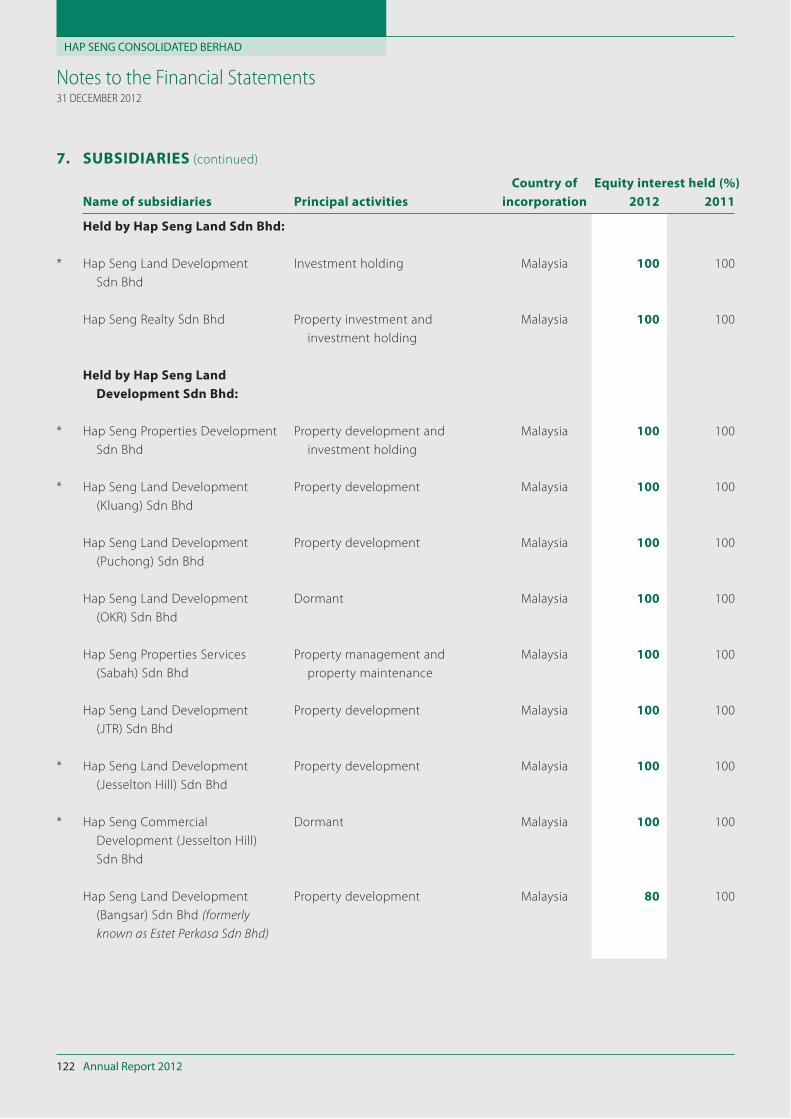
HAP SENG CONSOLIDATED BERHAD
Annual Report 2012122
Notes to the Financial Statements31 DECEMBER 2012
Name of subsidiaries Principal activities
Country of
incorporation
Equity interest held (%)
2012 2011
Held by Hap Seng Land Sdn Bhd:
* Hap Seng Land Development
Sdn Bhd
Investment holding Malaysia 100 100
Hap Seng Realty Sdn Bhd Property investment and
investment holding
Malaysia 100 100
Held by Hap Seng Land
Development Sdn Bhd:
* Hap Seng Properties Development
Sdn Bhd
Property development and
investment holding
Malaysia 100 100
* Hap Seng Land Development
(Kluang) Sdn Bhd
Property development Malaysia 100 100
Hap Seng Land Development
(Puchong) Sdn Bhd
Property development Malaysia 100 100
Hap Seng Land Development
(OKR) Sdn Bhd
Dormant Malaysia 100 100
Hap Seng Properties Services
(Sabah) Sdn Bhd
Property management and
property maintenance
Malaysia 100 100
Hap Seng Land Development
(JTR) Sdn Bhd
Property development Malaysia 100 100
* Hap Seng Land Development
(Jesselton Hill) Sdn Bhd
Property development Malaysia 100 100
* Hap Seng Commercial
Development (Jesselton Hill)
Sdn Bhd
Dormant Malaysia 100 100
Hap Seng Land Development
(Bangsar) Sdn Bhd (formerly
known as Estet Perkasa Sdn Bhd)
Property development Malaysia 80 100
7. SUBSIDIARIES (continued)
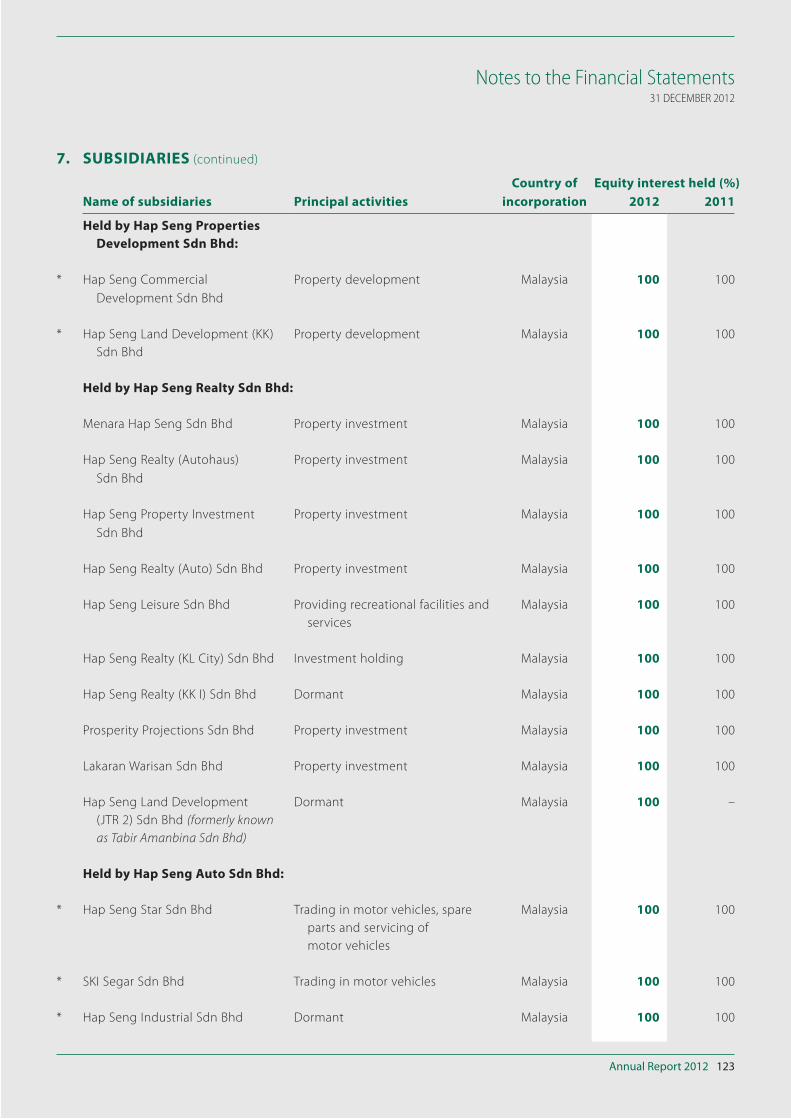
Annual Report 2012 123
Notes to the Financial Statements31 DECEMBER 2012
Name of subsidiaries Principal activities
Country of
incorporation
Equity interest held (%)
2012 2011
Held by Hap Seng Properties
Development Sdn Bhd:
* Hap Seng Commercial
Development Sdn Bhd
Property development Malaysia 100 100
* Hap Seng Land Development (KK)
Sdn Bhd
Property development Malaysia 100 100
Held by Hap Seng Realty Sdn Bhd:
Menara Hap Seng Sdn Bhd Property investment Malaysia 100 100
Hap Seng Realty (Autohaus)
Sdn Bhd
Property investment Malaysia 100 100
Hap Seng Property Investment
Sdn Bhd
Property investment Malaysia 100 100
Hap Seng Realty (Auto) Sdn Bhd Property investment Malaysia 100 100
Hap Seng Leisure Sdn Bhd Providing recreational facilities and
services
Malaysia 100 100
Hap Seng Realty (KL City) Sdn Bhd Investment holding Malaysia 100 100
Hap Seng Realty (KK I) Sdn Bhd Dormant Malaysia 100 100
Prosperity Projections Sdn Bhd Property investment Malaysia 100 100
Lakaran Warisan Sdn Bhd Property investment Malaysia 100 100
Hap Seng Land Development
(JTR 2) Sdn Bhd (formerly known
as Tabir Amanbina Sdn Bhd)
Dormant Malaysia 100 –
Held by Hap Seng Auto Sdn Bhd:
* Hap Seng Star Sdn Bhd Trading in motor vehicles, spare
parts and servicing of
motor vehicles
Malaysia 100 100
* SKI Segar Sdn Bhd Trading in motor vehicles Malaysia 100 100
* Hap Seng Industrial Sdn Bhd Dormant Malaysia 100 100
7. SUBSIDIARIES (continued)
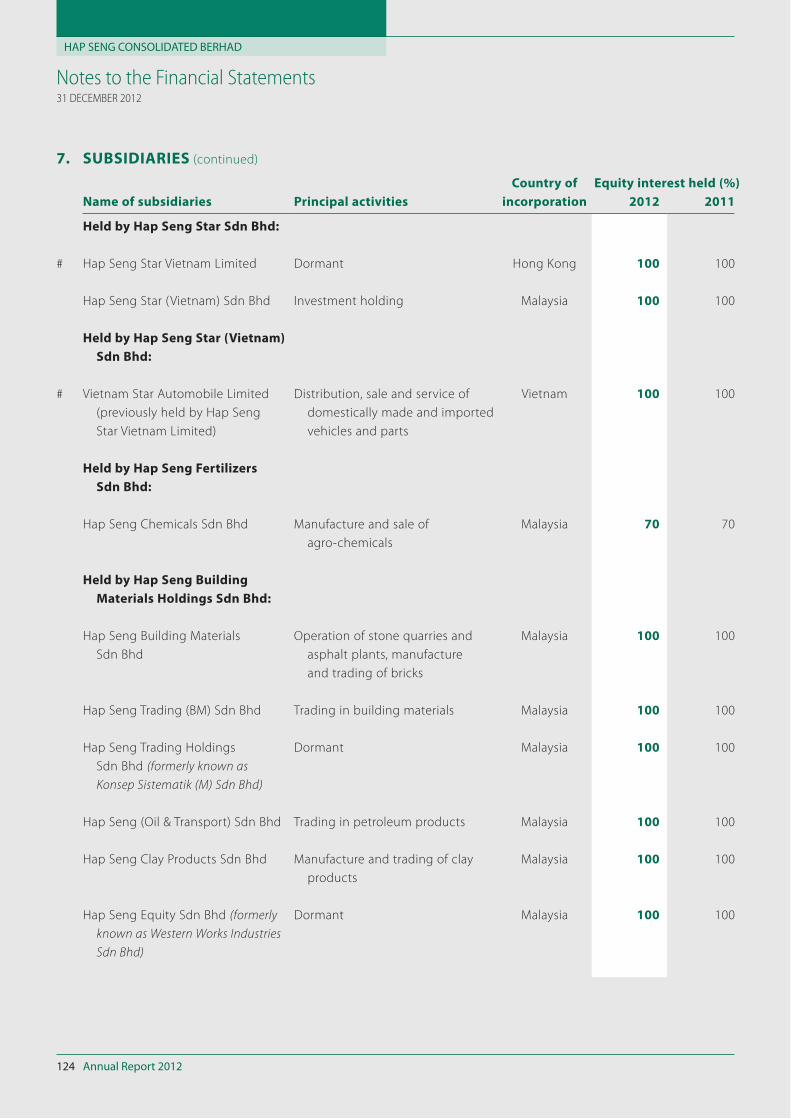
HAP SENG CONSOLIDATED BERHAD
Annual Report 2012124
Notes to the Financial Statements31 DECEMBER 2012
Name of subsidiaries Principal activities
Country of
incorporation
Equity interest held (%)
2012 2011
Held by Hap Seng Star Sdn Bhd:
# Hap Seng Star Vietnam Limited Dormant Hong Kong 100 100
Hap Seng Star (Vietnam) Sdn Bhd Investment holding Malaysia 100 100
Held by Hap Seng Star (Vietnam)
Sdn Bhd:
# Vietnam Star Automobile Limited
(previously held by Hap Seng
Star Vietnam Limited)
Distribution, sale and service of
domestically made and imported
vehicles and parts
Vietnam 100 100
Held by Hap Seng Fertilizers
Sdn Bhd:
Hap Seng Chemicals Sdn Bhd Manufacture and sale of
agro-chemicals
Malaysia 70 70
Held by Hap Seng Building
Materials Holdings Sdn Bhd:
Hap Seng Building Materials
Sdn Bhd
Operation of stone quarries and
asphalt plants, manufacture
and trading of bricks
Malaysia 100 100
Hap Seng Trading (BM) Sdn Bhd Trading in building materials Malaysia 100 100
Hap Seng Trading Holdings
Sdn Bhd (formerly known as
Konsep Sistematik (M) Sdn Bhd)
Dormant Malaysia 100 100
Hap Seng (Oil & Transport) Sdn Bhd Trading in petroleum products Malaysia 100 100
Hap Seng Clay Products Sdn Bhd Manufacture and trading of clay
products
Malaysia 100 100
Hap Seng Equity Sdn Bhd (formerly
known as Western Works Industries
Sdn Bhd)
Dormant Malaysia 100 100
7. SUBSIDIARIES (continued)
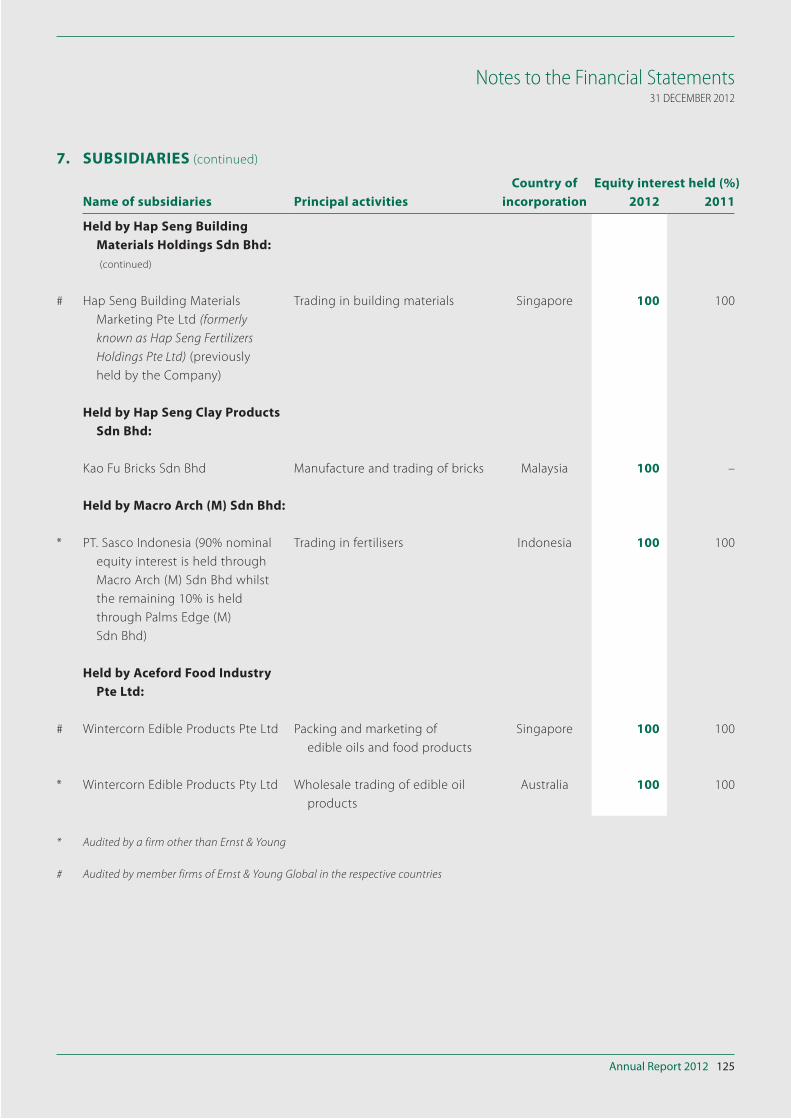
Annual Report 2012 125
Notes to the Financial Statements31 DECEMBER 2012
Name of subsidiaries Principal activities
Country of
incorporation
Equity interest held (%)
2012 2011
Held by Hap Seng Building
Materials Holdings Sdn Bhd:
(continued)
# Hap Seng Building Materials
Marketing Pte Ltd (formerly
known as Hap Seng Fertilizers
Holdings Pte Ltd) (previously
held by the Company)
Trading in building materials Singapore 100 100
Held by Hap Seng Clay Products
Sdn Bhd:
Kao Fu Bricks Sdn Bhd Manufacture and trading of bricks Malaysia 100 –
Held by Macro Arch (M) Sdn Bhd:
* PT. Sasco Indonesia (90% nominal
equity interest is held through
Macro Arch (M) Sdn Bhd whilst
the remaining 10% is held
through Palms Edge (M)
Sdn Bhd)
Trading in fertilisers Indonesia 100 100
Held by Aceford Food Industry
Pte Ltd:
# Wintercorn Edible Products Pte Ltd Packing and marketing of
edible oils and food products
Singapore 100 100
* Wintercorn Edible Products Pty Ltd Wholesale trading of edible oil
products
Australia 100 100
* Audited by a firm other than Ernst & Young
# Audited by member firms of Ernst & Young Global in the respective countries
7. SUBSIDIARIES (continued)
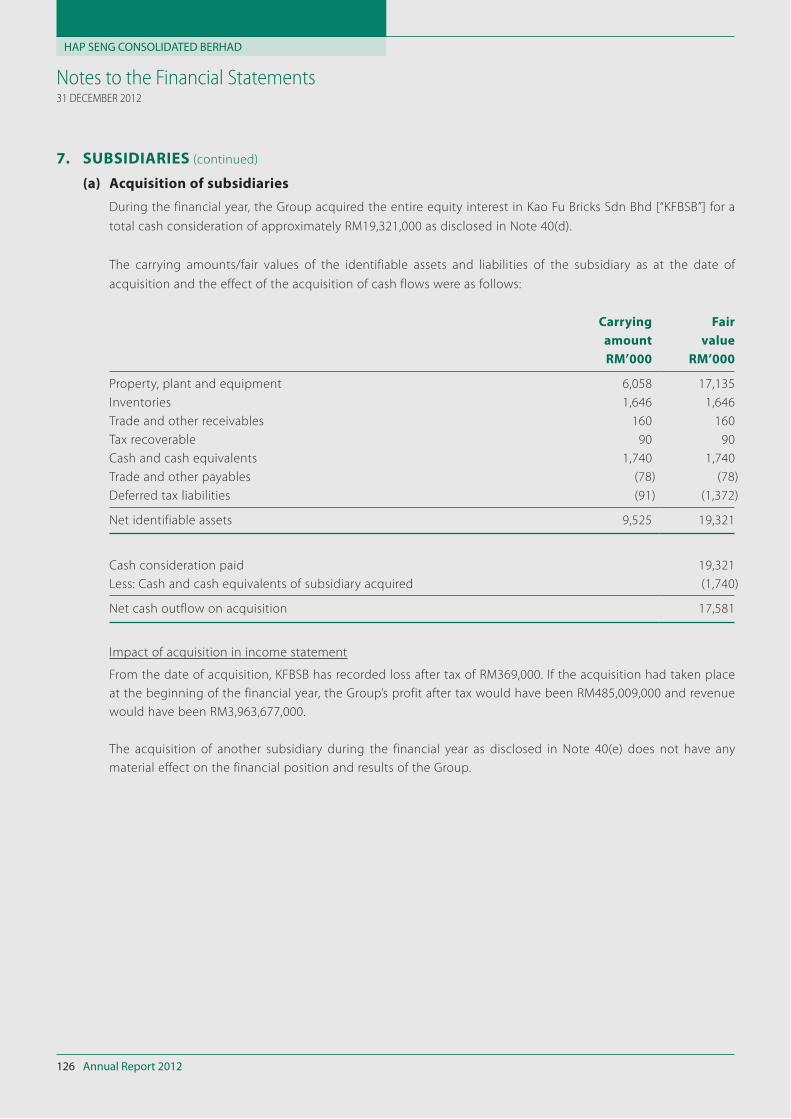
HAP SENG CONSOLIDATED BERHAD
Annual Report 2012126
Notes to the Financial Statements31 DECEMBER 2012
7. SUBSIDIARIES (continued)
(a) Acquisition of subsidiaries
During the financial year, the Group acquired the entire equity interest in Kao Fu Bricks Sdn Bhd [“KFBSB”] for a
total cash consideration of approximately RM19,321,000 as disclosed in Note 40(d).
The carrying amounts/fair values of the identifiable assets and liabilities of the subsidiary as at the date of
acquisition and the effect of the acquisition of cash flows were as follows:
Carrying
amount
Fair
value
RM’000 RM’000
Property, plant and equipment 6,058 17,135
Inventories 1,646 1,646
Trade and other receivables 160 160
Tax recoverable 90 90
Cash and cash equivalents 1,740 1,740
Trade and other payables (78) (78)
Deferred tax liabilities (91) (1,372)
Net identifiable assets 9,525 19,321
Cash consideration paid 19,321
Less: Cash and cash equivalents of subsidiary acquired (1,740)
Net cash outflow on acquisition 17,581
Impact of acquisition in income statement
From the date of acquisition, KFBSB has recorded loss after tax of RM369,000. If the acquisition had taken place
at the beginning of the financial year, the Group’s profit after tax would have been RM485,009,000 and revenue
would have been RM3,963,677,000.
The acquisition of another subsidiary during the financial year as disclosed in Note 40(e) does not have any
material effect on the financial position and results of the Group.
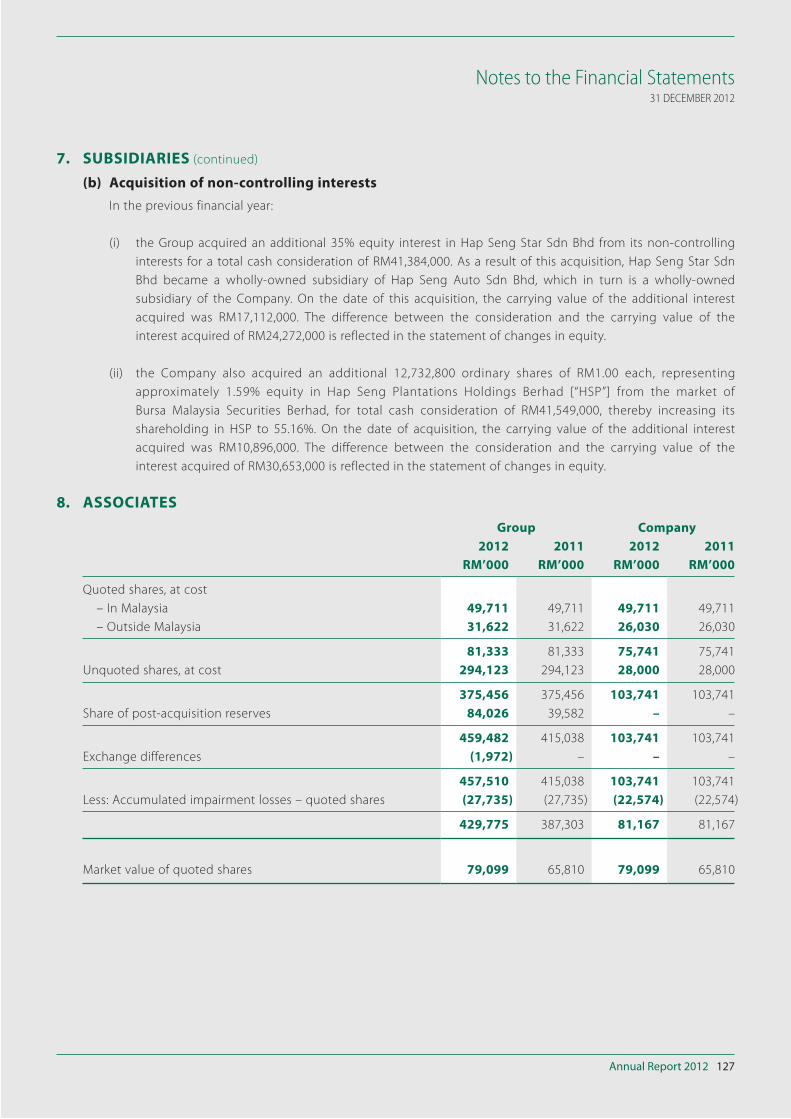
Annual Report 2012 127
Notes to the Financial Statements31 DECEMBER 2012
7. SUBSIDIARIES (continued)
(b) Acquisition of non-controlling interests
In the previous financial year:
(i) the Group acquired an additional 35% equity interest in Hap Seng Star Sdn Bhd from its non-controlling
interests for a total cash consideration of RM41,384,000. As a result of this acquisition, Hap Seng Star Sdn
Bhd became a wholly-owned subsidiary of Hap Seng Auto Sdn Bhd, which in turn is a wholly-owned
subsidiary of the Company. On the date of this acquisition, the carrying value of the additional interest
acquired was RM17,112,000. The difference between the consideration and the carrying value of the
interest acquired of RM24,272,000 is reflected in the statement of changes in equity.
(ii) the Company also acquired an additional 12,732,800 ordinary shares of RM1.00 each, representing
approximately 1.59% equity in Hap Seng Plantations Holdings Berhad [“HSP”] from the market of
Bursa Malaysia Securities Berhad, for total cash consideration of RM41,549,000, thereby increasing its
shareholding in HSP to 55.16%. On the date of acquisition, the carrying value of the additional interest
acquired was RM10,896,000. The difference between the consideration and the carrying value of the
interest acquired of RM30,653,000 is reflected in the statement of changes in equity.
8. ASSOCIATES
Group Company
2012 2011 2012 2011
RM’000 RM’000 RM’000 RM’000
Quoted shares, at cost
– In Malaysia 49,711 49,711 49,711 49,711
– Outside Malaysia 31,622 31,622 26,030 26,030
81,333 81,333 75,741 75,741
Unquoted shares, at cost 294,123 294,123 28,000 28,000
375,456 375,456 103,741 103,741
Share of post-acquisition reserves 84,026 39,582 – –
459,482 415,038 103,741 103,741
Exchange differences (1,972) – – –
457,510 415,038 103,741 103,741
Less: Accumulated impairment losses – quoted shares (27,735) (27,735) (22,574) (22,574)
429,775 387,303 81,167 81,167
Market value of quoted shares 79,099 65,810 79,099 65,810
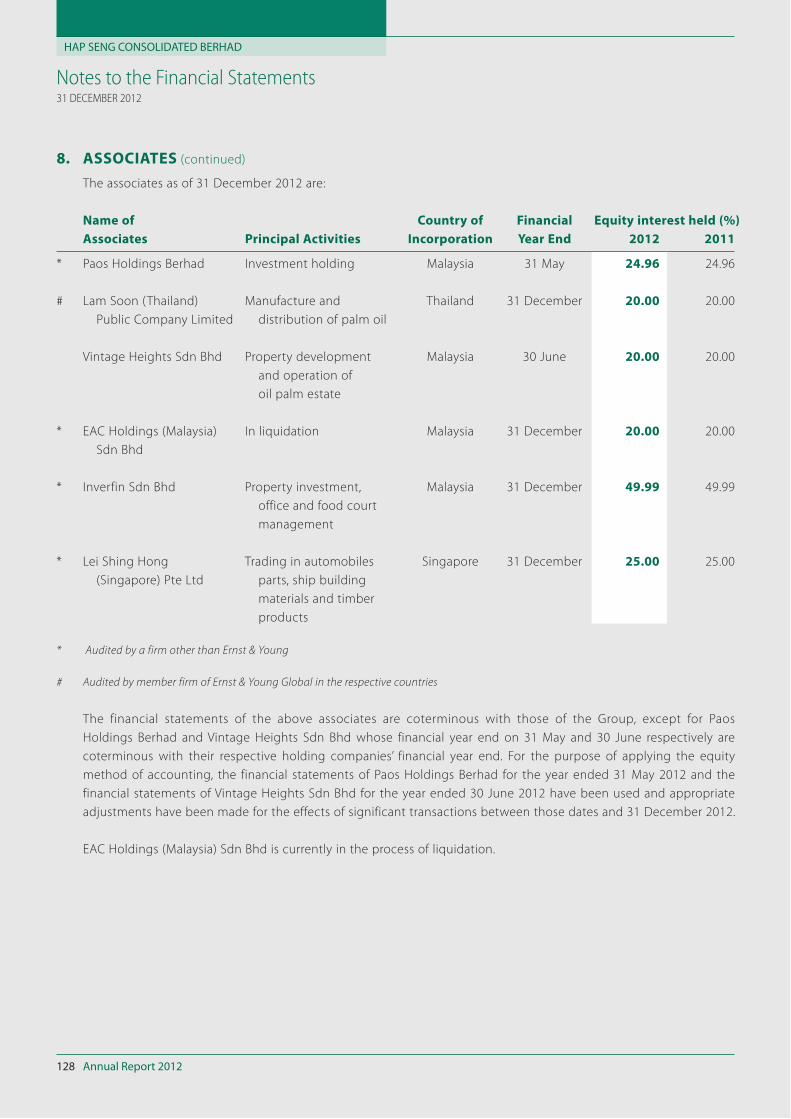
HAP SENG CONSOLIDATED BERHAD
Annual Report 2012128
Notes to the Financial Statements31 DECEMBER 2012
8. ASSOCIATES (continued)
The associates as of 31 December 2012 are:
Name of
Associates Principal Activities
Country of
Incorporation
Financial
Year End
Equity interest held (%)
2012 2011
* Paos Holdings Berhad Investment holding Malaysia 31 May 24.96 24.96
# Lam Soon (Thailand)
Public Company Limited
Manufacture and
distribution of palm oil
Thailand 31 December 20.00 20.00
Vintage Heights Sdn Bhd Property development
and operation of
oil palm estate
Malaysia 30 June 20.00 20.00
* EAC Holdings (Malaysia)
Sdn Bhd
In liquidation Malaysia 31 December 20.00 20.00
* Inverfin Sdn Bhd Property investment,
office and food court
management
Malaysia 31 December 49.99 49.99
* Lei Shing Hong
(Singapore) Pte Ltd
Trading in automobiles
parts, ship building
materials and timber
products
Singapore 31 December 25.00 25.00
* Audited by a firm other than Ernst & Young
# Audited by member firm of Ernst & Young Global in the respective countries
The financial statements of the above associates are coterminous with those of the Group, except for Paos
Holdings Berhad and Vintage Heights Sdn Bhd whose financial year end on 31 May and 30 June respectively are
coterminous with their respective holding companies’ financial year end. For the purpose of applying the equity
method of accounting, the financial statements of Paos Holdings Berhad for the year ended 31 May 2012 and the
financial statements of Vintage Heights Sdn Bhd for the year ended 30 June 2012 have been used and appropriate
adjustments have been made for the effects of significant transactions between those dates and 31 December 2012.
EAC Holdings (Malaysia) Sdn Bhd is currently in the process of liquidation.
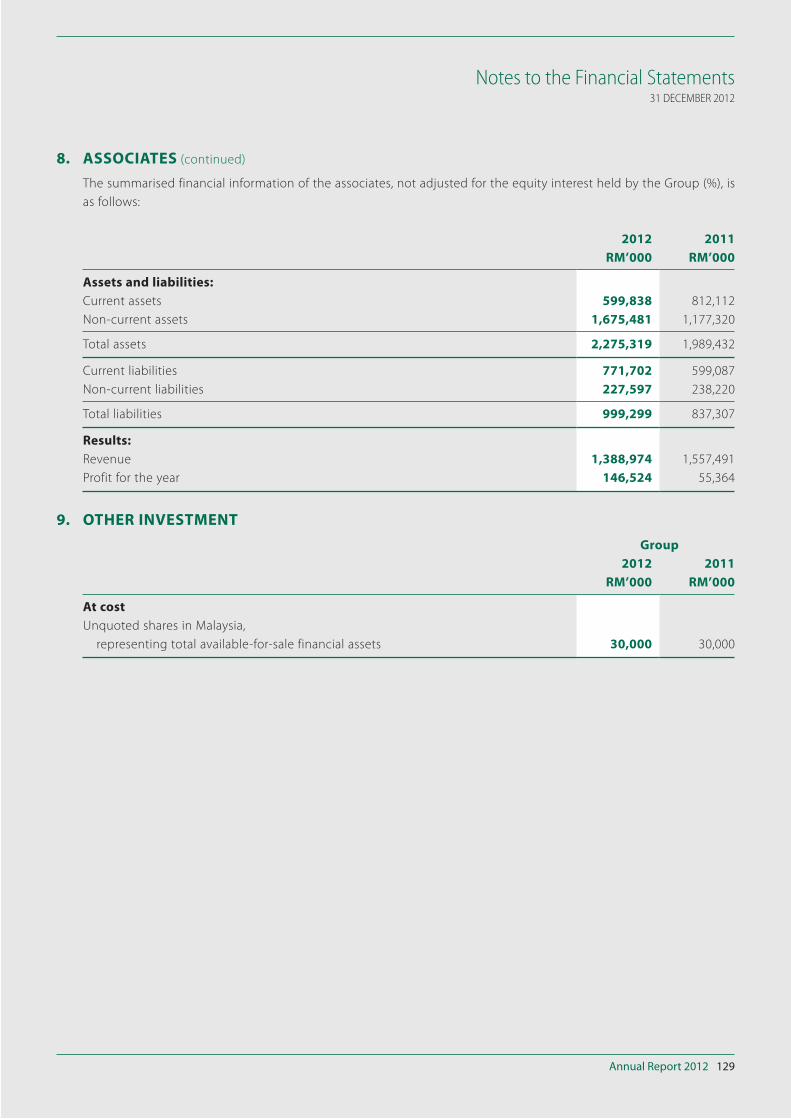
Annual Report 2012 129
Notes to the Financial Statements31 DECEMBER 2012
8. ASSOCIATES (continued)
The summarised financial information of the associates, not adjusted for the equity interest held by the Group (%), is
as follows:
2012 2011
RM’000 RM’000
Assets and liabilities:
Current assets 599,838 812,112
Non-current assets 1,675,481 1,177,320
Total assets 2,275,319 1,989,432
Current liabilities 771,702 599,087
Non-current liabilities 227,597 238,220
Total liabilities 999,299 837,307
Results:
Revenue 1,388,974 1,557,491
Profit for the year 146,524 55,364
9. OTHER INVESTMENT
Group
2012 2011
RM’000 RM’000
At cost
Unquoted shares in Malaysia,
representing total available-for-sale financial assets 30,000 30,000
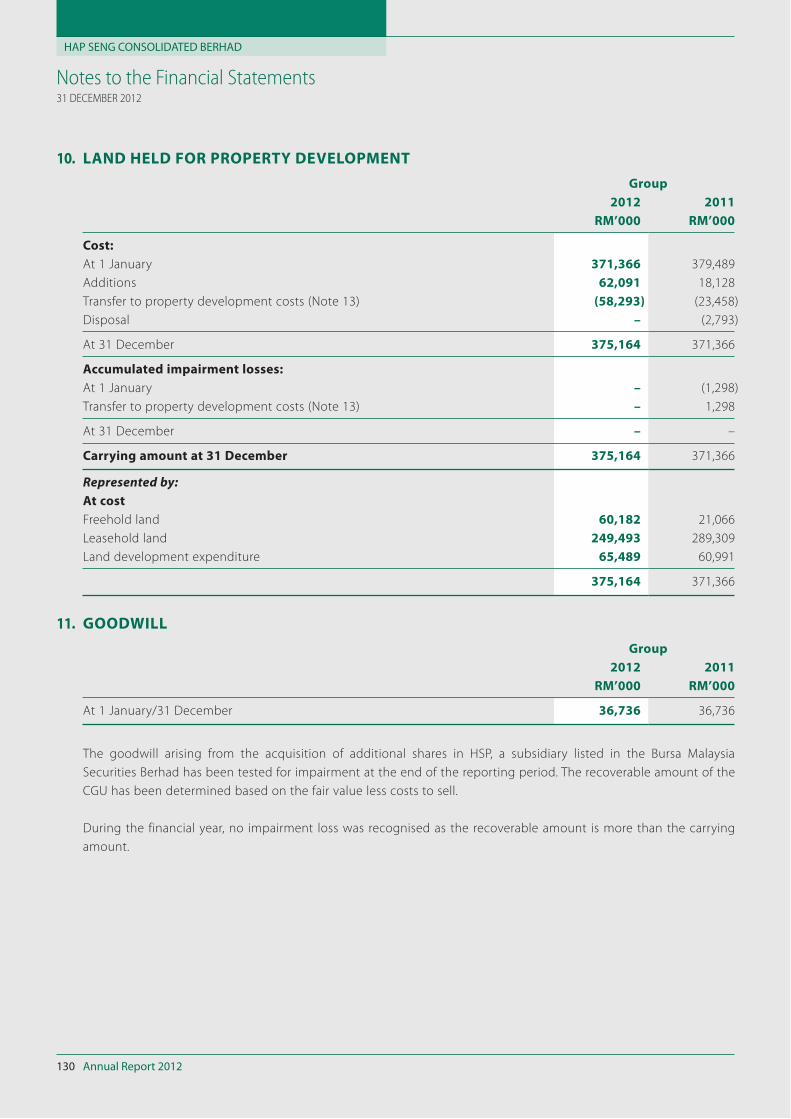
HAP SENG CONSOLIDATED BERHAD
Annual Report 2012130
Notes to the Financial Statements31 DECEMBER 2012
10. LAND HELD FOR PROPERTY DEVELOPMENT
Group
2012 2011
RM’000 RM’000
Cost:
At 1 January 371,366 379,489
Additions 62,091 18,128
Transfer to property development costs (Note 13) (58,293) (23,458)
Disposal – (2,793)
At 31 December 375,164 371,366
Accumulated impairment losses:
At 1 January – (1,298)
Transfer to property development costs (Note 13) – 1,298
At 31 December – –
Carrying amount at 31 December 375,164 371,366
Represented by:At cost
Freehold land 60,182 21,066
Leasehold land 249,493 289,309
Land development expenditure 65,489 60,991
375,164 371,366
11. GOODWILL
Group
2012 2011
RM’000 RM’000
At 1 January/31 December 36,736 36,736
The goodwill arising from the acquisition of additional shares in HSP, a subsidiary listed in the Bursa Malaysia
Securities Berhad has been tested for impairment at the end of the reporting period. The recoverable amount of the
CGU has been determined based on the fair value less costs to sell.
During the financial year, no impairment loss was recognised as the recoverable amount is more than the carrying
amount.
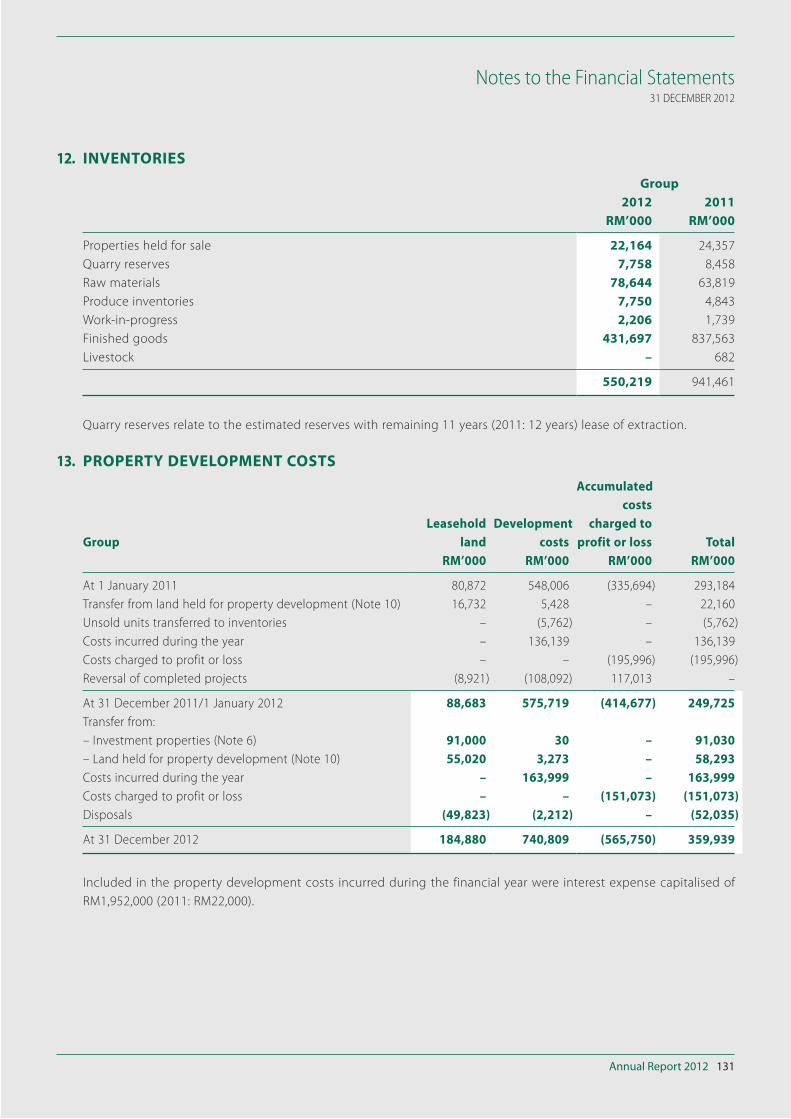
Annual Report 2012 131
Notes to the Financial Statements31 DECEMBER 2012
12. INVENTORIES
Group
2012 2011
RM’000 RM’000
Properties held for sale 22,164 24,357
Quarry reserves 7,758 8,458
Raw materials 78,644 63,819
Produce inventories 7,750 4,843
Work-in-progress 2,206 1,739
Finished goods 431,697 837,563
Livestock – 682
550,219 941,461
Quarry reserves relate to the estimated reserves with remaining 11 years (2011: 12 years) lease of extraction.
13. PROPERTY DEVELOPMENT COSTS
Group
Leasehold
land
Development
costs
Accumulated
costs
charged to
profit or loss Total
RM’000 RM’000 RM’000 RM’000
At 1 January 2011 80,872 548,006 (335,694) 293,184
Transfer from land held for property development (Note 10) 16,732 5,428 – 22,160
Unsold units transferred to inventories – (5,762) – (5,762)
Costs incurred during the year – 136,139 – 136,139
Costs charged to profit or loss – – (195,996) (195,996)
Reversal of completed projects (8,921) (108,092) 117,013 –
At 31 December 2011/1 January 2012 88,683 575,719 (414,677) 249,725
Transfer from:
– Investment properties (Note 6) 91,000 30 – 91,030
– Land held for property development (Note 10) 55,020 3,273 – 58,293
Costs incurred during the year – 163,999 – 163,999
Costs charged to profit or loss – – (151,073) (151,073)
Disposals (49,823) (2,212) – (52,035)
At 31 December 2012 184,880 740,809 (565,750) 359,939
Included in the property development costs incurred during the financial year were interest expense capitalised of
RM1,952,000 (2011: RM22,000).
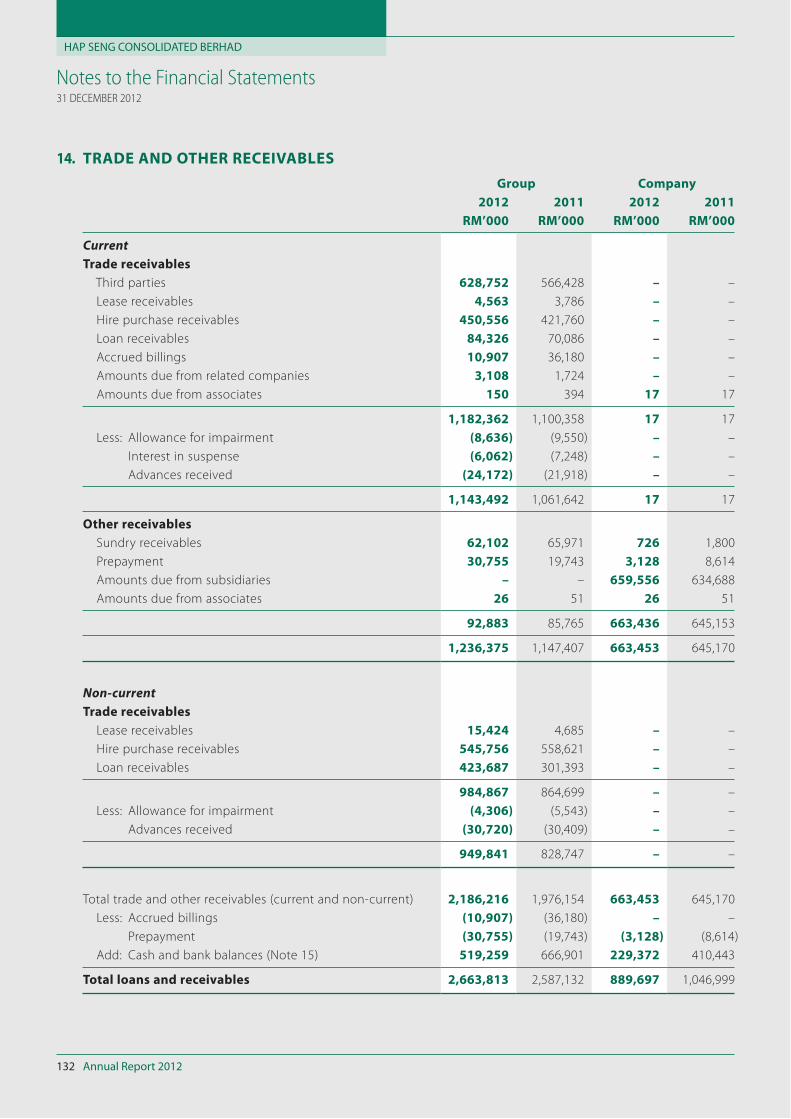
HAP SENG CONSOLIDATED BERHAD
Annual Report 2012132
Notes to the Financial Statements31 DECEMBER 2012
14. TRADE AND OTHER RECEIVABLES
Group Company
2012 2011 2012 2011
RM’000 RM’000 RM’000 RM’000
CurrentTrade receivables
Third parties 628,752 566,428 – –
Lease receivables 4,563 3,786 – –
Hire purchase receivables 450,556 421,760 – –
Loan receivables 84,326 70,086 – –
Accrued billings 10,907 36,180 – –
Amounts due from related companies 3,108 1,724 – –
Amounts due from associates 150 394 17 17
1,182,362 1,100,358 17 17
Less: Allowance for impairment (8,636) (9,550) – –
Interest in suspense (6,062) (7,248) – –
Advances received (24,172) (21,918) – –
1,143,492 1,061,642 17 17
Other receivables
Sundry receivables 62,102 65,971 726 1,800
Prepayment 30,755 19,743 3,128 8,614
Amounts due from subsidiaries – – 659,556 634,688
Amounts due from associates 26 51 26 51
92,883 85,765 663,436 645,153
1,236,375 1,147,407 663,453 645,170
Non-currentTrade receivables
Lease receivables 15,424 4,685 – –
Hire purchase receivables 545,756 558,621 – –
Loan receivables 423,687 301,393 – –
984,867 864,699 – –
Less: Allowance for impairment (4,306) (5,543) – –
Advances received (30,720) (30,409) – –
949,841 828,747 – –
Total trade and other receivables (current and non-current) 2,186,216 1,976,154 663,453 645,170
Less: Accrued billings (10,907) (36,180) – –
Prepayment (30,755) (19,743) (3,128) (8,614)
Add: Cash and bank balances (Note 15) 519,259 666,901 229,372 410,443
Total loans and receivables 2,663,813 2,587,132 889,697 1,046,999
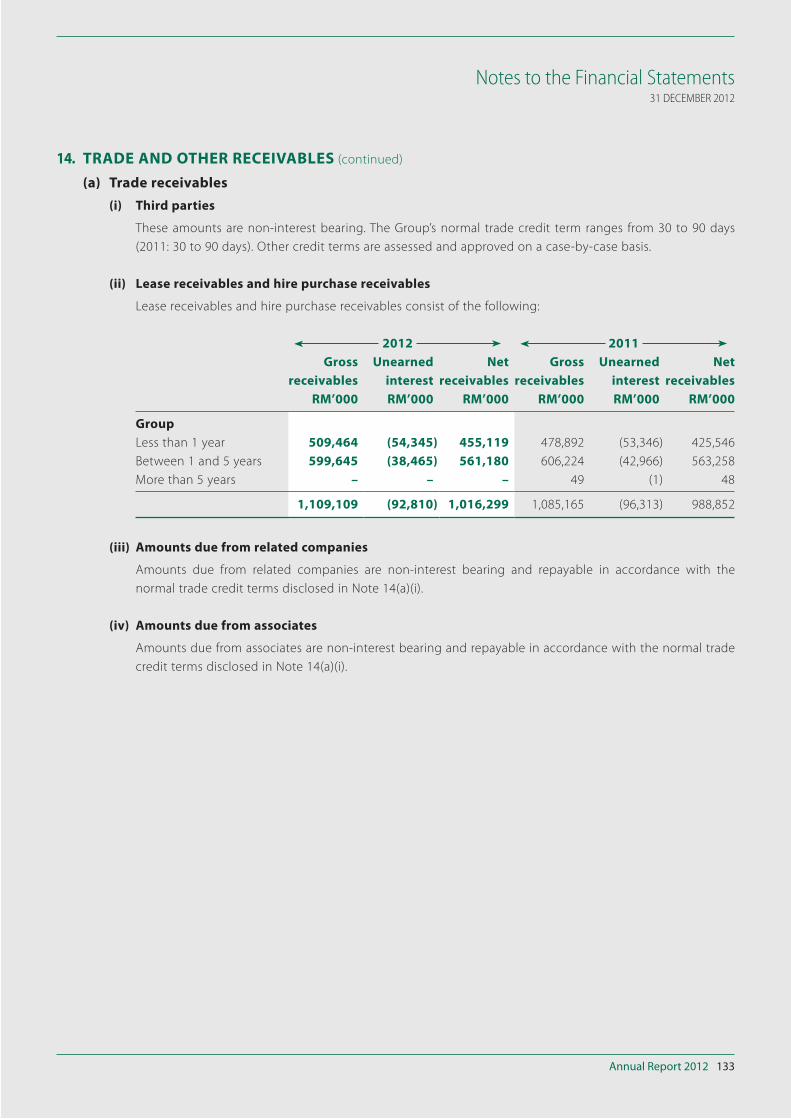
Annual Report 2012 133
Notes to the Financial Statements31 DECEMBER 2012
14. TRADE AND OTHER RECEIVABLES (continued)
(a) Trade receivables
(i) Third parties
These amounts are non-interest bearing. The Group’s normal trade credit term ranges from 30 to 90 days
(2011: 30 to 90 days). Other credit terms are assessed and approved on a case-by-case basis.
(ii) Lease receivables and hire purchase receivables
Lease receivables and hire purchase receivables consist of the following:
2012 2011
Gross
receivables
Unearned
interest
Net
receivables
Gross
receivables
Unearned
interest
Net
receivables
RM’000 RM’000 RM’000 RM’000 RM’000 RM’000
Group
Less than 1 year 509,464 (54,345) 455,119 478,892 (53,346) 425,546
Between 1 and 5 years 599,645 (38,465) 561,180 606,224 (42,966) 563,258
More than 5 years – – – 49 (1) 48
1,109,109 (92,810) 1,016,299 1,085,165 (96,313) 988,852
(iii) Amounts due from related companies
Amounts due from related companies are non-interest bearing and repayable in accordance with the
normal trade credit terms disclosed in Note 14(a)(i).
(iv) Amounts due from associates
Amounts due from associates are non-interest bearing and repayable in accordance with the normal trade
credit terms disclosed in Note 14(a)(i).
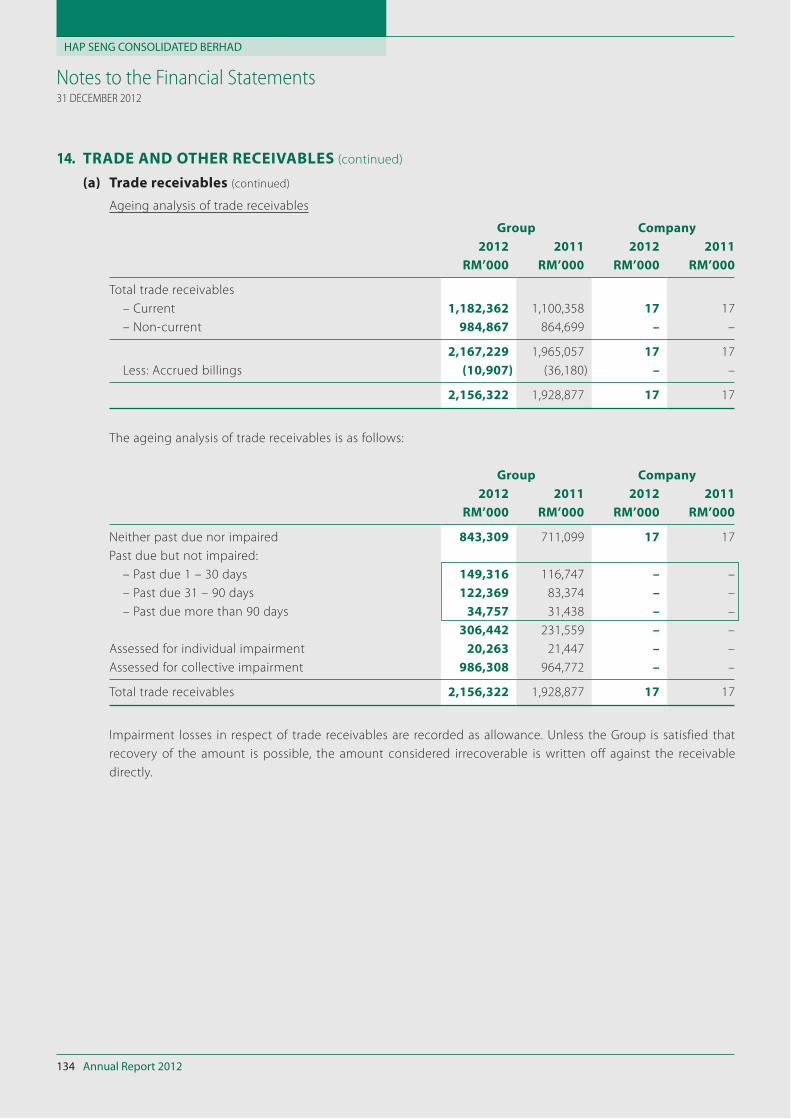
HAP SENG CONSOLIDATED BERHAD
Annual Report 2012134
Notes to the Financial Statements31 DECEMBER 2012
14. TRADE AND OTHER RECEIVABLES (continued)
(a) Trade receivables (continued)
Ageing analysis of trade receivables
Group Company
2012 2011 2012 2011
RM’000 RM’000 RM’000 RM’000
Total trade receivables
– Current 1,182,362 1,100,358 17 17
– Non-current 984,867 864,699 – –
2,167,229 1,965,057 17 17
Less: Accrued billings (10,907) (36,180) – –
2,156,322 1,928,877 17 17
The ageing analysis of trade receivables is as follows:
Group Company
2012 2011 2012 2011
RM’000 RM’000 RM’000 RM’000
Neither past due nor impaired 843,309 711,099 17 17
Past due but not impaired:
– Past due 1 – 30 days 149,316 116,747 – –
– Past due 31 – 90 days 122,369 83,374 – –
– Past due more than 90 days 34,757 31,438 – –
306,442 231,559 – –
Assessed for individual impairment 20,263 21,447 – –
Assessed for collective impairment 986,308 964,772 – –
Total trade receivables 2,156,322 1,928,877 17 17
Impairment losses in respect of trade receivables are recorded as allowance. Unless the Group is satisfied that
recovery of the amount is possible, the amount considered irrecoverable is written off against the receivable
directly.
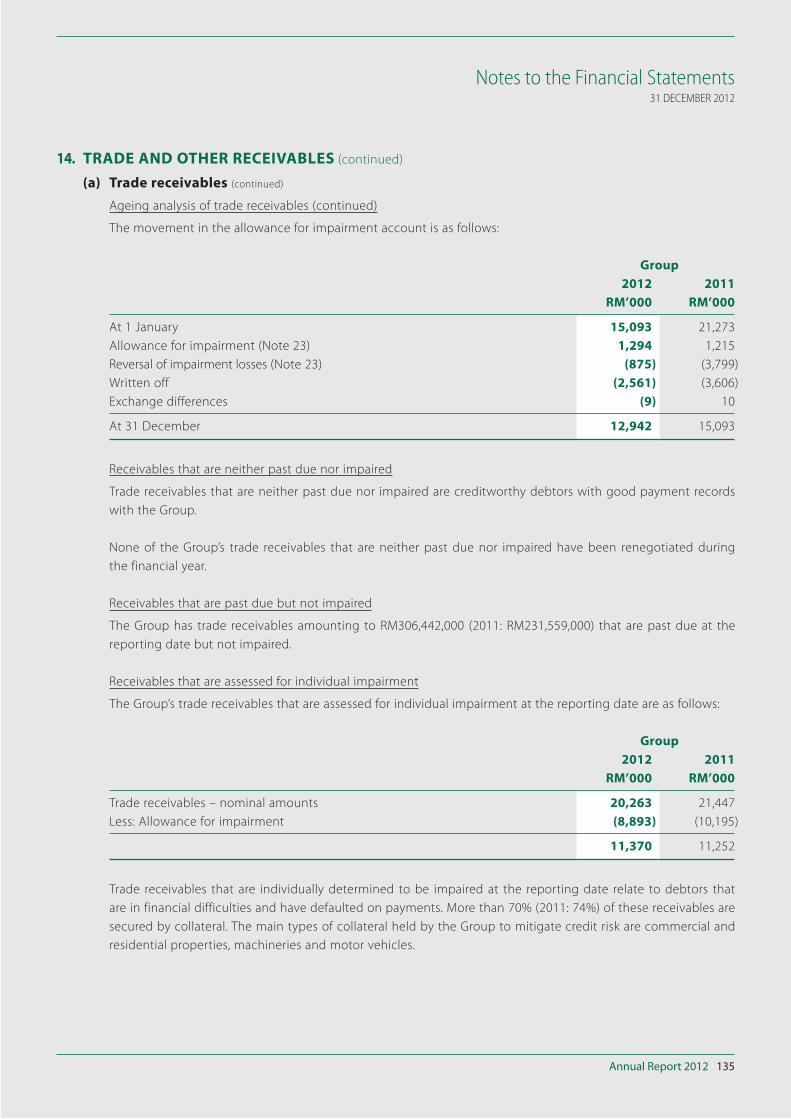
Annual Report 2012 135
Notes to the Financial Statements31 DECEMBER 2012
14. TRADE AND OTHER RECEIVABLES (continued)
(a) Trade receivables (continued)
Ageing analysis of trade receivables (continued)
The movement in the allowance for impairment account is as follows:
Group
2012 2011
RM’000 RM’000
At 1 January 15,093 21,273
Allowance for impairment (Note 23) 1,294 1,215
Reversal of impairment losses (Note 23) (875) (3,799)
Written off (2,561) (3,606)
Exchange differences (9) 10
At 31 December 12,942 15,093
Receivables that are neither past due nor impaired
Trade receivables that are neither past due nor impaired are creditworthy debtors with good payment records
with the Group.
None of the Group’s trade receivables that are neither past due nor impaired have been renegotiated during
the financial year.
Receivables that are past due but not impaired
The Group has trade receivables amounting to RM306,442,000 (2011: RM231,559,000) that are past due at the
reporting date but not impaired.
Receivables that are assessed for individual impairment
The Group’s trade receivables that are assessed for individual impairment at the reporting date are as follows:
Group
2012 2011
RM’000 RM’000
Trade receivables – nominal amounts 20,263 21,447
Less: Allowance for impairment (8,893) (10,195)
11,370 11,252
Trade receivables that are individually determined to be impaired at the reporting date relate to debtors that
are in financial difficulties and have defaulted on payments. More than 70% (2011: 74%) of these receivables are
secured by collateral. The main types of collateral held by the Group to mitigate credit risk are commercial and
residential properties, machineries and motor vehicles.
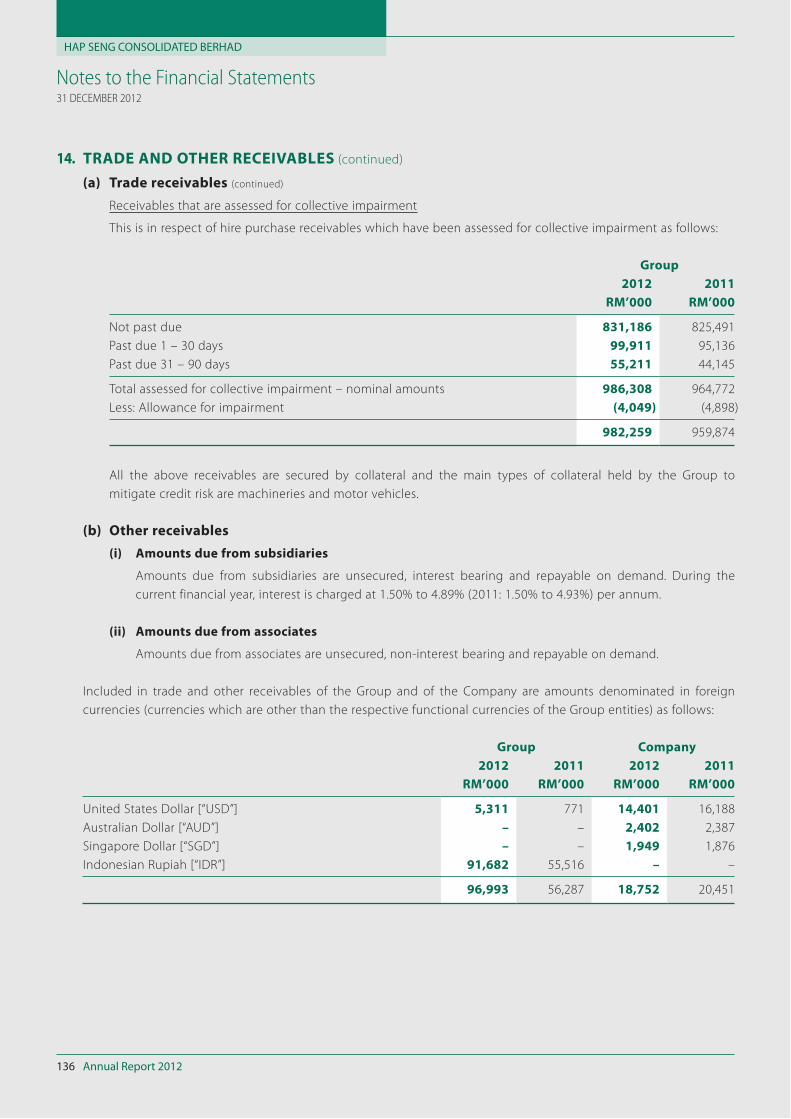
HAP SENG CONSOLIDATED BERHAD
Annual Report 2012136
Notes to the Financial Statements31 DECEMBER 2012
14. TRADE AND OTHER RECEIVABLES (continued)
(a) Trade receivables (continued)
Receivables that are assessed for collective impairment
This is in respect of hire purchase receivables which have been assessed for collective impairment as follows:
Group
2012 2011
RM’000 RM’000
Not past due 831,186 825,491
Past due 1 – 30 days 99,911 95,136
Past due 31 – 90 days 55,211 44,145
Total assessed for collective impairment – nominal amounts 986,308 964,772
Less: Allowance for impairment (4,049) (4,898)
982,259 959,874
All the above receivables are secured by collateral and the main types of collateral held by the Group to
mitigate credit risk are machineries and motor vehicles.
(b) Other receivables
(i) Amounts due from subsidiaries
Amounts due from subsidiaries are unsecured, interest bearing and repayable on demand. During the
current financial year, interest is charged at 1.50% to 4.89% (2011: 1.50% to 4.93%) per annum.
(ii) Amounts due from associates
Amounts due from associates are unsecured, non-interest bearing and repayable on demand.
Included in trade and other receivables of the Group and of the Company are amounts denominated in foreign
currencies (currencies which are other than the respective functional currencies of the Group entities) as follows:
Group Company
2012 2011 2012 2011
RM’000 RM’000 RM’000 RM’000
United States Dollar [“USD”] 5,311 771 14,401 16,188
Australian Dollar [“AUD”] – – 2,402 2,387
Singapore Dollar [“SGD”] – – 1,949 1,876
Indonesian Rupiah [“IDR”] 91,682 55,516 – –
96,993 56,287 18,752 20,451
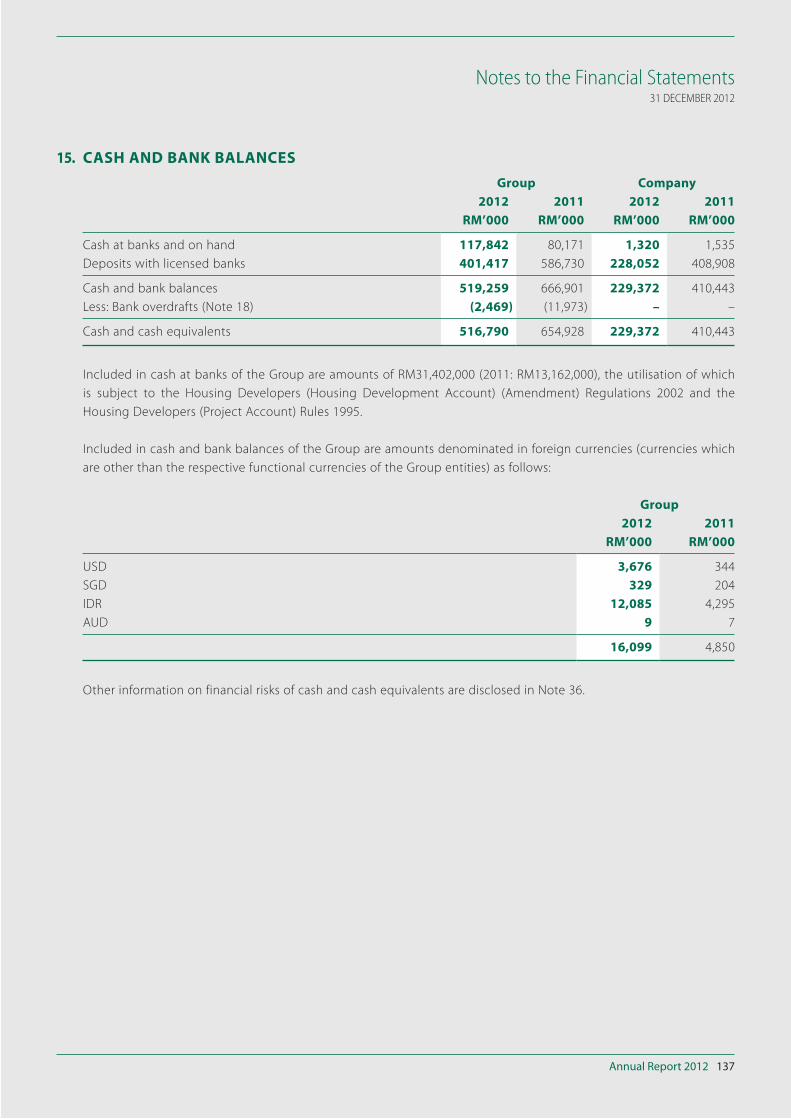
Annual Report 2012 137
Notes to the Financial Statements31 DECEMBER 2012
15. CASH AND BANK BALANCES
Group Company
2012 2011 2012 2011
RM’000 RM’000 RM’000 RM’000
Cash at banks and on hand 117,842 80,171 1,320 1,535
Deposits with licensed banks 401,417 586,730 228,052 408,908
Cash and bank balances 519,259 666,901 229,372 410,443
Less: Bank overdrafts (Note 18) (2,469) (11,973) – –
Cash and cash equivalents 516,790 654,928 229,372 410,443
Included in cash at banks of the Group are amounts of RM31,402,000 (2011: RM13,162,000), the utilisation of which
is subject to the Housing Developers (Housing Development Account) (Amendment) Regulations 2002 and the
Housing Developers (Project Account) Rules 1995.
Included in cash and bank balances of the Group are amounts denominated in foreign currencies (currencies which
are other than the respective functional currencies of the Group entities) as follows:
Group
2012 2011
RM’000 RM’000
USD 3,676 344
SGD 329 204
IDR 12,085 4,295
AUD 9 7
16,099 4,850
Other information on financial risks of cash and cash equivalents are disclosed in Note 36.
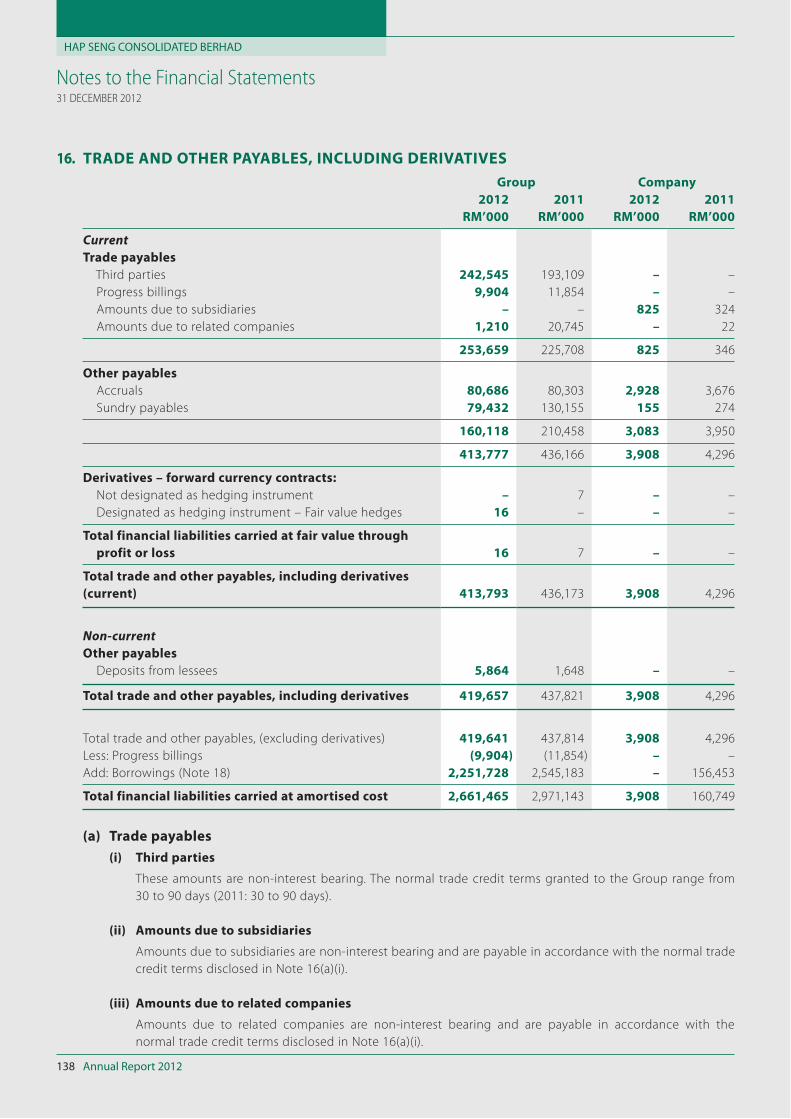
HAP SENG CONSOLIDATED BERHAD
Annual Report 2012138
Notes to the Financial Statements31 DECEMBER 2012
16. TRADE AND OTHER PAYABLES, INCLUDING DERIVATIVES
Group Company
2012 2011 2012 2011
RM’000 RM’000 RM’000 RM’000
CurrentTrade payables
Third parties 242,545 193,109 – –
Progress billings 9,904 11,854 – –
Amounts due to subsidiaries – – 825 324
Amounts due to related companies 1,210 20,745 – 22
253,659 225,708 825 346
Other payables
Accruals 80,686 80,303 2,928 3,676
Sundry payables 79,432 130,155 155 274
160,118 210,458 3,083 3,950
413,777 436,166 3,908 4,296
Derivatives – forward currency contracts:
Not designated as hedging instrument – 7 – –
Designated as hedging instrument – Fair value hedges 16 – – –
Total financial liabilities carried at fair value through
profit or loss 16 7 – –
Total trade and other payables, including derivatives
(current) 413,793 436,173 3,908 4,296
Non-currentOther payables
Deposits from lessees 5,864 1,648 – –
Total trade and other payables, including derivatives 419,657 437,821 3,908 4,296
Total trade and other payables, (excluding derivatives) 419,641 437,814 3,908 4,296
Less: Progress billings (9,904) (11,854) – –
Add: Borrowings (Note 18) 2,251,728 2,545,183 – 156,453
Total financial liabilities carried at amortised cost 2,661,465 2,971,143 3,908 160,749
(a) Trade payables
(i) Third parties
These amounts are non-interest bearing. The normal trade credit terms granted to the Group range from
30 to 90 days (2011: 30 to 90 days).
(ii) Amounts due to subsidiaries
Amounts due to subsidiaries are non-interest bearing and are payable in accordance with the normal trade
credit terms disclosed in Note 16(a)(i).
(iii) Amounts due to related companies
Amounts due to related companies are non-interest bearing and are payable in accordance with the
normal trade credit terms disclosed in Note 16(a)(i).
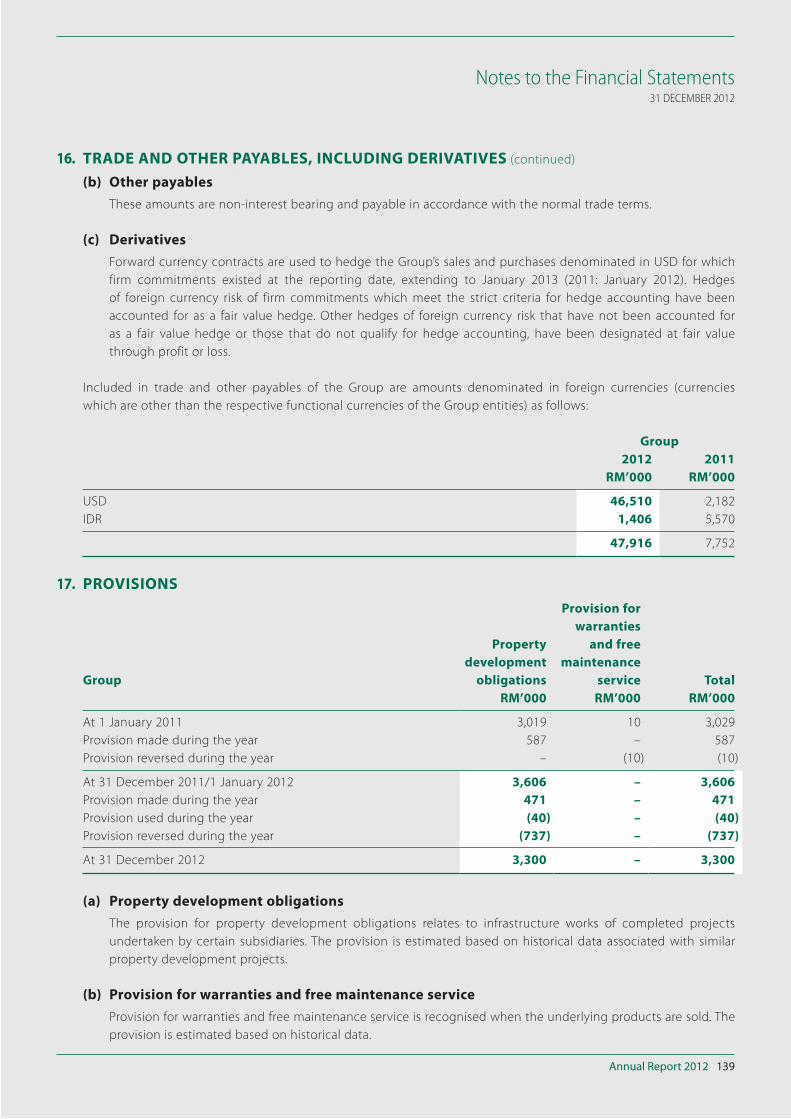
Annual Report 2012 139
Notes to the Financial Statements31 DECEMBER 2012
16. TRADE AND OTHER PAYABLES, INCLUDING DERIVATIVES (continued)
(b) Other payables
These amounts are non-interest bearing and payable in accordance with the normal trade terms.
(c) Derivatives
Forward currency contracts are used to hedge the Group’s sales and purchases denominated in USD for which
firm commitments existed at the reporting date, extending to January 2013 (2011: January 2012). Hedges
of foreign currency risk of firm commitments which meet the strict criteria for hedge accounting have been
accounted for as a fair value hedge. Other hedges of foreign currency risk that have not been accounted for
as a fair value hedge or those that do not qualify for hedge accounting, have been designated at fair value
through profit or loss.
Included in trade and other payables of the Group are amounts denominated in foreign currencies (currencies
which are other than the respective functional currencies of the Group entities) as follows:
Group
2012 2011
RM’000 RM’000
USD 46,510 2,182
IDR 1,406 5,570
47,916 7,752
17. PROVISIONS
Group
Property
development
obligations
Provision for
warranties
and free
maintenance
service Total
RM’000 RM’000 RM’000
At 1 January 2011 3,019 10 3,029
Provision made during the year 587 – 587
Provision reversed during the year – (10) (10)
At 31 December 2011/1 January 2012 3,606 – 3,606
Provision made during the year 471 – 471
Provision used during the year (40) – (40)
Provision reversed during the year (737) – (737)
At 31 December 2012 3,300 – 3,300
(a) Property development obligations
The provision for property development obligations relates to infrastructure works of completed projects
undertaken by certain subsidiaries. The provision is estimated based on historical data associated with similar
property development projects.
(b) Provision for warranties and free maintenance service
Provision for warranties and free maintenance service is recognised when the underlying products are sold. The
provision is estimated based on historical data.
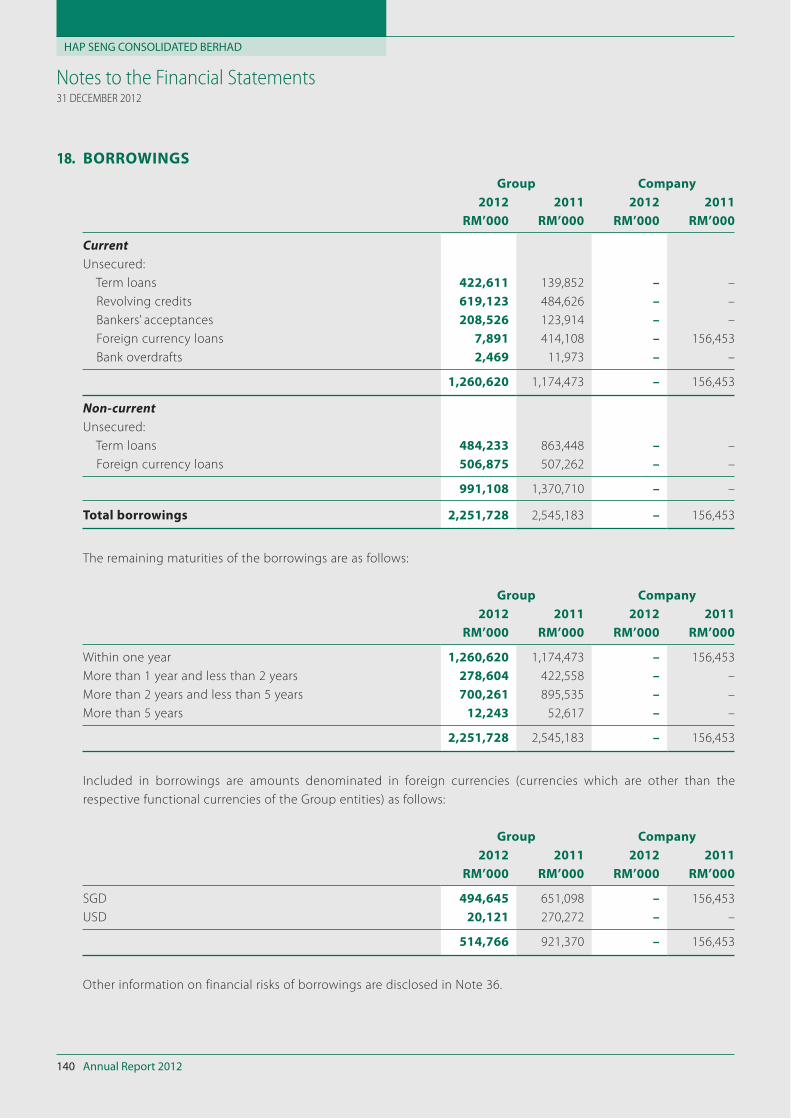
HAP SENG CONSOLIDATED BERHAD
Annual Report 2012140
Notes to the Financial Statements31 DECEMBER 2012
18. BORROWINGS
Group Company
2012 2011 2012 2011
RM’000 RM’000 RM’000 RM’000
CurrentUnsecured:
Term loans 422,611 139,852 – –
Revolving credits 619,123 484,626 – –
Bankers’ acceptances 208,526 123,914 – –
Foreign currency loans 7,891 414,108 – 156,453
Bank overdrafts 2,469 11,973 – –
1,260,620 1,174,473 – 156,453
Non-currentUnsecured:
Term loans 484,233 863,448 – –
Foreign currency loans 506,875 507,262 – –
991,108 1,370,710 – –
Total borrowings 2,251,728 2,545,183 – 156,453
The remaining maturities of the borrowings are as follows:
Group Company
2012 2011 2012 2011
RM’000 RM’000 RM’000 RM’000
Within one year 1,260,620 1,174,473 – 156,453
More than 1 year and less than 2 years 278,604 422,558 – –
More than 2 years and less than 5 years 700,261 895,535 – –
More than 5 years 12,243 52,617 – –
2,251,728 2,545,183 – 156,453
Included in borrowings are amounts denominated in foreign currencies (currencies which are other than the
respective functional currencies of the Group entities) as follows:
Group Company
2012 2011 2012 2011
RM’000 RM’000 RM’000 RM’000
SGD 494,645 651,098 – 156,453
USD 20,121 270,272 – –
514,766 921,370 – 156,453
Other information on financial risks of borrowings are disclosed in Note 36.
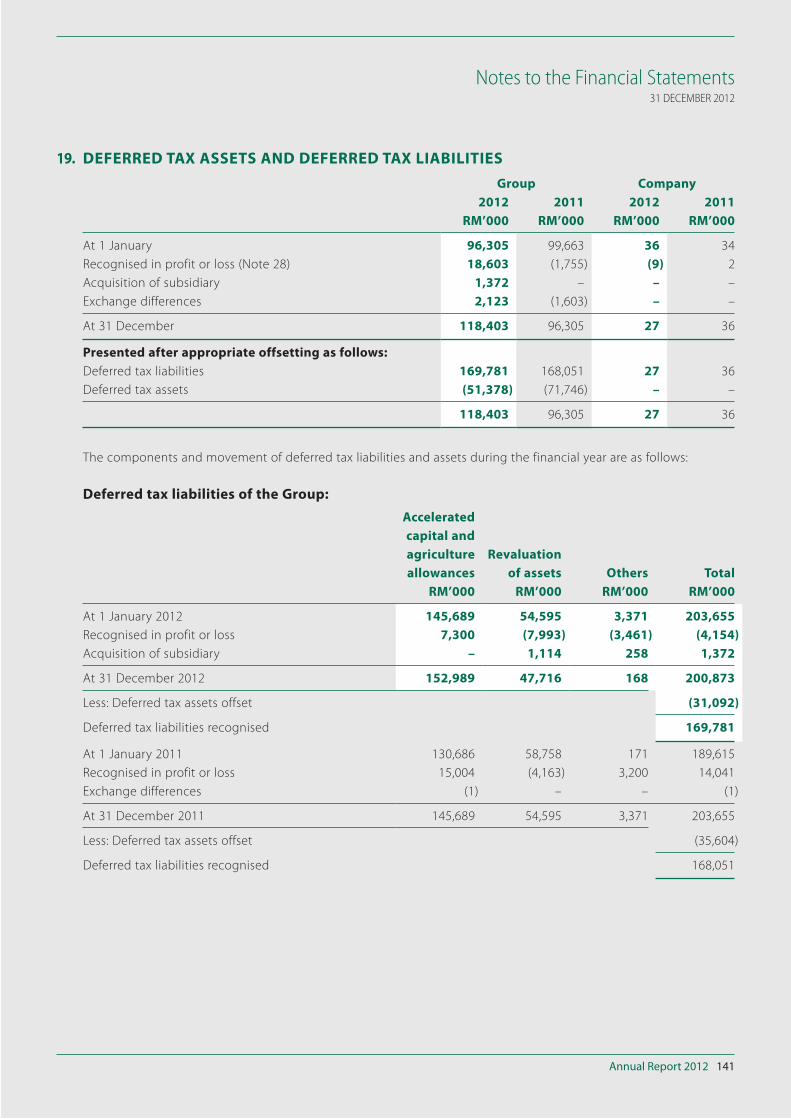
Annual Report 2012 141
Notes to the Financial Statements31 DECEMBER 2012
19. DEFERRED TAX ASSETS AND DEFERRED TAX LIABILITIES
Group Company
2012 2011 2012 2011
RM’000 RM’000 RM’000 RM’000
At 1 January 96,305 99,663 36 34
Recognised in profit or loss (Note 28) 18,603 (1,755) (9) 2
Acquisition of subsidiary 1,372 – – –
Exchange differences 2,123 (1,603) – –
At 31 December 118,403 96,305 27 36
Presented after appropriate offsetting as follows:
Deferred tax liabilities 169,781 168,051 27 36
Deferred tax assets (51,378) (71,746) – –
118,403 96,305 27 36
The components and movement of deferred tax liabilities and assets during the financial year are as follows:
Deferred tax liabilities of the Group:
Accelerated
capital and
agriculture
allowances
Revaluation
of assets Others Total
RM’000 RM’000 RM’000 RM’000
At 1 January 2012 145,689 54,595 3,371 203,655
Recognised in profit or loss 7,300 (7,993) (3,461) (4,154)
Acquisition of subsidiary – 1,114 258 1,372
At 31 December 2012 152,989 47,716 168 200,873
Less: Deferred tax assets offset (31,092)
Deferred tax liabilities recognised 169,781
At 1 January 2011 130,686 58,758 171 189,615
Recognised in profit or loss 15,004 (4,163) 3,200 14,041
Exchange differences (1) – – (1)
At 31 December 2011 145,689 54,595 3,371 203,655
Less: Deferred tax assets offset (35,604)
Deferred tax liabilities recognised 168,051
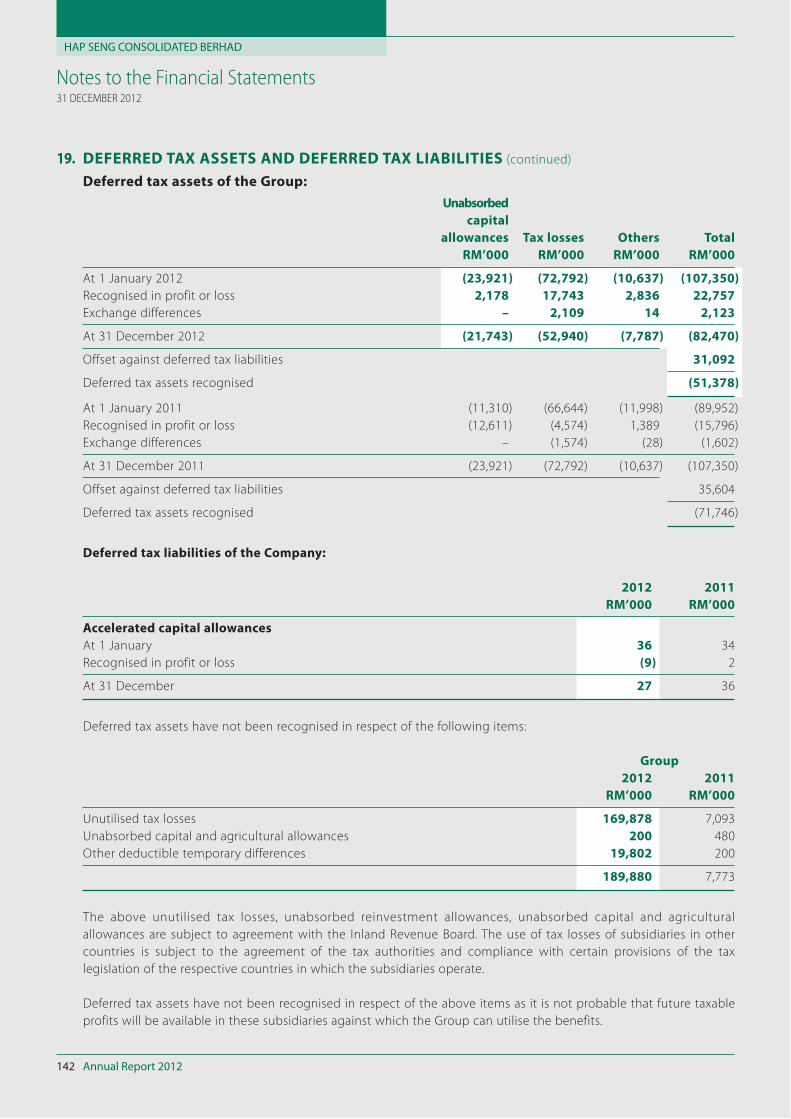
HAP SENG CONSOLIDATED BERHAD
Annual Report 2012142
Notes to the Financial Statements31 DECEMBER 2012
19. DEFERRED TAX ASSETS AND DEFERRED TAX LIABILITIES (continued)
Deferred tax assets of the Group:
Unabsorbed
capital
allowances Tax losses Others Total
RM’000 RM’000 RM’000 RM’000
At 1 January 2012 (23,921) (72,792) (10,637) (107,350)
Recognised in profit or loss 2,178 17,743 2,836 22,757
Exchange differences – 2,109 14 2,123
At 31 December 2012 (21,743) (52,940) (7,787) (82,470)
Offset against deferred tax liabilities 31,092
Deferred tax assets recognised (51,378)
At 1 January 2011 (11,310) (66,644) (11,998) (89,952)
Recognised in profit or loss (12,611) (4,574) 1,389 (15,796)
Exchange differences – (1,574) (28) (1,602)
At 31 December 2011 (23,921) (72,792) (10,637) (107,350)
Offset against deferred tax liabilities 35,604
Deferred tax assets recognised (71,746)
Deferred tax liabilities of the Company:
2012 2011
RM’000 RM’000
Accelerated capital allowances
At 1 January 36 34
Recognised in profit or loss (9) 2
At 31 December 27 36
Deferred tax assets have not been recognised in respect of the following items:
Group
2012 2011
RM’000 RM’000
Unutilised tax losses 169,878 7,093
Unabsorbed capital and agricultural allowances 200 480
Other deductible temporary differences 19,802 200
189,880 7,773
The above unutilised tax losses, unabsorbed reinvestment allowances, unabsorbed capital and agricultural
allowances are subject to agreement with the Inland Revenue Board. The use of tax losses of subsidiaries in other
countries is subject to the agreement of the tax authorities and compliance with certain provisions of the tax
legislation of the respective countries in which the subsidiaries operate.
Deferred tax assets have not been recognised in respect of the above items as it is not probable that future taxable
profits will be available in these subsidiaries against which the Group can utilise the benefits.
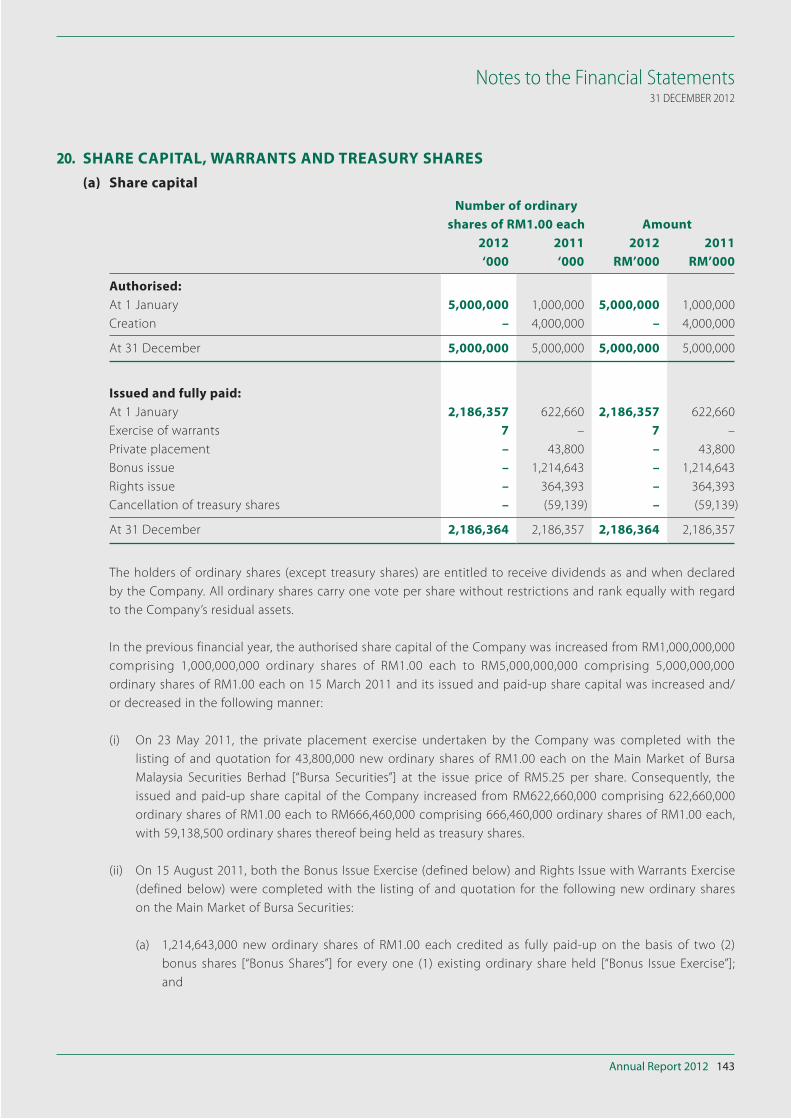
Annual Report 2012 143
Notes to the Financial Statements31 DECEMBER 2012
20. SHARE CAPITAL, WARRANTS AND TREASURY SHARES
(a) Share capital
Number of ordinary
shares of RM1.00 each Amount
2012 2011 2012 2011
‘000 ‘000 RM’000 RM’000
Authorised:
At 1 January 5,000,000 1,000,000 5,000,000 1,000,000
Creation – 4,000,000 – 4,000,000
At 31 December 5,000,000 5,000,000 5,000,000 5,000,000
Issued and fully paid:
At 1 January 2,186,357 622,660 2,186,357 622,660
Exercise of warrants 7 – 7 –
Private placement – 43,800 – 43,800
Bonus issue – 1,214,643 – 1,214,643
Rights issue – 364,393 – 364,393
Cancellation of treasury shares – (59,139) – (59,139)
At 31 December 2,186,364 2,186,357 2,186,364 2,186,357
The holders of ordinary shares (except treasury shares) are entitled to receive dividends as and when declared
by the Company. All ordinary shares carry one vote per share without restrictions and rank equally with regard
to the Company’s residual assets.
In the previous financial year, the authorised share capital of the Company was increased from RM1,000,000,000
comprising 1,000,000,000 ordinary shares of RM1.00 each to RM5,000,000,000 comprising 5,000,000,000
ordinary shares of RM1.00 each on 15 March 2011 and its issued and paid-up share capital was increased and/
or decreased in the following manner:
(i) On 23 May 2011, the private placement exercise undertaken by the Company was completed with the
listing of and quotation for 43,800,000 new ordinary shares of RM1.00 each on the Main Market of Bursa
Malaysia Securities Berhad [“Bursa Securities”] at the issue price of RM5.25 per share. Consequently, the
issued and paid-up share capital of the Company increased from RM622,660,000 comprising 622,660,000
ordinary shares of RM1.00 each to RM666,460,000 comprising 666,460,000 ordinary shares of RM1.00 each,
with 59,138,500 ordinary shares thereof being held as treasury shares.
(ii) On 15 August 2011, both the Bonus Issue Exercise (defined below) and Rights Issue with Warrants Exercise
(defined below) were completed with the listing of and quotation for the following new ordinary shares
on the Main Market of Bursa Securities:
(a) 1,214,643,000 new ordinary shares of RM1.00 each credited as fully paid-up on the basis of two (2)
bonus shares [“Bonus Shares”] for every one (1) existing ordinary share held [“Bonus Issue Exercise”];
and
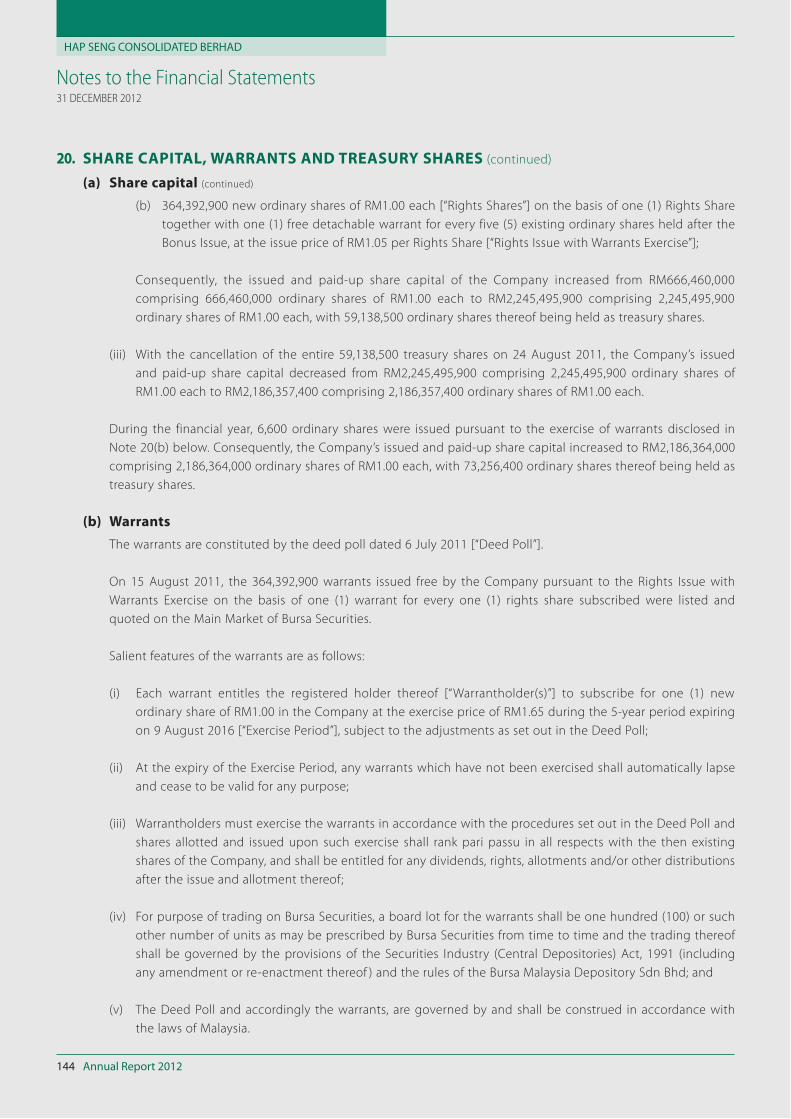
HAP SENG CONSOLIDATED BERHAD
Annual Report 2012144
Notes to the Financial Statements31 DECEMBER 2012
20. SHARE CAPITAL, WARRANTS AND TREASURY SHARES (continued)
(a) Share capital (continued)
(b) 364,392,900 new ordinary shares of RM1.00 each [“Rights Shares”] on the basis of one (1) Rights Share
together with one (1) free detachable warrant for every five (5) existing ordinary shares held after the
Bonus Issue, at the issue price of RM1.05 per Rights Share [“Rights Issue with Warrants Exercise”];
Consequently, the issued and paid-up share capital of the Company increased from RM666,460,000
comprising 666,460,000 ordinary shares of RM1.00 each to RM2,245,495,900 comprising 2,245,495,900
ordinary shares of RM1.00 each, with 59,138,500 ordinary shares thereof being held as treasury shares.
(iii) With the cancellation of the entire 59,138,500 treasury shares on 24 August 2011, the Company’s issued
and paid-up share capital decreased from RM2,245,495,900 comprising 2,245,495,900 ordinary shares of
RM1.00 each to RM2,186,357,400 comprising 2,186,357,400 ordinary shares of RM1.00 each.
During the financial year, 6,600 ordinary shares were issued pursuant to the exercise of warrants disclosed in
Note 20(b) below. Consequently, the Company’s issued and paid-up share capital increased to RM2,186,364,000
comprising 2,186,364,000 ordinary shares of RM1.00 each, with 73,256,400 ordinary shares thereof being held as
treasury shares.
(b) Warrants
The warrants are constituted by the deed poll dated 6 July 2011 [“Deed Poll”].
On 15 August 2011, the 364,392,900 warrants issued free by the Company pursuant to the Rights Issue with
Warrants Exercise on the basis of one (1) warrant for every one (1) rights share subscribed were listed and
quoted on the Main Market of Bursa Securities.
Salient features of the warrants are as follows:
(i) Each warrant entitles the registered holder thereof [“Warrantholder(s)”] to subscribe for one (1) new
ordinary share of RM1.00 in the Company at the exercise price of RM1.65 during the 5-year period expiring
on 9 August 2016 [“Exercise Period”], subject to the adjustments as set out in the Deed Poll;
(ii) At the expiry of the Exercise Period, any warrants which have not been exercised shall automatically lapse
and cease to be valid for any purpose;
(iii) Warrantholders must exercise the warrants in accordance with the procedures set out in the Deed Poll and
shares allotted and issued upon such exercise shall rank pari passu in all respects with the then existing
shares of the Company, and shall be entitled for any dividends, rights, allotments and/or other distributions
after the issue and allotment thereof;
(iv) For purpose of trading on Bursa Securities, a board lot for the warrants shall be one hundred (100) or such
other number of units as may be prescribed by Bursa Securities from time to time and the trading thereof
shall be governed by the provisions of the Securities Industry (Central Depositories) Act, 1991 (including
any amendment or re-enactment thereof ) and the rules of the Bursa Malaysia Depository Sdn Bhd; and
(v) The Deed Poll and accordingly the warrants, are governed by and shall be construed in accordance with
the laws of Malaysia.
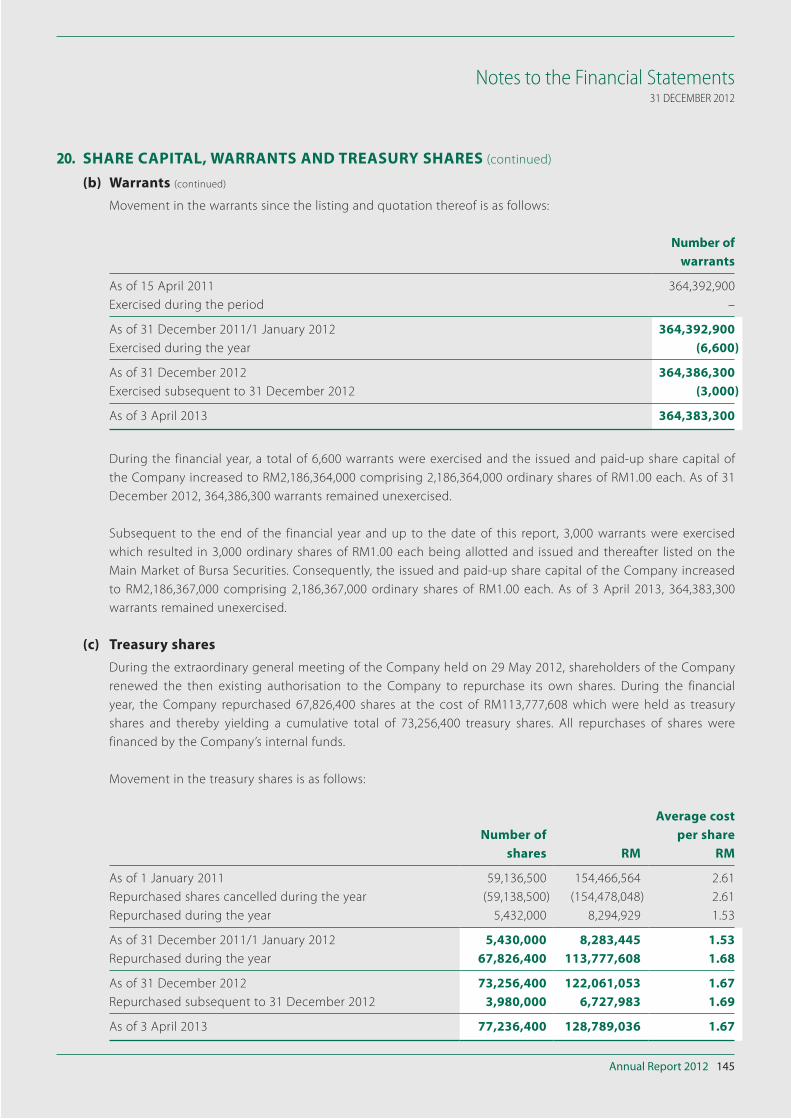
Annual Report 2012 145
Notes to the Financial Statements31 DECEMBER 2012
20. SHARE CAPITAL, WARRANTS AND TREASURY SHARES (continued)
(b) Warrants (continued)
Movement in the warrants since the listing and quotation thereof is as follows:
Number of
warrants
As of 15 April 2011 364,392,900
Exercised during the period –
As of 31 December 2011/1 January 2012 364,392,900
Exercised during the year (6,600)
As of 31 December 2012 364,386,300
Exercised subsequent to 31 December 2012 (3,000)
As of 3 April 2013 364,383,300
During the financial year, a total of 6,600 warrants were exercised and the issued and paid-up share capital of
the Company increased to RM2,186,364,000 comprising 2,186,364,000 ordinary shares of RM1.00 each. As of 31
December 2012, 364,386,300 warrants remained unexercised.
Subsequent to the end of the financial year and up to the date of this report, 3,000 warrants were exercised
which resulted in 3,000 ordinary shares of RM1.00 each being allotted and issued and thereafter listed on the
Main Market of Bursa Securities. Consequently, the issued and paid-up share capital of the Company increased
to RM2,186,367,000 comprising 2,186,367,000 ordinary shares of RM1.00 each. As of 3 April 2013, 364,383,300
warrants remained unexercised.
(c) Treasury shares
During the extraordinary general meeting of the Company held on 29 May 2012, shareholders of the Company
renewed the then existing authorisation to the Company to repurchase its own shares. During the financial
year, the Company repurchased 67,826,400 shares at the cost of RM113,777,608 which were held as treasury
shares and thereby yielding a cumulative total of 73,256,400 treasury shares. All repurchases of shares were
financed by the Company’s internal funds.
Movement in the treasury shares is as follows:
Number of
shares RM
Average cost
per share
RM
As of 1 January 2011 59,136,500 154,466,564 2.61
Repurchased shares cancelled during the year (59,138,500) (154,478,048) 2.61
Repurchased during the year 5,432,000 8,294,929 1.53
As of 31 December 2011/1 January 2012 5,430,000 8,283,445 1.53
Repurchased during the year 67,826,400 113,777,608 1.68
As of 31 December 2012 73,256,400 122,061,053 1.67
Repurchased subsequent to 31 December 2012 3,980,000 6,727,983 1.69
As of 3 April 2013 77,236,400 128,789,036 1.67
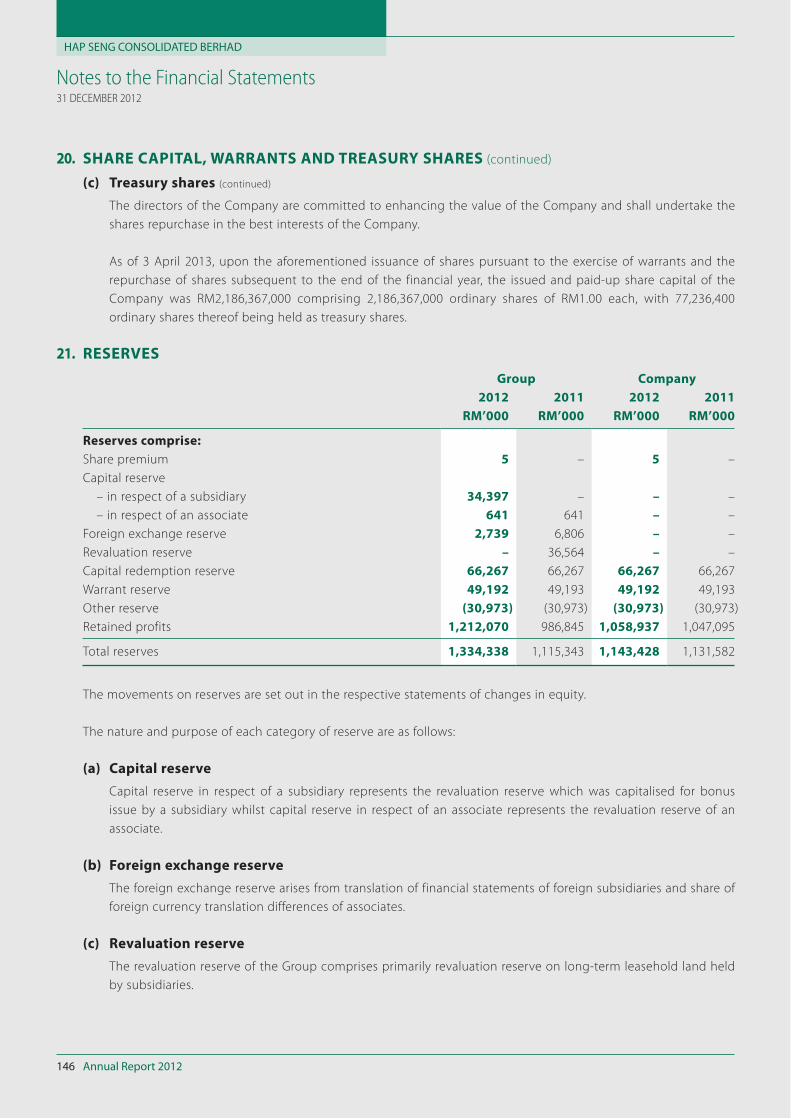
HAP SENG CONSOLIDATED BERHAD
Annual Report 2012146
Notes to the Financial Statements31 DECEMBER 2012
20. SHARE CAPITAL, WARRANTS AND TREASURY SHARES (continued)
(c) Treasury shares (continued)
The directors of the Company are committed to enhancing the value of the Company and shall undertake the
shares repurchase in the best interests of the Company.
As of 3 April 2013, upon the aforementioned issuance of shares pursuant to the exercise of warrants and the
repurchase of shares subsequent to the end of the financial year, the issued and paid-up share capital of the
Company was RM2,186,367,000 comprising 2,186,367,000 ordinary shares of RM1.00 each, with 77,236,400
ordinary shares thereof being held as treasury shares.
21. RESERVES
Group Company
2012 2011 2012 2011
RM’000 RM’000 RM’000 RM’000
Reserves comprise:
Share premium 5 – 5 –
Capital reserve
– in respect of a subsidiary 34,397 – – –
– in respect of an associate 641 641 – –
Foreign exchange reserve 2,739 6,806 – –
Revaluation reserve – 36,564 – –
Capital redemption reserve 66,267 66,267 66,267 66,267
Warrant reserve 49,192 49,193 49,192 49,193
Other reserve (30,973) (30,973) (30,973) (30,973)
Retained profits 1,212,070 986,845 1,058,937 1,047,095
Total reserves 1,334,338 1,115,343 1,143,428 1,131,582
The movements on reserves are set out in the respective statements of changes in equity.
The nature and purpose of each category of reserve are as follows:
(a) Capital reserve
Capital reserve in respect of a subsidiary represents the revaluation reserve which was capitalised for bonus
issue by a subsidiary whilst capital reserve in respect of an associate represents the revaluation reserve of an
associate.
(b) Foreign exchange reserve
The foreign exchange reserve arises from translation of financial statements of foreign subsidiaries and share of
foreign currency translation differences of associates.
(c) Revaluation reserve
The revaluation reserve of the Group comprises primarily revaluation reserve on long-term leasehold land held
by subsidiaries.
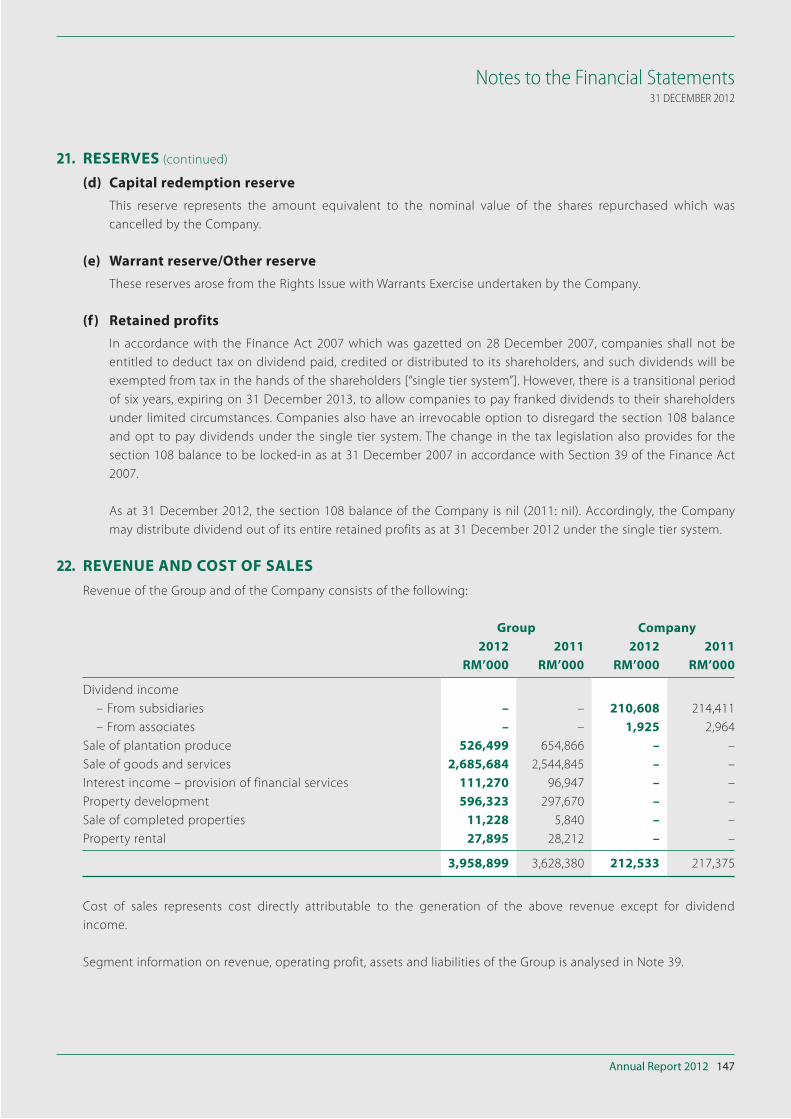
Annual Report 2012 147
Notes to the Financial Statements31 DECEMBER 2012
21. RESERVES (continued)
(d) Capital redemption reserve
This reserve represents the amount equivalent to the nominal value of the shares repurchased which was
cancelled by the Company.
(e) Warrant reserve/Other reserve
These reserves arose from the Rights Issue with Warrants Exercise undertaken by the Company.
(f) Retained profits
In accordance with the Finance Act 2007 which was gazetted on 28 December 2007, companies shall not be
entitled to deduct tax on dividend paid, credited or distributed to its shareholders, and such dividends will be
exempted from tax in the hands of the shareholders [“single tier system”]. However, there is a transitional period
of six years, expiring on 31 December 2013, to allow companies to pay franked dividends to their shareholders
under limited circumstances. Companies also have an irrevocable option to disregard the section 108 balance
and opt to pay dividends under the single tier system. The change in the tax legislation also provides for the
section 108 balance to be locked-in as at 31 December 2007 in accordance with Section 39 of the Finance Act
2007.
As at 31 December 2012, the section 108 balance of the Company is nil (2011: nil). Accordingly, the Company
may distribute dividend out of its entire retained profits as at 31 December 2012 under the single tier system.
22. REVENUE AND COST OF SALES
Revenue of the Group and of the Company consists of the following:
Group Company
2012 2011 2012 2011
RM’000 RM’000 RM’000 RM’000
Dividend income
– From subsidiaries – – 210,608 214,411
– From associates – – 1,925 2,964
Sale of plantation produce 526,499 654,866 – –
Sale of goods and services 2,685,684 2,544,845 – –
Interest income – provision of financial services 111,270 96,947 – –
Property development 596,323 297,670 – –
Sale of completed properties 11,228 5,840 – –
Property rental 27,895 28,212 – –
3,958,899 3,628,380 212,533 217,375
Cost of sales represents cost directly attributable to the generation of the above revenue except for dividend
income.
Segment information on revenue, operating profit, assets and liabilities of the Group is analysed in Note 39.
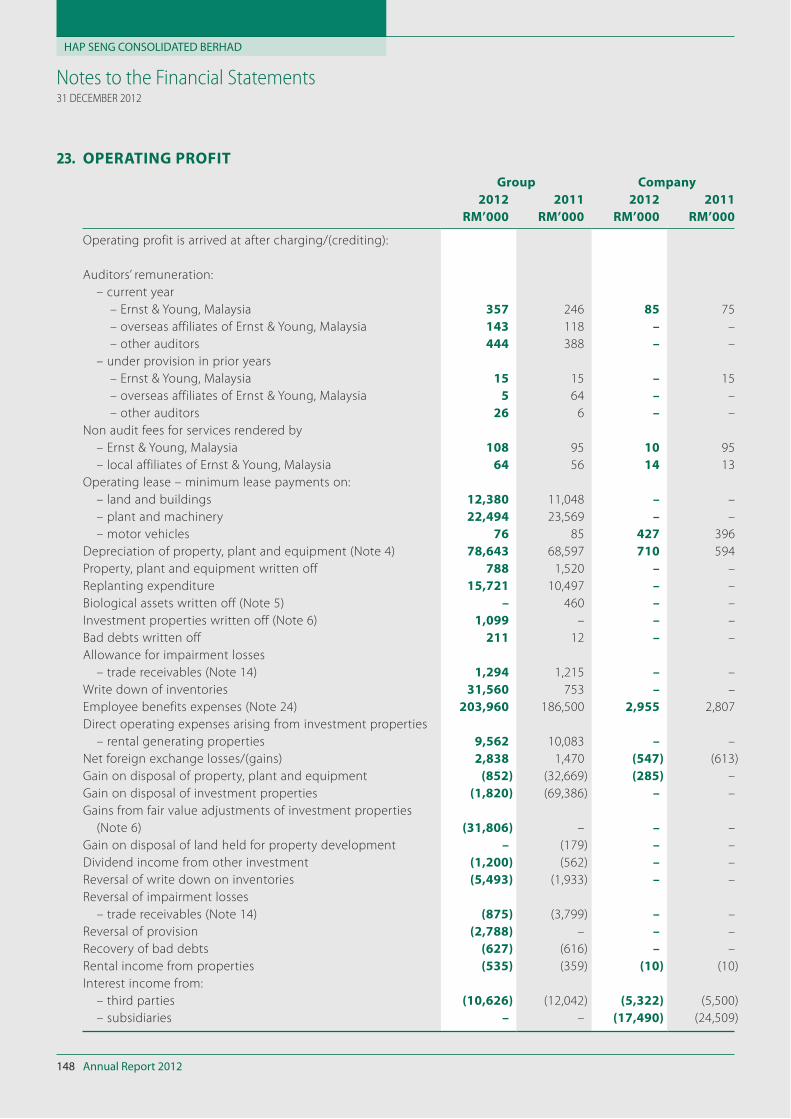
HAP SENG CONSOLIDATED BERHAD
Annual Report 2012148
Notes to the Financial Statements31 DECEMBER 2012
23. OPERATING PROFIT
Group Company
2012 2011 2012 2011
RM’000 RM’000 RM’000 RM’000
Operating profit is arrived at after charging/(crediting):
Auditors’ remuneration:
– current year
– Ernst & Young, Malaysia 357 246 85 75
– overseas affiliates of Ernst & Young, Malaysia 143 118 – –
– other auditors 444 388 – –
– under provision in prior years
– Ernst & Young, Malaysia 15 15 – 15
– overseas affiliates of Ernst & Young, Malaysia 5 64 – –
– other auditors 26 6 – –
Non audit fees for services rendered by
– Ernst & Young, Malaysia 108 95 10 95
– local affiliates of Ernst & Young, Malaysia 64 56 14 13
Operating lease – minimum lease payments on:
– land and buildings 12,380 11,048 – –
– plant and machinery 22,494 23,569 – –
– motor vehicles 76 85 427 396
Depreciation of property, plant and equipment (Note 4) 78,643 68,597 710 594
Property, plant and equipment written off 788 1,520 – –
Replanting expenditure 15,721 10,497 – –
Biological assets written off (Note 5) – 460 – –
Investment properties written off (Note 6) 1,099 – – –
Bad debts written off 211 12 – –
Allowance for impairment losses
– trade receivables (Note 14) 1,294 1,215 – –
Write down of inventories 31,560 753 – –
Employee benefits expenses (Note 24) 203,960 186,500 2,955 2,807
Direct operating expenses arising from investment properties
– rental generating properties 9,562 10,083 – –
Net foreign exchange losses/(gains) 2,838 1,470 (547) (613)
Gain on disposal of property, plant and equipment (852) (32,669) (285) –
Gain on disposal of investment properties (1,820) (69,386) – –
Gains from fair value adjustments of investment properties
(Note 6) (31,806) – – –
Gain on disposal of land held for property development – (179) – –
Dividend income from other investment (1,200) (562) – –
Reversal of write down on inventories (5,493) (1,933) – –
Reversal of impairment losses
– trade receivables (Note 14) (875) (3,799) – –
Reversal of provision (2,788) – – –
Recovery of bad debts (627) (616) – –
Rental income from properties (535) (359) (10) (10)
Interest income from:
– third parties (10,626) (12,042) (5,322) (5,500)
– subsidiaries – – (17,490) (24,509)
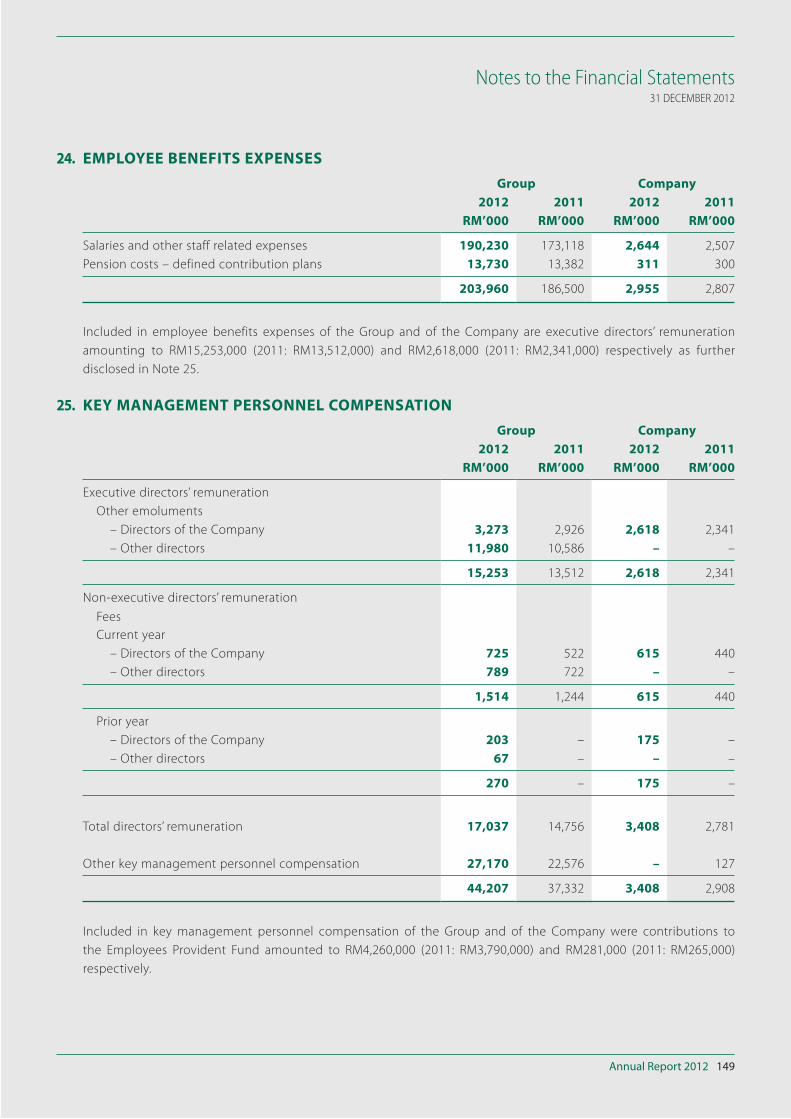
Annual Report 2012 149
Notes to the Financial Statements31 DECEMBER 2012
24. EMPLOYEE BENEFITS EXPENSES
Group Company
2012 2011 2012 2011
RM’000 RM’000 RM’000 RM’000
Salaries and other staff related expenses 190,230 173,118 2,644 2,507
Pension costs – defined contribution plans 13,730 13,382 311 300
203,960 186,500 2,955 2,807
Included in employee benefits expenses of the Group and of the Company are executive directors’ remuneration
amounting to RM15,253,000 (2011: RM13,512,000) and RM2,618,000 (2011: RM2,341,000) respectively as further
disclosed in Note 25.
25. KEY MANAGEMENT PERSONNEL COMPENSATION
Group Company
2012 2011 2012 2011
RM’000 RM’000 RM’000 RM’000
Executive directors’ remuneration
Other emoluments
– Directors of the Company 3,273 2,926 2,618 2,341
– Other directors 11,980 10,586 – –
15,253 13,512 2,618 2,341
Non-executive directors’ remuneration
Fees
Current year
– Directors of the Company 725 522 615 440
– Other directors 789 722 – –
1,514 1,244 615 440
Prior year
– Directors of the Company 203 – 175 –
– Other directors 67 – – –
270 – 175 –
Total directors’ remuneration 17,037 14,756 3,408 2,781
Other key management personnel compensation 27,170 22,576 – 127
44,207 37,332 3,408 2,908
Included in key management personnel compensation of the Group and of the Company were contributions to
the Employees Provident Fund amounted to RM4,260,000 (2011: RM3,790,000) and RM281,000 (2011: RM265,000)
respectively.
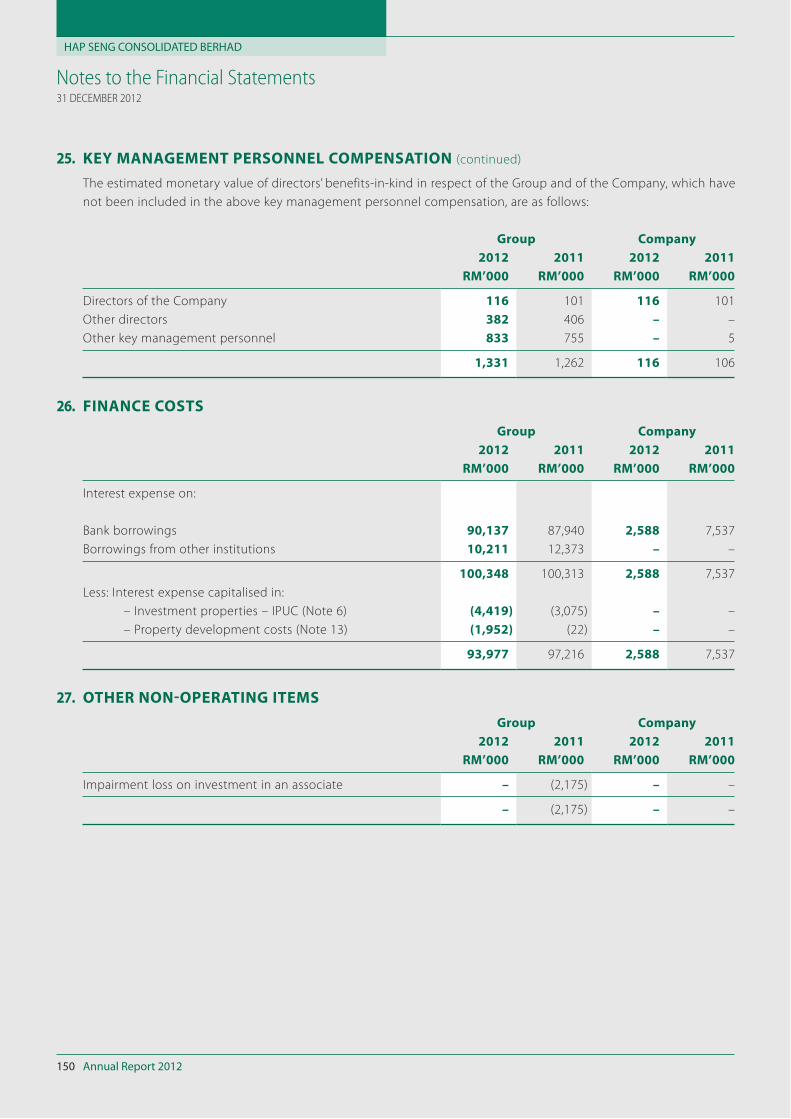
HAP SENG CONSOLIDATED BERHAD
Annual Report 2012150
Notes to the Financial Statements31 DECEMBER 2012
25. KEY MANAGEMENT PERSONNEL COMPENSATION (continued)
The estimated monetary value of directors’ benefits-in-kind in respect of the Group and of the Company, which have
not been included in the above key management personnel compensation, are as follows:
Group Company
2012 2011 2012 2011
RM’000 RM’000 RM’000 RM’000
Directors of the Company 116 101 116 101
Other directors 382 406 – –
Other key management personnel 833 755 – 5
1,331 1,262 116 106
26. FINANCE COSTS
Group Company
2012 2011 2012 2011
RM’000 RM’000 RM’000 RM’000
Interest expense on:
Bank borrowings 90,137 87,940 2,588 7,537
Borrowings from other institutions 10,211 12,373 – –
100,348 100,313 2,588 7,537
Less: Interest expense capitalised in:
– Investment properties – IPUC (Note 6) (4,419) (3,075) – –
– Property development costs (Note 13) (1,952) (22) – –
93,977 97,216 2,588 7,537
27. OTHER NON-OPERATING ITEMS
Group Company
2012 2011 2012 2011
RM’000 RM’000 RM’000 RM’000
Impairment loss on investment in an associate – (2,175) – –
– (2,175) – –

Annual Report 2012 151
Notes to the Financial Statements31 DECEMBER 2012
28. TAX EXPENSE
Group Company
2012 2011 2012 2011
RM’000 RM’000 RM’000 RM’000
Malaysian income tax:
– Current income tax 170,556 140,395 4,791 20,186
– Under provision in prior year 1,472 2,132 644 154
172,028 142,527 5,435 20,340
Foreign income tax:
– Current income tax 22 1,100 – –
172,050 143,627 5,435 20,340
Deferred tax (Note 19):
– Relating to origination and reversal of temporary
differences (1,570) (1,324) (9) 2
– Under/(over) provision in prior year 20,173 (431) – –
18,603 (1,755) (9) 2
Total tax expense 190,653 141,872 5,426 20,342
Domestic income tax is calculated at the Malaysian statutory tax rate of 25% (2011: 25%) of the estimated assessable
profit for the year. Taxation for other jurisdictions is calculated at the rates prevailing in the respective jurisdictions.
A reconciliation of income tax expense applicable to profit before tax at the statutory income tax rate to income tax
expense at the effective income tax rate of the Group and of the Company is as follows:
Group Company
2012 2011 2012 2011
RM’000 RM’000 RM’000 RM’000
Profit before tax 677,107 634,999 216,842 226,218
Taxation at Malaysian statutory tax rate of 25% (2011: 25%) 169,277 158,750 54,211 56,555
Effect of different tax rates in other countries (61) 948 – –
Effect of capital gains taxed at Real Property Gains Tax rate (346) (22,114) – –
Income not subject to tax (18,786) (3,633) (53,394) (39,506)
Expenses not deductible for tax purposes 16,139 11,513 3,965 3,139
Effect of share of results of associates (13,592) (4,937) – –
Deferred tax assets not recognised 16,377 – – –
Utilisation of previously unrecognised deferred tax assets – (356) – –
Under/(over) provision in prior year
– income tax 1,472 2,132 644 154
– deferred tax 20,173 (431) – –
Tax expense for the year 190,653 141,872 5,426 20,342
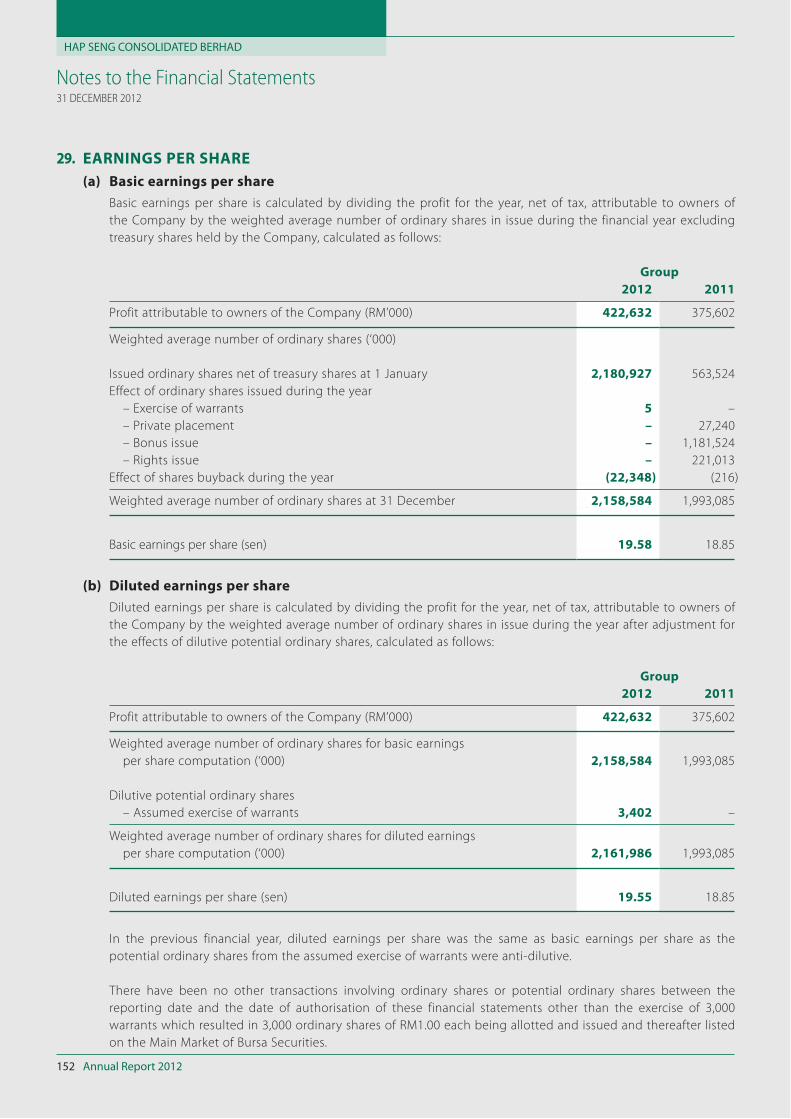
HAP SENG CONSOLIDATED BERHAD
Annual Report 2012152
Notes to the Financial Statements31 DECEMBER 2012
29. EARNINGS PER SHARE
(a) Basic earnings per share
Basic earnings per share is calculated by dividing the profit for the year, net of tax, attributable to owners of
the Company by the weighted average number of ordinary shares in issue during the financial year excluding
treasury shares held by the Company, calculated as follows:
Group
2012 2011
Profit attributable to owners of the Company (RM’000) 422,632 375,602
Weighted average number of ordinary shares (‘000)
Issued ordinary shares net of treasury shares at 1 January 2,180,927 563,524
Effect of ordinary shares issued during the year
– Exercise of warrants 5 –
– Private placement – 27,240
– Bonus issue – 1,181,524
– Rights issue – 221,013
Effect of shares buyback during the year (22,348) (216)
Weighted average number of ordinary shares at 31 December 2,158,584 1,993,085
Basic earnings per share (sen) 19.58 18.85
(b) Diluted earnings per share
Diluted earnings per share is calculated by dividing the profit for the year, net of tax, attributable to owners of
the Company by the weighted average number of ordinary shares in issue during the year after adjustment for
the effects of dilutive potential ordinary shares, calculated as follows:
Group
2012 2011
Profit attributable to owners of the Company (RM’000) 422,632 375,602
Weighted average number of ordinary shares for basic earnings
per share computation (‘000) 2,158,584 1,993,085
Dilutive potential ordinary shares
– Assumed exercise of warrants 3,402 –
Weighted average number of ordinary shares for diluted earnings
per share computation (‘000) 2,161,986 1,993,085
Diluted earnings per share (sen) 19.55 18.85
In the previous financial year, diluted earnings per share was the same as basic earnings per share as the
potential ordinary shares from the assumed exercise of warrants were anti-dilutive.
There have been no other transactions involving ordinary shares or potential ordinary shares between the
reporting date and the date of authorisation of these financial statements other than the exercise of 3,000
warrants which resulted in 3,000 ordinary shares of RM1.00 each being allotted and issued and thereafter listed
on the Main Market of Bursa Securities.
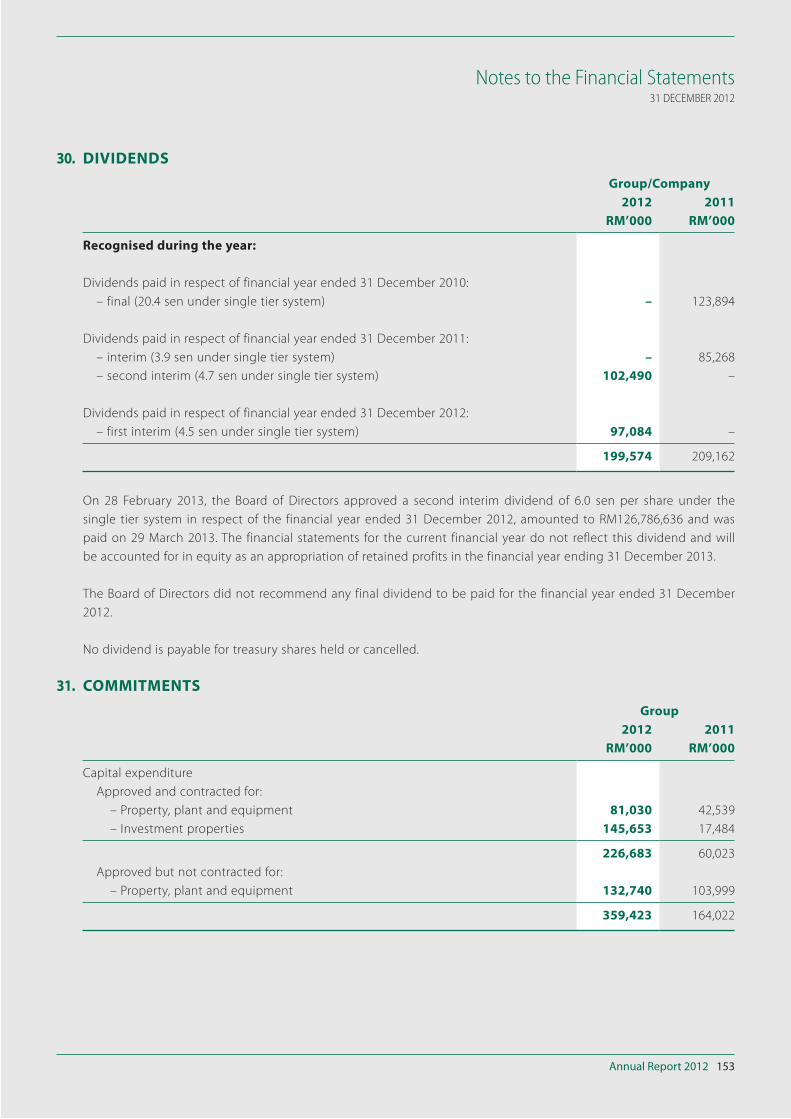
Annual Report 2012 153
Notes to the Financial Statements31 DECEMBER 2012
30. DIVIDENDS
Group/Company
2012 2011
RM’000 RM’000
Recognised during the year:
Dividends paid in respect of financial year ended 31 December 2010:
– final (20.4 sen under single tier system) – 123,894
Dividends paid in respect of financial year ended 31 December 2011:
– interim (3.9 sen under single tier system) – 85,268
– second interim (4.7 sen under single tier system) 102,490 –
Dividends paid in respect of financial year ended 31 December 2012:
– first interim (4.5 sen under single tier system) 97,084 –
199,574 209,162
On 28 February 2013, the Board of Directors approved a second interim dividend of 6.0 sen per share under the
single tier system in respect of the financial year ended 31 December 2012, amounted to RM126,786,636 and was
paid on 29 March 2013. The financial statements for the current financial year do not reflect this dividend and will
be accounted for in equity as an appropriation of retained profits in the financial year ending 31 December 2013.
The Board of Directors did not recommend any final dividend to be paid for the financial year ended 31 December
2012.
No dividend is payable for treasury shares held or cancelled.
31. COMMITMENTS
Group
2012 2011
RM’000 RM’000
Capital expenditure
Approved and contracted for:
– Property, plant and equipment 81,030 42,539
– Investment properties 145,653 17,484
226,683 60,023
Approved but not contracted for:
– Property, plant and equipment 132,740 103,999
359,423 164,022
HAP SENG CONSOLIDATED BERHAD
Annual Report 2012154
Notes to the Financial Statements31 DECEMBER 2012
32. OPERATING LEASE COMMITMENTS (AS LESSEE)
Total future minimum rentals payable under non-cancellable operating leases are as follows:
Group
2012 2011
RM’000 RM’000
Due within one year 5,642 6,013
Due after one year but not more than five years 10,515 7,330
Due after five years 10,186 3,700
26,343 17,043
33. CONTINGENT LIABILITIES
There are no material contingent liabilities to be disclosed for the Group and the Company.
34. MATERIAL LITIGATIONS
(a) On 24 October 2002, the Company was served with a Writ of Summons [“said Writ”] in the High Court in Sabah
and Sarawak at Kota Kinabalu [“Tongod Suit”] wherein the Company was named as the First Defendant, Genting
Plantations Berhad (formerly known as Asiatic Development Berhad) [“GPB”] as the Second Defendant, Tanjung
Bahagia Sdn Bhd as the Third Defendant, Director of Department of Lands and Surveys, Sabah as the Fourth
Defendant and the Government of the State of Sabah as the Fifth Defendant. The Tongod Suit was instituted by
certain natives of Sabah claiming Native Customary Rights [“NCR”] over all that parcel of land held under Title
No. CL095330724 situated in Sungai Tongod, District of Kinabatangan, Sandakan [the “Tongod Land”] or part
thereof. The Company had on 9 May 2002 completed its disposal of the Tongod Land to Tanjung Bahagia Sdn
Bhd, the wholly-owned subsidiary of GPB.
The Company filed its Statement of Defence and an application to strike out the said Writ on 11 February 2003
[“Striking-out Application”]. The Deputy Registrar dismissed the Striking-out Application on 13 June 2003, which
decision was appealed against by the Company [“said Striking-out Appeal”].
The Plaintiffs had earlier filed an application for injunction restraining the Second Defendant and the Third
Defendant from carrying out, inter alia, planting activities on the Tongod Land or part thereof [“Injunction
Application”]. During the 5 July 2004 High Court hearing on the Injunction Application, the Defendants raised
a preliminary objection to the High Court’s jurisdiction to determine Native Customary Rights. The preliminary
objection was upheld by the High Court on 20 June 2008 and the Tongod Suit was thereupon dismissed
with costs awarded to the Defendants [the “PO Decision”]. The Plaintiffs’s appeal against the PO Decision was
dismissed by the Court of Appeal on 9 June 2011 [the “said Dismissal Decision”]. Thereafter, the Plaintiffs filed an
application by way of Notice of Motion to the Federal Court seeking leave to appeal against the said Dismissal
Decision [“said Leave Application”].
On 25 July 2011, the Federal Court allowed the said Leave Application with which the Plaintiffs were granted
leave and stay of the said Dismissal Decision pending hearing of the Plaintiffs’ appeal [“said Appeal”]. On 24
November 2011, the Federal Court allowed the said Appeal and set aside both the PO Decision and said
Dismissal Decision. The Federal Court further ordered that the said Striking-out Appeal be remitted to the High
Court.
Annual Report 2012 155
Notes to the Financial Statements31 DECEMBER 2012
34. MATERIAL LITIGATIONS (continued)
(a) (continued)
On 21 March 2012, the High Court dismissed the said Striking-out Appeal with costs awarded to the Plaintiffs
[“Striking-out Appeal Dismissal”]. Upon the Plaintiffs’ application, the High Court further on 12 April 2012
ordered that the Assistant Collector of Land Revenues, Tongod and Registrar of Titles be added as the Sixth
Defendant and Seventh Defendant respectively in the Tongod Suit. On 13 April 2012, the Company filed a
Notice of Appeal to the Court of Appeal appealing against the Striking-out Appeal Dismissal which is now fixed
for hearing on 8 May 2013.
The Plaintiffs were granted leave by the High Court on 7 November 2012 to add the Assistant Collector of Land
Revenues, Kota Kinabatangan as the Eighth Defendant in the Tongod Suit.
The Tongod Suit was part-heard from 26 to 29 November 2012, 14 to 18 January 2013, 18 to 22 February 2013
and 11 to 15 March 2013. Hearing of the Tongod Suit would continue from 13 to 17 May 2013.
The Company’s Solicitors are of the opinion that the Plaintiffs’ NCR claim is unlikely to succeed.
(b) Hap Seng Plantations (River Estates) Sdn Bhd [“RESB”], the wholly-owned subsidiary of Hap Seng Plantations
Holdings Berhad [“HSP”], the 55.16%-owned listed subsidiary of the Company, is the registered and beneficial
proprietor of all that parcel of land held under CL095310017, District of Kinabatangan, State of Sabah
measuring approximately 6,454 acres [“said Land”]. On 16 January 2012, a purported sale and purchase
agreement in respect of the said Land was entered into between Mr. Heng Chin Hing @ Wong Chin Hing (NRIC
No. H0699157/570811-12-5731) [“HCH”] as the purported vendor and Excess Interpoint Sdn Bhd [“EISB”] as
the purported purchaser [the “Purported SPA”]. HCH alleged that he is the donee of a power of attorney dated
8.2.1977 allegedly created in respect of the said Land [the “Alleged PA”]. On the basis of the Purported SPA, a
private caveat was entered on the said Land on 3 April 2012 by EISB.
On 23 May 2012, RESB filed a writ of summon and an application for interlocutory injunction [“said Interlocutory
Injunction Application”] through its solicitors in Kuala Lumpur, Messrs Wong Kian Kheong, against EISB [“1st
Defendant”] at the Kuala Lumpur High Court [“KLHC”] vide Civil Suit No. 22NCVC-631-05/2012 [“RESB Suit”].
On 14 June 2012, the KLHC granted an ad interim injunction in favour of RESB [“said Ad Interim Injunction”]
pending disposal of the hearing of the said Interlocutory Injunction Application subject to RESB’s undertaking
to pay damages to the 1st Defendant for losses suffered by the 1st Defendant resulting from the said Ad Interim
Injunction in the event that the said Ad Interim Injunction is subsequently discharged or set aside. On 16 June
2012, HCH was added as a co-defendant [“2nd Defendant”] to the RESB Suit upon RESB’s application.
RESB is claiming for the following in the RESB Suit:
(a) That RESB be declared as the registered and beneficial owner of the said Land;
(b) That the Purported SPA be declared null and void;
(c) That the Alleged PA be declared null and void;
HAP SENG CONSOLIDATED BERHAD
Annual Report 2012156
Notes to the Financial Statements31 DECEMBER 2012
34. MATERIAL LITIGATIONS (continued)
(b) (continued)
(d) An injunction restraining the 1st Defendant from:
(i) effecting any further dealings including but not limited to disposal, assignment, transfer, mortgage,
charge, lease, tenancy over the said Land with any third party;
(ii) taking any actions to fulfill the terms and conditions in the Purported SPA; and
(iii) taking any further action to complete the Purported SPA.
(e) An injunction restraining the 2nd Defendant from effecting any steps, actions and/or representations in
respect of the Alleged PA;
(f ) Costs of the RESB Suit; and
(g) Such further or other relief as the Court deems fit and just.
Upon application by the 1st Defendant, the KLHC had on 10 August 2012 transferred the RESB Suit to the High
Court of Sabah & Sarawak at Kota Kinabalu [“KKHC”]. KKHC has registered the transferred RESB Suit as Civil Suit
No. BKI-22-209/9-2012 with the said Ad Interim Injunction continuing to be in effect. With the transfer of the
RESB Suit to KKHC, RESB is currently represented by Messrs Jayasuria Kah & Co.
The RESB Suit has been stayed pending a Court of Appeal decision in another case on the constitutionality of
the transfer of civil suits from West Malaysia to Sabah and vice versa. The KKHC has fixed the next mention of
the RESB Suit on 22 April 2013.
HSP has been advised by both Messrs Wong Kian Kheong and Messrs Jayasuria Kah & Co. that RESB has good
grounds to succeed in the RESB Suit.
(c) Chee Ah Nun @ Sia Yi Chan (NRIC No. 550808-12-5663) [“SYC” or the “Plaintiff ”] has filed a separate legal suit
against RESB in respect of the said Land in KKHC vide Originating Summon No. BKI-24-127/5-2012, and the
same was served on RESB on 11 June 2012 [the “KK Suit”].
The KK Suit is premised on a purported deed of appointment of substitute by attorney dated 24 June 2010
[“Alleged Deed of Substitute”] allegedly executed by HCH pursuant to which HCH had allegedly divested to SYC
all his interests or claims on the said Land pursuant to the Alleged PA.
SYC is claiming for the following in the KK Suit:
(a) that by virtue of the Alleged PA, RESB had allegedly divested its ownership and all interests or claims to the
said Land to HCH;
(b) that pursuant to the Alleged Deed of Substitute, SYC is the beneficial owner and has rights to take
possession of the said Land;
Annual Report 2012 157
Notes to the Financial Statements31 DECEMBER 2012
34. MATERIAL LITIGATIONS (continued)
(c) (continued)
(c) an order that RESB forthwith deliver vacant possession of the said Land to SYC free of encumbrances with
all fixtures and crops planted thereon;
(d) an injunction restraining RESB, its servants and/or employees or agents from harvesting crops on the said
Land or removing anything thereon and/or otherwise from doing anything or interfering with SYC’s rights
thereon;
(e) costs of the KK Suit; and
(f ) such further or other relief as the Court deems fit and just.
RESB has through its solicitors in Sabah, Messrs Jayasuria Kah & Co., filed an application to convert the KK Suit
from being an originating summon action into a writ action [“Conversion Application”]. The KKHC has on 21
November 2012 granted a stay of the KK Suit. The next mention of the KK Suit has been fixed on 12 April 2013.
HSP has been advised by its solicitors that the KK Suit is unlikely to succeed.
35. FINANCIAL INSTRUMENTS
(a) Fair value of financial instruments
The carrying values of financial instruments of the Group and of the Company at the reporting date
approximated their fair values except for other investment.
Fair value information has not been disclosed for the Group’s investments in unquoted shares (Note 9) that are
carried at cost because it is not practicable to estimate its fair value due to lack of comparable quoted market
prices and the inability to estimate fair value without incurring excessive costs.
The following methods and assumptions are used to estimate the fair values of the following classes of financial
instruments.
(i) Cash and cash equivalents, sundry receivables, other payables and current bank borrowings
The carrying amounts approximate fair values due to the relatively short term maturity of these financial
instruments.
(ii) Third parties receivables and payables, lease, hire purchase and loan receivables, and amount
due to/from subsidiaries, associates, and related companies
The carrying amounts of third parties receivables and payables and amounts due to/from subsidiaries,
associates, and related companies approximate fair values because these amounts are expected to be
settled in the short term.
The carrying amounts of lease, hire purchase and loan receivables, which are based on principal amounts
outstanding representing approximately the cash flow receivables discounted at their effective yields. The
carrying amounts of lease, hire purchase and loan receivables closely approximate their fair values.
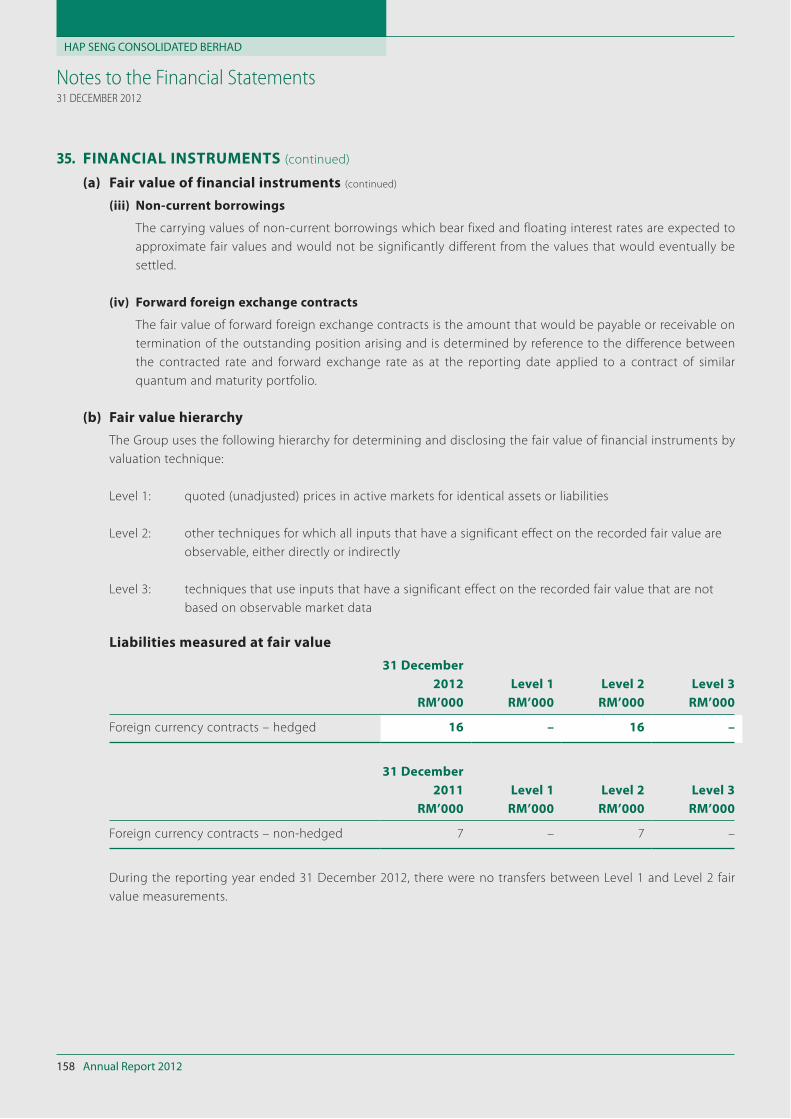
HAP SENG CONSOLIDATED BERHAD
Annual Report 2012158
Notes to the Financial Statements31 DECEMBER 2012
35. FINANCIAL INSTRUMENTS (continued)
(a) Fair value of financial instruments (continued)
(iii) Non-current borrowings
The carrying values of non-current borrowings which bear fixed and floating interest rates are expected to
approximate fair values and would not be significantly different from the values that would eventually be
settled.
(iv) Forward foreign exchange contracts
The fair value of forward foreign exchange contracts is the amount that would be payable or receivable on
termination of the outstanding position arising and is determined by reference to the difference between
the contracted rate and forward exchange rate as at the reporting date applied to a contract of similar
quantum and maturity portfolio.
(b) Fair value hierarchy
The Group uses the following hierarchy for determining and disclosing the fair value of financial instruments by
valuation technique:
Level 1: quoted (unadjusted) prices in active markets for identical assets or liabilities
Level 2: other techniques for which all inputs that have a significant effect on the recorded fair value are
observable, either directly or indirectly
Level 3: techniques that use inputs that have a significant effect on the recorded fair value that are not
based on observable market data
Liabilities measured at fair value
31 December
2012 Level 1 Level 2 Level 3
RM’000 RM’000 RM’000 RM’000
Foreign currency contracts – hedged 16 – 16 –
31 December
2011 Level 1 Level 2 Level 3
RM’000 RM’000 RM’000 RM’000
Foreign currency contracts – non-hedged 7 – 7 –
During the reporting year ended 31 December 2012, there were no transfers between Level 1 and Level 2 fair
value measurements.
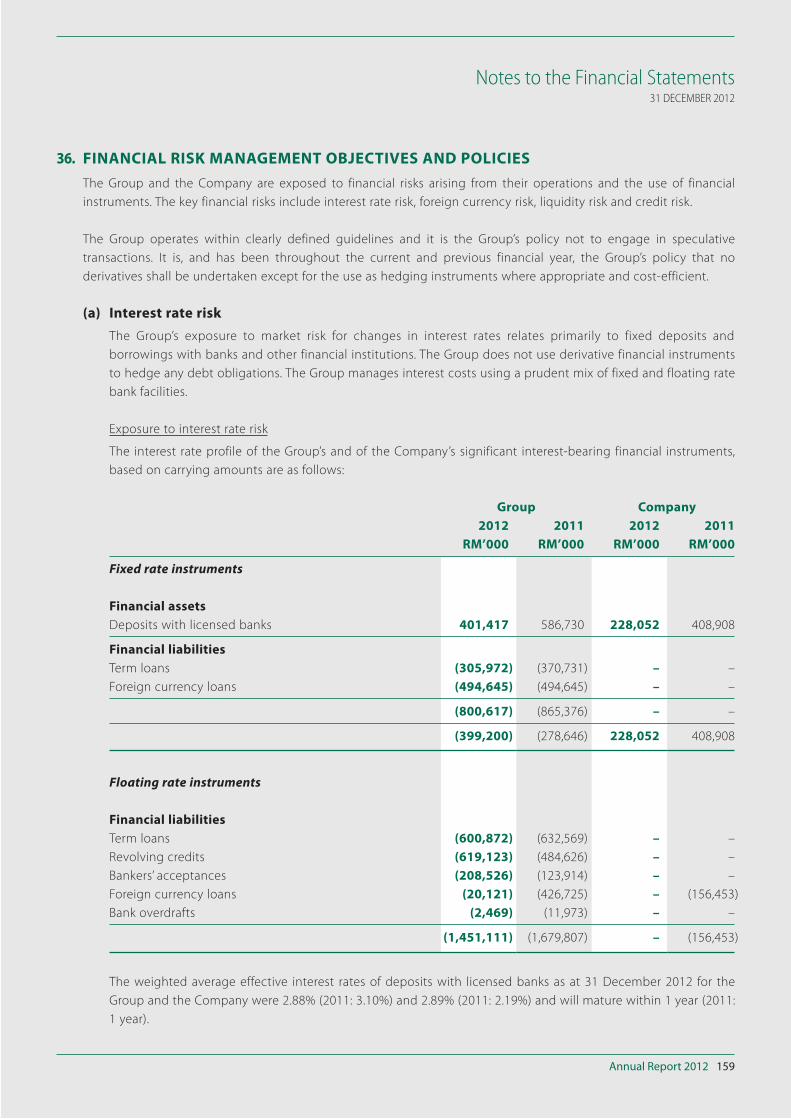
Annual Report 2012 159
Notes to the Financial Statements31 DECEMBER 2012
36. FINANCIAL RISK MANAGEMENT OBJECTIVES AND POLICIES
The Group and the Company are exposed to financial risks arising from their operations and the use of financial
instruments. The key financial risks include interest rate risk, foreign currency risk, liquidity risk and credit risk.
The Group operates within clearly defined guidelines and it is the Group’s policy not to engage in speculative
transactions. It is, and has been throughout the current and previous financial year, the Group’s policy that no
derivatives shall be undertaken except for the use as hedging instruments where appropriate and cost-efficient.
(a) Interest rate risk
The Group’s exposure to market risk for changes in interest rates relates primarily to fixed deposits and
borrowings with banks and other financial institutions. The Group does not use derivative financial instruments
to hedge any debt obligations. The Group manages interest costs using a prudent mix of fixed and floating rate
bank facilities.
Exposure to interest rate risk
The interest rate profile of the Group’s and of the Company’s significant interest-bearing financial instruments,
based on carrying amounts are as follows:
Group Company
2012 2011 2012 2011
RM’000 RM’000 RM’000 RM’000
Fixed rate instruments
Financial assets
Deposits with licensed banks 401,417 586,730 228,052 408,908
Financial liabilities
Term loans (305,972) (370,731) – –
Foreign currency loans (494,645) (494,645) – –
(800,617) (865,376) – –
(399,200) (278,646) 228,052 408,908
Floating rate instruments
Financial liabilities
Term loans (600,872) (632,569) – –
Revolving credits (619,123) (484,626) – –
Bankers’ acceptances (208,526) (123,914) – –
Foreign currency loans (20,121) (426,725) – (156,453)
Bank overdrafts (2,469) (11,973) – –
(1,451,111) (1,679,807) – (156,453)
The weighted average effective interest rates of deposits with licensed banks as at 31 December 2012 for the
Group and the Company were 2.88% (2011: 3.10%) and 2.89% (2011: 2.19%) and will mature within 1 year (2011:
1 year).
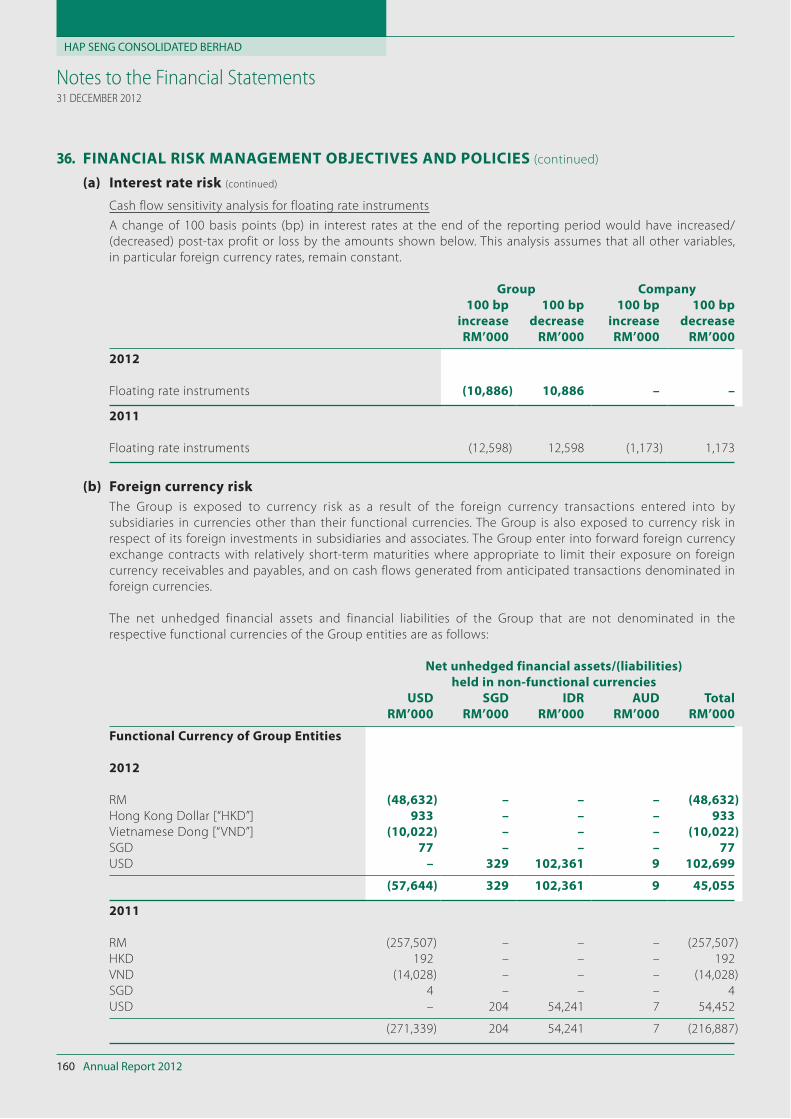
HAP SENG CONSOLIDATED BERHAD
Annual Report 2012160
Notes to the Financial Statements31 DECEMBER 2012
36. FINANCIAL RISK MANAGEMENT OBJECTIVES AND POLICIES (continued)
(a) Interest rate risk (continued)
Cash flow sensitivity analysis for floating rate instruments
A change of 100 basis points (bp) in interest rates at the end of the reporting period would have increased/
(decreased) post-tax profit or loss by the amounts shown below. This analysis assumes that all other variables,
in particular foreign currency rates, remain constant.
Group Company
100 bp 100 bp 100 bp 100 bp
increase decrease increase decrease
RM’000 RM’000 RM’000 RM’000
2012
Floating rate instruments (10,886) 10,886 – –
2011
Floating rate instruments (12,598) 12,598 (1,173) 1,173
(b) Foreign currency risk
The Group is exposed to currency risk as a result of the foreign currency transactions entered into by
subsidiaries in currencies other than their functional currencies. The Group is also exposed to currency risk in
respect of its foreign investments in subsidiaries and associates. The Group enter into forward foreign currency
exchange contracts with relatively short-term maturities where appropriate to limit their exposure on foreign
currency receivables and payables, and on cash flows generated from anticipated transactions denominated in
foreign currencies.
The net unhedged financial assets and financial liabilities of the Group that are not denominated in the
respective functional currencies of the Group entities are as follows:
Net unhedged financial assets/(liabilities)
held in non-functional currencies
USD SGD IDR AUD Total
RM’000 RM’000 RM’000 RM’000 RM’000
Functional Currency of Group Entities
2012
RM (48,632) – – – (48,632)
Hong Kong Dollar [“HKD”] 933 – – – 933
Vietnamese Dong [“VND”] (10,022) – – – (10,022)
SGD 77 – – – 77
USD – 329 102,361 9 102,699
(57,644) 329 102,361 9 45,055
2011
RM (257,507) – – – (257,507)
HKD 192 – – – 192
VND (14,028) – – – (14,028)
SGD 4 – – – 4
USD – 204 54,241 7 54,452
(271,339) 204 54,241 7 (216,887)
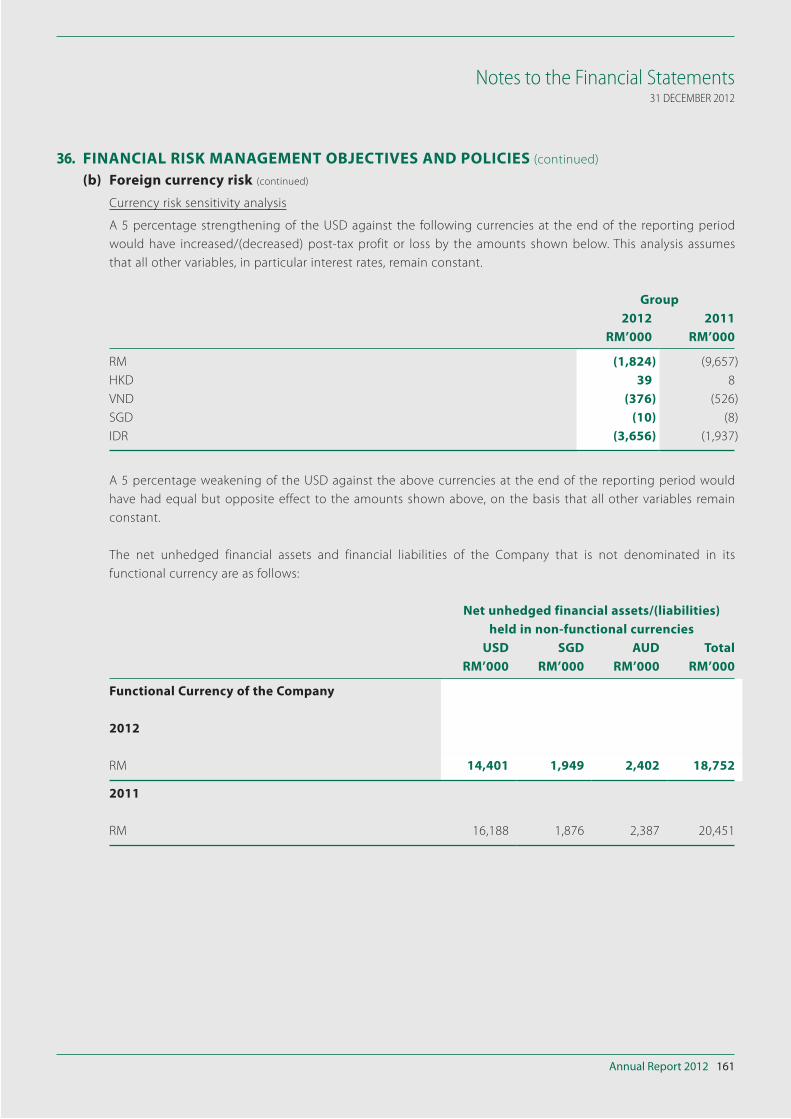
Annual Report 2012 161
Notes to the Financial Statements31 DECEMBER 2012
36. FINANCIAL RISK MANAGEMENT OBJECTIVES AND POLICIES (continued)
(b) Foreign currency risk (continued)
Currency risk sensitivity analysis
A 5 percentage strengthening of the USD against the following currencies at the end of the reporting period
would have increased/(decreased) post-tax profit or loss by the amounts shown below. This analysis assumes
that all other variables, in particular interest rates, remain constant.
Group
2012 2011
RM’000 RM’000
RM (1,824) (9,657)
HKD 39 8
VND (376) (526)
SGD (10) (8)
IDR (3,656) (1,937)
A 5 percentage weakening of the USD against the above currencies at the end of the reporting period would
have had equal but opposite effect to the amounts shown above, on the basis that all other variables remain
constant.
The net unhedged financial assets and financial liabilities of the Company that is not denominated in its
functional currency are as follows:
Net unhedged financial assets/(liabilities)
held in non-functional currencies
USD SGD AUD Total
RM’000 RM’000 RM’000 RM’000
Functional Currency of the Company
2012
RM 14,401 1,949 2,402 18,752
2011
RM 16,188 1,876 2,387 20,451
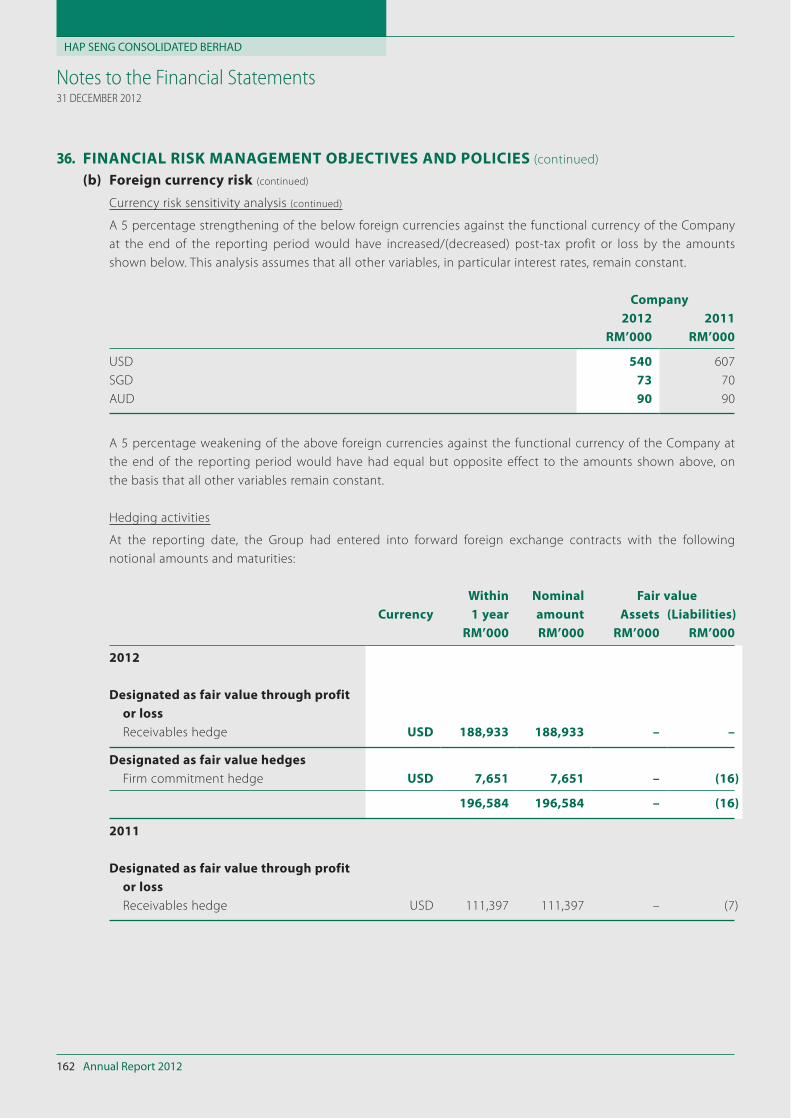
HAP SENG CONSOLIDATED BERHAD
Annual Report 2012162
Notes to the Financial Statements31 DECEMBER 2012
36. FINANCIAL RISK MANAGEMENT OBJECTIVES AND POLICIES (continued)
(b) Foreign currency risk (continued)
Currency risk sensitivity analysis (continued)
A 5 percentage strengthening of the below foreign currencies against the functional currency of the Company
at the end of the reporting period would have increased/(decreased) post-tax profit or loss by the amounts
shown below. This analysis assumes that all other variables, in particular interest rates, remain constant.
Company
2012 2011
RM’000 RM’000
USD 540 607
SGD 73 70
AUD 90 90
A 5 percentage weakening of the above foreign currencies against the functional currency of the Company at
the end of the reporting period would have had equal but opposite effect to the amounts shown above, on
the basis that all other variables remain constant.
Hedging activities
At the reporting date, the Group had entered into forward foreign exchange contracts with the following
notional amounts and maturities:
Currency
Within
1 year
Nominal
amount
Fair value
Assets (Liabilities)
RM’000 RM’000 RM’000 RM’000
2012
Designated as fair value through profit
or loss
Receivables hedge USD 188,933 188,933 – –
Designated as fair value hedges
Firm commitment hedge USD 7,651 7,651 – (16)
196,584 196,584 – (16)
2011
Designated as fair value through profit
or loss
Receivables hedge USD 111,397 111,397 – (7)
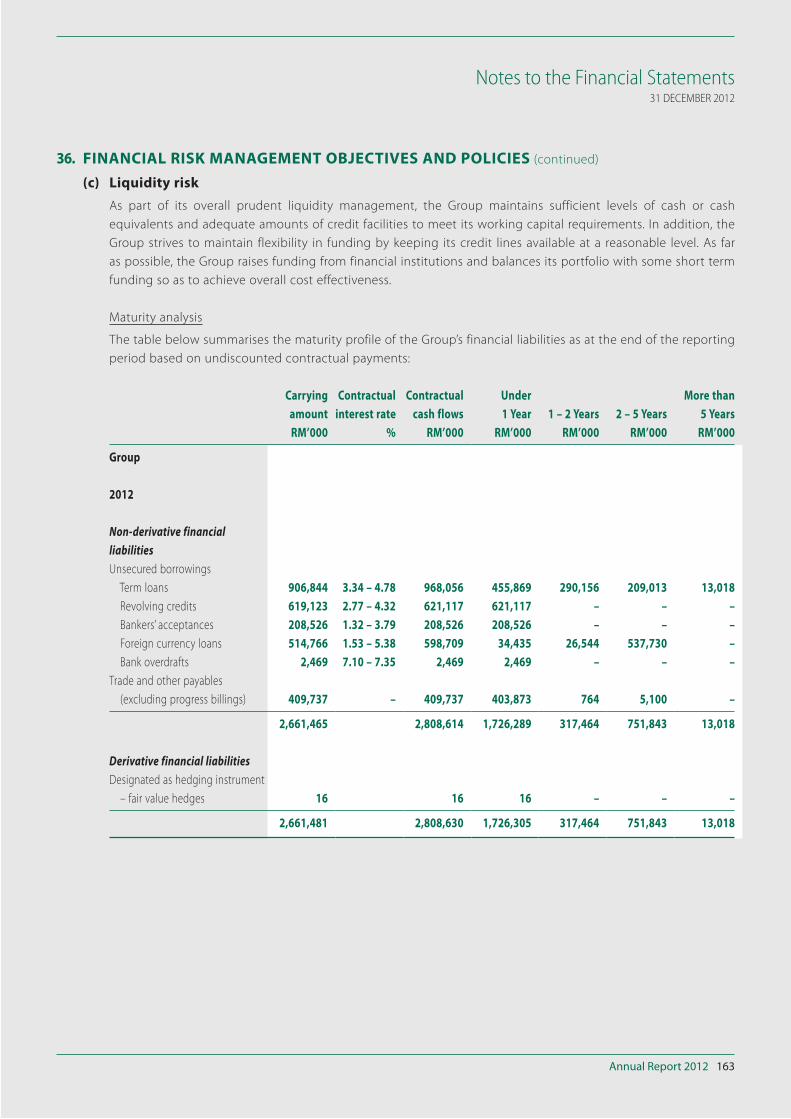
Annual Report 2012 163
Notes to the Financial Statements31 DECEMBER 2012
36. FINANCIAL RISK MANAGEMENT OBJECTIVES AND POLICIES (continued)
(c) Liquidity risk
As part of its overall prudent liquidity management, the Group maintains sufficient levels of cash or cash
equivalents and adequate amounts of credit facilities to meet its working capital requirements. In addition, the
Group strives to maintain flexibility in funding by keeping its credit lines available at a reasonable level. As far
as possible, the Group raises funding from financial institutions and balances its portfolio with some short term
funding so as to achieve overall cost effectiveness.
Maturity analysis
The table below summarises the maturity profile of the Group’s financial liabilities as at the end of the reporting
period based on undiscounted contractual payments:
Carrying
amount
Contractual
interest rate
Contractual
cash flows
Under
1 Year 1 – 2 Years 2 – 5 Years
More than
5 Years
RM’000 % RM’000 RM’000 RM’000 RM’000 RM’000
Group
2012
Non-derivative financial liabilitiesUnsecured borrowings
Term loans 906,844 3.34 – 4.78 968,056 455,869 290,156 209,013 13,018
Revolving credits 619,123 2.77 – 4.32 621,117 621,117 – – –
Bankers’ acceptances 208,526 1.32 – 3.79 208,526 208,526 – – –
Foreign currency loans 514,766 1.53 – 5.38 598,709 34,435 26,544 537,730 –
Bank overdrafts 2,469 7.10 – 7.35 2,469 2,469 – – –
Trade and other payables
(excluding progress billings) 409,737 – 409,737 403,873 764 5,100 –
2,661,465 2,808,614 1,726,289 317,464 751,843 13,018
Derivative financial liabilitiesDesignated as hedging instrument
– fair value hedges 16 16 16 – – –
2,661,481 2,808,630 1,726,305 317,464 751,843 13,018
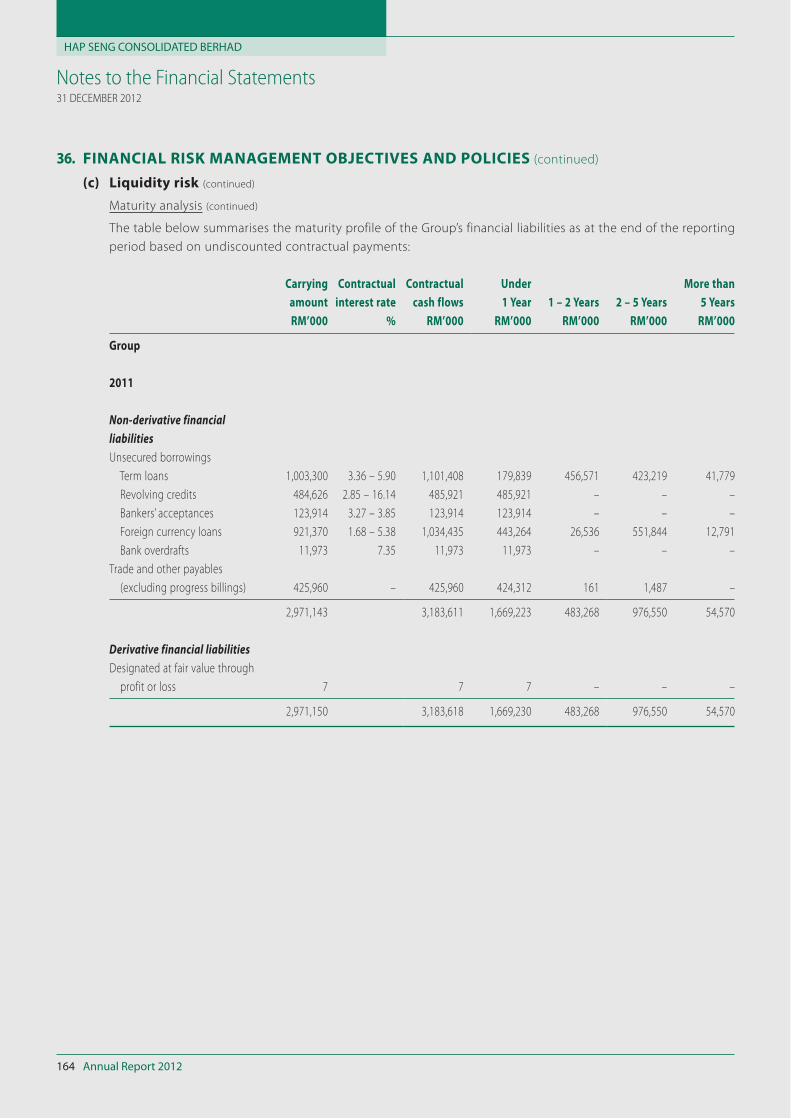
HAP SENG CONSOLIDATED BERHAD
Annual Report 2012164
Notes to the Financial Statements31 DECEMBER 2012
36. FINANCIAL RISK MANAGEMENT OBJECTIVES AND POLICIES (continued)
(c) Liquidity risk (continued)
Maturity analysis (continued)
The table below summarises the maturity profile of the Group’s financial liabilities as at the end of the reporting
period based on undiscounted contractual payments:
Carrying
amount
Contractual
interest rate
Contractual
cash flows
Under
1 Year 1 – 2 Years 2 – 5 Years
More than
5 Years
RM’000 % RM’000 RM’000 RM’000 RM’000 RM’000
Group
2011
Non-derivative financial liabilitiesUnsecured borrowings
Term loans 1,003,300 3.36 – 5.90 1,101,408 179,839 456,571 423,219 41,779
Revolving credits 484,626 2.85 – 16.14 485,921 485,921 – – –
Bankers’ acceptances 123,914 3.27 – 3.85 123,914 123,914 – – –
Foreign currency loans 921,370 1.68 – 5.38 1,034,435 443,264 26,536 551,844 12,791
Bank overdrafts 11,973 7.35 11,973 11,973 – – –
Trade and other payables
(excluding progress billings) 425,960 – 425,960 424,312 161 1,487 –
2,971,143 3,183,611 1,669,223 483,268 976,550 54,570
Derivative financial liabilitiesDesignated at fair value through
profit or loss 7 7 7 – – –
2,971,150 3,183,618 1,669,230 483,268 976,550 54,570
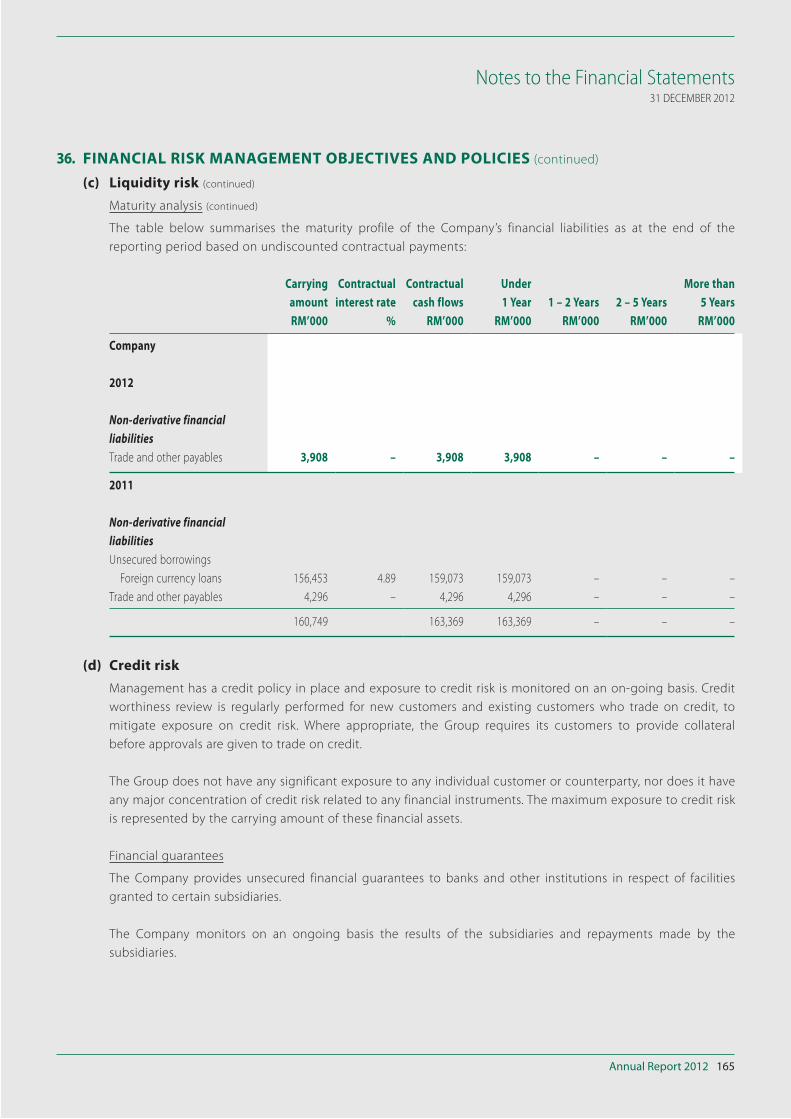
Annual Report 2012 165
Notes to the Financial Statements31 DECEMBER 2012
36. FINANCIAL RISK MANAGEMENT OBJECTIVES AND POLICIES (continued)
(c) Liquidity risk (continued)
Maturity analysis (continued)
The table below summarises the maturity profile of the Company’s financial liabilities as at the end of the
reporting period based on undiscounted contractual payments:
Carrying
amount
Contractual
interest rate
Contractual
cash flows
Under
1 Year 1 – 2 Years 2 – 5 Years
More than
5 Years
RM’000 % RM’000 RM’000 RM’000 RM’000 RM’000
Company
2012
Non-derivative financial liabilitiesTrade and other payables 3,908 – 3,908 3,908 – – –
2011
Non-derivative financial liabilitiesUnsecured borrowings
Foreign currency loans 156,453 4.89 159,073 159,073 – – –
Trade and other payables 4,296 – 4,296 4,296 – – –
160,749 163,369 163,369 – – –
(d) Credit risk
Management has a credit policy in place and exposure to credit risk is monitored on an on-going basis. Credit
worthiness review is regularly performed for new customers and existing customers who trade on credit, to
mitigate exposure on credit risk. Where appropriate, the Group requires its customers to provide collateral
before approvals are given to trade on credit.
The Group does not have any significant exposure to any individual customer or counterparty, nor does it have
any major concentration of credit risk related to any financial instruments. The maximum exposure to credit risk
is represented by the carrying amount of these financial assets.
Financial guarantees
The Company provides unsecured financial guarantees to banks and other institutions in respect of facilities
granted to certain subsidiaries.
The Company monitors on an ongoing basis the results of the subsidiaries and repayments made by the
subsidiaries.

HAP SENG CONSOLIDATED BERHAD
Annual Report 2012166
Notes to the Financial Statements31 DECEMBER 2012
36. FINANCIAL RISK MANAGEMENT OBJECTIVES AND POLICIES (continued)
(d) Credit risk (continued)
Corporate guarantees with a nominal amount of RM2,251,728,000 (2011: RM2,388,730,000) were provided by
the Company to the banks and other institutions in respect of facilities of its subsidiaries.
As at the reporting date, there was no indication that any subsidiary would default on repayment.
The financial guarantees have not been recognised as their fair values on initial recognition were not material
as the risk of default from subsidiaries is low.
37. CAPITAL MANAGEMENT
The Group’s objectives when managing capital is to maintain a strong capital base and safeguard the Group’s ability
to continue as a going concern, so as to maintain investor, creditor and market confidence and to sustain future
development of the business. The Directors monitor and are determined to maintain an optimal debt-to-equity ratio
that complies with debt covenants and regulatory requirements.
There were no changes in the Group’s approach to capital management during the year. The debt-to-equity ratios as
at the end of the reporting period were as follows:
Group
2012 2011
RM’000 RM’000
Borrowings (Note 18) 2,251,728 2,545,183
Cash and bank balances (Note 15) (519,259) (666,901)
Net debt 1,732,469 1,878,282
Total equity 3,763,743 3,652,048
Debt-to-equity ratio 0.46 0.51
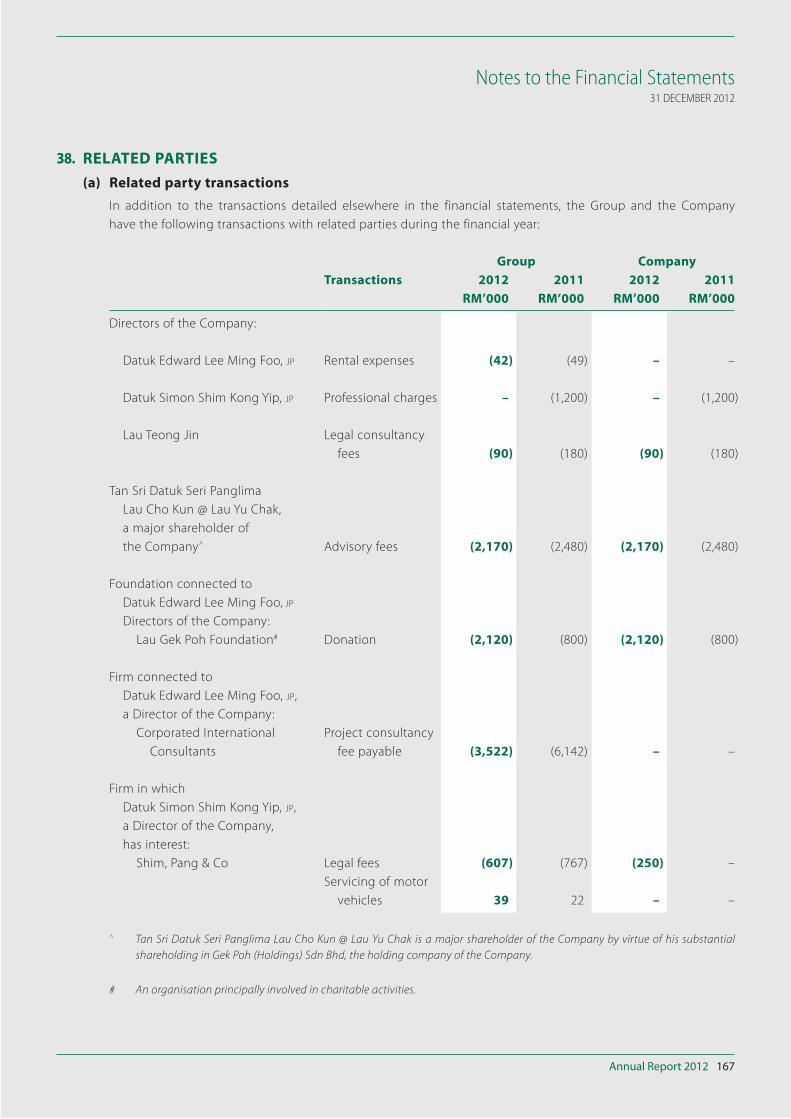
Annual Report 2012 167
Notes to the Financial Statements31 DECEMBER 2012
38. RELATED PARTIES
(a) Related party transactions
In addition to the transactions detailed elsewhere in the financial statements, the Group and the Company
have the following transactions with related parties during the financial year:
Group Company
Transactions 2012 2011 2012 2011
RM’000 RM’000 RM’000 RM’000
Directors of the Company:
Datuk Edward Lee Ming Foo, JP Rental expenses (42) (49) – –
Datuk Simon Shim Kong Yip, JP Professional charges – (1,200) – (1,200)
Lau Teong Jin Legal consultancy
fees (90) (180) (90) (180)
Tan Sri Datuk Seri Panglima
Lau Cho Kun @ Lau Yu Chak,
a major shareholder of
the Company^ Advisory fees (2,170) (2,480) (2,170) (2,480)
Foundation connected to
Datuk Edward Lee Ming Foo, JP
Directors of the Company:
Lau Gek Poh Foundation# Donation (2,120) (800) (2,120) (800)
Firm connected to
Datuk Edward Lee Ming Foo, JP,
a Director of the Company:
Corporated International
Consultants
Project consultancy
fee payable (3,522) (6,142) – –
Firm in which
Datuk Simon Shim Kong Yip, JP,
a Director of the Company,
has interest:
Shim, Pang & Co Legal fees (607) (767) (250) –
Servicing of motor
vehicles 39 22 – –
^ Tan Sri Datuk Seri Panglima Lau Cho Kun @ Lau Yu Chak is a major shareholder of the Company by virtue of his substantial
shareholding in Gek Poh (Holdings) Sdn Bhd, the holding company of the Company.
# An organisation principally involved in charitable activities.
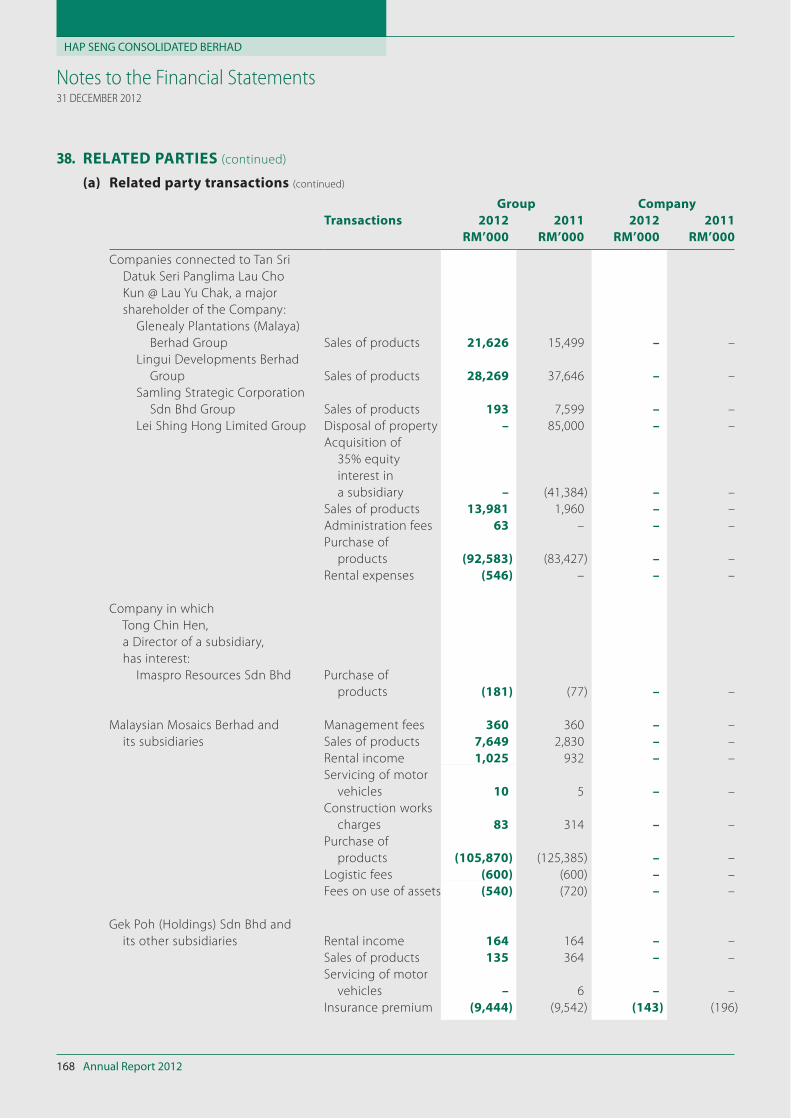
HAP SENG CONSOLIDATED BERHAD
Annual Report 2012168
Notes to the Financial Statements31 DECEMBER 2012
38. RELATED PARTIES (continued)
(a) Related party transactions (continued)
Group Company
Transactions 2012 2011 2012 2011
RM’000 RM’000 RM’000 RM’000
Companies connected to Tan Sri
Datuk Seri Panglima Lau Cho
Kun @ Lau Yu Chak, a major
shareholder of the Company:
Glenealy Plantations (Malaya)
Berhad Group Sales of products 21,626 15,499 – –
Lingui Developments Berhad
Group Sales of products 28,269 37,646 – –
Samling Strategic Corporation
Sdn Bhd Group Sales of products 193 7,599 – –
Lei Shing Hong Limited Group Disposal of property – 85,000 – –
Acquisition of
35% equity
interest in
a subsidiary – (41,384) – –
Sales of products 13,981 1,960 – –
Administration fees 63 – – –
Purchase of
products (92,583) (83,427) – –
Rental expenses (546) – – –
Company in which
Tong Chin Hen,
a Director of a subsidiary,
has interest:
Imaspro Resources Sdn Bhd Purchase of
products (181) (77) – –
Malaysian Mosaics Berhad and
its subsidiaries
Management fees 360 360 – –
Sales of products 7,649 2,830 – –
Rental income 1,025 932 – –
Servicing of motor
vehicles 10 5 – –
Construction works
charges 83 314 – –
Purchase of
products (105,870) (125,385) – –
Logistic fees (600) (600) – –
Fees on use of assets (540) (720) – –
Gek Poh (Holdings) Sdn Bhd and
its other subsidiaries Rental income 164 164 – –
Sales of products 135 364 – –
Servicing of motor
vehicles – 6 – –
Insurance premium (9,444) (9,542) (143) (196)
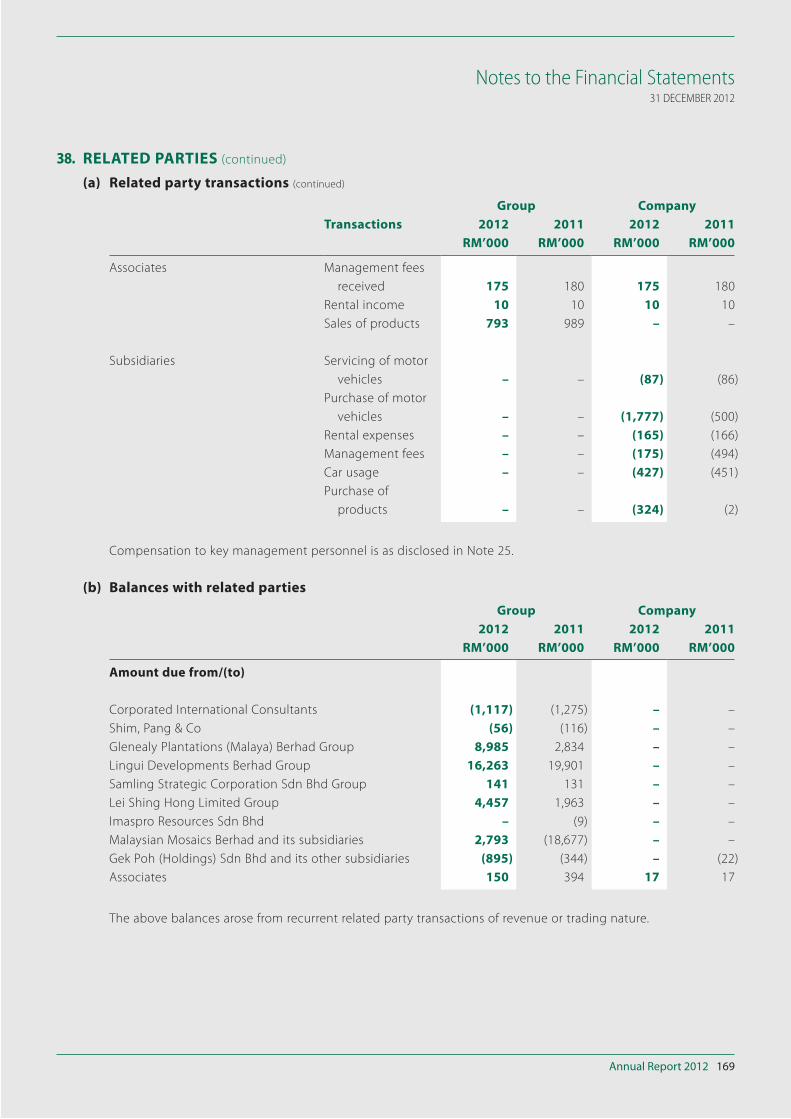
Annual Report 2012 169
Notes to the Financial Statements31 DECEMBER 2012
38. RELATED PARTIES (continued)
(a) Related party transactions (continued)
Group Company
Transactions 2012 2011 2012 2011
RM’000 RM’000 RM’000 RM’000
Associates Management fees
received 175 180 175 180
Rental income 10 10 10 10
Sales of products 793 989 – –
Subsidiaries Servicing of motor
vehicles – – (87) (86)
Purchase of motor
vehicles – – (1,777) (500)
Rental expenses – – (165) (166)
Management fees – – (175) (494)
Car usage – – (427) (451)
Purchase of
products – – (324) (2)
Compensation to key management personnel is as disclosed in Note 25.
(b) Balances with related parties
Group Company
2012 2011 2012 2011
RM’000 RM’000 RM’000 RM’000
Amount due from/(to)
Corporated International Consultants (1,117) (1,275) – –
Shim, Pang & Co (56) (116) – –
Glenealy Plantations (Malaya) Berhad Group 8,985 2,834 – –
Lingui Developments Berhad Group 16,263 19,901 – –
Samling Strategic Corporation Sdn Bhd Group 141 131 – –
Lei Shing Hong Limited Group 4,457 1,963 – –
Imaspro Resources Sdn Bhd – (9) – –
Malaysian Mosaics Berhad and its subsidiaries 2,793 (18,677) – –
Gek Poh (Holdings) Sdn Bhd and its other subsidiaries (895) (344) – (22)
Associates 150 394 17 17
The above balances arose from recurrent related party transactions of revenue or trading nature.
HAP SENG CONSOLIDATED BERHAD
Annual Report 2012170
Notes to the Financial Statements31 DECEMBER 2012
39. SEGMENT INFORMATION
For management purposes, the Group is organised into business units according to their nature of activities and has
six reportable operating segments as follows:
(i) Plantation – Cultivation of oil palm and processing of fresh fruit bunches
(ii) Property – Property investment and property development
(iii) Credit financing – Provision of financial services
(iv) Fertilizer trading – Trading and distribution of fertilizers and agro-chemicals
(v) Q uarry and building
materials
– Operation of stone quarries and asphalt plants, manufacture of bricks and
trading in building materials
(vi) Automotive – Trading in motor vehicles, spare parts and servicing of motor vehicles
Segment accounting policies are the same as the policies described in Significant Accounting Policies. All inter-
segment transactions have been entered in the normal course of business and have been established on terms and
conditions that are not materially different from those obtainable in transactions with third parties.
Management monitors the operating results of its business units separately for the purpose of making decisions on
resource allocation and performance assessment. Segment performance is evaluated based on operating profit or
loss. Group financing are not allocated to operating segments.
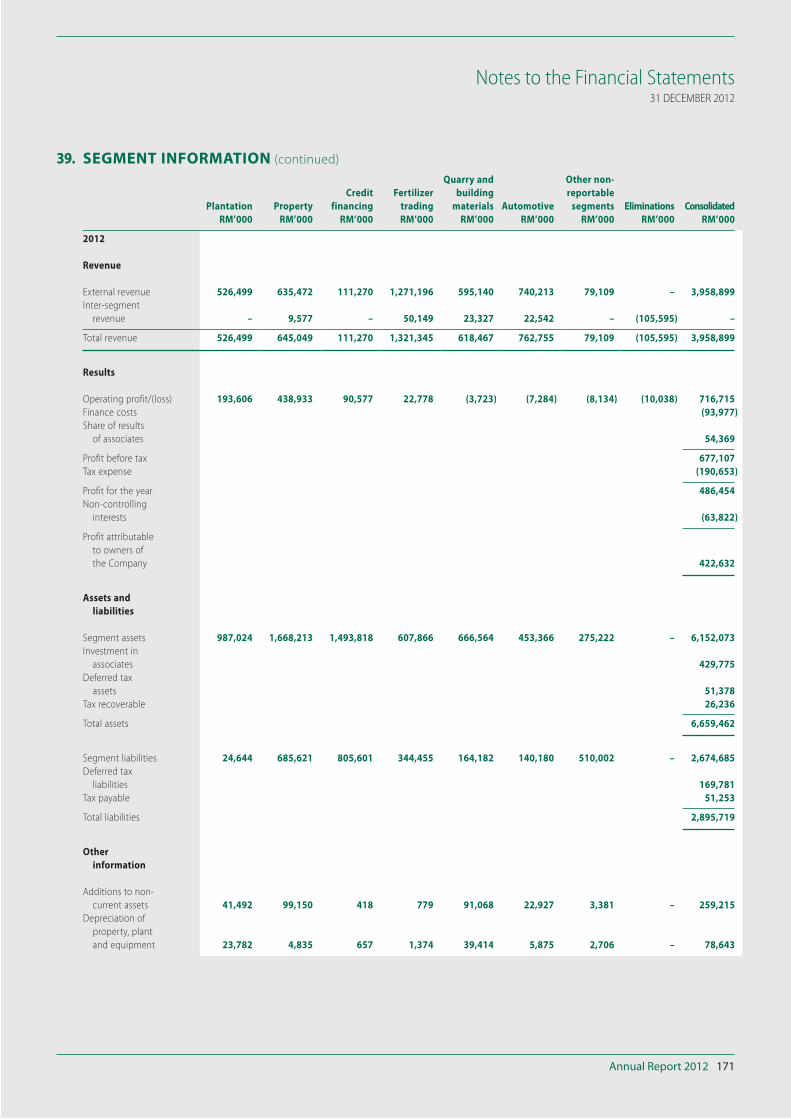
Annual Report 2012 171
Notes to the Financial Statements31 DECEMBER 2012
39. SEGMENT INFORMATION (continued)
Plantation Property
Credit
financing
Fertilizer
trading
Quarry and
building
materials Automotive
Other non-
reportable
segments Eliminations Consolidated
RM’000 RM’000 RM’000 RM’000 RM’000 RM’000 RM’000 RM’000 RM’000
2012
Revenue
External revenue 526,499 635,472 111,270 1,271,196 595,140 740,213 79,109 – 3,958,899
Inter-segment
revenue – 9,577 – 50,149 23,327 22,542 – (105,595) –
Total revenue 526,499 645,049 111,270 1,321,345 618,467 762,755 79,109 (105,595) 3,958,899
Results
Operating profit/(loss) 193,606 438,933 90,577 22,778 (3,723) (7,284) (8,134) (10,038) 716,715
Finance costs (93,977)
Share of results
of associates 54,369
Profit before tax 677,107
Tax expense (190,653)
Profit for the year 486,454
Non-controlling
interests (63,822)
Profit attributable
to owners of
the Company 422,632
Assets and
liabilities
Segment assets 987,024 1,668,213 1,493,818 607,866 666,564 453,366 275,222 – 6,152,073
Investment in
associates 429,775
Deferred tax
assets 51,378
Tax recoverable 26,236
Total assets 6,659,462
Segment liabilities 24,644 685,621 805,601 344,455 164,182 140,180 510,002 – 2,674,685
Deferred tax
liabilities 169,781
Tax payable 51,253
Total liabilities 2,895,719
Other
information
Additions to non-
current assets 41,492 99,150 418 779 91,068 22,927 3,381 – 259,215
Depreciation of
property, plant
and equipment 23,782 4,835 657 1,374 39,414 5,875 2,706 – 78,643
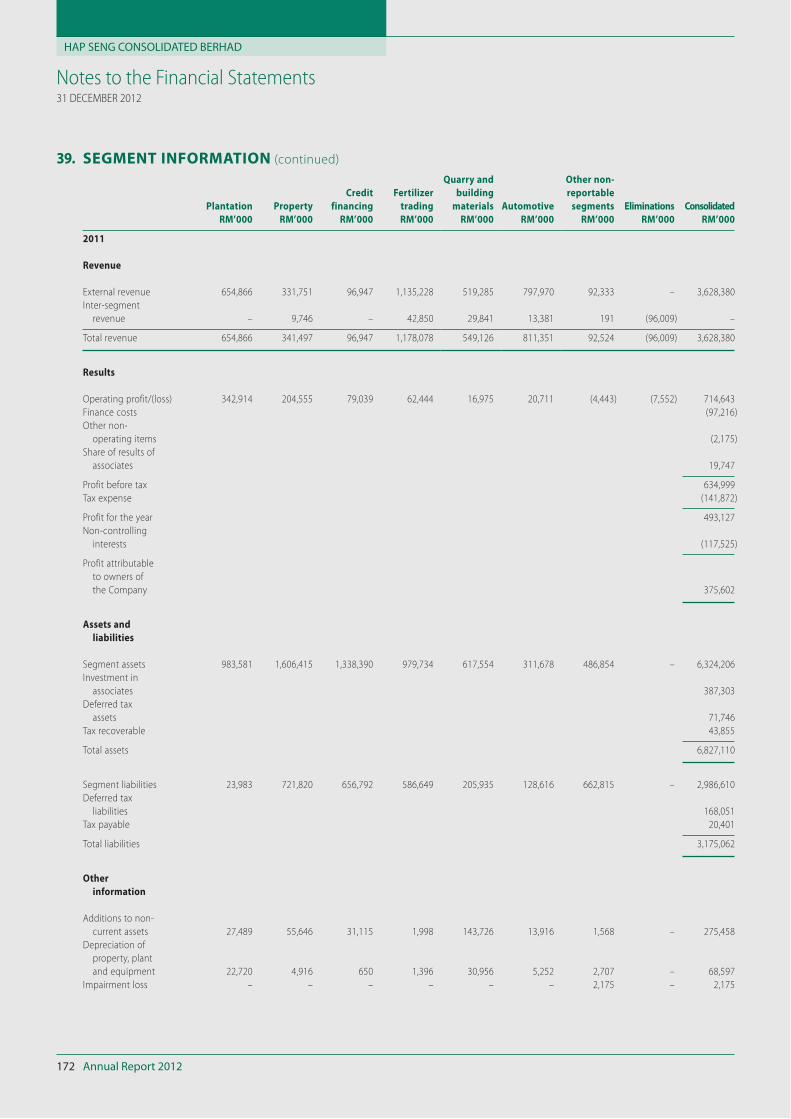
HAP SENG CONSOLIDATED BERHAD
Annual Report 2012172
Notes to the Financial Statements31 DECEMBER 2012
39. SEGMENT INFORMATION (continued)
Plantation Property
Credit
financing
Fertilizer
trading
Quarry and
building
materials Automotive
Other non-
reportable
segments Eliminations Consolidated
RM’000 RM’000 RM’000 RM’000 RM’000 RM’000 RM’000 RM’000 RM’000
2011
Revenue
External revenue 654,866 331,751 96,947 1,135,228 519,285 797,970 92,333 – 3,628,380
Inter-segment
revenue – 9,746 – 42,850 29,841 13,381 191 (96,009) –
Total revenue 654,866 341,497 96,947 1,178,078 549,126 811,351 92,524 (96,009) 3,628,380
Results
Operating profit/(loss) 342,914 204,555 79,039 62,444 16,975 20,711 (4,443) (7,552) 714,643
Finance costs (97,216)
Other non-
operating items (2,175)
Share of results of
associates 19,747
Profit before tax 634,999
Tax expense (141,872)
Profit for the year 493,127
Non-controlling
interests (117,525)
Profit attributable
to owners of
the Company 375,602
Assets and
liabilities
Segment assets 983,581 1,606,415 1,338,390 979,734 617,554 311,678 486,854 – 6,324,206
Investment in
associates 387,303
Deferred tax
assets 71,746
Tax recoverable 43,855
Total assets 6,827,110
Segment liabilities 23,983 721,820 656,792 586,649 205,935 128,616 662,815 – 2,986,610
Deferred tax
liabilities 168,051
Tax payable 20,401
Total liabilities 3,175,062
Other
information
Additions to non-
current assets 27,489 55,646 31,115 1,998 143,726 13,916 1,568 – 275,458
Depreciation of
property, plant
and equipment 22,720 4,916 650 1,396 30,956 5,252 2,707 – 68,597
Impairment loss – – – – – – 2,175 – 2,175
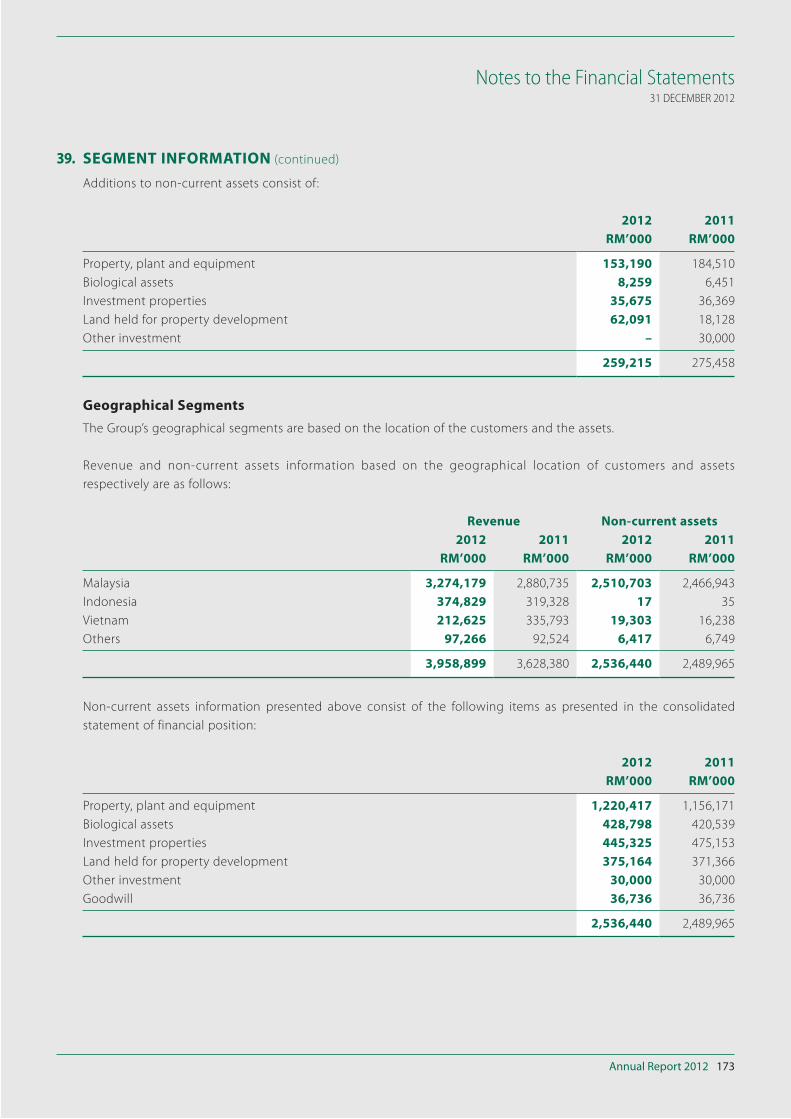
Annual Report 2012 173
Notes to the Financial Statements31 DECEMBER 2012
39. SEGMENT INFORMATION (continued)
Additions to non-current assets consist of:
2012 2011
RM’000 RM’000
Property, plant and equipment 153,190 184,510
Biological assets 8,259 6,451
Investment properties 35,675 36,369
Land held for property development 62,091 18,128
Other investment – 30,000
259,215 275,458
Geographical Segments
The Group’s geographical segments are based on the location of the customers and the assets.
Revenue and non-current assets information based on the geographical location of customers and assets
respectively are as follows:
Revenue Non-current assets
2012 2011 2012 2011
RM’000 RM’000 RM’000 RM’000
Malaysia 3,274,179 2,880,735 2,510,703 2,466,943
Indonesia 374,829 319,328 17 35
Vietnam 212,625 335,793 19,303 16,238
Others 97,266 92,524 6,417 6,749
3,958,899 3,628,380 2,536,440 2,489,965
Non-current assets information presented above consist of the following items as presented in the consolidated
statement of financial position:
2012 2011
RM’000 RM’000
Property, plant and equipment 1,220,417 1,156,171
Biological assets 428,798 420,539
Investment properties 445,325 475,153
Land held for property development 375,164 371,366
Other investment 30,000 30,000
Goodwill 36,736 36,736
2,536,440 2,489,965
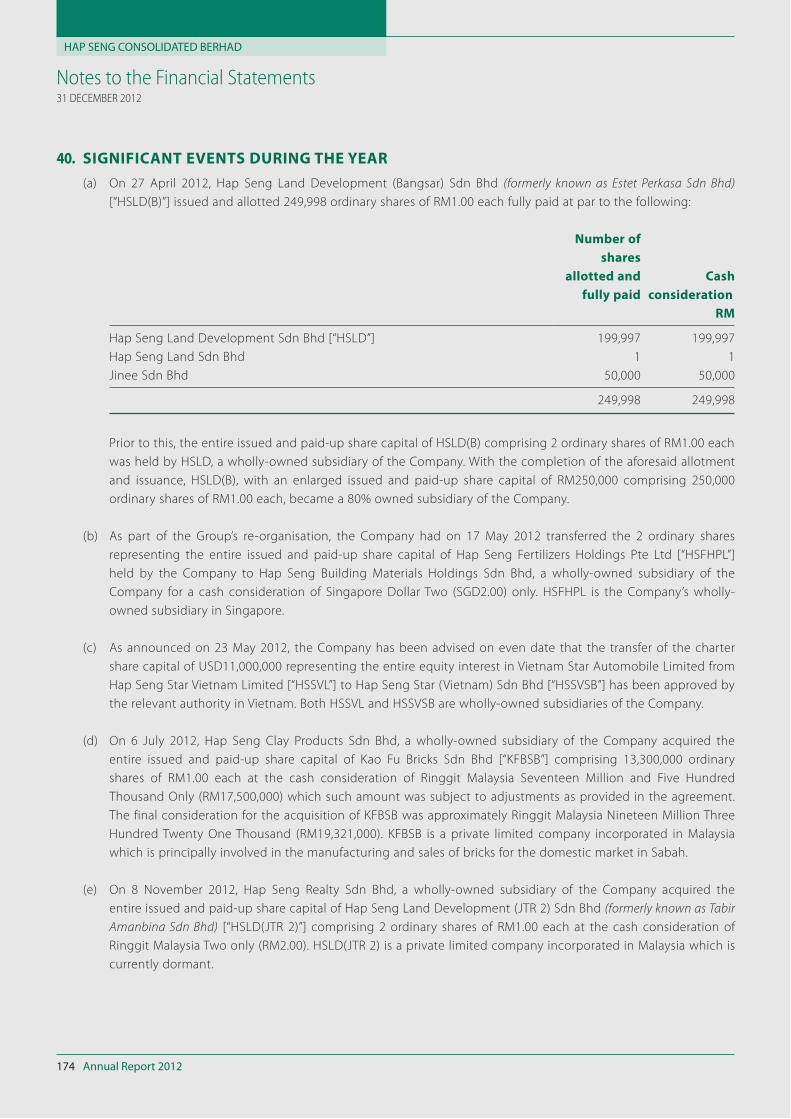
HAP SENG CONSOLIDATED BERHAD
Annual Report 2012174
Notes to the Financial Statements31 DECEMBER 2012
40. SIGNIFICANT EVENTS DURING THE YEAR
(a) On 27 April 2012, Hap Seng Land Development (Bangsar) Sdn Bhd (formerly known as Estet Perkasa Sdn Bhd)
[“HSLD(B)”] issued and allotted 249,998 ordinary shares of RM1.00 each fully paid at par to the following:
Number of
shares
allotted and
fully paid
Cash
consideration
RM
Hap Seng Land Development Sdn Bhd [“HSLD”] 199,997 199,997
Hap Seng Land Sdn Bhd 1 1
Jinee Sdn Bhd 50,000 50,000
249,998 249,998
Prior to this, the entire issued and paid-up share capital of HSLD(B) comprising 2 ordinary shares of RM1.00 each
was held by HSLD, a wholly-owned subsidiary of the Company. With the completion of the aforesaid allotment
and issuance, HSLD(B), with an enlarged issued and paid-up share capital of RM250,000 comprising 250,000
ordinary shares of RM1.00 each, became a 80% owned subsidiary of the Company.
(b) As part of the Group’s re-organisation, the Company had on 17 May 2012 transferred the 2 ordinary shares
representing the entire issued and paid-up share capital of Hap Seng Fertilizers Holdings Pte Ltd [“HSFHPL”]
held by the Company to Hap Seng Building Materials Holdings Sdn Bhd, a wholly-owned subsidiary of the
Company for a cash consideration of Singapore Dollar Two (SGD2.00) only. HSFHPL is the Company’s wholly-
owned subsidiary in Singapore.
(c) As announced on 23 May 2012, the Company has been advised on even date that the transfer of the charter
share capital of USD11,000,000 representing the entire equity interest in Vietnam Star Automobile Limited from
Hap Seng Star Vietnam Limited [“HSSVL”] to Hap Seng Star (Vietnam) Sdn Bhd [“HSSVSB”] has been approved by
the relevant authority in Vietnam. Both HSSVL and HSSVSB are wholly-owned subsidiaries of the Company.
(d) On 6 July 2012, Hap Seng Clay Products Sdn Bhd, a wholly-owned subsidiary of the Company acquired the
entire issued and paid-up share capital of Kao Fu Bricks Sdn Bhd [“KFBSB”] comprising 13,300,000 ordinary
shares of RM1.00 each at the cash consideration of Ringgit Malaysia Seventeen Million and Five Hundred
Thousand Only (RM17,500,000) which such amount was subject to adjustments as provided in the agreement.
The final consideration for the acquisition of KFBSB was approximately Ringgit Malaysia Nineteen Million Three
Hundred Twenty One Thousand (RM19,321,000). KFBSB is a private limited company incorporated in Malaysia
which is principally involved in the manufacturing and sales of bricks for the domestic market in Sabah.
(e) On 8 November 2012, Hap Seng Realty Sdn Bhd, a wholly-owned subsidiary of the Company acquired the
entire issued and paid-up share capital of Hap Seng Land Development (JTR 2) Sdn Bhd (formerly known as Tabir
Amanbina Sdn Bhd) [“HSLD(JTR 2)”] comprising 2 ordinary shares of RM1.00 each at the cash consideration of
Ringgit Malaysia Two only (RM2.00). HSLD(JTR 2) is a private limited company incorporated in Malaysia which is
currently dormant.
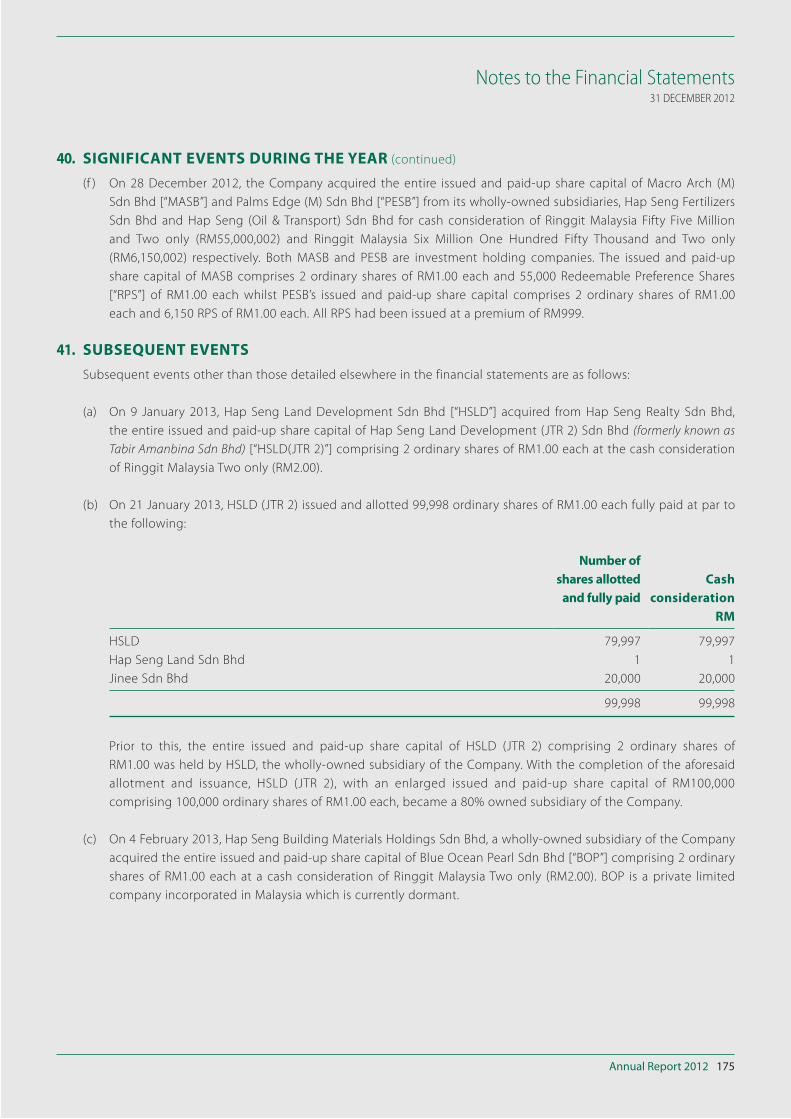
Annual Report 2012 175
Notes to the Financial Statements31 DECEMBER 2012
40. SIGNIFICANT EVENTS DURING THE YEAR (continued)
(f ) On 28 December 2012, the Company acquired the entire issued and paid-up share capital of Macro Arch (M)
Sdn Bhd [“MASB”] and Palms Edge (M) Sdn Bhd [“PESB”] from its wholly-owned subsidiaries, Hap Seng Fertilizers
Sdn Bhd and Hap Seng (Oil & Transport) Sdn Bhd for cash consideration of Ringgit Malaysia Fifty Five Million
and Two only (RM55,000,002) and Ringgit Malaysia Six Million One Hundred Fifty Thousand and Two only
(RM6,150,002) respectively. Both MASB and PESB are investment holding companies. The issued and paid-up
share capital of MASB comprises 2 ordinary shares of RM1.00 each and 55,000 Redeemable Preference Shares
[“RPS”] of RM1.00 each whilst PESB’s issued and paid-up share capital comprises 2 ordinary shares of RM1.00
each and 6,150 RPS of RM1.00 each. All RPS had been issued at a premium of RM999.
41. SUBSEQUENT EVENTS
Subsequent events other than those detailed elsewhere in the financial statements are as follows:
(a) On 9 January 2013, Hap Seng Land Development Sdn Bhd [“HSLD”] acquired from Hap Seng Realty Sdn Bhd,
the entire issued and paid-up share capital of Hap Seng Land Development (JTR 2) Sdn Bhd (formerly known as
Tabir Amanbina Sdn Bhd) [“HSLD(JTR 2)”] comprising 2 ordinary shares of RM1.00 each at the cash consideration
of Ringgit Malaysia Two only (RM2.00).
(b) On 21 January 2013, HSLD (JTR 2) issued and allotted 99,998 ordinary shares of RM1.00 each fully paid at par to
the following:
Number of
shares allotted
and fully paid
Cash
consideration
RM
HSLD 79,997 79,997
Hap Seng Land Sdn Bhd 1 1
Jinee Sdn Bhd 20,000 20,000
99,998 99,998
Prior to this, the entire issued and paid-up share capital of HSLD (JTR 2) comprising 2 ordinary shares of
RM1.00 was held by HSLD, the wholly-owned subsidiary of the Company. With the completion of the aforesaid
allotment and issuance, HSLD (JTR 2), with an enlarged issued and paid-up share capital of RM100,000
comprising 100,000 ordinary shares of RM1.00 each, became a 80% owned subsidiary of the Company.
(c) On 4 February 2013, Hap Seng Building Materials Holdings Sdn Bhd, a wholly-owned subsidiary of the Company
acquired the entire issued and paid-up share capital of Blue Ocean Pearl Sdn Bhd [“BOP”] comprising 2 ordinary
shares of RM1.00 each at a cash consideration of Ringgit Malaysia Two only (RM2.00). BOP is a private limited
company incorporated in Malaysia which is currently dormant.
HAP SENG CONSOLIDATED BERHAD
Annual Report 2012176
Notes to the Financial Statements31 DECEMBER 2012
41. SUBSEQUENT EVENTS (continued)
(d) On 19 February 2013, the Company acquired the entire issued and paid-up share capital of Hap Seng Trading
Holdings Sdn Bhd (formerly known as Konsep Sistematik (M) Sdn Bhd) [“HSTH”] from its wholly-owned subsidiary,
Hap Seng Building Materials Holdings Sdn Bhd [“HSBMH”] at the cash consideration of Ringgit Malaysia
Sixty Thousand Three Hundred and Forty Six only (RM60,346). The issued and paid-up share capital of HSTH
comprises 100,000 ordinary shares of RM1.00 each. HSTH is a private limited company incorporated in Malaysia
which is principally involved in investment holding.
(e) On 19 February 2013, HSTH, the wholly-owned subsidiary of the Company acquired the entire issued and paid-
up share capital of Hap Seng (Oil & Transport) Sdn Bhd [“HSOT”] and Hap Seng Trading (BM) Sdn Bhd [“HSTBM”]
from HSBMH for cash consideration of Ringgit Malaysia Twenty One Million Six Hundred Forty Nine Thousand
Seven Hundred and Seventy Four only (RM21,649,774) and Ringgit Malaysia Two only (RM2) respectively.
The issued and paid-up share capital of HSOT comprises 2,000,000 ordinary shares of RM1.00 each whilst the
issued and paid-up share capital of HSTBM comprises 9,000,000 ordinary shares of RM1.00 each and 21,000
RPS of RM1.00 each (issued at a premium of RM999). The principal activities of HSOT and HSTBM are trading of
petroleum products and trading of building materials respectively.
(f ) On 26 February 2013, HSBMH entered into a shares sale agreement with Lei Shing Hong Limited [“LSH”], to
dispose its 1,750,000 ordinary shares representing 25% of the issued and paid-up share capital in Lei Shing
Hong (Singapore) Pte Ltd to LSH for a cash consideration of Singapore Dollars Forty Seven Million Three
Hundred and Thirteen Thousand Five Hundred and Fifty Three only (SGD47,313,553), approximately Ringgit
Malaysia One Hundred Eighteen Million only (RM118,000,000) [“Shares Sale Agreement”].
The Share Sale Agreement was deemed a related party transaction as it involved the interests of Tan Sri Datuk
Seri Panglima Lau Cho Kun @ Lau Yu Chak, the 37.68% major shareholder of LSH, who is a director and major
shareholder of Gek Poh (Holdings) Sdn Bhd, the holding company of the Company. The Shares Sale Agreement
was completed on 8 March 2013, resulted in a gain of approximately RM78.9 million to the Group.
(g) As part of the Group’s re-organisation, the Company had on 13 March 2013 acquired from HSBMH, the entire
issued and paid-up share capital of Hap Seng Equity Sdn Bhd (formerly known as Western Works Industries Sdn
Bhd) [“HSE”] comprising 2 ordinary shares of RM1.00 each at the cash consideration of Ringgit Malaysia Two only
(RM2). HSE which was previously dormant has commenced operations in the trading of marketable securities
subsequent to the re-organisation.
Annual Report 2012 177
Notes to the Financial Statements31 DECEMBER 2012
41. SUBSEQUENT EVENTS (continued)
(h) On 18 March 2013, Hap Seng Star Sdn Bhd [“HSS”], a wholly-owned subsidiary of the Company entered into
a conditional agreement with Prestige Sports Cars (HK) Limited [“PSC”], a wholly-owned subsidiary Lei Shing
Hong Limited [“LSH”], pursuant to which:
(i) HSS has agreed to dispose of its 51% equity in Hap Seng Star (Vietnam) Sdn Bhd [“HSSV”] comprising
510,000 ordinary shares of RM1.00 each [“HSSV Ordinary Shares”] and 51,102 redeemable preference
shares of RM 1.00 each [“HSSV RPS”] [collectively the “Sale Shares”] to PSC and PSC has agreed to acquire
from HSS the Sale Shares at a cash consideration of Ringgit Malaysia One Hundred and Fifty Three Million
(RM153,000,000) [“Proposed Disposal”]; and
(ii) PSC has granted to HSS a put option to sell up to 49% of the equity in HSSV comprising 490,000 HSSV
Ordinary Shares and 49,098 HSSV RPS [collectively the “Option Shares”] to PSC [the “said Option”] at a total
option price of Ringgit Malaysia One Hundred and Forty Seven Million (RM147,000,000) [the “Exercise
Price”]. The Exercise Price is to be pro-rated accordingly based on the actual number of Option Shares put
to PSC. HSS has accepted the said Option, which is only exercisable after the completion of the Proposed
Disposal. The said Option can be exercised progressively over the period of twelve (12) months from the
date of completion of the Proposed Disposal.
The Proposed Disposal and the said Option are collectively referred to as the “Proposals”.
The Proposals are deemed a related party transaction as it involved the interests of Tan Sri Datuk Seri Panglima Lau
Cho Kun @ Lau Yu Chak, the 37.68% major shareholder of LSH and a 56.00% major shareholder and director of Gek
Poh (Holdings) Sdn Bhd which is the holding company of the Company.
The Proposals are subject to the approvals being obtained from the directors and shareholders of HSS, the Company
and PSC at an extraordinary general meeting to be convened.
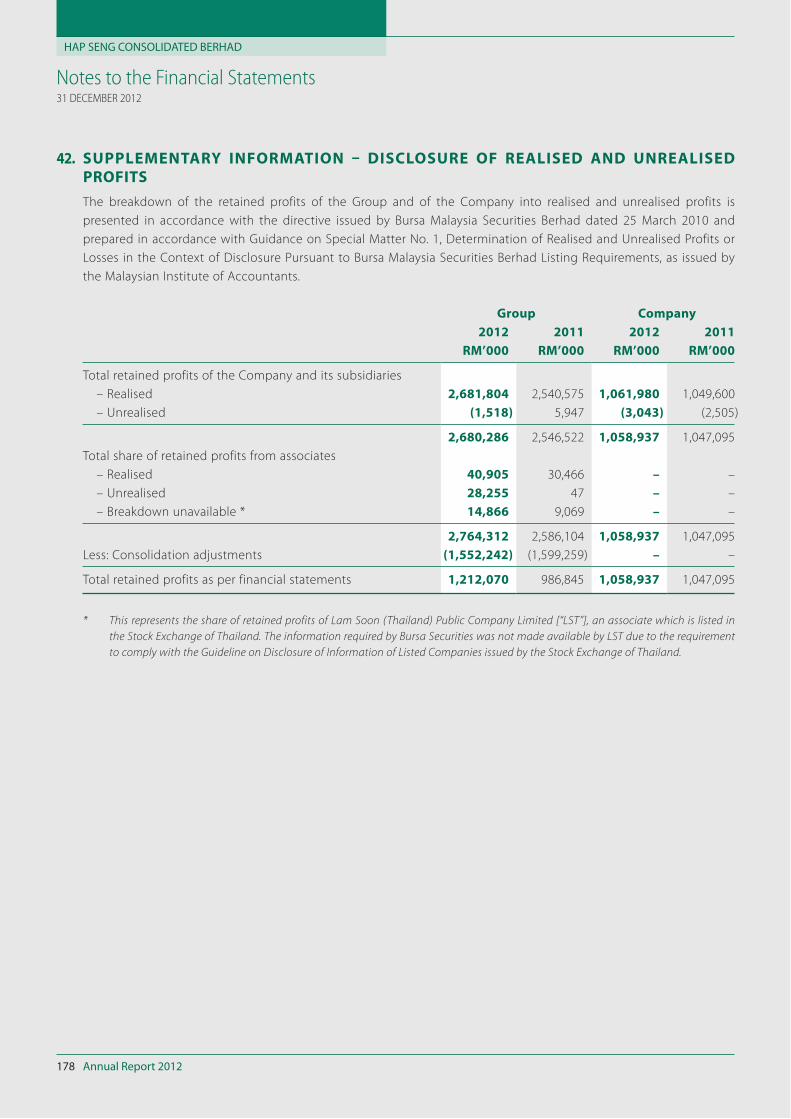
HAP SENG CONSOLIDATED BERHAD
Annual Report 2012178
Notes to the Financial Statements31 DECEMBER 2012
42. SUPPLEMENTARY INFORMATION – DISCLOSURE OF REALISED AND UNREALISED
PROFITS
The breakdown of the retained profits of the Group and of the Company into realised and unrealised profits is
presented in accordance with the directive issued by Bursa Malaysia Securities Berhad dated 25 March 2010 and
prepared in accordance with Guidance on Special Matter No. 1, Determination of Realised and Unrealised Profits or
Losses in the Context of Disclosure Pursuant to Bursa Malaysia Securities Berhad Listing Requirements, as issued by
the Malaysian Institute of Accountants.
Group Company
2012 2011 2012 2011
RM’000 RM’000 RM’000 RM’000
Total retained profits of the Company and its subsidiaries
– Realised 2,681,804 2,540,575 1,061,980 1,049,600
– Unrealised (1,518) 5,947 (3,043) (2,505)
2,680,286 2,546,522 1,058,937 1,047,095
Total share of retained profits from associates
– Realised 40,905 30,466 – –
– Unrealised 28,255 47 – –
– Breakdown unavailable * 14,866 9,069 – –
2,764,312 2,586,104 1,058,937 1,047,095
Less: Consolidation adjustments (1,552,242) (1,599,259) – –
Total retained profits as per financial statements 1,212,070 986,845 1,058,937 1,047,095
* This represents the share of retained profits of Lam Soon (Thailand) Public Company Limited [“LST”], an associate which is listed in
the Stock Exchange of Thailand. The information required by Bursa Securities was not made available by LST due to the requirement
to comply with the Guideline on Disclosure of Information of Listed Companies issued by the Stock Exchange of Thailand.
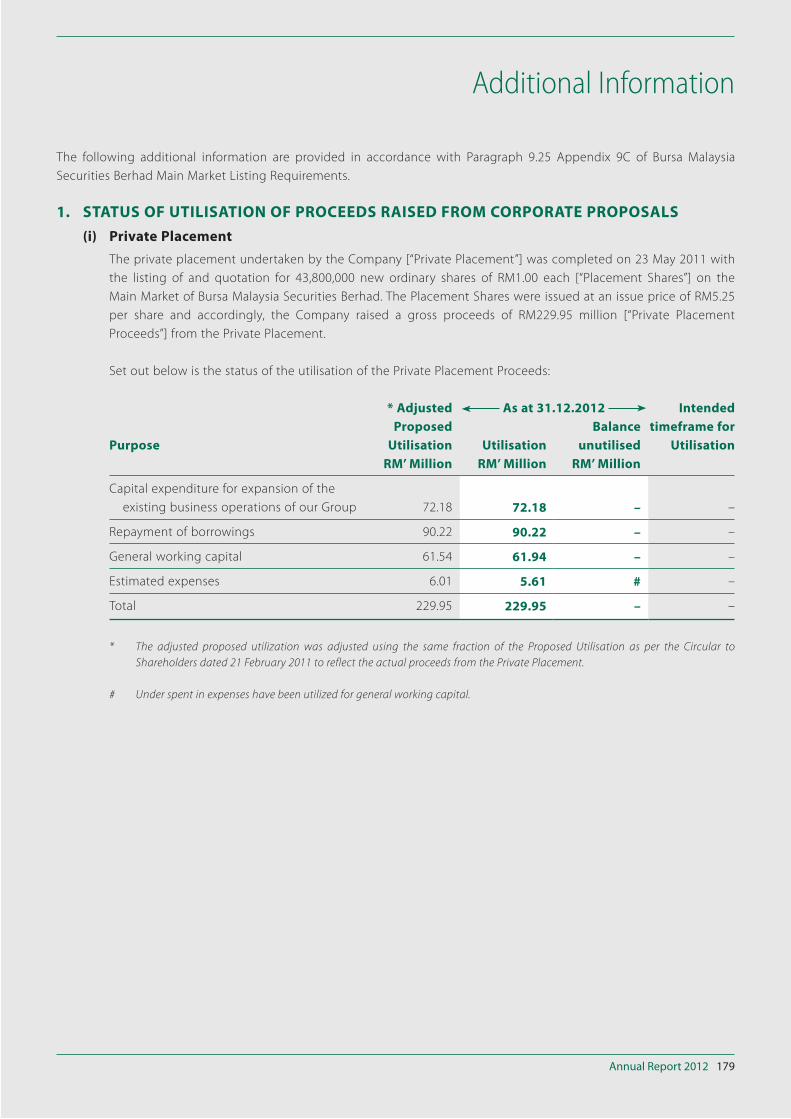
Annual Report 2012 179
Additional Information
The following additional information are provided in accordance with Paragraph 9.25 Appendix 9C of Bursa Malaysia
Securities Berhad Main Market Listing Requirements.
1. STATUS OF UTILISATION OF PROCEEDS RAISED FROM CORPORATE PROPOSALS
(i) Private Placement
The private placement undertaken by the Company [“Private Placement”] was completed on 23 May 2011 with
the listing of and quotation for 43,800,000 new ordinary shares of RM1.00 each [“Placement Shares”] on the
Main Market of Bursa Malaysia Securities Berhad. The Placement Shares were issued at an issue price of RM5.25
per share and accordingly, the Company raised a gross proceeds of RM229.95 million [“Private Placement
Proceeds”] from the Private Placement.
Set out below is the status of the utilisation of the Private Placement Proceeds:
Purpose
* Adjusted
Proposed
Utilisation
As at 31.12.2012 Intended
timeframe for
UtilisationUtilisation
Balance
unutilised
RM’ Million RM’ Million RM’ Million
Capital expenditure for expansion of the
existing business operations of our Group 72.18 72.18 – –
Repayment of borrowings 90.22 90.22 – –
General working capital 61.54 61.94 – –
Estimated expenses 6.01 5.61 # –
Total 229.95 229.95 – –
* The adjusted proposed utilization was adjusted using the same fraction of the Proposed Utilisation as per the Circular to
Shareholders dated 21 February 2011 to reflect the actual proceeds from the Private Placement.
# Under spent in expenses have been utilized for general working capital.
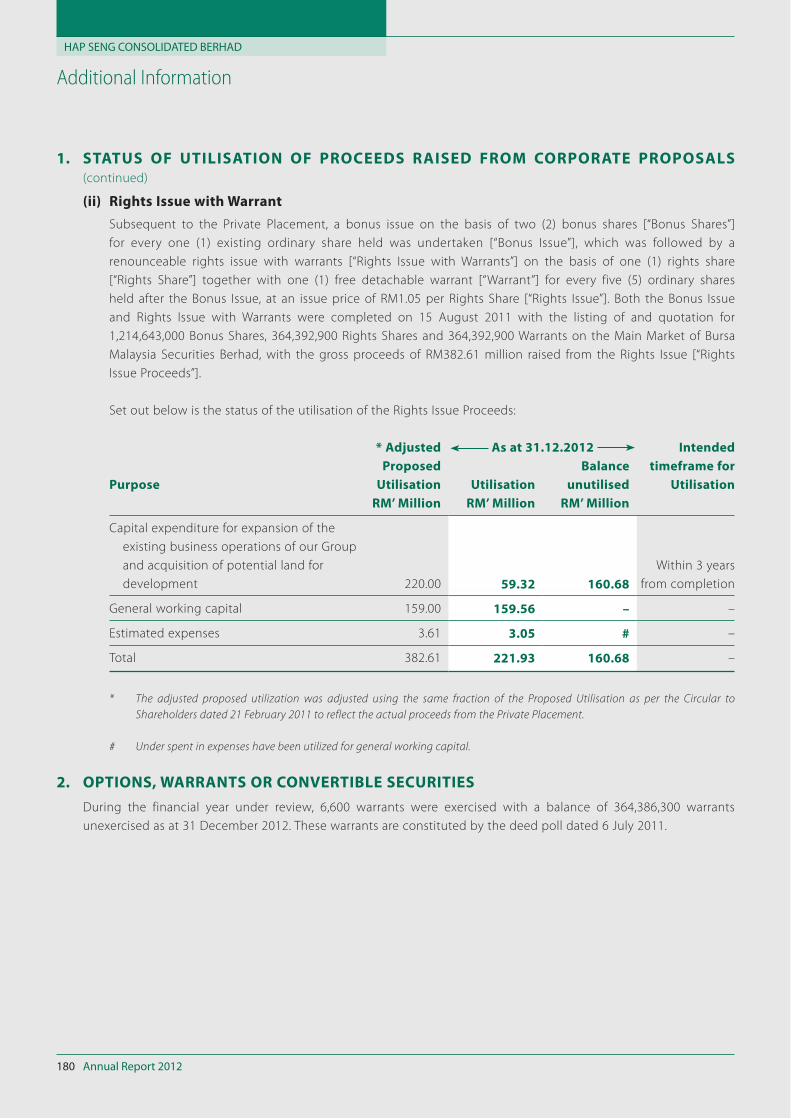
HAP SENG CONSOLIDATED BERHAD
Annual Report 2012180
Additional Information
1. STATUS OF UTILISATION OF PROCEEDS RAISED FROM CORPORATE PROPOSALS
(continued)
(ii) Rights Issue with Warrant
Subsequent to the Private Placement, a bonus issue on the basis of two (2) bonus shares [“Bonus Shares”]
for every one (1) existing ordinary share held was undertaken [“Bonus Issue”], which was followed by a
renounceable rights issue with warrants [“Rights Issue with Warrants”] on the basis of one (1) rights share
[“Rights Share”] together with one (1) free detachable warrant [“Warrant”] for every five (5) ordinary shares
held after the Bonus Issue, at an issue price of RM1.05 per Rights Share [“Rights Issue”]. Both the Bonus Issue
and Rights Issue with Warrants were completed on 15 August 2011 with the listing of and quotation for
1,214,643,000 Bonus Shares, 364,392,900 Rights Shares and 364,392,900 Warrants on the Main Market of Bursa
Malaysia Securities Berhad, with the gross proceeds of RM382.61 million raised from the Rights Issue [“Rights
Issue Proceeds”].
Set out below is the status of the utilisation of the Rights Issue Proceeds:
Purpose
* Adjusted
Proposed
Utilisation
As at 31.12.2012 Intended
timeframe for
UtilisationUtilisation
Balance
unutilised
RM’ Million RM’ Million RM’ Million
Capital expenditure for expansion of the
existing business operations of our Group
and acquisition of potential land for
development 220.00 59.32 160.68
Within 3 years
from completion
General working capital 159.00 159.56 – –
Estimated expenses 3.61 3.05 # –
Total 382.61 221.93 160.68 –
* The adjusted proposed utilization was adjusted using the same fraction of the Proposed Utilisation as per the Circular to
Shareholders dated 21 February 2011 to reflect the actual proceeds from the Private Placement.
# Under spent in expenses have been utilized for general working capital.
2. OPTIONS, WARRANTS OR CONVERTIBLE SECURITIES
During the financial year under review, 6,600 warrants were exercised with a balance of 364,386,300 warrants
unexercised as at 31 December 2012. These warrants are constituted by the deed poll dated 6 July 2011.
Annual Report 2012 181
Additional Information
3. AMERICAN DEPOSITORY RECEIPT (“ADR”) OR GLOBAL DEPOSITORY RECEIPT (“GDR”)
PROGRAMME
The Company did not sponsor any ADR or GDR programme for the year.
4. PARTICULARS OF SANCTIONS AND/OR PENALTIES IMPOSED
There were no sanctions and/or penalties imposed on the Company and its subsidiaries, directors or management
by the relevant regulatory bodies during the financial year ended 31 December 2012.
5. NON-AUDIT FEES
The amount of non-audit fees incurred for services rendered by the external auditors and/or its affiliates to the
Group for the financial year ended 31 December 2012 was RM172,000 as disclosed in Note 23 to the Financial
Statements.
6. VARIATION IN RESULTS
There were no material variances in the Company’s audited consolidated financial results for the financial year
ended 31 December 2012 and the unaudited results for the same period previously released in the quarterly report
to Bursa Malaysia Securities Berhad on 28 February 2013.
7. PROFIT GUARANTEES
There was no profit guarantee given by the Company during the financial year ended 31 December 2012.
8. MATERIAL CONTRACTS
Save for the following, there were no other material contracts of the Company and its subsidiaries involving
directors’ and major shareholders’ interests, which still subsisted as at 31 December 2012, or entered into since 31
December 2011:
parties than those generally available to the public and are not detrimental to the minority interests, which
were entered into during the financial year ended 31 December 2012 as disclosed in Note 38 to the Financial
Statements.
The Company will be seeking new or renewed shareholders’ mandate for recurrent related party transactions at
the extraordinary general meeting to be convened on 29 May 2013 immediately after the conclusion of the annual
general meeting to be held on the same date.
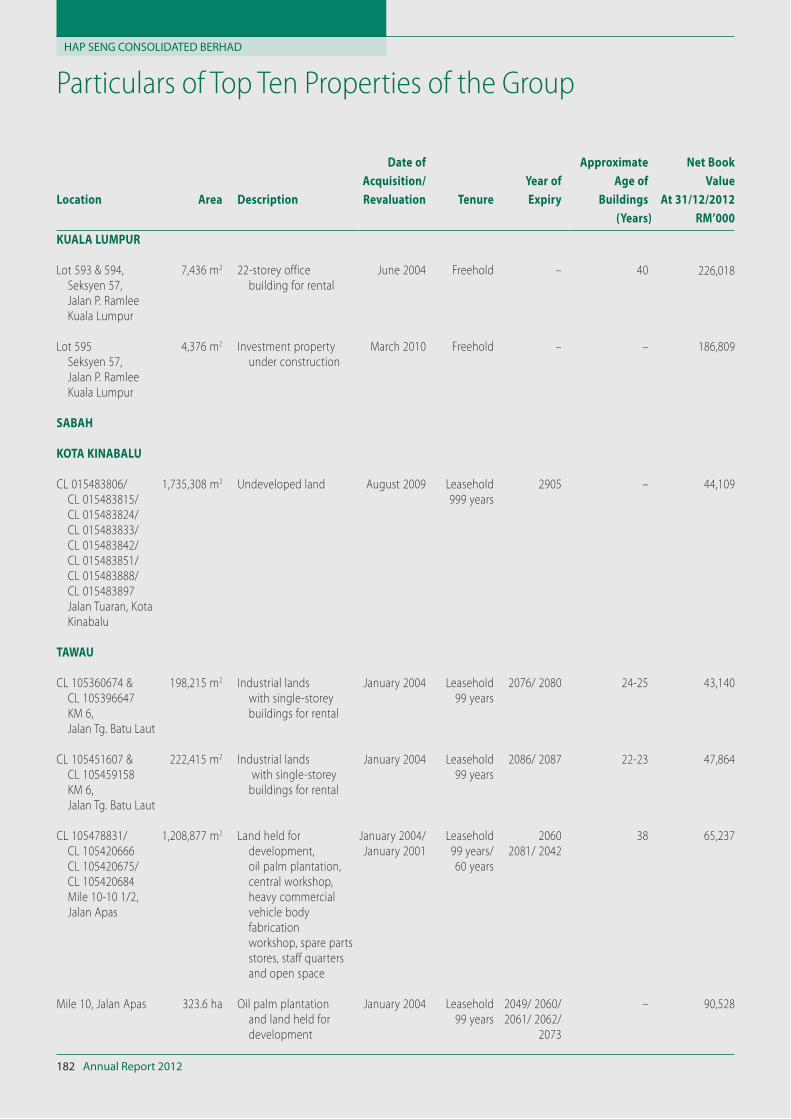
HAP SENG CONSOLIDATED BERHAD
Annual Report 2012182
Particulars of Top Ten Properties of the Group
Location Area Description
Date of
Acquisition/
Revaluation Tenure
Year of
Expiry
Approximate
Age of
Buildings
Net Book
Value
At 31/12/2012
(Years) RM’000
KUALA LUMPUR
Lot 593 & 594,
Seksyen 57,
Jalan P. Ramlee
Kuala Lumpur
7,436 m2 22-storey office
building for rental
June 2004 Freehold – 40 226,018
Lot 595
Seksyen 57,
Jalan P. Ramlee
Kuala Lumpur
4,376 m2 Investment property
under construction
March 2010 Freehold – – 186,809
SABAH
KOTA KINABALU
CL 015483806/
CL 015483815/
CL 015483824/
CL 015483833/
CL 015483842/
CL 015483851/
CL 015483888/
CL 015483897
Jalan Tuaran, Kota
Kinabalu
1,735,308 m2 Undeveloped land August 2009 Leasehold
999 years
2905 – 44,109
TAWAU
CL 105360674 &
CL 105396647
KM 6,
Jalan Tg. Batu Laut
198,215 m2 Industrial lands
with single-storey
buildings for rental
January 2004 Leasehold
99 years
2076/ 2080 24-25 43,140
CL 105451607 &
CL 105459158
KM 6,
Jalan Tg. Batu Laut
222,415 m2 Industrial lands
with single-storey
buildings for rental
January 2004 Leasehold
99 years
2086/ 2087 22-23 47,864
CL 105478831/
CL 105420666
CL 105420675/
CL 105420684
Mile 10-10 1/2,
Jalan Apas
1,208,877 m2 Land held for
development,
oil palm plantation,
central workshop,
heavy commercial
vehicle body
fabrication
workshop, spare parts
stores, staff quarters
and open space
January 2004/
January 2001
Leasehold
99 years/
60 years
2060
2081/ 2042
38 65,237
Mile 10, Jalan Apas 323.6 ha Oil palm plantation
and land held for
development
January 2004 Leasehold
99 years
2049/ 2060/
2061/ 2062/
2073
– 90,528
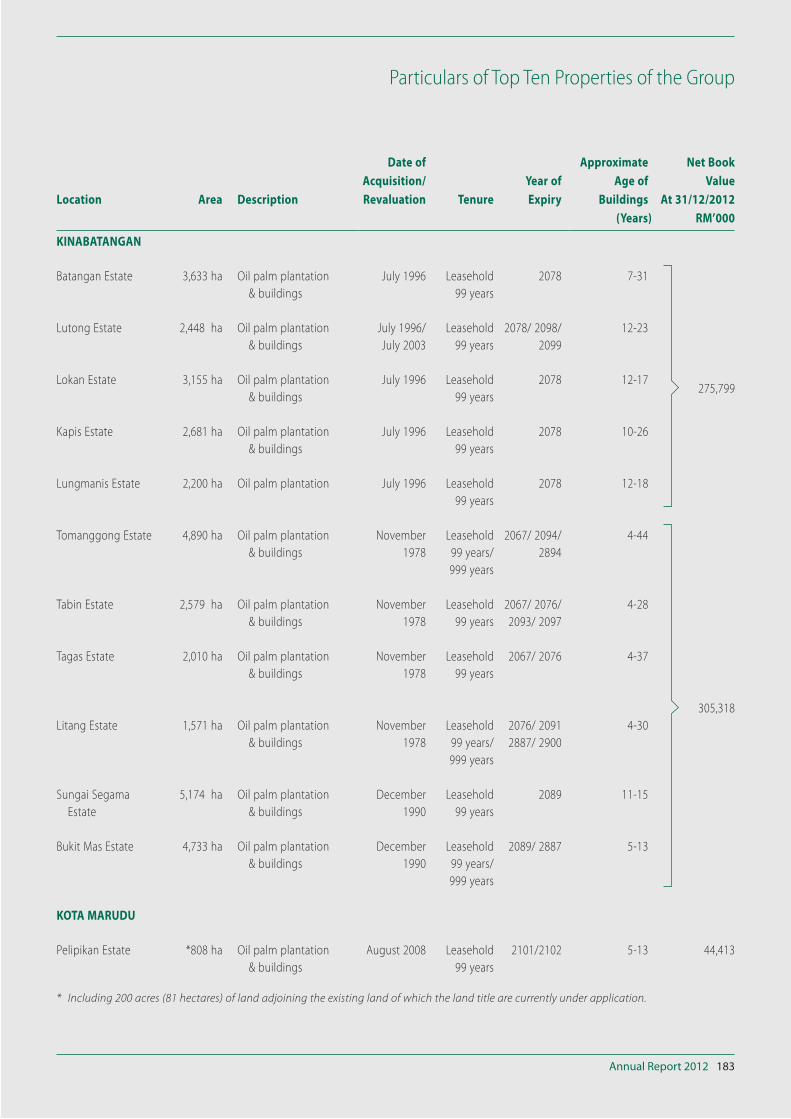
Annual Report 2012 183
Particulars of Top Ten Properties of the Group
Location Area Description
Date of
Acquisition/
Revaluation Tenure
Year of
Expiry
Approximate
Age of
Buildings
Net Book
Value
At 31/12/2012
(Years) RM’000
KINABATANGAN
Batangan Estate 3,633 ha Oil palm plantation
& buildings
July 1996 Leasehold
99 years
2078 7-31
275,799
Lutong Estate 2,448 ha Oil palm plantation
& buildings
July 1996/
July 2003
Leasehold
99 years
2078/ 2098/
2099
12-23
Lokan Estate 3,155 ha Oil palm plantation
& buildings
July 1996 Leasehold
99 years
2078 12-17
Kapis Estate 2,681 ha Oil palm plantation
& buildings
July 1996 Leasehold
99 years
2078 10-26
Lungmanis Estate 2,200 ha Oil palm plantation July 1996 Leasehold
99 years
2078 12-18
Tomanggong Estate 4,890 ha Oil palm plantation
& buildings
November
1978
Leasehold
99 years/
999 years
2067/ 2094/
2894
4-44
305,318
Tabin Estate 2,579 ha Oil palm plantation
& buildings
November
1978
Leasehold
99 years
2067/ 2076/
2093/ 2097
4-28
Tagas Estate 2,010 ha Oil palm plantation
& buildings
November
1978
Leasehold
99 years
2067/ 2076 4-37
Litang Estate 1,571 ha Oil palm plantation
& buildings
November
1978
Leasehold
99 years/
999 years
2076/ 2091
2887/ 2900
4-30
Sungai Segama
Estate
5,174 ha Oil palm plantation
& buildings
December
1990
Leasehold
99 years
2089 11-15
Bukit Mas Estate 4,733 ha Oil palm plantation
& buildings
December
1990
Leasehold
99 years/
999 years
2089/ 2887 5-13
KOTA MARUDU
Pelipikan Estate *808 ha Oil palm plantation
& buildings
August 2008 Leasehold
99 years
2101/2102 5-13 44,413
* Including 200 acres (81 hectares) of land adjoining the existing land of which the land title are currently under application.
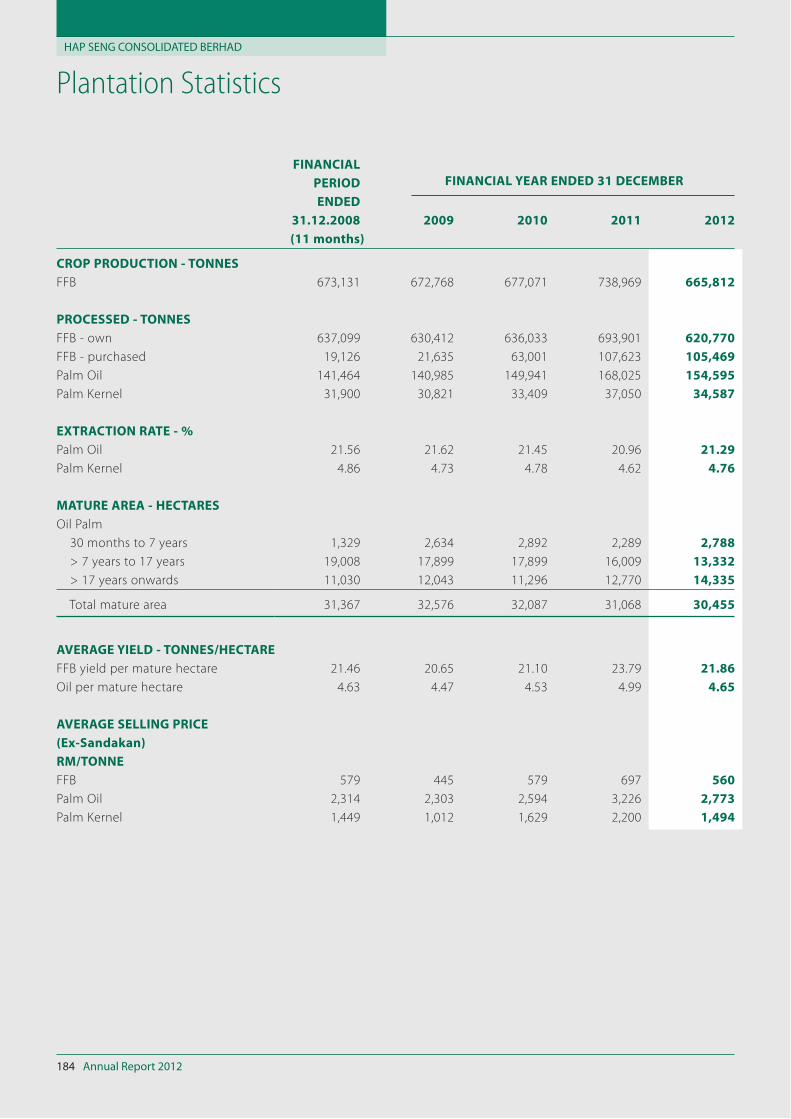
HAP SENG CONSOLIDATED BERHAD
Annual Report 2012184
Plantation Statistics
FINANCIAL
PERIOD
ENDED
FINANCIAL YEAR ENDED 31 DECEMBER
31.12.2008 2009 2010 2011 2012
(11 months)
CROP PRODUCTION - TONNES
FFB 673,131 672,768 677,071 738,969 665,812
PROCESSED - TONNES
FFB - own 637,099 630,412 636,033 693,901 620,770
FFB - purchased 19,126 21,635 63,001 107,623 105,469
Palm Oil 141,464 140,985 149,941 168,025 154,595
Palm Kernel 31,900 30,821 33,409 37,050 34,587
EXTRACTION RATE - %
Palm Oil 21.56 21.62 21.45 20.96 21.29
Palm Kernel 4.86 4.73 4.78 4.62 4.76
MATURE AREA - HECTARES
Oil Palm
30 months to 7 years 1,329 2,634 2,892 2,289 2,788
> 7 years to 17 years 19,008 17,899 17,899 16,009 13,332
> 17 years onwards 11,030 12,043 11,296 12,770 14,335
Total mature area 31,367 32,576 32,087 31,068 30,455
AVERAGE YIELD - TONNES/HECTARE
FFB yield per mature hectare 21.46 20.65 21.10 23.79 21.86
Oil per mature hectare 4.63 4.47 4.53 4.99 4.65
AVERAGE SELLING PRICE
(Ex-Sandakan)
RM/TONNE
FFB 579 445 579 697 560
Palm Oil 2,314 2,303 2,594 3,226 2,773
Palm Kernel 1,449 1,012 1,629 2,200 1,494
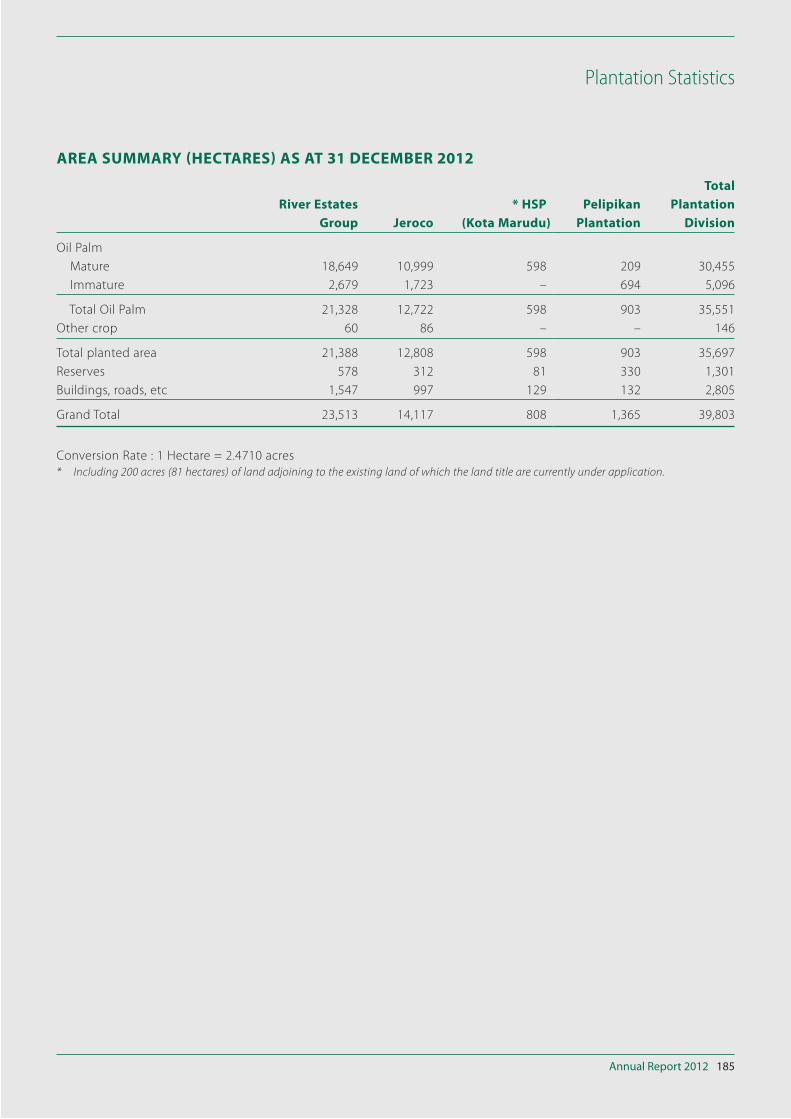
Annual Report 2012 185
Plantation Statistics
AREA SUMMARY (HECTARES) AS AT 31 DECEMBER 2012
River Estates
Group Jeroco
* HSP
(Kota Marudu)
Pelipikan
Plantation
Total
Plantation
Division
Oil Palm
Mature 18,649 10,999 598 209 30,455
Immature 2,679 1,723 – 694 5,096
Total Oil Palm 21,328 12,722 598 903 35,551
Other crop 60 86 – – 146
Total planted area 21,388 12,808 598 903 35,697
Reserves 578 312 81 330 1,301
Buildings, roads, etc 1,547 997 129 132 2,805
Grand Total 23,513 14,117 808 1,365 39,803
Conversion Rate : 1 Hectare = 2.4710 acres
* Including 200 acres (81 hectares) of land adjoining to the existing land of which the land title are currently under application.
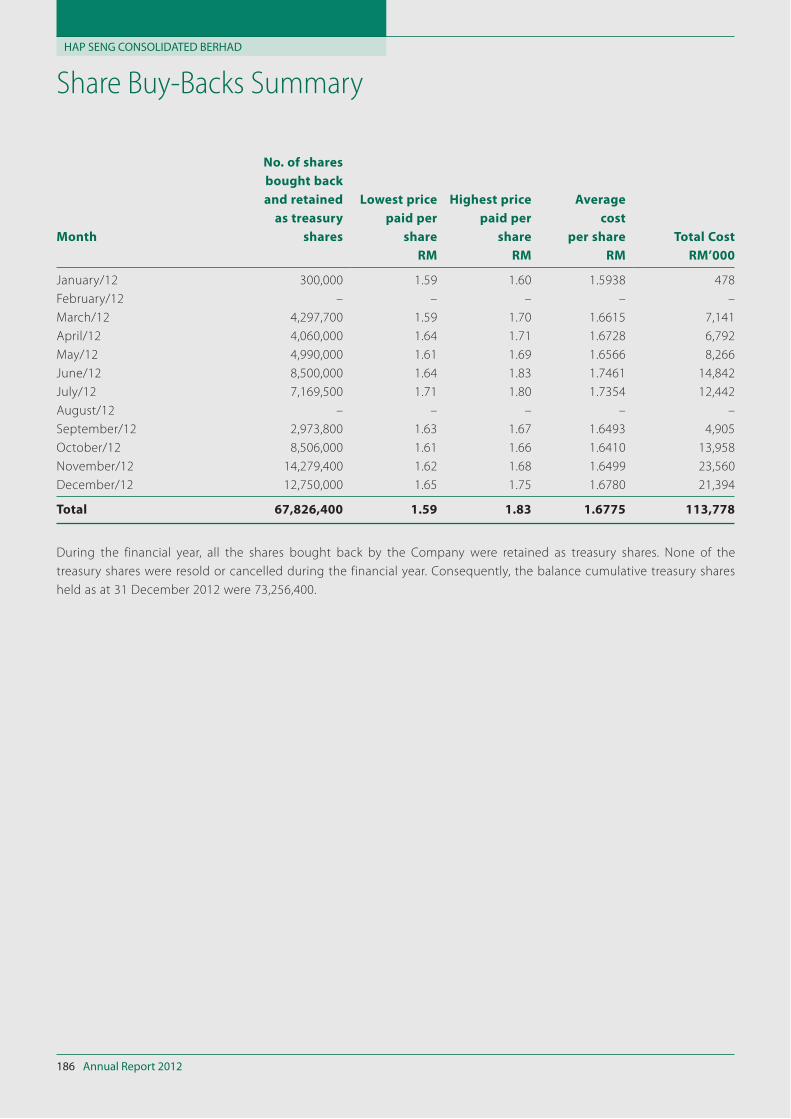
HAP SENG CONSOLIDATED BERHAD
Annual Report 2012186
Share Buy-Backs Summary
Month
No. of shares
bought back
and retained
as treasury
shares
Lowest price
paid per
share
Highest price
paid per
share
Average
cost
per share Total Cost
RM RM RM RM’000
January/12 300,000 1.59 1.60 1.5938 478
February/12 – – – – –
March/12 4,297,700 1.59 1.70 1.6615 7,141
April/12 4,060,000 1.64 1.71 1.6728 6,792
May/12 4,990,000 1.61 1.69 1.6566 8,266
June/12 8,500,000 1.64 1.83 1.7461 14,842
July/12 7,169,500 1.71 1.80 1.7354 12,442
August/12 – – – – –
September/12 2,973,800 1.63 1.67 1.6493 4,905
October/12 8,506,000 1.61 1.66 1.6410 13,958
November/12 14,279,400 1.62 1.68 1.6499 23,560
December/12 12,750,000 1.65 1.75 1.6780 21,394
Total 67,826,400 1.59 1.83 1.6775 113,778
During the financial year, all the shares bought back by the Company were retained as treasury shares. None of the
treasury shares were resold or cancelled during the financial year. Consequently, the balance cumulative treasury shares
held as at 31 December 2012 were 73,256,400.
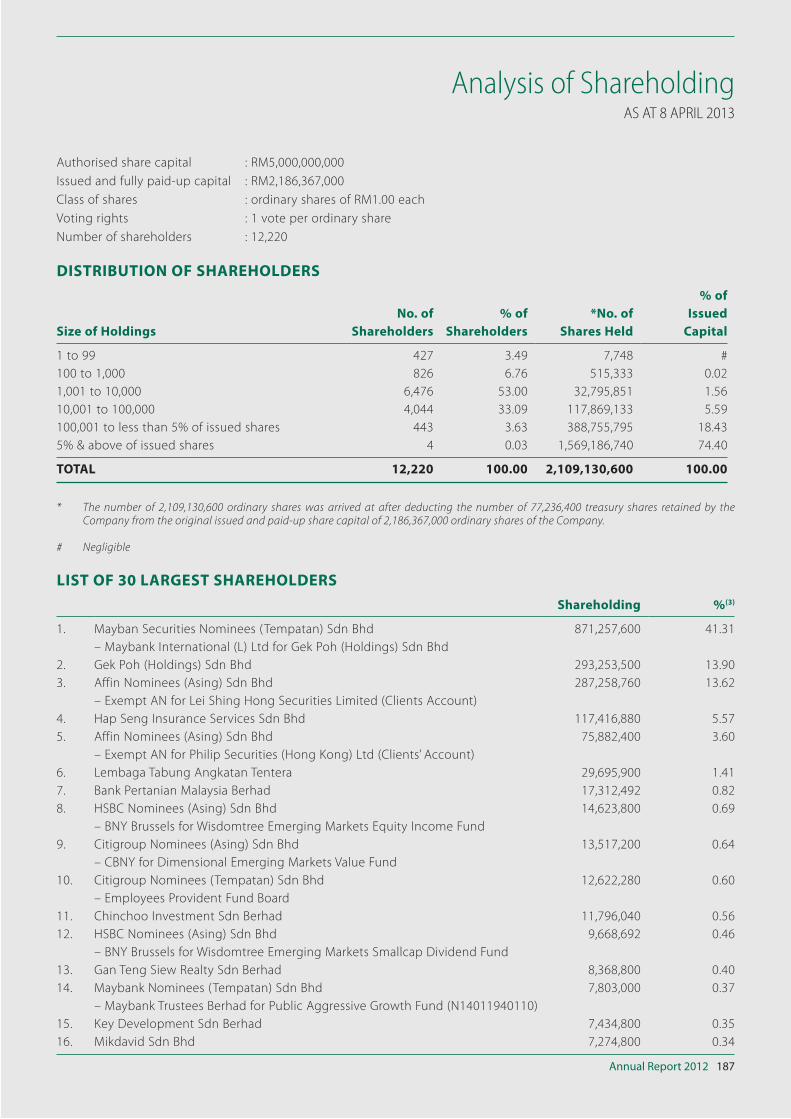
Annual Report 2012 187
Analysis of ShareholdingAS AT 8 APRIL 2013
Authorised share capital : RM5,000,000,000
Issued and fully paid-up capital : RM2,186,367,000
Class of shares : ordinary shares of RM1.00 each
Voting rights : 1 vote per ordinary share
Number of shareholders : 12,220
DISTRIBUTION OF SHAREHOLDERS
Size of Holdings
No. of
Shareholders
% of
Shareholders
*No. of
Shares Held
% of
Issued
Capital
1 to 99 427 3.49 7,748 #
100 to 1,000 826 6.76 515,333 0.02
1,001 to 10,000 6,476 53.00 32,795,851 1.56
10,001 to 100,000 4,044 33.09 117,869,133 5.59
100,001 to less than 5% of issued shares 443 3.63 388,755,795 18.43
5% & above of issued shares 4 0.03 1,569,186,740 74.40
TOTAL 12,220 100.00 2,109,130,600 100.00
* The number of 2,109,130,600 ordinary shares was arrived at after deducting the number of 77,236,400 treasury shares retained by the Company from the original issued and paid-up share capital of 2,186,367,000 ordinary shares of the Company.
# Negligible
LIST OF 30 LARGEST SHAREHOLDERS
Shareholding %(3)
1. Mayban Securities Nominees (Tempatan) Sdn Bhd 871,257,600 41.31
– Maybank International (L) Ltd for Gek Poh (Holdings) Sdn Bhd
2. Gek Poh (Holdings) Sdn Bhd 293,253,500 13.90
3. Affin Nominees (Asing) Sdn Bhd 287,258,760 13.62
– Exempt AN for Lei Shing Hong Securities Limited (Clients Account)
4. Hap Seng Insurance Services Sdn Bhd 117,416,880 5.57
5. Affin Nominees (Asing) Sdn Bhd 75,882,400 3.60
– Exempt AN for Philip Securities (Hong Kong) Ltd (Clients’ Account)
6. Lembaga Tabung Angkatan Tentera 29,695,900 1.41
7. Bank Pertanian Malaysia Berhad 17,312,492 0.82
8. HSBC Nominees (Asing) Sdn Bhd 14,623,800 0.69
– BNY Brussels for Wisdomtree Emerging Markets Equity Income Fund
9. Citigroup Nominees (Asing) Sdn Bhd 13,517,200 0.64
– CBNY for Dimensional Emerging Markets Value Fund
10. Citigroup Nominees (Tempatan) Sdn Bhd 12,622,280 0.60
– Employees Provident Fund Board
11. Chinchoo Investment Sdn Berhad 11,796,040 0.56
12. HSBC Nominees (Asing) Sdn Bhd 9,668,692 0.46
– BNY Brussels for Wisdomtree Emerging Markets Smallcap Dividend Fund
13. Gan Teng Siew Realty Sdn Berhad 8,368,800 0.40
14. Maybank Nominees (Tempatan) Sdn Bhd 7,803,000 0.37
– Maybank Trustees Berhad for Public Aggressive Growth Fund (N14011940110)
15. Key Development Sdn Berhad 7,434,800 0.35
16. Mikdavid Sdn Bhd 7,274,800 0.34
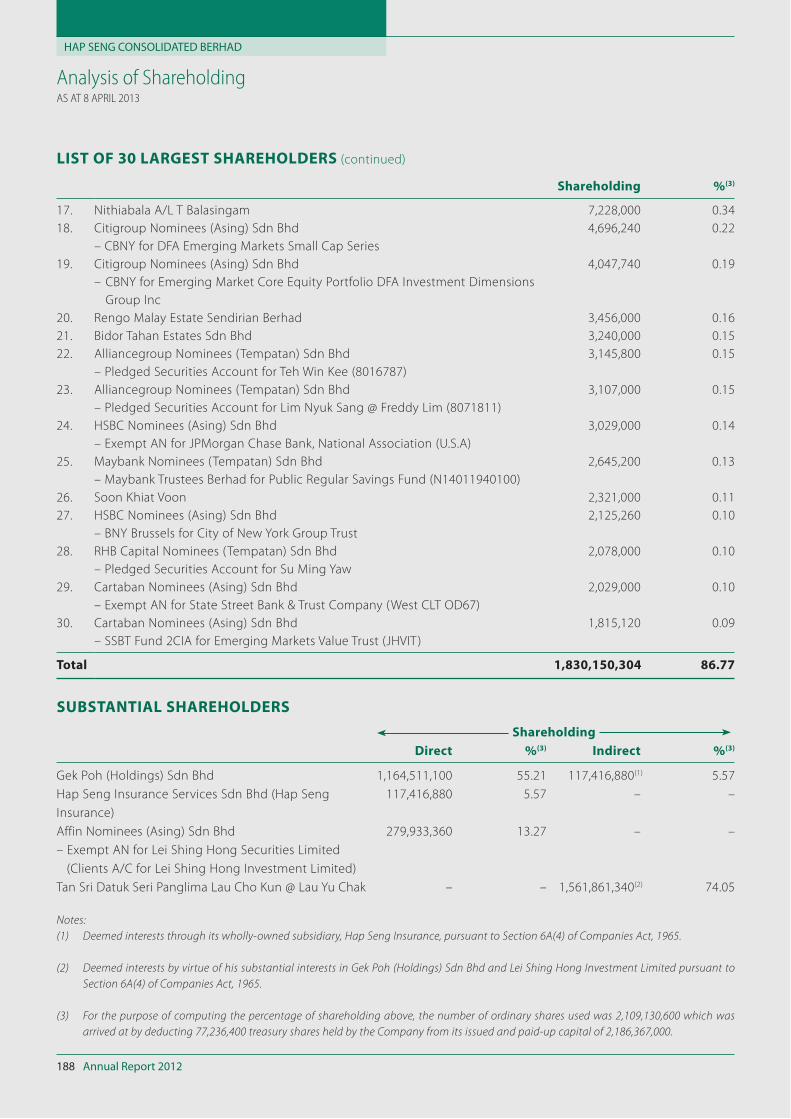
HAP SENG CONSOLIDATED BERHAD
Annual Report 2012188
Analysis of ShareholdingAS AT 8 APRIL 2013
Shareholding %(3)
17. Nithiabala A/L T Balasingam 7,228,000 0.34
18. Citigroup Nominees (Asing) Sdn Bhd 4,696,240 0.22
– CBNY for DFA Emerging Markets Small Cap Series
19. Citigroup Nominees (Asing) Sdn Bhd 4,047,740 0.19
– CBNY for Emerging Market Core Equity Portfolio DFA Investment Dimensions
Group Inc
20. Rengo Malay Estate Sendirian Berhad 3,456,000 0.16
21. Bidor Tahan Estates Sdn Bhd 3,240,000 0.15
22. Alliancegroup Nominees (Tempatan) Sdn Bhd 3,145,800 0.15
– Pledged Securities Account for Teh Win Kee (8016787)
23. Alliancegroup Nominees (Tempatan) Sdn Bhd 3,107,000 0.15
– Pledged Securities Account for Lim Nyuk Sang @ Freddy Lim (8071811)
24. HSBC Nominees (Asing) Sdn Bhd 3,029,000 0.14
– Exempt AN for JPMorgan Chase Bank, National Association (U.S.A)
25. Maybank Nominees (Tempatan) Sdn Bhd 2,645,200 0.13
– Maybank Trustees Berhad for Public Regular Savings Fund (N14011940100)
26. Soon Khiat Voon 2,321,000 0.11
27. HSBC Nominees (Asing) Sdn Bhd 2,125,260 0.10
– BNY Brussels for City of New York Group Trust
28. RHB Capital Nominees (Tempatan) Sdn Bhd 2,078,000 0.10
– Pledged Securities Account for Su Ming Yaw
29. Cartaban Nominees (Asing) Sdn Bhd 2,029,000 0.10
– Exempt AN for State Street Bank & Trust Company (West CLT OD67)
30. Cartaban Nominees (Asing) Sdn Bhd 1,815,120 0.09
– SSBT Fund 2CIA for Emerging Markets Value Trust (JHVIT)
Total 1,830,150,304 86.77
SUBSTANTIAL SHAREHOLDERS
Shareholding
Direct %(3) Indirect %(3)
Gek Poh (Holdings) Sdn Bhd 1,164,511,100 55.21 117,416,880(1) 5.57
Hap Seng Insurance Services Sdn Bhd (Hap Seng
Insurance)
117,416,880 5.57 – –
Affin Nominees (Asing) Sdn Bhd 279,933,360 13.27 – –
– Exempt AN for Lei Shing Hong Securities Limited
(Clients A/C for Lei Shing Hong Investment Limited)
Tan Sri Datuk Seri Panglima Lau Cho Kun @ Lau Yu Chak – – 1,561,861,340(2) 74.05
Notes:
(1) Deemed interests through its wholly-owned subsidiary, Hap Seng Insurance, pursuant to Section 6A(4) of Companies Act, 1965.
(2) Deemed interests by virtue of his substantial interests in Gek Poh (Holdings) Sdn Bhd and Lei Shing Hong Investment Limited pursuant to
Section 6A(4) of Companies Act, 1965.
(3) For the purpose of computing the percentage of shareholding above, the number of ordinary shares used was 2,109,130,600 which was
arrived at by deducting 77,236,400 treasury shares held by the Company from its issued and paid-up capital of 2,186,367,000.
LIST OF 30 LARGEST SHAREHOLDERS (continued)
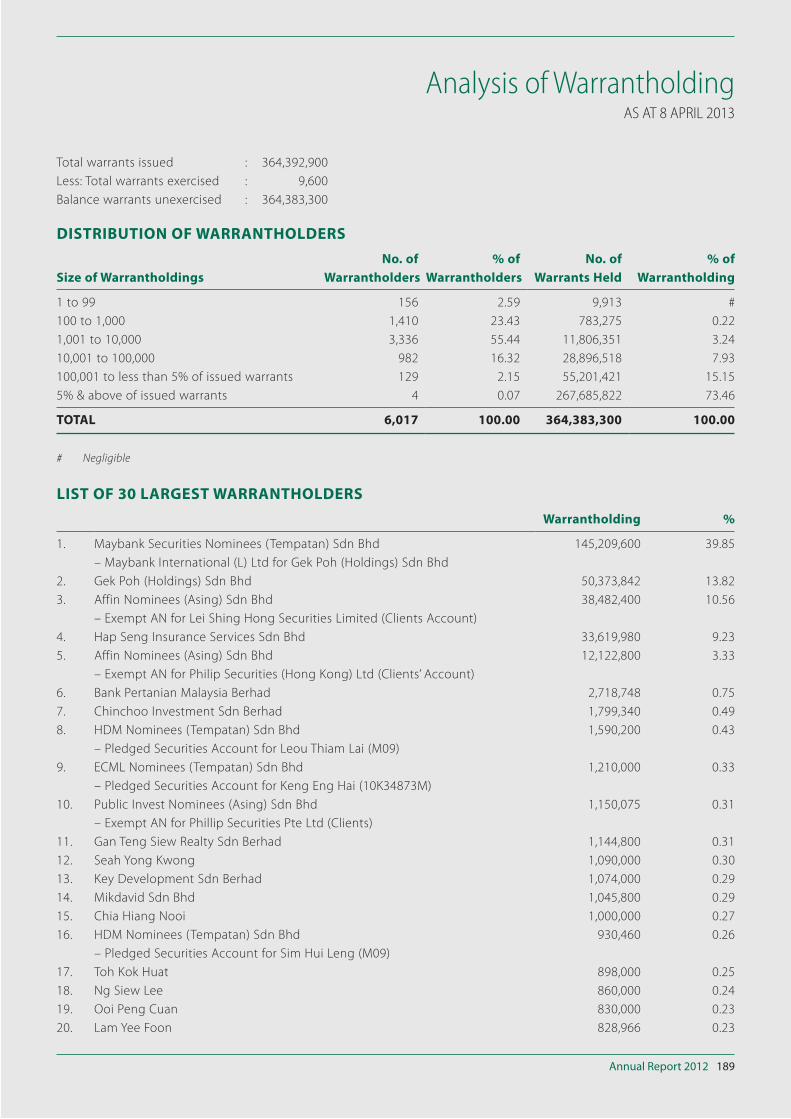
Annual Report 2012 189
Analysis of WarrantholdingAS AT 8 APRIL 2013
Total warrants issued : 364,392,900
Less: Total warrants exercised : 9,600
Balance warrants unexercised : 364,383,300
DISTRIBUTION OF WARRANTHOLDERS
Size of Warrantholdings
No. of
Warrantholders
% of
Warrantholders
No. of
Warrants Held
% of
Warrantholding
1 to 99 156 2.59 9,913 #
100 to 1,000 1,410 23.43 783,275 0.22
1,001 to 10,000 3,336 55.44 11,806,351 3.24
10,001 to 100,000 982 16.32 28,896,518 7.93
100,001 to less than 5% of issued warrants 129 2.15 55,201,421 15.15
5% & above of issued warrants 4 0.07 267,685,822 73.46
TOTAL 6,017 100.00 364,383,300 100.00
# Negligible
LIST OF 30 LARGEST WARRANTHOLDERS
Warrantholding %
1. Maybank Securities Nominees (Tempatan) Sdn Bhd 145,209,600 39.85
– Maybank International (L) Ltd for Gek Poh (Holdings) Sdn Bhd
2. Gek Poh (Holdings) Sdn Bhd 50,373,842 13.82
3. Affin Nominees (Asing) Sdn Bhd 38,482,400 10.56
– Exempt AN for Lei Shing Hong Securities Limited (Clients Account)
4. Hap Seng Insurance Services Sdn Bhd 33,619,980 9.23
5. Affin Nominees (Asing) Sdn Bhd 12,122,800 3.33
– Exempt AN for Philip Securities (Hong Kong) Ltd (Clients’ Account)
6. Bank Pertanian Malaysia Berhad 2,718,748 0.75
7. Chinchoo Investment Sdn Berhad 1,799,340 0.49
8. HDM Nominees (Tempatan) Sdn Bhd 1,590,200 0.43
– Pledged Securities Account for Leou Thiam Lai (M09)
9. ECML Nominees (Tempatan) Sdn Bhd 1,210,000 0.33
– Pledged Securities Account for Keng Eng Hai (10K34873M)
10. Public Invest Nominees (Asing) Sdn Bhd 1,150,075 0.31
– Exempt AN for Phillip Securities Pte Ltd (Clients)
11. Gan Teng Siew Realty Sdn Berhad 1,144,800 0.31
12. Seah Yong Kwong 1,090,000 0.30
13. Key Development Sdn Berhad 1,074,000 0.29
14. Mikdavid Sdn Bhd 1,045,800 0.29
15. Chia Hiang Nooi 1,000,000 0.27
16. HDM Nominees (Tempatan) Sdn Bhd 930,460 0.26
– Pledged Securities Account for Sim Hui Leng (M09)
17. Toh Kok Huat 898,000 0.25
18. Ng Siew Lee 860,000 0.24
19. Ooi Peng Cuan 830,000 0.23
20. Lam Yee Foon 828,966 0.23
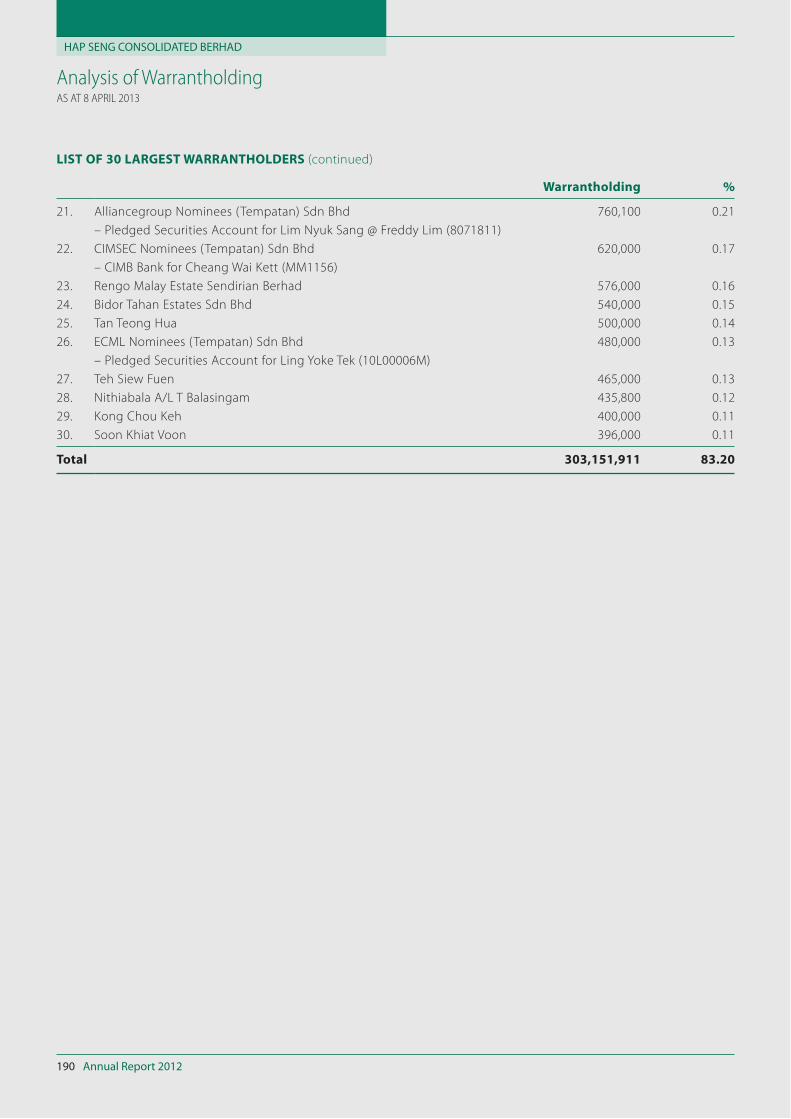
HAP SENG CONSOLIDATED BERHAD
Annual Report 2012190
Analysis of WarrantholdingAS AT 8 APRIL 2013
Warrantholding %
21. Alliancegroup Nominees (Tempatan) Sdn Bhd 760,100 0.21
– Pledged Securities Account for Lim Nyuk Sang @ Freddy Lim (8071811)
22. CIMSEC Nominees (Tempatan) Sdn Bhd 620,000 0.17
– CIMB Bank for Cheang Wai Kett (MM1156)
23. Rengo Malay Estate Sendirian Berhad 576,000 0.16
24. Bidor Tahan Estates Sdn Bhd 540,000 0.15
25. Tan Teong Hua 500,000 0.14
26. ECML Nominees (Tempatan) Sdn Bhd 480,000 0.13
– Pledged Securities Account for Ling Yoke Tek (10L00006M)
27. Teh Siew Fuen 465,000 0.13
28. Nithiabala A/L T Balasingam 435,800 0.12
29. Kong Chou Keh 400,000 0.11
30. Soon Khiat Voon 396,000 0.11
Total 303,151,911 83.20
LIST OF 30 LARGEST WARRANTHOLDERS (continued)
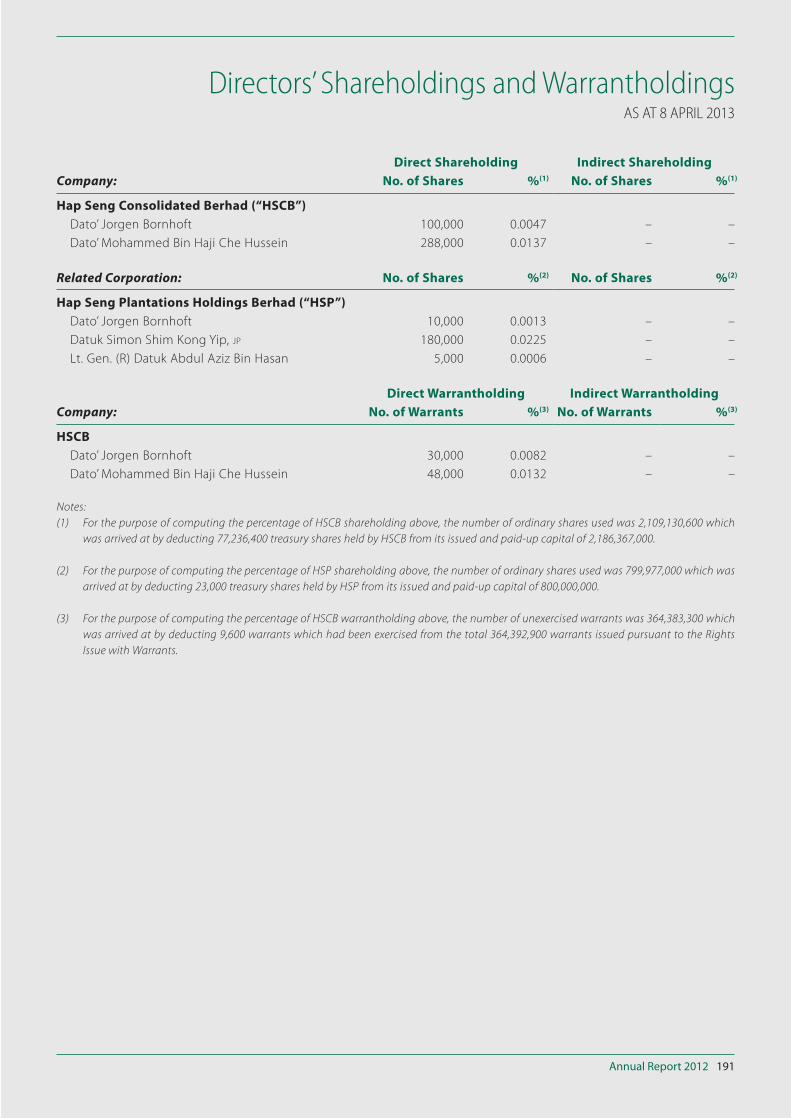
Annual Report 2012 191
Directors’ Shareholdings and WarrantholdingsAS AT 8 APRIL 2013
Direct Shareholding Indirect Shareholding
Company: No. of Shares %(1) No. of Shares %(1)
Hap Seng Consolidated Berhad (“HSCB”)
Dato’ Jorgen Bornhoft 100,000 0.0047 – –
Dato’ Mohammed Bin Haji Che Hussein 288,000 0.0137 – –
Related Corporation: No. of Shares %(2) No. of Shares %(2)
Hap Seng Plantations Holdings Berhad (“HSP”)
Dato’ Jorgen Bornhoft 10,000 0.0013 – –
Datuk Simon Shim Kong Yip, JP 180,000 0.0225 – –
Lt. Gen. (R) Datuk Abdul Aziz Bin Hasan 5,000 0.0006 – –
Direct Warrantholding Indirect Warrantholding
Company: No. of Warrants %(3) No. of Warrants %(3)
HSCB
Dato’ Jorgen Bornhoft 30,000 0.0082 – –
Dato’ Mohammed Bin Haji Che Hussein 48,000 0.0132 – –
Notes:
(1) For the purpose of computing the percentage of HSCB shareholding above, the number of ordinary shares used was 2,109,130,600 which
was arrived at by deducting 77,236,400 treasury shares held by HSCB from its issued and paid-up capital of 2,186,367,000.
(2) For the purpose of computing the percentage of HSP shareholding above, the number of ordinary shares used was 799,977,000 which was
arrived at by deducting 23,000 treasury shares held by HSP from its issued and paid-up capital of 800,000,000.
(3) For the purpose of computing the percentage of HSCB warrantholding above, the number of unexercised warrants was 364,383,300 which
was arrived at by deducting 9,600 warrants which had been exercised from the total 364,392,900 warrants issued pursuant to the Rights
Issue with Warrants.
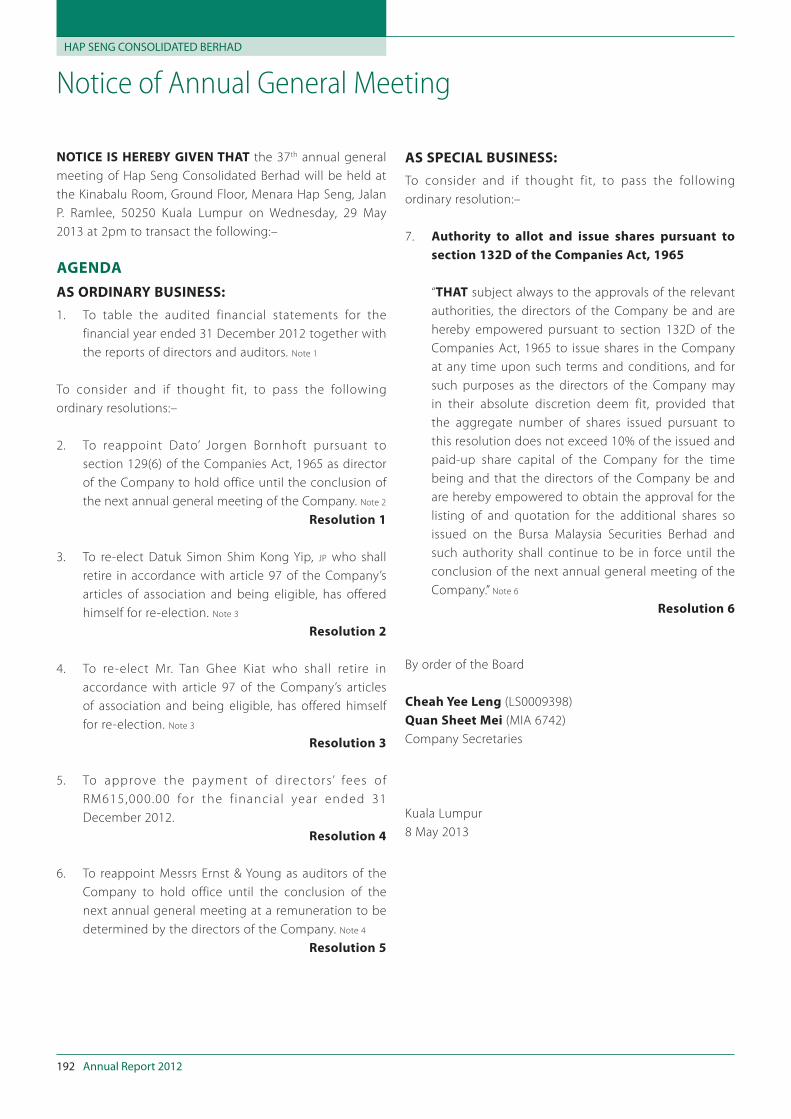
HAP SENG CONSOLIDATED BERHAD
Annual Report 2012192
Notice of Annual General Meeting
NOTICE IS HEREBY GIVEN THAT the 37th annual general
meeting of Hap Seng Consolidated Berhad will be held at
the Kinabalu Room, Ground Floor, Menara Hap Seng, Jalan
P. Ramlee, 50250 Kuala Lumpur on Wednesday, 29 May
2013 at 2pm to transact the following:–
AGENDA
AS ORDINARY BUSINESS:
1. To table the audited financial statements for the
financial year ended 31 December 2012 together with
the reports of directors and auditors. Note 1
To consider and if thought fit, to pass the following
ordinary resolutions:–
2. To reappoint Dato’ Jorgen Bornhoft pursuant to
section 129(6) of the Companies Act, 1965 as director
of the Company to hold office until the conclusion of
the next annual general meeting of the Company. Note 2
Resolution 1
3. To re-elect Datuk Simon Shim Kong Yip, JP who shall
retire in accordance with article 97 of the Company’s
articles of association and being eligible, has offered
himself for re-election. Note 3
Resolution 2
4. To re-elect Mr. Tan Ghee Kiat who shall retire in
accordance with article 97 of the Company’s articles
of association and being eligible, has offered himself
for re-election. Note 3
Resolution 3
5. To approve the payment of d i rectors’ fees of
RM615,000.00 for the f inancial year ended 31
December 2012.
Resolution 4
6. To reappoint Messrs Ernst & Young as auditors of the
Company to hold office until the conclusion of the
next annual general meeting at a remuneration to be
determined by the directors of the Company. Note 4
Resolution 5
AS SPECIAL BUSINESS:
To consider and if thought fit, to pass the following
ordinary resolution:–
7. Authority to allot and issue shares pursuant to
section 132D of the Companies Act, 1965
“THAT subject always to the approvals of the relevant
authorities, the directors of the Company be and are
hereby empowered pursuant to section 132D of the
Companies Act, 1965 to issue shares in the Company
at any time upon such terms and conditions, and for
such purposes as the directors of the Company may
in their absolute discretion deem fit, provided that
the aggregate number of shares issued pursuant to
this resolution does not exceed 10% of the issued and
paid-up share capital of the Company for the time
being and that the directors of the Company be and
are hereby empowered to obtain the approval for the
listing of and quotation for the additional shares so
issued on the Bursa Malaysia Securities Berhad and
such authority shall continue to be in force until the
conclusion of the next annual general meeting of the
Company.” Note 6
Resolution 6
By order of the Board
Cheah Yee Leng (LS0009398)
Quan Sheet Mei (MIA 6742)
Company Secretaries
Kuala Lumpur
8 May 2013
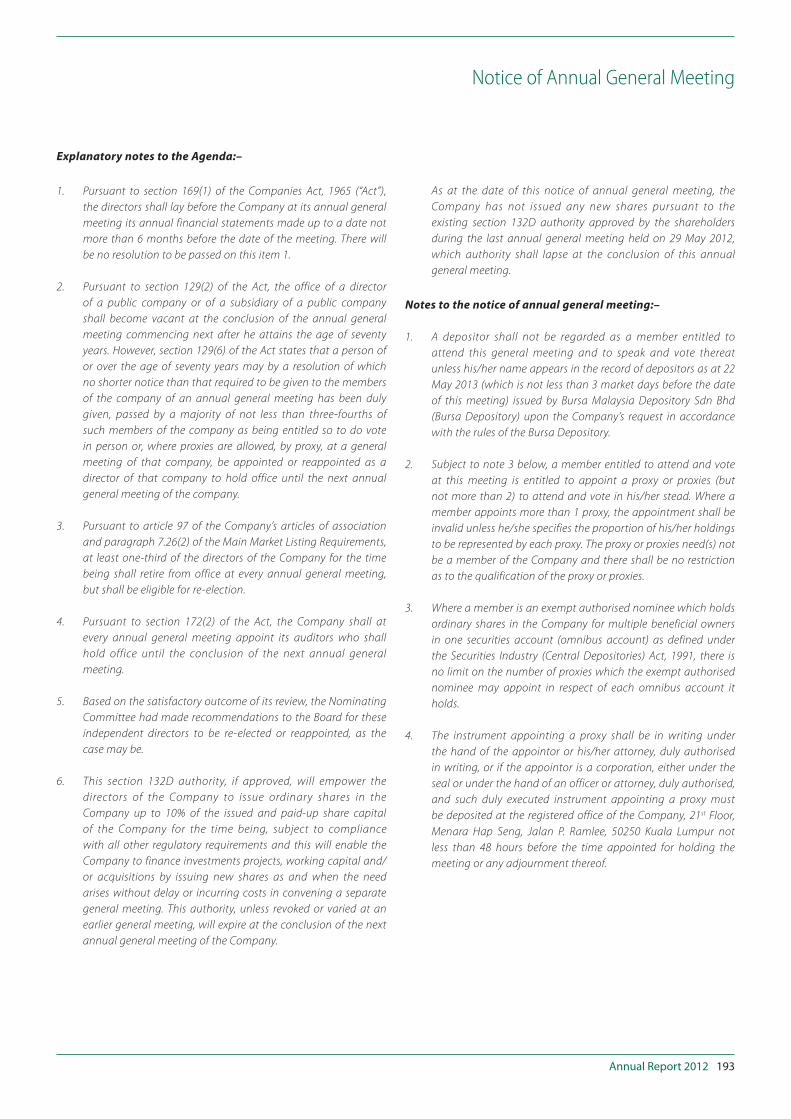
Annual Report 2012 193
Notice of Annual General Meeting
Explanatory notes to the Agenda:–
1. Pursuant to section 169(1) of the Companies Act, 1965 (“Act”),
the directors shall lay before the Company at its annual general
meeting its annual financial statements made up to a date not
more than 6 months before the date of the meeting. There will
be no resolution to be passed on this item 1.
2. Pursuant to section 129(2) of the Act, the office of a director
of a public company or of a subsidiary of a public company
shall become vacant at the conclusion of the annual general
meeting commencing next after he attains the age of seventy
years. However, section 129(6) of the Act states that a person of
or over the age of seventy years may by a resolution of which
no shorter notice than that required to be given to the members
of the company of an annual general meeting has been duly
given, passed by a majority of not less than three-fourths of
such members of the company as being entitled so to do vote
in person or, where proxies are allowed, by proxy, at a general
meeting of that company, be appointed or reappointed as a
director of that company to hold office until the next annual
general meeting of the company.
3. Pursuant to article 97 of the Company’s articles of association
and paragraph 7.26(2) of the Main Market Listing Requirements,
at least one-third of the directors of the Company for the time
being shall retire from office at every annual general meeting,
but shall be eligible for re-election.
4. Pursuant to section 172(2) of the Act, the Company shall at
every annual general meeting appoint its auditors who shall
hold office until the conclusion of the next annual general
meeting.
5. Based on the satisfactory outcome of its review, the Nominating
Committee had made recommendations to the Board for these
independent directors to be re-elected or reappointed, as the
case may be.
6. This section 132D authority, if approved, will empower the
directors of the Company to issue ordinary shares in the
Company up to 10% of the issued and paid-up share capital
of the Company for the time being, subject to compliance
with all other regulatory requirements and this will enable the
Company to finance investments projects, working capital and/
or acquisitions by issuing new shares as and when the need
arises without delay or incurring costs in convening a separate
general meeting. This authority, unless revoked or varied at an
earlier general meeting, will expire at the conclusion of the next
annual general meeting of the Company.
As at the date of this notice of annual general meeting, the
Company has not issued any new shares pursuant to the
existing section 132D authority approved by the shareholders
during the last annual general meeting held on 29 May 2012,
which authority shall lapse at the conclusion of this annual
general meeting.
Notes to the notice of annual general meeting:–
1. A depositor shall not be regarded as a member entitled to
attend this general meeting and to speak and vote thereat
unless his/her name appears in the record of depositors as at 22
May 2013 (which is not less than 3 market days before the date
of this meeting) issued by Bursa Malaysia Depository Sdn Bhd
(Bursa Depository) upon the Company’s request in accordance
with the rules of the Bursa Depository.
2. Subject to note 3 below, a member entitled to attend and vote
at this meeting is entitled to appoint a proxy or proxies (but
not more than 2) to attend and vote in his/her stead. Where a
member appoints more than 1 proxy, the appointment shall be
invalid unless he/she specifies the proportion of his/her holdings
to be represented by each proxy. The proxy or proxies need(s) not
be a member of the Company and there shall be no restriction
as to the qualification of the proxy or proxies.
3. Where a member is an exempt authorised nominee which holds
ordinary shares in the Company for multiple beneficial owners
in one securities account (omnibus account) as defined under
the Securities Industry (Central Depositories) Act, 1991, there is
no limit on the number of proxies which the exempt authorised
nominee may appoint in respect of each omnibus account it
holds.
4. The instrument appointing a proxy shall be in writing under
the hand of the appointor or his/her attorney, duly authorised
in writing, or if the appointor is a corporation, either under the
seal or under the hand of an officer or attorney, duly authorised,
and such duly executed instrument appointing a proxy must
be deposited at the registered office of the Company, 21st Floor,
Menara Hap Seng, Jalan P. Ramlee, 50250 Kuala Lumpur not
less than 48 hours before the time appointed for holding the
meeting or any adjournment thereof.

This page has been intentionally left blank
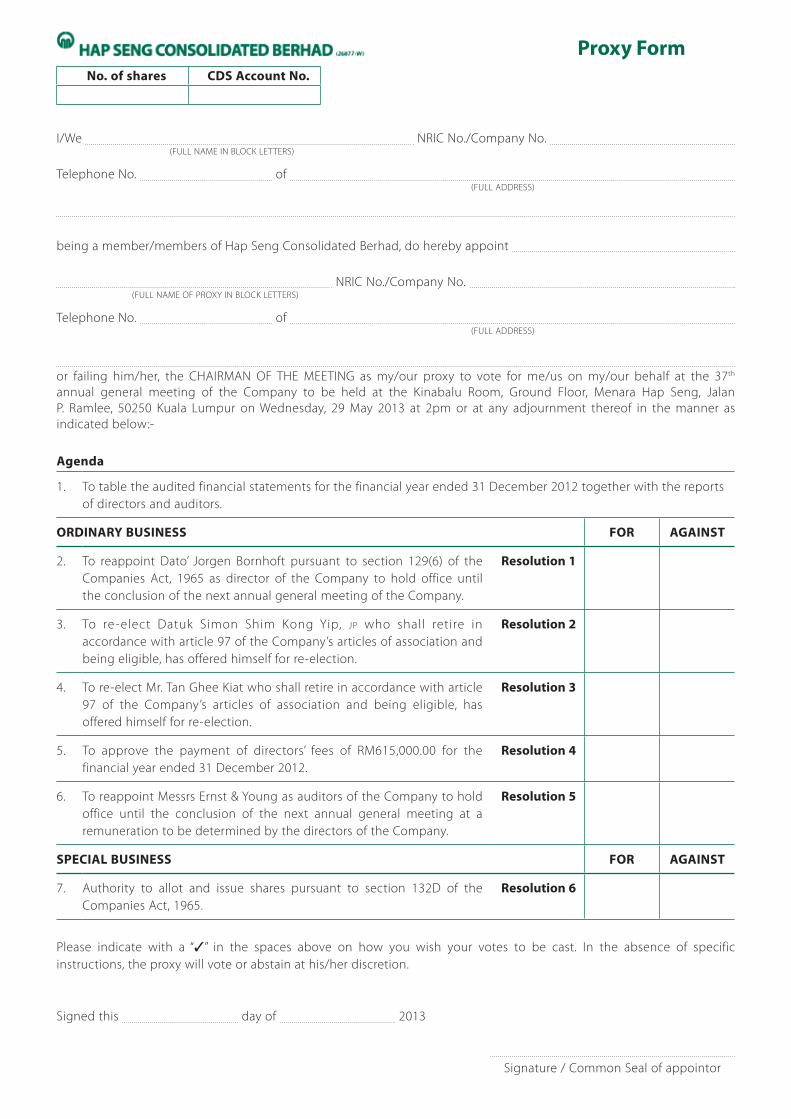
I/We NRIC No./Company No. (FULL NAME IN BLOCK LETTERS)
Telephone No. of (FULL ADDRESS)
being a member/members of Hap Seng Consolidated Berhad, do hereby appoint
NRIC No./Company No. (FULL NAME OF PROXY IN BLOCK LETTERS)
Telephone No. of (FULL ADDRESS)
or failing him/her, the CHAIRMAN OF THE MEETING as my/our proxy to vote for me/us on my/our behalf at the 37th
annual general meeting of the Company to be held at the Kinabalu Room, Ground Floor, Menara Hap Seng, Jalan
P. Ramlee, 50250 Kuala Lumpur on Wednesday, 29 May 2013 at 2pm or at any adjournment thereof in the manner as
indicated below:-
Agenda
1. To table the audited financial statements for the financial year ended 31 December 2012 together with the reports
of directors and auditors.
ORDINARY BUSINESS FOR AGAINST
2. To reappoint Dato’ Jorgen Bornhoft pursuant to section 129(6) of the
Companies Act, 1965 as director of the Company to hold office until
the conclusion of the next annual general meeting of the Company.
Resolution 1
3. To re-elect Datuk Simon Shim Kong Yip, JP who shall retire in
accordance with article 97 of the Company’s articles of association and
being eligible, has offered himself for re-election.
Resolution 2
4. To re-elect Mr. Tan Ghee Kiat who shall retire in accordance with article
97 of the Company’s articles of association and being eligible, has
offered himself for re-election.
Resolution 3
5. To approve the payment of directors’ fees of RM615,000.00 for the
financial year ended 31 December 2012.
Resolution 4
6. To reappoint Messrs Ernst & Young as auditors of the Company to hold
office until the conclusion of the next annual general meeting at a
remuneration to be determined by the directors of the Company.
Resolution 5
SPECIAL BUSINESS FOR AGAINST
7. Authority to allot and issue shares pursuant to section 132D of the
Companies Act, 1965.
Resolution 6
Please indicate with a “✓” in the spaces above on how you wish your votes to be cast. In the absence of specific
instructions, the proxy will vote or abstain at his/her discretion.
Signed this day of 2013
Signature / Common Seal of appointor
Proxy Form
No. of shares CDS Account No.
Notes:-
1. A depositor shall not be regarded as a member entitled to attend this general meeting and to speak and vote thereat unless his/her name
appears in the record of depositors as at 22 May 2013 (which is not less than 3 market days before the date of this meeting) issued by
Bursa Malaysia Depository Sdn Bhd (Bursa Depository) upon the Company’s request in accordance with the rules of the Bursa Depository.
2. Subject to note 3 below, a member entitled to attend and vote at this meeting is entitled to appoint a proxy or proxies (but not more
than 2) to attend and vote in his/her stead. Where a member appoints more than 1 proxy, the appointment shall be invalid unless he/she
specifies the proportion of his/her holdings to be represented by each proxy. The proxy or proxies need(s) not be a member of the Company
and there shall be no restriction as to the qualification of the proxy or proxies.
3. Where a member is an exempt authorised nominee which holds ordinary shares in the Company for multiple beneficial owners in one
securities account (omnibus account) as defined under the Securities Industry (Central Depositories) Act, 1991, there is no limit on the
number of proxies which the exempt authorised nominee may appoint in respect of each omnibus account it holds.
4. The instrument appointing a proxy shall be in writing under the hand of the appointor or his/her attorney, duly authorised in writing, or
if the appointor is a corporation, either under the seal or under the hand of an officer or attorney duly authorised, and such duly executed
instrument appointing a proxy must be deposited at the registered office of the Company, 21st Floor, Menara Hap Seng, Jalan P. Ramlee,
50250 Kuala Lumpur not less than 48 hours before the time appointed for holding the meeting or any adjournment thereof.
fold here
fold here
Postage
THE COMPANY SECRETARY
HAP SENG CONSOLIDATED BERHAD(Company No. 26877-W)
21st Floor, Menara Hap Seng,
Jalan P. Ramlee
50250 Kuala Lumpur
Malaysia


![[i] · Nestle (Malaysia) Berhad 0.10 0.21 PPB Group Berhad 0.68 0.79 QL Resources Berhad -* -* UMW Holdings Berhad 1.77 1.29 * Peratusan kurang daripada 0.01% Kewangan AmBank Berhad](https://static.fdokumen.site/doc/165x107/5b4c331c7f8b9a9a408b8254/i-nestle-malaysia-berhad-010-021-ppb-group-berhad-068-079-ql-resources.jpg)