Dietary and Lifestyle Factors and its Risk to Kidney Stone...
18
113 Jurnal Sains Kesihatan Malaysia 15(1) 2017: 113-130 DOI : http://dx.doi.org./10.17576/JSKM-2017-1501-14 Artikel Asli/Original Articles Dietary and Lifestyle Factors and its Risk to Kidney Stone Disease: A Case Control Study at UKM Medical Centre (Faktor Diet dan Gaya Hidup dan Risikonya terhadap Penyakit Batu Karang Ginjal: Satu Kajian Kes Kawalan di Pusat Perubatan UKM) NURUL NURLIANA BAHARUDIN, SUZANA SHAHAR & ZULKIFLI MD. ZAINUDDIN ABSTRACT Nutrition has been widely recognized to have certain levels of influence on the risk of kidney stone formation. Thus, this case-control study was conducted to determine the association of dietary intake and lifestyles factors with kidney stone disease. Sociodemographic data, dietary intake, supplements intake, smoking and alcohol habit, medical history, physical activity and anthropometric data were obtained using interviewer-administered pre-tested questionnaires among 81 patients who had been diagnosed with kidney stone disease and 81 patients without kidney stone disease at Universiti Kebangsaan Malaysia Medical Centre. The results indicated that body mass index and hip circumference were higher among cases as compared to controls in both men and women (p < 0.05). Energy, macronutrients and micronutrients intake were higher for case subjects compared to control subjects for all significant parameters (p < 0.05). Results showed positive association of kidney stone with consumption of nuts (≥1 time/week) for men and women while consumption of eggs (1-3 times/month) and beans (1-6 times/week) showed positive association for women. Analysis of multivariate found the risk factor among women was diabetes mellitus [Adjusted OR = 27.6 (95% CI = 1.43-53.3)] (p < 0.05). Whilst, plain water intake of at least 6 glasses [Adjusted OR = 0.001 (95% CI = 0.000-0.08)] (p < 0.05) and 8 glasses per day [Adjusted OR = 0.001 (95% CI = 0.000-0.02)] (p < 0.05) reduced the risk among women. The risk factors for men were smoking habits [Adjusted OR = 16.2 (95% CI = 1.29-203)] (p < 0.05), consumption of carbonated drink 1-3 times per month [Adjusted OR = 6.25 (95% CI = 1.04-40.7)] (p < 0.05) and 1-6 times per week [Adjusted OR = 12.5 (95% CI = 1.41-111)] (p < 0.05). Unhealthy dietary and lifestyles factors increased the risk of kidney stone disease and various risk factors were found for different sexes. Keywords: Kidney stone disease; nephrolithiasis; risk factor; dietary; beverages ABSTRAK Pemakanan telah dikenal pasti mempengaruhi risiko pembentukan penyakit batu karang ginjal. Oleh itu, kajian kes- kawalan telah dijalankan untuk mengkaji peranan diet dan gaya hidup dalam pembentukan penyakit batu karang ginjal. Data sosiodemografi, pengambilan makanan, pengambilan makanan tambahan, tabiat merokok dan pengambilan alkohol, sejarah perubatan, aktiviti fizikal, dan data antropometri telah diperolehi dengan menggunakan borang soal selidik dalam kalangan 81 pesakit yang menghidap penyakit batu karang ginjal dan 81 pesakit tanpa penyakit batu karang ginjal di Pusat Perubatan Universiti Kebangsaan Malaysia. Keputusan menunjukkan bahawa indeks jisim tubuh dan lilitan pinggul adalah lebih tinggi dalam kalangan subjek kes berbanding kawalan bagi lelaki dan wanita (p < 0.05). Pengambilan tenaga, makronutrien dan mikronutrien adalah lebih tinggi bagi subjek kes berbanding subjek kawalan untuk semua parameter (p < 0.05). Hasil kajian menunjukkan perkaitan positif penyakit batu karang ginjal dengan pengambilan kacang (≥1 masa/minggu) untuk lelaki dan wanita manakala pengambilan telur (1-3 kali/bulan) dan kekacang (1-6 kali/ minggu) menunjukkan perkaitan positif untuk wanita. Analisis multivariat mendapati faktor risiko dalam kalangan wanita adalah penyakit diabetes mellitus [Adjusted OR = 27.6 (95% CI = 1.43-53.3)] (p < 0.05). Sementara itu, pengambilan air kosong sekurang-kurangnya 6 gelas [Adjusted OR = 0.001 (95% CI = 0.000-0.08)] (p < 0.05) dan 8 gelas sehari [Adjusted OR = 0.001 (95% CI = 0.000-0.02)] (p < 0.05) mengurangkan risiko dalam kalangan wanita. Faktor-faktor risiko untuk lelaki adalah tabiat merokok [Adjusted OR = 16.2 (95% CI = 1.29-20.3)] (p < 0.05), pengambilan minuman berkarbonat 1-3 kali sebulan [Adjusted OR = 6.25 (95% CI = 1.04 -40.7)] (p < 0.05) dan 1-6 kali seminggu [Adjusted OR = 12.5 (95% CI =1.41-111)] (p < 0.05). Pemakanan dan gaya hidup yang tidak sihat meningkatkan risiko penyakit batu karang ginjal dan pelbagai faktor risiko telah dijumpai untuk jantina yang berbeza. Kata kunci: Penyakit batu karang ginjal; nefrolitiasis; faktor risiko; pemakanan; gaya hidup Chap 14.indd 113 23/01/2017 10:34:28
Transcript of Dietary and Lifestyle Factors and its Risk to Kidney Stone...
113
Jurnal Sains Kesihatan Malaysia 15(1) 2017: 113-130DOI : http://dx.doi.org./10.17576/JSKM-2017-1501-14
Artikel Asli/Original Articles
Dietary and Lifestyle Factors and its Risk to Kidney Stone Disease: A Case Control Study at UKM Medical Centre
(Faktor Diet dan Gaya Hidup dan Risikonya terhadap Penyakit Batu Karang Ginjal: Satu Kajian Kes Kawalan di Pusat Perubatan UKM)
NURUL NURLIANA BAHARUDIN, SUZANA SHAHAR & ZULKIFLI MD. ZAINUDDIN
ABSTRACT
Nutrition has been widely recognized to have certain levels of influence on the risk of kidney stone formation. Thus, this case-control study was conducted to determine the association of dietary intake and lifestyles factors with kidney stone disease. Sociodemographic data, dietary intake, supplements intake, smoking and alcohol habit, medical history, physical activity and anthropometric data were obtained using interviewer-administered pre-tested questionnaires among 81 patients who had been diagnosed with kidney stone disease and 81 patients without kidney stone disease at Universiti Kebangsaan Malaysia Medical Centre. The results indicated that body mass index and hip circumference were higher among cases as compared to controls in both men and women (p < 0.05). Energy, macronutrients and micronutrients intake were higher for case subjects compared to control subjects for all significant parameters (p < 0.05). Results showed positive association of kidney stone with consumption of nuts (≥1 time/week) for men and women while consumption of eggs (1-3 times/month) and beans (1-6 times/week) showed positive association for women. Analysis of multivariate found the risk factor among women was diabetes mellitus [Adjusted OR = 27.6 (95% CI = 1.43-53.3)] (p < 0.05). Whilst, plain water intake of at least 6 glasses [Adjusted OR = 0.001 (95% CI = 0.000-0.08)] (p < 0.05) and 8 glasses per day [Adjusted OR = 0.001 (95% CI = 0.000-0.02)] (p < 0.05) reduced the risk among women. The risk factors for men were smoking habits [Adjusted OR = 16.2 (95% CI = 1.29-203)] (p < 0.05), consumption of carbonated drink 1-3 times per month [Adjusted OR = 6.25 (95% CI = 1.04-40.7)] (p < 0.05) and 1-6 times per week [Adjusted OR = 12.5 (95% CI = 1.41-111)] (p < 0.05). Unhealthy dietary and lifestyles factors increased the risk of kidney stone disease and various risk factors were found for different sexes.
Keywords: Kidney stone disease; nephrolithiasis; risk factor; dietary; beverages
ABSTRAK
Pemakanan telah dikenal pasti mempengaruhi risiko pembentukan penyakit batu karang ginjal. Oleh itu, kajian kes-kawalan telah dijalankan untuk mengkaji peranan diet dan gaya hidup dalam pembentukan penyakit batu karang ginjal. Data sosiodemografi, pengambilan makanan, pengambilan makanan tambahan, tabiat merokok dan pengambilan alkohol, sejarah perubatan, aktiviti fizikal, dan data antropometri telah diperolehi dengan menggunakan borang soal selidik dalam kalangan 81 pesakit yang menghidap penyakit batu karang ginjal dan 81 pesakit tanpa penyakit batu karang ginjal di Pusat Perubatan Universiti Kebangsaan Malaysia. Keputusan menunjukkan bahawa indeks jisim tubuh dan lilitan pinggul adalah lebih tinggi dalam kalangan subjek kes berbanding kawalan bagi lelaki dan wanita (p < 0.05). Pengambilan tenaga, makronutrien dan mikronutrien adalah lebih tinggi bagi subjek kes berbanding subjek kawalan untuk semua parameter (p < 0.05). Hasil kajian menunjukkan perkaitan positif penyakit batu karang ginjal dengan pengambilan kacang (≥1 masa/minggu) untuk lelaki dan wanita manakala pengambilan telur (1-3 kali/bulan) dan kekacang (1-6 kali/minggu) menunjukkan perkaitan positif untuk wanita. Analisis multivariat mendapati faktor risiko dalam kalangan wanita adalah penyakit diabetes mellitus [Adjusted OR = 27.6 (95% CI = 1.43-53.3)] (p < 0.05). Sementara itu, pengambilan air kosong sekurang-kurangnya 6 gelas [Adjusted OR = 0.001 (95% CI = 0.000-0.08)] (p < 0.05) dan 8 gelas sehari [Adjusted OR = 0.001 (95% CI = 0.000-0.02)] (p < 0.05) mengurangkan risiko dalam kalangan wanita. Faktor-faktor risiko untuk lelaki adalah tabiat merokok [Adjusted OR = 16.2 (95% CI = 1.29-20.3)] (p < 0.05), pengambilan minuman berkarbonat 1-3 kali sebulan [Adjusted OR = 6.25 (95% CI = 1.04 -40.7)] (p < 0.05) dan 1-6 kali seminggu [Adjusted OR = 12.5 (95% CI =1.41-111)] (p < 0.05). Pemakanan dan gaya hidup yang tidak sihat meningkatkan risiko penyakit batu karang ginjal dan pelbagai faktor risiko telah dijumpai untuk jantina yang berbeza.
Kata kunci: Penyakit batu karang ginjal; nefrolitiasis; faktor risiko; pemakanan; gaya hidup
Chap 14.indd 113 23/01/2017 10:34:28
114
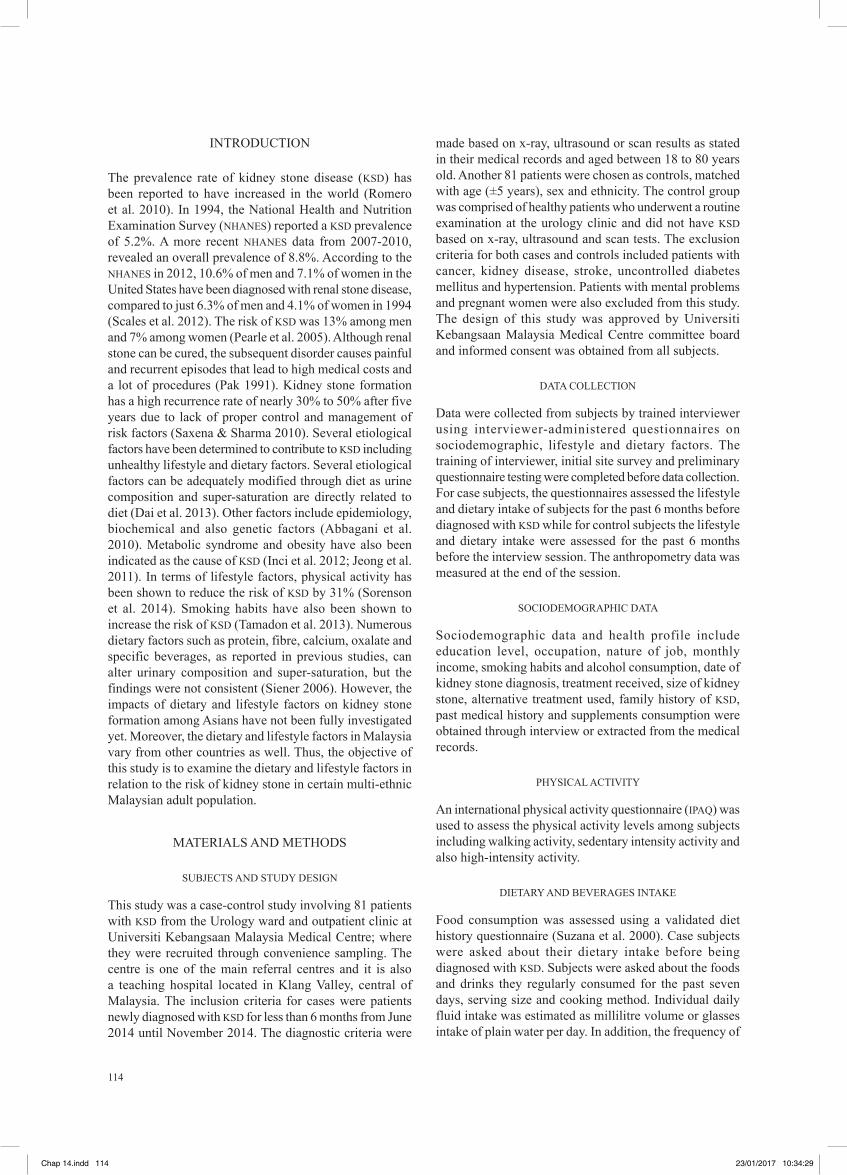
INTRODUCTION
The prevalence rate of kidney stone disease (KSD) has been reported to have increased in the world (Romero et al. 2010). In 1994, the National Health and Nutrition Examination Survey (NHANES) reported a KSD prevalence of 5.2%. A more recent NHANES data from 2007-2010, revealed an overall prevalence of 8.8%. According to the NHANES in 2012, 10.6% of men and 7.1% of women in the United States have been diagnosed with renal stone disease, compared to just 6.3% of men and 4.1% of women in 1994 (Scales et al. 2012). The risk of KSD was 13% among men and 7% among women (Pearle et al. 2005). Although renal stone can be cured, the subsequent disorder causes painful and recurrent episodes that lead to high medical costs and a lot of procedures (Pak 1991). Kidney stone formation has a high recurrence rate of nearly 30% to 50% after five years due to lack of proper control and management of risk factors (Saxena & Sharma 2010). Several etiological factors have been determined to contribute to KSD including unhealthy lifestyle and dietary factors. Several etiological factors can be adequately modified through diet as urine composition and super-saturation are directly related to diet (Dai et al. 2013). Other factors include epidemiology, biochemical and also genetic factors (Abbagani et al. 2010). Metabolic syndrome and obesity have also been indicated as the cause of KSD (Inci et al. 2012; Jeong et al. 2011). In terms of lifestyle factors, physical activity has been shown to reduce the risk of KSD by 31% (Sorenson et al. 2014). Smoking habits have also been shown to increase the risk of KSD (Tamadon et al. 2013). Numerous dietary factors such as protein, fibre, calcium, oxalate and specific beverages, as reported in previous studies, can alter urinary composition and super-saturation, but the findings were not consistent (Siener 2006). However, the impacts of dietary and lifestyle factors on kidney stone formation among Asians have not been fully investigated yet. Moreover, the dietary and lifestyle factors in Malaysia vary from other countries as well. Thus, the objective of this study is to examine the dietary and lifestyle factors in relation to the risk of kidney stone in certain multi-ethnic Malaysian adult population.
MATERIALS AND METHODS
SUBJECTS AND STUDY DESIGN
This study was a case-control study involving 81 patients with KSD from the Urology ward and outpatient clinic at Universiti Kebangsaan Malaysia Medical Centre; where they were recruited through convenience sampling. The centre is one of the main referral centres and it is also a teaching hospital located in Klang Valley, central of Malaysia. The inclusion criteria for cases were patients newly diagnosed with KSD for less than 6 months from June 2014 until November 2014. The diagnostic criteria were
made based on x-ray, ultrasound or scan results as stated in their medical records and aged between 18 to 80 years old. Another 81 patients were chosen as controls, matched with age (±5 years), sex and ethnicity. The control group was comprised of healthy patients who underwent a routine examination at the urology clinic and did not have KSD based on x-ray, ultrasound and scan tests. The exclusion criteria for both cases and controls included patients with cancer, kidney disease, stroke, uncontrolled diabetes mellitus and hypertension. Patients with mental problems and pregnant women were also excluded from this study. The design of this study was approved by Universiti Kebangsaan Malaysia Medical Centre committee board and informed consent was obtained from all subjects.
DATA COLLECTION
Data were collected from subjects by trained interviewer using interviewer-administered questionnaires on sociodemographic, lifestyle and dietary factors. The training of interviewer, initial site survey and preliminary questionnaire testing were completed before data collection. For case subjects, the questionnaires assessed the lifestyle and dietary intake of subjects for the past 6 months before diagnosed with KSD while for control subjects the lifestyle and dietary intake were assessed for the past 6 months before the interview session. The anthropometry data was measured at the end of the session.
SOCIODEMOGRAPHIC DATA
Sociodemographic data and health profile include education level, occupation, nature of job, monthly income, smoking habits and alcohol consumption, date of kidney stone diagnosis, treatment received, size of kidney stone, alternative treatment used, family history of KSD, past medical history and supplements consumption were obtained through interview or extracted from the medical records.
PHYSICAL ACTIVITY
An international physical activity questionnaire (IPAQ) was used to assess the physical activity levels among subjects including walking activity, sedentary intensity activity and also high-intensity activity.
DIETARY AND BEVERAGES INTAKE
Food consumption was assessed using a validated diet history questionnaire (Suzana et al. 2000). Case subjects were asked about their dietary intake before being diagnosed with KSD. Subjects were asked about the foods and drinks they regularly consumed for the past seven days, serving size and cooking method. Individual daily fluid intake was estimated as millilitre volume or glasses intake of plain water per day. In addition, the frequency of
Chap 14.indd 114 23/01/2017 10:34:29
115
beverages consumption (i.e. tea, coffee, chocolate drink, malt drink, fruit juice, soda drink and cordial) was also assessed either less than once per month, 1-3 times per month, 1-6 times per week, once or more per week, or more than that per week.
ANTHROPOMETRY MEASUREMENT
Height and weight were measured using the Leicester stadiometer and TANITA weighing scale to the nearest 0.01 m and 0.01 kg, respectively, using the standardized procedure proposed by (Lee & Nieman 2007) in order to determine and to calculate the body mass index (BMI). The fat percentage was assessed using the BIA Omron Hand-Held.
STATISTICAL ANALYSES
Statistical Product and Service Solutions software 21.0 (SPSS Version 21.0) was used to carry out the analysis. The analysis was performed on men and women subjects separately because it is suggested that different hormone levels between men and women could result in different risks of developing kidney stones. In addition, men and women may have different behaviours and lifestyles, associated with kidney stone formation. The differences in proportions were tested using the chi-square test. The unconditional logistic regression was used to obtain odd ratios (OR) and 95% confidence intervals (95% CI) to estimate the association between dietary and lifestyle factors with risk of kidney stones. Only the variables that have proportional differences between case and control groups were regarded as confounders in this study and were adjusted for the multivariate analysis, i.e. binary logistic regression, enter method, at p < 0.05.
RESULTS
SOCIODEMOGRAPHIC DATA
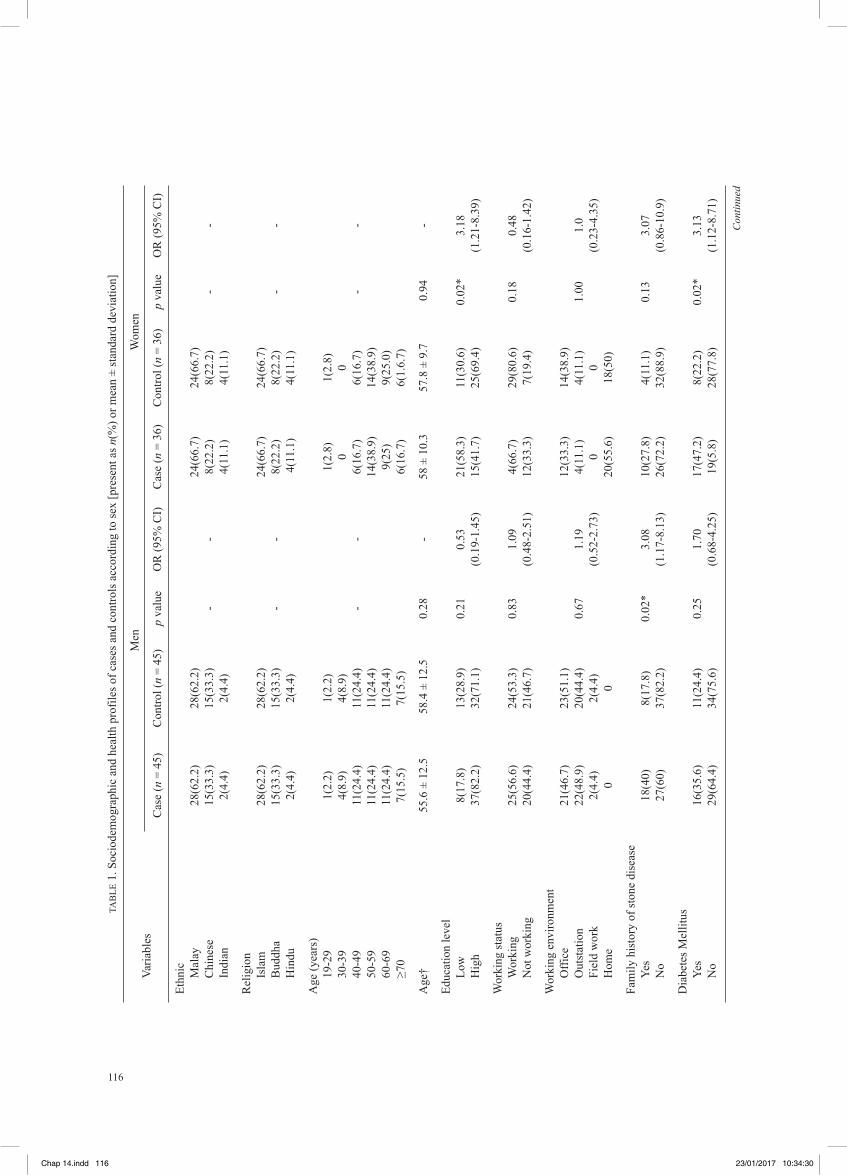
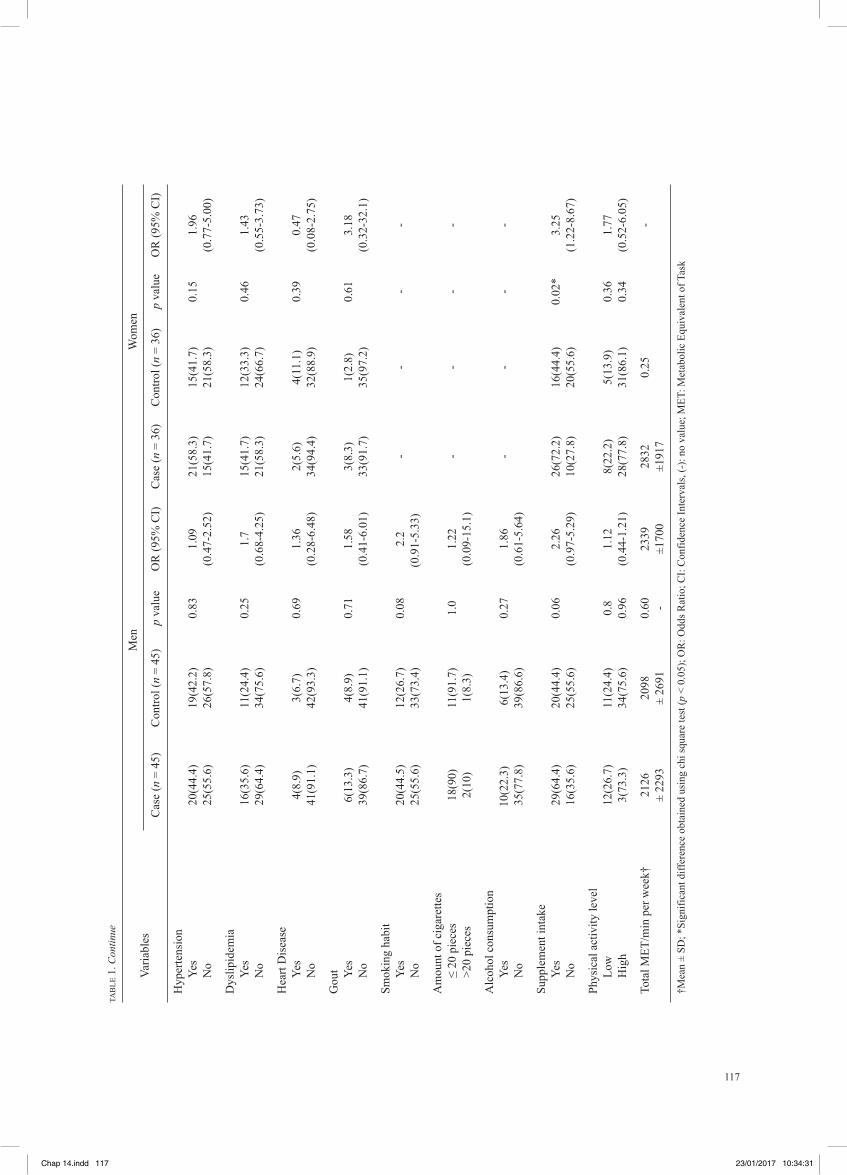
A total of 81 cases and 81 controls were considered in this study which comprised of 55.6% men and 44.4% women. A majority of the subjects were Malays, followed by the Chinese and Indians (Table 1). The mean age ± SD for cases and controls were 55.6 ± 12.5 years and 58.4 ± 12.5 years for men, while 58 ± 10.3 years and 57.8 ± 9.7 years for women, (p > 0.05) respectively. The highest percentage for men was in the age range of 60-69 years (26.7%) and 50-59 years for women (38.9%). A univariate analysis indicated that low education levels (i.e. primary schooled and never schooled) and diabetes mellitus increased the risk of KSD by approximately three folds in women (p < 0.05 for both parameters). In addition, a family history of stone disease increased the risk of KSD by three folds in men (p < 0.05). Supplement and herbs intake increased the risk of KSD by three folds in women (p < 0.05). However, there were no significant differences in the types of supplements and
herbs consumed with the risk of KSD in both men and women (Table 2 and 3).
Most of the patients were diagnosed with KSD in the year 2014 and the recurrence of KSD occurred after 14.2 ± 12.3 years for men and 10.4 ± 8.6 years for women. Besides that, one-fourth of the cases have sought for alternative medicine including the recitation of holy verses, usage of ointment, Chinese and Indian medicines and also the service of traditional healers (bomoh) to treat KSD. More than half of the cases have food beliefs related to treatment of KSD including barley water, white radish and watermelon (table not shown).
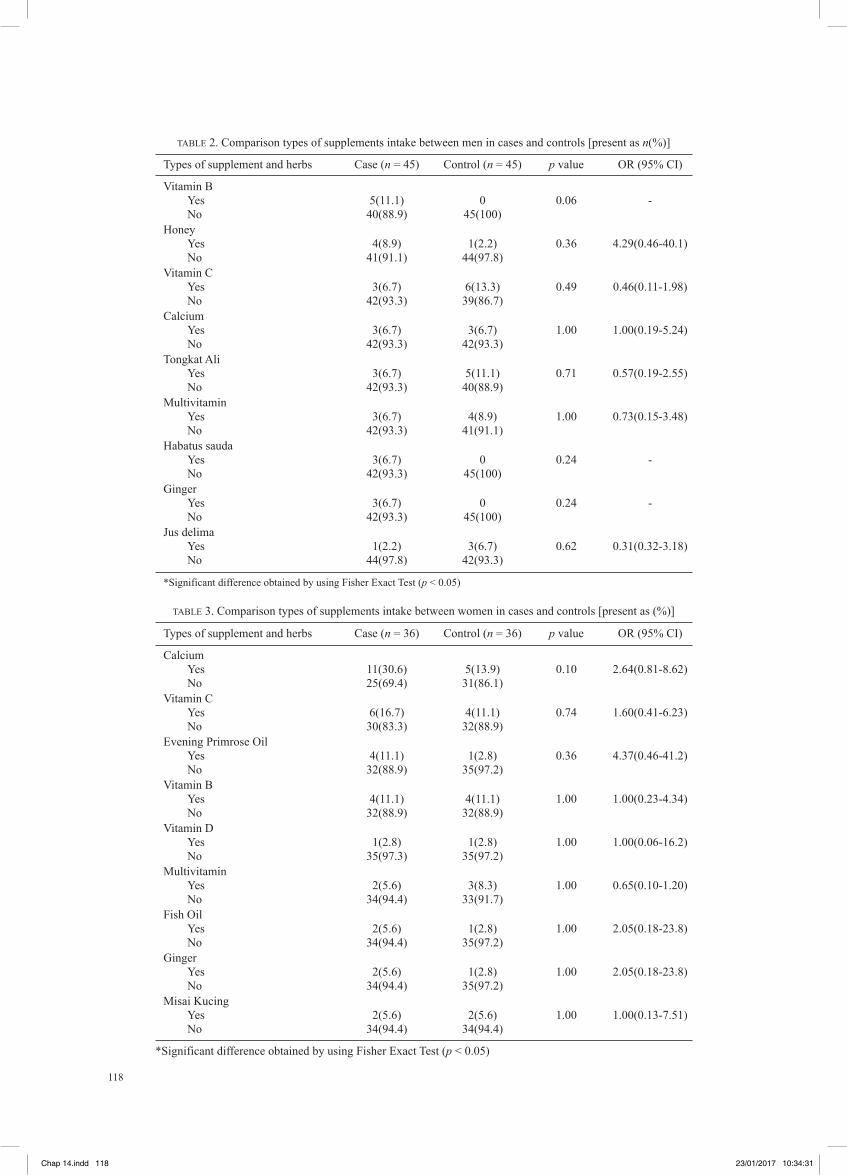
SUPPLEMENTS AND HERBS INTAKE
There were no significant differences in terms of types of supplements intake towards the risk of KSD; even though supplement intake was a risk factor for KSD as shown in Table 2. It is because this study only compared the types of supplements based on the highest consumption among case and control subjects. The same trend was shown by women subjects in which their types of supplement intake did not show any relationship with KSD (Table 3).
ANTHROPOMETRY DATA
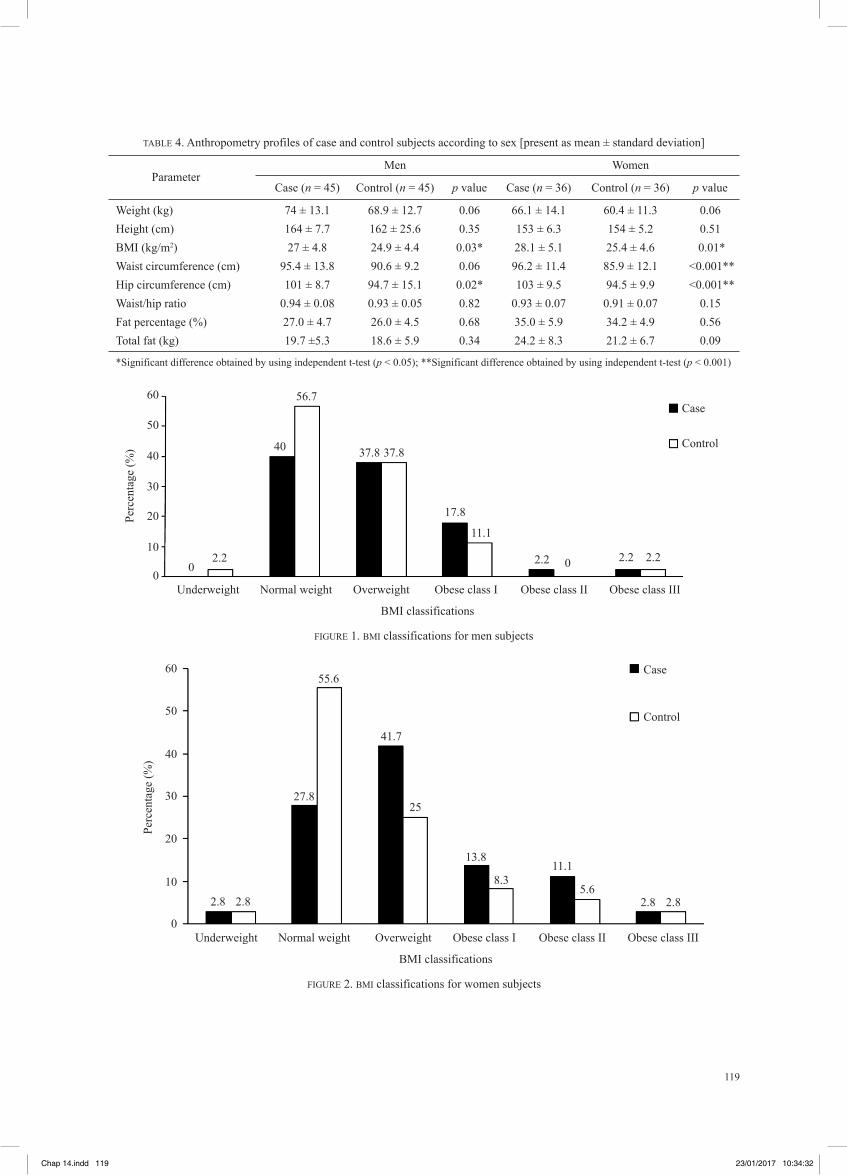
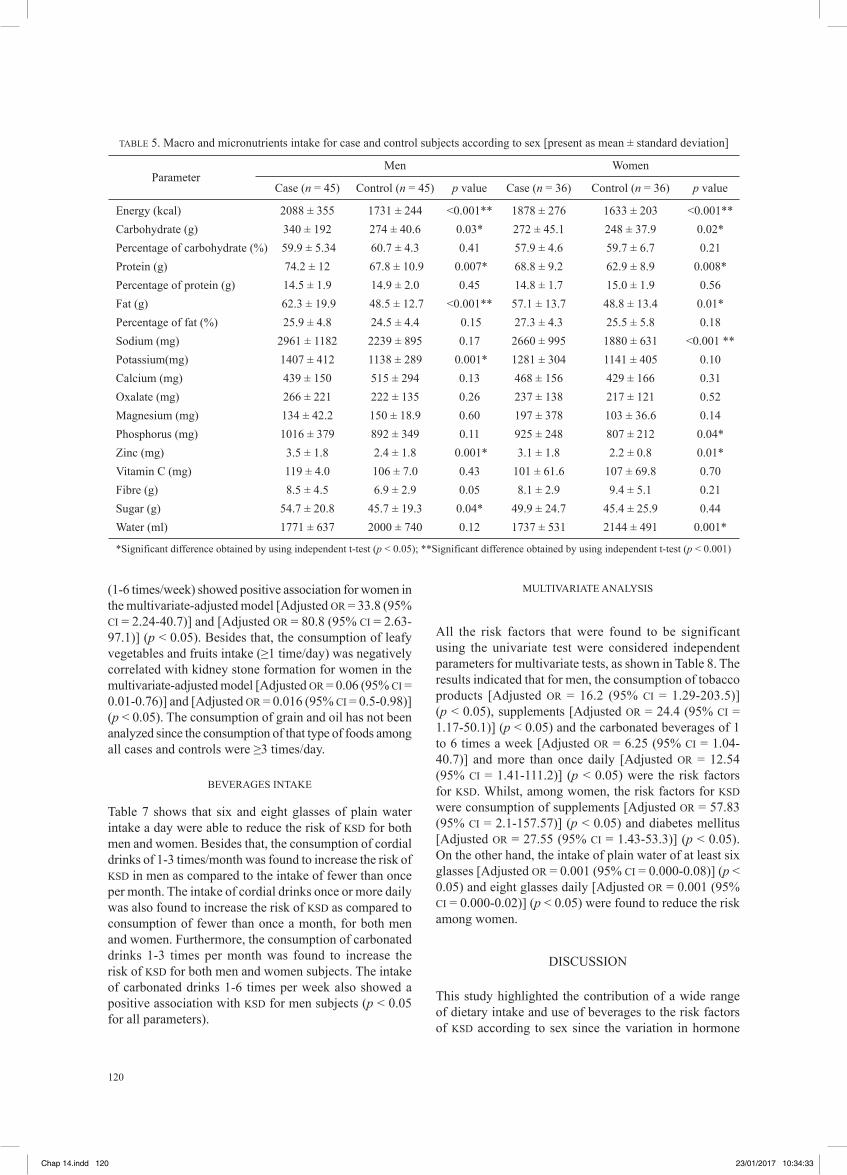
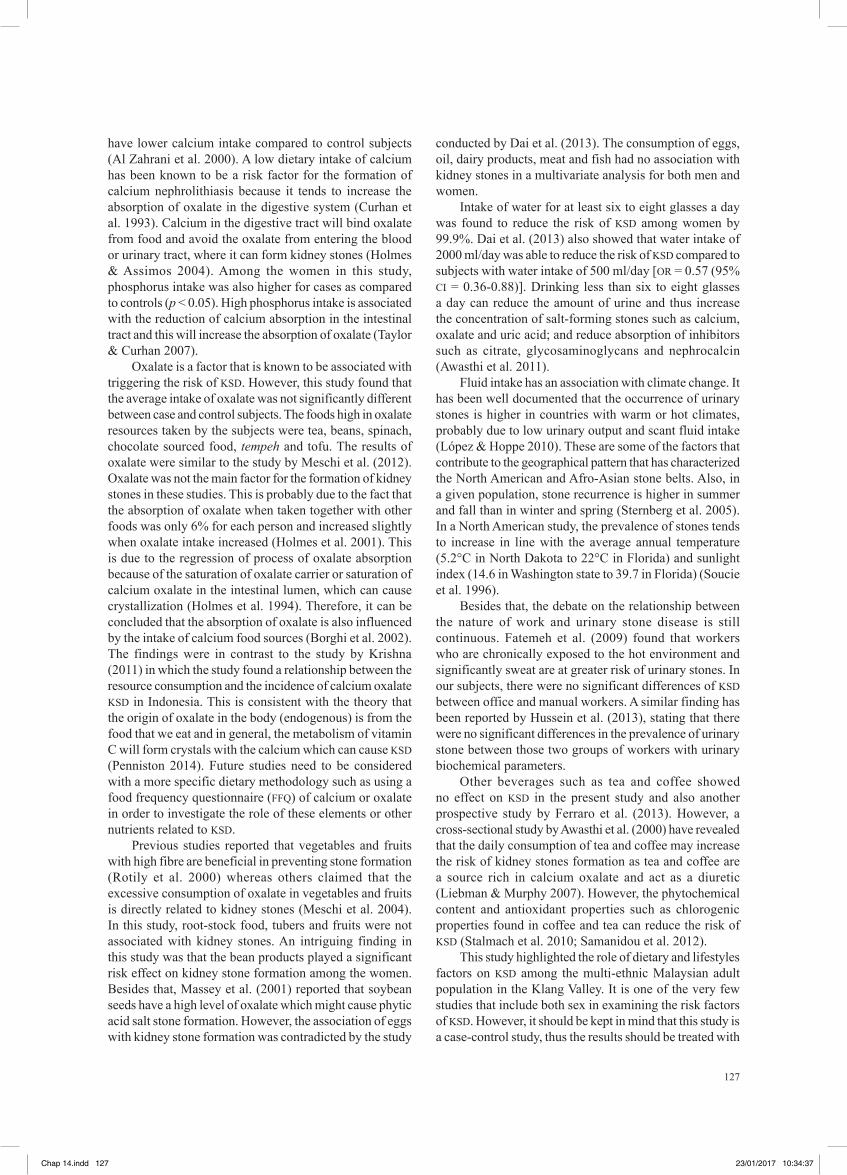
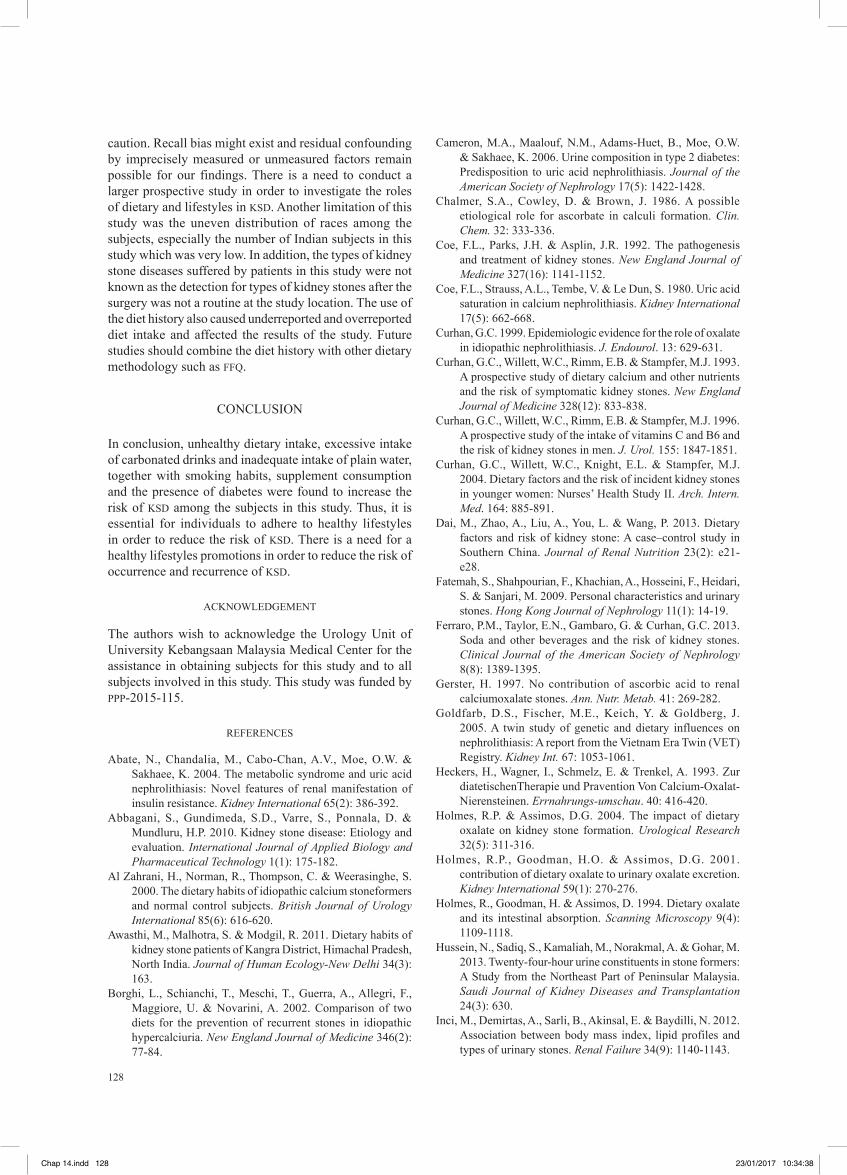
As shown in Table 4, BMI and hip circumference were significantly higher in cases as compared to controls in both men and women; and the waist circumference was significantly higher in women cases compared to controls (p < 0.05 for all parameters). Thus, most of the cases fall into the overweight and obesity categories as shown in Figure 1 and Figure 2.
With respect to food intake, the cases had a significantly higher intake of energy, carbohydrate, protein and fat as compared to controls (p < 0.05 for all parameters) (Table 5). Furthermore, among the men patients, the intake of potassium, zinc and sugar was significantly higher in cases compared to controls; whilst among the women patients, cases had a higher intake of sodium, phosphorus, zinc and water as compared to controls (p < 0.05 for all parameters).
FOODS INTAKE
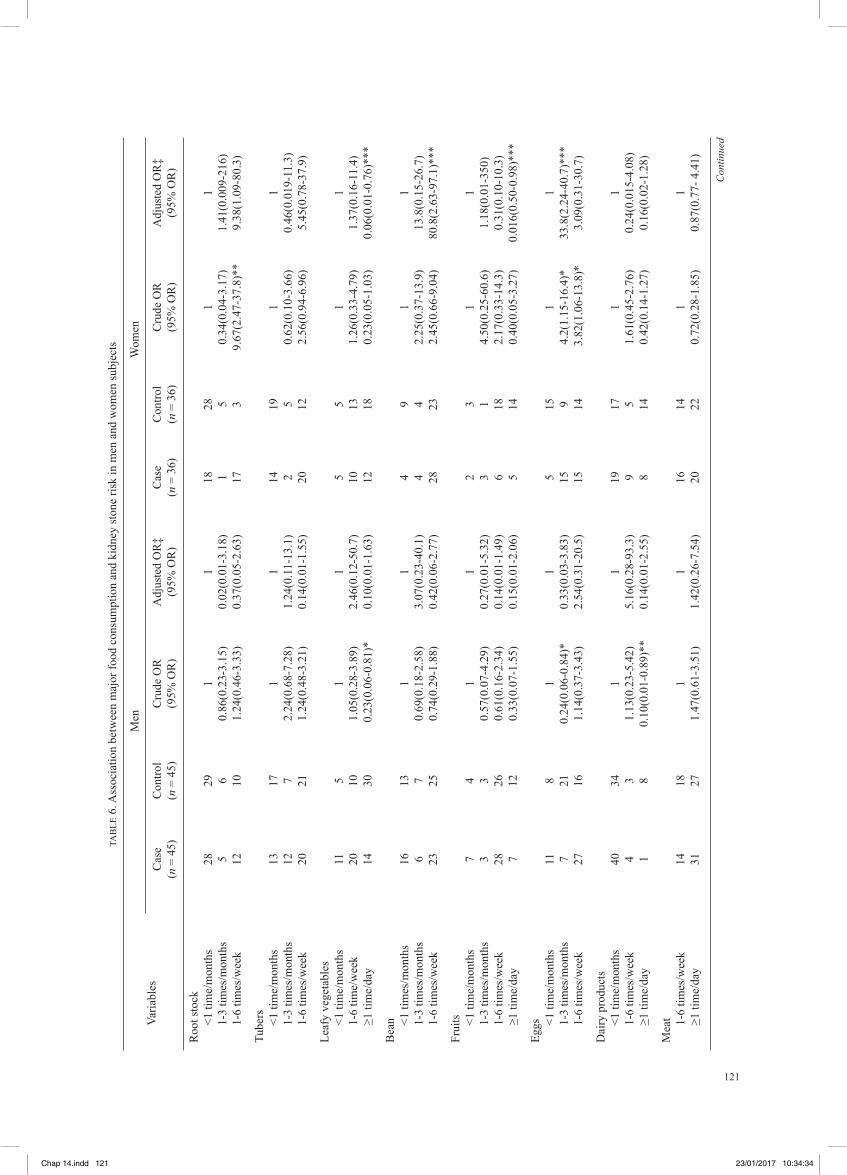
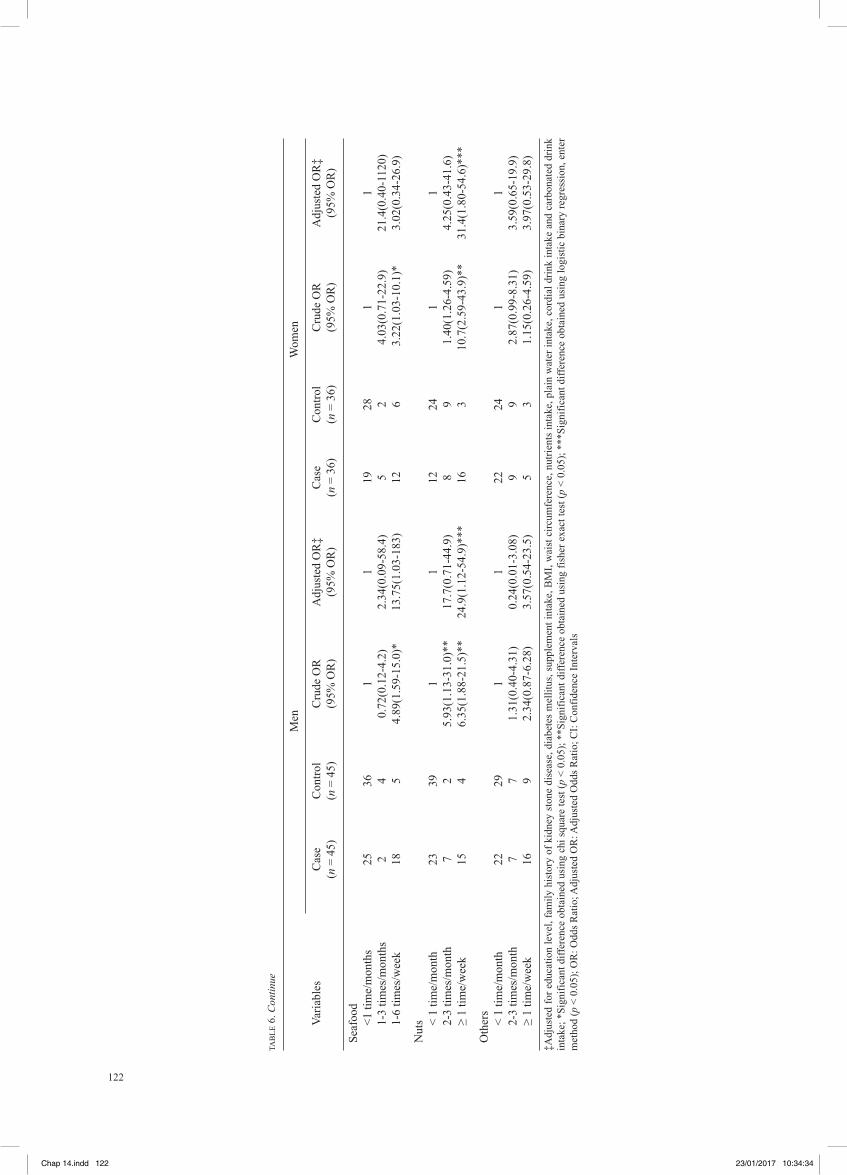
Table 6 shows the association of habitual foods intake with the risk of kidney stone formation among men and women. In an unadjusted analysis, the consumption of eggs, nuts and seafood was positively associated with KSD in both men and women. Dairy products and leafy vegetables intake were negatively associated with kidney stone formation in the unadjusted model for men. There was an association between the consumption of nuts (≥1 time/week) and kidney stone formation for men and women according to the multivariate-adjusted model [Adjusted OR = 24.9 (95% OR = 1.12-54.9)] and [Adjusted OR = 31.4 (95% CI = 1.80-54.6)] (p < 0.05); while eggs (1-3 times/month) and beans
Chap 14.indd 115 23/01/2017 10:34:30
116
TAB
LE 1
. Soc
iode
mog
raph
ic a
nd h
ealth
pro
files
of c
ases
and
con
trols
acc
ordi
ng to
sex
[pre
sent
as n
(%) o
r mea
n ±
stan
dard
dev
iatio
n]
Varia
bles
Men
Wom
en
C
ase
(n =
45)
C
ontro
l (n
= 45
) p
valu
e O
R (9
5% C
I)
Cas
e (n
= 3
6)
Con
trol (
n =
36)
p va
lue
OR
(95%
CI)
Et
hnic
Mal
ay
28(6
2.2)
28
(62.
2)
24(6
6.7)
24
(66.
7)
C
hine
se
15(3
3.3)
15
(33.
3)
- -
8(22
.2)
8(22
.2)
- -
Indi
an
2(4.
4)
2(4.
4)
4(11
.1)
4(11
.1)
R
elig
ion
Isla
m
28(6
2.2)
28
(62.
2)
24(6
6.7)
24
(66.
7)
B
uddh
a 15
(33.
3)
15(3
3.3)
-
- 8(
22.2
) 8(
22.2
) -
-
H
indu
2(
4.4)
2(
4.4)
4
(11.
1)
4(11
.1)
A
ge (y
ears
)
19
-29
1(2.
2)
1(2.
2)
1(2.
8)
1(2.
8)
30
-39
4(8.
9)
4(8.
9)
0 0
40-4
9 11
(24.
4)
11(2
4.4)
-
- 6(
16.7
) 6(
16.7
) -
-
50
-59
11(2
4.4)
11
(24.
4)
14(3
8.9)
14
(38.
9)
60
-69
11(2
4.4)
11
(24.
4)
9(25
) 9(
25.0
)
≥7
0 7(
15.5
) 7(
15.5
)
6(
16.7
) 6(
1.6.
7)
A
ge†
55.6
± 1
2.5
58.
4 ±
12.5
0.
28
- 58
± 1
0.3
57.8
± 9
.7
0.9
4 -
Ed
ucat
ion
leve
l
Lo
w
8(17
.8)
13(2
8.9)
0.
21
0.53
21
(58.
3)
11(3
0.6)
0.
02*
3.18
Hig
h 37
(82.
2)
32(7
1.1)
(0.1
9-1.
45)
15(4
1.7)
25
(69.
4)
(1
.21-
8.39
)
W
orki
ng st
atus
W
orki
ng
25(5
6.6)
24
(53.
3)
0.83
1.
09
4(66
.7)
29(8
0.6)
0.
18
0.48
Not
wor
king
20
(44.
4)
21(4
6.7)
(0.4
8-2.
51)
12(3
3.3)
7(
19.4
)
(0.1
6-1.
42)
W
orki
ng e
nviro
nmen
t
O
ffice
21
(46.
7)
23(5
1.1)
12
(33.
3)
14(3
8.9)
Out
stat
ion
22(4
8.9)
20
(44.
4)
0.67
1.
19
4(11
.1)
4(11
.1)
1.00
1.
0
Fi
eld
wor
k 2(
4.4)
2(
4.4)
(0.5
2-2.
73)
0 0
(0
.23-
4.35
)
H
ome
0 0
20(5
5.6)
18
(50)
Fa
mily
his
tory
of s
tone
dis
ease
Ye
s 18
(40)
8(
17.8
) 0.
02*
3.08
10
(27.
8)
4(11
.1)
0.13
3.
07
No
27(6
0)
37(8
2.2)
(1.1
7-8.
13)
26(7
2.2)
32
(88.
9)
(0
.86-
10.9
)
D
iabe
tes M
ellit
us
Ye
s 16
(35.
6)
11(2
4.4)
0.
25
1.70
17
(47.
2)
8(22
.2)
0.02
* 3.
13
N
o 29
(64.
4)
34(7
5.6)
(0.6
8-4.
25)
19(5
.8)
28(7
7.8)
(1.1
2-8.
71)
Con
tinue
d
Chap 14.indd 116 23/01/2017 10:34:30
117
Varia
bles
Men
Wom
en
C
ase
(n =
45)
C
ontro
l (n
= 45
) p
valu
e O
R (9
5% C
I)
Cas
e (n
= 3
6)
Con
trol (
n =
36)
p va
lue
OR
(95%
CI)
H
yper
tens
ion
Yes
20(4
4.4)
19
(42.
2)
0.83
1.
09
21(5
8.3)
15
(41.
7)
0.15
1.
96
N
o 25
(55.
6)
26(5
7.8)
(0.4
7-2.
52)
15(4
1.7)
21
(58.
3)
(0
.77-
5.00
)
D
yslip
idem
ia
Ye
s 16
(35.
6)
11(2
4.4)
0.
25
1.7
15(4
1.7)
12
(33.
3)
0.46
1.
43
N
o 29
(64.
4)
34(7
5.6)
(0.6
8-4.
25)
21(5
8.3)
24
(66.
7)
(0
.55-
3.73
)
H
eart
Dis
ease
Yes
4(8.
9)
3(6.
7)
0.69
1.
36
2(5.
6)
4(11
.1)
0.39
0.
47
N
o 41
(91.
1)
42(9
3.3)
(0.2
8-6.
48)
34(9
4.4)
32
(88.
9)
(0
.08-
2.75
)
G
out
Yes
6(13
.3)
4(8.
9)
0.71
1.
58
3(8.
3)
1(2.
8)
0.61
3.
18
N
o 39
(86.
7)
41(9
1.1)
(0.4
1-6.
01)
33(9
1.7)
35
(97.
2)
(0
.32-
32.1
)
Sm
okin
g ha
bit
Yes
20(4
4.5)
12
(26.
7)
0.08
2.
2 -
- -
-
N
o 25
(55.
6)
33(7
3.4)
(0.9
1-5.
33)
A
mou
nt o
f cig
aret
tes
≤ 20
pie
ces
18(9
0)
11(9
1.7)
1.
0 1.
22
- -
- -
>20
piec
es
2(10
) 1(
8.3)
(0.0
9-15
.1)
A
lcoh
ol c
onsu
mpt
ion
Yes
10(2
2.3)
6(
13.4
) 0.
27
1.86
-
- -
-
N
o 35
(77.
8)
39(8
6.6)
(0.6
1-5.
64)
Su
pple
men
t int
ake
Yes
29(6
4.4)
20
(44.
4)
0.06
2.
26
26(7
2.2)
16
(44.
4)
0.02
* 3.
25
N
o 16
(35.
6)
25(5
5.6)
(0.9
7-5.
29)
10(2
7.8)
20
(55.
6)
(1
.22-
8.67
)
Phys
ical
act
ivity
leve
l
Lo
w
12(2
6.7)
11
(24.
4)
0.8
1.12
8(
22.2
) 5(
13.9
) 0.
36
1.77
Hig
h 3(
73.3
) 34
(75.
6)
0.96
(0
.44-
1.21
) 28
(77.
8)
31(8
6.1)
0.
34
(0.5
2-6.
05)
To
tal M
ET/m
in p
er w
eek†
21
26
2098
0.
60
2339
28
32
0.25
-
± 22
93
± 26
91
- ±1
700
±191
7
†M
ean
± SD
; *Si
gnifi
cant
diff
eren
ce o
btai
ned
usin
g ch
i squ
are
test
(p <
0.0
5); O
R: O
dds R
atio
; CI:
Con
fiden
ce In
terv
als,
(-):
no v
alue
; MET
: Met
abol
ic E
quiv
alen
t of T
ask
TAB
LE 1
. Con
tinue
Chap 14.indd 117 23/01/2017 10:34:31
118
TABLE 2. Comparison types of supplements intake between men in cases and controls [present as n(%)]
Types of supplement and herbs Case (n = 45) Control (n = 45) p value OR (95% CI) Vitamin B Yes 5(11.1) 0 0.06 - No 40(88.9) 45(100) Honey Yes 4(8.9) 1(2.2) 0.36 4.29(0.46-40.1) No 41(91.1) 44(97.8) Vitamin C Yes 3(6.7) 6(13.3) 0.49 0.46(0.11-1.98) No 42(93.3) 39(86.7) Calcium Yes 3(6.7) 3(6.7) 1.00 1.00(0.19-5.24) No 42(93.3) 42(93.3) Tongkat Ali Yes 3(6.7) 5(11.1) 0.71 0.57(0.19-2.55) No 42(93.3) 40(88.9) Multivitamin Yes 3(6.7) 4(8.9) 1.00 0.73(0.15-3.48) No 42(93.3) 41(91.1) Habatus sauda Yes 3(6.7) 0 0.24 - No 42(93.3) 45(100) Ginger Yes 3(6.7) 0 0.24 - No 42(93.3) 45(100) Jus delima Yes 1(2.2) 3(6.7) 0.62 0.31(0.32-3.18) No 44(97.8) 42(93.3)
*Significant difference obtained by using Fisher Exact Test (p < 0.05)
TABLE 3. Comparison types of supplements intake between women in cases and controls [present as (%)]
Types of supplement and herbs Case (n = 36) Control (n = 36) p value OR (95% CI) Calcium Yes 11(30.6) 5(13.9) 0.10 2.64(0.81-8.62) No 25(69.4) 31(86.1) Vitamin C Yes 6(16.7) 4(11.1) 0.74 1.60(0.41-6.23) No 30(83.3) 32(88.9) Evening Primrose Oil Yes 4(11.1) 1(2.8) 0.36 4.37(0.46-41.2) No 32(88.9) 35(97.2) Vitamin B Yes 4(11.1) 4(11.1) 1.00 1.00(0.23-4.34) No 32(88.9) 32(88.9) Vitamin D Yes 1(2.8) 1(2.8) 1.00 1.00(0.06-16.2) No 35(97.3) 35(97.2) Multivitamin Yes 2(5.6) 3(8.3) 1.00 0.65(0.10-1.20) No 34(94.4) 33(91.7) Fish Oil Yes 2(5.6) 1(2.8) 1.00 2.05(0.18-23.8) No 34(94.4) 35(97.2) Ginger Yes 2(5.6) 1(2.8) 1.00 2.05(0.18-23.8) No 34(94.4) 35(97.2) Misai Kucing Yes 2(5.6) 2(5.6) 1.00 1.00(0.13-7.51) No 34(94.4) 34(94.4)
*Significant difference obtained by using Fisher Exact Test (p < 0.05)
Chap 14.indd 118 23/01/2017 10:34:31
119
TABLE 4. Anthropometry profiles of case and control subjects according to sex [present as mean ± standard deviation]
Parameter
Men Women
Case (n = 45) Control (n = 45) p value Case (n = 36) Control (n = 36) p value
Weight (kg) 74 ± 13.1 68.9 ± 12.7 0.06 66.1 ± 14.1 60.4 ± 11.3 0.06 Height (cm) 164 ± 7.7 162 ± 25.6 0.35 153 ± 6.3 154 ± 5.2 0.51 BMI (kg/m2) 27 ± 4.8 24.9 ± 4.4 0.03* 28.1 ± 5.1 25.4 ± 4.6 0.01* Waist circumference (cm) 95.4 ± 13.8 90.6 ± 9.2 0.06 96.2 ± 11.4 85.9 ± 12.1 <0.001** Hip circumference (cm) 101 ± 8.7 94.7 ± 15.1 0.02* 103 ± 9.5 94.5 ± 9.9 <0.001** Waist/hip ratio 0.94 ± 0.08 0.93 ± 0.05 0.82 0.93 ± 0.07 0.91 ± 0.07 0.15 Fat percentage (%) 27.0 ± 4.7 26.0 ± 4.5 0.68 35.0 ± 5.9 34.2 ± 4.9 0.56 Total fat (kg) 19.7 ±5.3 18.6 ± 5.9 0.34 24.2 ± 8.3 21.2 ± 6.7 0.09
*Significant difference obtained by using independent t-test (p < 0.05); **Significant difference obtained by using independent t-test (p < 0.001)
FIGURE 1. BMI classifications for men subjects
Case60
50
Underweight
Perc
enta
ge (%
)
02.2
40
56.7
37.8 37.8
17.8
11.1
2.2 0 2.2 2.2
Normal weight Overweight
BMI classifications
Obese class I Obese class II Obese class III
40
30
20
10
0
Control
FIGURE 2. BMI classifications for women subjects
Case60
50
Underweight
Perc
enta
ge (%
)
2.8 2.8
27.8
55.6
41.7
25
13.8
8.311.1
5.62.8 2.8
Normal weight Overweight
BMI classifications
Obese class I Obese class II Obese class III
40
30
20
10
0
Control
Chap 14.indd 119 23/01/2017 10:34:32
120
TABLE 5. Macro and micronutrients intake for case and control subjects according to sex [present as mean ± standard deviation]
Parameter
Men Women
Case (n = 45) Control (n = 45) p value Case (n = 36) Control (n = 36) p value
Energy (kcal) 2088 ± 355 1731 ± 244 <0.001** 1878 ± 276 1633 ± 203 <0.001** Carbohydrate (g) 340 ± 192 274 ± 40.6 0.03* 272 ± 45.1 248 ± 37.9 0.02* Percentage of carbohydrate (%) 59.9 ± 5.34 60.7 ± 4.3 0.41 57.9 ± 4.6 59.7 ± 6.7 0.21 Protein (g) 74.2 ± 12 67.8 ± 10.9 0.007* 68.8 ± 9.2 62.9 ± 8.9 0.008* Percentage of protein (g) 14.5 ± 1.9 14.9 ± 2.0 0.45 14.8 ± 1.7 15.0 ± 1.9 0.56 Fat (g) 62.3 ± 19.9 48.5 ± 12.7 <0.001** 57.1 ± 13.7 48.8 ± 13.4 0.01* Percentage of fat (%) 25.9 ± 4.8 24.5 ± 4.4 0.15 27.3 ± 4.3 25.5 ± 5.8 0.18 Sodium (mg) 2961 ± 1182 2239 ± 895 0.17 2660 ± 995 1880 ± 631 <0.001 ** Potassium(mg) 1407 ± 412 1138 ± 289 0.001* 1281 ± 304 1141 ± 405 0.10 Calcium (mg) 439 ± 150 515 ± 294 0.13 468 ± 156 429 ± 166 0.31 Oxalate (mg) 266 ± 221 222 ± 135 0.26 237 ± 138 217 ± 121 0.52 Magnesium (mg) 134 ± 42.2 150 ± 18.9 0.60 197 ± 378 103 ± 36.6 0.14 Phosphorus (mg) 1016 ± 379 892 ± 349 0.11 925 ± 248 807 ± 212 0.04* Zinc (mg) 3.5 ± 1.8 2.4 ± 1.8 0.001* 3.1 ± 1.8 2.2 ± 0.8 0.01* Vitamin C (mg) 119 ± 4.0 106 ± 7.0 0.43 101 ± 61.6 107 ± 69.8 0.70 Fibre (g) 8.5 ± 4.5 6.9 ± 2.9 0.05 8.1 ± 2.9 9.4 ± 5.1 0.21 Sugar (g) 54.7 ± 20.8 45.7 ± 19.3 0.04* 49.9 ± 24.7 45.4 ± 25.9 0.44 Water (ml) 1771 ± 637 2000 ± 740 0.12 1737 ± 531 2144 ± 491 0.001*
*Significant difference obtained by using independent t-test (p < 0.05); **Significant difference obtained by using independent t-test (p < 0.001)
(1-6 times/week) showed positive association for women in the multivariate-adjusted model [Adjusted OR = 33.8 (95% CI = 2.24-40.7)] and [Adjusted OR = 80.8 (95% CI = 2.63-97.1)] (p < 0.05). Besides that, the consumption of leafy vegetables and fruits intake (≥1 time/day) was negatively correlated with kidney stone formation for women in the multivariate-adjusted model [Adjusted OR = 0.06 (95% CI = 0.01-0.76)] and [Adjusted OR = 0.016 (95% CI = 0.5-0.98)] (p < 0.05). The consumption of grain and oil has not been analyzed since the consumption of that type of foods among all cases and controls were ≥3 times/day.
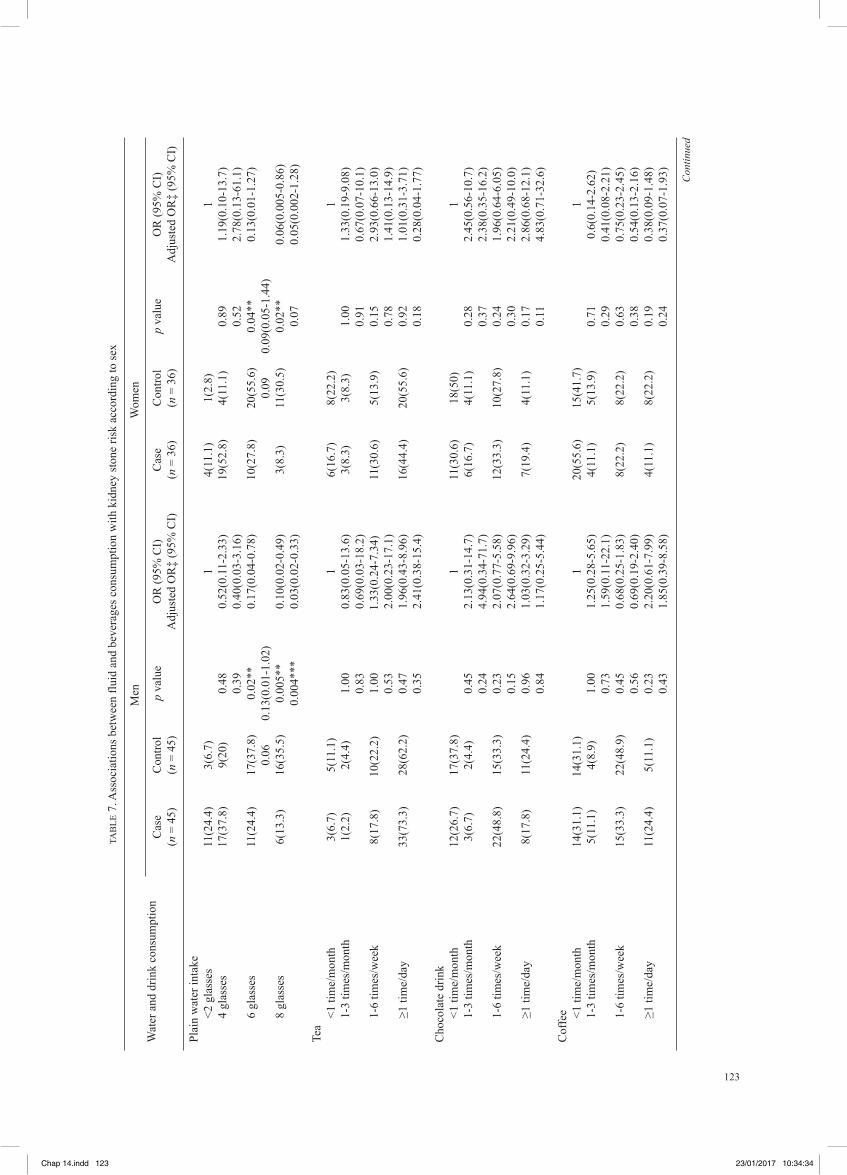
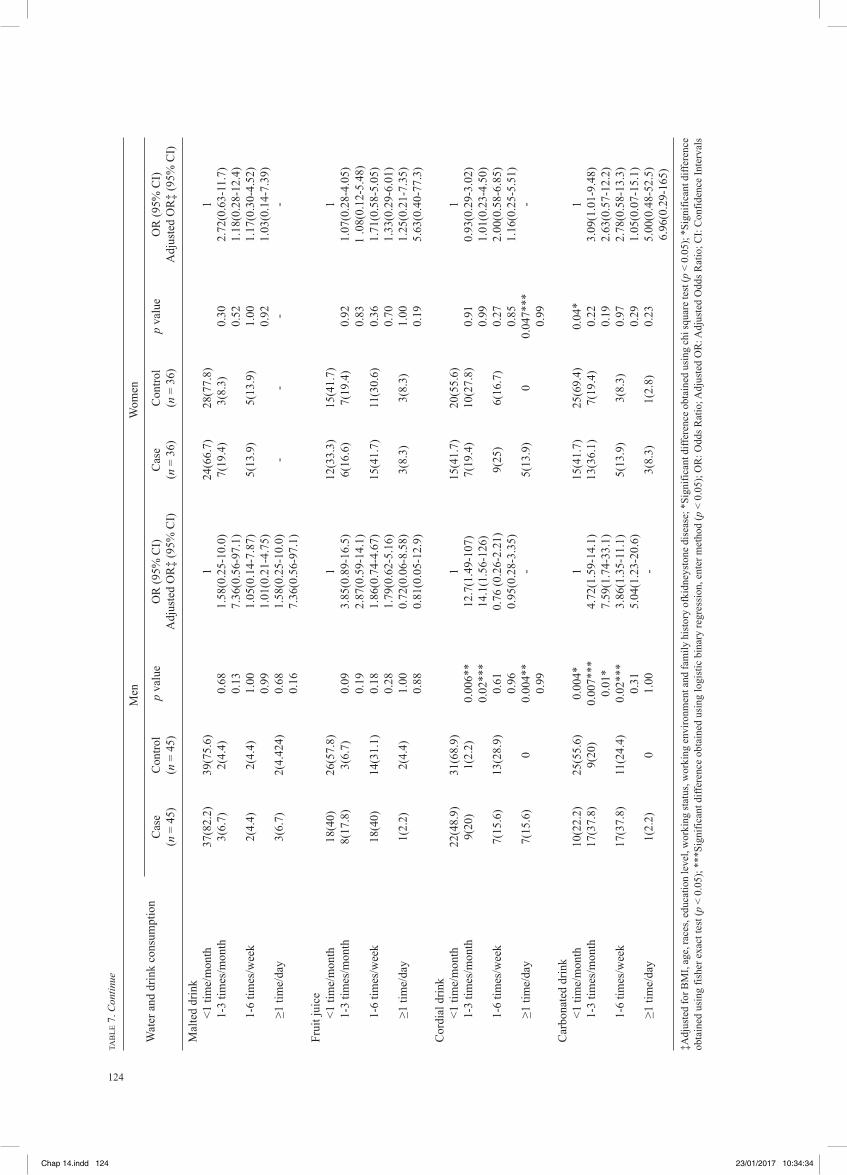
BEVERAGES INTAKE
Table 7 shows that six and eight glasses of plain water intake a day were able to reduce the risk of KSD for both men and women. Besides that, the consumption of cordial drinks of 1-3 times/month was found to increase the risk of KSD in men as compared to the intake of fewer than once per month. The intake of cordial drinks once or more daily was also found to increase the risk of KSD as compared to consumption of fewer than once a month, for both men and women. Furthermore, the consumption of carbonated drinks 1-3 times per month was found to increase the risk of KSD for both men and women subjects. The intake of carbonated drinks 1-6 times per week also showed a positive association with KSD for men subjects (p < 0.05 for all parameters).
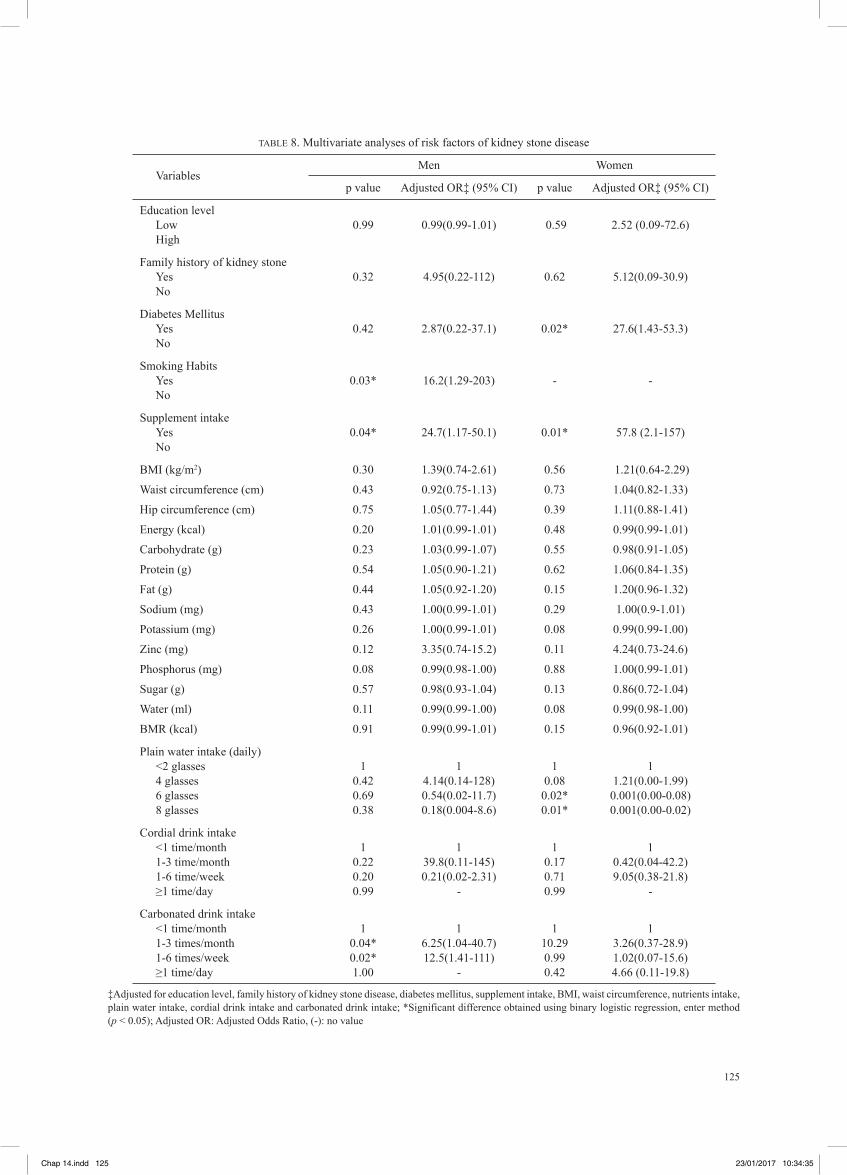
MULTIVARIATE ANALYSIS
All the risk factors that were found to be significant using the univariate test were considered independent parameters for multivariate tests, as shown in Table 8. The results indicated that for men, the consumption of tobacco products [Adjusted OR = 16.2 (95% CI = 1.29-203.5)] (p < 0.05), supplements [Adjusted OR = 24.4 (95% CI = 1.17-50.1)] (p < 0.05) and the carbonated beverages of 1 to 6 times a week [Adjusted OR = 6.25 (95% CI = 1.04-40.7)] and more than once daily [Adjusted OR = 12.54 (95% CI = 1.41-111.2)] (p < 0.05) were the risk factors for KSD. Whilst, among women, the risk factors for KSD were consumption of supplements [Adjusted OR = 57.83 (95% CI = 2.1-157.57)] (p < 0.05) and diabetes mellitus [Adjusted OR = 27.55 (95% CI = 1.43-53.3)] (p < 0.05). On the other hand, the intake of plain water of at least six glasses [Adjusted OR = 0.001 (95% CI = 0.000-0.08)] (p < 0.05) and eight glasses daily [Adjusted OR = 0.001 (95% CI = 0.000-0.02)] (p < 0.05) were found to reduce the risk among women.
DISCUSSION
This study highlighted the contribution of a wide range of dietary intake and use of beverages to the risk factors of KSD according to sex since the variation in hormone
Chap 14.indd 120 23/01/2017 10:34:33
121
TAB
LE 6
. Ass
ocia
tion
betw
een
maj
or fo
od c
onsu
mpt
ion
and
kidn
ey st
one
risk
in m
en a
nd w
omen
subj
ects
M
en
Wom
en
Varia
bles
C
ase
Con
trol
Cru
de O
R
Adj
uste
d O
R‡
Cas
e C
ontro
l C
rude
OR
A
djus
ted
OR
‡
(n =
45)
(n
= 4
5)
(95%
OR
) (9
5% O
R)
(n =
36)
(n
= 3
6)
(95%
OR
) (9
5% O
R)
R
oot s
tock
<1 ti
me/
mon
ths
28
29
1 1
18
28
1 1
1-3
times
/mon
ths
5 6
0.86
(0.2
3-3.
15)
0.02
(0.0
1-3.
18)
1 5
0.34
(0.0
4-3.
17)
1.41
(0.0
09-2
16)
1-6
times
/wee
k 12
10
1.
24(0
.46-
3.33
) 0.
37(0
.05-
2.63
) 17
3
9.67
(2.4
7-37
.8)*
* 9.
38(1
.09-
80.3
)
Tu
bers
<1 ti
me/
mon
ths
13
17
1 1
14
19
1 1
1-3
times
/mon
ths
12
7 2.
24(0
.68-
7.28
) 1.
24(0
.11-
13.1
) 2
5 0.
62(0
.10-
3.66
) 0.
46(0
.019
-11.
3)
1-
6 tim
es/w
eek
20
21
1.24
(0.4
8-3.
21)
0.14
(0.0
1-1.
55)
20
12
2.56
(0.9
4-6.
96)
5.45
(0.7
8-37
.9)
Le
afy
vege
tabl
es
<1
tim
e/m
onth
s 11
5
1 1
5 5
1 1
1-6
time/
wee
k 20
10
1.
05(0
.28-
3.89
) 2.
46(0
.12-
50.7
) 10
13
1.
26(0
.33-
4.79
) 1.
37(0
.16-
11.4
)
≥1
tim
e/da
y 14
30
0
.23(
0.06
-0.8
1)*
0.10
(0.0
1-1.
63)
12
18
0.23
(0.0
5-1.
03)
0.06
(0.0
1-0.
76)*
**
B
ean
<1 ti
mes
/mon
ths
16
13
1 1
4 9
1 1
1-3
times
/mon
ths
6 7
0.69
(0.1
8-2.
58)
3.07
(0.2
3-40
.1)
4 4
2.25
(0.3
7-13
.9)
13.8
(0.1
5-26
.7)
1-6
times
/wee
k 23
25
0.
74(0
.29-
1.88
) 0.
42(0
.06-
2.77
) 28
23
2.
45(0
.66-
9.04
) 80
.8(2
.63-
97.1
)***
Fr
uits
<1 ti
me/
mon
ths
7 4
1 1
2 3
1 1
1-3
times
/mon
ths
3 3
0.57
(0.0
7-4.
29)
0.27
(0.0
1-5.
32)
3 1
4.50
(0.2
5-60
.6)
1.18
(0.0
1-35
0)
1-
6 tim
es/w
eek
28
26
0.61
(0.1
6-2.
34)
0.14
(0.0
1-1.
49)
6 18
2.
17(0
.33-
14.3
) 0.
31(0
.10-
10.3
)
≥1
tim
e/da
y 7
12
0.33
(0.0
7-1.
55)
0.15
(0.0
1-2.
06)
5 14
0.
40(0
.05-
3.27
) 0.
016(
0.50
-0.9
8)**
*
Eg
gs
<1
tim
e/m
onth
s 11
8
1 1
5 15
1
1
1-
3 tim
es/m
onth
s 7
21
0.24
(0.0
6-0.
84)*
0.
33(0
.03-
3.83
) 15
9
4.2(
1.15
-16.
4)*
33.8
(2.2
4-40
.7)*
**
1-
6 tim
es/w
eek
27
16
1.14
(0.3
7-3.
43)
2.54
(0.3
1-20
.5)
15
14
3.8
2(1.
06-1
3.8)
* 3.
09(0
.31-
30.7
)
D
airy
pro
duct
s
<1
tim
e/m
onth
s 40
34
1
1 19
17
1
1
1-
6 tim
es/w
eek
4 3
1.13
(0.2
3-5.
42)
5.16
(0.2
8-93
.3)
9 5
1.61
(0.4
5-2.
76)
0.24
(0.0
15-4
.08)
≥1 ti
me/
day
1
8 0.
10(0
.01-
0.89
)**
0.14
(0.0
1-2.
55)
8 14
0.
42(0
.14-
1.27
) 0.
16(0
.02-
1.28
)
M
eat
1-6
times
/wee
k 14
18
1
1 16
14
1
1
≥1
tim
e/da
y
31
27
1.47
(0.6
1-3.
51)
1.42
(0.2
6-7.
54)
20
22
0.72
(0.2
8-1.
85)
0.87
(0.7
7- 4
.41)
Con
tinue
d
Chap 14.indd 121 23/01/2017 10:34:34
122
M
en
Wom
en
Varia
bles
C
ase
Con
trol
Cru
de O
R
Adj
uste
d O
R‡
Cas
e C
ontro
l C
rude
OR
A
djus
ted
OR
‡
(n =
45)
(n
= 4
5)
(95%
OR
) (9
5% O
R)
(n =
36)
(n
= 3
6)
(95%
OR
) (9
5% O
R)
Se
afoo
d
<1
tim
e/m
onth
s 25
36
1
1 19
28
1
1
1-
3 tim
es/m
onth
s 2
4 0.
72(0
.12-
4.2)
2.
34(0
.09-
58.4
) 5
2 4.
03(0
.71-
22.9
) 21
.4(0
.40-
1120
)
1-
6 tim
es/w
eek
18
5 4.
89(1
.59-
15.0
)*
13.7
5(1.
03-1
83)
12
6 3
.22(
1.03
-10.
1)*
3.02
(0.3
4-26
.9)
N
uts
< 1
time/
mon
th
23
39
1 1
12
24
1 1
2-3
times
/mon
th
7 2
5.93
(1.1
3-31
.0)*
* 17
.7(0
.71-
44.9
) 8
9 1.
40(1
.26-
4.59
) 4.
25(0
.43-
41.6
)
≥
1 tim
e/w
eek
15
4 6.
35(1
.88-
21.5
)**
24.9
(1.1
2-54
.9)*
**
16
3 10
.7(2
.59-
43.9
)**
31.4
(1.8
0-54
.6)*
**
O
ther
s
<
1 tim
e/m
onth
22
29
1
1 22
24
1
1
2-
3 tim
es/m
onth
7
7 1.
31(0
.40-
4.31
) 0.
24(0
.01-
3.08
) 9
9 2.
87(0
.99-
8.31
) 3.
59(0
.65-
19.9
)
≥
1 tim
e/w
eek
16
9 2.
34(0
.87-
6.28
) 3.
57(0
.54-
23.5
) 5
3 1.
15(0
.26-
4.59
) 3.
97(0
.53-
29.8
)
‡Adj
uste
d fo
r edu
catio
n le
vel,
fam
ily h
isto
ry o
f kid
ney
ston
e di
seas
e, d
iabe
tes
mel
litus
, sup
plem
ent i
ntak
e, B
MI,
wai
st c
ircum
fere
nce,
nut
rient
s in
take
, pla
in w
ater
inta
ke, c
ordi
al d
rink
inta
ke a
nd c
arbo
nate
d dr
ink
inta
ke; *
Sign
ifica
nt d
iffer
ence
obt
aine
d us
ing
chi s
quar
e te
st (p
< 0
.05)
; **S
igni
fican
t diff
eren
ce o
btai
ned
usin
g fis
her e
xact
test
(p <
0.0
5); *
**Si
gnifi
cant
diff
eren
ce o
btai
ned
usin
g lo
gist
ic b
inar
y re
gres
sion
, ent
er
met
hod
(p <
0.0
5); O
R: O
dds R
atio
; Adj
uste
d O
R: A
djus
ted
Odd
s Rat
io; C
I: C
onfid
ence
Inte
rval
s
TAB
LE 6
. Con
tinue
Chap 14.indd 122 23/01/2017 10:34:34
123
TAB
LE 7
. Ass
ocia
tions
bet
wee
n flu
id a
nd b
ever
ages
con
sum
ptio
n w
ith k
idne
y st
one
risk
acco
rdin
g to
sex
M
en
W
omen
W
ater
and
drin
k co
nsum
ptio
n C
ase
Con
trol
p va
lue
OR
(95%
CI)
C
ase
Con
trol
p va
lue
OR
(95%
CI)
(n
= 4
5)
(n =
45)
Adj
uste
d O
R‡
(95%
CI)
(n
= 3
6)
(n =
36)
Adj
uste
d O
R‡
(95%
CI)
Pl
ain
wat
er in
take
<2
gla
sses
11
(24.
4)
3(6.
7)
1
4(11
.1)
1(2.
8)
1
4 gl
asse
s 17
(37.
8)
9(20
) 0.
48
0.52
(0.1
1-2.
33)
19(5
2.8)
4(
11.1
) 0.
89
1.19
(0.1
0-13
.7)
0.
39
0.40
(0.0
3-3.
16)
0.52
2.
78(0
.13-
61.1
)
6
glas
ses
11(2
4.4)
17
(37.
8)
0.02
**
0.17
(0.0
4-0.
78)
10(2
7.8)
20
(55.
6)
0.04
**
0.13
(0.0
1-1.
27)
0.
06
0.13
(0.0
1-1.
02)
0.09
0.
09(0
.05-
1.44
)
8
glas
ses
6(13
.3)
16(3
5.5)
0.
005*
* 0.
10(0
.02-
0.49
) 3(
8.3)
11
(30.
5)
0.02
**
0.06
(0.0
05-0
.86)
0.
004*
**
0.03
(0.0
2-0.
33)
0.07
0.
05(0
.002
-1.2
8)
Te
a
<1
tim
e/m
onth
3(
6.7)
5(
11.1
)
1 6(
16.7
) 8(
22.2
)
1
1-
3 tim
es/m
onth
1(
2.2)
2(
4.4)
1.
00
0.83
(0.0
5-13
.6)
3(8.
3)
3(8.
3)
1.00
1.
33(0
.19-
9.08
)
0.83
0.
69(0
.03-
18.2
)
0.
91
0.67
(0.0
7-10
.1)
1-6
times
/wee
k 8(
17.8
) 10
(22.
2)
1.00
1.
33(0
.24-
7.34
) 11
(30.
6)
5(13
.9)
0.15
2.
93(0
.66-
13.0
)
0.53
2.
00(0
.23-
17.1
)
0.
78
1.41
(0.1
3-14
.9)
≥1 ti
me/
day
33(7
3.3)
28
(62.
2)
0.47
1.
96(0
.43-
8.96
) 16
(44.
4)
20(5
5.6)
0.
92
1.01
(0.3
1-3.
71)
0.
35
2.41
(0.3
8-15
.4)
0.18
0.
28(0
.04-
1.77
)
C
hoco
late
drin
k
<1
tim
e/m
onth
12
(26.
7)
17(3
7.8)
1 11
(30.
6)
18(5
0)
1
1-3
times
/mon
th
3(6.
7)
2(4.
4)
0.45
2.
13(0
.31-
14.7
) 6(
16.7
) 4(
11.1
) 0.
28
2.45
(0.5
6-10
.7)
0.
24
4.94
(0.3
4-71
.7)
0.37
2.
38(0
.35-
16.2
)
1-
6 tim
es/w
eek
22(4
8.8)
15
(33.
3)
0.23
2.
07(0
.77-
5.58
) 12
(33.
3)
10(2
7.8)
0.
24
1.96
(0.6
4-6.
05)
0.
15
2.64
(0.6
9-9.
96)
0.30
2.
21(0
.49-
10.0
)
≥1
tim
e/da
y 8(
17.8
) 11
(24.
4)
0.96
1.
03(0
.32-
3.29
) 7(
19.4
) 4(
11.1
) 0.
17
2.86
(0.6
8-12
.1)
0.
84
1.17
(0.2
5-5.
44)
0.11
4.
83(0
.71-
32.6
)
C
offe
e
<1
tim
e/m
onth
14
(31.
1)
14(3
1.1)
1 20
(55.
6)
15(4
1.7)
1
1-
3 tim
es/m
onth
5(
11.1
) 4(
8.9)
1.
00
1.25
(0.2
8-5.
65)
4(11
.1)
5(13
.9)
0.71
0.
6(0.
14-2
.62)
0.
73
1.59
(0.1
1-22
.1)
0.29
0.
41(0
.08-
2.21
)
1-
6 tim
es/w
eek
15(3
3.3)
22
(48.
9)
0.45
0.
68(0
.25-
1.83
) 8(
22.2
) 8(
22.2
) 0.
63
0.75
(0.2
3-2.
45)
0.
56
0.69
(0.1
9-2.
40)
0.38
0.
54(0
.13-
2.16
)
≥1
tim
e/da
y 11
(24.
4)
5(11
.1)
0.23
2.
20(0
.61-
7.99
) 4(
11.1
) 8(
22.2
) 0.
19
0.38
(0.0
9-1.
48)
0.
43
1.85
(0.3
9-8.
58)
0.24
0.
37(0
.07-
1.93
)
Con
tinue
d
Chap 14.indd 123 23/01/2017 10:34:34
124
M
en
W
omen
W
ater
and
drin
k co
nsum
ptio
n C
ase
Con
trol
p va
lue
OR
(95%
CI)
C
ase
Con
trol
p va
lue
OR
(95%
CI)
(n
= 4
5)
(n =
45)
Adj
uste
d O
R‡
(95%
CI)
(n
= 3
6)
(n =
36)
Adj
uste
d O
R‡
(95%
CI)
M
alte
d dr
ink
<1 ti
me/
mon
th
37(8
2.2)
39
(75.
6)
1
24(6
6.7)
28
(77.
8)
1
1-3
times
/mon
th
3(6.
7)
2(4.
4)
0.68
1.
58(0
.25-
10.0
) 7(
19.4
) 3(
8.3)
0.
30
2.72
(0.6
3-11
.7)
0.
13
7.36
(0.5
6-97
.1)
0.52
1.
18(0
.28-
12.4
)
1-
6 tim
es/w
eek
2(4.
4)
2(4.
4)
1.00
1.
05(0
.14-
7.87
) 5(
13.9
) 5(
13.9
) 1.
00
1.17
(0.3
0-4.
52)
0.
99
1.01
(0.2
1-4.
75)
0.92
1.
03(0
.14-
7.39
)
≥1
tim
e/da
y 3(
6.7)
2(
4.42
4)
0.68
1.
58(0
.25-
10.0
) -
- -
-
0.16
7.
36(0
.56-
97.1
)
Fr
uit j
uice
<1 ti
me/
mon
th
18(4
0)
26(5
7.8)
1 12
(33.
3)
15(4
1.7)
1
1-
3 tim
es/m
onth
8(
17.8
) 3(
6.7)
0.
09
3.85
(0.8
9-16
.5)
6(16
.6)
7(19
.4)
0.92
1.
07(0
.28-
4.05
)
0.19
2.
87(0
.59-
14.1
)
0.
83
1 .0
8(0.
12-5
.48)
1-6
times
/wee
k 18
(40)
14
(31.
1)
0.18
1.
86(0
.74-
4.67
) 15
(41.
7)
11(3
0.6)
0.
36
1.71
(0.5
8-5.
05)
0.
28
1.79
(0.6
2-5.
16)
0.70
1.
33(0
.29-
6.01
)
≥1
tim
e/da
y 1(
2.2)
2(
4.4)
1.
00
0.72
(0.0
6-8.
58)
3(8.
3)
3(8.
3)
1.00
1.
25(0
.21-
7.35
)
0.88
0.
81(0
.05-
12.9
)
0.
19
5.63
(0.4
0-77
.3)
C
ordi
al d
rink
<1 ti
me/
mon
th
22(4
8.9)
31
(68.
9)
1
15(4
1.7)
20
(55.
6)
1
1-3
times
/mon
th
9(20
) 1(
2.2)
0.
006*
* 12
.7(1
.49-
107)
7(
19.4
) 10
(27.
8)
0.91
0.
93(0
.29-
3.02
)
0.02
***
14.1
(1.5
6-12
6)
0.99
1.
01(0
.23-
4.50
)
1-
6 tim
es/w
eek
7(15
.6)
13(2
8.9)
0.
61
0.76
(0.2
6-2.
21)
9(25
) 6(
16.7
) 0.
27
2.00
(0.5
8-6.
85)
0.
96
0.95
(0.2
8-3.
35)
0.85
1.
16(0
.25-
5.51
)
≥1
tim
e/da
y 7(
15.6
) 0
0.00
4**
- 5(
13.9
) 0
0.04
7***
-
0.
99
0.
99
Car
bona
ted
drin
k
<1
tim
e/m
onth
10
(22.
2)
25(5
5.6)
0.
004*
1
15(4
1.7)
25
(69.
4)
0.04
* 1
1-3
times
/mon
th
17(3
7.8)
9(
20)
0.00
7***
4.
72(1
.59-
14.1
) 13
(36.
1)
7(19
.4)
0.22
3.
09(1
.01-
9.48
)
0.01
* 7.
59(1
.74-
33.1
)
0.
19
2.63
(0.5
7-12
.2)
1-6
times
/wee
k 17
(37.
8)
11(2
4.4)
0.
02**
* 3.
86(1
.35-
11.1
) 5(
13.9
) 3(
8.3)
0.
97
2.78
(0.5
8-13
.3)
0.
31
5.04
(1.2
3-20
.6)
0.29
1.
05(0
.07-
15.1
)
≥1
tim
e/da
y 1(
2.2)
0
1.00
-
3(8.
3)
1(2.
8)
0.23
5.
00(0
.48-
52.5
)
6.
96(0
.29-
165)
‡Adj
uste
d fo
r BM
I, ag
e, ra
ces,
educ
atio
n le
vel,
wor
king
stat
us, w
orki
ng e
nviro
nmen
t and
fam
ily h
isto
ry o
fkid
neys
tone
dis
ease
; *Si
gnifi
cant
diff
eren
ce o
btai
ned
usin
g ch
i squ
are
test
(p <
0.0
5); *
Sign
ifica
nt d
iffer
ence
ob
tain
ed u
sing
fish
er e
xact
test
(p <
0.0
5); *
**Si
gnifi
cant
diff
eren
ce o
btai
ned
usin
g lo
gist
ic b
inar
y re
gres
sion
, ent
er m
etho
d (p
< 0
.05)
; OR
: Odd
s Rat
io; A
djus
ted
OR
: Adj
uste
d O
dds R
atio
; CI:
Con
fiden
ce In
terv
als
TAB
LE 7
. Con
tinue
Chap 14.indd 124 23/01/2017 10:34:34
125
TABLE 8. Multivariate analyses of risk factors of kidney stone disease Men Women
Variables
p value Adjusted OR‡ (95% CI) p value Adjusted OR‡ (95% CI)
Education level Low 0.99 0.99(0.99-1.01) 0.59 2.52 (0.09-72.6) High
Family history of kidney stone Yes 0.32 4.95(0.22-112) 0.62 5.12(0.09-30.9) No
Diabetes Mellitus Yes 0.42 2.87(0.22-37.1) 0.02* 27.6(1.43-53.3) No
Smoking Habits Yes 0.03* 16.2(1.29-203) - - No
Supplement intake Yes 0.04* 24.7(1.17-50.1) 0.01* 57.8 (2.1-157) No
BMI (kg/m2) 0.30 1.39(0.74-2.61) 0.56 1.21(0.64-2.29)
Waist circumference (cm) 0.43 0.92(0.75-1.13) 0.73 1.04(0.82-1.33)
Hip circumference (cm) 0.75 1.05(0.77-1.44) 0.39 1.11(0.88-1.41)
Energy (kcal) 0.20 1.01(0.99-1.01) 0.48 0.99(0.99-1.01)
Carbohydrate (g) 0.23 1.03(0.99-1.07) 0.55 0.98(0.91-1.05)
Protein (g) 0.54 1.05(0.90-1.21) 0.62 1.06(0.84-1.35)
Fat (g) 0.44 1.05(0.92-1.20) 0.15 1.20(0.96-1.32)
Sodium (mg) 0.43 1.00(0.99-1.01) 0.29 1.00(0.9-1.01)
Potassium (mg) 0.26 1.00(0.99-1.01) 0.08 0.99(0.99-1.00)
Zinc (mg) 0.12 3.35(0.74-15.2) 0.11 4.24(0.73-24.6)
Phosphorus (mg) 0.08 0.99(0.98-1.00) 0.88 1.00(0.99-1.01)
Sugar (g) 0.57 0.98(0.93-1.04) 0.13 0.86(0.72-1.04)
Water (ml) 0.11 0.99(0.99-1.00) 0.08 0.99(0.98-1.00)
BMR (kcal) 0.91 0.99(0.99-1.01) 0.15 0.96(0.92-1.01)
Plain water intake (daily) <2 glasses 1 1 1 1 4 glasses 0.42 4.14(0.14-128) 0.08 1.21(0.00-1.99) 6 glasses 0.69 0.54(0.02-11.7) 0.02* 0.001(0.00-0.08) 8 glasses 0.38 0.18(0.004-8.6) 0.01* 0.001(0.00-0.02)
Cordial drink intake <1 time/month 1 1 1 1 1-3 time/month 0.22 39.8(0.11-145) 0.17 0.42(0.04-42.2) 1-6 time/week 0.20 0.21(0.02-2.31) 0.71 9.05(0.38-21.8) ≥1 time/day 0.99 - 0.99 -
Carbonated drink intake <1 time/month 1 1 1 1 1-3 times/month 0.04* 6.25(1.04-40.7) 10.29 3.26(0.37-28.9) 1-6 times/week 0.02* 12.5(1.41-111) 0.99 1.02(0.07-15.6) ≥1 time/day 1.00 - 0.42 4.66 (0.11-19.8)
‡Adjusted for education level, family history of kidney stone disease, diabetes mellitus, supplement intake, BMI, waist circumference, nutrients intake, plain water intake, cordial drink intake and carbonated drink intake; *Significant difference obtained using binary logistic regression, enter method (p < 0.05); Adjusted OR: Adjusted Odds Ratio, (-): no value
Chap 14.indd 125 23/01/2017 10:34:35
126
levels will contribute to different factors in the prevalence of KSD (Liufang 2003). Nevertheless, regardless of sex, supplements such as vitamins and minerals and also herbs were found to increase the risk of kidney stone formation by 24% in men and 58% in women. As in par with the findings made from a study by Dai et al. (2013), it also could not differentiate the types of supplements with the risk of KSD. However, vitamin B, vitamin C, vitamin D and vitamin E are suggested to have protective effects on kidney stone formation in previous studies, although the findings are inconsistent (Goldfarb et al. 2005; Curhan et al. 1996). The effects of calcium intake on kidney stone formation are the most controversial part in previous reports. Some researchers believe that calcium can reduce the risk of kidney stone formation by decreasing the gastrointestinal oxalic acid salt intake (Curhan 1999), whereas other studies claimed contrasting conclusions (Curhan et al. 2004; Sowers et al. 1998).
The explanation of the null association in this study may be partly because of the low exposure rate of dietary supplements. Alternatively, dietary supplements might take a long time to produce effects on kidney stone formation (Dai et al. 2013). However, studies have showed that supplements such as vitamin C can increase the risk of stone formation (Chamers et al. 1986). Vitamin C can be metabolized to form oxalate, which can increase oxalate excretion and hence trigger the risk of calcium oxalate stone formation (Curhan et al. 1999; Gerster 1997). Most of the oxalate found in urine is usually formed endogenously as a metabolic end product of glycoxylic (50% to 70%) and ascorbic acid (30% to 50%), with minor contributions by gelatin, tryptophan, phenylalanine, tyrosine, aspartic acid, creatinine and purines (Urivetzky et al. 1992). A few of previous studies have been focused on the effects of vitamin C and oxalate excretion on calcium stone forming patients (Tiselius & Almgard 2001; Heckes et al. 1993). Three studies have reported a significant increase from 31% to 100% in urinary oxalate after vitamin C was supplemented at doses from 0.5 to 2 g per day (Chalmers et al. 1986, Urivetzky et al. 1992; Tiselius & Almgard 2001).
This study also found that smoking habits among men increased the risk of KSD by 16%, as reported by a case-control study on 102 cases diagnosed with nephrolithiasis and 121 age-matched healthy controls in the Iranian population (Tamadon et al. 2013). Tobacco consumption will increase serum levels of cadmium and thus increase the risk of KSD (Scott et al. 1982). Furthermore, Mooser et al. (1989) found that there were significant changes in the plasma arginine vasopressin (AVP) (0.8 ± 0.3 pg/mL) before and (4.2 ± 4.1 pg/mL) after smoking (p = 0.001). Arginine vasopressin acts as an anti-diuretic agent which will reduce urine output. In addition, smoking also increases the production of reactive oxygen species and causes oxidative stress in kidneys, leading to kidney injury (Obatta et al. 2000). This injury increases nucleation, crystal accumulation and retention in the kidneys (Khan 2006).
Diabetes mellitus was found to increase the risk of KSD among women by 27%. Diabetes mellitus is associated with insulin resistance and changes in renal ammonium production which will increase the acidity of urine, reduce citrate in the urine and can further lead to high amount of calcium in the urine (Weinberg et al. 2014). This condition can contribute to the formation of uric acid stones and calcium stones (Cameron et al. 2006). In addition, the simultaneous occurrence of the metabolic syndrome, hyperglycaemia, hyperlipidaemia, hypertension and obesity show a high-risk ratio for the prevalence of kidney stone disease (Jeong et al. 2011). This study also revealed that obesity indices including high BMI, waist and hip circumferences increased the risk of KSD in univariate analysis but the findings were not significant in the multivariate model, probably due to the small sample size. Other larger prospective studies have proved that obesity as a predictor of KSD (Sorenson et al. 2012; Taylor et al. 2005; Semins et al. 2010). Obesity is associated with insulin resistance, hyperinsulinemia and metabolic syndrome that can lead to the formation of calcium kidney stones. A metabolic trial has demonstrated that insulin resistance is associated with the production of ammonium kidney (Abate et al. 2004). Changes in acid excretion in the kidneys can lead to hypocitraturia, an important risk factor for calcium nephrolithiasis (Coe et al. 1992). Hyperinsulinemia may contribute to the formation of calcium kidney stones by increasing the excretion of calcium in the urine (Nowicki et al. 1998). A large body size can also increase the excretion of uric acid and oxalate in urine and it is a risk factor for renal calcium stone formation (Coe et al. 1980).
Higher energy and macronutrients intake have shown to be associated with KSD as reported by Meschi et al. (2012)in a case-control study among 143 women with recurrent idiopathic calcium nephrolithiasis and 170 healthy women. This study was not able to show the contribution of macro and micronutrients in the multivariate analysis model. However, a high intake of carbonated drinks, which are usually rich in sugar, was found to increase the risk of KSD in men by 6% for consumption of one to six times per week and up to 12% for intake of more than once daily. Ferraro et al. (2013) also found that the intake of carbonated drinks can increase the formation of kidney stones by 23%. The consumption of carbonated drinks and cordials was associated with KSD due to the high fructose content. Fructose increases the excretion of calcium oxalate and high uric acid in the urine (Taylor & Curhan 2007). In addition, Saldana et al. (2007) have also reported that taking two or more carbonated drinks a day is associated with diabetes, high blood pressure and KSD.
Calcium intake and the risk of KSD have been widely studied. In this study, there were no significant differences between the case subjects and control subjects (p > 0.05). These findings coincide with the results of the case-control study by Meschi et al. (2012). Furthermore, some studies also showed that individuals with calcium kidney stones
Chap 14.indd 126 23/01/2017 10:34:36
127
have lower calcium intake compared to control subjects (Al Zahrani et al. 2000). A low dietary intake of calcium has been known to be a risk factor for the formation of calcium nephrolithiasis because it tends to increase the absorption of oxalate in the digestive system (Curhan et al. 1993). Calcium in the digestive tract will bind oxalate from food and avoid the oxalate from entering the blood or urinary tract, where it can form kidney stones (Holmes & Assimos 2004). Among the women in this study, phosphorus intake was also higher for cases as compared to controls (p < 0.05). High phosphorus intake is associated with the reduction of calcium absorption in the intestinal tract and this will increase the absorption of oxalate (Taylor & Curhan 2007).
Oxalate is a factor that is known to be associated with triggering the risk of KSD. However, this study found that the average intake of oxalate was not significantly different between case and control subjects. The foods high in oxalate resources taken by the subjects were tea, beans, spinach, chocolate sourced food, tempeh and tofu. The results of oxalate were similar to the study by Meschi et al. (2012). Oxalate was not the main factor for the formation of kidney stones in these studies. This is probably due to the fact that the absorption of oxalate when taken together with other foods was only 6% for each person and increased slightly when oxalate intake increased (Holmes et al. 2001). This is due to the regression of process of oxalate absorption because of the saturation of oxalate carrier or saturation of calcium oxalate in the intestinal lumen, which can cause crystallization (Holmes et al. 1994). Therefore, it can be concluded that the absorption of oxalate is also influenced by the intake of calcium food sources (Borghi et al. 2002). The findings were in contrast to the study by Krishna (2011) in which the study found a relationship between the resource consumption and the incidence of calcium oxalate KSD in Indonesia. This is consistent with the theory that the origin of oxalate in the body (endogenous) is from the food that we eat and in general, the metabolism of vitamin C will form crystals with the calcium which can cause KSD (Penniston 2014). Future studies need to be considered with a more specific dietary methodology such as using a food frequency questionnaire (FFQ) of calcium or oxalate in order to investigate the role of these elements or other nutrients related to KSD.
Previous studies reported that vegetables and fruits with high fibre are beneficial in preventing stone formation (Rotily et al. 2000) whereas others claimed that the excessive consumption of oxalate in vegetables and fruits is directly related to kidney stones (Meschi et al. 2004).In this study, root-stock food, tubers and fruits were not associated with kidney stones. An intriguing finding in this study was that the bean products played a significant risk effect on kidney stone formation among the women. Besides that, Massey et al. (2001) reported that soybean seeds have a high level of oxalate which might cause phytic acid salt stone formation. However, the association of eggs with kidney stone formation was contradicted by the study
conducted by Dai et al. (2013). The consumption of eggs, oil, dairy products, meat and fish had no association with kidney stones in a multivariate analysis for both men and women.
Intake of water for at least six to eight glasses a day was found to reduce the risk of KSD among women by 99.9%. Dai et al. (2013) also showed that water intake of 2000 ml/day was able to reduce the risk of KSD compared to subjects with water intake of 500 ml/day [OR = 0.57 (95% CI = 0.36-0.88)]. Drinking less than six to eight glasses a day can reduce the amount of urine and thus increase the concentration of salt-forming stones such as calcium, oxalate and uric acid; and reduce absorption of inhibitors such as citrate, glycosaminoglycans and nephrocalcin (Awasthi et al. 2011).
Fluid intake has an association with climate change. It has been well documented that the occurrence of urinary stones is higher in countries with warm or hot climates, probably due to low urinary output and scant fluid intake (López & Hoppe 2010). These are some of the factors that contribute to the geographical pattern that has characterized the North American and Afro-Asian stone belts. Also, in a given population, stone recurrence is higher in summer and fall than in winter and spring (Sternberg et al. 2005). In a North American study, the prevalence of stones tends to increase in line with the average annual temperature (5.2°C in North Dakota to 22°C in Florida) and sunlight index (14.6 in Washington state to 39.7 in Florida) (Soucie et al. 1996).
Besides that, the debate on the relationship between the nature of work and urinary stone disease is still continuous. Fatemeh et al. (2009) found that workers who are chronically exposed to the hot environment and significantly sweat are at greater risk of urinary stones. In our subjects, there were no significant differences of KSD between office and manual workers. A similar finding has been reported by Hussein et al. (2013), stating that there were no significant differences in the prevalence of urinary stone between those two groups of workers with urinary biochemical parameters.
Other beverages such as tea and coffee showed no effect on KSD in the present study and also another prospective study by Ferraro et al. (2013). However, a cross-sectional study by Awasthi et al. (2000) have revealed that the daily consumption of tea and coffee may increase the risk of kidney stones formation as tea and coffee are a source rich in calcium oxalate and act as a diuretic (Liebman & Murphy 2007). However, the phytochemical content and antioxidant properties such as chlorogenic properties found in coffee and tea can reduce the risk of KSD (Stalmach et al. 2010; Samanidou et al. 2012).
This study highlighted the role of dietary and lifestyles factors on KSD among the multi-ethnic Malaysian adult population in the Klang Valley. It is one of the very few studies that include both sex in examining the risk factors of KSD. However, it should be kept in mind that this study is a case-control study, thus the results should be treated with
Chap 14.indd 127 23/01/2017 10:34:37
128
caution. Recall bias might exist and residual confounding by imprecisely measured or unmeasured factors remain possible for our findings. There is a need to conduct a larger prospective study in order to investigate the roles of dietary and lifestyles in KSD. Another limitation of this study was the uneven distribution of races among the subjects, especially the number of Indian subjects in this study which was very low. In addition, the types of kidney stone diseases suffered by patients in this study were not known as the detection for types of kidney stones after the surgery was not a routine at the study location. The use of the diet history also caused underreported and overreported diet intake and affected the results of the study. Future studies should combine the diet history with other dietary methodology such as FFQ.
CONCLUSION
In conclusion, unhealthy dietary intake, excessive intake of carbonated drinks and inadequate intake of plain water, together with smoking habits, supplement consumption and the presence of diabetes were found to increase the risk of KSD among the subjects in this study. Thus, it is essential for individuals to adhere to healthy lifestyles in order to reduce the risk of KSD. There is a need for a healthy lifestyles promotions in order to reduce the risk of occurrence and recurrence of KSD.
ACKNOWLEDGEMENT
The authors wish to acknowledge the Urology Unit of University Kebangsaan Malaysia Medical Center for the assistance in obtaining subjects for this study and to all subjects involved in this study. This study was funded by PPP-2015-115.
REFERENCES
Abate, N., Chandalia, M., Cabo-Chan, A.V., Moe, O.W. & Sakhaee, K. 2004. The metabolic syndrome and uric acid nephrolithiasis: Novel features of renal manifestation of insulin resistance. Kidney International 65(2): 386-392.
Abbagani, S., Gundimeda, S.D., Varre, S., Ponnala, D. & Mundluru, H.P. 2010. Kidney stone disease: Etiology and evaluation. International Journal of Applied Biology and Pharmaceutical Technology 1(1): 175-182.
Al Zahrani, H., Norman, R., Thompson, C. & Weerasinghe, S. 2000. The dietary habits of idiopathic calcium stoneformers and normal control subjects. British Journal of Urology International 85(6): 616-620.
Awasthi, M., Malhotra, S. & Modgil, R. 2011. Dietary habits of kidney stone patients of Kangra District, Himachal Pradesh, North India. Journal of Human Ecology-New Delhi 34(3): 163.
Borghi, L., Schianchi, T., Meschi, T., Guerra, A., Allegri, F., Maggiore, U. & Novarini, A. 2002. Comparison of two diets for the prevention of recurrent stones in idiopathic hypercalciuria. New England Journal of Medicine 346(2): 77-84.
Cameron, M.A., Maalouf, N.M., Adams-Huet, B., Moe, O.W. & Sakhaee, K. 2006. Urine composition in type 2 diabetes: Predisposition to uric acid nephrolithiasis. Journal of the American Society of Nephrology 17(5): 1422-1428.
Chalmer, S.A., Cowley, D. & Brown, J. 1986. A possible etiological role for ascorbate in calculi formation. Clin. Chem. 32: 333-336.
Coe, F.L., Parks, J.H. & Asplin, J.R. 1992. The pathogenesis and treatment of kidney stones. New England Journal of Medicine 327(16): 1141-1152.
Coe, F.L., Strauss, A.L., Tembe, V. & Le Dun, S. 1980. Uric acid saturation in calcium nephrolithiasis. Kidney International 17(5): 662-668.
Curhan, G.C. 1999. Epidemiologic evidence for the role of oxalate in idiopathic nephrolithiasis. J. Endourol. 13: 629-631.
Curhan, G.C., Willett, W.C., Rimm, E.B. & Stampfer, M.J. 1993. A prospective study of dietary calcium and other nutrients and the risk of symptomatic kidney stones. New England Journal of Medicine 328(12): 833-838.
Curhan, G.C., Willett, W.C., Rimm, E.B. & Stampfer, M.J. 1996. A prospective study of the intake of vitamins C and B6 and the risk of kidney stones in men. J. Urol. 155: 1847-1851.
Curhan, G.C., Willett, W.C., Knight, E.L. & Stampfer, M.J. 2004. Dietary factors and the risk of incident kidney stones in younger women: Nurses’ Health Study II. Arch. Intern. Med. 164: 885-891.
Dai, M., Zhao, A., Liu, A., You, L. & Wang, P. 2013. Dietary factors and risk of kidney stone: A case–control study in Southern China. Journal of Renal Nutrition 23(2): e21-e28.
Fatemah, S., Shahpourian, F., Khachian, A., Hosseini, F., Heidari, S. & Sanjari, M. 2009. Personal characteristics and urinary stones. Hong Kong Journal of Nephrology 11(1): 14-19.
Ferraro, P.M., Taylor, E.N., Gambaro, G. & Curhan, G.C. 2013. Soda and other beverages and the risk of kidney stones. Clinical Journal of the American Society of Nephrology 8(8): 1389-1395.
Gerster, H. 1997. No contribution of ascorbic acid to renal calciumoxalate stones. Ann. Nutr. Metab. 41: 269-282.
Goldfarb, D.S., Fischer, M.E., Keich, Y. & Goldberg, J. 2005. A twin study of genetic and dietary influences on nephrolithiasis: A report from the Vietnam Era Twin (VET) Registry. Kidney Int. 67: 1053-1061.
Heckers, H., Wagner, I., Schmelz, E. & Trenkel, A. 1993. Zur diatetischenTherapie und Pravention Von Calcium-Oxalat-Nierensteinen. Errnahrungs-umschau. 40: 416-420.
Holmes, R.P. & Assimos, D.G. 2004. The impact of dietary oxalate on kidney stone formation. Urological Research 32(5): 311-316.
Holmes, R.P., Goodman, H.O. & Assimos, D.G. 2001. contribution of dietary oxalate to urinary oxalate excretion. Kidney International 59(1): 270-276.
Holmes, R., Goodman, H. & Assimos, D. 1994. Dietary oxalate and its intestinal absorption. Scanning Microscopy 9(4): 1109-1118.
Hussein, N., Sadiq, S., Kamaliah, M., Norakmal, A. & Gohar, M. 2013. Twenty-four-hour urine constituents in stone formers: A Study from the Northeast Part of Peninsular Malaysia. Saudi Journal of Kidney Diseases and Transplantation 24(3): 630.
Inci, M., Demirtas, A., Sarli, B., Akinsal, E. & Baydilli, N. 2012. Association between body mass index, lipid profiles and types of urinary stones. Renal Failure 34(9): 1140-1143.
Chap 14.indd 128 23/01/2017 10:34:38
129
International Physical Activity Questionnaire Committee. 2005. Guidelines for the data processing and analysis of the International Physical Activity Questionnaire.www. ipaq.ki.se [14 March 2014].
Jeong, I.G., Kang, T., Bang, J.K., Park, J., Kim, W., Hwang, S.S., Kim, H.K. & Park, H.K. 2011. Association between metabolic syndrome and the presence of kidney stones in a screened population. American Journal of Kidney Diseases 58(3): 383-388.
Johri, N., Cooper, B., Robertson, W., Choong, S., Rickards, D. & Unwin, R. 2010. An update and practical guide to renal stone Management. Nephron Clinical Practice 116(3): c159-c171.
Khan, S.R. 2006. Renal tubular damage/dysfunction: Key to the formation of kidney stones. Urological Research 34(2): 86-91.
Krishna, D.N.P. 2011. Faktor risiko penyakit batu ginjal. Jurnal Kesihatan Masyarakat 7(1): 51-62.
Lee, R.D. & Neiman, D.C. 2007. Nutritional Assessment. 4th Edition. New York: McGrew Hill.
Liebman, M. & Murphy, S. 2007. Low oxalate bioavailability from black tea. Nutr. Research 27: 273-278.
Liufang, G. 2003. Urolithiasis epidemiological and etiology. China Journal of Urology 10: 68-70.
López, M. & Hoppe, B. 2010. History, epidemiology and regional diversities of urolithiasis. Pediatr. Nephrol. 1: 49-59
Massey, L.K., Palmer, R.G. & Horner, H.T. 2001. Oxalate content of soybean seeds (Glycine max:Leguminosae), soyfoods and other edible legumes. J. Agric. Food Chem. 49: 4262-4266.
Meschi,T., Maggiore, U. & Fiaccadori, E. 2004. The effect of fruits and vegetables on urinary stone risk factors. Kidney Int. 66: 2402-2410.
Meschi, T., Nouvenne, A., Ticinesi, A., Prati, B., Guerra, A., Allegri, F., Pigna, F., Soldati, L., Vezzoli, G. & Gambaro, G. 2012. Dietary habits in women with recurrent idiopathic calcium nephrolithiasis. J. Transl. Med. 10(63): 1Y8.
Mooser, V., Burnier, M., Nussberger, J., Juilierat, L., Waeber, B. & Brunner, H.R. 1989. Effects of smoking and physical exercise on platelet free cytosolic calcium in healthy normotensive volunteers. Journal of Hypertension 7(3): 211-269.
Nowicki, M., Kokot, F. & Surdacki, A. 1998. The influence of hyperinsulinaemia on calcium-phosphate metabolism in renal failure. Nephrology Dialysis Transplantation 13(10): 2566-2571.
Obata, T., Tomaru, K., Nagakura, T., Izumi, Y. & Kawamoto, T. 2000. Smoking and oxidant stress: assay of isoprostane in human urine by gas chromatography–mass spectrometry. Journal of Chromatography B: Biomedical Sciences and Applications 746(1): 11-15.
Pak, C.Y. 1991. Etiology and treatment of urolithiasis. American Journal of Kidney Diseases 18(6): 624-637.
Pearle, M.S., Calhoun, E.A. & Curhan, G.C. 2005. Urologic diseases in America project: Urolithiasis. The Journal of Urology 173(3): 848-857.
Penniston, K.L. 2014. Dietary oxalate and calcium oxalate stones: A Theoretical or real concern? In Practical Controversies in Medical Management of Stone Disease. 7-28. Springer.
Romero, V., Akpinar, H. & Assimos, D.G. 2010. Kidney stones: A global picture of prevalence, incidence and associated risk factors. Reviews in Urology 12(2-3): e86.
Rotily, M., Leonetti, F. & Iovanna, C. 2000. Effects of Low Animal Protein or High-Fiber Diets on Urine Composition in Calcium Nephrolithiasis. Kidney Int. 57: 1115-1123.
Saldana, T.M., Basso, O., Darden, R. & Sandler, D.P. 2007. Carbonated beverages and chronic kidney disease. Epidemiology (Cambridge, Mass.) 18(4): 501.
Samanidou, V., Tsagiannidis, A. & Sarakatsianos, I. 2012. Simultaneous determination of polyphenols and major purine alkaloids in greek sideritis species, herbal extracts, green tea, black tea and coffee by high-performance liquid chromatography-diode array detection. Journal of Separation Science 35(4): 608-615.
Saxena, A. & Sharma, R.K. 2010. Nutritional aspect of nephrolithiasis. Indian Journal of Urology 26: 523-530.
Scales, C.D., Smith, A.C., Hanley, J.M. & Saigal, C.S. 2012. Prevalence of kidney stones in the United States. European Urology 62(1): 160-165.
Scott, R., Cunningham, C., Mclelland, A., Fell, G., FitzgeraldFinch, O. & Mckellar, N. 1982. The importance of cadmium as a factor in calcified upper urinary tract stone disease-a prospective 7 year study. British Journal of Urology 54(6): 584-589.
Semins, M.J., Shore, A.D., Makary, M.A., Magnuson, T., Johns, R. & Matlaga, B.R. 2010. The association of increasing body mass index and kidney stone disease. The Journal of Urology 183(2): 571-575.
Siener, R. 2006. Impact of dietary habits on stone incidence. Urological Research 34(2): 131-133.
Sorensen, M.D., Chi, T., Shara, N.M., Wang, H., Hsi, R.S., Orchard, T., Kahn, A.J., Jackson, R.D., Miller, J. & Reiner, A.P. 2014. Activity, energy intake, obesity and the risk of incident kidney stones in postmenopausal women: A report from the women’s health initiative. Journal of the American Society of Nephrology 25(2): 362-369.
Sorensen, M.D., Kahn, A.J., Reiner, A.P., Tseng, T.Y., Shikany, J.M., Wallace, R.B., Chi, T., Wactawski-Wende, J., Jackson, R.D. & O’sullivan, M.J. 2012. Impact of nutritional factors on incident kidney stone formation: A report from the WHI. The Journal of Urology 187(5): 1645-1650.
Soucie, J.M., Coates, R., McClellan, W., Austin, W. & Thun, M. 1996. Relation between geographic variability in kidney stones prevalence and risk factors for stones. Am. J. Epidemiol. 143: 487-495.
Sowers, M.R., Jannausch, M., Wood, C., Pope, S.K., Lachance, L.L. & Peterson, B. 1998. Prevalence of renal stones in a population-based study with dietary calcium, oxalate, and medication exposures. Am. J. Epidemiol. 147: 914-920.
Stalmach, A., Steiling, H., Williamson, G. & Crozier, A. 2010. Bioavailability of chlorogenic acids following acute ingestion of coffee by humans with an ileostomy. Archives of Biochemistry and Biophysics 501(1): 98-105.
Sternberg, K., Greenfield, S.P., Williot, P. & Wan, J. 2005. Pediatric stone disease: an evolving experience. J. Urol. 174: 1711-1714.
Suzana, S., Earland, J. & Abdulrahman, S. 2000. Validation of a dietary history questionnaire against a 7-d weighed record for estimating nutrient intake among rural elderly malays. Malaysian Journal of Nutrition 6(1): 33-44.
Tamadon, M.R., Nassaji, M. & Ghorbani, R. 2013. Cigarette smoking and nephrolitiasis in adult individuals. Nephro-urology Monthly 5(1): 702.
Chap 14.indd 129 23/01/2017 10:34:39
130
Taylor, E.N. & Curhan, G. 2007. Fructose consumption and the risk of kidney stones. Kidney International 73(2): 207-212.
Taylor, E.N. & Curhan, G.C. 2007. Oxalate intake and the risk for nephrolithiasis. Journal of the American Society of Nephrology 18(7): 2198-2204.
Taylor, E.N., Stampfer, M.J. & Curhan, G.C. 2005. Obesity, weight gain and the risk of kidney stones. JAMA 293(4): 455-462.
Thomas, L.D., Elinder, C.G., Tiselius, H.G., Wolk, A. & Åkesson, A. 2013. Dietary cadmium exposure and kidney stone incidence: A population-based prospective cohort study of men & women. Environment International 59: 148-151.
Tiselius, H.G. & Almgard, L.E. 2001. The diurnal urinary excretion of oxa- and non-acid urine collection on urinary oxalate determination. Arch. Ital. Urol. Androl. 73: 78.
Urivetzky, M., Kessaris, D. & Smith, A.D. 1992. Ascorbic acid overdosing. J .Urol. 149: 1215-1218.
Weinberg, A.E., Patel, C.J., Chertow, G.M. & Leppert, J.T. 2014. Diabetic severity and risk of kidney stone disease. European Urology 65(1): 242-247.
Nurul Nurliana BaharudinSuzana ShaharDietetic Program School of Healthcare Sciences Faculty of Health Sciences Universiti Kebangsaan Malaysia 50300 Kuala Lumpur, Malaysia
Zulkifli Md. ZainuddinDepartment of SurgeryFaculty of MedicineUniversiti Kebangsaan Malaysia Medical Centre Jalan Yaacob LatifBandar Tun Razak, Cheras56000 Kuala Lumpur, Malaysia
Corresponding author: Suzana ShaharEmail: [email protected].:03-9289 7651/0193326530 Fax: 03-2694 7621
Received: April 2016Accepted for publication: November 2016
Chap 14.indd 130 23/01/2017 10:34:39