ENVIRONMENTAL - Universiti Malaysia Sabah · i 2015 Editors Siti Aishah Mohd Ali Carolyn Melissa...
113
FACULTY OF SCIENCE AND NATURAL RESOURCES UNIVERSITI MALAYSIA SABAH Editors | Siti Aishah Mohd Ali | Carolyn Melissa Payus | Vun Leong Wan | ENVIRONMENTAL SCIENCE Scientific Project Guidelines
Transcript of ENVIRONMENTAL - Universiti Malaysia Sabah · i 2015 Editors Siti Aishah Mohd Ali Carolyn Melissa...

FACULTY OF SCIENCE AND NATURAL RESOURCES UNIVERSITI MALAYSIA SABAH
Editors | Siti Aishah Mohd Ali | Carolyn Melissa Payus | Vun Leong Wan |
ENVIRONMENTAL
SCIENCE Scientific Project Guidelines

i
2015
Editors
Siti Aishah Mohd Ali
Carolyn Melissa Payus
Vun Leong Wan
Scientific Project Guidelines
ENVIRONMENTAL SCIENCE
FACULTY OF SCIENCE AND NATURAL RESOURCES UNIVERSITI MALAYSIA SABAH

ii
First Published 2015
Copyright © 2015 by Faculty of Science and Natural Resources, UMS All rights reserved. No part of this publication may be reproduced, stored in any retrieval system, or transmitted in any form or by any means, electronic, mechanical, photocopying, or recording, without prior written permission from the Faculty of Science and Natural Resources, UMS. Printed & Published in Malaysia by Faculty of Science and Natural Resources Universiti Malaysia Sabah (UMS) Jalan UMS, 88400 Kota Kinabalu Sabah Tel: 6088-320000 ext 5872 Fax: 6088-435324 E-mail: [email protected] Website: http://www.ums.edu.my/fssa Malaysia National Library Cataloguing-in-Publication Data Environmental Science: Scientific Project Guidelines ISBN 978-967-0582-37-5

iii
Our aim in writing this guideline is to assist the final year students in understanding the
structure and procedures so that they can carry out their scientific research systematically
and in an organized manner.
The book is divided into 11 main chapters on the topics of scientific project management,
type of research projects, literature research, research proposal, sampling design in
environmental research, how to design a questionnaire in environmental science research,
secondary data sources for research, statistics for environmental research, scientific project
report and assessment guidelines. In addition, this book also contains the relevant forms and
planner needed. We hope that this book it will help students to manage and complete their
scientific research project successfully.
In the process of writing and materializing of this book, we have received bundle of
references from various sources of literatures both in printed and also electronic forms
which have been appropriately cited and acknowledged.
We would particularly like to express our gratitude to Faculty of Science and Natural
Resources for printing and publishing this book. Last but not least, we thank our family and
colleagues, for their support, patience and understanding during the process of planning,
preparing and writing of the book. Thank you.
Siti Aishah Mohd Ali Carolyn Melissa Payus
Vun Leong Wan
July 2015
PREFACE This book seeks to provide guidance and instructions
for final year undergraduate students of
Environmental Science Programme, Faculty of
Science and Natural Resources (FSSA).

iv
Preface iii
Contents iv
INTRODUCTION Siti Aishah Binti Mohd Ali
1.1
1.2
1.3
OVERVIEW OF THE SCIENTIFIC PROJECT
LEARNING OUTCOMES
SCIENTIFIC PROJECT ASSESSMENT
1
2
2
SCIENTIFIC PROJECT MANAGEMENT Kamsia Budin & Siti Aishah Binti Mohd Ali
2.1
2.2
2.3
2.4
2.5
2.6
2.7
2.8
2.9
IDENTIFICATION AND ALLOCATION OF PROJECTS
PLANNING, EXECUTING AND PROJECT MANAGEMENT
ACADEMIC STAFF PROGRAMME RESEARCH FOCUS
CHANGE OF PROJECT TITLE/ SUPERVISOR RESPONSIBILITIES AND ROLE OF THE SUPERVISOR
RESPONSIBILITIES AND ROLE OF THE STUDENT
SCIENTIFIC PROJECT DOCUMENTATION – LOGBOOK
SUBMISSION
SCIENTIFIC PROJECT CALENDAR /SCHEDULE
3
3
6
7
7
7
8
8
9
TYPE OF RESEARCH PROJECTS Siti Aishah Binti Mohd Ali
3.1
3.2
3.3
3.4
INTRODUCTION
PRIMARY RESEARCH
Local Field Research
Laboratory Research
SECONDARY RESEARCH
EXAMPLES OF SCIENTIFIC PROJECT
10
10
10
10
11
11
LITERATURE RESEARCH Harry Chong Lye Hin
4.1
4.2
4.3
4.4
UNDERSTANDING THE TERMINOLOGY LITERATURE
LITERATURE SEARCH
IN SEARCH OF SPECIFIC LITERATURE
ORGANISING THE FOUND LITERATURE
13
13
14
15
CONTENTS
CHAPTER 1
CHAPTER 2
CHAPTER 3
CHAPTER 4
v
RESEARCH PROPOSAL Vun Leong Wan
5.1
5.5
5.3
5.4
WHAT IS A RESEARCH PROPOSAL?
HOW MUCH SHOULD I WRITE IN A RESEARCH PROPOSAL?
WHAT IS THE STRUCTURE OF A RESEARCH PROPOSAL?
Writing a Title
Writing Introduction
Writing Literature Review
Writing Research Objectives
Writing Justification
Writing Methodology
Writing Expected Result and Gantt Chart
FURTHER READING
18
19
19
19
20
20
21
21
22
22
23
SAMPLING DESIGN IN ENVIRONMENTAL RESEARCH Rohana Tair
6.1
6.2
6.3
6.4
6.5
WHAT IS SAMPLING?
WHAT IS DATA?
TYPE OF RANDOM SAMPLING
Simple Random
Systematic Random
Stratified Random
Cluster Random
EXPERIMENTAL DESIGN
WHAT IS SAMPLING DESIGN? WHY IMPORTANT?
24
24
25
25
25
26
26
26
28
QUESTIONNAIRE Carolyn Melissa Payus & Vun Leong Wan
7.1
7.2
DESIGNING A QUESTIONNAIRE
Organizing a Survey
Questions in Questionnaire
Administration of the Questionnaire
How do I know if I am Ready?
Starting a Questionnaire
Ending a Questionnaire
Final Words
HOW TO START A QUESTIONNAIRE
Cover Letter
Steps for Questionnaire Design
Physical Appearance of Questionnaire
Types of Questions
Scale of Questionnaire
Pilot Study
Ways to ask Questions
31
31
32
35
35
35
36
36
36
36
36
37
37
38
39
39
CHAPTER 6
CHAPTER 5
CHAPTER 7

vi
SECONDARY DATA SOURCES FOR RESEARCH Vun Leong Wan & Ahmad Norazhar Mohd Yatim
8.1
8.2
8.3
8.4
8.5
8.6
INTRODUCTION
WHAT IS SECONDARY DATA?
Using Secondary Data Inferior to Primary Data?
What is not Secondary Data?
Sources of Secondary Data
Where to Begin?
QUALITY CONTROL
WHY DO WE USE SECONDARY DATA?
ADVANTAGES OF USING SECONDARY DATA
DISADVANTAGES OF USING SECONDARY DATA
40
40
40
41
41
41
42
42
42
43
STATISTICS FOR ENVIRONMENTAL RESEARCH Rohana Tair
9.1
9.2
9.3
9.4
9.5
9.6
9.7
9.8
INTRODUCTION
SIGNIFICANT IN STATISTIC
STATISTICS
Descriptive Statistics
Inferential Statistics
BASIC INFERENTIAL STATISTICS
Range
Mean
Variance
Standard Deviation
COMPARISON OF TWO MEANS
Student T-Test for Two Population Mean
Paired T-Test for Two Population Mean
CORRELATION
REGRESSION
CASE STUDY
44
46
47
47
48
48
48
48
49
49
50
50
51
53
54
55
SCIENTIFIC PROJECT REPORT Siti Aishah Binti Mohd Ali
10.1
10.2
10.3
SCIENTIFIC PROJECT REPORT OUTLINE
Scientific Project Proposal
Scientific Project Final Report
REPORT FORMAT
General Tips
Chapter Content
Text Format
PLAGIARISM
65
65
65
66
66
67
72
74
CHAPTER 8
CHAPTER 9
CHAPTER 10

vii
ASSESSMENT GUIDELINES Siti Aishah Binti Mohd Ali
11.1
11.2
MARKING SCHEME
ORAL PRESENTATION GUIDELINES
Oral Presentation
Design Tips
Content of Presentation
Presentation Style
Questions and Answers Session
76
77
77
78
78
79
79
Frequently Asked Questions (FAQs) 81
References 85
Appendixes
A: Supervisor Approval Form
B: Example of Log Book (FYP01 – FYP06)
C: Easy step to compile a cited sources / references
D: Example of Tables of Content
E: Example of List of Tables
F: Example of List of Figures
G: Example of List of Appendices
H: Example of List of Symbols and Abbreviations
I: Scientific Project 1 - Writing Evaluation Rubric
J: Scientific Project 1 - Supervisor’s Point Rubric
K: Scientific Project 1 - Proposal Presentation Evaluation Rubric
L: Scientific Project 2 - Writing Evaluation Rubric
M: Scientific Project 2 - Supervisor’s Point Rubric
N: Scientific Project 2 - Viva Evaluation Rubric
86
87
93
94
95
96
97
98
99
100
101
102
103
104
CHAPTER 11

1
Undergraduate scientific project is a subject where the students have to design, execute,
analyze and disseminate their research ideas. Third year students are required to carry out a
scientific project independently and submit a formal written report at the end of each
semester. This scientific project is a substantial research work that will require students to
grasp the theoretical and practical aspects of scientific research. The nature of the project is
either field studies, laboratory-based or environmental modeling work within the fields of
environmental science.
This scientific project aims to give a clear understanding of the concept of research in
environmental science that will allow students to become more familiar with the actual
research environment. This research based learning courses also serves as an introduction to
the development of logical, analytical thinking and deductive reasoning.
A project proposal covers background of the study and problem statement, literature review,
methodology, written report and presentation. Project proposal also involves execution of the
research plans that have been developed and will be evaluated. The students will undertake
an independent research work on the approved proposal topic in consultation with the
respective supervisor. The results will be subsequently analyzed, interpreted, discussed and
finally presented as a written scientific report.
This scientific project is to be undertaken in two phases over the period of two semesters, in
which each phase carries its own number of credits. Scientific Project 1 carries 3 credits hour
and needs to be done in the first semester of the final year. It is a prerequisite for scientific
Project 2, which means that students must register and pass scientific Project 1 before they
can proceed to scientific Project 2 in the following semester. Scientific Project 2 carries 6
credit hours and needs to be done in the second semester of the final year.
INTRODUCTION
Environmental Science: Scientific Project Guidelines
1 1.1 OVERVIEW OF THE SCIENTIFIC PROJECT

2
On successful completion of this course, students will be able to:
1. Demonstrate proficiency in project planning and manage the time involved to
complete the scientific project and related report, within given time constraints.
2. Demonstrate the ability to work independently piece of research with support from
academic supervision.
3. Provide a clear set of objectives for the scientific project, a literature review of
previous work, a theoretical foundation and coherent justification in the research area.
4. Describe an appropriate experimental design, scientific information and analysis
procedures in a clear, complete and effectively.
5. Report a clear, concise and accurate record, interpret and report relevant data in a
manner that addresses the research question and draw conclusions from the research
findings.
6. Demonstrate the ability to produce a formal environmental science report, substantive
in nature, with proper and complete structure, outline, cross-referencing of figures,
tables and text, and referencing of previous research.
7. Communicate the research findings though presentation and reports effectively.
In semester 1, students are required to prepare a research proposal and present it for
endorsement and assessment. For scientific Project 1, students will need to prepare chapters
on introduction, literature review and methodology. Supervisors will assess the students
based on their initiative and management of the project. In semester 2, at the completion of
research project, students will have to write up a complete dissertation/thesis and submit it
for examination and viva-voce. The scientific project is assessed in three sections:
Table 1.1 Scientific Project Assessments
No Assessments Scientific Project 1
(%)
Scientific Project 2
(%)
1 Proposal / viva-voce presentation 20 20
2 Supervisor’s assessment 20 20
3 Scientific written proposal / full report 60 60
Note: Scientific Project 1 carries 3 credit hours; Scientific Project 2 carries 6 credit hours.
1.2 LEARNING OUTCOMES
1.3 SCIENTIFIC PROJECT ASSESSMENT
Chapter 1: Introduction

3
Each student is responsible to choose a suitable academic supervisor to in the execution of
their project. The academic supervisor should be a lecturer in the Environmental Science
Programme (refer Table 2.1). The appointed supervisor will supervise the student’s project
for both Scientific Project 1 and Scientific Project 2. Therefore, each student needs to fill in the
Form HS11-SP01 – Supervisor Approval Form (Appendix A) and get the supervisor’s
approval and project information before submitting it to the Scientific Project Coordinator.
Students are encouraged to propose their own project titles. However, students can also get
topics/titles from the prospective supervisors. If the students are interested in any of the
academic staff’s project, the student should contact the respective academic staff at the
earliest opportunity. There is no guarantee that the student will be allocated for their
preferred project.
Whether the student chooses their own topic or the academic staff project, there are a
number of conditions that they have to consider. The project must contain both a theoretical
and a practical component which covers identifying a problem and developing a solution to
the problem.
A work plan is needed to demonstrate that a student have a clear ideas of how to
proceed with the scientific project.
The student should identify activities and allocate time accordingly within the two (2)
semesters. Figure 2.1 and 2.2 shows scientific project planning activities.
The planning should take into account factors such as the workload from other
courses and the various deadlines that the students need to follow.
SCIENTIFIC PROJECT
MANAGEMENT
Environmental Science: Scientific Project Guidelines
2 2.1 IDENTIFICATION AND ALLOCATION OF PROJECTS
2.2 PLANNING, EXECUTING AND PROJECT MANAGEMENT

4
Figure 2.1 Scientific Project 1 planning activities
Chapter 2: Scientific Project Management
IDENTIFICATION AND ALLOCATION OF
PROJECT
SEMESTER 1
LITERATURE REVIEW
Chapter 3: • Research design • Sampling Methods • Data collection methods • Research procedures • Data analysis methods • Gantt Chart
Chapter 1: Introduction
• Objectives
• Problem Statement
• Scope of Research
• Significance of Research
Chapter 2: Literature Review
SUBMISSION HS11-SP01 FORM
Week 2
METHODOLOGY
Semester 2 (2nd Year):
• Choose suitable supervisor
• Propose project title
SUBMISSION OF PROJECT 1
• Front Page • Table of Content • List of Tables • List of Figures • List of Symbols and Abbreviations • Chapter 1: Introduction • Chapter 2: Literature Review • Chapter 3: Methodology • References • Appendix
Do all amendments and suggestions based on examiner and supervisor comment
PROPOSAL PRESENTATION
Week 14
CORRECTION (FOR NEXT SEMESTER)

5
Figure 2.2 Scientific Project 2 planning activities
Chapter 2: Scientific Project Management
SEMESTER2
Laboratory Research: • Preliminary survey for the characteristics
of study area • Sampling • Laboratory analysis
Secondary Research: • Collect existing data • Analysis using relevant tools
EXPERIMENTAL DESIGN AND ANALYSIS
SUBMISSION OF FULL REPORT
RESULT INTERPRETATION
Chapter 4: Result & Discussion
Chapter 5: Conclusion
• Front page • Declaration • Verification • Acknowledgement • Abstrak • Abstract • Table of Content • List of Tables • List of Figures • List of Symbols and Abbreviations • Chapter 1: Introduction • Chapter 2: Literature Review • Chapter 3: Methodology • Chapter 4: Results and discussion • Chapter 5: Conclusion • References • Appendix
Correction: Do all amendments and suggestions based on examiner and supervisor comment
Submission: • Binding of hardcover for final report can
only be done after getting the examiner and supervisor signature in the Project Submission Form.
• Submit 3 copies of hardcover thesis (1 for Supervisor and 2 for Bilik Sumber FSSA & UMS Library) including 1 softcopy in CD (for supervisor only)
• Submission of final report form– FYP06
VIVA-VOCE PRESENTATION
Week 14
CORRECTION & SUBMISSION OF FINAL
REPORT

6
The research focus for the academic staffs is shown in Table 2.1.
Table 2.1 Environmental Science Programme academic staff’s research focus
Lecturer Name Area(s) of Specialization Research Focus
Prof. Datuk Dr. Mohd.
Harun Abdullah Environmental & Water Quality Water / Groundwater Quality
Prof. Dr. Kawi Bidin Environmental Hydrology Hydrology/
Hydro-geomorfology
Assoc. Prof. Dr. Piakong
Mohd. Tuah
Solid & Toxic Waste
Management/ Bioremediation
Solid Waste Management/
Environmental Microbiology/
Bioremediation
Assoc. Prof. Dr. Justin
Sentian
Atmospheric Science/
Environmental Modeling/
Environmental Law/ EIA
Atmospheric Chemistry/ Climate
Change/ Environmental Impact
Assessment
Dr. Vun Leong Wan Environmental Management Environmental Management/ EIA
Review/ Environmental Policy
Dr. Harry Chong Lye
Hin Environmental Science
Water Treatment / Direct Use of
Renewable Energy
Ms. Kamsia Budin Environmental Toxicology Toxicology/ Environmental Health /
Risk Assessment
Ms. Farrah Anis
Fazliatul Adnan
Marine Science
/Environmental Management Environmental Management
Ms. Carolyn Melissa
Payus
Atmospheric Chemistry /
Environmental Law/ Water
Resource
Atmospheric Chemistry /
Environmental Law / Water Resource
Ms. Siti Aishah Binti
Mohd. Ali Environmental Chemistry Environmental Chemistry
Ms. Rohana Tair Environmental Statistic Statistic and Modeling
Mr. Ahmad Norazhar
Mohd Yatim
Remote Sensing, Geographic
Information Systems (GIS) Digital Image Processing
2.3 ACADEMIC STAFF PROGRAMME RESEARCH FOCUS
Chapter 2: Scientific Project Management

7
The approval of the supervisor is needed to change the project title. This request needs to be
submitted to the scientific project coordinator for processing. The scientific project
committee in the programme does not encourage the change of supervisor. For special case
where the change of supervisor is necessary, the existing and the new supervisor, together
with the student must all agree with the changes. The scientific project coordinator’s
endorsement is necessary before the request is submitted to the scientific project committee
in the programme.
A supervisor is an academic staff to whom the students were allocated and responsible
for guiding the students with the scientific project.
As the supervisor, he/she will guide, direct, advice and assess the student through
every stages of the scientific project until completion.
However, it is NOT the supervisor responsible to do the work for their students.
The supervisor will assist the students on the technical part of the project which
covers sampling, lab and data analysis where necessary.
It is the supervisor responsibility to encourage initiative in the students to take
responsibility for their work and not overly dependent on their supervisor.
The discussion between the supervisor and the students should not be the supervisor
telling the students on what and how to do his/her project.
The supervisors are expected to be understanding, courteous and considerate with
their students.
The supervisor and the student should meet regularly at time and place suits to them.
If the supervisor has some difficulties or problem with their student’s performance,
he/she should communicate and discuss it with the scientific project coordinator.
The ratio supervisor between students should not exceed 10 students per supervisor.
The ultimate responsibility for the completion of scientific project lies on the students
and it should be his / her own work.
The students should not depend on the supervisor to actively solve their problems.
The students should develop initiatives in completing the scientific project; it should
contain the ideas of the students with guidance from the supervisor.
2.4 CHANGE OF PROJECT TITLE/ SUPERVISOR
2.5 RESPONSIBILITIES AND ROLE OF THE SUPERVISOR
2.6 RESPONSIBILITIES AND ROLE OF THE STUDENT
Chapter 2: Scientific Project Management

8
The students are expected to behave with maturity in respect to their supervisor, the
lab staff, their peers and the scientific project.
The students should be courteous to their supervisor, accept direction, complete the
works as required and be punctual for the meetings.
If the student has any query or problem with her/his project that cannot be resolved
by the supervisor, the student can discuss this with the Scientific Project Coordinator.
It is the student responsibility to contact their supervisor to set up a meeting and
discuss their progress. Please plan the meetings in advance as the supervisor has other
responsibilities and may not be in position to meet the students at any time.
The students should NOT plagiarise their research writing.
The students should keep two (2) log books that show their work progress.
One of it is for their own use and contains working notes, measurements, notes, lab
work notes.
The second logbook will be the formal log book which will be distributed to all
students at the start of the session (refer Appendix B).
Student must be careful to safeguard their records, keeping copies of vital papers or
results. This includes doing sufficient softcopy backup for all computer media or
reports that are needed for the assessment.
All progress made or discussion with the supervisor must be recorded/documented
and maintained in the formal log book. This covers summary of discussions, design
work, theoretical work, experimental results and conclusion.
This log book will be inspected from time to time by project supervisor and
moderating examiner for evidence of satisfactory progress.
Constant review from supervisors will ensure that students execute their projects
according to the school’s procedure and standard. A complete log book should be
submitted concurrently with the hard binding thesis.
There are two (2) submission deadlines that the student has to meet. Each student has
to submit two (2) copies to the Faculty of Science and Natural Resources (FSSA Main
Office). These copies will be used for the assessment.
o The first submission is in week 13th of 1st semester for written proposal.
o The second submission is in week 13th of 2nd semester for the full scientific
project report.
Any late submission the student will be penalized accordingly.
2.7 SCIENTIFIC PROJECT DOCUMENTATION – LOGBOOK
2.8 SUBMISSION
Chapter 2: Scientific Project Management

9
For full scientific project report, the student will have 2 weeks to do all the correction
once the project have been accessed and returned to them. The hard cover can only be
preceded after all amendments and suggestions have been done and have been
approved by their supervisor.
After getting the examiner and supervisor signature in the Project Submission Form,
then the student will bind final report and the hardcover will be sent to Bilik Sumber
FSSA for record. The form will be collected for the Dean to sign.
Failure to submit the three (3) copies of hardcover thesis including one (1) softcopy in
CD (for supervisor) to the faculty may result in his/her graduation will be put on hold.
The scientific project calendar is shown in Table 2.2.
Table 2.2 Scientific project calendar for Environmental Science Programme
NO. MATTERS
IMPORTANT DATES
ACTION SCIENTIFIC PROJECT 1
SCIENTIFIC PROJECT 2
1 Student acquires scientific research title from supervisor
Previous Semester
- Student
2 Submit HS11-SP01 – Supervisor Approval Form
Week 2 - Student, Scientific
Project Coordinator
3 Literature review /acquiring data for scientific project
Week 2 - 5 - Student
4 Methodology design and development
week 6-13 - Student
5 Experimental design and analysis - Week 1 - 7 Student
6 Result interpretation - Week 8 - 13 Student
7
Submission of project report:
Project 1 (proposal report)
Project 2 (Full report)
Week 13 Student
(FSSA main office)
8 Collecting and distributing of project reports
Week 13
Scientific Project Coordinator,
supervisor, examiner (FSSA main office)
9 Presentation Proposal (Project 1) Viva-voce (Project 2)
Week 14 Student, Scientific
Project Coordinator, Examiner
10 Correction & submission of three (3) copies of final report including 1 softcopy in CD
- Week 14 - 18 Student
(Bilik Sumber FSSA)
11 Checklist and declaration of submission of final report form– FYP06
- Week 18 Student, Scientific
Project Coordinator
2.9 SCIENTIFIC PROJECT CALENDAR
Chapter 2: Scientific Project Management

10
At the beginning of developing a research project, you will have to decide on the type of
research that you would like to conduct. There are several types of undergraduate research
projects, for examples laboratory works, field study, desktop study and data analysis. The
type of research that you select will depend on your research question.
Primary research is any type of research that student investigate by collecting new data from
the field or the laboratory. The methods vary on how student run an experiment or study, but
it typically follows the scientific method. Conducting primary research is a useful skill to
acquire as it can greatly supplement scientific research in secondary sources, such as journals
or books.
3.2.1 Local Field Research
Local field research is a collection of primary data by conducting fieldwork outside of the
classroom, laboratory, library or workplace setting. Field research involves a range of
methods: recording direct observations, collecting samples, distributing surveys or
conducting interviews. In the environmental science, field research refers to field
experiments utilizing in situ instruments and sampling samples. The quality of results
obtained from field research depends on the data gathered in the field.
3.2.2 Laboratory Research
Laboratory research is a collection primary data by conducting scientific research in the
laboratory. This type of research is considered as an experiment if samples are randomly
taken to analyze with control groups to investigate a cause and effect relationship.
TYPE OF RESEARCH
PROJECTS
Environmental Science: Scientific Project Guidelines
3 3.1 INTRODUCTION
3.2 PRIMARY RESEARCH

11
Secondary research is a research question by using existing data previously collected by an
outside source such as water quality data from Department of Environment (DOE), which can
be re-used for the research. For this type of research, secondary data can be collected from
online databases, industries/institutions, publications or experts. This would allow the
examination of changes in parameter/variables over a larger scale than if you were to collect
the data yourself. It is also a good ethical research practice to use sound secondary data
wherever possible.
The field of Environmental Science Program is a science based research area that addresses
the interface of environmental science and human activity using a broad range of disciplines.
Most of the projects offered through this program can be categorized into several research
fields:
Water Quality
Environmental Hydrology
Environmental Technology
Environmental Management
Air Quality
Environmental Modelling
Climate Change
Atmospheric Chemistry
Toxicology
Solid & Toxic Wastes Management
Environmental Chemistry
Environmental Health
The example of research projects from previous Environmental Science Program
undergraduate thesis are listed below:
Assessing the concentration and toxicity of dissolved metals of acid mine drainage
downstream of Mamut Copper Mine, Ranau, Sabah.
The potential of Pistia stratiotes in removing heavy metals from simulated wastewater.
Study on temporal and spatial variations of nitrogen dioxides, ozone and carbon
monoxide in Kota Kinabalu City.
Distribution, source and enrichment of selected heavy metals in sediments and waters
along the coastal area of Papar - Tuaran, Sabah.
Parameters affecting the adsorption of Cu (II) from aqueous solution by rice husk in
batch adsorption system.
Petroleum hydrocarbon concentrations in water and sediments from coastal area of
Papar, Sabah.
Heavy metal determination in tea and its removal utilizing cattails, Typha spp.
Investigate the presence of pesticide in fishes in Kinabatangan River.
3.3 SECONDARY RESEARCH
3.4 EXAMPLES OF SCIENTIFIC PROJECT
Chapter 3: Type of Research Projects

12
Characterization and concentration of aliphatic and polycyclic aromatic hydrocarbons
from atmospheric environment samples.
Ecological input assessment in EIA for Coastal Resort Development in Sabah.
Heavy metals concentration in surface sediment and sediment core (50 cm depths) at
selected mangrove area of Tuaran district.
Characterization of drinking water quality (biological and chemical contaminations)
for Sabah Kampong community.
Biodegradation of crude oil in simulated seawater by locally isolated microorganisms
in consortia culture.
Surface flow freshwater constructed wetland of UMS.
Determination of crude oil penetration rate into beach sand: n-alkanes and
polyaromatic hydrocarbon as an oil spill pollution indicators.
Physical, chemical and microbiological analysis of untreated well water quality.
Chapter 3: Type of Research Projects

13
The common mass read whatever they want; this could range from daily newspapers to
romantic novel. These reading materials are often entertaining as they do not require serious
focusing and mental analysis. However, a scholar read what he or she needs to. Of course,
doing what you want and what you need is a totally different feeling altogether, now add in
the focusing and understanding factors to be incorporated in the reading process, life just got
tougher, isn’t it?
Towards graduation, it is a common requirement that a final year student needs to perform a
research project and write a dissertation or thesis about it. Majority of students faced
problem even at the very initial stage just because they failed to acknowledge their role as a
researcher. A student reads mostly text books but a researcher reads mostly journals. A text
book is a literature on mostly established theory while a journal is a literature on new
developments in research. Both of these literatures had gone through scientific review
process where the facts had been verified by qualified academician in the particular niche of
knowledge.
In scientific research, it is best to avoid referring to literature that its content validity is
questionable. Examples are website which its author cannot be identified as well as book and
journal published by predatory publishers.
The purposes of performing a good intensive literature search are (i) to establish thorough
related database and (ii) to identify data gap on the subject of interest.
One needs to understand that in order to establish thorough research database on a
particular subject of interest is not easy. Failure to identify what to search for is the biggest
failure in literature search. If anyone has no idea what to search for, it is an indicator that the
LITERATURE
RESEARCH
Environmental Science: Scientific Project Guidelines
4 4.1 UNDERSTANDING THE TERMINOLOGY LITERATURE
4.2 LITERATURE RESEARCH

14
particular person is lack of basic knowledge in that subject of interest. In such case, it will be
more beneficial to read up text books and enhance the basic knowledge first before jumping
into research based literature search.
Just like anything we do in research, literature search requires planning and strategy. To aid
the literature search planning and strategy, questions can be listed and grouped in categories
so that keywords can be identified along the process. These keywords are very important as
journal content are tagged based on them. Thus, identifying the wrong keywords will not get
you the correct literature that you need.
There are many type of literature of different characteristic. If a researcher fails to
understand this, his or her literature planning and strategy will be affected and there is a high
possibility he or she will never be able to establish a thorough database on the subject of
interest.
Classified and sensitive information related to national security will never be published in
journal due to restriction posed by the governing body. Thus, if one is looking at topic like
uranium deposit in a particular area, perhaps the best place to start the search is at the
Mineral and Geoscience Department or consultant report (if any). Such departmental report
will normally require letter from the faculty stating your intention of research before the said
department allows one to access such document.
Impact factor journal is a good source if one is searching for (i) thorough yet established
research methodology, (ii) variety of valid data presentation technique and (iii) work with
novelty value. Another two categories of journals are indexed and non-indexed journal.
Although it may not be necessarily true, it is a common belief that the quality of the journal
increased from non-indexed to indexed and peaked at higher impact factor journal.
Therefore, if the subject of interest is of novel value, one should start the research based
literature search in impact factor journal. Journal can be easily searched utilising
ScienceDirect and Scopus which are available at http://www.sciencedirect.com and
http://www.scopus.com, respectively. It is however risky to refer to journal published by
predatory publishers.
At times, on-going research, due to their incomplete nature, is available in the form of
proceeding. One needs to understand that data of on-going research is presented in
conference and documented in the form of proceeding for information sharing and
discussion. While it is unfair to say the quality of literature in a proceeding is low, one need to
understand that its level of review process is somehow lenient. Researcher do not normally
refers to proceeding as to avoid the question on validity.
4.3 IN SEARCH OF SPECIFIC LITERATURE
Chapter 4: Literature Research

15
A single keyword search in ScienceDirect can lead you to thousands of matching journal
articles. For example, the key word adsorption will lead you to 578,605 matching journal
articles (Figure 4.1). You have two options to proceed: (i) to manually go through one by one
of these journals and pick out the one that you need, or (ii) to zoom in your search by adding
another keyword (Figure 4.2).
Figure 4.1 One keyword search results
4.4 ORGANISING THE FOUND LITERATURE
Chapter 4: Literature Research

16
Figure 4.2 Two keywords search results
The advantage of option (ii) is that it is very convenient and fast. Of course if one feels that
108,900 matching journal articles are still too pain staking to process, one can add in more
keywords to narrow down the number of matching. However, there is a catch with option (ii)
because at times due to technical error in tagging of the keyword, articles that you are
supposed to look for are not found in the matching list. For this reason, it is advisable to stick
to option (i). In such, it means that research based literature search cannot be done last
minute. One will also need to understand that number and sequence of the keyword matching
list change from time to time whenever newer articles are available.
Since there are thousands of matching articles to read and process, it is very unlikely for a
researcher to read all of these at one go or within a week or two. Therefore, perhaps the best
strategy one can do is to create folders to organise these found articles and read them later
when one is doing the literature review process (Figure 4.3).
Chapter 4: Literature Research

17
Figure 4.3 Example of folders to organise the found articles
Whatever one does during the literature search, just remember one thing that one must not
be desperate but take control of time and plan the strategy ahead. In other words, one need to
visualise the research based literature search outcome before swinging into action.
Chapter 4: Literature Research

18
A good research proposal helps to put your ideas into objective, clear and focused statements,
so that you will be able to know your scopes of research, your motivation, your research
objectives and the methodology to achieve that, and finally your hypothesis (which are
tentative and provisional statement(s) that you believe you are going to find out in your
research).
It is both thinking and writing process. When preparing a research proposal, you will have the
opportunity to think about many issues related, besides outlining your research
designs/approach and methods, location, the proposal would also require you to demonstrate
a level of knowledge of the literature in the relevant fields and also the up-to-date
information on the topic.
Research proposal is usually considered as a short “action plan” for your proposed piece of
the research project. It also serves as a provisional agreement between you and your
supervisor, something that you have made a commitment to accomplish within the next 2
semesters. A time table (Gantt chart) is included in a proposal to help you plan ahead by
thinking about the different stages of your research, so that you can weed out unrealistic
research objectives.
Usually a research proposal will become your chapter 1 (introduction) in your scientific
project. However, research proposal is not the same as the proposal report for scientific
Project 1.
The keywords to remember when writing a research proposal are as follows: clear, short and
focused, you should have the intention also to convince your readers or any members of the
scientific community about the need of your research project. Just like a story book, the first
chapter should attempt to draw others into your research by putting your words
“scientifically intriguing”.
RESEARCH PROPOSAL
Environmental Science: Scientific Project Guidelines
5 5.1 WHAT IS A RESEARCH PROPOSAL?

19
A research proposal has three main points:
1. Explanation of proposed research (what will be done)
2. Methods and techniques to be employed (how it will be done)
3. Novelty and/or importance of the study (why it should be done)
There is no definite answer to this. Just as a guide, and not a rule, the following is the
benchmark for a scientific project research proposal:
Word count is between 1500 to 2500 words (not including references)
Number of references should be about 5 to 20 (recent academic journal publications)
Number of pages between 5-10 pages.
The structure of a research proposal is explained in the table as follows:
Title (provisional title)
Introduction
Brief literature review
Research objective(s)
The need of the research
Methodology
Expected results & Gantt chart
5.3.1 Writing a Title
This should provide a specific summary of the proposed work and no over-claim.
Example:
1. NO (too much detail)
A study of population decline in the soil microbial diversity following logging, road
building and forest replanting project in a logged-over forest deep in the interior of
North-eastern Sabah
5.2 HOW MUCH SHOULD I WRITE IN A RESEARCH PROPOSAL?
5.3 WHAT IS THE STRUCTURE OF A RESEARCH PROPOSAL?
Chapter 5: Research Proposal

20
2. No (too little detail)
Population changes in logged-over-forest
3. Over-claim (don’t write what is Not and what is Unsubstantiated)
The study of the significant long term population changes in the soil microbial
diversity following persistent logging, unsound road construction and unsustainable
forest-replanting programme in a 25 years logged-over forest in the north-eastern
Sabah territory towards establishing a long term management plan
4. YES
A study of soil microbial diversity changes following logging in north-eastern Sabah
5.3.2 Writing Introduction
A “scientifically-intriguing” introduction work best to hook your readers and set the context
of your proposed research project. Capture your readers’ attention if possible in the first two-
three sentences. This is the opportunity to show that your research has not been done before
and the findings will add something new and significant to the existing body of knowledge.
A brief description of the field in which the study is to be on: the brief background provided
for the research should provide an adequate context for the study to help the readers
understand the questions and objectives. The selective literature will show the readers that
you have a good knowledge of what is happening.
Suggested format:
• Introduce the area of research
• Review key publications
• Identify any gap in the knowledge which needs to be addressed
• Your hypotheses
• Your aims and objectives
• How is your research beneficial and to whom
5.3.3 Writing Literature Review
The literature review section is to summarize in brief what the literature has to say about the
research topic/questions that you are undertaking. It would be good to summarize key
research findings and/or important theories in the field; appropriate references help to set
the research in a context and show that you have done some relevant and selective reading in
your intended area of research.
Chapter 5: Research Proposal

21
A further description of the research problem could also be carried out; this could arise from
a gap or conflict in previous or recent researches or be an extension/continuity of what
others have done. It could also arise from a puzzling issue or new methods in the recent
development in the relevant field.
5.3.4 Writing Research Objectives
How many objectives should there be in a scientific project? The answer lies in achievability
and not the number of it, sometimes the number of objectives will change based on the
findings of your research.
Setting the number of objectives depend on what is your research question(s) in the first
place. Objectives are set to answer just that. It could be written in the form of research
questions (e.g. what impact does…), hypothesis or purposeful sentences (e.g. this study aims
to investigate…)
Some authors suggested that research objectives should be SMART (Specific, Measurable,
Achievable, Realistic and Time-bound), as this would help you to break down your objectives
to stages and set the scope. SMART is a good guide in setting reasonable and feasible
objectives.
The student-learning-time (SLT) for a scientific project depends on the credit hours allocated.
Based on Malaysia Qualification Framework (MQF), 40 active learning hours are associated
with each credit, thus for 3 credit hours scientific Project 1, a student should be spending
approximately 120 hours a semester on it. Too much time spent just on scientific project will
jeopardize a student’s performance in other subjects, thus one must manage his/her time
wisely to learn. The SLT for scientific Project 2 is 240 hours for a semester (6 credit hours).
5.3.5 Writing Justification
Justification is the need of the research. Your literature review will have already helped to
lead the reader to an understanding of why your topic is of importance. This is where you will
explicitly state how your proposed research will advance the existing body of knowledge.
What are all the positive effects? Will your study ultimately change understanding or
practices or policies?
List all the scientific benefits from your research.
Chapter 5: Research Proposal

22
5.3.6 Writing Methodology
This section derived from your research objectives and the methods used must help you to
achieve your objectives. They have to be logically arranged and it should cover your
experimental design, data collection, quality control and data analysis.
Laboratory experiments would be straightforward with standard protocols: chosen
techniques, sample size, controls, species chosen, equipment and data analysis. For other
primary data collection tools such as questionnaires, observations, interviews, document
analysis and case study should be chosen appropriately so that it is able to help to answer the
research objective. Specific statistical test(s) used in data analysis should be specified here.
5.3.7 Writing Expected Result and Gantt Chart
Expected results are the outcome of the research, what would expect to find at the end of the
project.
Developing a time table / Gantt chart (Figure 5.1) that indicates the sequence of research
phases/stages and the time that you might need for each phases will help in planning your
plan and focus also. Though estimation, you still need to carefully assign the activities and
time span, so that the Gantt chart will not be just a display.
1 2 3 4 1 2 3 4 1 2 3 4 1 2 3 4 1 2 3 4 1 2 3 4 1 2 3 4 1 2 3 4 1 2 3 4
Literature Review
Fieldwork
Laboratory Analysis
Data interpretation
Report writing
Viva
Research activities Sept Oct Nov
20162015
Dec Jan Feb Mar Apr May
Figure 5.1 Example of Gantt chart for scientific Project 1 & 2 planning
Chapter 5: Research Proposal

23
1. http://www.ait.ac.th/education/LanguageCenter/ait-writing-services/guide-book
2. http://www.writingcenter.uconn.edu/pdf/Research_Proposal_Writing.pdf
3. http://www.phrasebank.manchester.ac.uk/ (top rated)
4. http://www.writing.utoronto.ca/
5.4 FURTHER READING
Some Golden Rules These are stylistic “golden rules” which contribute to a
good proposal:
· Be clear, objective and straight to the point
· Justify your objectives: “because it is interesting” is
not enough!
· Provide a structure and use headings
· Avoid long solid blocks of text and use smaller
paragraphs
· Write short sentences
· If allowed and if helpful, insert
images/charts/diagrams to help break up text.
· Stick to guidelines and the deadline!
Chapter 5: Research Proposal

24
Sampling refers to the way that data collection is done. There are many techniques of doing
sampling. However, understanding the data set is required before doing sampling.
Data are VALUE (measurements or observations) that the variable can assume. A collection of
data values forms a DATA SET.
IDENTIFY YOUR DATA BEFORE GOING TO SAMPLING!!!!
DATA
SET
Qualitative Data Variable that can be placed
into distinct categories, according to some
characteristic or attribute. eg: gender (M/F), geographic
location
Quantitative Data Numerical and can be ordered or
ranked. Ex: Size & height (unit: cm, m), weight (unit: kg, g),
concentration (unit: ppm, etc.), time Set of
experiment unit
or set of
measurement
from experiment
SAMPLING DESIGN IN
ENVIRONMENTAL
RESEARCH
Environmental Science: Scientific Project Guidelines
6 6.1 WHAT IS SAMPLING?
6.2 WHAT IS DATA?
Univariate Data = result
when a single variable
(=1) is measured on a
single experimental unit
Bivariate Data = result
when two variable (=2)
are measured on a single
experimental unit
Multivariate Data =
result when more than
two variable (>2) are
measured

25
Example
Univariate Data Bivariate Data Multivariate Data
6.3.1 Simple Random
All possible sample of a specific size or every
member of the population has an equal
chance of being selected.
Example:
Title: Measured pollutant inside fish tissue
Method of sampling: Using fishing net.
Sample: Whatever type of fish trapped on the net
is the sample for experiment.
6.3.2 Systematic Random
A sample obtained by numbering each
element in the population and then selecting
every third or fifth or tenth.
Example:
Title: Measured pollutant inside fish tissue –
Tilapia sp.
Method of sampling: Using fishing net.
Sample: Only type of Tilapia sp. trapped on the
net is the sample for experiment.
6.3 TYPE OF RANDOM SAMPLING
Chapter 6: Sampling Design in Environmental Research
26
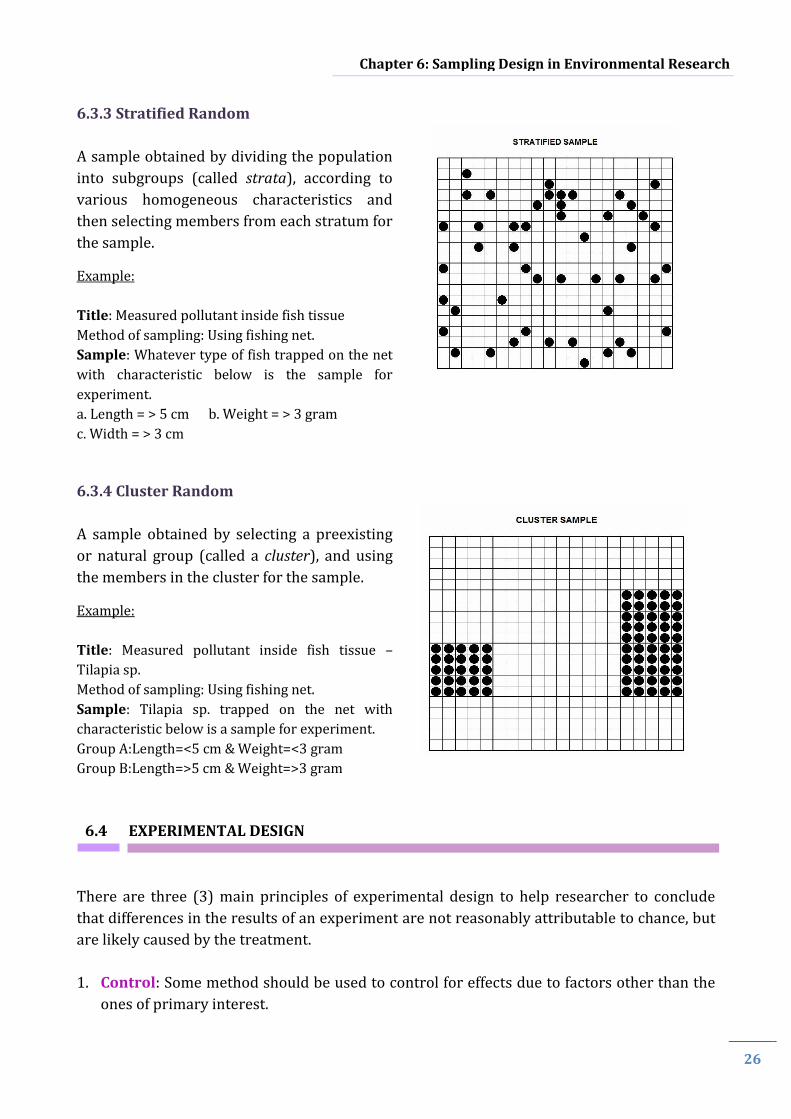
6.3.3 Stratified Random
A sample obtained by dividing the population
into subgroups (called strata), according to
various homogeneous characteristics and
then selecting members from each stratum for
the sample.
Example:
Title: Measured pollutant inside fish tissue
Method of sampling: Using fishing net.
Sample: Whatever type of fish trapped on the net
with characteristic below is the sample for
experiment.
a. Length = > 5 cm b. Weight = > 3 gram
c. Width = > 3 cm
6.3.4 Cluster Random
A sample obtained by selecting a preexisting
or natural group (called a cluster), and using
the members in the cluster for the sample.
Example:
Title: Measured pollutant inside fish tissue –
Tilapia sp.
Method of sampling: Using fishing net.
Sample: Tilapia sp. trapped on the net with
characteristic below is a sample for experiment.
Group A:Length=<5 cm & Weight=<3 gram
Group B:Length=>5 cm & Weight=>3 gram
There are three (3) main principles of experimental design to help researcher to conclude
that differences in the results of an experiment are not reasonably attributable to chance, but
are likely caused by the treatment.
1. Control: Some method should be used to control for effects due to factors other than the
ones of primary interest.
6.4 EXPERIMENTAL DESIGN
Chapter 6: Sampling Design in Environmental Research

27
Example Bioassay experiment: To determine the potential of accumulation pollutant,
Cu by using fish. Six tanks are used with different series concentrations (0, 1, 2, 3, 4, 5
ppm) of Cu in the water. The concentration 0 ppm is without Cu, so this tank will act as
a control for the experiment. At the end, the mortality number of fish as a result of
experiment and for the potential accumulation of Cu will be compared to the control
tank.
Method Experiment Recovery: The method used in experiment is always referring to
the experiment done before or from other references. Researcher will used others
researcher’s method and sometimes modified it. Meaning that, researcher are using the
same method but at a different place/laboratory. So, method experiment recovery is
very important to avoid the error from all sources such as the apparatus used, the
environments, the instruments and etc. For the method recovery, Standard References
Material (SRM) will be used as a sample and ran the experiment together with our main
sample. The SRM is of known concentration, so at the end we should get the same
concentration, if not, there is an error somewhere. Calculate the differences of the
result and we can know the percentage errors made in the experiment. However, SRM
is very costly.
Standard solution series is important to control instrument such as AAS, ICP-OES,
ICP-MS, UV-Vis, GC-MS and etc. Each instrument has their own standard stock for
making series of solution. From the solution series, researcher can determine the low
detection limit and upper detection limit of the instrument to verify that the output is
always within the range of detection limits. In addition, the standard solution series is
important to make a standard curve to show the competence of the instrument.
2. Randomization: Subjects should be randomly divided into groups to avoid unintentional
selection bias in constituting the groups, that is, to make the groups as similar as possible
(refer to 6.3).
3. Replication: A sufficient number of subjects should be used to ensure that randomization
creates groups that resemble each other closely and to increase the chances of detecting
differences among the treatments when such differences actually exist.
Replicate for taking sample is how many samples will be taken from one point or
station of sampling.
Replication by times series data is a sequence of data points, typically consisting of
successive measurements made over a time interval.
Chapter 6: Sampling Design in Environmental Research

28
Sampling design is really important and must be suitable to the hypothesis of problem
statement that needs to be solved. From the design, researcher can identify:
1. The media (ex: sediment, water, air, biota etc.)
2. The objective and problem statement
3. The analytical method, the experimental method, the chemical method, specific
method recovery (e.g.: Standard Reference Material- SRM, Standard AAS, ICPMS,
GCMS, HPLC, etc.)
4. The number of sample (N) & number of replicates (how many samples taken from one
point or station of sampling)
5. The time series of going to sampling (e.g.: daily, weekly, monthly, yearly, etc.)- A time
series is a sequence of data points, typically consisting of successive measurements
made over a time interval.
6. The parameter being measured (e.g.: water quality parameter, organic & inorganic
parameter, composting, recycle, EIA parameter, etc.)
7. Numbers of location & station for sampling
8. Choose the type of random sampling.
9. How to get the sample (ex: secondary data, buy from market, reports collection, etc.)
Example A:
Media Sampling Parameter Location Station Replicate N
Water
Monthly in a
year (12
times)
Zn, Cu, Pb
(3)
River A, B, C
(3)
Each
location 5
stations
3 12 x 3 x 3 x
5 x 3 = 1620
Expected Results:
Sampling River Station Parameter Data Replicates
January A 1
Zn ZnA11
ZnA12
ZnA13
Cu CuA11
CuA12
CuA13
Pb PbA11
PbA12
PbA13
6.5 WHAT IS SAMPLING DESIGN? WHY IS IT IMPORTANT?
Chapter 6: Sampling Design in Environmental Research

29
Example B:
Media Sampling Parameter Location Station Replicate N
Air
1 day
(24 hour)
5 days
Zn, Cu, Pb
(3)
A, B, C
(3)
Morning
(6am-12pm)
Afternoon
(12pm-6pm)
Evening
(6pm- 12am)
Midnight
(12am-6am)
(4 times interval)
0
(because
use
cumulative
data by
hours
interval)
5 x 3 x 3 x
4 x 0 = 180
Each
interval
has 45
data
Example C:
Media Sampling Parameter Location Station Replicate N
Sediment 1 times Zn, Cu, Pb
(3) A, B, C
(3)
Surface
sediment (5 station)
Corer
2
50 cm cut each 5cm (10)
1 x 3 x 3 x 5
x 2 = 90
1 x 3 x 3 x 0 x 10 = 90
Example D:
Media Sampling Parameter Location Station Replicate N
Biota 2 species Zn, Cu, Pb
(3)
A, B, C
(3) 0 15
2 x 3 x 3 x 0 x 15 =
540
Example E:
Media Sampling Parameter Location Station Replicate N
Report 8 selected
reports
There were 8
characteristics
selected to
compare each
reports
(8)
0
Choose score
1 to 5
(1)
3 times
reading
the report
8 x 8 x 0 x 1
x 3 = 192
Chapter 6: Sampling Design in Environmental Research

30
Example F:
Media Sampling Parameter Location Station Replicate N
Lake
water 1 time
Water quality
parameters
(Example: DO, °C, BOD,
nitrate,
ammonia, oil
& grease etc.)
(1)
A, B, C
(3)
Surface
(depth 0 m-
0.5 m)
Middle
(depth 1 m
-1.5 m)
Bottom
(3)
3
1 x 1 x 3 x 3 x
3 = 27
(if you choose
3 parameters,
so 27x3 =81)
Example G: Combination
Media Sampling Parameter Location Station Replicate N
Biota
2 species
live at
surface
sediment Zn, Cu, Pb
(3)
River
A, B, C
(3)
By transect
or quadrate
(3 point each
location.
Example:
upstream,
middle &
downstream
Number of
individuals
biota in
quadrate
2 x 3 x 3 x 3
= 54
Sediment Surface
sediment 3
1 x 3 x 3 x 2
x 3 = 54
*For more examples, please refer to journal that related to your fields of interest.
The sampling design can help the researcher to manage the time, method, technique and how
many sample that is appropriate to solve the problem statement.
Chapter 6: Sampling Design in Environmental Research

31
Usually, questionnaires are used in a survey which requires the students to collect
information from organizations or people for their research. Questionnaires should be well
designed to achieve the same types of information which are collected from a large number of
people. Hence, the data can also be analyzed quantitatively and systematically. It is important
to design a suitable questionnaire to ensure that you get valid responses to the questions
asked. The objectives in designing a questionnaire are as below:
1. Maximize the proportion of subjects answering the questionnaire (the response rate)
2. Obtain accurate and relevant information
The first objective is to establish a connection with the subjects, explain the purpose of the
survey and also as a reminder to those who have not responded. For the second objective, the
way we ask questions to the subjects is important which compromises what to ask, how to
ask, the order of the questions and the general layout of the questionnaire.
7.1.1 Organizing a Survey
Early Planning
A timeline for the research, preparation of question and preliminary survey is suggested
to recognize any possible problems with the questionnaires before the interview.
Recognizing the Goals
It is important to recognize the information wanted from the survey so that a specific and
relevance question can be created.
Give Instruction
Explain the objective of the survey and provide extra help that the respondent will need
for the completion of the questionnaire.
7.1 DESIGNING A QUESTIONNAIRE
Environmental Science: Scientific Project Guidelines
7 QUESTIONNAIRE

32
Length of Questionnaire
Generally, the shorter and simpler the questionnaires (1-2 pages), the better and higher
the response rates.
7.1.2 Questions in Questionnaire
a) Questions to be Asked
Below are three types of information collected in a survey:
1. Dependent Variables: Information of the research’s primary interest.
2. Independent Variables: Information explaining the dependent variables.
3. Confounding Variables: Other factors associated to both dependent and independent
factors which will alter the outcomes and have to be changed for.
An example is a survey regarding the level of knowledge and attitudes of participants
about climate change. The dependent factors are the participants’ level of relevant
knowledge and attitudes. The independent factors are the education, background or
experiences of the participants about climate change. The confounding variables might be
the quality of their education where the knowledge they obtain are different from the
school they attended.
b) Types of Questions
Closed Format: Respondents are only required to select the answer from the given
options.
Examples: Multiple choices, yes/no, ranking and rating scale.
Benefits of closed format:
Easy and quick to fill in.
Discrimination for the less literate (in self-constructed questionnaire) or the less
articulate (in interview questionnaire) can be reduced.
Quantitative results of coding, recording and analyzing can be obtained easily.
The reporting of results is simpler.
In obtaining information, types of question can be combined. However, be careful in
using too many different question types to avoid confusion towards the respondents.
Also, the structure of the question must be consistent if the same type of questions is
used. For example, in a rating scale, the most positive response is assign as the highest
numerical value (Very Satisfied = 5 on scale of 1 to 5).
Chapter 7: Questionnaire

33
The responses must also be balanced (for every Very Satisfied, have a Very
Unsatisfied). For example is rate the effectiveness of the recent school recycling
education program on a scale of 1 to 5.
Open Format: It is based on the respondents own answers where their answers
provide specific comments or feedback.
Benefits of open format:
More possible themes can be explored from an issue
Can be used even if a broad range of alternative choices cannot be compiled
c) Ways to Ask the Questions
Use short and simple sentences.
Generally, a short and simple sentences is less confusing and ambiguous than long and
complex sentences. As a rule of thumb, the sentences should not contain more than one or
two clauses.
Ask for one piece of information at a time.
Avoid putting two pieces of information in one sentence at the same time. It should be
separated into two different sentences. For example, “Please rate Global Environment
Class in terms of its content and presentation” can be separated into two parts which is
“Please rate the class in terms of its content” and “Please rate the class in terms of its
presentation”.
Avoid leading questions to reduce bias.
A lot of neutral questions lead to bias where the people are often led down the path of
answering questions in a way they perceive to be socially desired or in a way expected by
the questioner. It is preferable to encourage the respondent to select a response from a
list of answer. For example, the question “What do you believe are the major forces behind
recent climate change? Natural Forces, Human Forces or the Combination of both” is
preferable instead of “Do you agree that humans are the major force behind recent climate
change? Yes or No”.
Negatives are preferable to be avoided.
Negatives should be used carefully. For example, in a yes or no question, the statement,
“Coal plants should not be abolished” should be rephrase as, “Coal plants should continue
operating”. Never use double negatives in a statement as well.
Chapter 7: Questionnaire

34
Ask specific questions.
Words can be a bit confusing sometime where different people will interpret different
meaning. Another source of uncertainty is the frame of reference is failed to be specified.
For example is the time reference is missing in the question “How often do you recycle?”.
It can be rephrased as, “How many times have you filled your recycling bin in the past six
months?”
Participants must have the knowledge about the research.
For example, the question, "Do you agree with restriction on new coal plants found in the
Clean Air Act?” is unsatisfactory. Several pieces of information is asked at the same time
(there are many restrictions in the Act) and it shows that the participants know details of
the restrictions and the Clean Air Act.
Sensitive issues should be questioned carefully.
A true and honest answer is difficult to get. A response of either no or negative is likely to
be receive for the question such as, “Have you ever littered while no one is watching?”
Some less direct approaches:
The casual approach: “By the way, have you ever happened to litter, maybe when no
one was looking?” should be used as a last part of another decoy question.
The numbered card approach: “Please pick one or more of the following items which
correspond to how you view littering.” In the list of choices, include: “I occasionally
litter”
The everybody approach: “As we all know, some people litter when they have no
choice. Are you one of them?”
The other people approach: A scenario is given to the participants, “John occasionally
tosses small pieces of litter out his car window.” They were then asked, “Do you feel
John is wrong? What penalty should be imposed for John? Have you done this in the
past? Would you ever consider doing the above?”
d) Arrangement of Questions
It is important to arrange the questions to get the most information out of the participant.
Some general rules are:
Go from general to specific
Go from easy to difficult
Go from factual to abstract
Start with closed format questions
Start with questions relevant to the main subject
Avoid starting question with demographic and personal questions
Chapter 7: Questionnaire

35
7.1.3 Administration of the Questionnaire
There are a number of ways of managing questionnaires. Example is they may be completed
independently (self-administered) which may be sent by post, email or electronically online,
or read out loud in the form of interview which may be completed over the telephone or in
face-to-face interviews.
i. Benefits of self-administered questionnaires:
Cheap and easy
Preserve confidentiality
Completed at respondent’s convenience
Administered in a standard manner
ii. Benefits of interview administered questionnaires:
Illiterate people can participate
Ambiguity can be clarified
Individuals with specific information is targeted
A greater respond is guaranteed
The choice of method of administration depends on who the respondent are. For example,
older people may be suitably surveyed by interviews and university lecturers by email.
7.1.4 How do I Know if I am Ready?
It is impossible to get the questionnaire right for the first round even for the experts. The
questionnaires should be conducted on a small sample of people characteristic of those in the
survey population. Each pilot respondent are asked with questions regarding the survey
design: effects of different wordings, their opinion on the answer they gave, their
understanding on a particular word, length and appropriateness of questions, etc. The
questionnaire can be improved by polishing the question order, wording and layout.
7.1.5 Starting a Questionnaire
A personalized cover letter or an introductory statement is a good idea to start with where
the purpose of the survey can be explained, the importance of the respondent’s participation,
the person in charge of the survey, and a statement guaranteeing confidentiality.
Lots of students have difficulties talking to strangers when conducting an interview surveys
and questionnaires. A good way to start the conversation with a stranger is as follow:
Chapter 7: Questionnaire

36
“Hello. My name is ________________ and I am a student from _______________________. I’m working
on a research project looking at_________________________________ for a college-credit class called
“The Global Environment.” I found your phone number/email address on the internet and I
was wondering if you have a few minutes to answer some questions regarding with my
research.”
7.1.6 Ending a Questionnaire
Always remember to thank the respondent for participating in your questionnaire.
7.1.7 Final Word
In order to yield valid information, the questionnaires must be designed carefully. Every
question must be relevant, appropriate, intelligible, precise and unbiased with the objective of
the research. The questions must also be in the right order and the layout must be clear.
Drafting is recommended for a clear personalized cover letter. A trail for the questionnaire
must be made before the actual survey.
7.2.1 Cover Letter
The important things to be included in a cover letter are the name of institute/school, title of
research project, the name of researcher, objective of the research, the selection of
respondents, the confidentiality of the respondents identification and personal opinion and
finally a word of appreciation for the respondents’ participation in your questionnaire.
7.2.2 Steps for Questionnaire Design
1. Select the information needed.
2. Define target respondents.
3. Select the suitable method to reach target respondents.
4. Decide on question content.
5. Improve and change the question wording.
6. Arrange the questions into order and format.
7. Check the length of the questionnaire.
8. Conduct a trial for the questionnaire and develop the final survey form.
Chapter 7: Questionnaire
7.2 HOW TO START A QUESTIONNAIRE
(name) (school/institute)
(title of research project)

37
7.2.3 Physical Appearance of Questionnaire
In the form of booklets
Booklets make it easier for the interviewers or respondent to go through the document
and the loss of pages can be avoided as well.
Simple and clear formats
The way of presenting the questionnaire helps the interviewers or respondents to
complete a questionnaire with ease.
Creative use of space and typeface
A questionnaire that fills the blank space in a page appears easier to use, have higher
response rates and contain less error.
Color coding
Due to the several types of respondents within a single survey (for example wholesalers
and retailers), color coding makes it easier to manage the questionnaire.
Interviewer instructions
Instruction should be provided alongside the questions to make it easier for the
interviewers to complete the questionnaire.
o Dillman’s Total Design
Attractive and creative question paper
Question is arrange vertically
Selecting relevant questions
Length of questionnaire must not be more than 10 pages/25 questions/ 30
minutes to complete.
7.2.4 Types of Questions
a) Open-ended question
Advantage
- Respondent are free to provide their own answer.
- A variety of a possible answer can be obtained.
Disadvantage
- Difficult to analyze data.
Chapter 7: Questionnaire

38
b) Fixed response
Advantage
- Analyzing data is easier.
- Respondents do not have to answer in detail.
- Time spent to answer is short.
- Higher respond rate.
Disadvantage
- Limited answer.
- Respondent does not answer the question seriously.
Examples are force-choice (yes/no) and rating scale.
7.2.5 Scale of Questionnaire
a) Force Choice
Type of questionnaire where respondents have to choose a response that shows definitive
options.
Example:
Do you understand by the concept of sustainable environment?
( ) Yes
( ) No
b) Differential Semantic Scale
This type of scale is used to measure the connotative (strength and power) meaning of a
questionnaire.
Example:
Rate the current environmental policy by United Nations on each of the following:
Decisive ___: ___: ___: ___: ___: ___: ___: Indecisive
Active ___: ___: ___: ___: ___: ___: ___: Passive
c) Likert Scale
Psychometric response scale used in questionnaire to get the series of preferences from
respondents. It measures the degree of opinion and converts an ordinal scale to
quantitative data.
Chapter 7: Questionnaire
39
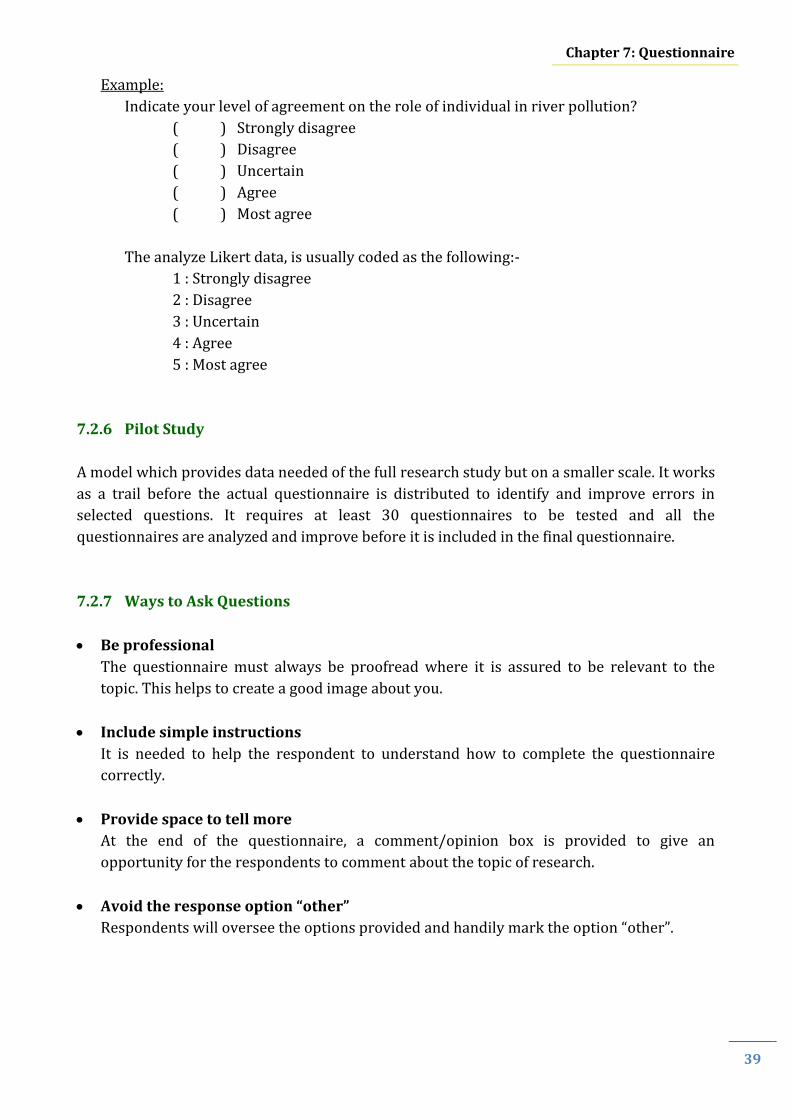
Example:
Indicate your level of agreement on the role of individual in river pollution?
( ) Strongly disagree
( ) Disagree
( ) Uncertain
( ) Agree
( ) Most agree
The analyze Likert data, is usually coded as the following:-
1 : Strongly disagree
2 : Disagree
3 : Uncertain
4 : Agree
5 : Most agree
7.2.6 Pilot Study
A model which provides data needed of the full research study but on a smaller scale. It works
as a trail before the actual questionnaire is distributed to identify and improve errors in
selected questions. It requires at least 30 questionnaires to be tested and all the
questionnaires are analyzed and improve before it is included in the final questionnaire.
7.2.7 Ways to Ask Questions
Be professional
The questionnaire must always be proofread where it is assured to be relevant to the
topic. This helps to create a good image about you.
Include simple instructions
It is needed to help the respondent to understand how to complete the questionnaire
correctly.
Provide space to tell more
At the end of the questionnaire, a comment/opinion box is provided to give an
opportunity for the respondents to comment about the topic of research.
Avoid the response option “other”
Respondents will oversee the options provided and handily mark the option “other”.
Chapter 7: Questionnaire

40
Data collection is the most important process in a study. This is because the collection of
accurate data, data analysis and processing are needed to answer the research questions or
objectives in a study. The data we collected or observed should correspond to the purpose of
the study. There are two types of data that can be used in a study, namely primary and
secondary data.
With the availability of secondary data, it can help students or researchers to manipulate
them to achieve different objectives. In addition, it can be used as a reference point or as
comparison to the present study.
In classification of data, it can be classified by who collected the data.
Primary data are data collected by the researcher himself/herself for a specific purpose,
for example data collected by a research students in his/her final year research project.
Secondary data are data collected by someone else for some other purposes, but being
used by the researcher for another purpose.
8.2.1 Using Secondary Data Inferior to Primary Data?
The answer is no. There are some advantages and disadvantages in using primary and
secondary data. Quality is not the issue. However in primary data collection, the researcher
himself/herself will be able to determine the quality of it, whereas in using secondary data,
one can only hope that the data are in good quality.
Environmental Science: Scientific Project Guidelines
8 SECONDARY DATA
SOURCES FOR RESEARCH
8.1 INTRODUCTION
8.2 WHAT IS SECONDARY DATA?

41
8.2.2 What is not Secondary Data?
Whatever data a researcher has obtained first hand by himself/herself are NOT secondary
data and they are considered as primary data. Examples of primary data sources are:
Direct observation
In situ readings
Questionnaires and surveys
Interviews
Laboratory experiments
8.2.3 Sources of Secondary Data
Official Statistics: Official statistics are statistics collected by governments and this
information is readily available in the annual statistic reports. For example the
Department of Statistics Malaysia would have census and surveys for various activities
and even on the environment. The Department of Environment also produces annual
report on the quality of the environment on their website.
Technical reports from completed research project or on-going research projects.
Scientific journals are a good source of secondary information as they usually undergo
peer review and they are first hand reports of original findings.
Review articles are assembles and summaries of the related publications on a specific
topic. Reviews are usually written by experts in the relevant field. The review article will
attempt to give any overview of the latest development and list all the relevant
publication from which the information is derived.
Book (of course).
International organizations: World Health Organization (WHO), Food and Agricultural
Organization (FAO), United Nations Environmental Programme (UNEP) and others.
8.2.4 Where to Begin?
The internet (look for reliable/valid websites)
The library
The references list at the back of a journal, report, book etc.
Various governmental agencies
Chapter 8: Secondary Data Sources for Research

42
Quality control is the key that able to judge the quality of such data. Questions to ask:
Is the source reliable?
Does if include a method section and is the method sound?
When is the source published, is it consistent with the information reported
(Sometimes a year 2011 data can exist in a 2008 report)? Is it up-to-date?
Is it a primary or secondary data?
Is it well referenced?
Does it make sense?
Most of the time, secondary data (as in Literature Review) are used to help us have a
better understanding of the topic that we are researching.
It can also be valuable in generating hypothesis and identifying the areas of interests.
It helps to plan for primary data collection to ensure that the data collected are
comparable with the secondary data.
The analysis of secondary data will also help in identifying the possible root of a problem.
More readily available (can be obtained from public sources) - the secondary data readily
available either online or manually. Some departments or agencies periodically upload
data unto their department's websites
Cost-saving / It is less expensive.
Provide basic idea in designing the new study.
Serve as starting point in preparing the formation of the research problem, research
hypothesis or research methods.
Reliability of data collected by government and commercial research institutions is
probably higher
Time-saving. The study does not need to start or collect any information that was known.
Help decide whether a research should be done.
Help shape the various hypotheses.
There is no hassles for data collection
It is not time consuming
It may allow the researcher to cover a wider spatial or temporal range
8.3 QUALITY CONTROL
8.4 WHY DO WE USE SECONDARY DATA?
8.5 ADVANTAGES OF USING SECONDARY DATA
Chapter 8: Secondary Data Sources for Research

43
Information may be outdated or obsolete. This is because the old data will often cause
dispute if it becomes the primary data in a research.
Concept definition may differ from other studies. Data acquired in the past is to answer
the question at that particular period of time, and it may not be able to answer the
objectives in the current study.
Units of measurement may differ.
Difficult to ascertain the previous research design.
The data may be incomplete and inaccurate (Some researches may be bias during data
collection).
Perhaps there is a conversion of data, thus the secondary data do not follow the format
required by the researchers.
The researcher cannot decide what is collected
One can only hope that the data is of good quality
Incompatibilities
Limited access
Usually researchers will use data observed in the field as control or benchmarking to
maintain and ensure the quality of the secondary data.
8.6 DISADVANTAGES OF USING SECONDARY DATA
Chapter 8: Secondary Data Sources for Research

44
Normal Distribution- The normal distribution is a descriptive model that describes the
distribution of a set of data to represent the situations or phenomena or an experiment. A
normal distribution curve is bell shape. The shape and position of normal distribution
curve depend on two parameters, the mean and standard deviation. The larger the
standard deviation, the more dispersed or spread out, the distribution is. So, normal
distribution is important to identify the distributions of a set of data before analyzing it
further with statistical calculations.
Same Means
Different Standard Deviations
Different Means
Same Standard Deviations
Different Means
Different Standard Deviations
The bell shape normal distribution graph covered 100% or probability-1 of total area
under the graph. The area is important to find the percentage or probability of significant
for decision making for hypothesis of situation or phenomena or experiment to be solved.
Normal Distribution Table (can find it from any statistical text book) is used as a
reference to find the critical value of alpha (α).
Environmental Science: Scientific Project Guidelines
9 STATISTICS FOR
ENVIRONMENTAL
RESEARCH
9.1 INTRODUCTION

45
Area under the graph normal distribution
100% 90% 95% 99% Percentage
1 0.90 0.95 0.99 Probability
α
(chance of
rejecting
the Ho)
0.10 0.05 0.01
The level of significance is the maximum probability
of committing a type I error = α.
• Typical significance levels are:
0.10, 0.05, and 0.01
• When α = 0.01, there is a 10% chance of rejecting a
true null hypothesis (H0).
• When α = 0.05, there is a 5% chance of rejecting a
true null hypothesis (H0).
• When α = 0.10, there is a 1% chance of rejecting a
true null hypothesis (H0).
*Small chance of rejecting shown the persistency to
decision making.
The P-value method or probability value is the probability of getting a sample statistic
(such as the mean) or a more extreme sample statistic in the direction of the alternative
hypothesis when the null hypothesis is true.
-The P-value method for solving hypothesis-testing problems compares areas
between alpha (α) and P-value
A statistical hypothesis is a conjecture about a population parameter. This conjecture
may or may not be true, and a decision is made to reject or not to reject it on the basis of
the data obtained from a sample.
Distinguishing Features • The mean ± 1 standard deviation covers
68% of the area under the curve • The mean ± 2 standard deviation covers
95% of the area under the curve • The mean ± 3 standard deviation covers
99% of the area under the curve
P-value > α = Do not reject H0 P-value < α = reject H0
Chapter 9: Statistic for Environmental Research

46
The null hypothesis, (H0) is a statistical hypothesis that states that there is no difference
between a parameter and a specific value, or that there is no difference between two
parameters.
The alternative hypothesis, (Ha) is a statistical hypothesis that states the existence of a
difference between a parameter and a specific value, or states that there is a difference
between two parameters.
Example:
Title: Measured pollutant-Lead (Pb) inside fish tissue and water from FSSA Lake.
Objective 1: To determine the Pb concentration in fish tissue.
Ho: There is no Pb present in fish tissue.
Ha: There is Pb present in fish tissue.
Objective 2: To determine the Pb concentration in water.
Ho: There is no Pb present in water.
Ha: There is Pb present in water.
Objective 3: To determine the significant different between Pb concentration in fish
tissue and water.
Ho: There is no significant different between Pb present in fish tissue and water.
Ha: There is a significant different between Pb present in fish tissue and water.
The student / researcher should distinguish between statistical significance and
practical significance.
When the null hypothesis is rejected at a specific significance level, it can be concluded that
the difference is probably not due to chance and thus is statistically significant. However,
the results may not have any practical significance.
It is up to the student / researcher to use common sense when interpreting the results of a
statistical test.
9.2 SIGNIFICANT IN STATISTIC
Chapter 9: Statistic for Environmental Research

47
Statistics is a branch of mathematics that has applications in almost every facet of our daily
life. The field of statistics is composed of both theory and methods that govern its application.
In this text, it shall look on statistics as a methodological tool in analyzing numerical data to
make better decision.
9.3.1 Descriptive Statistics
Descriptive statistics is the branch of statistics concerned with describing set of
measurements, both samples and population. Also, consist of procedures used to summarize
and describe the important characteristics of set of measurement. It consists of the collection,
organization, summarization, and presentation of data.
Bar Chart & Pie Chart
Numerical Tables
Sampling River Station Parameter Data Replicates (ppm)
January A 1
Zn 12.0
11.5
13.2
Cu 10.0
12.6 13.0
Pb 0.5 0.8 0.9
9.3 STATISTICS
Chapter 9: Statistic for Environmental Research
Descriptive Statistics
Statistics
Inferential Statistics

48
Line Graph
9.3.2 Inferential Statistics
Inferential statistics is the branch of statistics that deals with problem. Also, consists of
procedures used to make inferences about population characteristics from information
contained. It consists of generalizing from samples to populations, performing estimations
and hypothesis tests, determining relationships among variables, and making predictions.
The inferential statistics involves determining whether a relationship between two or more
numerical or quantitative variables exists.
9.4.1 Range
The data set obtained by observing the values of a variable for an entire population is called
population data. A data set obtained by observing the values of a variable for a sample of the
population is called sample data. The data set from observation has a smallest and largest
numbers or minimum and maximum values. The difference of minimum and maximum is
called range.
Range = Xmax - Xmin
9.4.2 Mean
The most commonly used measure of center is the mean. When people speak of taking an
average, it is the mean that they are most often referring to. The mean of a data set is the sum
of the observations divided by the number of observation. Researcher used mean as a
number to represent a set of data that used in an experiment had been done.
9.4 BASIC INFERENTIAL STATISTICS
Chapter 9: Statistic for Environmental Research

49
Mean, N
XX
N
xxxx i......321
Where,
X = measured value of item
N = size of sample
9.4.3 Variance
Variance is the average of the squares of the distance each value is from the mean. Variance is
to find how far all observation is from the mean, the total deviation from the mean. The
symbol sample variance (S2) and population variance (σ2).
N
xxx
N
xi
22
2
2
1
2
2 ....
1
....
1
22
2
2
1
2
2
n
xxxxxx
n
xxS i
9.4.4 Standard Deviation (SD)
In contrast to the range, the standard deviation takes into account all of the observations. To
describe that quantitatively, we use a descriptive measure that indicates the amount of
variation or spread in a data set. Such descriptive measures are referred to as measures of
variation or measures of spread. The standard deviation measures variation by indicating
how far, on average, the observation are from the mean. For a data set with a large amount of
variation, the observations will, on the average, be far from the mean; hence the standard
deviation will be large. For a data set with a small amount of variation, the observations will,
on the average, be close to the mean; consequently, the standard deviation will be small. So,
standard deviation is to find how far each observation is from the mean, the deviation from
the mean.
To compute the standard deviation of a data set, we need to know whether it is population
data or sample data. This information is necessary because the formulas for standard
deviations of sample data and population data differ slightly. The symbol sample data (s) and
population data (σ).
N
xxx
N
xi
22
2
2
1
2....
Chapter 9: Statistic for Environmental Research

50
1
....
1
22
2
2
1
2
n
xxxxxx
n
xxS i
Where, N & n = Number of sample
Until this point, all the inferential statistics we have considered involve using one sample as
the basis for drawing conclusion about one population. Although these single sample
techniques are used occasionally in real research, most research studies aim to compare of
two (or more) sets of data in order to make inferences about the differences between two (or
more) populations.
9.5.1 Student T-Test for Two Population Mean (used table t-distribution)
ASSUMPTIONS
1. Independent samples
2. Normal populations or large samples
3. Equal population standard deviations
Step 1: The null hypothesis is Ho: µ1 = µ2 and the alternative hypothesis is one of the
following:
Ha: µ1 ≠ µ2 or Ha: µ1 < µ2 or Ha: µ1 > µ2 (Two-tailed) (Left-tailed) (Right-tailed)
Step 2: Decide on the significance level, α.
Step 3: The critical value(s) are
± t α/2 or -t α or tα
(Two-tailed) (Left-tailed) (Right-tailed)
With df = n1 + n2 - 2. Use Normal Distribution Table to find the critical value(s)
9.5 COMPARISON OF TWO MEANS
Chapter 9: Statistic for Environmental Research
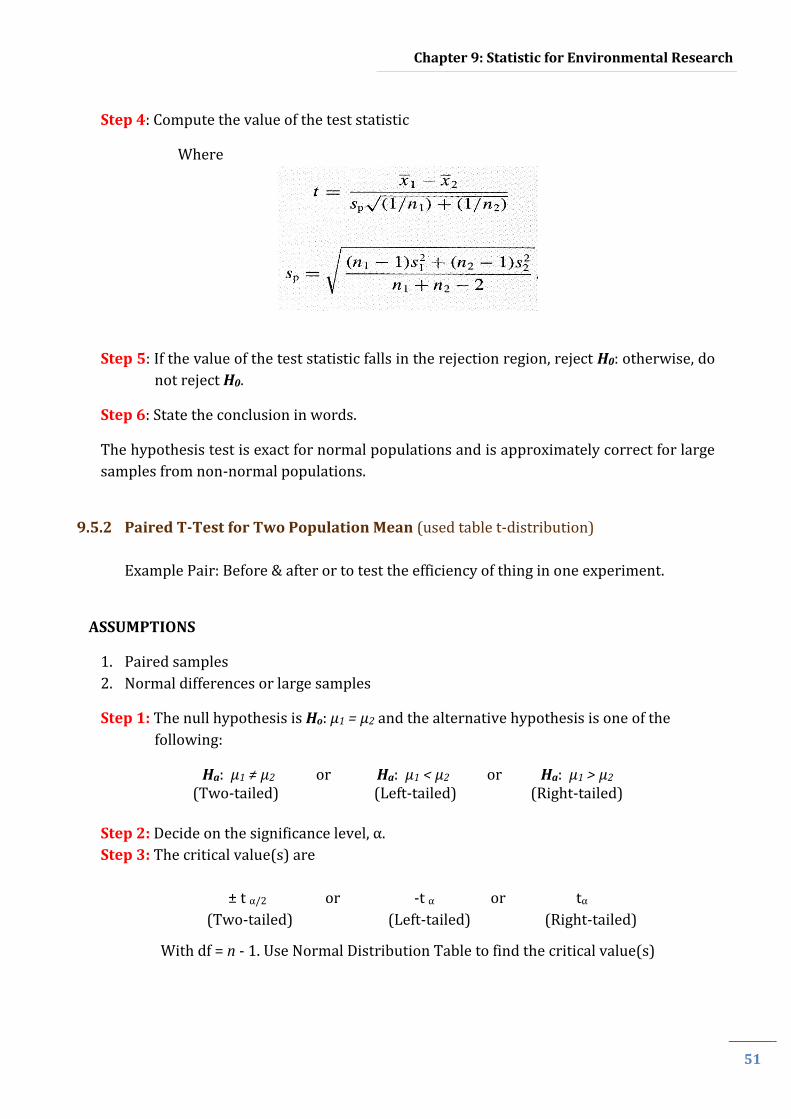
51
Step 4: Compute the value of the test statistic
Where
Step 5: If the value of the test statistic falls in the rejection region, reject H0: otherwise, do
not reject H0.
Step 6: State the conclusion in words.
The hypothesis test is exact for normal populations and is approximately correct for large
samples from non-normal populations.
9.5.2 Paired T-Test for Two Population Mean (used table t-distribution)
Example Pair: Before & after or to test the efficiency of thing in one experiment.
ASSUMPTIONS
1. Paired samples
2. Normal differences or large samples
Step 1: The null hypothesis is Ho: µ1 = µ2 and the alternative hypothesis is one of the
following:
Ha: µ1 ≠ µ2 or Ha: µ1 < µ2 or Ha: µ1 > µ2 (Two-tailed) (Left-tailed) (Right-tailed)
Step 2: Decide on the significance level, α.
Step 3: The critical value(s) are
± t α/2 or -t α or tα
(Two-tailed) (Left-tailed) (Right-tailed)
With df = n - 1. Use Normal Distribution Table to find the critical value(s)
Chapter 9: Statistic for Environmental Research

52
Step 4: Calculate the paired differences of the sample pairs.
Step 5: Compute the value of the test statistic
Where
Where D = The paired differences ( Xafter – Xbefore)
D = Mean for data D
SD = Standard deviation for D
µD = 0
Make the decision
CV > t = Do not reject H0
CV < t = Reject H0
Step 6: If the value of the test statistic falls in the rejection region, reject H0: otherwise, do
not reject H0.
Step 7: State the conclusion in words.
D
D
Dt
s n
2 2
with d.f. = -1 and where
and 1
D
n
n D DDD s
n n n
Chapter 9: Statistic for Environmental Research

53
Correlation is a statistical method used to determine whether a linear relationship between
variables exists.
.
The correlation coefficient (r) computed from the sample data measures the strength
and direction of a linear relationship between two variables.
The range of the correlation coefficient (r) is from 1 to 1
2 22 2
n xy x yr
n x x n y y
n= numbers of data pairs
Significant t-test for correlation coefficient, r
*The t-test is used to support the r, where it is significant at which level either 0.05 or
0.01 or not significant at all. Only the value of r with significant level will accepted, Ha.
Hypothesis testing
H0: 0 (there is no correlation between the x and y variables in the population)
Ha: 0 (there is a significant correlation between the variables in the population)
2
2
1
with degrees of freedom equal to 2.
nt r
r
n
9.6 CORRELATION
Statistical Relationship
Correlation & Regression
Chapter 9: Statistic for Environmental Research

54
Step Procedure:
1. Find the hypothesis
2. Find the critical value (CV) using α, d.f = n - 2 in table t-distribution
3. Compute the test value (t)
4. Make the decision
CV > t = Do not reject H0
CV < t = Reject H0
Regression is a statistical method used to describe the nature of the relationship between
variables—that is, positive or negative, linear or nonlinear. If the value of the correlation
coefficient is significant, the next step is to determine the equation of the regression line
which is the data’s line of best fit. Best fit means that the sum of the squares of the vertical
distance from each point to the line is at a minimum.
Graph Regression: regression equation line, y ’ = a + bx
2
22
22
where
= intercept
= the slope of the line.
y x x xya
n x x
n xy x yb
n x x
a y
b
Multiple Regression Coefficient ( R)
In multiple regressions, the strength of the relationship between the independent
variables and the dependent variable is measured by a correlation coefficient.
1 2 1 2 1 2
1 2
2 2
2
2
1
yx yx yx yx x x
x x
r r r r r
rR
where
ryx1 = correlation coefficient for y and x1
ryx2 = correlation coefficient for y and x2
rx1x2 = correlation coefficient for x1 and x2
9.7 REGRESSION
Chapter 9: Statistic for Environmental Research

55
Significant f-test for R
*The f-test is used to support the R, where it is significant at which level either 0.05 or
0.01 or not significant at all. Only the value of R with significant level will accepted, Ha.
2
21 1
R k
R n kF
where
n = the number of data groups
k = the number of independent variables
d.f.N. = n – k
d.f.D. = n – k – 1
Step Procedure: 1. Find the hypothesis 2. Find the critical value (CV) using α, dfN and dfD in table F-distribution 3. Compute the test value (F) 4. Make the decision
CV > F = Do not reject H0
a) Title: Zn and Cu in Mollusk at River A
b) Objective
1. To determine the Zn and Cu distribution in mollusk tissue
2. To determine the relationship between Zn and Cu in mollusk tissue
c) Design of Data Collection
Media Sampling Parameter Location Station Replicate N
Mollusk
1 species live at
surface sediment
(sampling 2x)
Zn, Cu
(2)
River
A (1) 0 15
2 x 2 x 1 x
15 = 80
9.8 CASE STUDY
Chapter 9: Statistic for Environmental Research
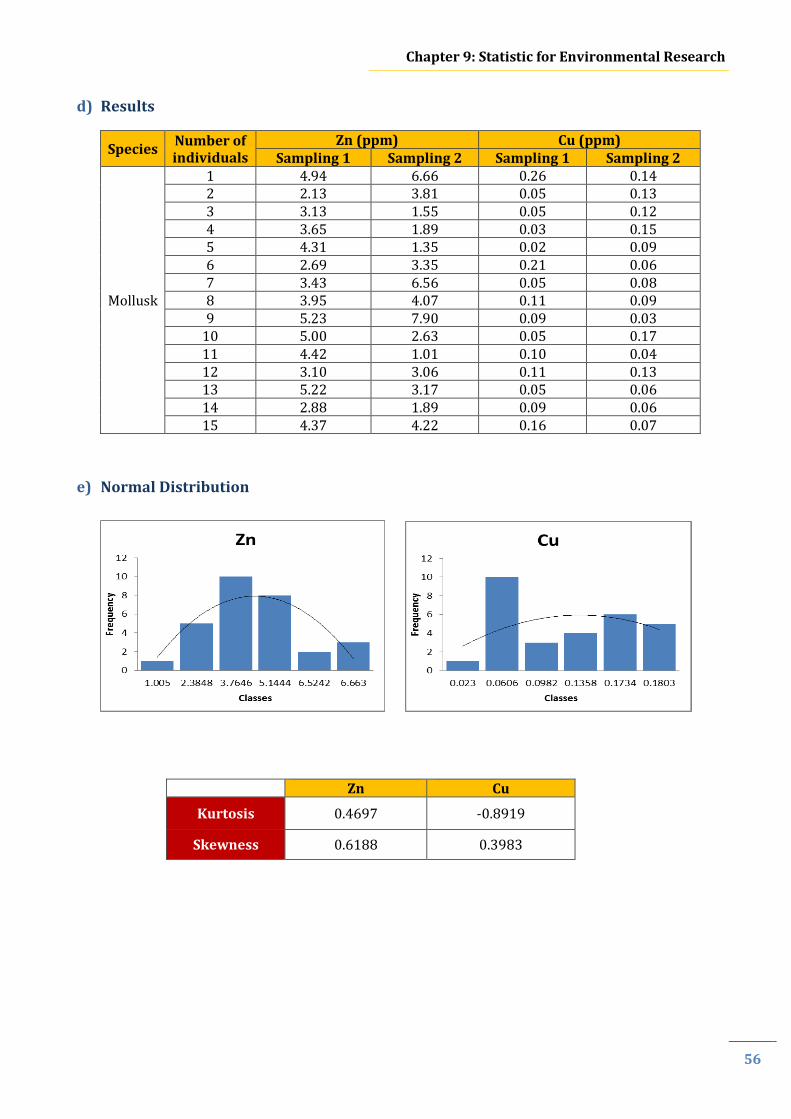
56
d) Results
Species Number of individuals
Zn (ppm) Cu (ppm) Sampling 1 Sampling 2 Sampling 1 Sampling 2
Mollusk
1 4.94 6.66 0.26 0.14 2 2.13 3.81 0.05 0.13 3 3.13 1.55 0.05 0.12 4 3.65 1.89 0.03 0.15 5 4.31 1.35 0.02 0.09 6 2.69 3.35 0.21 0.06 7 3.43 6.56 0.05 0.08 8 3.95 4.07 0.11 0.09 9 5.23 7.90 0.09 0.03
10 5.00 2.63 0.05 0.17 11 4.42 1.01 0.10 0.04 12 3.10 3.06 0.11 0.13 13 5.22 3.17 0.05 0.06 14 2.88 1.89 0.09 0.06 15 4.37 4.22 0.16 0.07
e) Normal Distribution
Zn Cu
Kurtosis 0.4697 -0.8919
Skewness 0.6188 0.3983
Chapter 9: Statistic for Environmental Research

57
f) Basic Inferential Analysis for Zn
Species Number of individuals
Zn (ppm)
Sampling 1 x- x (x- x )2 Sampling 2 x- x (x- x )2
Mollusk
1 4.9390 1.0441 1.0901 6.6630 3.1227 9.7513
2 2.1250 -1.7699 3.1325 3.8130 0.2727 0.0744
3 3.1300 -0.7649 0.5851 1.5490 -1.9913 3.9653
4 3.6480 -0.2469 0.0610 1.8870 -1.6533 2.7334
5 4.3060 0.4111 0.1690 1.3460 -2.1943 4.8150
6 2.6870 -1.2079 1.4590 3.3480 -0.1923 0.0370
7 3.4260 -0.4689 0.2199 6.5630 3.0227 9.1367
8 3.9460 0.0511 0.0026 4.0690 0.5287 0.2795
9 5.2290 1.3341 1.7798 7.9040 4.3637 19.0419
10 5.0000 1.1051 1.2212 2.6300 -0.9103 0.8286
11 4.4160 0.5211 0.2715 1.0050 -2.5353 6.4277
12 3.0960 -0.7989 0.6382 3.0580 -0.4823 0.2326
13 5.2240 1.3291 1.7665 3.1680 -0.3723 0.1386
14 2.8800 -1.0149 1.0300 1.8860 -1.6543 2.7367
15 4.3710 0.4761 0.2267 4.2160 0.6757 0.4566
Sum of X 58.4230 13.6533 53.1050 60.6552
N 15 15
Minimum Data
2.1250
1.0050
Maximum Data
5.2290
7.9040
Range = Xmax - Xmin
Sampling 1 = 5.2290 - 2.1250 = 3.1040 Sampling 2=7.9040 – 1.0050 = 6.8990
Mean ( x ) = Σ X/N = (X1+X2+X3…Xi) / N
Sampling 1 =58.4230/15 = 3.8949 Sampling 2= 53.1050/15 = 3.5403
Variance S2 = ∑(X-X)2 = (X1-X)2+ (X2-X)2+… (Xi-X)2 n-1 n-1
Sampling 1 = 13.6533/14 = 0.9752 Sampling 2= 60.6552/14 = 4.3325
Standard deviation S = √ S2
Sampling 1= (0.9752)1/2 = 0.9875 Sampling 2= (4.3325)1/2= 2.0814
Chapter 9: Statistic for Environmental Research
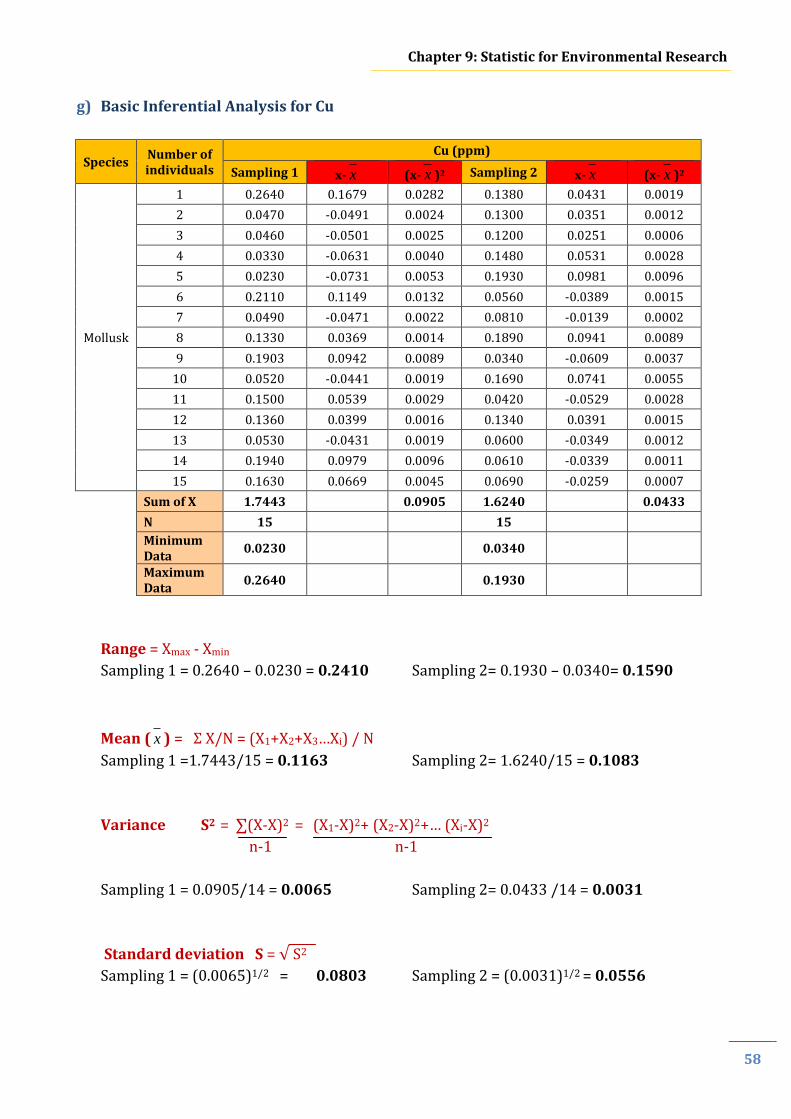
58
g) Basic Inferential Analysis for Cu
Species Number of individuals
Cu (ppm)
Sampling 1 x- x (x- x )2 Sampling 2 x- x (x- x )2
Mollusk
1 0.2640 0.1679 0.0282 0.1380 0.0431 0.0019
2 0.0470 -0.0491 0.0024 0.1300 0.0351 0.0012
3 0.0460 -0.0501 0.0025 0.1200 0.0251 0.0006
4 0.0330 -0.0631 0.0040 0.1480 0.0531 0.0028
5 0.0230 -0.0731 0.0053 0.1930 0.0981 0.0096
6 0.2110 0.1149 0.0132 0.0560 -0.0389 0.0015
7 0.0490 -0.0471 0.0022 0.0810 -0.0139 0.0002
8 0.1330 0.0369 0.0014 0.1890 0.0941 0.0089
9 0.1903 0.0942 0.0089 0.0340 -0.0609 0.0037
10 0.0520 -0.0441 0.0019 0.1690 0.0741 0.0055
11 0.1500 0.0539 0.0029 0.0420 -0.0529 0.0028
12 0.1360 0.0399 0.0016 0.1340 0.0391 0.0015
13 0.0530 -0.0431 0.0019 0.0600 -0.0349 0.0012
14 0.1940 0.0979 0.0096 0.0610 -0.0339 0.0011
15 0.1630 0.0669 0.0045 0.0690 -0.0259 0.0007
Sum of X 1.7443
0.0905 1.6240
0.0433
N 15
15
Minimum Data
0.0230
0.0340
Maximum Data
0.2640
0.1930
Range = Xmax - Xmin
Sampling 1 = 0.2640 – 0.0230 = 0.2410 Sampling 2= 0.1930 – 0.0340= 0.1590
Mean ( x ) = Σ X/N = (X1+X2+X3…Xi) / N
Sampling 1 =1.7443/15 = 0.1163 Sampling 2= 1.6240/15 = 0.1083
Variance S2 = ∑(X-X)2 = (X1-X)2+ (X2-X)2+… (Xi-X)2 n-1 n-1
Sampling 1 = 0.0905/14 = 0.0065 Sampling 2= 0.0433 /14 = 0.0031
Standard deviation S = √ S2
Sampling 1 = (0.0065)1/2 = 0.0803 Sampling 2 = (0.0031)1/2 = 0.0556
Chapter 9: Statistic for Environmental Research

59
h) Comparison of Two Means (always refer back to your data collection & design)
Objective 1: To determine the Zn and Cu distribution in mollusk tissue
The distribution of Zn and Cu is refer to the significant different between sampling 1 and
2.
i) T-Test for Two Population Mean
We assumed that we used different individuals of mollusk in both sampling 1 and 2.
Step 1: Hypothesis
Ho: There is no significant different Zn concentration in mollusc between sampling 1
and 2.
Ha: There is significant different Zn concentration in mollusc between sampling 1 and
2.
Step 2: Decided on the significant level, α = 0.05
Step 3: The Critical Value from T-Distribution table is ttwo tailed=1.701
(df = n1+n2-2=15+15-2= 28)
Step 4: Test Statistic value, ttest
Zn
Sampling 1 Sampling 2
x 3.8949 3.5403
n 15 15
S2 0.9752 4.3325
2
11
21
2
22
2
11
nn
snsnsP
21515
3325.41159752.0115
28
6550.606528.13
65385.2 =1.6291
Chapter 9: Statistic for Environmental Research

60
PS
nn
xxt
21
21
11
6291.1
15
1
15
1
5403.38949.3
t
6291.1 1333.0
3546.0t =9.4471
Step 5: Critical value ttwo tailed=1.701 less than Test statistical value ttest =9.4471, falls in
rejection region. So, Reject Ho.
Step 6: There is significant different data at α = 0.05 of Zn concentration in mollusk
between sampling 1 & 2. This study shown, the mollusks collected randomly have
different Zn concentration in each individual.
j) Paired T-Test for Two Population Mean
We use the same size individual of mollusk in sampling 1 and 2. Typically, paired T-Test is
used to check the efficiency before and after treatment. So, the same size of mollusk in this
case study will determine the efficiency of accumulation of Zn and Cu by mollusk in
specific size.
Step 1: Hypothesis
Ho: There is no significant different Zn concentration in mollusc (<5cm length)
between sampling 1 and 2.
Ha: There is significant different Zn concentration in mollusc (<5cm length) between
sampling 1 and 2.
Step 2: Decided on the significant level, α = 0.05
Step 3: The Critical Value from T-Distribution table is ttwo tailed=1.761
(df = n - 1=15-1= 14)
Chapter 9: Statistic for Environmental Research

61
Step 4: Calculated the different between pairs.
Number of individuals
Zn
Sampling 1 (before) Sampling 2 (after) D D2
1 4.9390 6.6630 -1.7240 2.9722
2 2.1250 3.8130 -1.6880 2.8493
3 3.1300 1.5490 1.5810 2.4996
4 3.6480 1.8870 1.7610 3.1011
5 4.3060 1.3460 2.9600 8.7616
6 2.6870 3.3480 -0.6610 0.4369
7 3.4260 6.5630 -3.1370 9.8408
8 3.9460 4.0690 -0.1230 0.0151
9 5.2290 7.9040 -2.6750 7.1556
10 5.0000 2.6300 2.3700 5.6169
11 4.4160 1.0050 3.4110 11.6349
12 3.0960 3.0580 0.0380 0.0014
13 5.2240 3.1680 2.0560 4.2271
14 2.8800 1.8860 0.9940 0.9880
15 4.3710 4.2160 0.1550 0.0240
Sum of X 5.3180 60.1247
Step 5: Test Statistic value, ttest
Mean, n
DD
15
3180.5 = 0.3545
)1(
22
nn
DDnSD
)14(15
1247.60318.5152
210
1247.602167.424 7337.1 = 1.3167
n
S
Dt
D
D
15
3167.1
03545.0
3400.0
3545.0 = 1.0428
Step 6: Critical value ttwo tailed=1.761 more than Test statistical value ttest =1.0428, falls in
non- rejection region. So, Do Not Reject Ho.
Step 7: There is no significant different data at α = 0.05 of Zn concentration in mollusk
(<5cm length) between sampling 1 and 2. This study shown, the mollusk with size <5cm
length is not very efficient to accumulated the Zn from environment.
Chapter 9: Statistic for Environmental Research

62
k) Relationship Analysis
Objective 2: To determine the relationship between Zn and Cu in mollusk tissue
We want to find out the relationship of influencing each element in mollusk which is Zn
and Cu. Sometimes, the elements can influencing each other to present in any material.
l) Correlation Coefficient (r)
Number of Individuals
Zn Cu
x y xy x2 y
2
1 4.9390 0.2640 1.3039 24.3937 0.0697
2 2.1250 0.0470 0.0999 4.5156 0.0022
3 3.1300 0.0460 0.1440 9.7969 0.0021
4 3.6480 0.0330 0.1204 13.3079 0.0011
5 4.3060 0.0230 0.0990 18.5416 0.0005
6 2.6870 0.2110 0.5670 7.2200 0.0445
7 3.4260 0.0490 0.1679 11.7375 0.0024
8 3.9460 0.1330 0.5248 15.5709 0.0177
9 5.2290 0.1903 0.9951 27.3424 0.0362
10 5.0000 0.0520 0.2600 25.0000 0.0027
11 4.4160 0.1500 0.6624 19.5011 0.0225
12 3.0960 0.1360 0.4211 9.5852 0.0185
13 5.2240 0.0530 0.2769 27.2902 0.0028
14 2.8800 0.1940 0.5587 8.2944 0.0376
15 4.3710 0.1630 0.7125 19.1056 0.0266
16 6.6630 0.1380 0.9195 44.3956 0.0190
17 3.8130 0.1300 0.4957 14.5390 0.0169
18 1.5490 0.1200 0.1859 2.3994 0.0144
19 1.8870 0.1480 0.2793 3.5608 0.0219
20 1.3460 0.1930 0.2598 1.8117 0.0372
21 3.3480 0.0560 0.1875 11.2091 0.0031
22 6.5630 0.0810 0.5316 43.0730 0.0066
23 4.0690 0.1890 0.7690 16.5568 0.0357
24 7.9040 0.0340 0.2687 62.4732 0.0012
25 2.6300 0.1690 0.4445 6.9169 0.0286
26 1.0050 0.0420 0.0422 1.0100 0.0018
27 3.0580 0.1340 0.4098 9.3514 0.0180
28 3.1680 0.0600 0.1901 10.0362 0.0036
29 1.8860 0.0610 0.1150 3.5570 0.0037
30 4.2160 0.0690 0.2909 17.7747 0.0048
Sum of Data 111.5280 3.3683 12.3029 489.8677 0.5036
Chapter 9: Statistic for Environmental Research

63
Step 1: Hypothesis
H0: 0 (there is no correlation between the Zn and Cu in the population of mollusk)
Ha: 0 (there is a significant correlation between the Zn and Cu in the population of
mollusk)
Step 2: Decided on the significant level, α = 0.05
Step 3: The Critical Value from T-Distribution table is ttwo tailed =1.701 (d.f = n-2 = 30-
2=28)
Step 4: Correlation coefficient (r)
2222
yynxxn
yxxynr
223683.35036.0305280.1118677.48930
3683.35280.1113029.1230
r
3454.111084.154948.124380315.14696
6598.3750867.369
r
9250.8494
5731.6r = -0.0713
Step 5: Test Statistic value, ttest:
r
r
nt
21
2
0713.0
20713.01
28
0713.0
9949.0
28 = 0.7882
Step 6: Critical value ttwo tailed=1.701 more than Test statistical value ttest =0.7882, falls in
non- rejection region. So, Do Not Reject Ho.
Step 7: There is no correlation relationship (r= -0.0713, P<0.05) between the Zn and Cu in
the population of mollusk. This study shown, there is no influencing from both elements in
mollusk. Both elements are independent.
Chapter 9: Statistic for Environmental Research

64
m) Regression (using Microsoft Excel to create the graph and add the tradeline)
The figure below shown the equation regression line 0027.40184.0 xy and
R2=0.0101, so, 1005.00101.0 R (In this case, there is a no relationship among the
variables; the value of R is far from 1.00)
The figure below shown the equation regression line 1233.00007.0 xy and
R2=0.0091, so, 0954.00091.0 R (In this case, there is a no relationship among the
variables; the value of R is far from 1.00)
The figure below shown the equation regression line 0027.40184..0 xy and
R2=0.0101, so, 1005.00101.0 R (In this case, there is a no relationship among the
variables; the value of R is far from 1.00)
Chapter 9: Statistic for Environmental Research

65
Project proposal and final report writing must follow the format set by the Faculty of Science
and Natural Resources (FSSA), where students must refer to “Panduan Penulisan Disertasi”
book. Students also need to seek their supervisors’ approval before submitting the proposals
and full report to FSSA main office.
10.1.1 Scientific Project Proposal
Towards the end of the first semester, each student is required to submit two (2) copies of
their project proposals to be evaluated. The content of the project proposal report must
follow the format given below.
Front Page Table of Content List of Tables List of Figures List of Symbols and Abbreviations Chapter 1 Introduction Chapter 2 Literature Review Chapter 3 Methodology References
10.1.2 Scientific Project Final Report
Student is required to submit two (2) copies of their final report at the end of the second
semester to be evaluated. The content of the final report must follow the format given below.
10.1 SCIENTIFIC PROJECT REPORT OUTLINE
SCIENTIFIC PROJECT
REPORT
Environmental Science: Scientific Project Guidelines
10

66
Front page Declaration Verification Acknowledgement Abstrak Abstract Table of Content List of Tables List of Figures List of Symbols and Abbreviations Chapter 1 Introduction Chapter 2 Literature Review Chapter 3 Methodology Chapter 4 Results and discussion Chapter 5 Conclusion References Appendix
10.2.1 General Tips
a) Be concise. The report should be written scientifically, whereby it has to be clear and
straightforward. It is very important to use as few words as possible but at the same time
manage to cover as much details as needed. Scientific reports should be comprehensive
and repetition should be avoided.
b) Write in third person sentence structure. The report should be written using the third
person and all activities must be described in the past tense (except future activities
outlined in the proposal report). For example, do not use ‘I’, ‘you’ or ‘we’ in the report.
Instead of:
"I have analyzed the experimental results" write "The experimental results have
been analyzed".
“We have conducted a water quality test for the untreated gravity water resource”
change to “The study has conducted a water quality test for the untreated gravity
water resource”.
“From this study if anyone is interested to venture into oil palm as a source of
income, he or she could plan to buy a suitable land size and the area that could
derive a maximum revenue from the oil palm yields” change to third person
sentence “From this study, in oil palm venture it is found that the land size and the
land area the important factors that can maximize the revenue of the oil palm
yields”.
Chapter 10: Scientific Project Report
10.2 REPORT FORMAT

67
“According to farm supervisor Mr. Soreal Mansor (2013), many palm trees in oil
palm plantations in Jerudo were planted in mid-2005 and 2006 and this resulted in
the yield production for 2010 to 2011 did not reach the maximum production for
oil palm age immature of 6 to 7 years” change to “According to Soreal Mansor
(2013), many palm trees in oil palm plantations in Jerudo were planted in mid-
2005 and 2006 and this resulted in the yield production for 2010 to 2011 did not
reach the maximum production for oil palm age immature of 6 to 7 years”.
c) Language. The proposal report and final report should be written in Bahasa Melayu.
Permission from both the supervisor and the Dean of Faculty of Science and Natural
Resources is required to write a report in English. The style of writing should be formal
and easily understood by readers. It is very important to use proper Bahasa Melayu @
English grammar and sentence structure. If other languages are used, it must be italicized.
For example:
Penyelidikan ke atas genom manusia atau human genome.
This is adopted from the Akta Kualiti Alam Sekeliling 1974.
Kajian ini bertujuan untuk mengenalpasti perubahan morfologi permukaan
cengkerang dan kulit telur sebelum dan selepas rawatan dengan menggunakan
Scanning Electron Microscopy (SEM).
The concentrations of heavy metals are successfully reduced to below maximum
admissible limit set by Piawaian Kualiti Air Minuman Kebangsaan Malaysia.
10.2.2 Chapter Content
Every chapter has specific content that describes the process, progress and results of the
project. The outline content of what should go into each chapter of the report writing or
project report is given below.
a) Introduction
Introduction contains background of research and problem statement/issues that indicates
its importance and validity with clear-cut, precise, concise and explicit explained. The
introduction should include a full but concise statement of:
i. The background to the investigation, briefly stating the significance and contribution
reasons of this research governing the need for the investigation. This background
should reflect the title of the project.
ii. Problem statement including the precise definition and importance. Introduction
should avoid very technical definitions and statements (present them in Chapter 2).
Chapter 10: Scientific Project Report

68
iii. The main aims or objectives of the investigation. The main objectives of the study
together with the outline of research must be as concise as possible and should not
contain argument or discussion.
iv. The scope of research must be spelled-out clearly together with limitations. It should
have a good flow, natural, style of writing and should read like a story.
v. Research contributions or proposed solutions (why they are expected to be better or
essence of the idea(s) used in proposed solutions), research conditions, assumptions
and limitations of the research done.
b) Literature Review
For scientific projects, literature review gives some current information on research findings
based on previous study related to the research topic. In this section, student must provide a
brief, clear statement of the rationale for their approach to the problem studied. Student need
to express the different views of the research topic that will be essential for the development
of the framework for research. Student also must have an original critical opinions not just
reporting from previous research. Student can use the previous research and presented in the
forms of paraphrase, quotation or simply stating the data from the source.
All references selected must be up-to-date. Student must evaluate all the information
retrieved (books, journals, magazines, thesis, internet or articles) and write a summary on its
significance to the research project. It should be relevant, sensible and concise with original
evidence. All reference sources in text must be recorded clearly with correct format citations
and listed in the references chapter. In this chapter also, student can review about techniques,
methods, equipment or technology that has been used in previous study or will be used in the
project.
c) Methodology
This chapter reports on the overall approach and framework chosen during design and
implementation of the scientific project. Research methodology describes the methods and
techniques used such as sampling stations, types of sample, variables and measurement,
type/method of data collection, instrumentation and techniques of data analysis. The
parameters used in research methodology must reflect the theoretical framework so that the
objectives of study can be attained.
The methodology chapter should include the followings:
i. Introduction: A brief introduction highlighting the general methodology, sampling site
and structure of the chapter.
Chapter 10: Scientific Project Report

69
ii. Research Design: In research designs, it will provide the structure of the scientific
research and student carefully planning the research approach. The student should
identify, define and provide justification/rationale of the choice of specific methods used
and cite the methods source. The research study can be conducted based on the nature
of study. There are several elements will be considered: sampling type, how the data be
collected/ generated, how will the data be analyzed, how to obtain results and how to
identify and acknowledge any issues or barriers.
iii. Sampling methods: In this section, detailed description of sampling method and the
actual sample size should be provided.
iv. Data Collection Methods: Student should describe the major methods for collecting
data from the subjects. Data collection and sampling can be carried out in the form of
quantitative or qualitative measurements. All equipment / instrument should be
specified fully (i.e. model numbers, reference numbers). This specification may also
include the accuracy, validity and reliability of the equipment used.
v. Research Procedures: A detailed description of the steps taken in the conduct of
scientific research should be provided. Student should provide a complete step of the
research process. In case of experiments, make sure sufficient information will be given
so that anyone wishing to repeat the experiments will be able to do so and obtain similar
experimental results. Procedures may also be able to be simplified in flow chart form.
vi. Data Analysis Methods: The student should identify and describe appropriate data
analysis methods for the study. Two types of data analysis method:
Quantitative approaches in terms of descriptive statistics or inferential statistics,
data analysis tools in terms of computer application packages (Excel, SPSS or SAS)
or data presentation methods in terms of tables, graphs or charts.
Qualitative data should be summarized and categorized according to common
themes and presented in frequency distribution tables.
d) Result & Discussion
This chapter is generally considered as the most critical section of the scientific Project 2. The
findings should be presented and analysed on the basis of the specific objectives, hypotheses
or research questions. The results section always begins with text, reporting the main results
without interpretation. Write the text of the Results section concisely, objectively and logical
sequence using both text and illustrative materials. If the study didn’t get the anticipated or
negative results, it should be reported and it may mean that the hypothesis was incorrect and
needs to be reformulated or further research is needed.
Chapter 10: Scientific Project Report

70
Discussion section will provide interpretation and the analysis of the results by comparing
them to the findings of previous studies or theoretical background presented in the literature
review.
Result written style including:
Tables, charts or graphs should be used to present quantitative data along with the
explanation.
All tables, graphs or chart should be referred directly within the text, in such a way in
describing the outcomes of the study. If the information can summarize in one
sentence, then a table or graph is not necessary.
Report findings must write in the past tense.
Avoid present the same data in both a table and figure. Decide whether a figure or
table is the more effective way to present the data.
Avoid report raw data, unless the raw data is more critical. Raw data can be including
in an Appendix.
Result findings must be present in a clear and easy to understand manner.
Discussion written style including:
The topics of the discussion should follow the same order as the Results section.
Interpret the results of each of the studies presented in the Results.
Focus on whether results supported specific hypotheses presented in the introduction
and the cited literature.
Describe limitations of the research, potential applications of the findings, and ideas
for further research
e) Conclusion and Recommendation
This chapter highlights the findings along with recommendation for future research of the
study upon which a conclusion is drawn in line with the objectives of project. Be specific
when drawing conclusions. Conclusions should be based on real results of the project. It is not
necessary that all the conclusions are positive. Negative conclusions are sometimes more
valuable than positive ones. It is suitable as well to discuss in this chapter the alternative
methods that could be taken to solve the identified research problems and suggestions for
future research work based on the findings and conclusions generated from the study. It also
can include the contribution of this study towards end-user communities or societies.
Chapter 10: Scientific Project Report

71
f) References
References are the detailed description of resources from which information, theory or ideas
were obtained in preparing the scientific project report. A proper format of citations must be
followed which come from books, journals, magazines, thesis, articles, internet, etc. The detail
references written format should follow the “Panduan Penulisan Disertasi” FSSA book. The
details of every references cited in the text MUST be listed in this chapter and list in
alphabetical order. If more than one published materials by the same author are cited, these
materials should be listed chronologically. Articles in PDF format are acceptable for reference
and internet information should only be treated as secondary or supporting reference.
Appendix C show easy step to compile a cited sources.
g) Abstract
Abstract is a single sheet which gives an overview of the whole report and it is required with
all research projects. The abstract should never exceed one page (not exceeding 200-300
words) and should be considered as an alternative to reading the whole report, not as an
introduction to it. An abstract summarizes the main point of a piece of writing that includes
the field of study, the aim of the project, problem definition, methodology adopted, research
process, results and conclusions reached. It should be written only when almost all section of
the report have been completed. Abstracts typically serve to help readers decide if they
should read an entire article and to understand the achievement of report project by acting as
a pre-reading outline of key points. An abstract in both Bahasa Melayu and English are
required. Bahasa Melayu report written must include abstract and title project in English, and
vice versa. Both abstract and abstrak sections should be separated.
h) Appendices
The appendices are supplementary materials that are not compulsory for the report but help
in better understanding. Material that would seriously obstruct the flow of the text or ideas of
the report should also be placed into appendices. This could be extensive technical details or
explanation of mathematical derivation/procedures, lists of numerical data, maps and extra
photographs, analysis output, diagrams of specialized equipment, questionnaire form etc. as
additional information or reference to the text to support a report. All appendices should be
titled and numbered alphabetically. All material placed into the appendices should be cited in
the text of the report. For example: "Illustrations of typical equipment are shown in Appendix
B". All appendices also must be listed in the List of Appendices page (Appendix G).
Chapter 10: Scientific Project Report
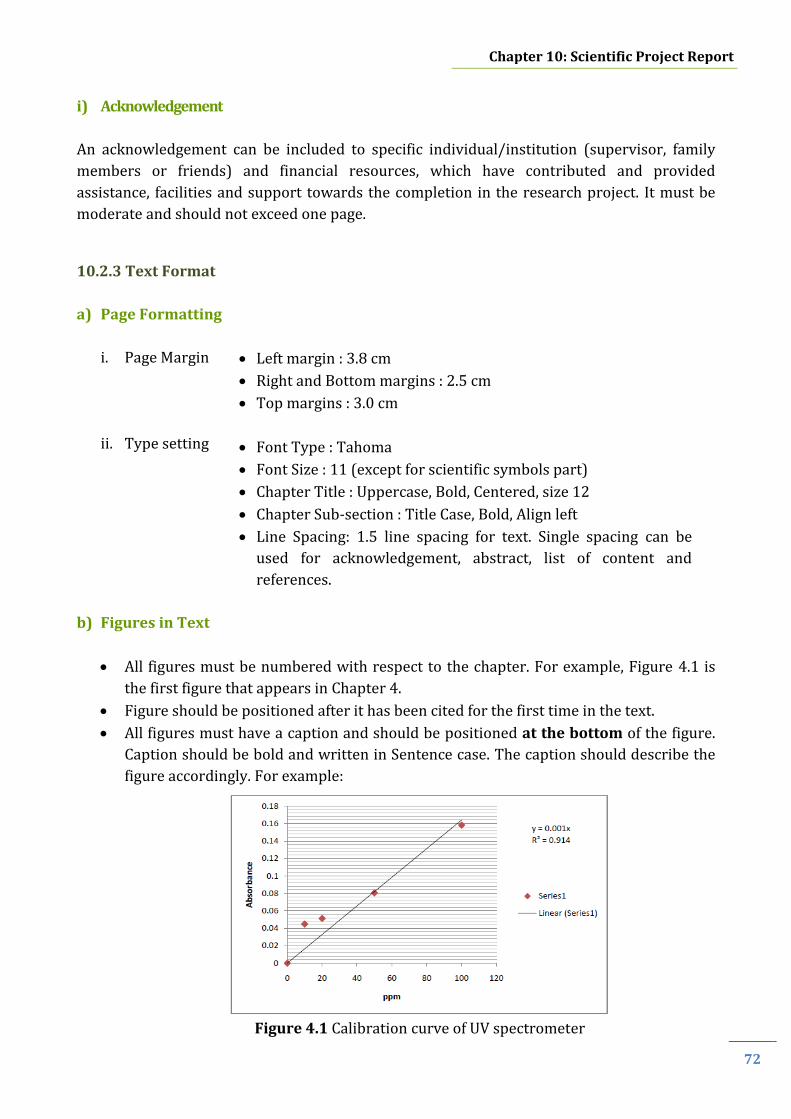
72
i) Acknowledgement
An acknowledgement can be included to specific individual/institution (supervisor, family
members or friends) and financial resources, which have contributed and provided
assistance, facilities and support towards the completion in the research project. It must be
moderate and should not exceed one page.
10.2.3 Text Format
a) Page Formatting
i. Page Margin
ii. Type setting
Left margin : 3.8 cm
Right and Bottom margins : 2.5 cm
Top margins : 3.0 cm
Font Type : Tahoma
Font Size : 11 (except for scientific symbols part)
Chapter Title : Uppercase, Bold, Centered, size 12
Chapter Sub-section : Title Case, Bold, Align left
Line Spacing: 1.5 line spacing for text. Single spacing can be
used for acknowledgement, abstract, list of content and
references.
b) Figures in Text
All figures must be numbered with respect to the chapter. For example, Figure 4.1 is
the first figure that appears in Chapter 4.
Figure should be positioned after it has been cited for the first time in the text.
All figures must have a caption and should be positioned at the bottom of the figure.
Caption should be bold and written in Sentence case. The caption should describe the
figure accordingly. For example:
Figure 4.1 Calibration curve of UV spectrometer
Chapter 10: Scientific Project Report

73
c) Tables in Text
All tables must be numbered with respect to the chapter. For example, Table 4.1 is the
first table that appears in Chapter 4.
A table should be positioned after it has been cited for the first time in the text.
All tables must have a caption, which should be positioned at the top of the table.
Caption should be bold and written in Sentence case. For example:
Table 4.1 Mean concentration of heavy metals (mgkg−1) in C. obtusa and sediment
Metals
Heavy metal concentration (mgkg−1)
Cerithidea obtusa Sediment
Mean Lower Upper Mean Lower Upper
Cd 0.66 0.41 0.81 2.23 0.74 3.64
Cr 1.11 0.84 1.61 11.65 8.41 16.61
Cu 16.01 10.14 28.08 65.00 12.81 26.58
Fe 89.51 96.86 92.43 53.29 84.09 99.59
Pb 0.30 0.10 0.66 7.78 4.68 17.43
Zn 12.79 10.77 17.12 13.66 7.49 23.64
d) Equations in Text
All equations must be numbered in brackets with respect to the chapter.
Equation and its numbering should be centered and align with right margin.
Must have an explanation for each symbol in the equation together with the right units
(if any).
For example: The second equation that appears in Chapter 3:
Percentage of Organic Matter = (B-A) g – (C-A) g x 100% (3.2)
(B-A) g
Where:
A = Weight empty beaker
B = Initial weight
C = Final weight
e) Tables of Content
All sections and their sub-sections should be listed appropriately with their associated
page numbers. Refer to Appendix D.
Chapter 10: Scientific Project Report

74
f) List of Tables
All indication and labels must be clear in the list of tables. Refer to Appendix E.
g) List of Figures
All indication and labels must be clear in the list of figures. Refer to Appendix F.
h) List of Appendices
All indication and labels must be clear in the list of appendices. Refer to Appendix G.
i) List of Symbols and Abbreviations
All indication and labels must be clear in the list of symbols and abbreviations. Refer to
Appendix H.
Plagiarism is the act of using someone else’s ideas or words without acknowledgement. All
idea or words whether deliberate or accidental plagiarized is a serious matter and punishable
offense in research projects. Students must make a report project using their own words and
must not contain any plagiarize material. The report should clearly mention any work that is
not student work whenever such work is presented. Students found guilty of plagiarism will
get an E grade in scientific project.
Accidental plagiarism occurs when a student draws phrases or words from someone else’s
research writing and presenting them as their own work without providing complete source
citation. Accidental plagiarism may include:
1. Copying someone else’s report writing - paragraphs, sentences, pictures, maps, ideas,
concepts and tables from sources such as journals, textbooks, magazines, internet and
others without proper source citation.
2. Forgetting to place quotation marks around original author words.
3. Omitting or paraphrasing a source citation someone else’s idea without
acknowledgement in a source citation to the original authors.
10.3 PLAGIARISM
Chapter 10: Scientific Project Report
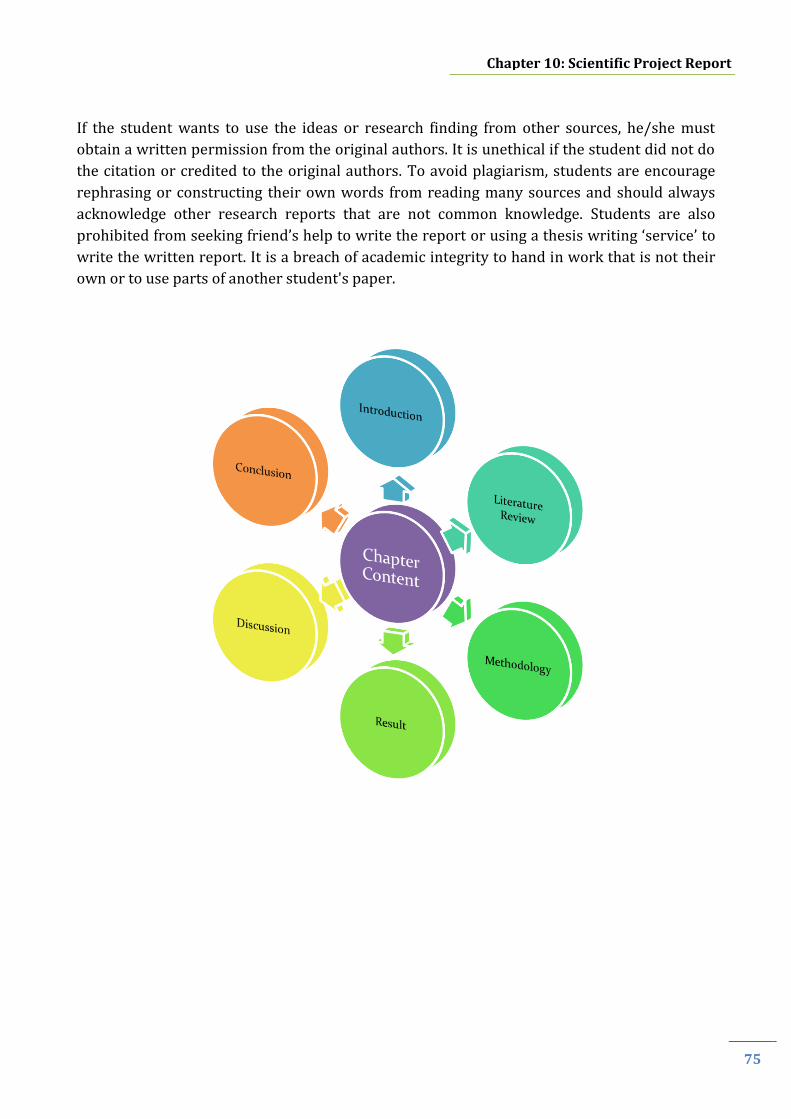
75
If the student wants to use the ideas or research finding from other sources, he/she must
obtain a written permission from the original authors. It is unethical if the student did not do
the citation or credited to the original authors. To avoid plagiarism, students are encourage
rephrasing or constructing their own words from reading many sources and should always
acknowledge other research reports that are not common knowledge. Students are also
prohibited from seeking friend’s help to write the report or using a thesis writing ‘service’ to
write the written report. It is a breach of academic integrity to hand in work that is not their
own or to use parts of another student's paper.
Chapter 10: Scientific Project Report

76
The assessment of the scientific project work will be based on a proposal / viva-voce
presentation, report writing and supervision. The detail marking scheme are listed in
Appendix I – N. The variety of rubric assessment features include:
a) Proposal/ Viva-voce Presentation
Suitability of the title
Clearly stated research background
Objectives clearly defined and achievable
Clearly stated methodology
Results and discussion interpretation
Communication skills with correct use of linguistic grammar and intonation Question and answering skills
b) Supervisor Point
Initiative in research activities
Laboratory or field work management equivalent to credit hour
Student’s research skill
Research intellectual advancement
Time management and progress
c) Report Writing
Presentation/Writing
Format, spelling and language comply with FSSA’s format
Text well organized and easy to understand
Clear and relevant illustrations
ASSESSMENT
GUIDELINES
Environmental Science: Scientific Project Guidelines
11 11.1 MARKING SCHEME
77
Content
Introduction with clear and sufficient evidence of research
Sufficient and appropriate literature review
Sufficient, clear and relevant methodology
Results and analysis with adequate, appropriate, accurate and fulfils the study
objectives
Results discussed in a scientific manner and accompanied by relevant supporting
references
References with complete and written in the correct format
Clear conclusion
11.2.1 Oral Presentation
Oral presentations are considered as an important part of the scientific project assessment
because of the importance placed on communications skills both in academia and industry.
Communication skills, which not only mean in spoken or written languages is also refer to an
individual's ability to transfer information in a manner that is interesting, accurate,
informative and concise. The purpose of the scientific project oral presentation is to train
students in presenting and defending the objectives, research analysis, findings and
conclusions of their own research projects. Formal dressing is needed.
An oral presentation by each final year student is compulsory. The scientific project
presentation is assessed in general both on content and delivery to ensure that the student is
able to communicate project work done that is of a standard worthy of an honours degree.
The presentation should describe the aim of the project, an outline of the presentation, the
results obtained and the extent to which the goals of the project are met. The scientific project
presentation will be graded according to proposal / viva-voce presentation evaluation rubric
form as shown in Appendix K and N.
The supervisor(s) and the examiner will attend and assess the presentation. Student must
bring PowerPoint presentation on a USB flash drive and each student should arrive for the
presentation earlier and stay for the presentation after their own. Student must have a plan B
in the event of technical difficulties such as a laptop with a copy of slide presentation, extra
flash drive or handouts. The time allocated for the presentation session is usually 10 to 15
minutes and an additional 5 minutes for the question and answer session. Questions will be
asked to assess the student’s understanding and knowledge of the project.
11.2 ORAL PRESENTAION GUIDELINES
Chapter 11: Assessment Guidelines

78
11.2.2 Design Tips
To create an attractive and effective 10 to 15 minutes PowerPoint presentation, there are
several basic tips that can be use:
Produce slides using Microsoft PowerPoint or other presentation software.
Ensure consistency with element of color and format / design such as font and
background throughout the presentation.
Choose good contrast colors so that the texts will stand out from the background.
Don’t put too much information on the slides. It is difficult to read and understand. Use
bullet points and headlines only.
Don’t use small fonts that are difficult to read (18 pt and below) and displaying graphs
or pictures that should be able to see / readable clearly from 3-4 meters.
Use sans serif fonts (Arial, Calibri, Comic Sans, Century Gothic, Verdana). Do not
use serif fonts (Times New Roman, Garamond, Palatino Linotype).
Make sure there are no spellings and format mistakes or typing error.
Limit the total number of slides in the presentation. Only include material that
necessary that can present within the time frame given.
Show clear and only relevant diagrams (figures, graphs, block diagrams, flowcharts,
etc.) to aid the explanations.
The materials should be well organized and the presentation slide should be well
structured. Proofread the presentation materials.
11.2.3 Content of Presentation
Content of presentation is an overview of the whole presentation, informing the audience
what is to be expected or presented. Content outlines include:
a) Scientific Project 1
Title slide – title of proposal presentation, student and supervisor name
Introduction
Objectives - should be clearly stated
Literature study for the project
Experimental design and partial implementation of the project
Gantt Chart
References
Chapter 11: Assessment Guidelines

79
b) Scientific Project 2
Title slide – title of project presentation, student and supervisor name
Objectives - should be clearly stated
Literature review of research project
Research methodology and analysis
Results/ research findings of the project
Discussions that include detailed support / strong theoretical justifications such as
comparison, problem, solution, argument and importance
Conclusion
Acknowledgement / References
11.2.4 Presentation Style
Oral presentation (proposal and viva-voce) is normally designed to measures student
presentational skills, including questions related to the research project. It gives an
opportunity for the student to defend the objectives, research analysis, findings and
conclusions of the project.
For the oral presentation style:
Practice / rehearse presentation in advance. Measure presentation time. Make sure not
exceed time limit.
Speak with good pace/speed and clear language so that the audience is able to listen and
follow the presentation.
Stand straight, be confident and face the audience. Practice good eye contact to
audience.
Try to emphasis: body language, gestures, pitch and expression to highlight important
points.
Use a laser pointer on the screen. Don’t stand between the projector and the screen. The
screen must be visible for assessment panel and audience.
11.2.5 Questions and Answers Session
During the question and answer session, the student should be able to answer in details,
accurate and confidently. Try to communicate fluently to answer basic/fundamental
questions within the areas/scopes of the project.
Chapter 11: Assessment Guidelines

80
Advises during the question and answer session:
Take some time to think of how to answer the questions rather than answering it
immediately. Answer straight to the point.
Questions can be answered by simple English statements or with the use of visual aids.
Do not try to make-up an answer for a question. Please admit if unable to answer a
particular question and move on.
Do some homework. Think, prepare and practice for questions that could be asked.
Chapter 11: Assessment Guidelines

81
Q: When can I start to find a scientific project title?
If you have met the requirements (2nd year student and taken Scientific Writing), you can
start to find a project title around the end of Semester 2 (May/June).
Q: When can I start doing my scientific project?
You can start your scientific project only after you have registered scientific Project 1 in
Semester 1.
Q: Can I write my thesis in English?
Yes you can. But before that you have to get the permission from both the supervisor and the
Dean of Faculty of Science and Natural Resources (FSSA). You must also have MUET result at
level 4 and above. Please refer to Panduan Penulisan Disertasi FSSA book.
Q: Where can I buy Panduan Penulisan Disertasi FSSA book?
You can buy the book at FSSA main office.
Q: Must my proposal / viva presentation be in English?
You are given a choice. You are required to present in English for project proposal, meanwhile
for viva-voce presentation, it depends on the written language in the thesis.
Q: What must I present during my proposal / viva-voce presentations?
Please refer to ‘Content of Presentation’ in Chapter 11.
Q: How do I know who my examiner is?
The examiner list will be released around week 12 of the 1st semester in 3th year. You will be
informed through email / Facebook and also on the program notice board. You can refer to
Scientific Project Coordinator for more information.
Q: What are the marking criteria for scientific project?
Scientific project will be marked according to Table 1.1 (page 2).
Q: Who should I contact if I'm having problems with my scientific project?
The first person you should find when having problems is your supervisor. If you're having
problems with your supervisor, you should contact your Scientific Project Coordinator
and/or the Head of Program.
GENERAL
FREQUENTLY ASKED QUESTIONS (FAQs)

82
Q: How do I select a supervisor?
Supervisor selection should be from a lecturer in the Environmental Science Program (refer
Table 2.1). It usually takes place at the end of semester 2 for 2nd year student.
Q: Can I select the supervisor of my choice?
Yes. You are responsible to choose a suitable academic supervisor for the execution of your
project. You should contact the respective academic staff that you choose at the earliest
opportunity. You will have to check to see if he or she has already acquired the maximum
number of students. There is no guarantee that you will be allocated your preferred
project/supervisor. You are advised to have a few choices in mind before you make your
selection.
Q: Can I change my supervisor and/or title?
The Scientific Project Committee in the program does not encourage the change of supervisor
and/or title. Nevertheless, if you have a valid reason for changing your supervisor and/or
title, then you can. The approval of the supervisor is needed to change the project title.
Applications for changing supervisor and/or title must be made in advance with the Scientific
Project Coordinator using appropriate forms.
Q: What should I do next once I have a supervisor confirmed for my project?
The next step is that you need to fill in the form HS11-SP01 – Supervisor Approval Form
(Appendix A) and get the supervisor’s approval and provide relevant project information
before submitting it to the Scientific Project Coordinator on week 2 in the following semester.
Q: How often do I need to have discussions with my supervisor?
Ideally, you should meet with your supervisor at least once a week. You must fulfil at least
80% of the total meeting hours per semester.
SUPERVISION
FAQs

83
Q: What is the word count for a scientific written report?
Your project should not exceed 15,000 words in length. These limits exclude appendices,
bibliographies, tables and graphs. A written report project may not exceed these limits
without the consent of the supervisor.
Q: Should I get permission to use laboratories equipment and instruments?
All laboratory work and borrowing of equipment must first of all obtain permission by filling
out the necessary form in Environmental Science Laboratories.
Q: Can I make a scientific project during the semester break?
You are not allowed to do any sampling and analysis work before registering scientific Project
1, but you are encouraged to do a sampling work and laboratories analysis during the 2nd
semester break.
Q: Can I do laboratory work at night and weekends?
You can carry out laboratory work during weekends and night time if you have permission
from the Head of Program and FSSA Dean.
Q: What should I do if I want to get raw / secondary data from an outside organization?
To get data from an outside organization, the formal letter must be made through the faculty.
Application letter will be made after you fill out a form in the Deputy Dean (HEPA) Office.
FAQs
ANALYSIS & WRITTEN REPORT PROCESS

84
Q: What further action is needed after I make a correction?
After all amendment has been done, the correction should be shown to the examiner and
supervisor for their approval. After the supervisor and examiner have signed the relevant
section of the ‘Project Submission Form’, then you can proceed to make the hardcopies for
submission.
Q: What is the deadline for my written report?
You can refer list of deadlines in Scientific Project Calendar (Table 2.2).
Q: Where do I submit my written report?
Two (2) copies of your written report should be submitted to the FSSA main office. Theses
copies will be used for the assessment. Please refer Scientific Project Calendar (Table 2.2).
Q: Can I submit the final written report for assessment in soft copy?
No. The final written report should be submitted in ring bind for assessment.
Q: How many copies of my hard cover thesis do I need to submit?
You must submit three (3) copies of hard cover thesis including one (1) softcopy in CD (for
supervisor).
Q: When is the deadline for the submission of the hard cover copies of my thesis?
You must submit the hard cover thesis to the faculty on week 18 to Bilik Sumber FSSA.
Q: What are the consequences if I fail to submit my scientific project to the FSSA Office
by Week 13?
Failure to submit within the specified deadline will be penalized accordingly. Ultimately, you
will be given Grade E (Fail) for your project.
Q: Can I apply for an extension?
Extensions will only be granted under exceptional circumstances (e.g. medical reason or
major instrument / equipment failure). You should apply for extensions through your
supervisor who will liaise with the Scientific Project Coordinator.
Q: Can I present the proposal / viva before sending the written report for assessment?
No. You are not allowed to present a proposal / viva if you have not sent the written report.
SUBMISSION
FAQs

85
Bluman, G. A. 2007. Elementary Statistics: A step by step approach. Seventh Edition. McGraw –Hill Companies, Inc. New York. ISBN: 978-0-07-009178-8
Bryan, F. J. M. 2009. Statistics for Environmental Science and Management. Chapman and Hall: New York.
Cole, R., Young, T. & Newport, D. 2012. Guidelines for the Preparation and Submission of Final Year Project Reports. Department of Mechanical and Aeronautical Engineering Department. University of Limerick. http://www2.ul.ie/pdf/714746740.pdf
Eiselen, R. & Uys, T. 2011. Questionnaire Design. University of Johannesburg.
Eiselen, R., Uys, T. & Potgieter, N. 2005. Analysis Survey Data Using SPSS13: A Workbook. University of Johannesburg.
Final Year Project Guidelines. 2012. Faculty of Computer Science & Information Technology. http://www.fcsit.unimas.my/images/must_read/FCSIT_FYP_Guidelines.pdf.
Final Year Project Report Guidelines. 2012. Universiti Tunku Abdul Rahman. http://www.utar.edu.my/fes/file/FES%20FYP%20Report%20Guidelines-R2.pdf.
Gillham, B. 2000. Developing a Questionnaire. University of Michigan.
Guidelines for Management of Student Projects. 2011. Strathmore University. http://www.strathmore.edu/adu/sites/www.strathmore.edu.adu/files/guidelines_management_studentprojects.pdf
Mohd Asri Silahuddin. 2015. Soalselidik. http://www.scribd.com/doc/13090385/Kaedah-3-Soalselidik
Neil, A. W. 1999. Introductory Statistics. Fifth Edition. Addison Wesley Longman. United States of America.
PSM Handbook. 2010. Department of Computer Systems and Communications, FSKSM, UTM.
Short Guide to Writing Your Final Year Project Report or MSc Dissertation. 2011. School of Computer Science and Informatics. Cardiff University. https://www.cs.cf.ac.uk/PATS2/wiki/lib/exe/fetch.php?media=project-report.pdf
Stewart, A.M., Bowman, K., Buckley, S., Graves, M., Landis, C., Werner, N., Patterson, N. & Rivera, Y. 2009. A Research Guide for Students and Teachers. College of Environmental Science and Forestry. State University of New York. Syracuse, NY.
Syahida Adilah. 2015. Tutorial Penyelidikan dan Statistik. http://www.scribd.com/doc/52180655/Tutorial-Penyelidikan-Dan-Statistik#scribd
Szecsi, T. 2006. Student Guide to Final Year Projects. School of Mechanical and Manufacturing Engineering. Dublin City University. http://webpages.dcu.ie/~szecsit/Modules/Final_Year_Project/FYP_Guide_Edition_6.pdf
Thomas, F. B. 2001. Guide to the Design of Questionnaires. University of Leeds.
University of California. 2015. Scaling: Semantic Differential-Physchology. http://psychology.ucdavis.edu/faculty_sites/sommerb/sommerdemo/scaling/semdiff.htm
REFERENCES

86
Supervisor Approval Form (HS11-SP01)
Please complete and submit this form to Scientific Project coordinator within Week 2 Semester 1 SEMESTER: SESSION:
STUDENT INFORMATION
Name:
Matric Number:
Handphone No.:
E-mail Address:
SUPERVISOR APPROVAL
I agree/do not agree* to be the supervisor for this student for the project entitled:
Date : _________________________ Signature : ____________________________
Official Stamp :
PROJECT INFORMATION
Please attaches the project information in accordance with the following format:
(a) Project background including significance of study and literature reviews (maximum 300 words)
(b) Objective(s)
Example: This study embarks on the following objectives:
1. To identify...... 2. To assess ...... 3. To investigate.....
(c) Methodology
1. Description of methodology 2. Flow chart of research activities 3. Gantt chart of research activities
(d) References
APPENDIX A

87
Sesi/Semester
Session/Semester
: ____________________________ Projek Saintifik Scientific Project
: 1 / 2
Nama Pelajar
Name of Student
: _____________________________________________________________________________________
Tajuk Projek
Title of Project
: _____________________________________________________________________________________
_____________________________________________________________________________________
_____________________________________________________________________________________
Penyelia
Supervisor(s)
i) ____________________________________________________________________________________
ii)____________________________________________________________________________________
No. KP / IC. No
/Passport
: ______________________________ No. Matrik Matric No
: ______________________________
E-mel
: ______________________________ No. Tel/HP Phone/HP No
: ______________________________
Alamat Rumah
Home Address
: _____________________________________________________________________________________
_____________________________________________________________________________________
_____________________________________________________________________________________
Alamat Semasa (jika berlainan daripada
alamat rumah)
Current Address (if different from your
home address)
: _____________________________________________________________________________________
______________________________________________________________________________________
______________________________________________________________________________________
MAKLUMAT PELAJAR
Student Details
Log Book /FYP01
APPENDIX B

88
RINGKASAN TARIKH PERJUMPAAN ANTARA PELAJAR DENGAN PENYELIA PROJEK 1
SUMMARY OF DATE OF MEETING BETWEEN STUDENT AND PROJECT 1 SUPERVISOR
Projek Saintifik / Scientific Project 1
(Minggu / Week 1-14)
Pertengahan Semester
Mid Semester
Akhir Semester
End of Semester
Minggu / Week Tarikh / Date Minggu / Week Tarikh / Date
1 8
2 9
3 10
4 11
5 12
6 13
7 14
Komen penyelia / Supervisor comment:
Saya dengan ini mengesahkan bahawa pelajar telah membincangkan tentang projek saintifik beliau dengan saya pada tarikh di atas. I hereby verify that the student had discussed about his/her scientific project with me on the date above. Tandatangan Penyelia / Supervisor’s Signature: _________________________ Cop Rasmi/ Official Stamp:
Log Book /FYP02
APPENDIX B

89
RUMUSAN KEMAJUAN PROJEK 1/ SUMMARY OF PROJECT 1 PROGRESSION
Tarikh/ Date : ____________________ Minggu / Week: ._________________
Helaian ini perlu ditulis oleh pelajar pada setiap perjumpaan.
This page is to be filled up by student every meeting.
Sertakan lampiran terperinci untuk menyokong laporan anda jika perlu
Please provide any relevant atachment to support your report wherever needed
Pencapaian Minggu Ini
Achievement For This
Week
Cadangan Pencapaian
Minggu Hadapan
Expected Achievement
For Next Week
Masalah / Persoalan /
Ketidakpastian
Problems / Questions /
Uncertainties
Tandatangan Pelajar: _________________________________________________
Student’s Signature
Log Book /FYP03
APPENDIX B

90
RINGKASAN TARIKH PERJUMPAAN ANTARA PELAJAR DENGAN PENYELIA PROJEK 2
SUMMARY OF DATE OF MEETING BETWEEN STUDENT AND PROJECT 2 SUPERVISOR
Projek Saintifik / Scientific Project 2
(Minggu / Week 1-14)
Pertengahan Semester Mid Semester
Akhir Semester End of Semester
Minggu / Week Tarikh / Date Minggu / Week Tarikh / Date
1 8
2 9
3 10
4 11
5 12
6 13
7 14
Komen penyelia / Supervisor comment:
Saya dengan ini mengesahkan bahawa pelajar telah membincangkan tentang projek saintifik beliau dengan saya pada tarikh di atas. I hereby verify that the student had discussed about his/her scientific project with me on the date above. Tandatangan Penyelia / Supervisor’s Signature: _________________________ Cop Rasmi/ Official Stamp:
Log Book /FYP04
APPENDIX B
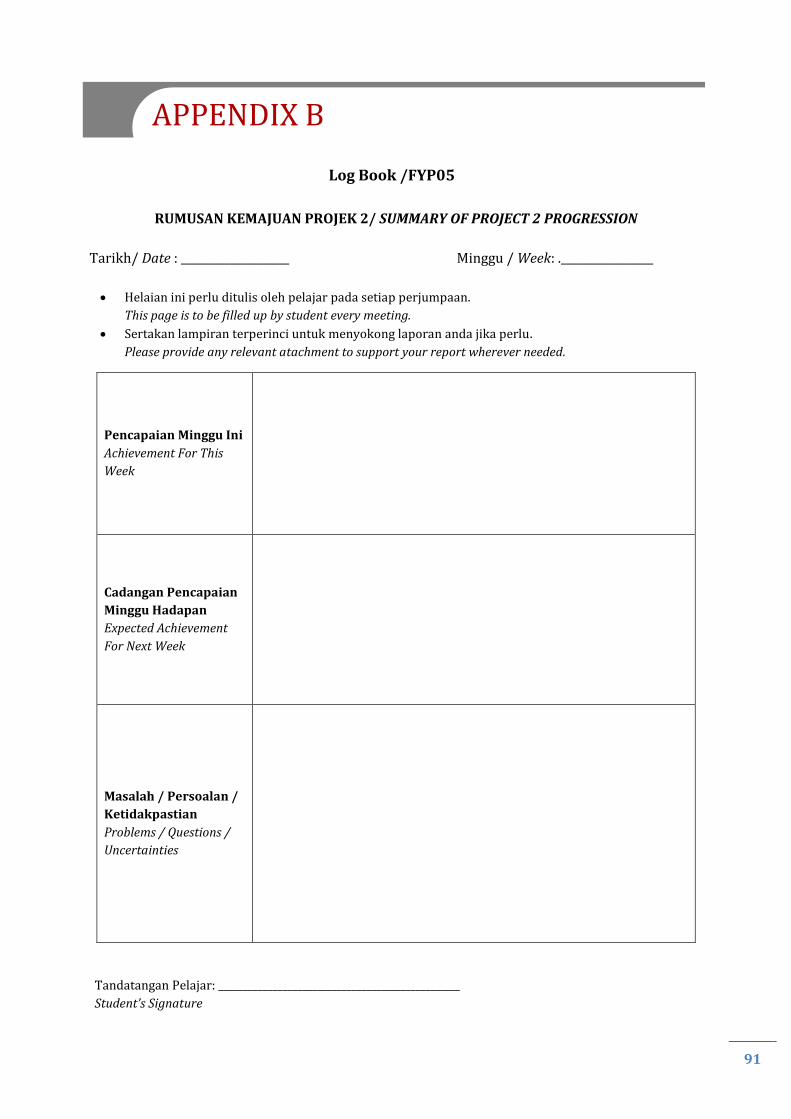
91
RUMUSAN KEMAJUAN PROJEK 2/ SUMMARY OF PROJECT 2 PROGRESSION
Tarikh/ Date : ____________________ Minggu / Week: ._________________
Helaian ini perlu ditulis oleh pelajar pada setiap perjumpaan.
This page is to be filled up by student every meeting.
Sertakan lampiran terperinci untuk menyokong laporan anda jika perlu.
Please provide any relevant atachment to support your report wherever needed.
Pencapaian Minggu Ini
Achievement For This
Week
Cadangan Pencapaian
Minggu Hadapan
Expected Achievement
For Next Week
Masalah / Persoalan /
Ketidakpastian
Problems / Questions /
Uncertainties
Tandatangan Pelajar: _________________________________________________
Student’s Signature
Log Book /FYP05
APPENDIX B

92
SENARAI SEMAK DAN PENGAKUAN PENYERAHAN LAPORAN AKHIR
CHECKLIST AND DECLARATION OF SUBMISSION OF FINAL REPORT
Borang ini hendaklah dilengkapkan oleh pelajar dan diserahkan kepada Penyelaras Projek Saintifik sebelum mengemukakan jilid keras laporan akhir kepada pihak Fakulti (sebelum minggu ke 18) This form should be completes by the student and submitted to Scientific Project Coordinator before submission of hard cover final report to the Faculty (before week 18)
SENARAI SEMAK DAN PENGAKUAN PENGHANTARAN LAPORAN AKHIR
SUBMISSION OF FINAL REPORT CHECKLIST AND DECLARATION
Diperakukan [Sila tandakan ( √ )]:
Recommended [Please tick ( √ )]:
Saya telah membuat semua pindaan yang diperlukan berdasarkan komen dan cadangan yang diberikan oleh
Penyelia dan Panel Pemeriksa saya.
I have made all the necessary ammendments based on comments and suggestion given by my Supervisor and
Examination Panel.
Saya telah memastikan bahawa format penulisan laporan akhir saya adalah selaras dengan buku Panduan
Penulisan Disertasi, Fakulti Sains & Sumber Alam (FSSA).
I have made sure that the writing format of my final reports is in accordance with the Panduan Penulisan Disertasi,
Faculty of Science & Natural Resources (FSSA) book.
Saya telah memperoleh kelulusan terhadap laporan akhir dari Penyelia saya.
I have obtained approval of my final report from my Supervisor.
Saya telah membuat sekurang-kurangnya tiga salinan jilid keras laporan akhir saya mengikut format sebagaimana
yang ditetapkan oleh buku Panduan Penulisan Disertasi, Fakulti Sains & Sumber Alam (FSSA).
I have made at least three hard cover copies of my Final Report according to the binding format as prescribed by the
Panduan Penulisan Disertasi, Faculty of Science & Natural Resources (FSSA) book.
* Saya telah memulangkan semula semua alatan makmal yang telah digunakan semasa melaksanakan projek
saintifik.
I have return back all laboratory equipment used during the implementation of scientific project.
* jika berkaitan / if applicable
Nama Pembantu Makmal / Lab Assistant Name : ____________________________________________________________________
Tandatangan / Signature: _____________________________________ Tarikh / Date: __________________________
Tandatangan Pelajar / Student’s Signature: _____________________________ Tarikh / Date: ______________________
Nama Pelajar / Student Name: _________________________________________________________________________________________
No. Matrik / Matric No.: ________________________________________________
PENGESAHAN OLEH PENYELIA / ENDORSEMENT BY SUPERVISOR
Komen (sekiranya ada) / Comment (if any): _________________________________________________________________________ ___________________________________________________________________________________________________________________________ ___________________________________________________________________________________________________________________________ Tandatangan Penyelia / Supervisor’s Signature: ______________________________ Tarikh / Date: __________________ Cop Rasmi / Official Stamp:
Log Book /FYP06
APPENDIX B
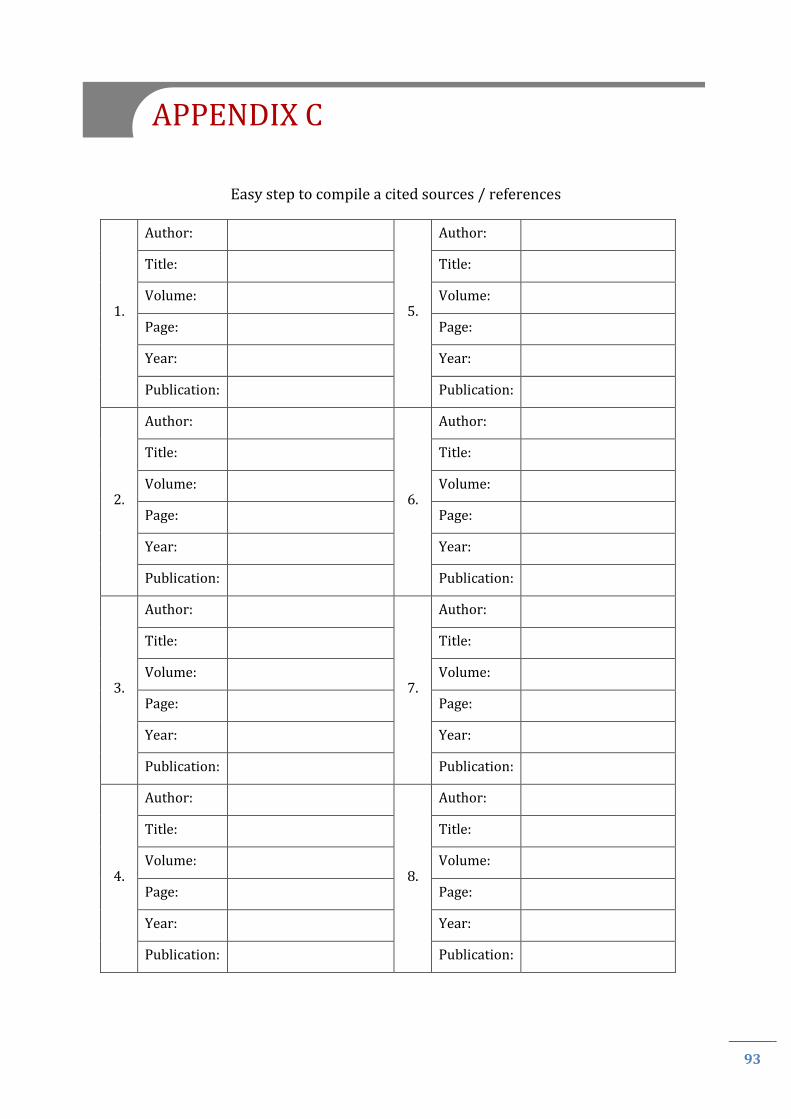
93
Easy step to compile a cited sources / references
1.
Author:
5.
Author:
Title: Title:
Volume: Volume:
Page: Page:
Year: Year:
Publication: Publication:
2.
Author:
6.
Author:
Title: Title:
Volume: Volume:
Page: Page:
Year: Year:
Publication: Publication:
3.
Author:
7.
Author:
Title: Title:
Volume: Volume:
Page: Page:
Year: Year:
Publication: Publication:
4.
Author:
8.
Author:
Title: Title:
Volume: Volume:
Page: Page:
Year: Year:
Publication: Publication:
APPENDIX C

94
Example of Tables of Content
TABLE OF CONTENT
Pages
DECLARATION ii
CERTIFIED BY iii
ACKNOWLEDGEMENT iv
ABSTRACT v
ABSTRAK vi
TABLE OF CONTENT vii
LIST OF TABLES ix
LIST OF FIGURES x
LIST OF APPENDICES xi
LISTS OF SYMBOLS AND ABBREVIATIONS xii
CHAPTER 1 INTRODUCTION 1
1.1 Introduction 1
1.1.1 ….. 2
1.1.2 …… 3
1.2 Objectives
CHAPTER 2 LITERATURE REVIEW 5
CHAPTER 3 METHODOLOGY 24
CHAPTER 4 RESULT AND DISCUSSION 36
CHAPTER 5 CONCLUSION 48
REFERENCE 48
APPENDIX 56
APPENDIX D
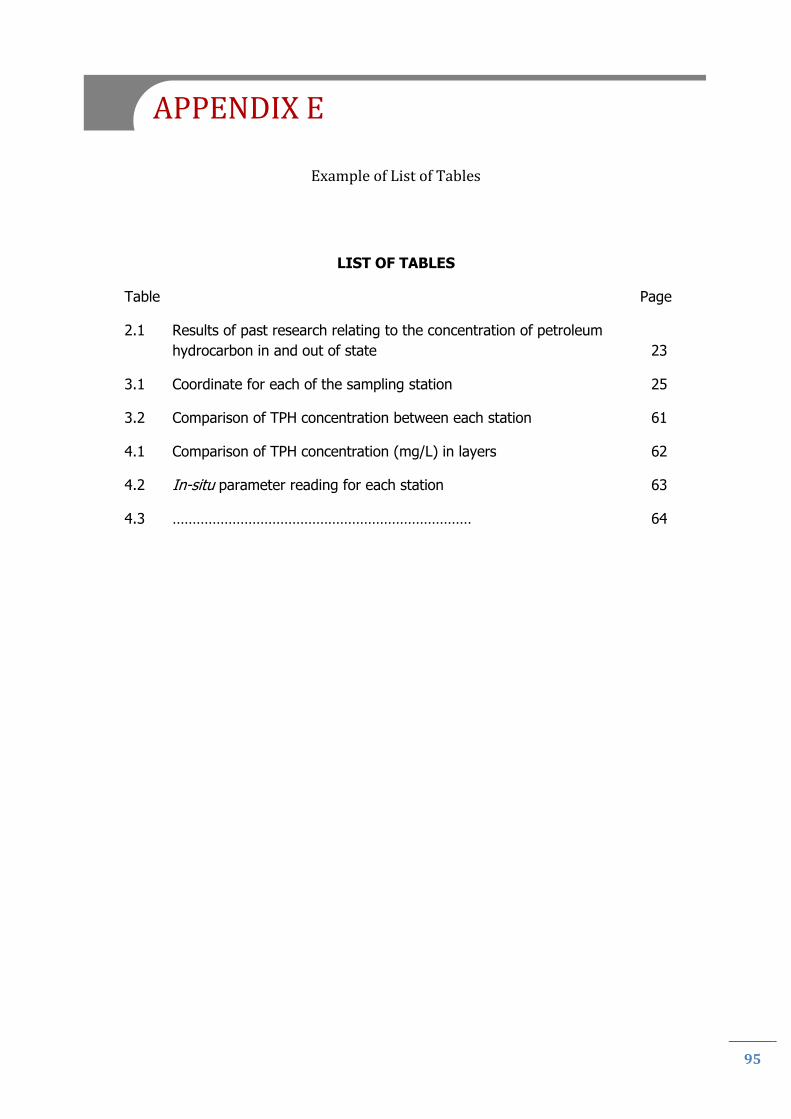
95
Example of List of Tables
LIST OF TABLES
Table Page
2.1 Results of past research relating to the concentration of petroleum
hydrocarbon in and out of state 23
3.1 Coordinate for each of the sampling station 25
3.2 Comparison of TPH concentration between each station 61
4.1 Comparison of TPH concentration (mg/L) in layers 62
4.2 In-situ parameter reading for each station 63
4.3 ………………………………………………………………… 64
APPENDIX E

96
Example of List of Figures
LIST OF FIGURES
Figure Page
2.1 Types of aliphatic hydrocarbon 7
2.2 Structure example of aromatic hydrocarbon 9
3.1 Location of sampling stations 25
3.2 Flow Chart of general steps for all stages during this study 57
4.1 Comparison of TPH concentration between sampling stations. 37
4.2 Comparison of pH parameter measured for each station 44
4.3 Comparison of dissolved oxygen parameters measurement in each
sampling station 46
4.4 ………………………………………………………….. 47
APPENDIX F

97
Example of List of Appendices
LIST OF APPENDICES
Appendix Page
A Petroleum hydrocarbon dry weight for each station 56
B Preparation flow chart 57
C Total Petroleum Hydrocarbon concentration in replicates for each
station 60
D Total Petroleum Hydrocarbon (TPH) concentration in sea water 61
E TPH concentration of sea water in layers 62
F In-situ parameter reading for each station 63
G ……………………………………………………….. 64
APPENDIX G

98
Example of List of Symbols and Abbreviations
LISTS OF SYMBOLS AND ABBREVIATION
% Percentage
& and
°C Degree Celsius
cm Centimeter
µg microgramme
mm milimeter
pg picogramme
mg miligramme
ng nanogramme
L litre
g gramme
DO Dissolved oxygen
EC Electrical conductivity
DCM Dichloromethane
HCl Hydrochloric acid
GC-MS Gas Chromatography-Mass Spectrometry
GPS Global Positioning Satellite
σ Sigma
β Beta
APPENDIX H

99
Scientific Project 1: Writing Evaluation Rubric
Student Name: __________________________________________ Matric No: ___________________________
Laporan Projek Saintifik 1 (Bab 1, 2 dan 3)
Scientific Project 1 Report (Chapter 1, 2 and 3)
Markah
Points
A Penyampaian/penulisan
Presentation/writing
(i) Format, Ejaan dan Bahasa (Adakah ia mengikut format FSSA, ejaan betul dan bahasa lancar?)
Format, Spelling and Language (Does it comply with FSSA format, with correct spelling and grammar?)
/ 5
(ii) Susunatur Teks (Adakah ia teratur, mudah difahami dan ada kesinambungan dengan perenggan lain?)
Text flow (Is it well organized, easy to understand? Is there any continuity with other paragraphs?)
/ 5
(iii) Illustrasi (Adakah rajah, foto, jadual, graf dan sebagainya cukup jelas dan relevan?)
Illustrations (Are the figures, pictures, tables, graphs and etc. clear and relevant?)
/ 5
B Isi Kandungan / Contents
(i) Pengenalan (Adakah ia memberi gambaran yang jelas dan mencukupi mengenai kajian yang telah dan akan dijalankan? Rasional untuk kajian?)
Introduction (Does it give a clear and sufficient evidence of research that has been and will be conducted? Rationales for the research?)
/ 10
(ii) Ulasan Perpustakaan (Adakah ia mencukupi dan sesuai dengan tajuk kajian?)
Literature Review (Is it sufficient and appropriate to the topic of study?) / 15
(iii) Metodologi (Adakah ia mencukupi, jelas dan relevan?)
Methodology (Is it sufficient, clear and relevant to the research objectives?) / 15
(iv) Rujukan ( Adakah senarai rujukan lengkap dan ditulis mengikut format?)
References (Is the reference list complete, and written in the correct format?) / 5
/60
Supervisor / Examiner Name: _____________________________________________________
Signature : _____________________________________________________
Date : _____________________________________________________
APPENDIX I

100
Scientific Project 1: Supervisor’s Point Rubric
A EVALUATION CRITERIA Points
awarded
(i) Initiative (Did this candidate initiate his / her own research activities?)
/ 4
(ii) Laboratory or field work (Did the candidate spend the equivalent of 3 credit hours performing the scientific Project 1 in this semester?)
/ 4
(iii) Candidate’s research skill (Did the candidate demonstrate a trustworthy research workmanship? Is the research data produced reliable?)
/ 4
(iv) Intellectual advancement (Did the candidate demonstrate a significant / normal / mild / no intellectual advancement in his or her research niche?)
/ 4
(v) Time management and progress (Is this candidate a last minute or consistent doer?)
/ 4
Total points awarded to the candidate (higher point signifies better performance) 20
B STUDENT NAME (i) (ii) (iii) (iv) (v) Total
(20%)
1
2
3
4
5
6
7
8
9
10
C ENDORSEMENT BY SUPERVISOR
Name: ____________________________________________________________ Signature: ______________________________ Date: _____________________________________
APPENDIX J

101
Scientific Project 1: Proposal Presentation Evaluation Rubric
A EVALUATION CRITERIA Points
awarded
(i) Suitability of the title (Does it reflect the content of the work?)
/ 2
(ii) Research background (Are the research question and literature review stated clearly?)
/ 3
(iii) Objective/s (Are the objective/s clearly defined and achievable?)
/ 3
(iv) Methodology (Are the description, flow chart, Gantt chart and milestone stated clearly?)
/ 5
(v) Communication skills (Correct use of linguistic grammar and intonation, body language etc.?)
/ 3
(vi) Question and answering skills (Capable to communicate with sensible answer?)
/ 4
Total points awarded to the candidate (higher point signifies better performance) 20
B STUDENT MATRIC NO. (i) (ii) (iii) (iv) (v) (vi) Total
(20%)
1
2
3
4
5
6
7
8
9
10
C ENDORSEMENT BY EVALUATOR
Name: ____________________________________________________________ Signature: ______________________________ Date: _____________________________________
APPENDIX K

102
Scientific Project 2: Writing Evaluation Rubric
Student Name: _________________________________________ Matric No: ___________________________
Laporan Projek Saintifik 2 / Scientific Project 2 Report Markah
Points
A Penyampaian/penulisan laporan
Presentation/ writing of report
(i) Format, Ejaan dan Bahasa (Adakah ia mengikut format FSSA, ejaan betul dan bahasa lancar?)
Format, Spelling and Language (Does it comply with FSSA’s format; having correct spelling and is grammatically correct?)
/ 5
(ii) Susunan Teks (Adakah ia teratur, mudah difahami dan ada kesinambungan dengan perenggan lain)
Text flow (Is it well organized, easy to understand and has continuity with other paragraphs?)
/ 5
(iii) Illustrasi (Adakah rajah,foto,jadual,graf dan sebagainya cukup jelas dan relevan)
Illustrations (Are the figures, pictures, tables, graphs and etc clear and relevant?)
/ 5
B Isi Kandungan
Table of contents
(i) Pengenalan/ Ulasan Perpustakaan/ Methodology (Adakah ia mencukupi, jelas dan relevan?)
Introduction / Literature Review / Methodology (Is it sufficient, clear and relevant)
/ 10
(ii) Hasil dan Analisis (Adakah ia mencukupi, sesuai, tepat dan menjawab objektif kajian?)
Results and Analysis (Is it adequate, appropriate, accurate and fulfils the study objectives? Did the candidate manage to describe/summarise his/her results?)
/ 30
(iii) Perbincangan (Adakah hasil dibincangkan secara saintifik dan disertakan dengan sokongan rujukan yang relevan? Adakah ia menjawab objektif kajian?)
Discussion (Are the results discussed in a scientific manner and accompanied by relevant supporting references? Does it answer the objectives of the study? Any attempt to interpret the results?)
/ 30
(iv) Kesimpulan ( Adakah ia merangkumi keseluruhan kajian?)
Conclusion (Does it answer the objective(s)?) / 10
(v) Rujukan ( Adakah senarai rujukan lengkap dan ditulis mengikut format)
References (Is the reference list complete, and written in the correct format?) / 5
/100
Supervisor / Examiner Name: _____________________________________________________
Signature : _____________________________________________________
Date : _____________________________________________________
APPENDIX L

103
Scientific Project 2: Supervisor’s Point Rubric
A EVALUATION CRITERIA Points
(i) Initiative
(Did this candidate have initiatives in his/her own research activities?) / 2
(ii)
Laboratory or field work
(Did this candidate spend the equivalent of 6 credit hours performing the Project 2 in this semester?)
/ 5
(iii)
Candidate’s research skill
(Did this candidate demonstrate a trustworthy research workmanship? Is the research data produced reliable?)
/ 5
(iv)
Intellectual advancement
(Did this candidate demonstrate a significant / normal / mild / no intellectual advancement in his or her research niche?)
/ 5
(v) Time management and progress
(Did the candidate manage his/her project well?) / 3
Total points awarded to the candidate (higher point signifies better performance) 20
B STUDENT NAME (i) (ii) (iii) (iv) (v) Total
(20%)
1
2
3
4
5
6
7
8
9
10
C ENDORSEMENT BY SUPERVISOR
Name: ____________________________________________________________ Signature: ______________________________ Date: _____________________________________
APPENDIX M

104
Scientific Project 2: Viva Evaluation Rubric
A EVALUATION CRITERIA Points
awarded
(i) Suitability of the title (Does it reflect the content of the work?)
/ 2
(ii) Research background (Are the research question and literature review stated clearly?)
/ 3
(iii) Objective/s (Are the objectives clearly defined and have been achieved?)
/ 3
(iv) Methodology (Are the description stated clearly and of acceptable standard?)
/ 5
(v) Results and Discussion (Did the candidate summarise, evaluate and interpret the results?)
/ 10
(vi) Communication skills (Correct use of grammar and intonation, body language etc.?)
/ 3
(vii) Question and answering skills (Ability to communicate with sensible answer?)
/ 4
Total points awarded to the candidate (higher point signifies better performance) 30
B STUDENT MATRIC NO. (i) (ii) (iii) (iv) (v) (vi) (vii) Total
(30%)
1
2
3
4
5
6
7
8
9
10
C ENDORSEMENT BY EVALUATOR
Name: ____________________________________________________________ Signature: ______________________________ Date: _____________________________________
/ 20
APPENDIX N

Environmental Science Programme
Faculty of Science & Natural Resources
Universiti Malaysia Sabah
Jalan UMS, 88400 Kota Kinabalu Sabah
Phone: 088-320000 ext 5872
Fax: 088-435324
E-mail: [email protected]
http://www.ums.edu.my/fssa/