Experimental and Numerical Studies of Vortex Induced ...
7
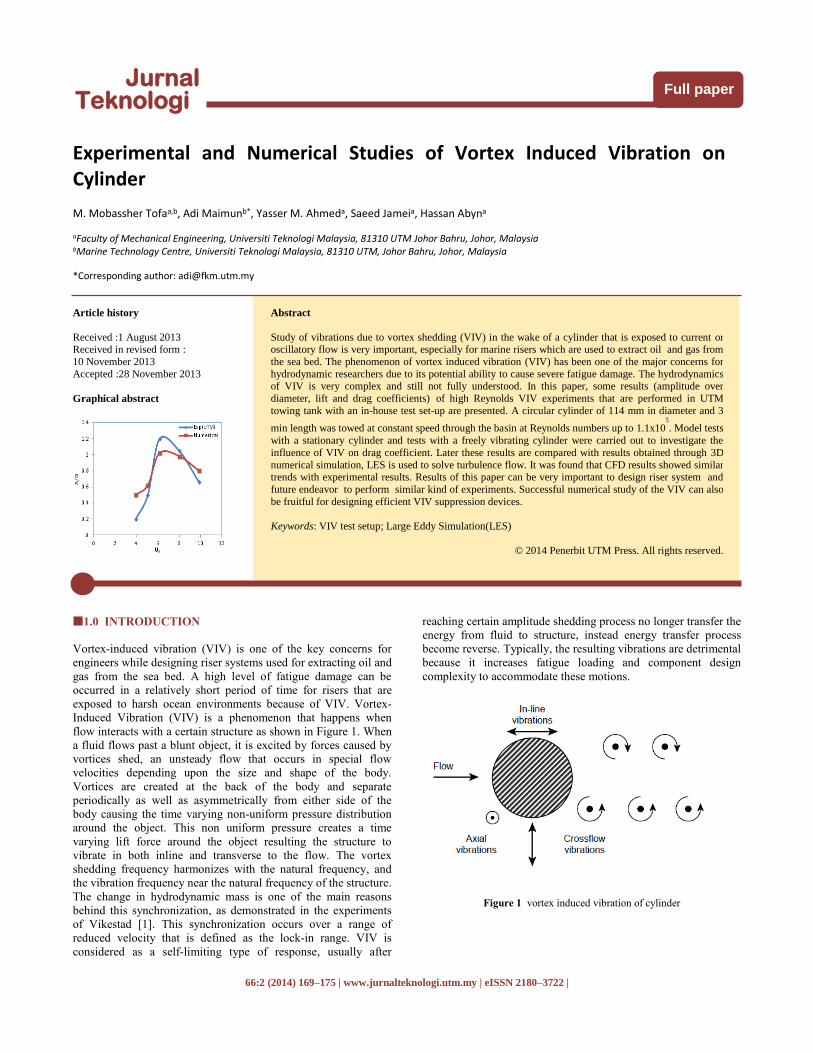
66:2 (2014) 169–175 | www.jurnalteknologi.utm.my | eISSN 2180–3722 | Full paper Jurnal Teknologi Experimental and Numerical Studies of Vortex Induced Vibration on Cylinder M. Mobassher Tofa a,b , Adi Maimun b* , Yasser M. Ahmed a , Saeed Jamei a , Hassan Abyn a a Faculty of Mechanical Engineering, Universiti Teknologi Malaysia, 81310 UTM Johor Bahru, Johor, Malaysia b Marine Technology Centre, Universiti Teknologi Malaysia, 81310 UTM, Johor Bahru, Johor, Malaysia *Corresponding author: [email protected] Article history Received :1 August 2013 Received in revised form : 10 November 2013 Accepted :28 November 2013 Graphical abstract Abstract Study of vibrations due to vortex shedding (VIV) in the wake of a cylinder that is exposed to current or oscillatory flow is very important, especially for marine risers which are used to extract oil and gas from the sea bed. The phenomenon of vortex induced vibration (VIV) has been one of the major concerns for hydrodynamic researchers due to its potential ability to cause severe fatigue damage. The hydrodynamics of VIV is very complex and still not fully understood. In this paper, some results (amplitude over diameter, lift and drag coefficients) of high Reynolds VIV experiments that are performed in UTM towing tank with an in-house test set-up are presented. A circular cylinder of 114 mm in diameter and 3 min length was towed at constant speed through the basin at Reynolds numbers up to 1.1x10 5 . Model tests with a stationary cylinder and tests with a freely vibrating cylinder were carried out to investigate the influence of VIV on drag coefficient. Later these results are compared with results obtained through 3D numerical simulation, LES is used to solve turbulence flow. It was found that CFD results showed similar trends with experimental results. Results of this paper can be very important to design riser system and future endeavor to perform similar kind of experiments. Successful numerical study of the VIV can also be fruitful for designing efficient VIV suppression devices. Keywords: VIV test setup; Large Eddy Simulation(LES) © 2014 Penerbit UTM Press. All rights reserved. 1.0 INTRODUCTION Vortex-induced vibration (VIV) is one of the key concerns for engineers while designing riser systems used for extracting oil and gas from the sea bed. A high level of fatigue damage can be occurred in a relatively short period of time for risers that are exposed to harsh ocean environments because of VIV. Vortex- Induced Vibration (VIV) is a phenomenon that happens when flow interacts with a certain structure as shown in Figure 1. When a fluid flows past a blunt object, it is excited by forces caused by vortices shed, an unsteady flow that occurs in special flow velocities depending upon the size and shape of the body. Vortices are created at the back of the body and separate periodically as well as asymmetrically from either side of the body causing the time varying non-uniform pressure distribution around the object. This non uniform pressure creates a time varying lift force around the object resulting the structure to vibrate in both inline and transverse to the flow. The vortex shedding frequency harmonizes with the natural frequency, and the vibration frequency near the natural frequency of the structure. The change in hydrodynamic mass is one of the main reasons behind this synchronization, as demonstrated in the experiments of Vikestad [1]. This synchronization occurs over a range of reduced velocity that is defined as the lock-in range. VIV is considered as a self-limiting type of response, usually after reaching certain amplitude shedding process no longer transfer the energy from fluid to structure, instead energy transfer process become reverse. Typically, the resulting vibrations are detrimental because it increases fatigue loading and component design complexity to accommodate these motions. Figure 1 vortex induced vibration of cylinder
Transcript of Experimental and Numerical Studies of Vortex Induced ...
66:2 (2014) 169–175 | www.jurnalteknologi.utm.my | eISSN 2180–3722 |
Full paper Jurnal
Teknologi
Experimental and Numerical Studies of Vortex Induced Vibration on Cylinder M. Mobassher Tofaa,b, Adi Maimunb*, Yasser M. Ahmeda, Saeed Jameia, Hassan Abyna
aFaculty of Mechanical Engineering, Universiti Teknologi Malaysia, 81310 UTM Johor Bahru, Johor, Malaysia bMarine Technology Centre, Universiti Teknologi Malaysia, 81310 UTM, Johor Bahru, Johor, Malaysia
*Corresponding author: [email protected] Article history
Received :1 August 2013 Received in revised form :
10 November 2013
Accepted :28 November 2013
Graphical abstract
Abstract
Study of vibrations due to vortex shedding (VIV) in the wake of a cylinder that is exposed to current or oscillatory flow is very important, especially for marine risers which are used to extract oil and gas from
the sea bed. The phenomenon of vortex induced vibration (VIV) has been one of the major concerns for
hydrodynamic researchers due to its potential ability to cause severe fatigue damage. The hydrodynamics of VIV is very complex and still not fully understood. In this paper, some results (amplitude over
diameter, lift and drag coefficients) of high Reynolds VIV experiments that are performed in UTM
towing tank with an in-house test set-up are presented. A circular cylinder of 114 mm in diameter and 3
min length was towed at constant speed through the basin at Reynolds numbers up to 1.1x10⁵
. Model tests
with a stationary cylinder and tests with a freely vibrating cylinder were carried out to investigate the
influence of VIV on drag coefficient. Later these results are compared with results obtained through 3D
numerical simulation, LES is used to solve turbulence flow. It was found that CFD results showed similar trends with experimental results. Results of this paper can be very important to design riser system and
future endeavor to perform similar kind of experiments. Successful numerical study of the VIV can also
be fruitful for designing efficient VIV suppression devices.
Keywords: VIV test setup; Large Eddy Simulation(LES)
© 2014 Penerbit UTM Press. All rights reserved.
1.0 INTRODUCTION
Vortex-induced vibration (VIV) is one of the key concerns for
engineers while designing riser systems used for extracting oil and
gas from the sea bed. A high level of fatigue damage can be
occurred in a relatively short period of time for risers that are
exposed to harsh ocean environments because of VIV. Vortex-
Induced Vibration (VIV) is a phenomenon that happens when
flow interacts with a certain structure as shown in Figure 1. When
a fluid flows past a blunt object, it is excited by forces caused by
vortices shed, an unsteady flow that occurs in special flow
velocities depending upon the size and shape of the body.
Vortices are created at the back of the body and separate
periodically as well as asymmetrically from either side of the
body causing the time varying non-uniform pressure distribution
around the object. This non uniform pressure creates a time
varying lift force around the object resulting the structure to
vibrate in both inline and transverse to the flow. The vortex
shedding frequency harmonizes with the natural frequency, and
the vibration frequency near the natural frequency of the structure.
The change in hydrodynamic mass is one of the main reasons
behind this synchronization, as demonstrated in the experiments
of Vikestad [1]. This synchronization occurs over a range of
reduced velocity that is defined as the lock-in range. VIV is
considered as a self-limiting type of response, usually after
reaching certain amplitude shedding process no longer transfer the
energy from fluid to structure, instead energy transfer process
become reverse. Typically, the resulting vibrations are detrimental
because it increases fatigue loading and component design
complexity to accommodate these motions.
Figure 1 vortex induced vibration of cylinder
170 Adi Maimun et al. / Jurnal Teknologi (Sciences & Engineering) 66:2 (2014), 169–175
Numerous experimental and numerical investigations, to study
vortex-induced vibrations (VIV) of a circular cylinder, have been
carried out in the recent past. In steady flow, the vortex shedding
process is characterized by Reynolds number, the vortex shedding
process remains more or less same for 300 <Re< 300000. This
range of Reynolds number is termed as sub-critical flow regime,
Though full scale cases certainly enter the critical and super-critical
regimes where Re> 300000, most VIV related experiments had
been done in sub-critical flow regime. Some of the initial research
works on flow induced vibrations were summed up by Blevins
[2]. It was found by numerous studies [2] that the in-line
vibrations magnitude are smaller than the transverse vibrations.
Inline vibrations are less important for risers since they only
emerge at lower reduced velocity. A number of experimental
evaluations of vortex formation modes were reviewed by
Govardhan and Williamson [3]. Willden and Graham [4]
reviewed VIV studies on low mass ratio cylinders. Dong and
Karniadakis [5] research presents some VIV results of Direct
Numerical Simulation (DNS) of the flow past a stationary
cylinder and a vibrating cylinder using a spectral element method
at Re =10000. Dong et al. [6] showed similar DNS simulations
and PIV measurements of the flow past a stationary cylinder at Re
= 4000 and 10000. Although results of the simulations are
successful in terms of matching with the experiments, it was
found that the use of the spectral element method to perform DNS
required large computational resources. Chaplin et al. [7]
reviewed and compared some existing CFD codes for riser VIV
analysis. Experimental details for a long riser under a variety of
current conditions were presented by Trim et al. [8]. A number of
research works on complex modes were reviewed by Lucor et al.
[9]. Holmes et al. [10] used a fully 3D simulation approach to
analyze riser VIV and the effect of strakes Flow over a sphere by
using Detached-Eddy Simulation was discussed in details by
Constantinescu et al. in both subcritical [11] and super critical
region [12]. Saltara et al. did a 3D simulation to analyze VIV by
using Detached-Eddy Simulation for a Reynolds number 104, his
simulation showed good agreement with existing results [13].
Research related 3D simulation to analyze VIV can be very
rewarding as successful simulation can be used to verify the
effectiveness of new design of VIV suppression devices. Very
small number of literatures regarding 3D VIV simulation can be
found, most of the existing literatures about VIV simulations are
2D and performed at low Re numbers. In this paper, the results of
VIV experiments that were performed in UTM MARIN's towing
tank are presented. This research study was primarily done to
obtain new VIV data of a cylinder with low mass ratio at high
Reynolds numbers that can be used as validation material for
CFD calculations and to develop a better test set-up for future
VIV measurements. Tests with a stationary cylinder as well as
with the cylinder freely vibrating were carried out to find the
effect of VIV on in-line drag. The present VIV data of this
research has been compared with results obtained through
computational fluid dynamics by using commercial software
ANSYS CFX, LES was used as the turbulence model.
2.0 IMPORTANT PARAMETERS FOR VIV ANALYSIS
The hydrodynamics of a fixed cylinder with diameter D in
constant flow with velocity U is characterized by three parameters
namely Reynolds number (Re), Strouhal number (St) and reduced
velocity (UR).
Re =UD
ν (1)
where 𝜈 is the viscosity of water.
St =Dfs
U (2)
where fs shedding frequency,
Reduced velocity (UR) is defined by following equation
UR =U
fnD (3)
where fn natural frequency,
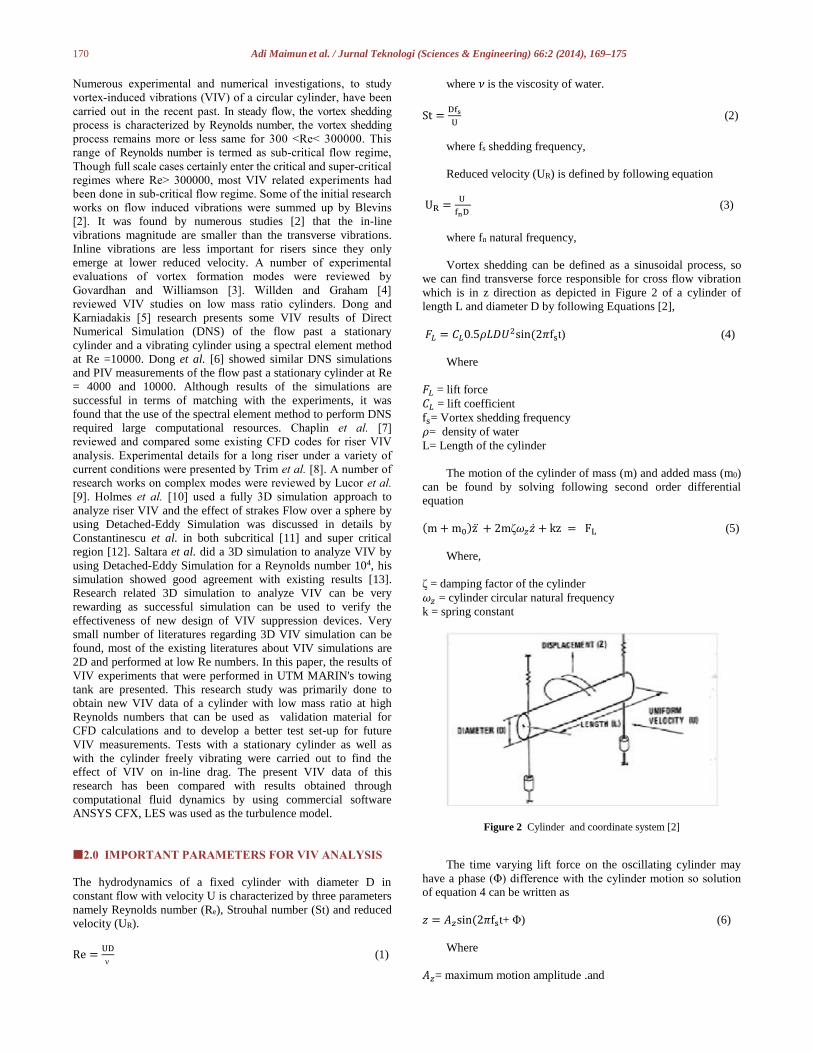
Vortex shedding can be defined as a sinusoidal process, so
we can find transverse force responsible for cross flow vibration
which is in z direction as depicted in Figure 2 of a cylinder of
length L and diameter D by following Equations [2],
𝐹𝐿 = 𝐶𝐿0.5𝜌𝐿𝐷𝑈2sin (2𝜋fst) (4)
Where
𝐹𝐿 = lift force
𝐶𝐿 = lift coefficient
fs= Vortex shedding frequency
𝜌= density of water
L= Length of the cylinder
The motion of the cylinder of mass (m) and added mass (m0)
can be found by solving following second order differential
equation
(m + m0)z ̈ + 2mζ𝜔𝑧�̇� + kz = FL (5)
Where,
ζ = damping factor of the cylinder
𝜔𝑧 = cylinder circular natural frequency
k = spring constant
Figure 2 Cylinder and coordinate system [2]
The time varying lift force on the oscillating cylinder may
have a phase (Φ) difference with the cylinder motion so solution
of equation 4 can be written as
𝑧 = 𝐴𝑧sin (2𝜋fst+ Φ) (6)
Where
𝐴𝑧= maximum motion amplitude .and
171 Adi Maimun et al. / Jurnal Teknologi (Sciences & Engineering) 66:2 (2014), 169–175
Φ = Phase difference
Drag of the cylinder can be directly measured with strain
gauges on the blade springs, accelerometer is used to measure the
vertical accelerations and by double integration motion in vertical
direction can be obtained. In line drag coefficient (CD) can be
found by following formula where 𝐹𝐷 s total in line drag.
𝐶𝐷 = 𝐹𝐷
0.5𝜌𝐿𝐷𝑈 2 (7)
The length of the path for one cycle is U/fs, for steady
vibration, where U is term used for free stream velocity and fs, for
the shedding frequency. The width of the path is 2Az where Az is
the amplitude of the vibration, also can be noted as A .These path
dimensions can be related to the structural dimension namely non
dimensional motion amplitude (A/D) and reduced velocity UR.
Normally non dimensional motion amplitude (A/D) is presented
as a function of reduced velocity(UR) to analyze vortex induced
vibration [2]. Figure 3 shows spring supported cylinder subjected
to current. Where, U is free stream velocity, D is cylinder diameter
and fn is natural frequency of the cylinder which can be found by
following equation
fn = 1
2π√
k
m+m0 (8)
where k is spring constant , m and mo are respectively the
mass and added mass of the cylinder. When the shedding
frequency (fs) becomes equal to the natural frequency (fn) of the
structure, the lock-in phenomenon occurs. At lock-in, the
vibration amplitude becomes maximum and the correlation
between the excitation forces along the span increases
dramatically. In other words, when the vortex shedding
frequency is controlled by the oscillation frequency, lock-in
occurs.
Figure 3 Spring supported cylinder subjected to current
The oscillation frequency will be different than the natural
frequency in still water since added mass will be varied. So, it can
be said the synchronisation of the shedding and vibration
frequencies largely depend on hydrodynamic mass variation.
Vikestad [1] showed normally much wider lock-in regions are
experienced at low mass ratio of order 1 to 10. The mass ratio is
defined as the ratio of the oscillating structural mass to the
displaced fluid mass. For cylinder of length L, it is
m+ =m
ρπLD2
4 (9)
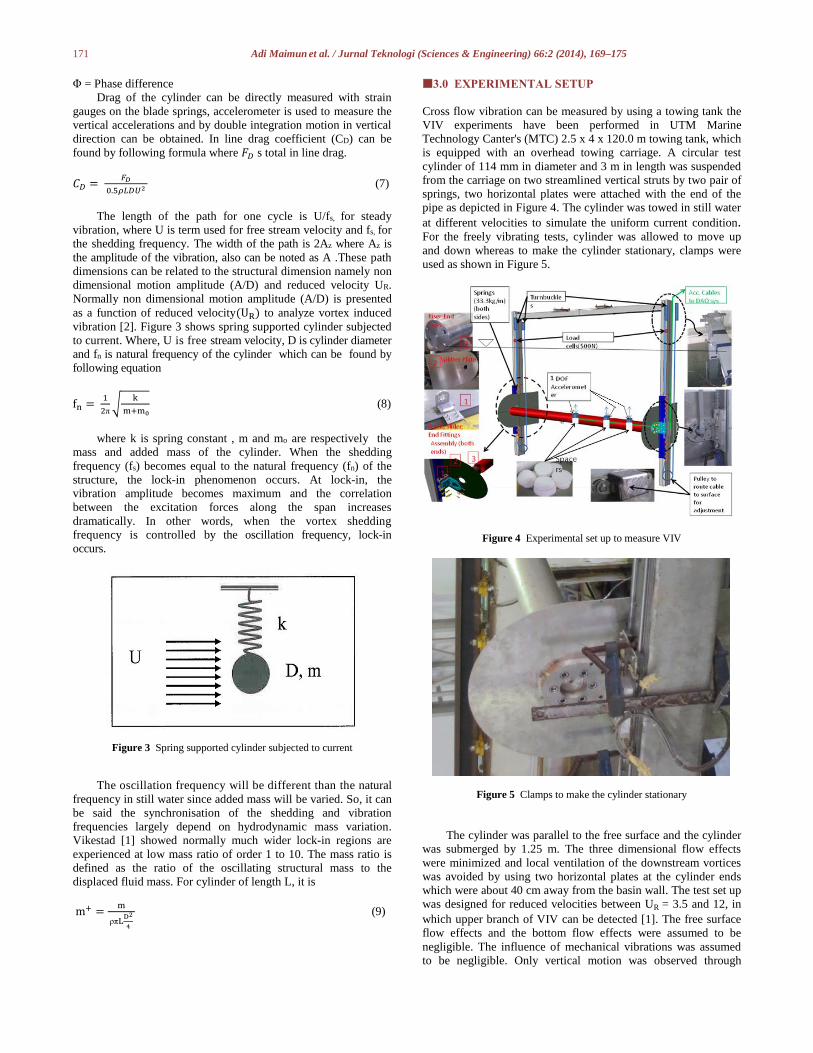
3.0 EXPERIMENTAL SETUP
Cross flow vibration can be measured by using a towing tank the
VIV experiments have been performed in UTM Marine
Technology Canter's (MTC) 2.5 x 4 x 120.0 m towing tank, which
is equipped with an overhead towing carriage. A circular test
cylinder of 114 mm in diameter and 3 m in length was suspended
from the carriage on two streamlined vertical struts by two pair of
springs, two horizontal plates were attached with the end of the
pipe as depicted in Figure 4. The cylinder was towed in still water
at different velocities to simulate the uniform current condition. For the freely vibrating tests, cylinder was allowed to move up
and down whereas to make the cylinder stationary, clamps were
used as shown in Figure 5.
Figure 4 Experimental set up to measure VIV
Figure 5 Clamps to make the cylinder stationary
The cylinder was parallel to the free surface and the cylinder
was submerged by 1.25 m. The three dimensional flow effects
were minimized and local ventilation of the downstream vortices
was avoided by using two horizontal plates at the cylinder ends
which were about 40 cm away from the basin wall. The test set up was designed for reduced velocities between UR = 3.5 and 12, in
which upper branch of VIV can be detected [1]. The free surface
flow effects and the bottom flow effects were assumed to be
negligible. The influence of mechanical vibrations was assumed
to be negligible. Only vertical motion was observed through
172 Adi Maimun et al. / Jurnal Teknologi (Sciences & Engineering) 66:2 (2014), 169–175
accelerometer, in-line drags were observed by strain gauge and lift forces were measured by transducers.
Table 1 Experimental parameters; (Cylinder Particulars)
Entry
Parameter
Symbol
unit
Value
1
Diameter
D
mm
114
3
1.18
0.70
26.31
0.01
2 Length L
m
3 Mass ratio m+
4 Natural frequency fn
s-1
5
Aspect Ratio L/D
6 Damping ratio ζ
4.0 NUMERICAL SIMULATION
The VIV experiment was tried to be simulated by solving the
coupled fluid–structure interaction problem. ANSYS-CFX solver
was used for simulations. The coupled fluid–structure interaction
problem can be considered as a three field problem, i.e. fluid
flow, structural displacement and the moving mesh. By solving
fluid flow problem, force on the structure at each time step is
calculated then by solving 2nd order motion equation the
structural displacement is calculated . By numerically solving the
unsteady incompressible Navier-Strokes equations, the flow flied
around the cylinder was calculated, LES was used to solve
turbulent flow.
𝜕𝑢𝑖
𝜕𝑡+
𝜕
𝜕𝑥𝑗 �̅�𝑖�̅�𝑗 = −
1
𝜌
𝜕�̅�
𝜕𝑥𝑗+ 𝒗
𝜕𝑢𝑖
𝜕𝑥𝑖𝑥𝑗−
𝜕𝜏𝑖𝑗
𝜕𝑥𝑖 (10)
where the sub grid stresses are given by
𝜏𝑖𝑗 = 𝑢𝑖𝑢𝑗 ̅̅ ̅̅ ̅̅ ̅ -�̅�𝑖�̅�𝑗 (11)
with the smagorinsky sub grid scale turbulence model
𝜏𝑖𝑗 = 2𝒗𝑻 𝑆�̅�𝑗 (12)
𝑣𝑇 = (Cs Δ)2√𝟐𝑆�̅�𝑗𝑆�̅�𝑗 (13)
The local strain rate tensor 𝑆�̅�𝑗 is defined as
𝑆�̅�𝑗 =1
2(
𝜕𝑢𝑖
𝜕𝑥𝑗 +
𝜕𝑢 𝑗
𝜕𝑥𝑖 ) (14)
and filter width is taken as the local grid size , for example
Δ = (ΔxΔyΔz)1
3 (15)
The Smagorinsky coefficient is taken as 0.1. The governing
equation (Equation 5) for the dynamic response of the rigid
horizontal cylinder is discussed earlier. ANSYS-CFX software
then solves the governing equation by using CFX Expression
Language (CEL) code to determine the cylinder displacement
The riser was horizontally positioned as it was during the
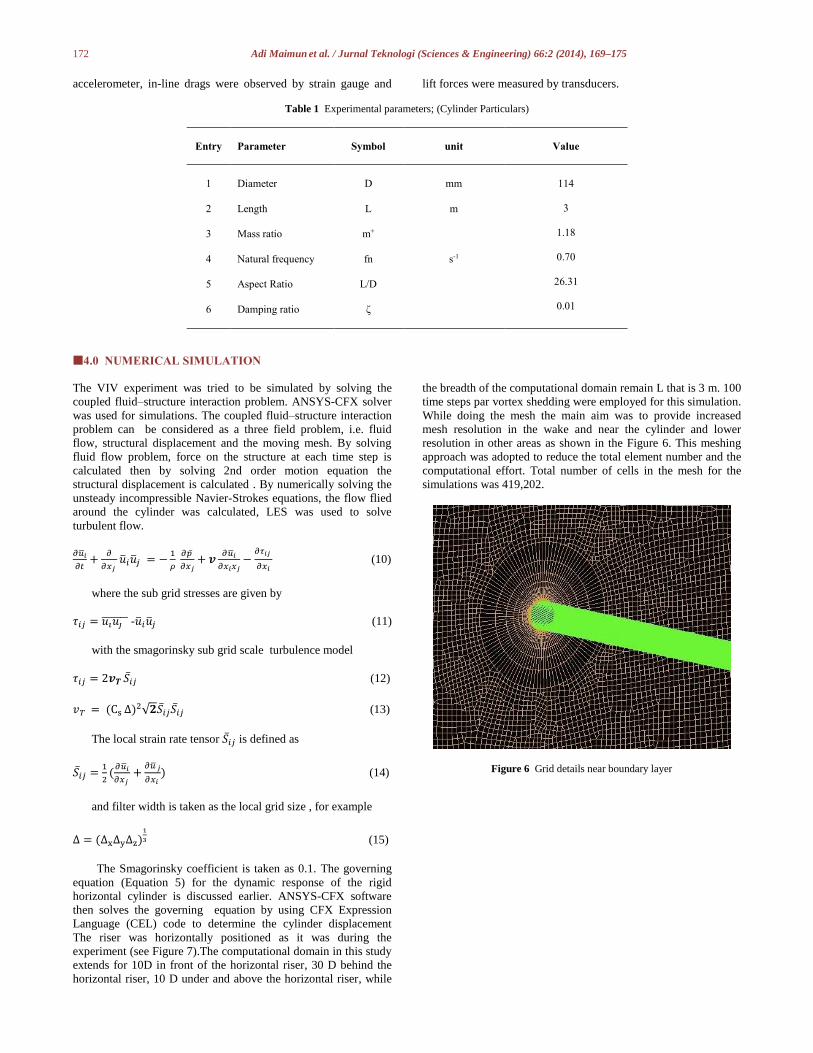
experiment (see Figure 7).The computational domain in this study
extends for 10D in front of the horizontal riser, 30 D behind the
horizontal riser, 10 D under and above the horizontal riser, while
the breadth of the computational domain remain L that is 3 m. 100
time steps par vortex shedding were employed for this simulation.
While doing the mesh the main aim was to provide increased
mesh resolution in the wake and near the cylinder and lower
resolution in other areas as shown in the Figure 6. This meshing
approach was adopted to reduce the total element number and the
computational effort. Total number of cells in the mesh for the
simulations was 419,202.
Figure 6 Grid details near boundary layer
173 Adi Maimun et al. / Jurnal Teknologi (Sciences & Engineering) 66:2 (2014), 169–175
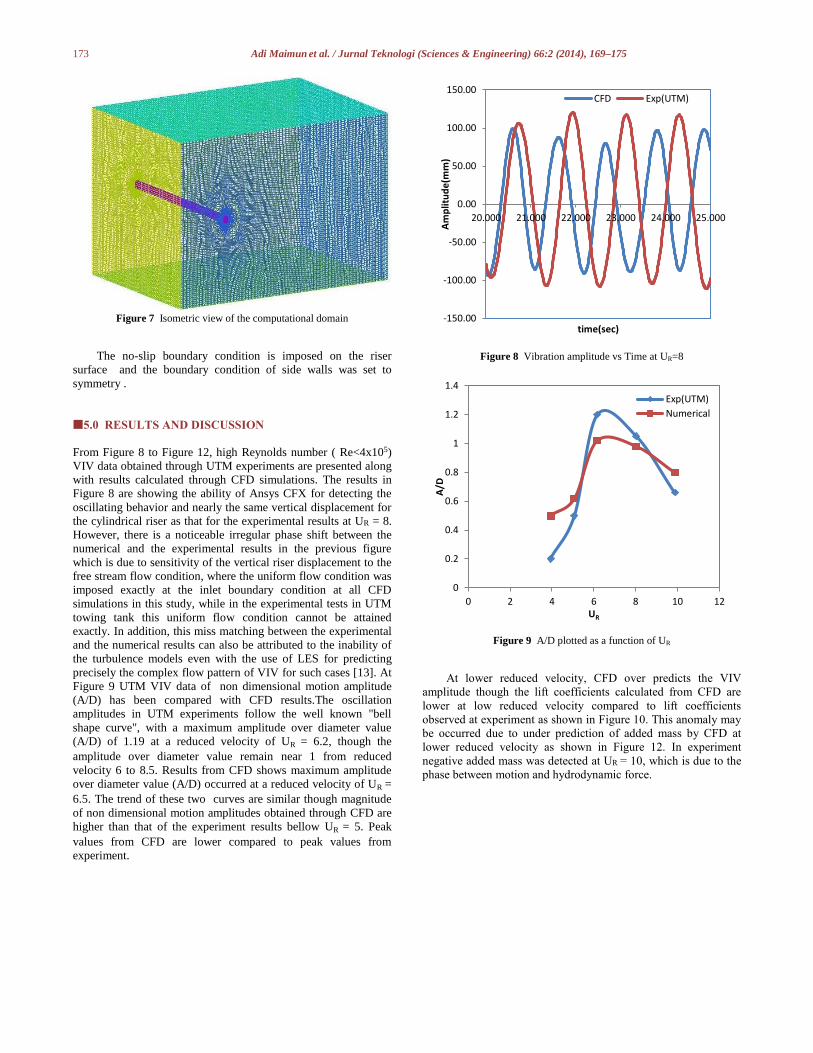
Figure 7 Isometric view of the computational domain
The no-slip boundary condition is imposed on the riser
surface and the boundary condition of side walls was set to
symmetry .
5.0 RESULTS AND DISCUSSION
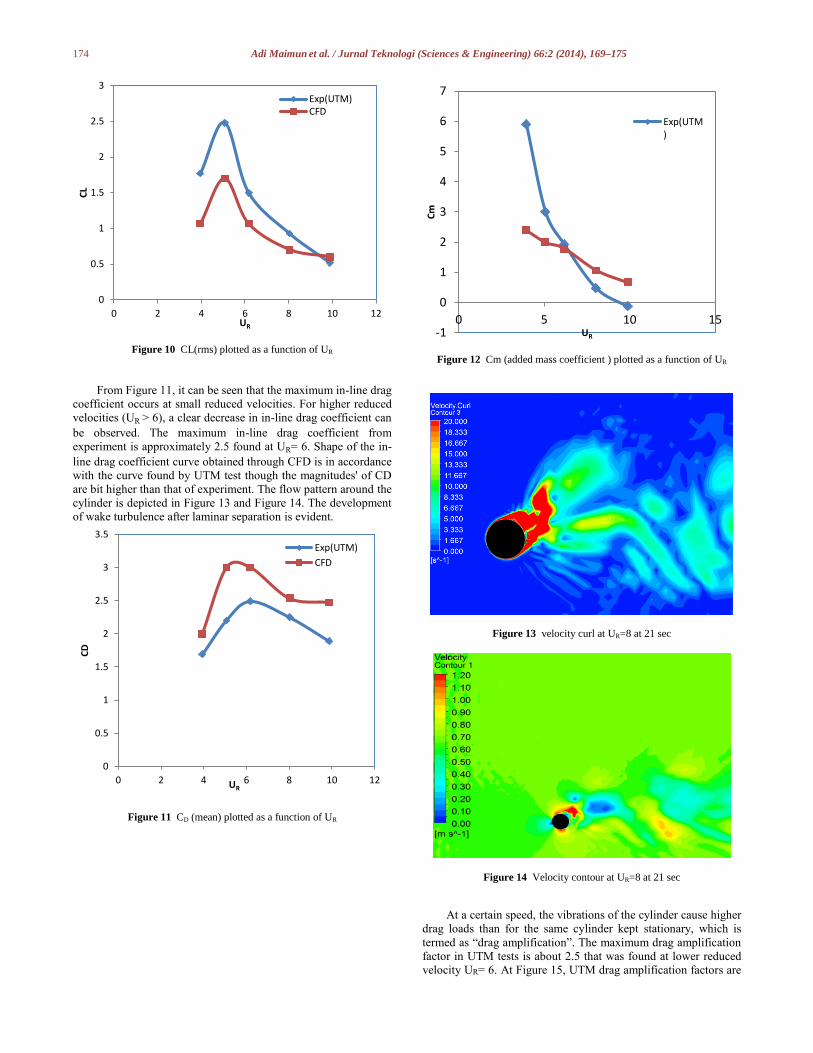
From Figure 8 to Figure 12, high Reynolds number ( Re<4x10⁵)
VIV data obtained through UTM experiments are presented along
with results calculated through CFD simulations. The results in
Figure 8 are showing the ability of Ansys CFX for detecting the
oscillating behavior and nearly the same vertical displacement for
the cylindrical riser as that for the experimental results at UR = 8.
However, there is a noticeable irregular phase shift between the
numerical and the experimental results in the previous figure
which is due to sensitivity of the vertical riser displacement to the
free stream flow condition, where the uniform flow condition was
imposed exactly at the inlet boundary condition at all CFD
simulations in this study, while in the experimental tests in UTM
towing tank this uniform flow condition cannot be attained
exactly. In addition, this miss matching between the experimental
and the numerical results can also be attributed to the inability of
the turbulence models even with the use of LES for predicting
precisely the complex flow pattern of VIV for such cases [13]. At
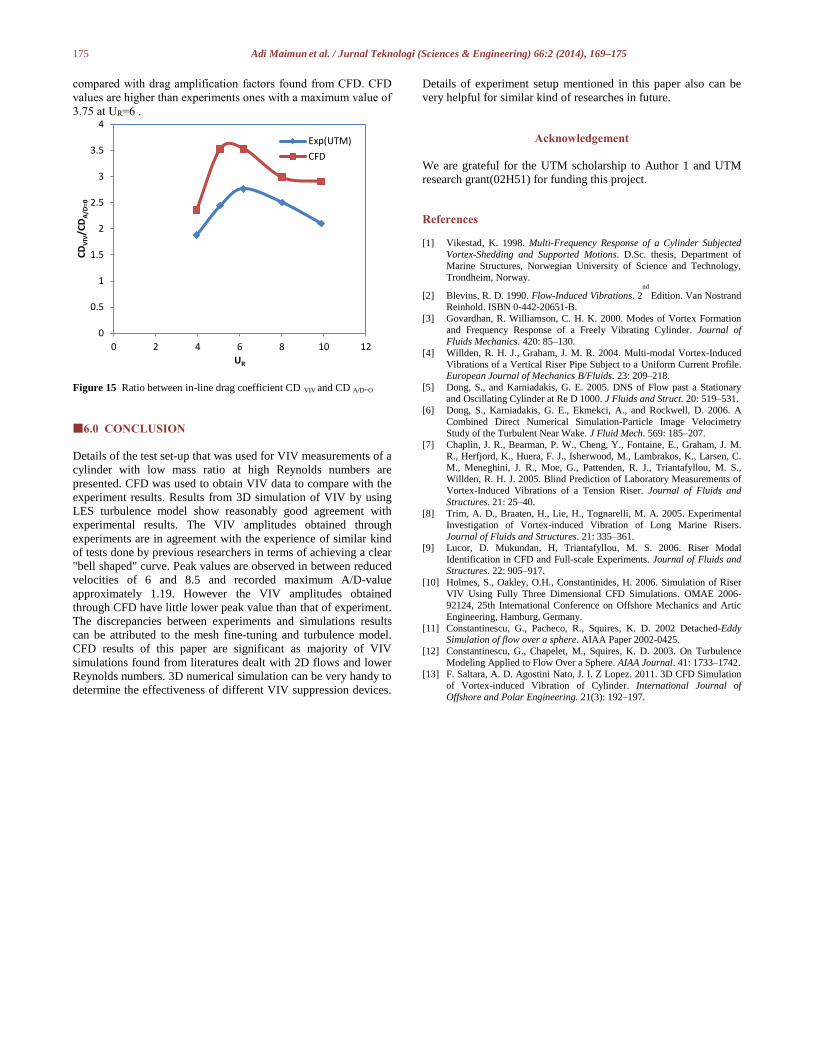
Figure 9 UTM VIV data of non dimensional motion amplitude
(A/D) has been compared with CFD results.The oscillation
amplitudes in UTM experiments follow the well known "bell
shape curve", with a maximum amplitude over diameter value
(A/D) of 1.19 at a reduced velocity of UR = 6.2, though the
amplitude over diameter value remain near 1 from reduced
velocity 6 to 8.5. Results from CFD shows maximum amplitude
over diameter value (A/D) occurred at a reduced velocity of UR =
6.5. The trend of these two curves are similar though magnitude
of non dimensional motion amplitudes obtained through CFD are
higher than that of the experiment results bellow UR = 5. Peak
values from CFD are lower compared to peak values from
experiment.
Figure 8 Vibration amplitude vs Time at UR=8
Figure 9 A/D plotted as a function of UR
At lower reduced velocity, CFD over predicts the VIV
amplitude though the lift coefficients calculated from CFD are
lower at low reduced velocity compared to lift coefficients
observed at experiment as shown in Figure 10. This anomaly may
be occurred due to under prediction of added mass by CFD at
lower reduced velocity as shown in Figure 12. In experiment
negative added mass was detected at UR = 10, which is due to the
phase between motion and hydrodynamic force.
-150.00
-100.00
-50.00
0.00
50.00
100.00
150.00
20.000 21.000 22.000 23.000 24.000 25.000
Am
plit
ud
e(m
m)
time(sec)
CFD Exp(UTM)
0
0.2
0.4
0.6
0.8
1
1.2
1.4
0 2 4 6 8 10 12
A/D
UR
Exp(UTM)
Numerical
174 Adi Maimun et al. / Jurnal Teknologi (Sciences & Engineering) 66:2 (2014), 169–175
Figure 10 CL(rms) plotted as a function of UR
From Figure 11, it can be seen that the maximum in-line drag
coefficient occurs at small reduced velocities. For higher reduced
velocities (UR > 6), a clear decrease in in-line drag coefficient can
be observed. The maximum in-line drag coefficient from
experiment is approximately 2.5 found at UR= 6. Shape of the in-
line drag coefficient curve obtained through CFD is in accordance
with the curve found by UTM test though the magnitudes' of CD
are bit higher than that of experiment. The flow pattern around the
cylinder is depicted in Figure 13 and Figure 14. The development
of wake turbulence after laminar separation is evident.
Figure 11 CD (mean) plotted as a function of UR
Figure 12 Cm (added mass coefficient ) plotted as a function of UR
Figure 13 velocity curl at UR=8 at 21 sec
Figure 14 Velocity contour at UR=8 at 21 sec
At a certain speed, the vibrations of the cylinder cause higher
drag loads than for the same cylinder kept stationary, which is
termed as “drag amplification”. The maximum drag amplification
factor in UTM tests is about 2.5 that was found at lower reduced
velocity UR= 6. At Figure 15, UTM drag amplification factors are
0
0.5
1
1.5
2
2.5
3
0 2 4 6 8 10 12
CL
UR
Exp(UTM)CFD
0
0.5
1
1.5
2
2.5
3
3.5
0 2 4 6 8 10 12
CD
UR
Exp(UTM)
CFD
-1
0
1
2
3
4
5
6
7
0 5 10 15
Cm
UR
Exp(UTM)
175 Adi Maimun et al. / Jurnal Teknologi (Sciences & Engineering) 66:2 (2014), 169–175
compared with drag amplification factors found from CFD. CFD
values are higher than experiments ones with a maximum value of
3.75 at UR=6 .
Figure 15 Ratio between in-line drag coefficient CD VIV and CD A/D=O
6.0 CONCLUSION
Details of the test set-up that was used for VIV measurements of a
cylinder with low mass ratio at high Reynolds numbers are
presented. CFD was used to obtain VIV data to compare with the
experiment results. Results from 3D simulation of VIV by using
LES turbulence model show reasonably good agreement with
experimental results. The VIV amplitudes obtained through
experiments are in agreement with the experience of similar kind
of tests done by previous researchers in terms of achieving a clear
"bell shaped" curve. Peak values are observed in between reduced
velocities of 6 and 8.5 and recorded maximum A/D-value
approximately 1.19. However the VIV amplitudes obtained
through CFD have little lower peak value than that of experiment.
The discrepancies between experiments and simulations results
can be attributed to the mesh fine-tuning and turbulence model.
CFD results of this paper are significant as majority of VIV
simulations found from literatures dealt with 2D flows and lower
Reynolds numbers. 3D numerical simulation can be very handy to
determine the effectiveness of different VIV suppression devices.
Details of experiment setup mentioned in this paper also can be
very helpful for similar kind of researches in future.
Acknowledgement
We are grateful for the UTM scholarship to Author 1 and UTM
research grant(02H51) for funding this project.
References
[1] Vikestad, K. 1998. Multi-Frequency Response of a Cylinder Subjected
Vortex-Shedding and Supported Motions. D.Sc. thesis, Department of
Marine Structures, Norwegian University of Science and Technology,
Trondheim, Norway.
[2] Blevins, R. D. 1990. Flow-Induced Vibrations. 2nd
Edition. Van Nostrand Reinhold. ISBN 0-442-20651-B.
[3] Govardhan, R. Williamson, C. H. K. 2000. Modes of Vortex Formation
and Frequency Response of a Freely Vibrating Cylinder. Journal of
Fluids Mechanics. 420: 85–130.
[4] Willden, R. H. J., Graham, J. M. R. 2004. Multi-modal Vortex-Induced
Vibrations of a Vertical Riser Pipe Subject to a Uniform Current Profile. European Journal of Mechanics B/Fluids. 23: 209–218.
[5] Dong, S., and Karniadakis, G. E. 2005. DNS of Flow past a Stationary
and Oscillating Cylinder at Re D 1000. J Fluids and Struct. 20: 519–531.
[6] Dong, S., Karniadakis, G. E., Ekmekci, A., and Rockwell, D. 2006. A
Combined Direct Numerical Simulation-Particle Image Velocimetry
Study of the Turbulent Near Wake. J Fluid Mech. 569: 185–207.
[7] Chaplin, J. R., Bearman, P. W., Cheng, Y., Fontaine, E., Graham, J. M.
R., Herfjord, K., Huera, F. J., Isherwood, M., Lambrakos, K., Larsen, C. M., Meneghini, J. R., Moe, G., Pattenden, R. J., Triantafyllou, M. S.,
Willden, R. H. J. 2005. Blind Prediction of Laboratory Measurements of
Vortex-Induced Vibrations of a Tension Riser. Journal of Fluids and
Structures. 21: 25–40.
[8] Trim, A. D., Braaten, H., Lie, H., Tognarelli, M. A. 2005. Experimental
Investigation of Vortex-induced Vibration of Long Marine Risers.
Journal of Fluids and Structures. 21: 335–361. [9] Lucor, D. Mukundan, H, Triantafyllou, M. S. 2006. Riser Modal
Identification in CFD and Full-scale Experiments. Journal of Fluids and
Structures. 22: 905–917.
[10] Holmes, S., Oakley, O.H., Constantinides, H. 2006. Simulation of Riser
VIV Using Fully Three Dimensional CFD Simulations. OMAE 2006-
92124, 25th International Conference on Offshore Mechanics and Artic
Engineering, Hamburg, Germany.
[11] Constantinescu, G., Pacheco, R., Squires, K. D. 2002 Detached-Eddy Simulation of flow over a sphere. AIAA Paper 2002-0425.
[12] Constantinescu, G., Chapelet, M., Squires, K. D. 2003. On Turbulence
Modeling Applied to Flow Over a Sphere. AIAA Journal. 41: 1733–1742.
[13] F. Saltara, A. D. Agostini Nato, J. I. Z Lopez. 2011. 3D CFD Simulation
of Vortex-induced Vibration of Cylinder. International Journal of
Offshore and Polar Engineering. 21(3): 192–197.
0
0.5
1
1.5
2
2.5
3
3.5
4
0 2 4 6 8 10 12
CD
VIV
/CD
A/D
=0
UR
Exp(UTM)
CFD