Good Corporate Governance Implementation - OECD · Good Corporate Governance Implementation In...
21
Disiapkan untuk diskusi kalangan terbatas oleh Kementerian BUMN. Dilarang memperbanyak tanpa izin tertulis Ministry of State-owned Enterprises Republic of Indonesia Good Corporate Governance Implementation In Indonesia’s State-owned Enterprises May 18 th 2011 Presented by Gatot Trihargo, Deputy Assistant for Strategic Industry & Manufacturing SOEs II
Transcript of Good Corporate Governance Implementation - OECD · Good Corporate Governance Implementation In...
Disiapkan untuk diskusi kalangan terbatas oleh Kementerian BUMN. Dilarang memperbanyak tanpa izin tertulis
Ministry of State-owned Enterprises Republic of Indonesia
Good Corporate Governance Implementation
In Indonesia’s State-owned Enterprises
May 18th 2011
Presented by Gatot Trihargo,
Deputy Assistant for Strategic Industry & Manufacturing SOEs II
Disiapkan untuk diskusi kalangan terbatas oleh Kementerian BUMN. Dilarang memperbanyak tanpa izin tertulis 2
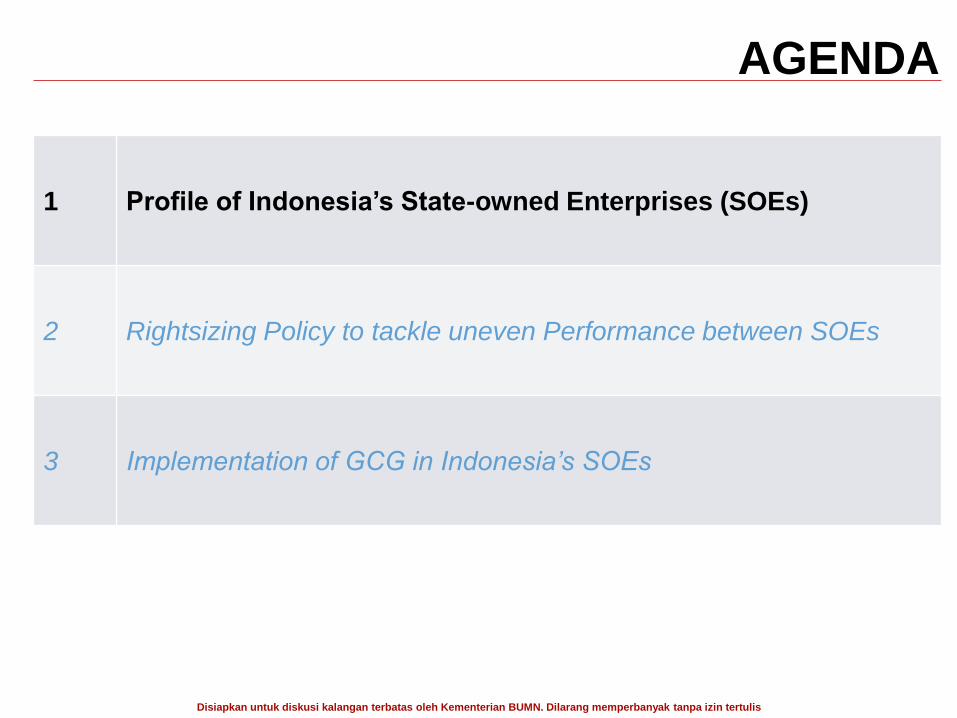
AGENDA
1 Profile of Indonesia’s State-owned Enterprises (SOEs)
2 Rightsizing Policy to tackle uneven Performance between SOEs
3 Implementation of GCG in Indonesia’s SOEs
3
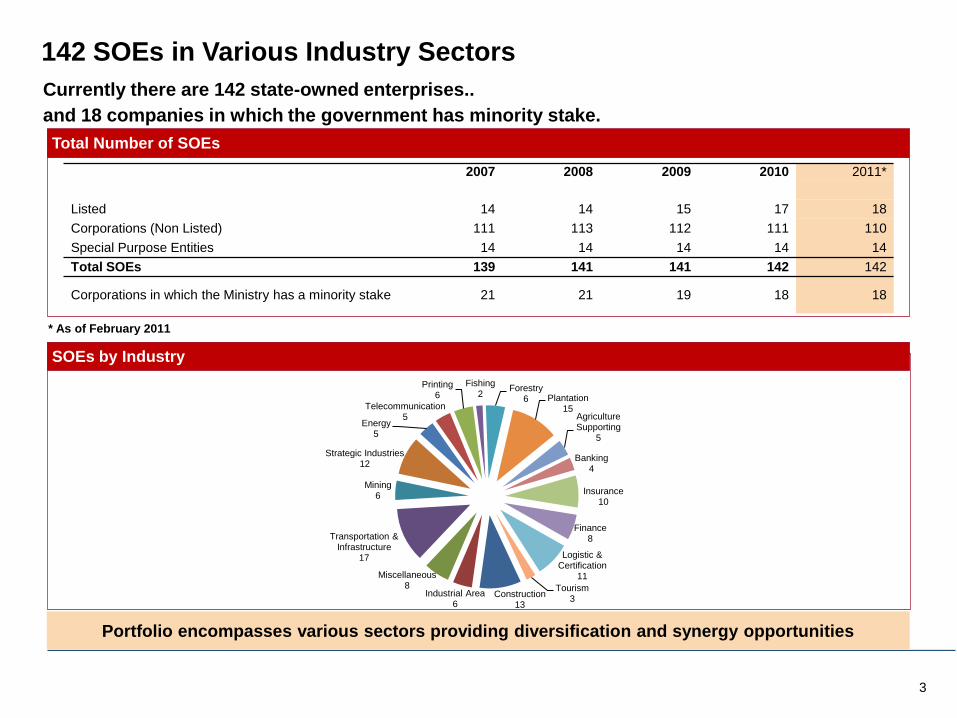
Currently there are 142 state-owned enterprises..
and 18 companies in which the government has minority stake.
142 SOEs in Various Industry Sectors
Portfolio encompasses various sectors providing diversification and synergy opportunities
Total Number of SOEs
2007 2008 2009 2010 2011*
Listed 14 14 15 17 18
Corporations (Non Listed) 111 113 112 111 110
Special Purpose Entities 14 14 14 14 14
Total SOEs 139 141 141 142 142
Corporations in which the Ministry has a minority stake 21 21 19 18 18
* As of February 2011
SOEs by Industry
3
Construction 13
Industrial Area 6
Miscellaneous 8
Transportation & Infrastructure
17
Mining 6
Strategic Industries 12
Energy 5
Telecommunication 5
Printing 6
Fishing 2
Forestry 6 Plantation
15 Agriculture Supporting
5
Banking 4
Insurance 10
Finance 8
Logistic & Certification
11
Tourism 3
4 4
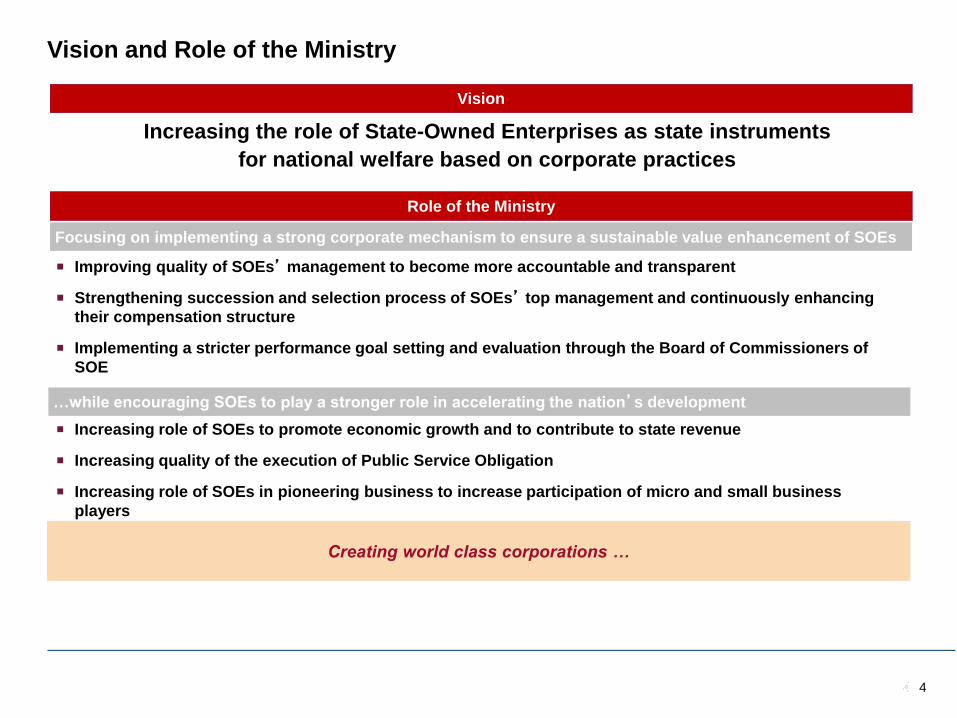
Increasing the role of State-Owned Enterprises as state instruments
for national welfare based on corporate practices
Focus on implementing a strong corporate mechanism to ensure sustainable value enhancement of SOE…
Improving quality of SOEs’ management to become more accountable and transparent
Strengthening succession and selection process of SOEs’ top management and continuously enhancing
their compensation structure
Implementing a stricter performance goal setting and evaluation through the Board of Commissioners of
SOE
…While encouraging a stronger role by SOEs in accelerating nation development
Increasing role of SOEs to promote economic growth and to contribute to state revenue
Increasing quality of the execution of Public Service Obligation
Increasing role of SOEs in pioneering business to increase participation of micro and small business
players
Vision and Role of the Ministry
Vision
Role of the Ministry
Creating world class corporations …
…while encouraging SOEs to play a stronger role in accelerating the nation’s development
Focusing on implementing a strong corporate mechanism to ensure a sustainable value enhancement of SOEs
4
5 5 5
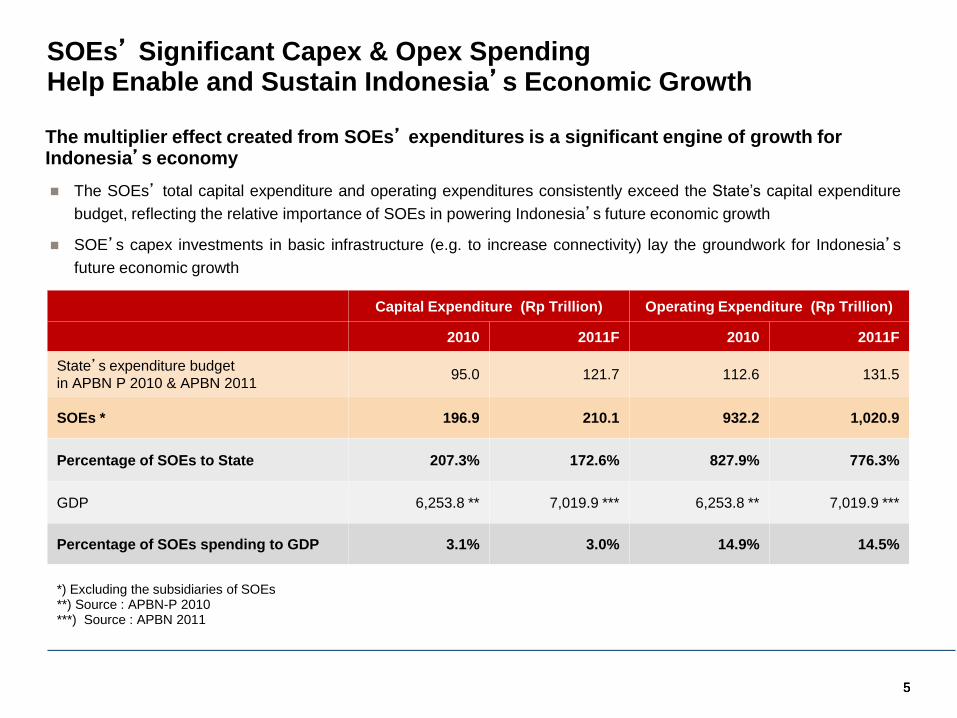
SOEs’ Significant Capex & Opex Spending Help Enable and Sustain Indonesia’s Economic Growth
The SOEs’ total capital expenditure and operating expenditures consistently exceed the State’s capital expenditure
budget, reflecting the relative importance of SOEs in powering Indonesia’s future economic growth
SOE’s capex investments in basic infrastructure (e.g. to increase connectivity) lay the groundwork for Indonesia’s
future economic growth
The multiplier effect created from SOEs’ expenditures is a significant engine of growth for Indonesia’s economy
Capital Expenditure (Rp Trillion) Operating Expenditure (Rp Trillion)
2010 2011F 2010 2011F
State’s expenditure budget
in APBN P 2010 & APBN 2011 95.0 121.7 112.6 131.5
SOEs * 196.9 210.1 932.2 1,020.9
Percentage of SOEs to State 207.3% 172.6% 827.9% 776.3%
GDP 6,253.8 ** 7,019.9 *** 6,253.8 ** 7,019.9 ***
Percentage of SOEs spending to GDP 3.1% 3.0% 14.9% 14.5%
*) Excluding the subsidiaries of SOEs **) Source : APBN-P 2010 ***) Source : APBN 2011
6 6 6
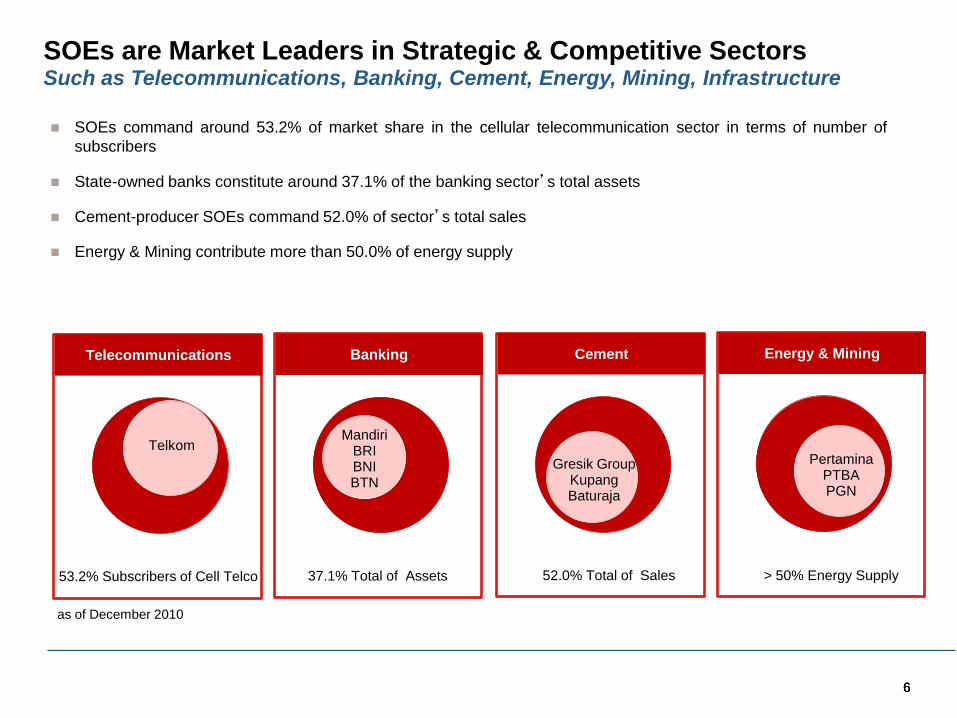
SOEs are Market Leaders in Strategic & Competitive Sectors Such as Telecommunications, Banking, Cement, Energy, Mining, Infrastructure
SOEs command around 53.2% of market share in the cellular telecommunication sector in terms of number of
subscribers
State-owned banks constitute around 37.1% of the banking sector’s total assets
Cement-producer SOEs command 52.0% of sector’s total sales
Energy & Mining contribute more than 50.0% of energy supply
Telecommunications Banking Cement Energy & Mining
53.2% Subscribers of Cell Telco
Telkom Mandiri
BRI BNI BTN
37.1% Total of Assets
Gresik Group Kupang Baturaja
52.0% Total of Sales > 50% Energy Supply
Pertamina PTBA PGN
as of December 2010
Disiapkan untuk diskusi kalangan terbatas oleh Kementerian BUMN. Dilarang memperbanyak tanpa izin tertulis 7
AGENDA
1 Profile of Indonesia’s State-owned Enterprises (SOEs)
2 Rightsizing Policy to tackle uneven Performance between
SOEs
3 Implementation of GCG in Indonesia’s SOEs
Disiapkan untuk diskusi kalangan terbatas oleh Kementerian SOEs. Dilarang memperbanyak tanpa izin tertulis
26 SOEs 92.5%
Others 7.5%
8 8 8
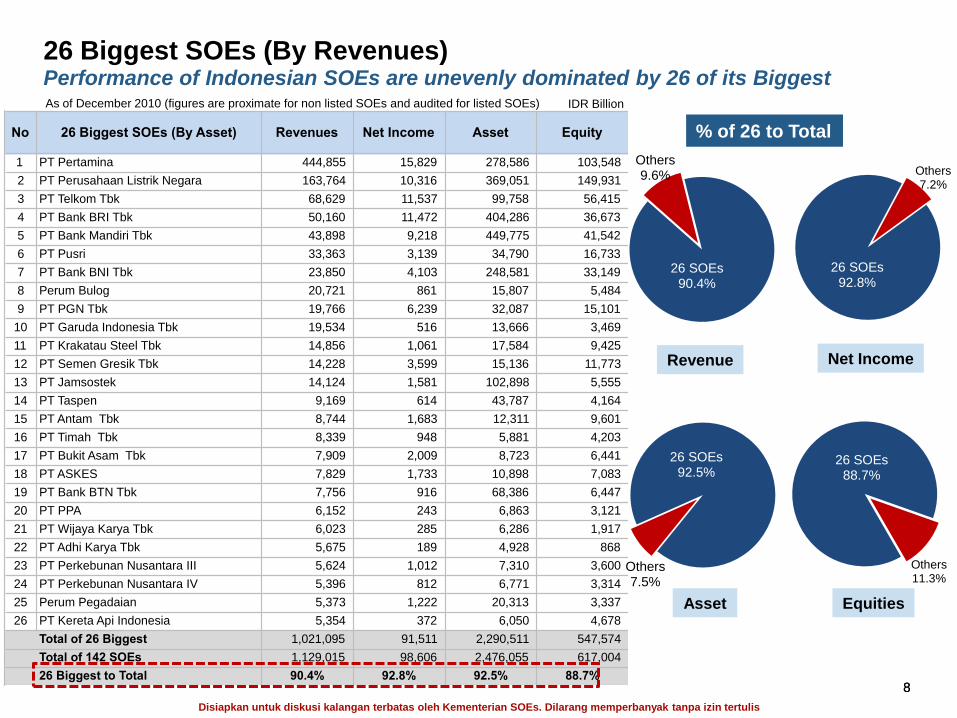
26 Biggest SOEs (By Revenues) Performance of Indonesian SOEs are unevenly dominated by 26 of its Biggest
IDR Billion
% of 26 to Total
Revenue Net Income
Asset Equities
26 SOEs 90.4%
Others 9.6%
26 SOEs 92.8%
Others 7.2%
As of December 2010 (figures are proximate for non listed SOEs and audited for listed SOEs)
No 26 Biggest SOEs (By Asset) Revenues Net Income Asset Equity
1 PT Pertamina 444,855 15,829 278,586 103,548
2 PT Perusahaan Listrik Negara 163,764 10,316 369,051 149,931
3 PT Telkom Tbk 68,629 11,537 99,758 56,415
4 PT Bank BRI Tbk 50,160 11,472 404,286 36,673
5 PT Bank Mandiri Tbk 43,898 9,218 449,775 41,542
6 PT Pusri 33,363 3,139 34,790 16,733
7 PT Bank BNI Tbk 23,850 4,103 248,581 33,149
8 Perum Bulog 20,721 861 15,807 5,484
9 PT PGN Tbk 19,766 6,239 32,087 15,101
10 PT Garuda Indonesia Tbk 19,534 516 13,666 3,469
11 PT Krakatau Steel Tbk 14,856 1,061 17,584 9,425
12 PT Semen Gresik Tbk 14,228 3,599 15,136 11,773
13 PT Jamsostek 14,124 1,581 102,898 5,555
14 PT Taspen 9,169 614 43,787 4,164
15 PT Antam Tbk 8,744 1,683 12,311 9,601
16 PT Timah Tbk 8,339 948 5,881 4,203
17 PT Bukit Asam Tbk 7,909 2,009 8,723 6,441
18 PT ASKES 7,829 1,733 10,898 7,083
19 PT Bank BTN Tbk 7,756 916 68,386 6,447
20 PT PPA 6,152 243 6,863 3,121
21 PT Wijaya Karya Tbk 6,023 285 6,286 1,917
22 PT Adhi Karya Tbk 5,675 189 4,928 868
23 PT Perkebunan Nusantara III 5,624 1,012 7,310 3,600
24 PT Perkebunan Nusantara IV 5,396 812 6,771 3,314
25 Perum Pegadaian 5,373 1,222 20,313 3,337
26 PT Kereta Api Indonesia 5,354 372 6,050 4,678
Total of 26 Biggest 1,021,095 91,511 2,290,511 547,574
Total of 142 SOEs 1,129,015 98,606 2,476,055 617,004
26 Biggest to Total 90.4% 92.8% 92.5% 88.7%
26 SOEs 88.7%
Others 11.3%
Disiapkan untuk diskusi kalangan terbatas oleh Kementerian SOEs. Dilarang memperbanyak tanpa izin tertulis
Kontribusi Terbesar Berasal dari 26 SOEs
26 SOEs 92.5%
Others 7.5%
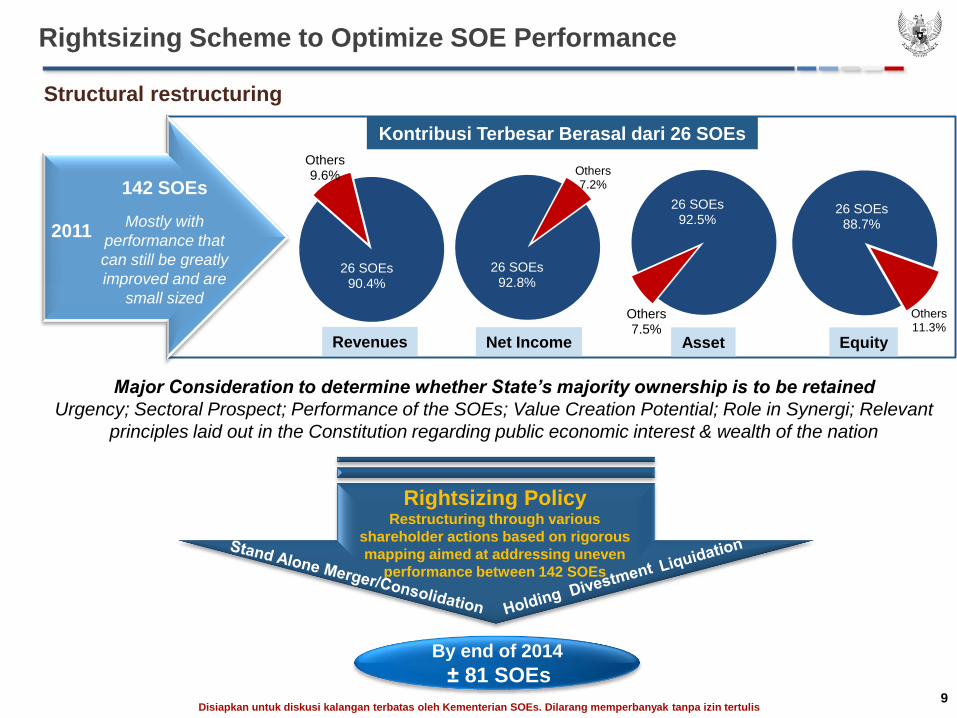
By end of 2014
± 81 SOEs
142 SOEs
Mostly with
performance that
can still be greatly
improved and are
small sized
2011
Rightsizing Scheme to Optimize SOE Performance
Structural restructuring
Major Consideration to determine whether State’s majority ownership is to be retained
Urgency; Sectoral Prospect; Performance of the SOEs; Value Creation Potential; Role in Synergi; Relevant
principles laid out in the Constitution regarding public economic interest & wealth of the nation
Revenues Net Income Asset Equity
26 SOEs 92.8%
Others 7.2%
26 SOEs 88.7%
Others 11.3%
26 SOEs 90.4%
Others 9.6%
9
Rightsizing Policy Restructuring through various
shareholder actions based on rigorous
mapping aimed at addressing uneven
performance between 142 SOEs
Disiapkan untuk diskusi kalangan terbatas oleh Kementerian SOEs. Dilarang memperbanyak tanpa izin tertulis
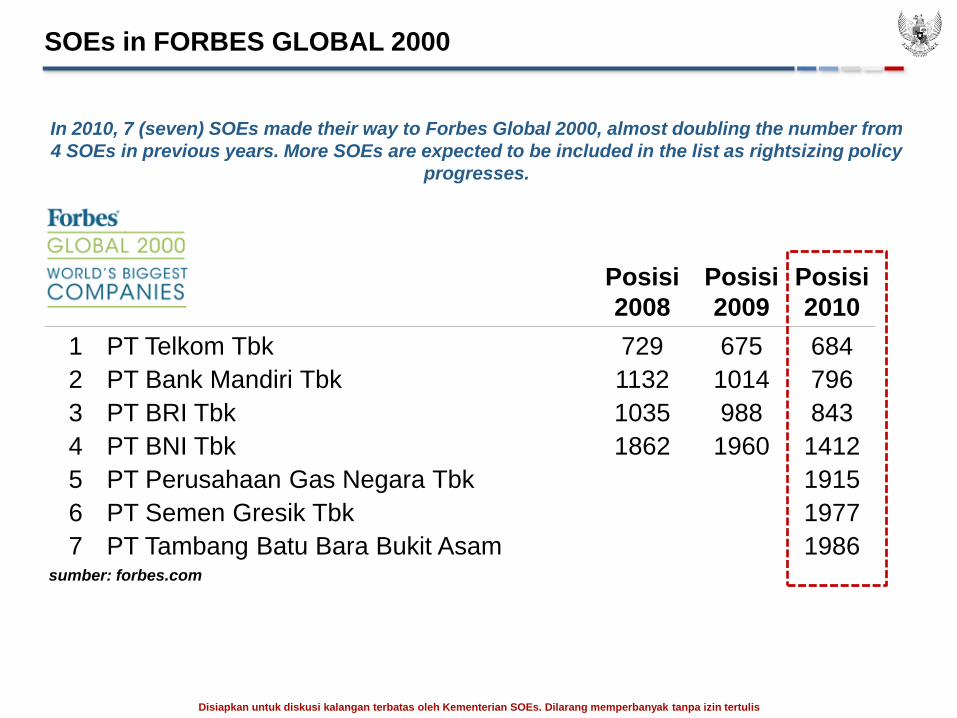
Posisi
2008
Posisi
2009
Posisi
2010
1 PT Telkom Tbk 729 675 684
2 PT Bank Mandiri Tbk 1132 1014 796
3 PT BRI Tbk 1035 988 843
4 PT BNI Tbk 1862 1960 1412
5 PT Perusahaan Gas Negara Tbk 1915
6 PT Semen Gresik Tbk 1977
7 PT Tambang Batu Bara Bukit Asam 1986
SOEs in FORBES GLOBAL 2000
sumber: forbes.com
In 2010, 7 (seven) SOEs made their way to Forbes Global 2000, almost doubling the number from
4 SOEs in previous years. More SOEs are expected to be included in the list as rightsizing policy
progresses.
Disiapkan untuk diskusi kalangan terbatas oleh Kementerian BUMN. Dilarang memperbanyak tanpa izin tertulis 11
AGENDA
1 Profile of Indonesia’s State-owned Enterprises (SOEs)
2 Rightsizing Policy to tackle uneven Performance between SOEs
3 Implementation of GCG in Indonesia’s SOEs
12
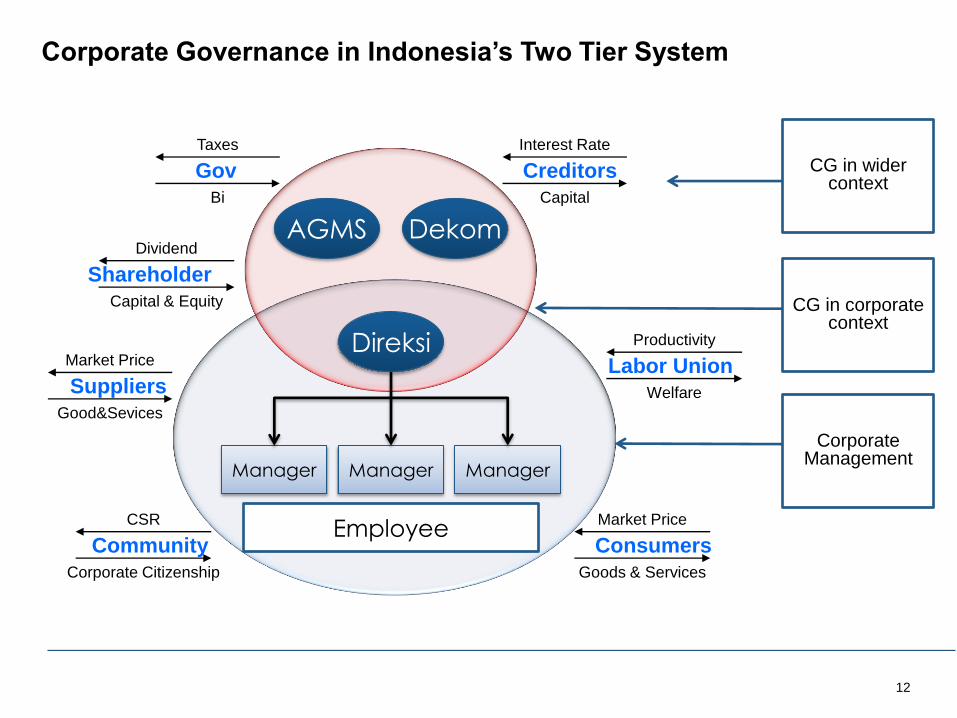
AGMS Dekom
Direksi
Employee
Manager Manager Manager
Community
Corporate Citizenship
CSR
Suppliers
Good&Sevices
Market Price
Shareholder
Capital & Equity
Dividend
Gov
Bi
Taxes
Consumers
Goods & Services
Market Price
Labor Union
Welfare
Productivity
Creditors
Capital
Interest Rate
CG in wider context
CG in corporate context
Corporate Management
Corporate Governance in Indonesia’s Two Tier System
Disiapkan untuk diskusi kalangan terbatas oleh Kementerian SOEs. Dilarang memperbanyak tanpa izin tertulis
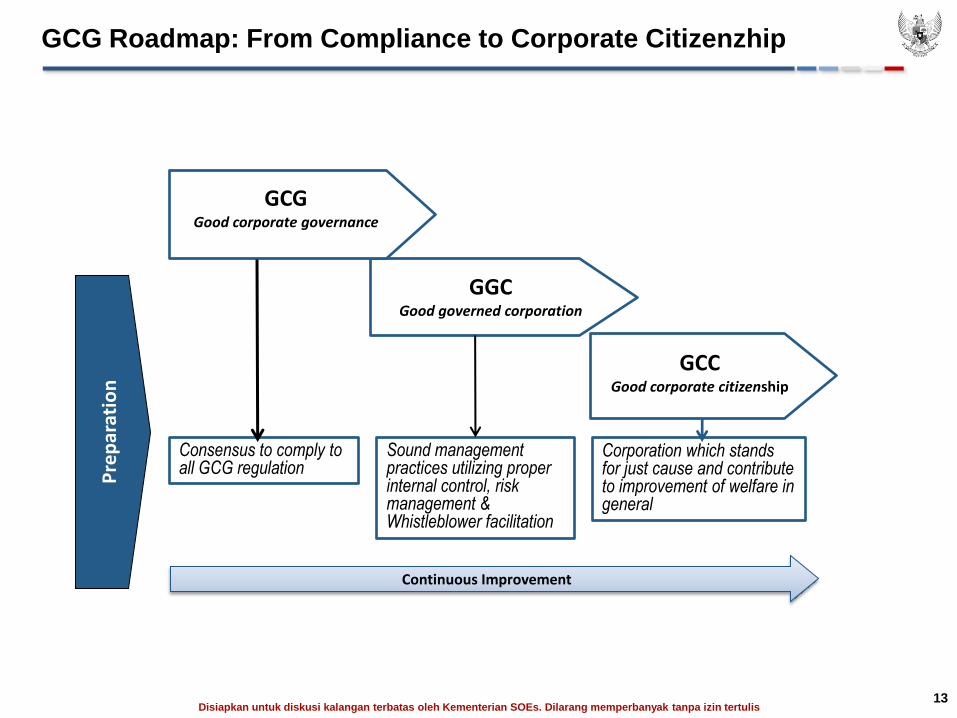
GCG Roadmap: From Compliance to Corporate Citizenzhip
13
Consensus to comply to all GCG regulation
Sound management practices utilizing proper internal control, risk management & Whistleblower facilitation
Corporation which stands for just cause and contribute to improvement of welfare in general
Pre
par
atio
n
Continuous Improvement
GGC Good governed corporation
GCC Good corporate citizenship
GCG Good corporate governance
Disiapkan untuk diskusi kalangan terbatas oleh Kementerian SOEs. Dilarang memperbanyak tanpa izin tertulis
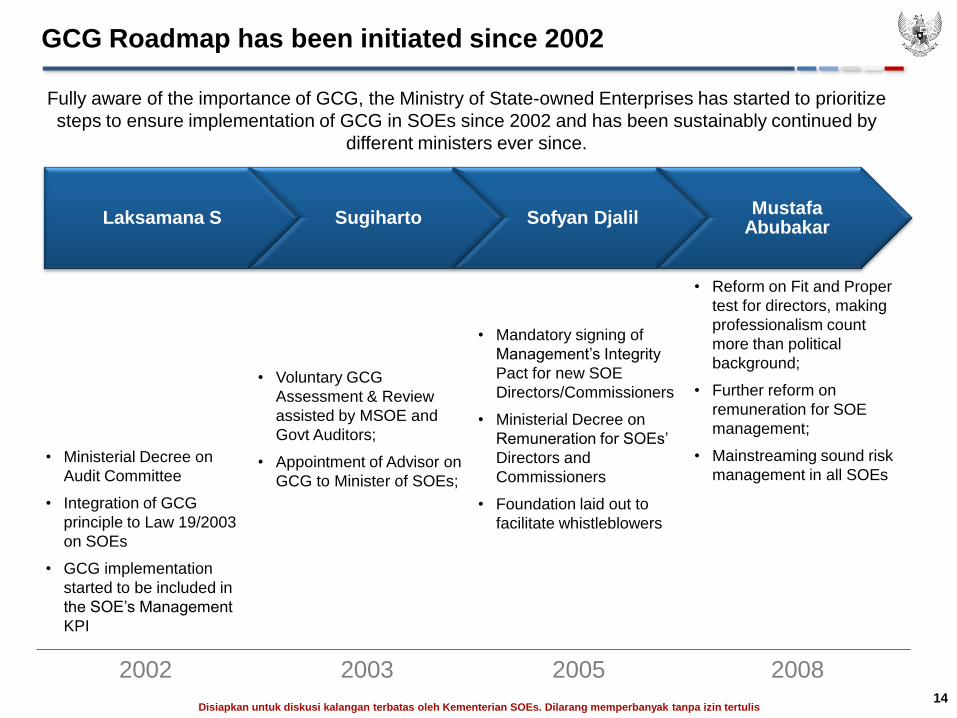
GCG Roadmap has been initiated since 2002
14
Laksamana S Sugiharto Sofyan Djalil Mustafa
Abubakar
• Ministerial Decree on
Audit Committee
• Integration of GCG
principle to Law 19/2003
on SOEs
• GCG implementation
started to be included in
the SOE’s Management
KPI
• Voluntary GCG
Assessment & Review
assisted by MSOE and
Govt Auditors;
• Appointment of Advisor on
GCG to Minister of SOEs;
• Mandatory signing of
Management’s Integrity
Pact for new SOE
Directors/Commissioners
• Ministerial Decree on
Remuneration for SOEs’
Directors and
Commissioners
• Foundation laid out to
facilitate whistleblowers
• Reform on Fit and Proper
test for directors, making
professionalism count
more than political
background;
• Further reform on
remuneration for SOE
management;
• Mainstreaming sound risk
management in all SOEs
2002 2003 2005 2008
Fully aware of the importance of GCG, the Ministry of State-owned Enterprises has started to prioritize
steps to ensure implementation of GCG in SOEs since 2002 and has been sustainably continued by
different ministers ever since.
Disiapkan untuk diskusi kalangan terbatas oleh Kementerian SOEs. Dilarang memperbanyak tanpa izin tertulis
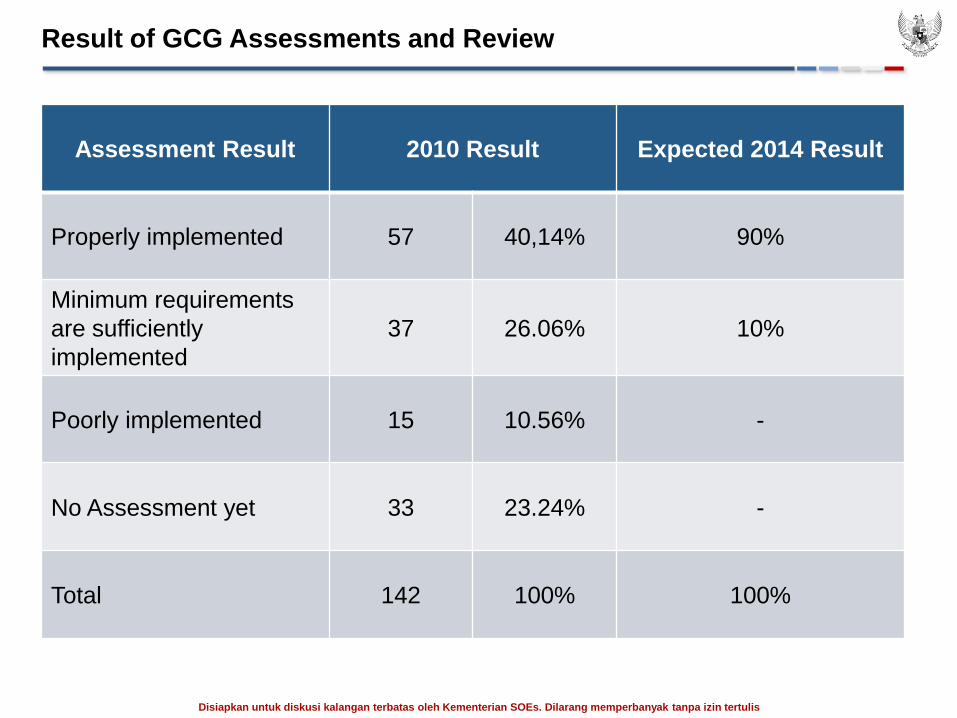
Result of GCG Assessments and Review
Assessment Result 2010 Result Expected 2014 Result
Properly implemented 57 40,14% 90%
Minimum requirements
are sufficiently
implemented
37 26.06% 10%
Poorly implemented 15 10.56% -
No Assessment yet 33 23.24% -
Total 142 100% 100%
16 16
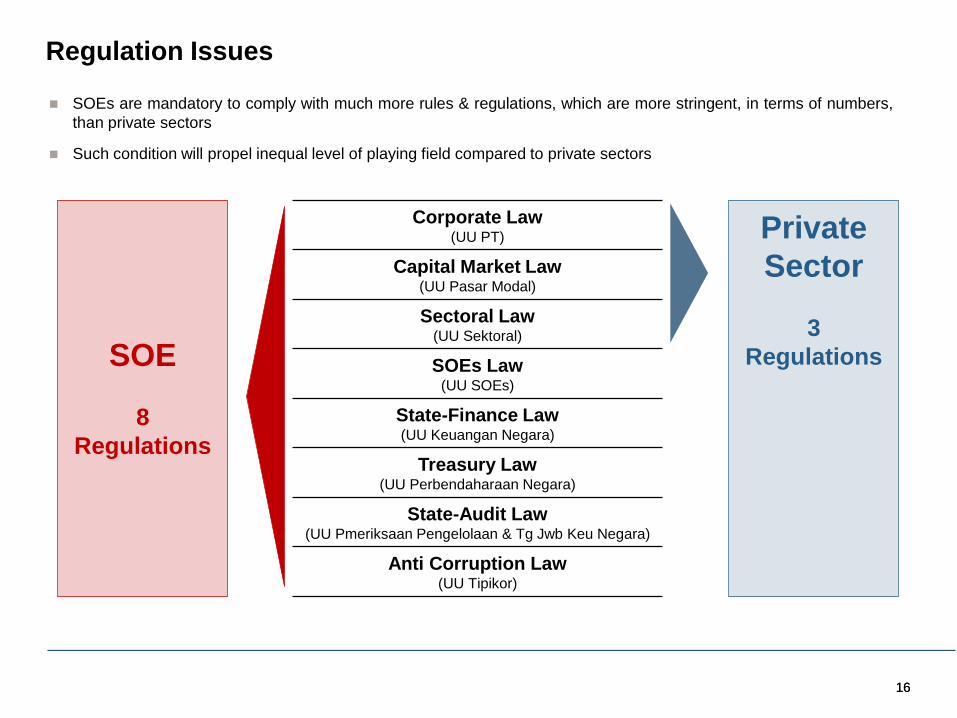
Regulation Issues
Corporate Law (UU PT)
Capital Market Law (UU Pasar Modal)
Sectoral Law (UU Sektoral)
SOEs Law (UU SOEs)
State-Finance Law (UU Keuangan Negara)
Treasury Law (UU Perbendaharaan Negara)
State-Audit Law (UU Pmeriksaan Pengelolaan & Tg Jwb Keu Negara)
Anti Corruption Law (UU Tipikor)
SOE
8
Regulations
Private
Sector
3
Regulations
SOEs are mandatory to comply with much more rules & regulations, which are more stringent, in terms of numbers,
than private sectors
Such condition will propel inequal level of playing field compared to private sectors
Disiapkan untuk diskusi kalangan terbatas oleh Kementerian SOEs. Dilarang memperbanyak tanpa izin tertulis
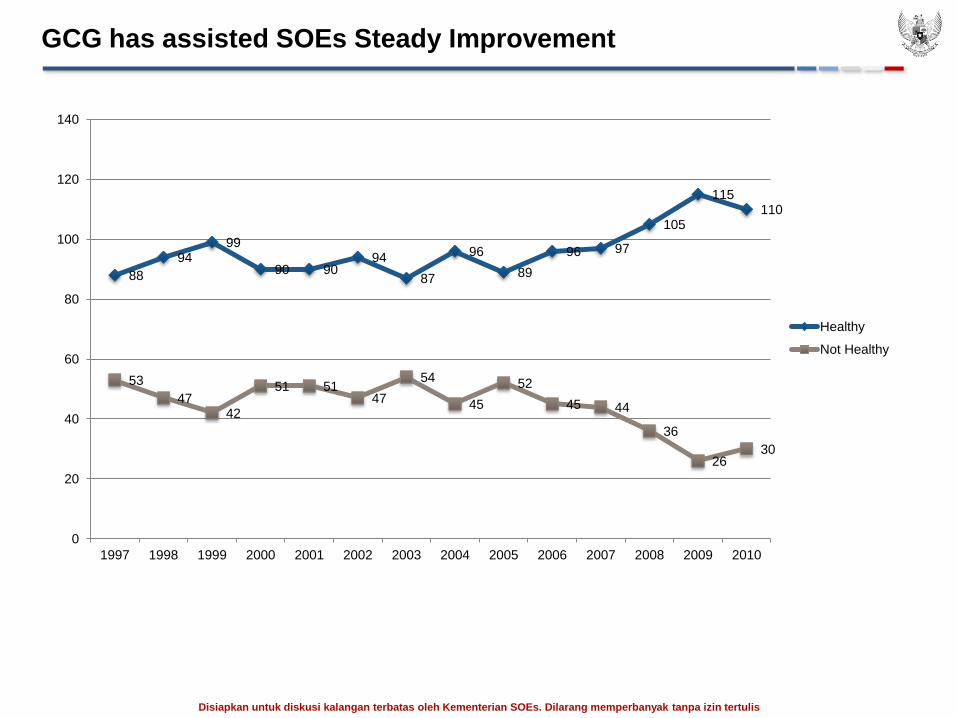
88
94 99
90 90 94
87
96
89
96 97
105
115 110
53
47 42
51 51 47
54
45
52
45 44
36
26 30
0
20
40
60
80
100
120
140
1997 1998 1999 2000 2001 2002 2003 2004 2005 2006 2007 2008 2009 2010
Healthy
Not Healthy
GCG has assisted SOEs Steady Improvement
Disiapkan untuk diskusi kalangan terbatas oleh Kementerian SOEs. Dilarang memperbanyak tanpa izin tertulis
18
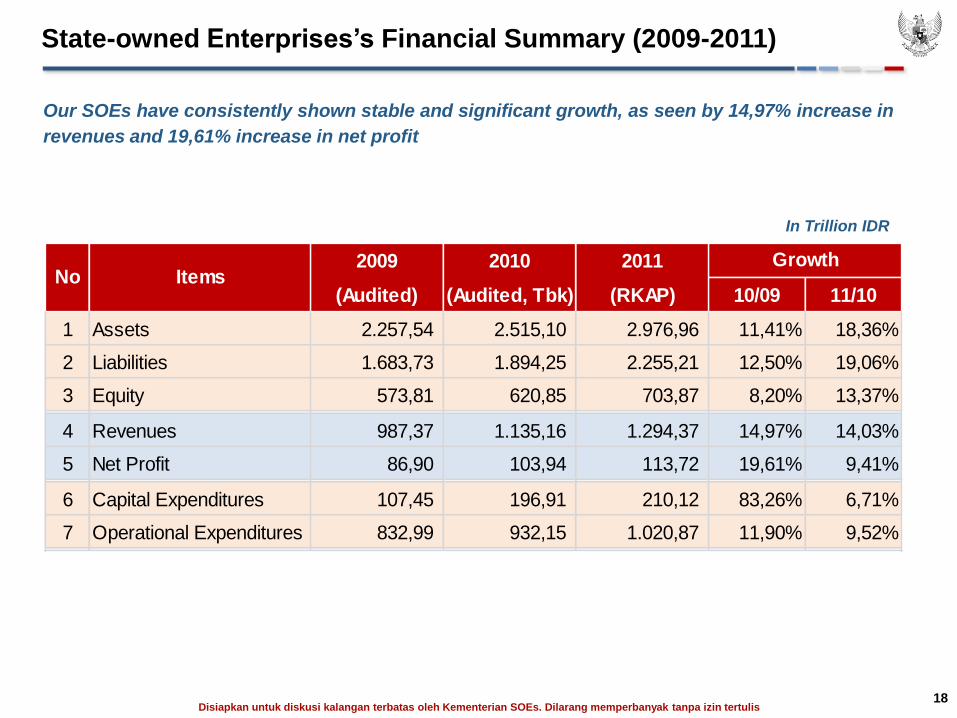
State-owned Enterprises’s Financial Summary (2009-2011)
2009 2010 2011
(Audited) (Audited, Tbk) (RKAP) 10/09 11/10
1 Assets 2.257,54 2.515,10 2.976,96 11,41% 18,36%
2 Liabilities 1.683,73 1.894,25 2.255,21 12,50% 19,06%
3 Equity 573,81 620,85 703,87 8,20% 13,37%
4 Revenues 987,37 1.135,16 1.294,37 14,97% 14,03%
5 Net Profit 86,90 103,94 113,72 19,61% 9,41%
6 Capital Expenditures 107,45 196,91 210,12 83,26% 6,71%
7 Operational Expenditures 832,99 932,15 1.020,87 11,90% 9,52%
GrowthNo Items
18
In Trillion IDR
Our SOEs have consistently shown stable and significant growth, as seen by 14,97% increase in
revenues and 19,61% increase in net profit
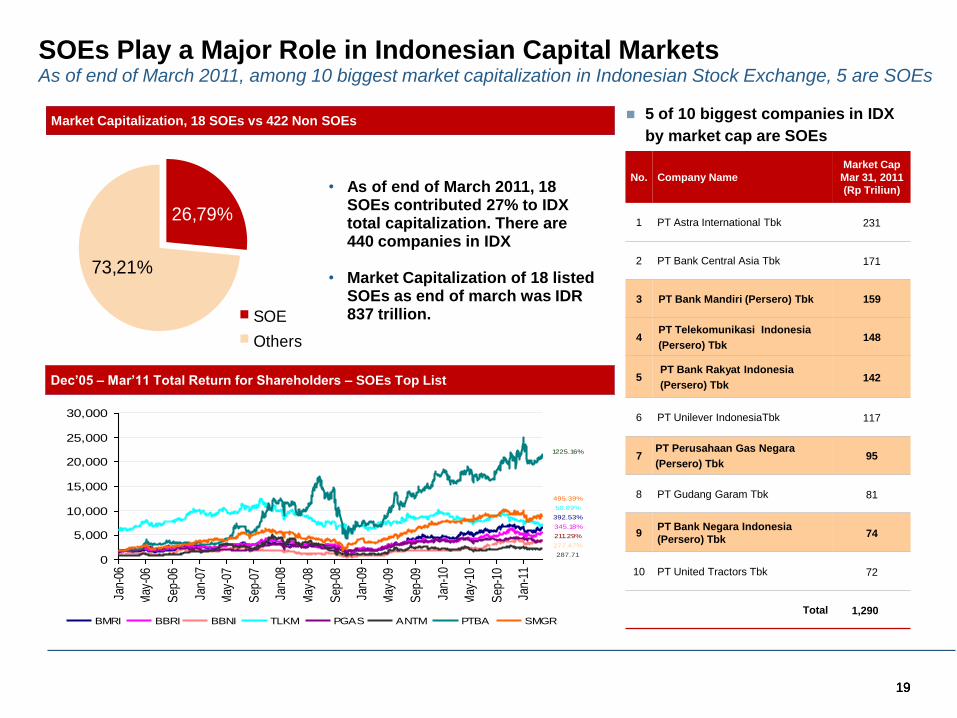
19 19 19
SOEs Play a Major Role in Indonesian Capital Markets As of end of March 2011, among 10 biggest market capitalization in Indonesian Stock Exchange, 5 are SOEs
No. Company Name
Market Cap
Mar 31, 2011
(Rp Triliun)
1 PT Astra International Tbk 231
2 PT Bank Central Asia Tbk 171
3 PT Bank Mandiri (Persero) Tbk 159
4 PT Telekomunikasi Indonesia
(Persero) Tbk 148
5 PT Bank Rakyat Indonesia
(Persero) Tbk 142
6 PT Unilever IndonesiaTbk 117
7 PT Perusahaan Gas Negara
(Persero) Tbk 95
8 PT Gudang Garam Tbk 81
9 PT Bank Negara Indonesia
(Persero) Tbk 74
10 PT United Tractors Tbk 72
Total 1,290
Market Capitalization, 18 SOEs vs 422 Non SOEs
Dec’05 – Mar’11 Total Return for Shareholders – SOEs Top List
26,79%
73,21%
SOE
Others
1225.16%
495.39%
50.89%
392.53%
345.18%
211.29%
277.47%
287.710
5,000
10,000
15,000
20,000
25,000
30,000
Jan-
06
May
-06
Sep
-06
Jan-
07
May
-07
Sep
-07
Jan-
08
May
-08
Sep
-08
Jan-
09
May
-09
Sep
-09
Jan-
10
May
-10
Sep
-10
Jan-
11
BMRI BBRI BBNI TLKM PGAS ANTM PTBA SMGR
• As of end of March 2011, 18 SOEs contributed 27% to IDX total capitalization. There are 440 companies in IDX
• Market Capitalization of 18 listed SOEs as end of march was IDR 837 trillion.
5 of 10 biggest companies in IDX
by market cap are SOEs
20 20 20
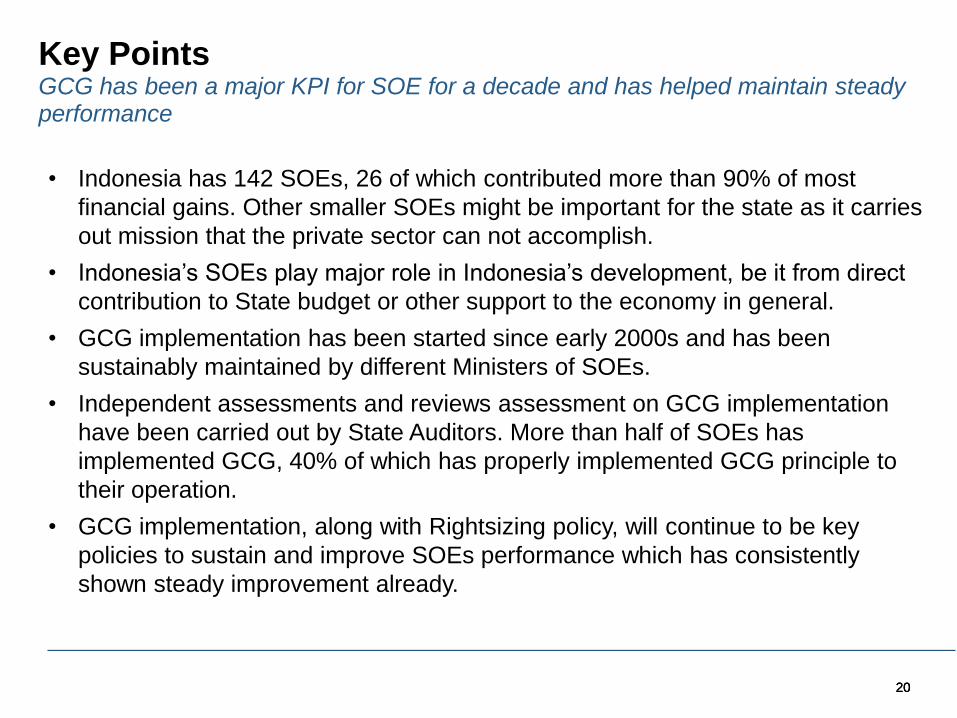
Key Points GCG has been a major KPI for SOE for a decade and has helped maintain steady performance
• Indonesia has 142 SOEs, 26 of which contributed more than 90% of most
financial gains. Other smaller SOEs might be important for the state as it carries
out mission that the private sector can not accomplish.
• Indonesia’s SOEs play major role in Indonesia’s development, be it from direct
contribution to State budget or other support to the economy in general.
• GCG implementation has been started since early 2000s and has been
sustainably maintained by different Ministers of SOEs.
• Independent assessments and reviews assessment on GCG implementation
have been carried out by State Auditors. More than half of SOEs has
implemented GCG, 40% of which has properly implemented GCG principle to
their operation.
• GCG implementation, along with Rightsizing policy, will continue to be key
policies to sustain and improve SOEs performance which has consistently
shown steady improvement already.
Ministry of State-owned Enterprises
Medan Merdeka Selatan No.13, Jakarta, Indonesia
http://www.bumn.go.id
Thank You