Herbs and Spices Statistic - doa.gov.my · Kementerian Pertanian dan Industri Asas Tani, ......
147
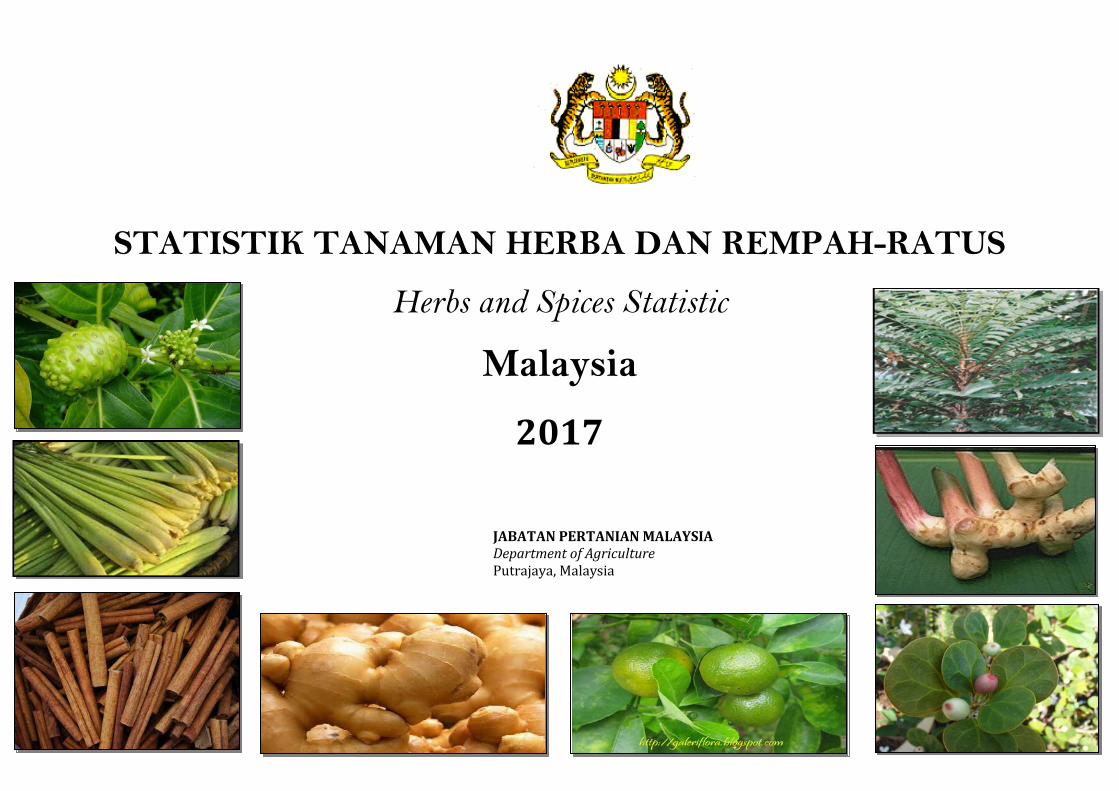
STATISTIK TANAMAN HERBA DAN REMPAH-RATUS Herbs and Spices Statistic Malaysia 2017 JABATAN PERTANIAN MALAYSIA Department of Agriculture Putrajaya, Malaysia
Transcript of Herbs and Spices Statistic - doa.gov.my · Kementerian Pertanian dan Industri Asas Tani, ......
STATISTIK TANAMAN HERBA DAN REMPAH-RATUS
Herbs and Spices Statistic
Malaysia
2017
JABATAN PERTANIAN MALAYSIA Department of Agriculture Putrajaya, Malaysia
STATISTIK TANAMAN HERBA DAN REMPAH-RATUS
Herbs and Spices Statistics
Malaysia
2017
Jabatan Pertanian Malaysia
Department of Agriculture Putrajaya, Malaysia
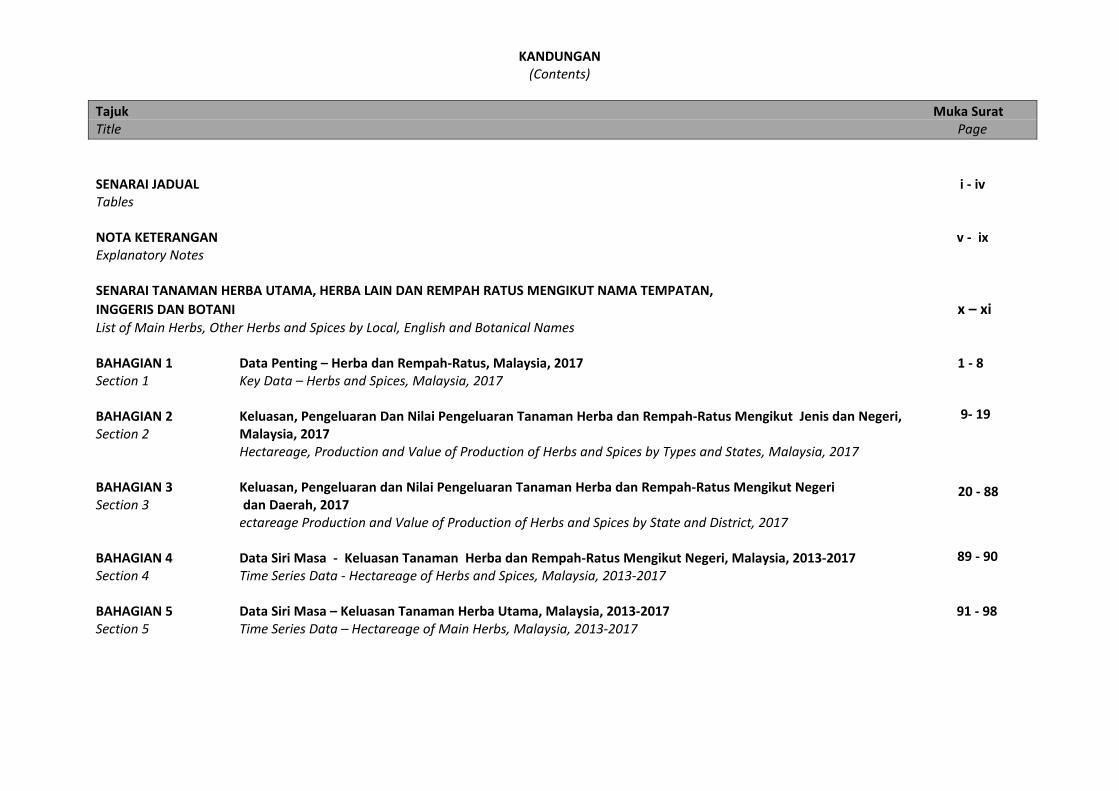
KANDUNGAN (Contents)
Tajuk Muka Surat Title Page SENARAI JADUAL i - iv Tables NOTA KETERANGAN v - ix Explanatory Notes SENARAI TANAMAN HERBA UTAMA, HERBA LAIN DAN REMPAH RATUS MENGIKUT NAMA TEMPATAN, INGGERIS DAN BOTANI x – xi List of Main Herbs, Other Herbs and Spices by Local, English and Botanical Names BAHAGIAN 1 Data Penting – Herba dan Rempah-Ratus, Malaysia, 2017 1 - 8 Section 1 Key Data – Herbs and Spices, Malaysia, 2017 BAHAGIAN 2 Keluasan, Pengeluaran Dan Nilai Pengeluaran Tanaman Herba dan Rempah-Ratus Mengikut Jenis dan Negeri, Section 2 Malaysia, 2017 Hectareage, Production and Value of Production of Herbs and Spices by Types and States, Malaysia, 2017
BAHAGIAN 3 Keluasan, Pengeluaran dan Nilai Pengeluaran Tanaman Herba dan Rempah-Ratus Mengikut Negeri Section 3 dan Daerah, 2017 ectareage Production and Value of Production of Herbs and Spices by State and District, 2017
BAHAGIAN 4 Data Siri Masa - Keluasan Tanaman Herba dan Rempah-Ratus Mengikut Negeri, Malaysia, 2013-2017 Section 4 Time Series Data - Hectareage of Herbs and Spices, Malaysia, 2013-2017 BAHAGIAN 5 Data Siri Masa – Keluasan Tanaman Herba Utama, Malaysia, 2013-2017 91 - 98 Section 5 Time Series Data – Hectareage of Main Herbs, Malaysia, 2013-2017
9- 19
20 - 88
89 - 90
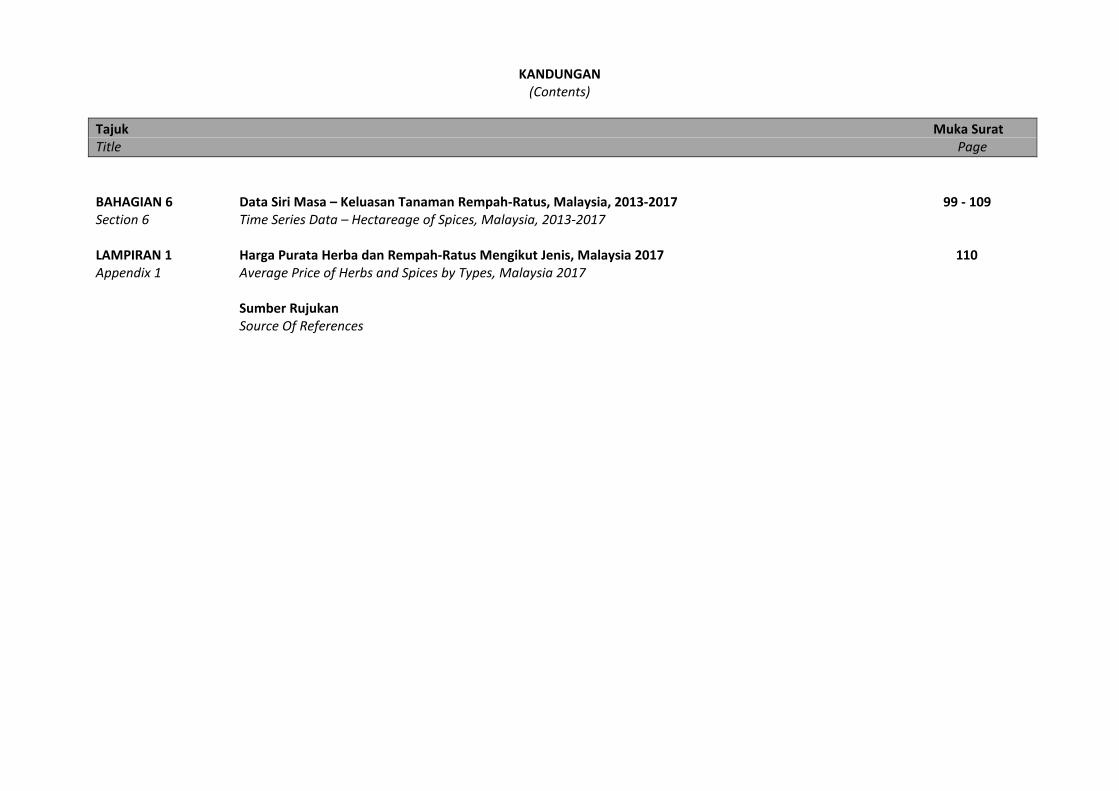
KANDUNGAN
(Contents) Tajuk Muka Surat Title Page BAHAGIAN 6 Data Siri Masa – Keluasan Tanaman Rempah-Ratus, Malaysia, 2013-2017 99 - 109 Section 6 Time Series Data – Hectareage of Spices, Malaysia, 2013-2017 LAMPIRAN 1 Harga Purata Herba dan Rempah-Ratus Mengikut Jenis, Malaysia 2017 110 Appendix 1 Average Price of Herbs and Spices by Types, Malaysia 2017
Sumber Rujukan Source Of References
i
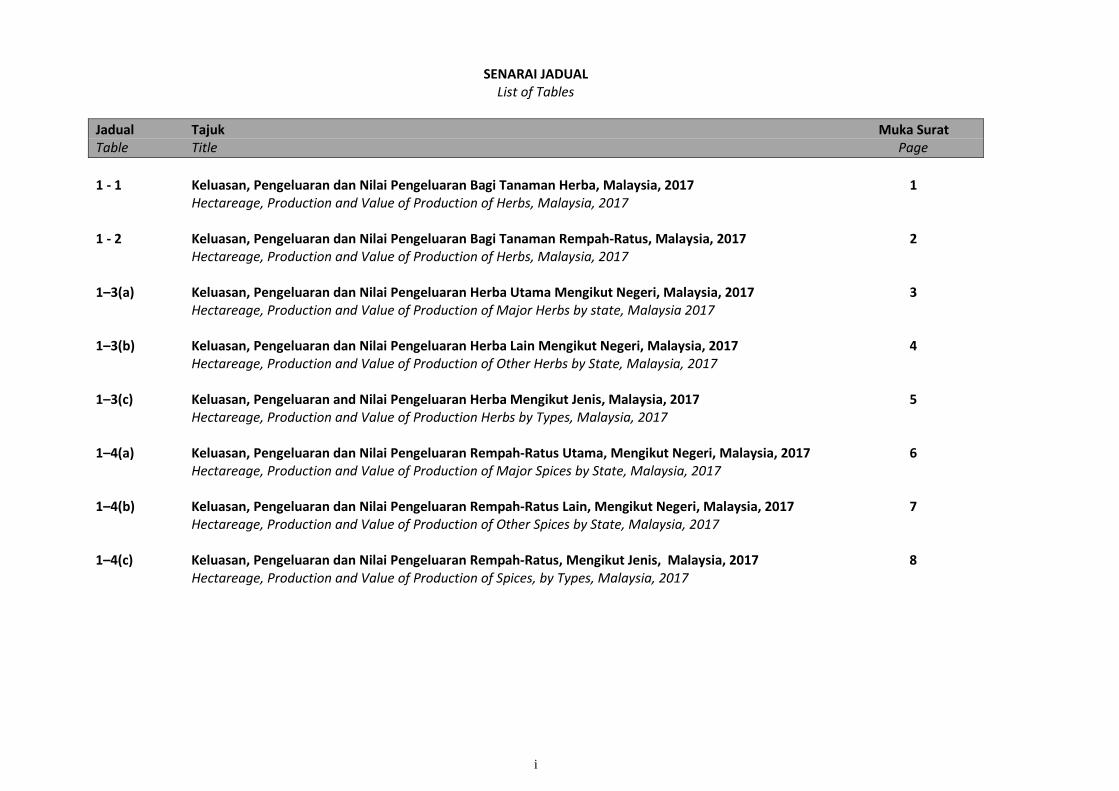
SENARAI JADUAL
List of Tables Jadual Tajuk Muka Surat Table Title Page 1 - 1 Keluasan, Pengeluaran dan Nilai Pengeluaran Bagi Tanaman Herba, Malaysia, 2017 1 Hectareage, Production and Value of Production of Herbs, Malaysia, 2017 1 - 2 Keluasan, Pengeluaran dan Nilai Pengeluaran Bagi Tanaman Rempah-Ratus, Malaysia, 2017 2 Hectareage, Production and Value of Production of Herbs, Malaysia, 2017 1–3(a) Keluasan, Pengeluaran dan Nilai Pengeluaran Herba Utama Mengikut Negeri, Malaysia, 2017 3 Hectareage, Production and Value of Production of Major Herbs by state, Malaysia 2017 1–3(b) Keluasan, Pengeluaran dan Nilai Pengeluaran Herba Lain Mengikut Negeri, Malaysia, 2017 4 Hectareage, Production and Value of Production of Other Herbs by State, Malaysia, 2017 1–3(c) Keluasan, Pengeluaran and Nilai Pengeluaran Herba Mengikut Jenis, Malaysia, 2017 5 Hectareage, Production and Value of Production Herbs by Types, Malaysia, 2017 1–4(a) Keluasan, Pengeluaran dan Nilai Pengeluaran Rempah-Ratus Utama, Mengikut Negeri, Malaysia, 2017 6 Hectareage, Production and Value of Production of Major Spices by State, Malaysia, 2017 1–4(b) Keluasan, Pengeluaran dan Nilai Pengeluaran Rempah-Ratus Lain, Mengikut Negeri, Malaysia, 2017 7 Hectareage, Production and Value of Production of Other Spices by State, Malaysia, 2017 1–4(c) Keluasan, Pengeluaran dan Nilai Pengeluaran Rempah-Ratus, Mengikut Jenis, Malaysia, 2017 8
Hectareage, Production and Value of Production of Spices, by Types, Malaysia, 2017
ii
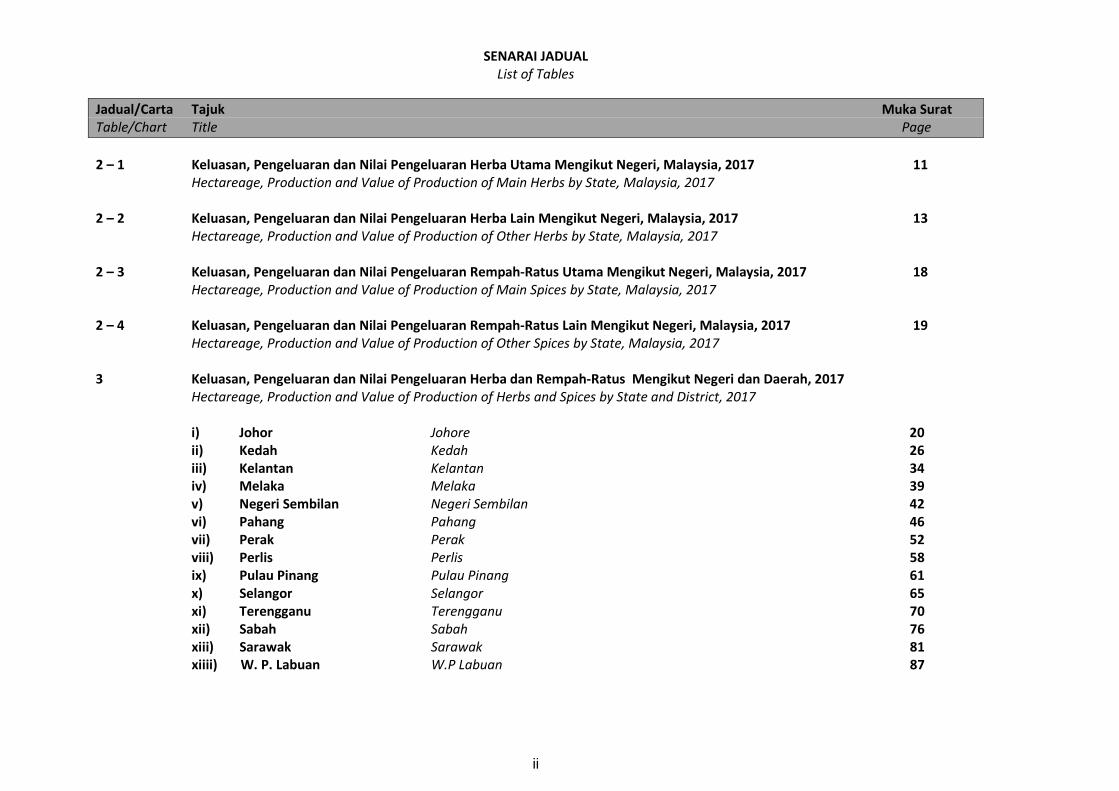
SENARAI JADUAL List of Tables
Jadual/Carta Tajuk Muka Surat Table/Chart Title Page 2 – 1 Keluasan, Pengeluaran dan Nilai Pengeluaran Herba Utama Mengikut Negeri, Malaysia, 2017 11
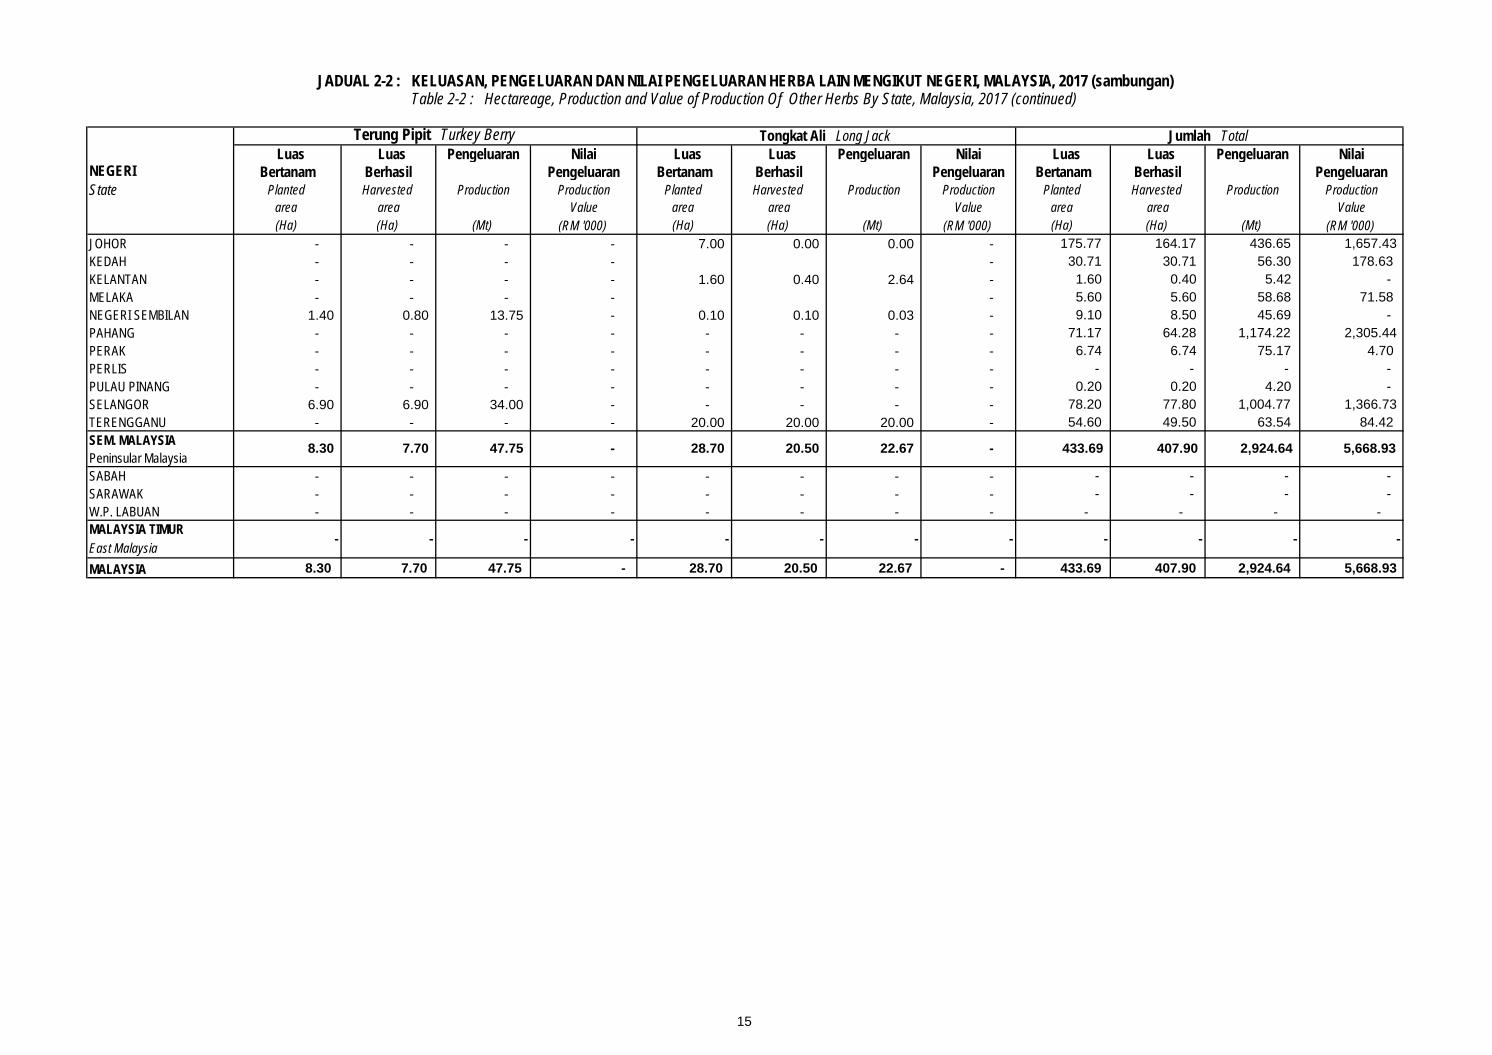
Hectareage, Production and Value of Production of Main Herbs by State, Malaysia, 2017 2 – 2 Keluasan, Pengeluaran dan Nilai Pengeluaran Herba Lain Mengikut Negeri, Malaysia, 2017 13
Hectareage, Production and Value of Production of Other Herbs by State, Malaysia, 2017
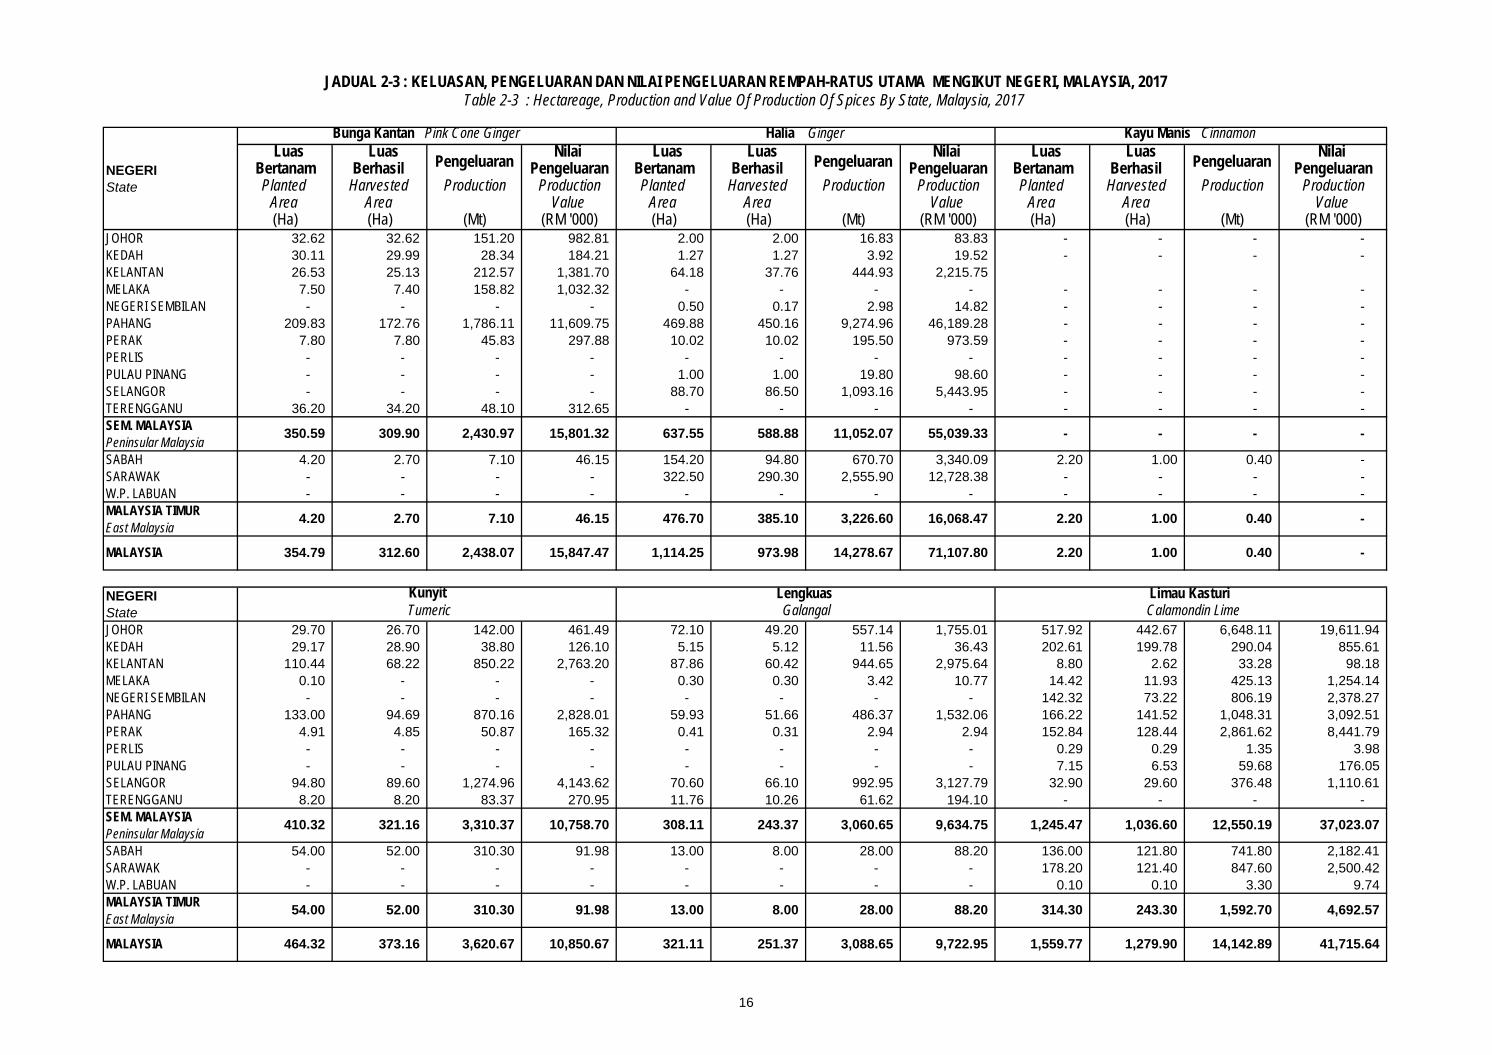
2 – 3 Keluasan, Pengeluaran dan Nilai Pengeluaran Rempah-Ratus Utama Mengikut Negeri, Malaysia, 2017 18 Hectareage, Production and Value of Production of Main Spices by State, Malaysia, 2017
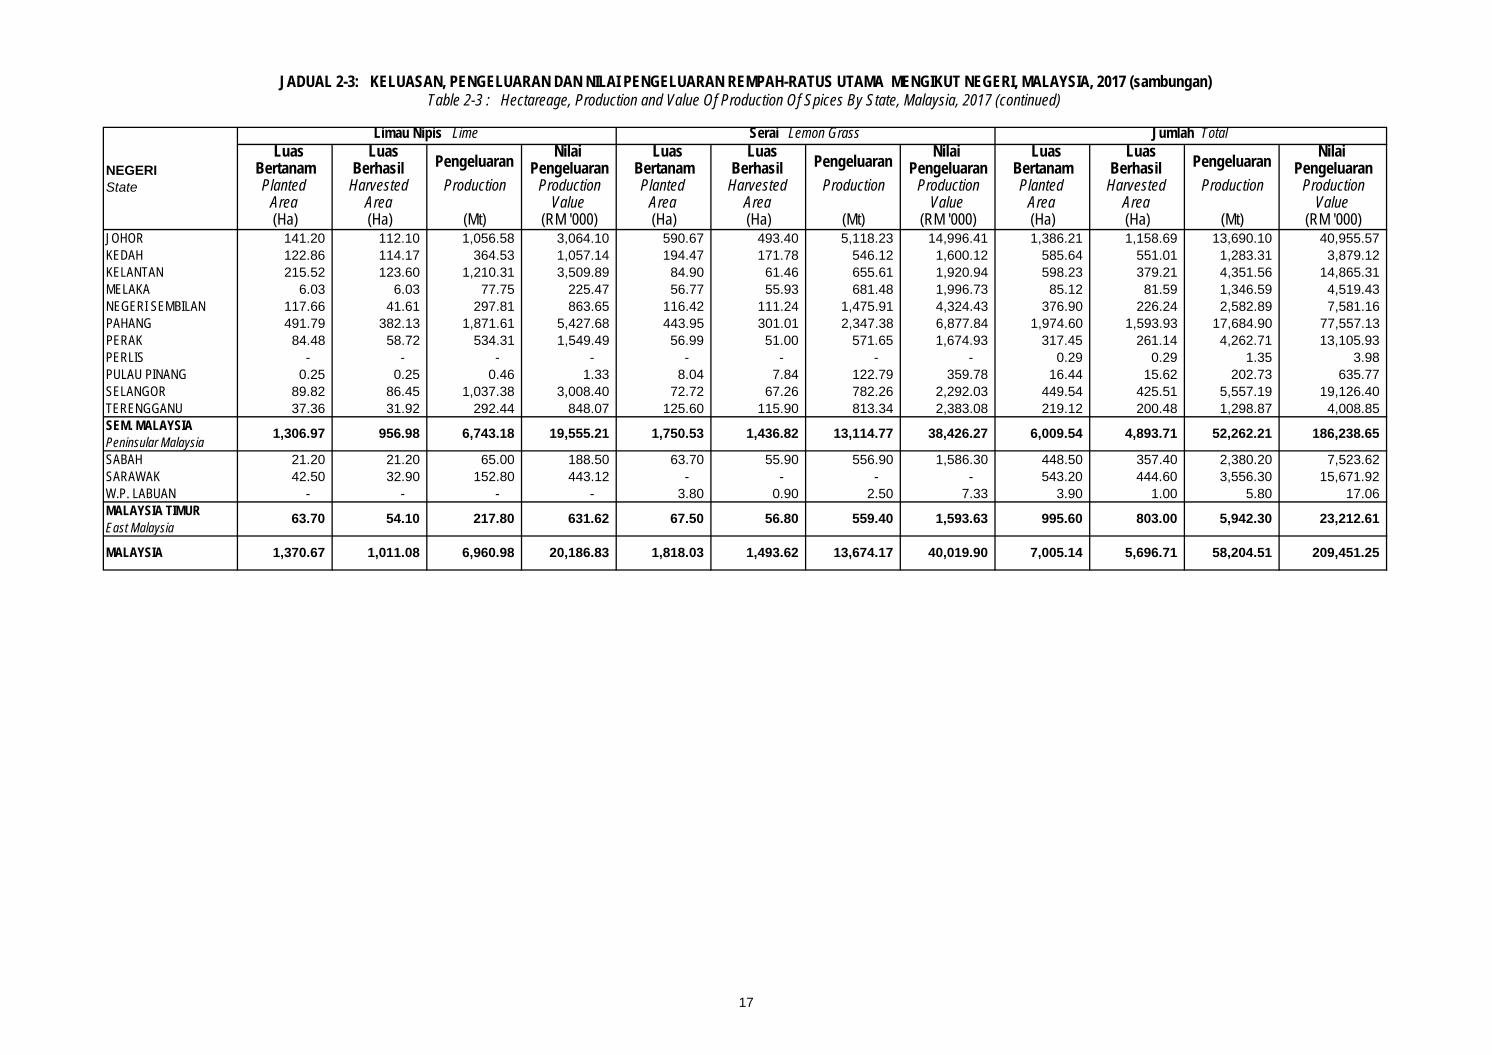
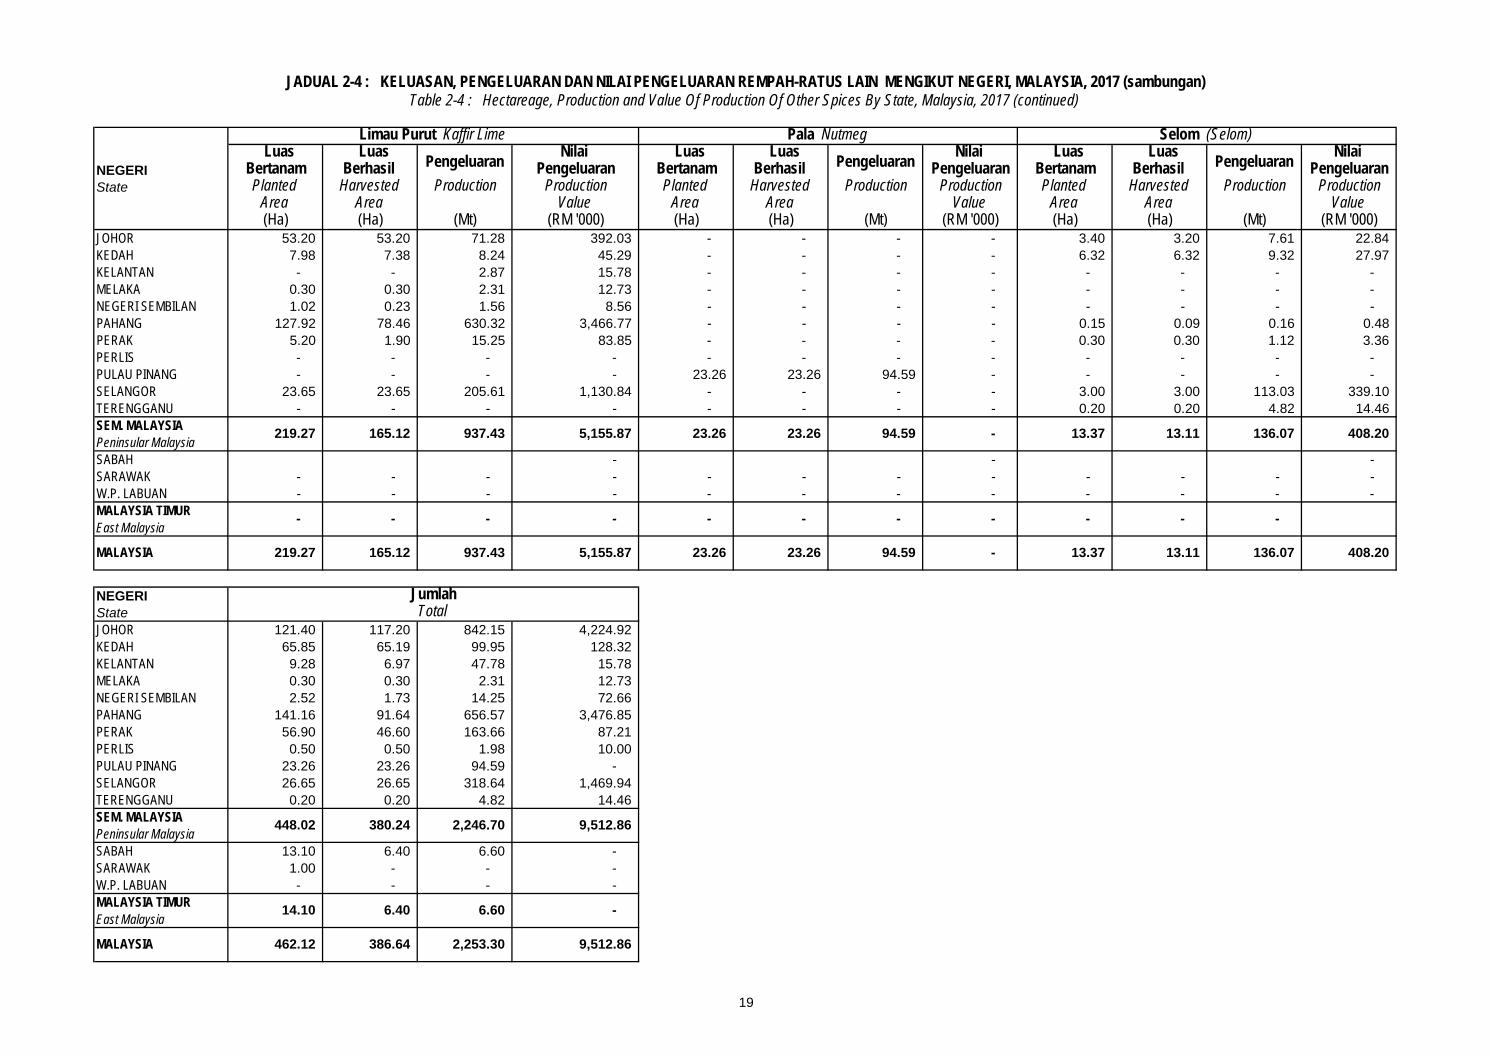
2 – 4 Keluasan, Pengeluaran dan Nilai Pengeluaran Rempah-Ratus Lain Mengikut Negeri, Malaysia, 2017 19 Hectareage, Production and Value of Production of Other Spices by State, Malaysia, 2017
3 Keluasan, Pengeluaran dan Nilai Pengeluaran Herba dan Rempah-Ratus Mengikut Negeri dan Daerah, 2017
Hectareage, Production and Value of Production of Herbs and Spices by State and District, 2017 i) Johor Johore 20 ii) Kedah Kedah 26 iii) Kelantan Kelantan 34 iv) Melaka Melaka 39 v) Negeri Sembilan Negeri Sembilan 42 vi) Pahang Pahang 46 vii) Perak Perak 52 viii) Perlis Perlis 58 ix) Pulau Pinang Pulau Pinang 61 x) Selangor Selangor 65 xi) Terengganu Terengganu 70 xii) Sabah Sabah 76 xiii) Sarawak Sarawak 81 xiiii) W. P. Labuan W.P Labuan 87
iii
SENARAI JADUAL
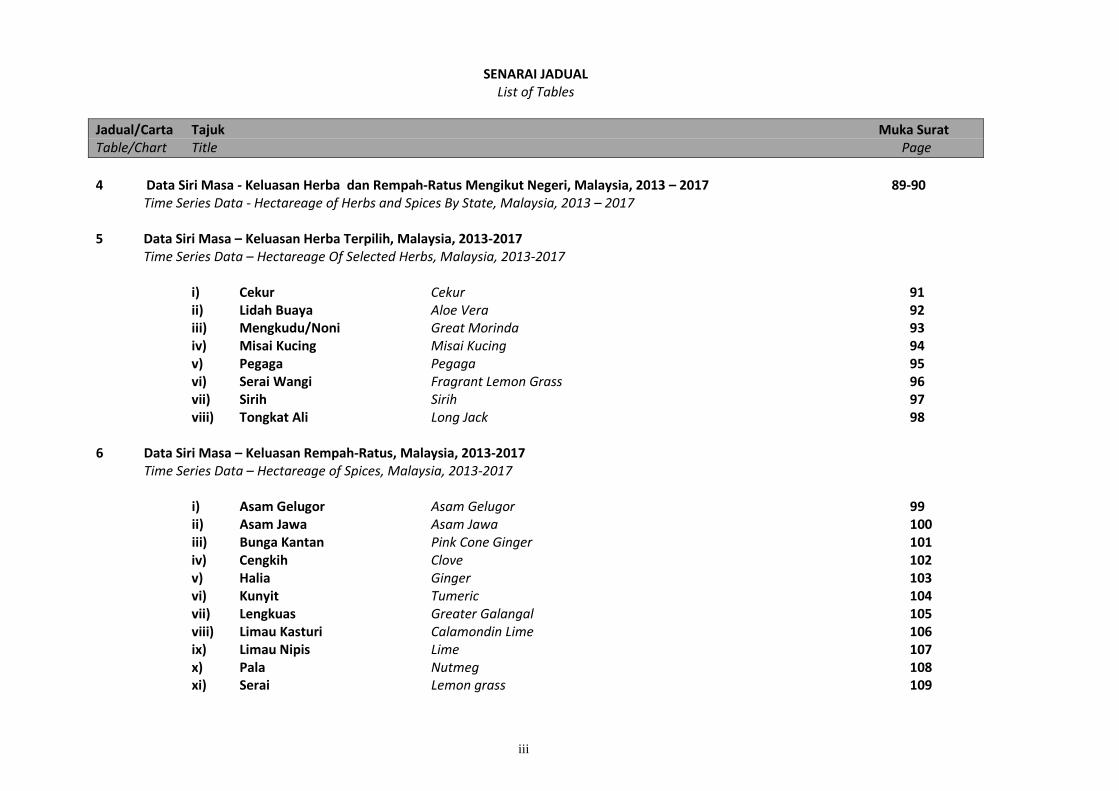
List of Tables Jadual/Carta Tajuk Muka Surat Table/Chart Title Page 4 Data Siri Masa - Keluasan Herba dan Rempah-Ratus Mengikut Negeri, Malaysia, 2013 – 2017 89-90
Time Series Data - Hectareage of Herbs and Spices By State, Malaysia, 2013 – 2017 5 Data Siri Masa – Keluasan Herba Terpilih, Malaysia, 2013-2017 Time Series Data – Hectareage Of Selected Herbs, Malaysia, 2013-2017
i) Cekur Cekur 91 ii) Lidah Buaya Aloe Vera 92 iii) Mengkudu/Noni Great Morinda 93 iv) Misai Kucing Misai Kucing 94 v) Pegaga Pegaga 95 vi) Serai Wangi Fragrant Lemon Grass 96 vii) Sirih Sirih 97 viii) Tongkat Ali Long Jack 98
6 Data Siri Masa – Keluasan Rempah-Ratus, Malaysia, 2013-2017 Time Series Data – Hectareage of Spices, Malaysia, 2013-2017
i) Asam Gelugor Asam Gelugor 99 ii) Asam Jawa Asam Jawa 100 iii) Bunga Kantan Pink Cone Ginger 101 iv) Cengkih Clove 102 v) Halia Ginger 103 vi) Kunyit Tumeric 104 vii) Lengkuas Greater Galangal 105 viii) Limau Kasturi Calamondin Lime 106 ix) Limau Nipis Lime 107 x) Pala Nutmeg 108 xi) Serai Lemon grass 109
iv
SENARAI JADUAL List of Tables
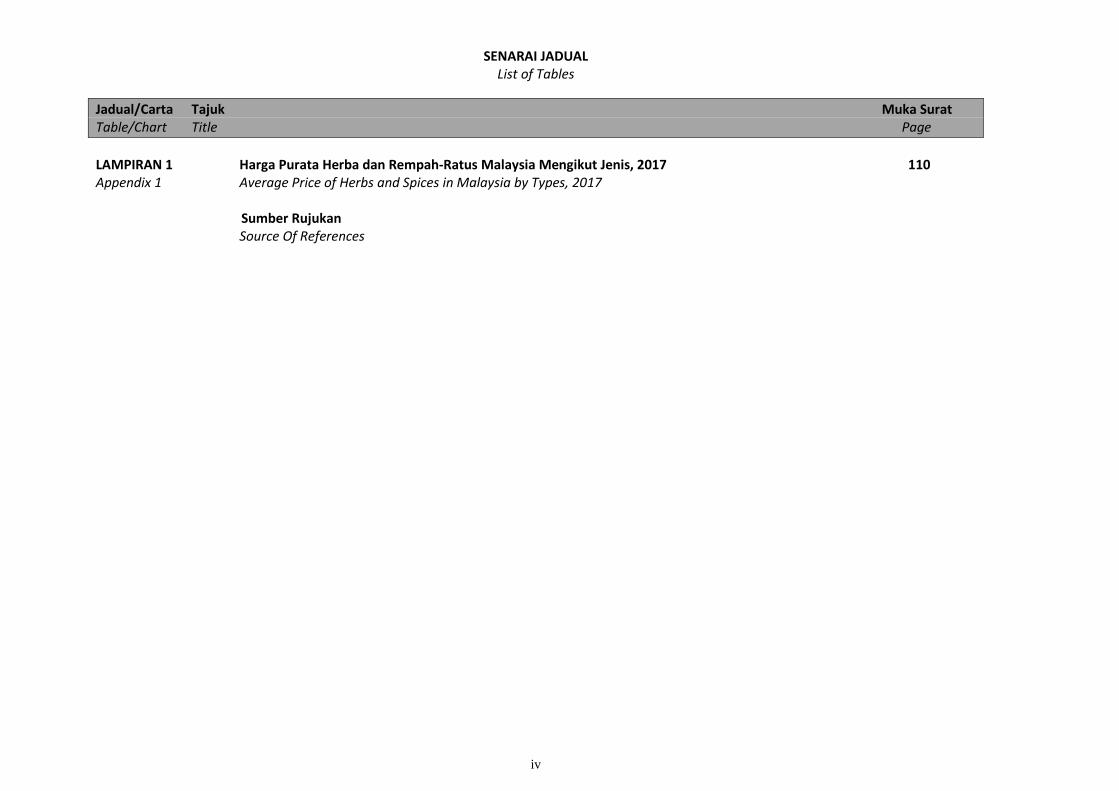
Jadual/Carta Tajuk Muka Surat Table/Chart Title Page LAMPIRAN 1 Harga Purata Herba dan Rempah-Ratus Malaysia Mengikut Jenis, 2017 110 Appendix 1 Average Price of Herbs and Spices in Malaysia by Types, 2017
Sumber Rujukan
Source Of References
v
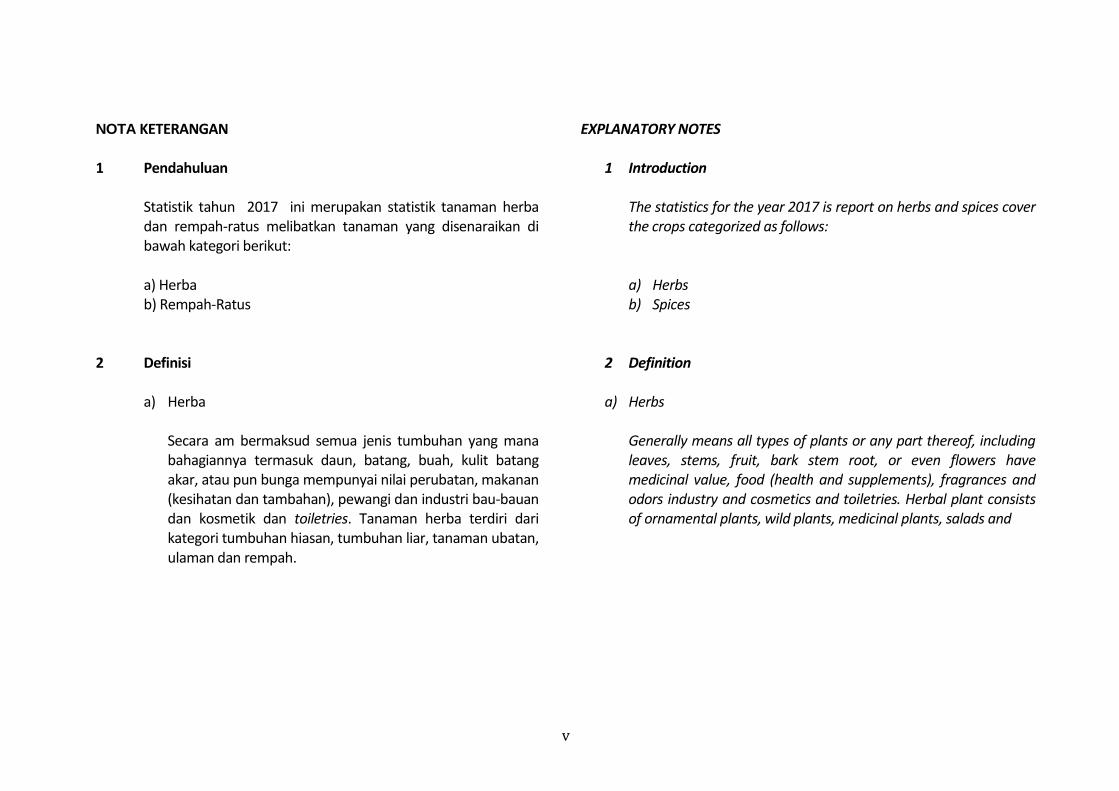
NOTA KETERANGAN
1 Pendahuluan
Statistik tahun 2017 ini merupakan statistik tanaman herba dan rempah-ratus melibatkan tanaman yang disenaraikan di bawah kategori berikut:
a) Herba b) Rempah-Ratus
2 Definisi
a) Herba Secara am bermaksud semua jenis tumbuhan yang mana bahagiannya termasuk daun, batang, buah, kulit batang akar, atau pun bunga mempunyai nilai perubatan, makanan (kesihatan dan tambahan), pewangi dan industri bau-bauan dan kosmetik dan toiletries. Tanaman herba terdiri dari kategori tumbuhan hiasan, tumbuhan liar, tanaman ubatan, ulaman dan rempah.
EXPLANATORY NOTES
1 Introduction
The statistics for the year 2017 is report on herbs and spices cover the crops categorized as follows:
a) Herbs b) Spices
2 Definition a) Herbs
Generally means all types of plants or any part thereof, including leaves, stems, fruit, bark stem root, or even flowers have medicinal value, food (health and supplements), fragrances and odors industry and cosmetics and toiletries. Herbal plant consists of ornamental plants, wild plants, medicinal plants, salads and
vi
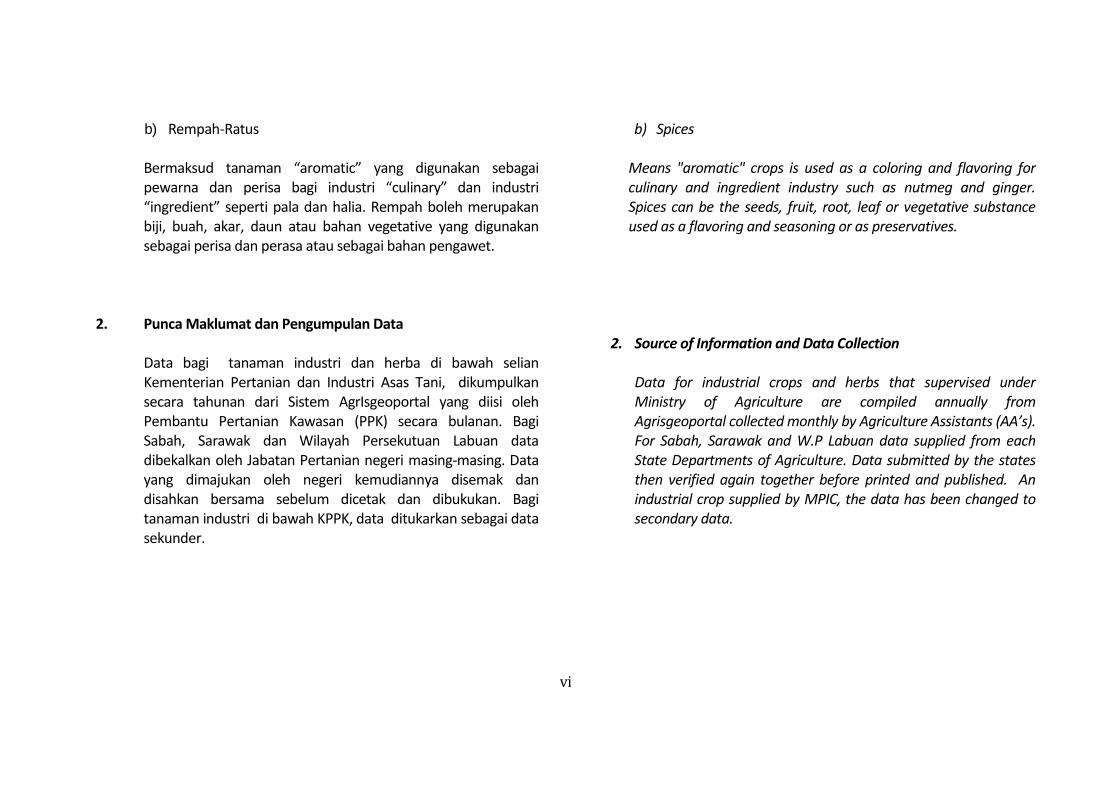
b) Rempah-Ratus
Bermaksud tanaman “aromatic” yang digunakan sebagai pewarna dan perisa bagi industri “culinary” dan industri “ingredient” seperti pala dan halia. Rempah boleh merupakan biji, buah, akar, daun atau bahan vegetative yang digunakan sebagai perisa dan perasa atau sebagai bahan pengawet.
2. Punca Maklumat dan Pengumpulan Data
Data bagi tanaman industri dan herba di bawah selian
Kementerian Pertanian dan Industri Asas Tani, dikumpulkan secara tahunan dari Sistem AgrIsgeoportal yang diisi oleh Pembantu Pertanian Kawasan (PPK) secara bulanan. Bagi Sabah, Sarawak dan Wilayah Persekutuan Labuan data dibekalkan oleh Jabatan Pertanian negeri masing-masing. Data yang dimajukan oleh negeri kemudiannya disemak dan disahkan bersama sebelum dicetak dan dibukukan. Bagi tanaman industri di bawah KPPK, data ditukarkan sebagai data sekunder.
b) Spices
Means "aromatic" crops is used as a coloring and flavoring for culinary and ingredient industry such as nutmeg and ginger. Spices can be the seeds, fruit, root, leaf or vegetative substance used as a flavoring and seasoning or as preservatives.
2. Source of Information and Data Collection
Data for industrial crops and herbs that supervised under Ministry of Agriculture are compiled annually from Agrisgeoportal collected monthly by Agriculture Assistants (AA’s). For Sabah, Sarawak and W.P Labuan data supplied from each State Departments of Agriculture. Data submitted by the states then verified again together before printed and published. An industrial crop supplied by MPIC, the data has been changed to secondary data.
vii
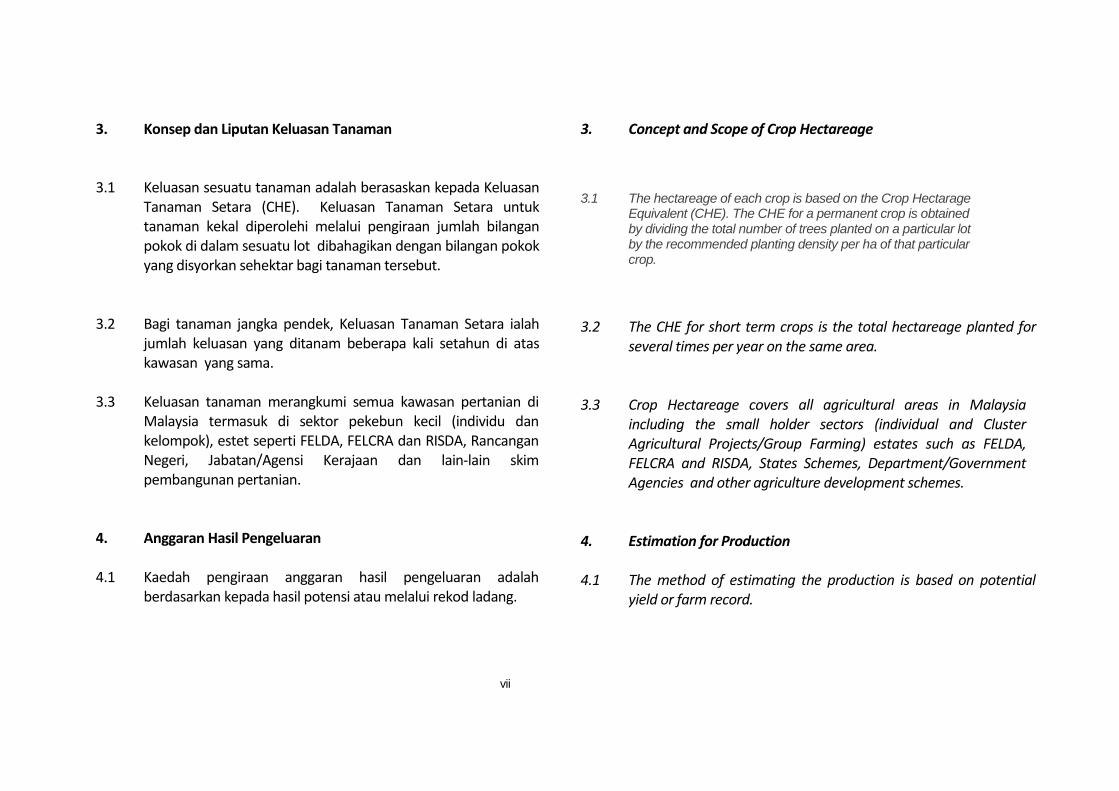
3. Konsep dan Liputan Keluasan Tanaman 3.1 Keluasan sesuatu tanaman adalah berasaskan kepada Keluasan
Tanaman Setara (CHE). Keluasan Tanaman Setara untuk tanaman kekal diperolehi melalui pengiraan jumlah bilangan pokok di dalam sesuatu lot dibahagikan dengan bilangan pokok yang disyorkan sehektar bagi tanaman tersebut.
3.2 Bagi tanaman jangka pendek, Keluasan Tanaman Setara ialah
jumlah keluasan yang ditanam beberapa kali setahun di atas kawasan yang sama.
3.3 Keluasan tanaman merangkumi semua kawasan pertanian di
Malaysia termasuk di sektor pekebun kecil (individu dan kelompok), estet seperti FELDA, FELCRA dan RISDA, Rancangan Negeri, Jabatan/Agensi Kerajaan dan lain-lain skim pembangunan pertanian.
4. Anggaran Hasil Pengeluaran
4.1 Kaedah pengiraan anggaran hasil pengeluaran adalah berdasarkan kepada hasil potensi atau melalui rekod ladang.
3. Concept and Scope of Crop Hectareage
3.1 The hectareage of each crop is based on the Crop Hectarage Equivalent (CHE). The CHE for a permanent crop is obtained by dividing the total number of trees planted on a particular lot by the recommended planting density per ha of that particular crop.
3.2 The CHE for short term crops is the total hectareage planted for
several times per year on the same area.
3.3 Crop Hectareage covers all agricultural areas in Malaysia including the small holder sectors (individual and Cluster Agricultural Projects/Group Farming) estates such as FELDA, FELCRA and RISDA, States Schemes, Department/Government Agencies and other agriculture development schemes.
4. Estimation for Production 4.1 The method of estimating the production is based on potential
yield or farm record.
ix
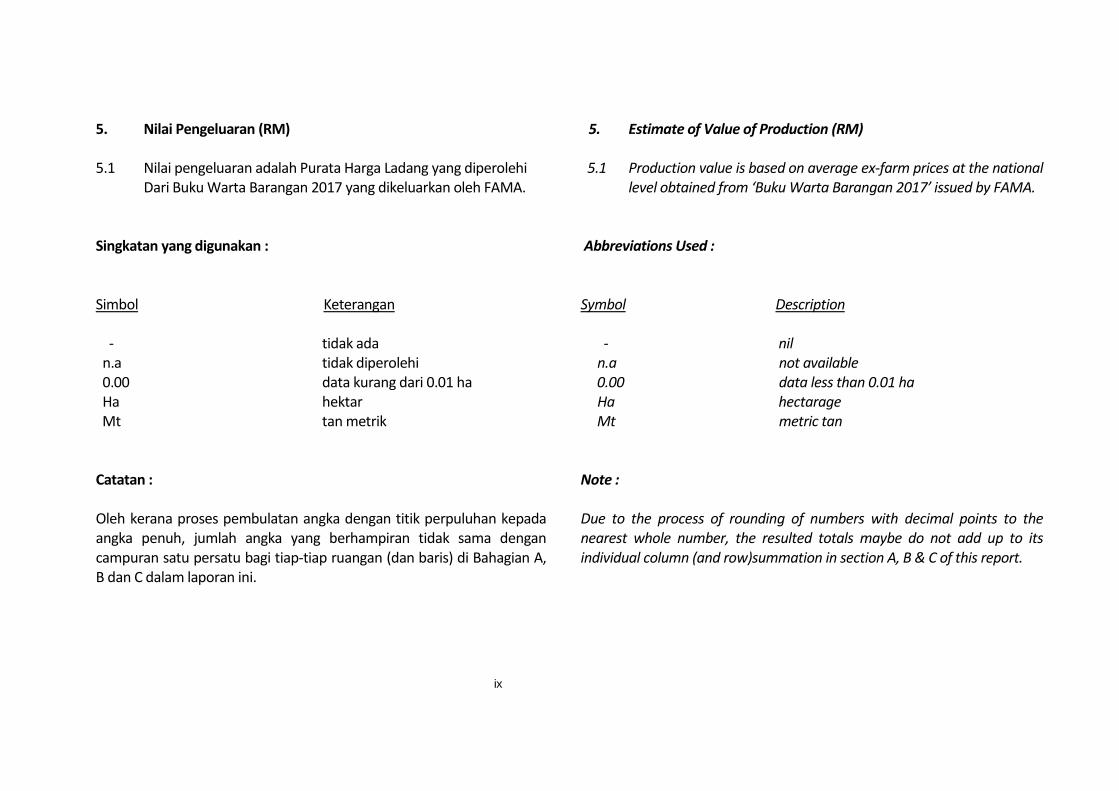
5. Nilai Pengeluaran (RM) 5.1 Nilai pengeluaran adalah Purata Harga Ladang yang diperolehi
Dari Buku Warta Barangan 2017 yang dikeluarkan oleh FAMA.
Singkatan yang digunakan : Simbol Keterangan - tidak ada n.a tidak diperolehi 0.00 data kurang dari 0.01 ha Ha hektar Mt tan metrik
Catatan : Oleh kerana proses pembulatan angka dengan titik perpuluhan kepada angka penuh, jumlah angka yang berhampiran tidak sama dengan campuran satu persatu bagi tiap-tiap ruangan (dan baris) di Bahagian A, B dan C dalam laporan ini.
5. Estimate of Value of Production (RM) 5.1 Production value is based on average ex-farm prices at the national
level obtained from ‘Buku Warta Barangan 2017’ issued by FAMA.
Abbreviations Used : Symbol Description - nil n.a not available 0.00 data less than 0.01 ha Ha hectarage Mt metric tan Note : Due to the process of rounding of numbers with decimal points to the nearest whole number, the resulted totals maybe do not add up to its individual column (and row)summation in section A, B & C of this report.
x
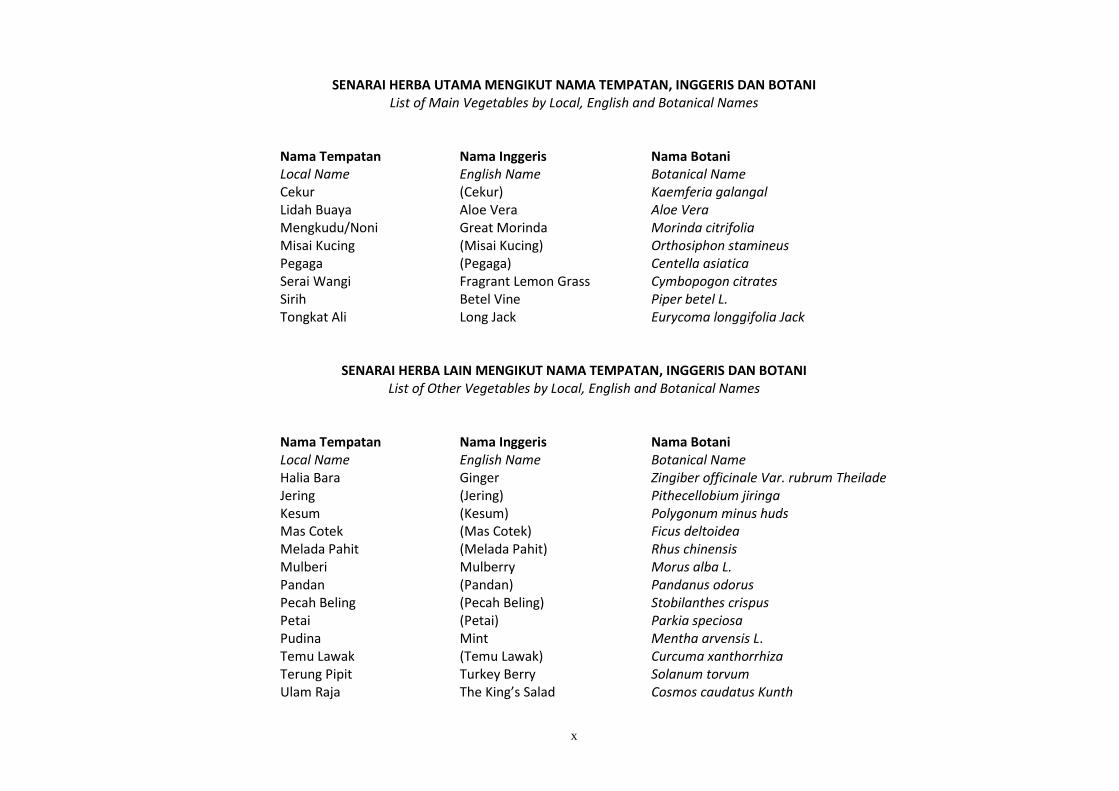
SENARAI HERBA UTAMA MENGIKUT NAMA TEMPATAN, INGGERIS DAN BOTANI List of Main Vegetables by Local, English and Botanical Names
Nama Tempatan Nama Inggeris Nama Botani Local Name English Name Botanical Name Cekur (Cekur) Kaemferia galangal Lidah Buaya Aloe Vera Aloe Vera Mengkudu/Noni Great Morinda Morinda citrifolia Misai Kucing (Misai Kucing) Orthosiphon stamineus Pegaga (Pegaga) Centella asiatica Serai Wangi Fragrant Lemon Grass Cymbopogon citrates Sirih Betel Vine Piper betel L. Tongkat Ali Long Jack Eurycoma longgifolia Jack
SENARAI HERBA LAIN MENGIKUT NAMA TEMPATAN, INGGERIS DAN BOTANI List of Other Vegetables by Local, English and Botanical Names
Nama Tempatan Nama Inggeris Nama Botani Local Name English Name Botanical Name Halia Bara Ginger Zingiber officinale Var. rubrum Theilade Jering (Jering) Pithecellobium jiringa Kesum (Kesum) Polygonum minus huds Mas Cotek (Mas Cotek) Ficus deltoidea Melada Pahit (Melada Pahit) Rhus chinensis Mulberi Mulberry Morus alba L. Pandan (Pandan) Pandanus odorus Pecah Beling (Pecah Beling) Stobilanthes crispus Petai (Petai) Parkia speciosa Pudina Mint Mentha arvensis L.
Temu Lawak (Temu Lawak) Curcuma xanthorrhiza Terung Pipit Turkey Berry Solanum torvum Ulam Raja The King’s Salad Cosmos caudatus Kunth
xi
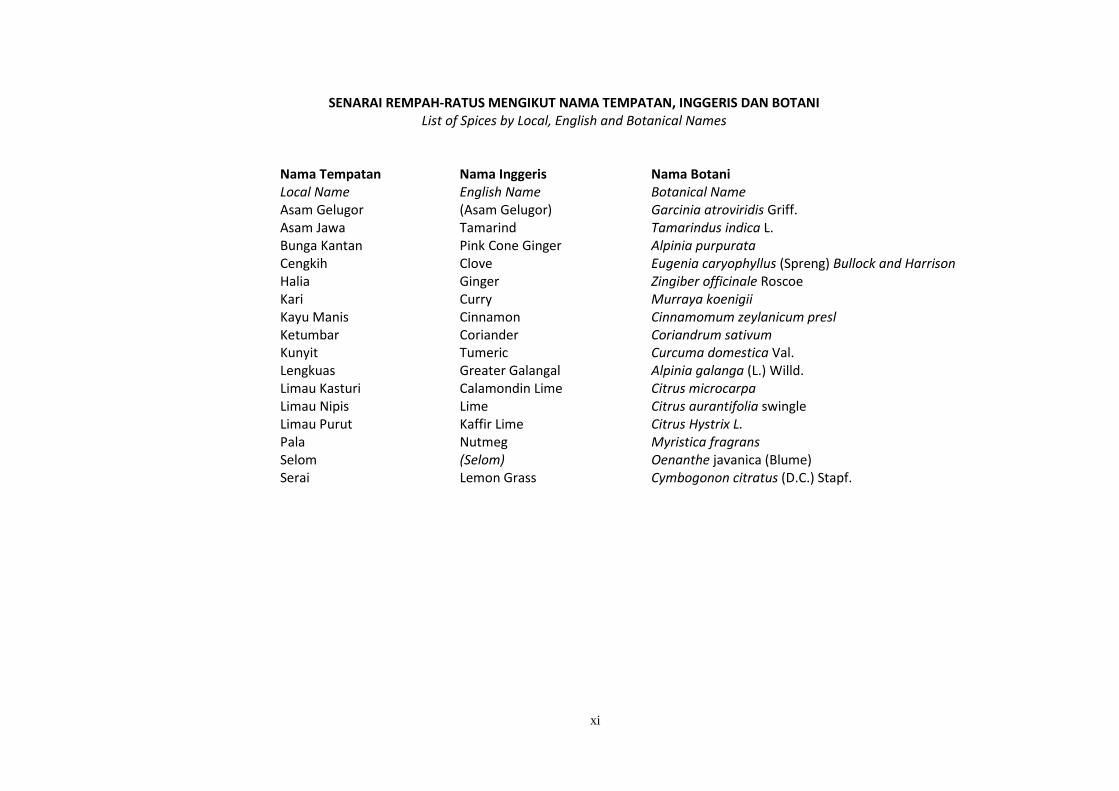
SENARAI REMPAH-RATUS MENGIKUT NAMA TEMPATAN, INGGERIS DAN BOTANI
List of Spices by Local, English and Botanical Names
Nama Tempatan Nama Inggeris Nama Botani Local Name English Name Botanical Name Asam Gelugor (Asam Gelugor) Garcinia atroviridis Griff. Asam Jawa Tamarind Tamarindus indica L. Bunga Kantan Pink Cone Ginger Alpinia purpurata Cengkih Clove Eugenia caryophyllus (Spreng) Bullock and Harrison Halia Ginger Zingiber officinale Roscoe Kari Curry Murraya koenigii Kayu Manis Cinnamon Cinnamomum zeylanicum presl Ketumbar Coriander Coriandrum sativum Kunyit Tumeric Curcuma domestica Val. Lengkuas Greater Galangal Alpinia galanga (L.) Willd. Limau Kasturi Calamondin Lime Citrus microcarpa Limau Nipis Lime Citrus aurantifolia swingle Limau Purut Kaffir Lime Citrus Hystrix L. Pala Nutmeg Myristica fragrans Selom (Selom) Oenanthe javanica (Blume) Serai Lemon Grass Cymbogonon citratus (D.C.) Stapf.
BAHAGIAN 1
Section 1
DATA PENTING – HERBA DAN REMPAH-RATUS, MALAYSIA, 2017
Key Data – Herbs and Spices, Malaysia, 2017
1
Luas Bertanam Luas Berhasil Pengeluaran Nilai PengeluaranPlanted Area Harvested Area Production Value of Production
(Ha) (Ha) (Mt) (RM'000)UtamaMajor
Semenanjung Malaysia Lain-LainPeninsular Malaysia Others
JumlahTotalUtamaMajor
Malaysia Timur Lain-LainEast Malaysia Others
JumlahTotalUtamaMajorLain-LainOthersJumlahTotal
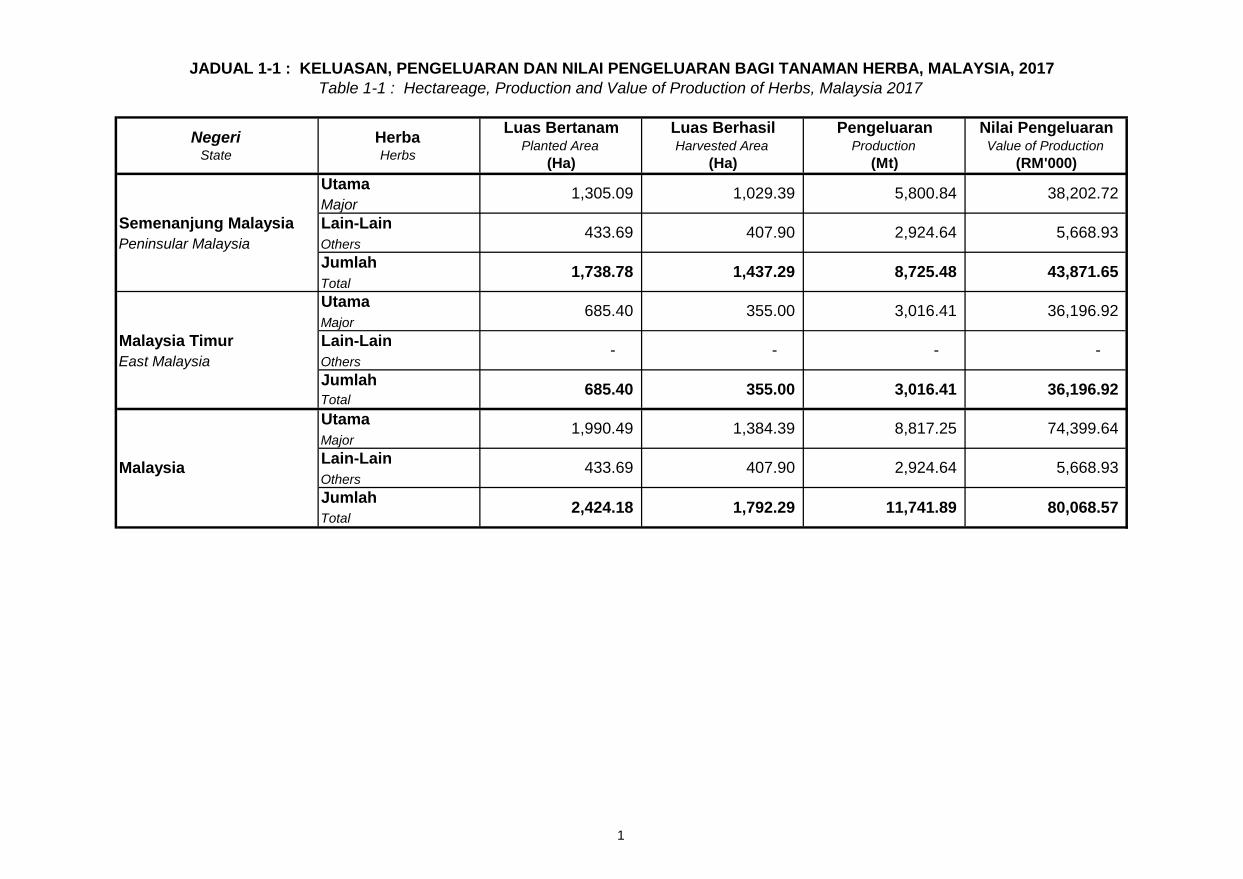
Malaysia 433.69 407.90 2,924.64 5,668.93
2,424.18 1,792.29 11,741.89 80,068.57
685.40 355.00 3,016.41 36,196.92
1,990.49 1,384.39 8,817.25 74,399.64
685.40 355.00 3,016.41 36,196.92
- - - -
433.69 407.90 2,924.64 5,668.93
1,738.78 1,437.29 8,725.48 43,871.65
JADUAL 1-1 : KELUASAN, PENGELUARAN DAN NILAI PENGELUARAN BAGI TANAMAN HERBA, MALAYSIA, 2017Table 1-1 : Hectareage, Production and Value of Production of Herbs, Malaysia 2017
Negeri State
Herba Herbs
1,305.09 1,029.39 5,800.84 38,202.72
2
Negeri Rempah-Ratus Luas Bertanam Luas Berhasil Pengeluaran Nilai PengeluaranState Spices Planted Area Harvested Area Production Value of Production
(Ha) (Ha) (Mt) (RM'000)UtamaMajor
Semenanjung Malaysia Lain-LainPeninsular Malaysia Others
JumlahTotalUtamaMajor
Malaysia Timur Lain-LainEast Malaysia Others
JumlahTotalUtamaMajorLain-LainOthersJumlahTotal
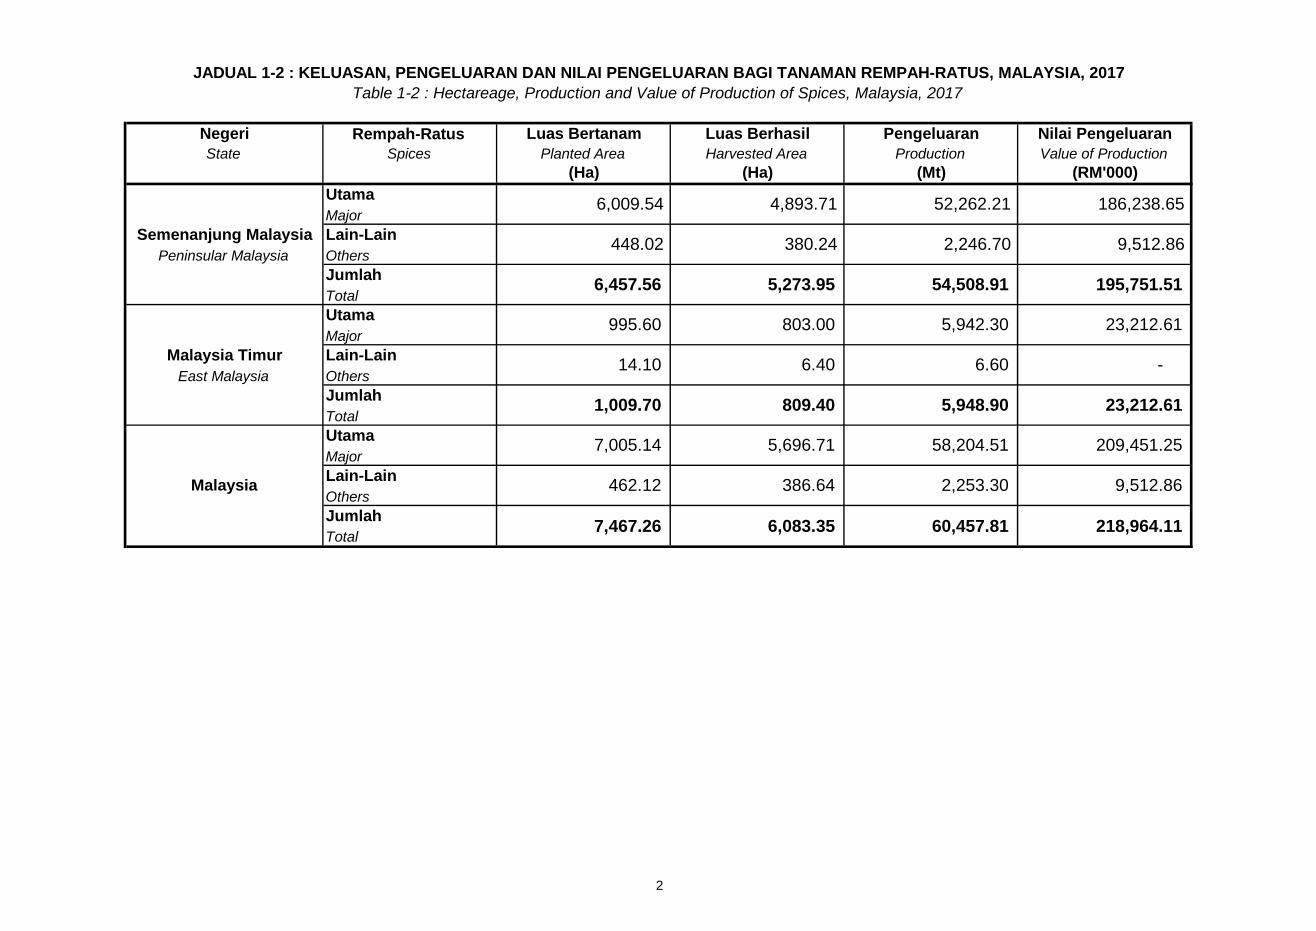
JADUAL 1-2 : KELUASAN, PENGELUARAN DAN NILAI PENGELUARAN BAGI TANAMAN REMPAH-RATUS, MALAYSIA, 2017Table 1-2 : Hectareage, Production and Value of Production of Spices, Malaysia, 2017
6,009.54 4,893.71 52,262.21 186,238.65
448.02 380.24 2,246.70 9,512.86
6,457.56 5,273.95 54,508.91 195,751.51
995.60 803.00 5,942.30 23,212.61
14.10 6.40 6.60 -
7,467.26 6,083.35 60,457.81 218,964.11
1,009.70 809.40 5,948.90 23,212.61
7,005.14 5,696.71 58,204.51 209,451.25
Malaysia 462.12 386.64 2,253.30 9,512.86
3
Luas Bertanam Luas Berhasil Pengeluaran Nilai PengeluaranPlanted area Harvested area Production Value of Production
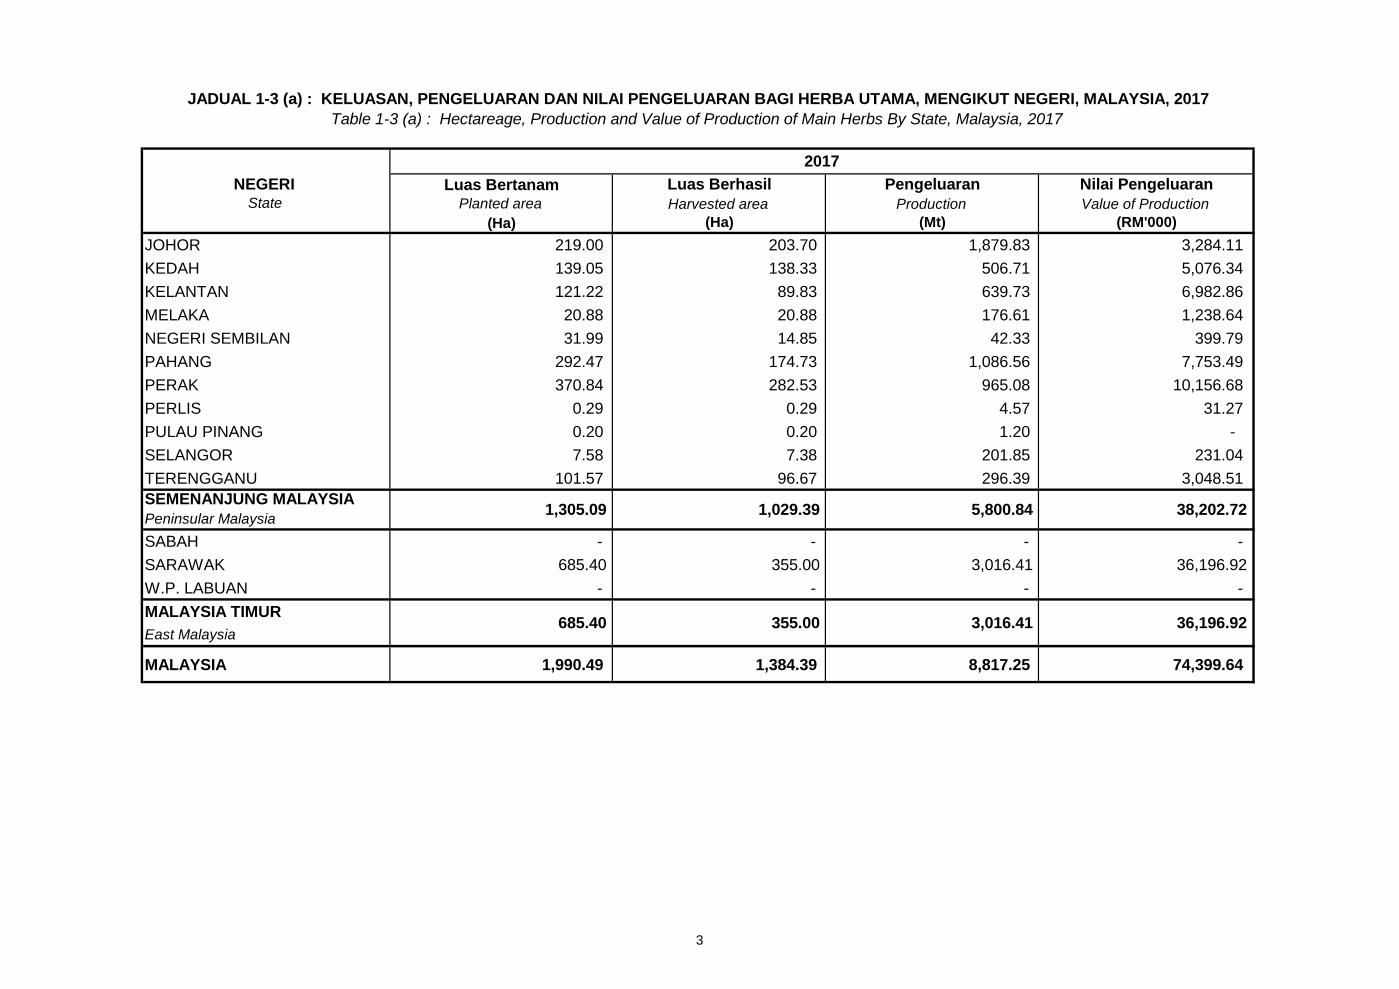
(Ha) (Ha) (Mt) (RM'000)JOHOR 219.00 203.70 1,879.83 3,284.11 KEDAH 139.05 138.33 506.71 5,076.34 KELANTAN 121.22 89.83 639.73 6,982.86 MELAKA 20.88 20.88 176.61 1,238.64 NEGERI SEMBILAN 31.99 14.85 42.33 399.79 PAHANG 292.47 174.73 1,086.56 7,753.49 PERAK 370.84 282.53 965.08 10,156.68 PERLIS 0.29 0.29 4.57 31.27 PULAU PINANG 0.20 0.20 1.20 - SELANGOR 7.58 7.38 201.85 231.04 TERENGGANU 101.57 96.67 296.39 3,048.51
Peninsular MalaysiaSABAH - - - - SARAWAK 685.40 355.00 3,016.41 36,196.92 W.P. LABUAN - - - - MALAYSIA TIMUREast Malaysia
MALAYSIA 1,990.49 1,384.39 8,817.25 74,399.64
685.40 355.00 3,016.41 36,196.92
SEMENANJUNG MALAYSIA 1,305.09 1,029.39 5,800.84 38,202.72
State
JADUAL 1-3 (a) : KELUASAN, PENGELUARAN DAN NILAI PENGELUARAN BAGI HERBA UTAMA, MENGIKUT NEGERI, MALAYSIA, 2017Table 1-3 (a) : Hectareage, Production and Value of Production of Main Herbs By State, Malaysia, 2017
2017NEGERI
4
4
Luas Bertanam Luas Berhasil Pengeluaran Nilai PengeluaranPlanted area Harvested area Production Value of Production
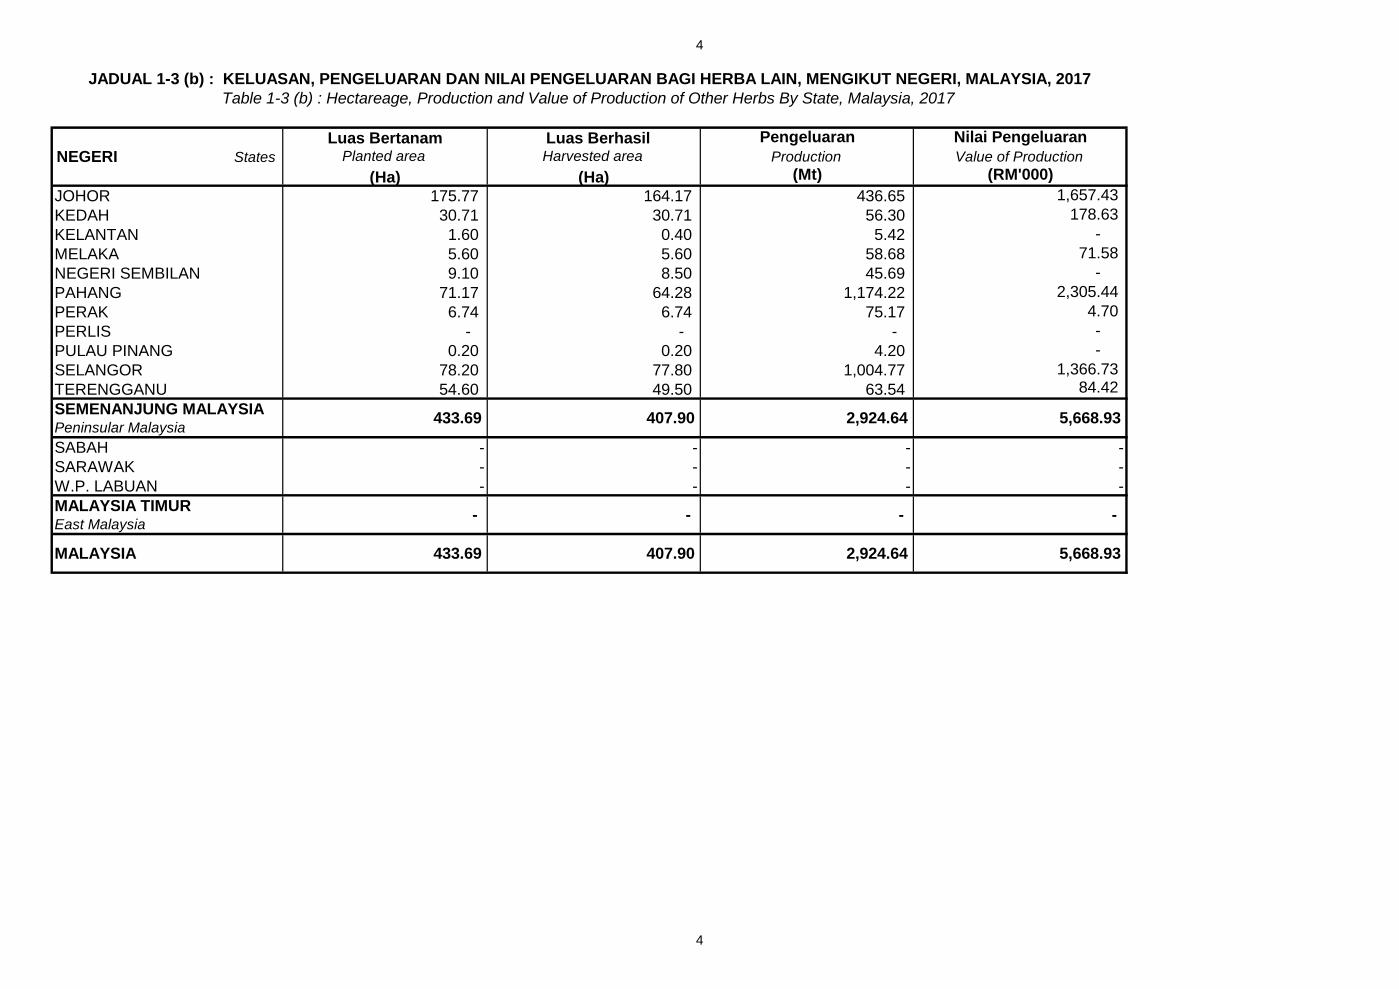
(Ha) (Ha) (Mt) (RM'000)JOHOR 175.77 164.17 436.65 1,657.43 KEDAH 30.71 30.71 56.30 178.63 KELANTAN 1.60 0.40 5.42 - MELAKA 5.60 5.60 58.68 71.58 NEGERI SEMBILAN 9.10 8.50 45.69 - PAHANG 71.17 64.28 1,174.22 2,305.44 PERAK 6.74 6.74 75.17 4.70 PERLIS - - - - PULAU PINANG 0.20 0.20 4.20 - SELANGOR 78.20 77.80 1,004.77 1,366.73 TERENGGANU 54.60 49.50 63.54 84.42 SEMENANJUNG MALAYSIAPeninsular MalaysiaSABAH - - - - SARAWAK - - - - W.P. LABUAN - - - - MALAYSIA TIMUREast Malaysia - - - -
MALAYSIA 433.69 407.90 2,924.64 5,668.93
JADUAL 1-3 (b) : KELUASAN, PENGELUARAN DAN NILAI PENGELUARAN BAGI HERBA LAIN, MENGIKUT NEGERI, MALAYSIA, 2017Table 1-3 (b) : Hectareage, Production and Value of Production of Other Herbs By State, Malaysia, 2017
NEGERI States
433.69 407.90 2,924.64 5,668.93
5
Luas Bertanam Luas Berhasil Pengeluaran Nilai Pengeluaran Purata HasilPlanted area Harvested area Production Value of Production Average Yield
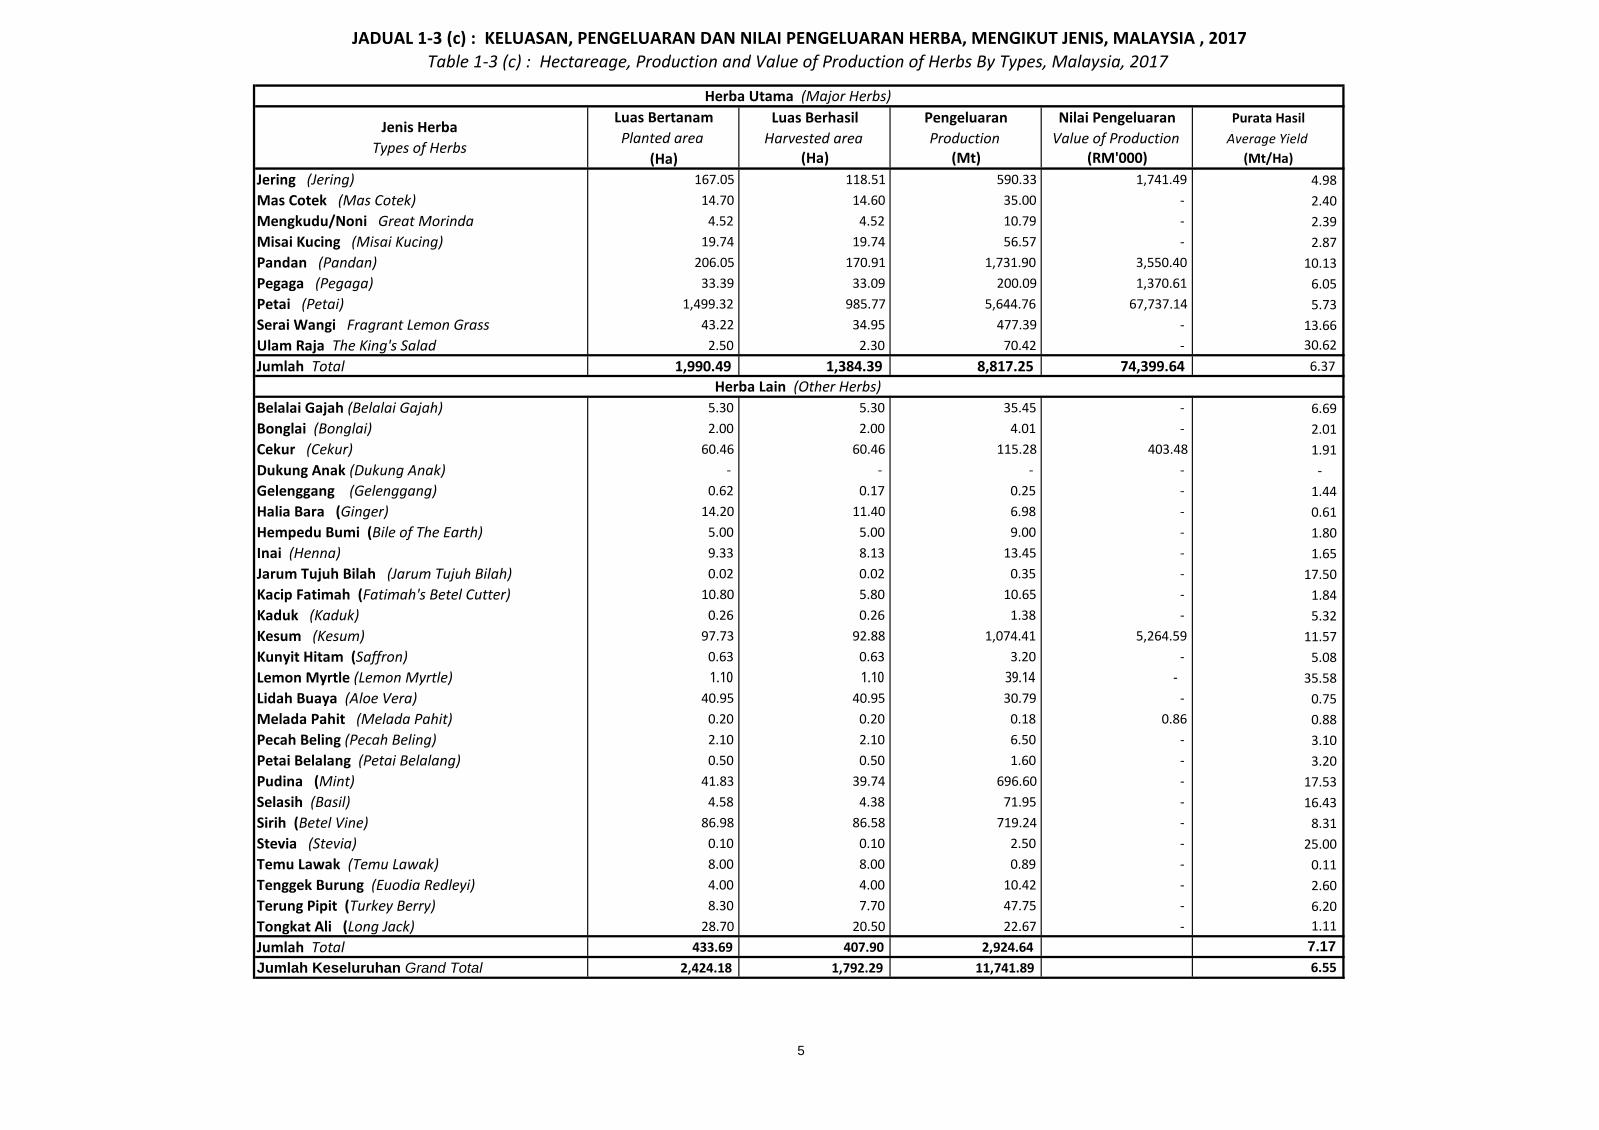
(Ha) (Ha) (Mt) (RM'000) (Mt/Ha)Jering (Jering) 167.05 118.51 590.33 1,741.49 4.98 Mas Cotek (Mas Cotek) 14.70 14.60 35.00 - 2.40 Mengkudu/Noni Great Morinda 4.52 4.52 10.79 - 2.39 Misai Kucing (Misai Kucing) 19.74 19.74 56.57 - 2.87 Pandan (Pandan) 206.05 170.91 1,731.90 3,550.40 10.13 Pegaga (Pegaga) 33.39 33.09 200.09 1,370.61 6.05 Petai (Petai) 1,499.32 985.77 5,644.76 67,737.14 5.73 Serai Wangi Fragrant Lemon Grass 43.22 34.95 477.39 - 13.66 Ulam Raja The King's Salad 2.50 2.30 70.42 - 30.62 Jumlah Total 1,990.49 1,384.39 8,817.25 74,399.64 6.37
Belalai Gajah (Belalai Gajah) 5.30 5.30 35.45 - 6.69 Bonglai (Bonglai) 2.00 2.00 4.01 - 2.01 Cekur (Cekur) 60.46 60.46 115.28 403.48 1.91 Dukung Anak (Dukung Anak) - - - - - Gelenggang (Gelenggang) 0.62 0.17 0.25 - 1.44 Halia Bara (Ginger) 14.20 11.40 6.98 - 0.61 Hempedu Bumi (Bile of The Earth) 5.00 5.00 9.00 - 1.80 Inai (Henna) 9.33 8.13 13.45 - 1.65 Jarum Tujuh Bilah (Jarum Tujuh Bilah) 0.02 0.02 0.35 - 17.50 Kacip Fatimah (Fatimah's Betel Cutter) 10.80 5.80 10.65 - 1.84 Kaduk (Kaduk) 0.26 0.26 1.38 - 5.32 Kesum (Kesum) 97.73 92.88 1,074.41 5,264.59 11.57 Kunyit Hitam (Saffron) 0.63 0.63 3.20 - 5.08 Lemon Myrtle (Lemon Myrtle) 1.10 1.10 39.14 - 35.58 Lidah Buaya (Aloe Vera) 40.95 40.95 30.79 - 0.75 Melada Pahit (Melada Pahit) 0.20 0.20 0.18 0.86 0.88 Pecah Beling (Pecah Beling) 2.10 2.10 6.50 - 3.10 Petai Belalang (Petai Belalang) 0.50 0.50 1.60 - 3.20 Pudina (Mint) 41.83 39.74 696.60 - 17.53 Selasih (Basil) 4.58 4.38 71.95 - 16.43 Sirih (Betel Vine) 86.98 86.58 719.24 - 8.31 Stevia (Stevia) 0.10 0.10 2.50 - 25.00 Temu Lawak (Temu Lawak) 8.00 8.00 0.89 - 0.11 Tenggek Burung (Euodia Redleyi) 4.00 4.00 10.42 - 2.60 Terung Pipit (Turkey Berry) 8.30 7.70 47.75 - 6.20 Tongkat Ali (Long Jack) 28.70 20.50 22.67 - 1.11 Jumlah Total 433.69 407.90 2,924.64 7.17 Jumlah Keseluruhan Grand Total 2,424.18 1,792.29 11,741.89 6.55
JADUAL 1-3 (c) : KELUASAN, PENGELUARAN DAN NILAI PENGELUARAN HERBA, MENGIKUT JENIS, MALAYSIA , 2017Table 1-3 (c) : Hectareage, Production and Value of Production of Herbs By Types, Malaysia, 2017
Herba Utama (Major Herbs)
Jenis Herba Types of Herbs
Herba Lain (Other Herbs)
6
Luas Bertanam Luas Berhasil Pengeluaran Nilai PengeluaranPlanted area Harvested area Production Value of Production
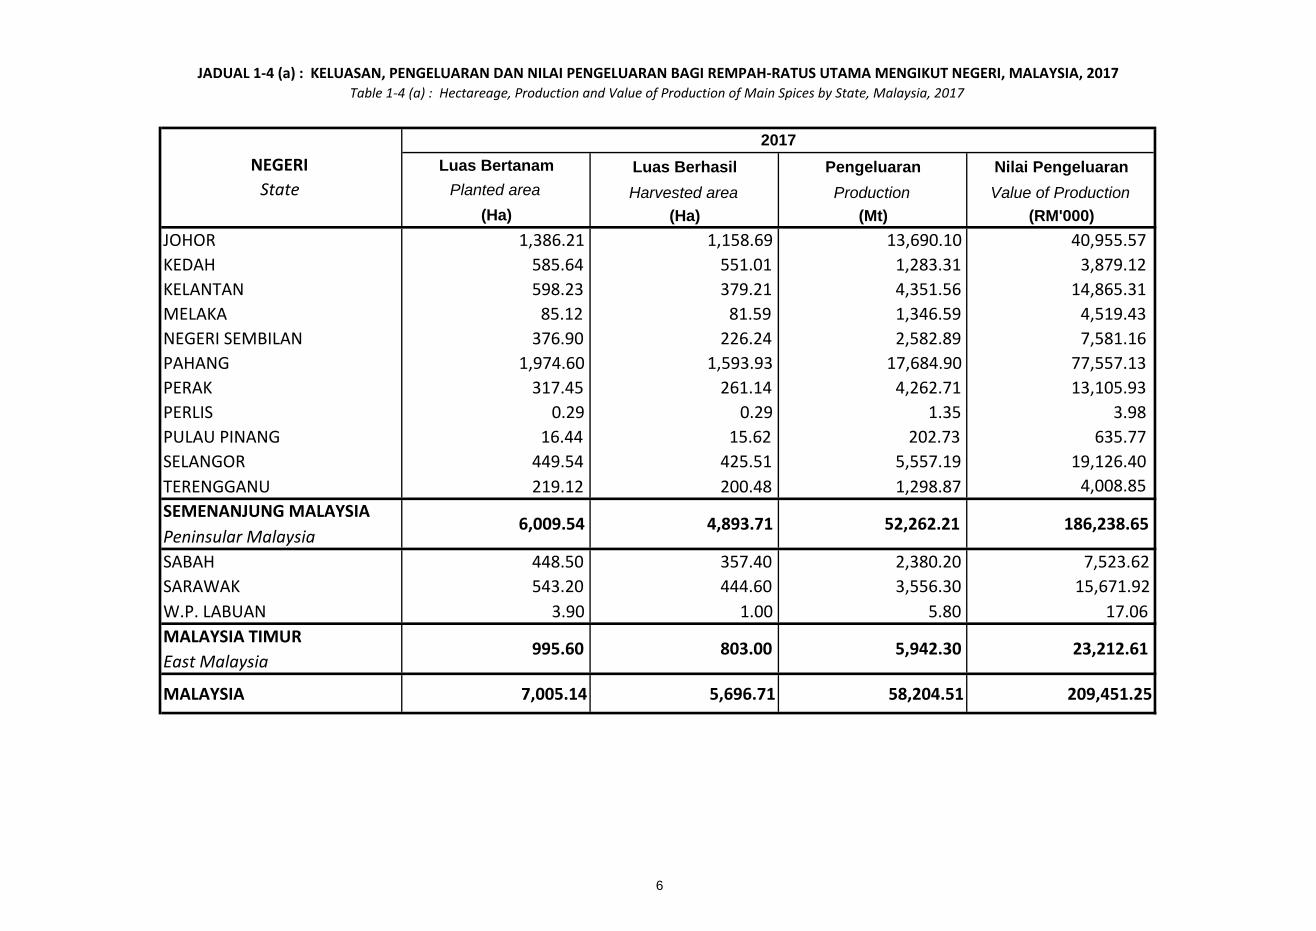
(Ha) (Ha) (Mt) (RM'000)JOHOR 1,386.21 1,158.69 13,690.10 40,955.57 KEDAH 585.64 551.01 1,283.31 3,879.12 KELANTAN 598.23 379.21 4,351.56 14,865.31 MELAKA 85.12 81.59 1,346.59 4,519.43 NEGERI SEMBILAN 376.90 226.24 2,582.89 7,581.16 PAHANG 1,974.60 1,593.93 17,684.90 77,557.13 PERAK 317.45 261.14 4,262.71 13,105.93 PERLIS 0.29 0.29 1.35 3.98 PULAU PINANG 16.44 15.62 202.73 635.77 SELANGOR 449.54 425.51 5,557.19 19,126.40 TERENGGANU 219.12 200.48 1,298.87 4,008.85
Peninsular MalaysiaSABAH 448.50 357.40 2,380.20 7,523.62 SARAWAK 543.20 444.60 3,556.30 15,671.92 W.P. LABUAN 3.90 1.00 5.80 17.06 MALAYSIA TIMUREast Malaysia
MALAYSIA 7,005.14 5,696.71 58,204.51 209,451.25
State
JADUAL 1-4 (a) : KELUASAN, PENGELUARAN DAN NILAI PENGELUARAN BAGI REMPAH-RATUS UTAMA MENGIKUT NEGERI, MALAYSIA, 2017Table 1-4 (a) : Hectareage, Production and Value of Production of Main Spices by State, Malaysia, 2017
2017NEGERI
995.60 803.00 5,942.30 23,212.61
SEMENANJUNG MALAYSIA 6,009.54 4,893.71 52,262.21 186,238.65
7
Luas Bertanam Luas Berhasil Pengeluaran Nilai PengeluaranPlanted area Harvested area Production Value of Production
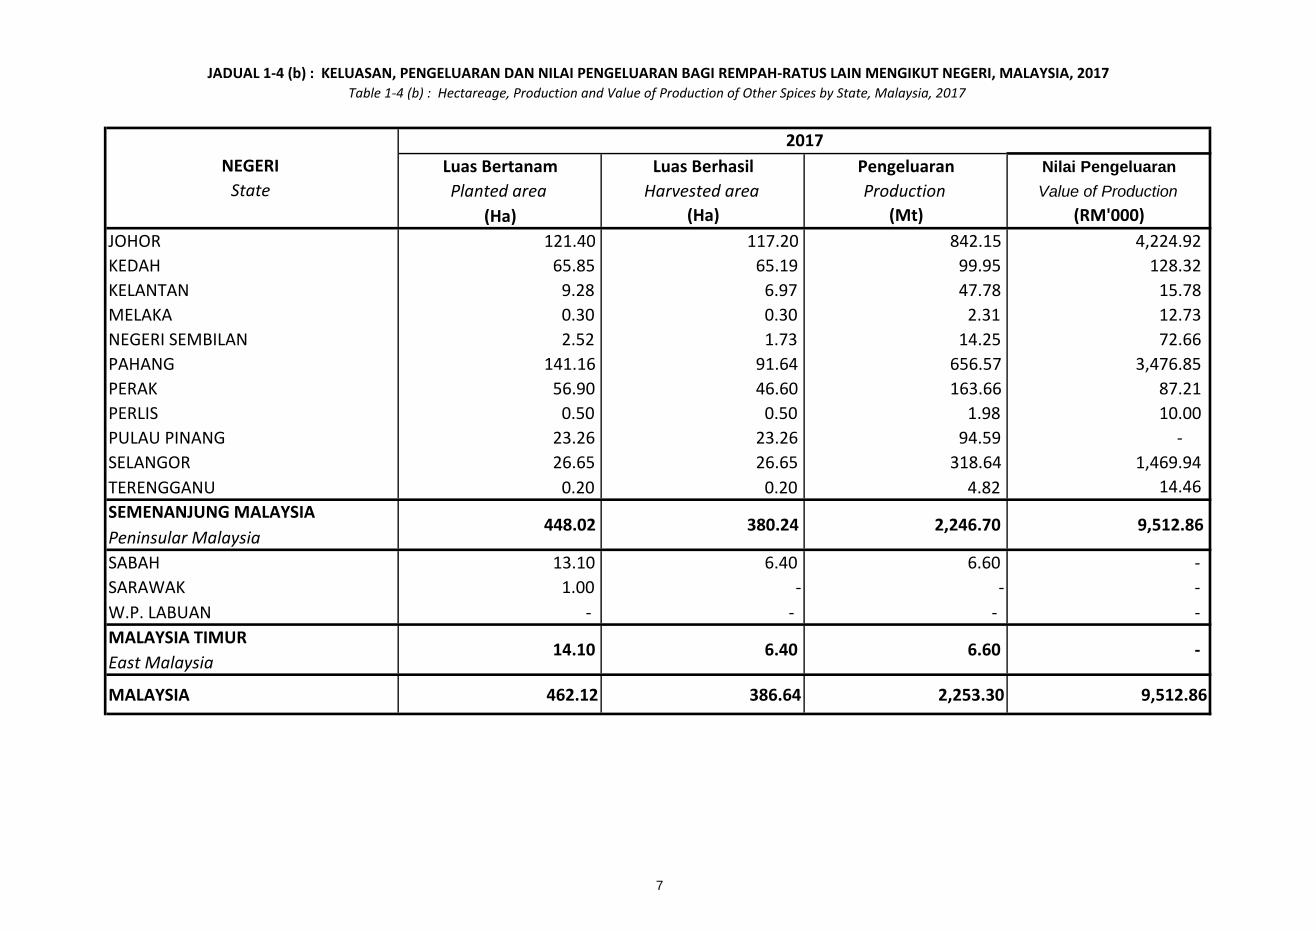
(Ha) (Ha) (Mt) (RM'000)JOHOR 121.40 117.20 842.15 4,224.92 KEDAH 65.85 65.19 99.95 128.32 KELANTAN 9.28 6.97 47.78 15.78 MELAKA 0.30 0.30 2.31 12.73 NEGERI SEMBILAN 2.52 1.73 14.25 72.66 PAHANG 141.16 91.64 656.57 3,476.85 PERAK 56.90 46.60 163.66 87.21 PERLIS 0.50 0.50 1.98 10.00 PULAU PINANG 23.26 23.26 94.59 - SELANGOR 26.65 26.65 318.64 1,469.94 TERENGGANU 0.20 0.20 4.82 14.46
Peninsular MalaysiaSABAH 13.10 6.40 6.60 - SARAWAK 1.00 - - - W.P. LABUAN - - - - MALAYSIA TIMUREast Malaysia
MALAYSIA 462.12 386.64 2,253.30 9,512.86
State
JADUAL 1-4 (b) : KELUASAN, PENGELUARAN DAN NILAI PENGELUARAN BAGI REMPAH-RATUS LAIN MENGIKUT NEGERI, MALAYSIA, 2017Table 1-4 (b) : Hectareage, Production and Value of Production of Other Spices by State, Malaysia, 2017
2017NEGERI
14.10 6.40 6.60 -
SEMENANJUNG MALAYSIA 448.02 380.24 2,246.70 9,512.86
8
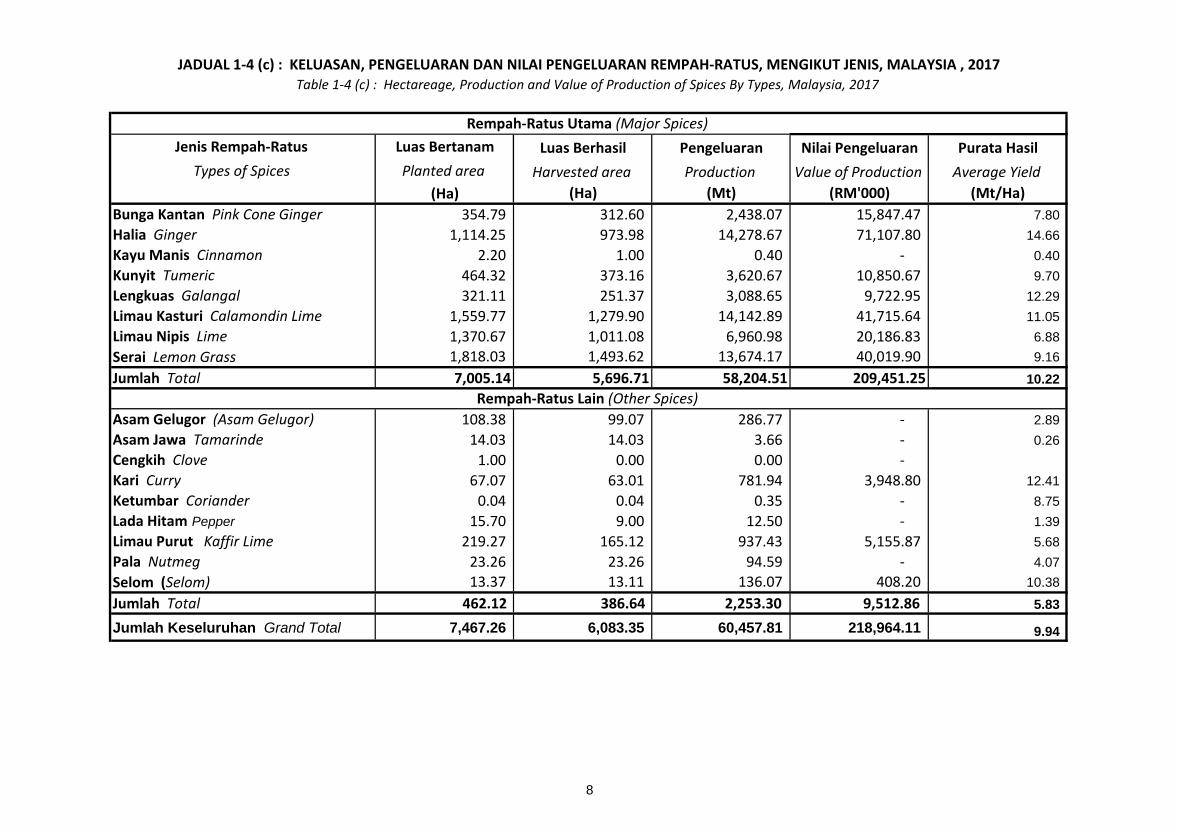
Jenis Rempah-Ratus Luas Bertanam Luas Berhasil Pengeluaran Nilai Pengeluaran Purata HasilTypes of Spices Planted area Harvested area Production Value of Production Average Yield
(Ha) (Ha) (Mt) (RM'000) (Mt/Ha)Bunga Kantan Pink Cone Ginger 354.79 312.60 2,438.07 15,847.47 7.80 Halia Ginger 1,114.25 973.98 14,278.67 71,107.80 14.66 Kayu Manis Cinnamon 2.20 1.00 0.40 - 0.40 Kunyit Tumeric 464.32 373.16 3,620.67 10,850.67 9.70 Lengkuas Galangal 321.11 251.37 3,088.65 9,722.95 12.29 Limau Kasturi Calamondin Lime 1,559.77 1,279.90 14,142.89 41,715.64 11.05 Limau Nipis Lime 1,370.67 1,011.08 6,960.98 20,186.83 6.88 Serai Lemon Grass 1,818.03 1,493.62 13,674.17 40,019.90 9.16 Jumlah Total 7,005.14 5,696.71 58,204.51 209,451.25 10.22
Asam Gelugor (Asam Gelugor) 108.38 99.07 286.77 - 2.89 Asam Jawa Tamarinde 14.03 14.03 3.66 - 0.26 Cengkih Clove 1.00 0.00 0.00 - Kari Curry 67.07 63.01 781.94 3,948.80 12.41 Ketumbar Coriander 0.04 0.04 0.35 - 8.75 Lada Hitam Pepper 15.70 9.00 12.50 - 1.39 Limau Purut Kaffir Lime 219.27 165.12 937.43 5,155.87 5.68 Pala Nutmeg 23.26 23.26 94.59 - 4.07 Selom (Selom) 13.37 13.11 136.07 408.20 10.38 Jumlah Total 462.12 386.64 2,253.30 9,512.86 5.83
Jumlah Keseluruhan Grand Total 7,467.26 6,083.35 60,457.81 218,964.11 9.94
JADUAL 1-4 (c) : KELUASAN, PENGELUARAN DAN NILAI PENGELUARAN REMPAH-RATUS, MENGIKUT JENIS, MALAYSIA , 2017Table 1-4 (c) : Hectareage, Production and Value of Production of Spices By Types, Malaysia, 2017
Rempah-Ratus Utama (Major Spices)
Rempah-Ratus Lain (Other Spices)
BAHAGIAN 2
Section 2
KELUASAN, PENGELUARAN DAN NILAI PENGELUARAN TANAMAN
HERBA DAN REMPAH-RATUS, MENGIKUT JENIS DAN NEGERI, MALAYSIA, 2017
Hectareage, Production and Value of Production of Herbs and Spices
By Types and State, Malaysia, 2017
9
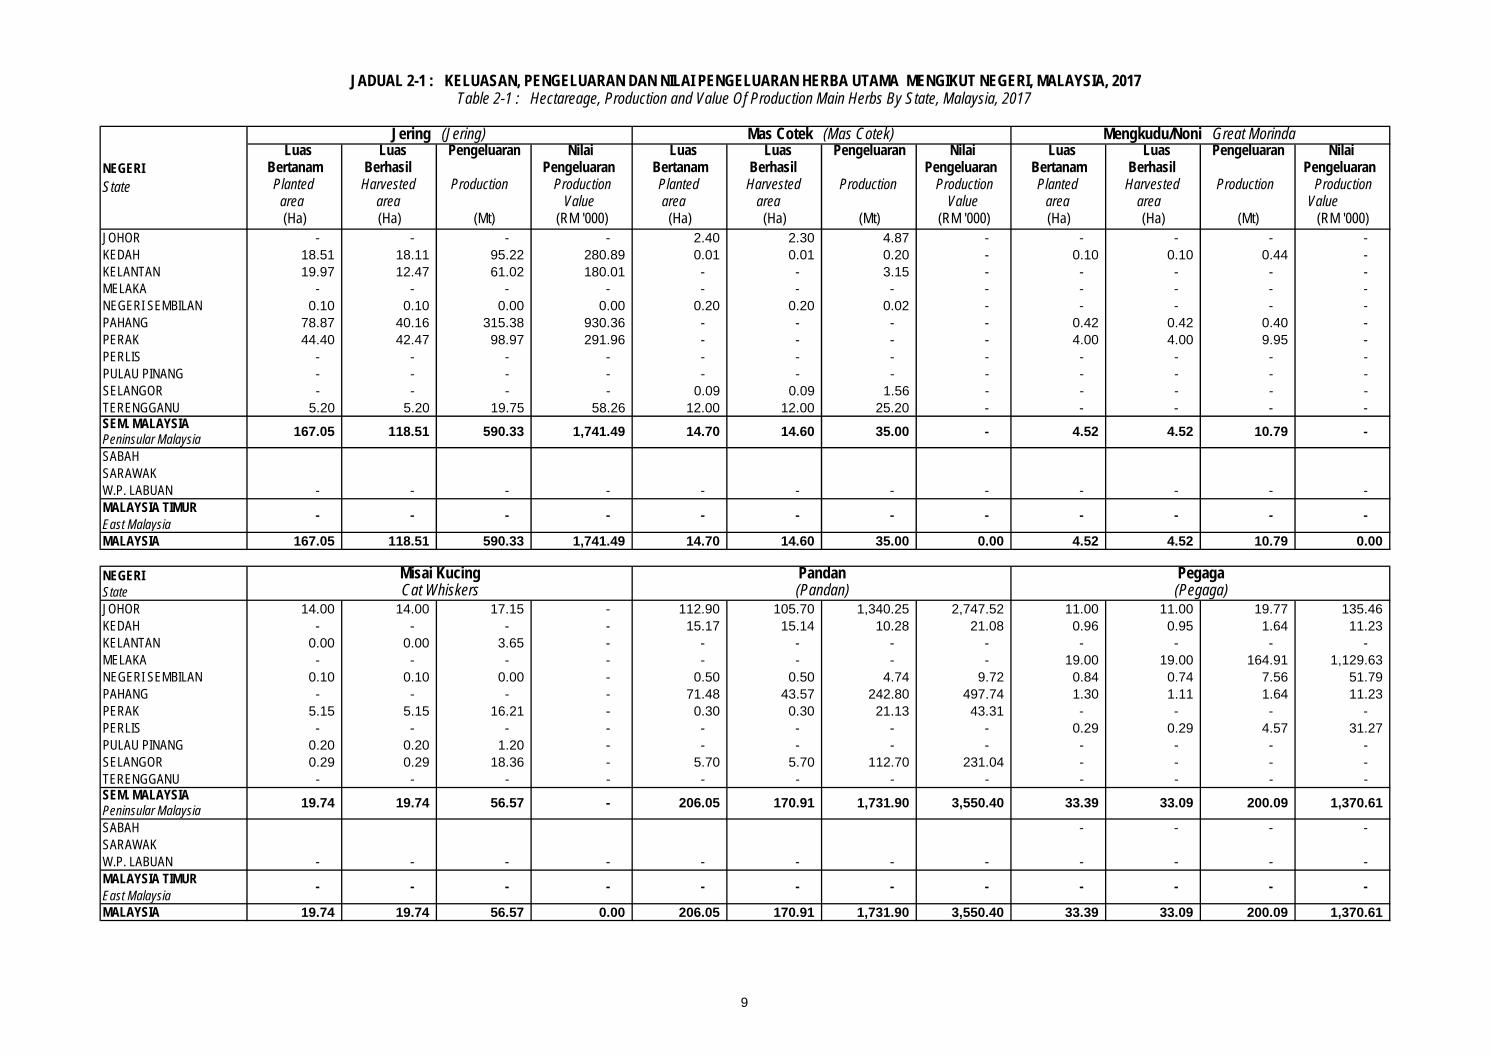
Luas Luas Pengeluaran Nilai Luas Luas Pengeluaran Nilai Luas Luas Pengeluaran Nilai Bertanam Berhasil Pengeluaran Bertanam Berhasil Pengeluaran Bertanam Berhasil Pengeluaran Planted Harvested Production Production Planted Harvested Production Production Planted Harvested Production Production
area area Value area area Value area area Value (Ha) (Ha) (Mt) (RM '000) (Ha) (Ha) (Mt) (RM '000) (Ha) (Ha) (Mt) (RM '000)
JOHOR - - - - 2.40 2.30 4.87 - - - - - KEDAH 18.51 18.11 95.22 280.89 0.01 0.01 0.20 - 0.10 0.10 0.44 - KELANTAN 19.97 12.47 61.02 180.01 - - 3.15 - - - - - MELAKA - - - - - - - - - - - - NEGERI SEMBILAN 0.10 0.10 0.00 0.00 0.20 0.20 0.02 - - - - - PAHANG 78.87 40.16 315.38 930.36 - - - - 0.42 0.42 0.40 - PERAK 44.40 42.47 98.97 291.96 - - - - 4.00 4.00 9.95 - PERLIS - - - - - - - - - - - - PULAU PINANG - - - - - - - - - - - - SELANGOR - - - - 0.09 0.09 1.56 - - - - - TERENGGANU 5.20 5.20 19.75 58.26 12.00 12.00 25.20 - - - - - SEM. MALAYSIAPeninsular MalaysiaSABAHSARAWAKW.P. LABUAN - - - - - - - - - - - - MALAYSIA TIMUREast MalaysiaMALAYSIA 167.05 118.51 590.33 1,741.49 14.70 14.60 35.00 0.00 4.52 4.52 10.79 0.00
NEGERI StateJOHOR 14.00 14.00 17.15 - 112.90 105.70 1,340.25 2,747.52 11.00 11.00 19.77 135.46 KEDAH - - - - 15.17 15.14 10.28 21.08 0.96 0.95 1.64 11.23 KELANTAN 0.00 0.00 3.65 - - - - - - - - - MELAKA - - - - - - - - 19.00 19.00 164.91 1,129.63 NEGERI SEMBILAN 0.10 0.10 0.00 - 0.50 0.50 4.74 9.72 0.84 0.74 7.56 51.79 PAHANG - - - - 71.48 43.57 242.80 497.74 1.30 1.11 1.64 11.23 PERAK 5.15 5.15 16.21 - 0.30 0.30 21.13 43.31 - - - - PERLIS - - - - - - - - 0.29 0.29 4.57 31.27 PULAU PINANG 0.20 0.20 1.20 - - - - - - - - - SELANGOR 0.29 0.29 18.36 - 5.70 5.70 112.70 231.04 - - - - TERENGGANU - - - - - - - - - - - - SEM. MALAYSIAPeninsular MalaysiaSABAH - - - - SARAWAKW.P. LABUAN - - - - - - - - - - - - MALAYSIA TIMUREast MalaysiaMALAYSIA 19.74 19.74 56.57 0.00 206.05 170.91 1,731.90 3,550.40 33.39 33.09 200.09 1,370.61
- - - - - - - - - - - -
1,731.90 3,550.40 33.39 33.09 200.09 1,370.61 19.74 19.74 56.57 - 206.05 170.91
Misai Kucing Pandan Pegaga Cat Whiskers (Pandan) (Pegaga)
- - - - - - - - - - - -
JADUAL 2-1 : KELUASAN, PENGELUARAN DAN NILAI PENGELUARAN HERBA UTAMA MENGIKUT NEGERI, MALAYSIA, 2017Table 2-1 : Hectareage, Production and Value Of Production Main Herbs By State, Malaysia, 2017
NEGERI State
Jering (Jering) Mas Cotek (Mas Cotek) Mengkudu/Noni Great Morinda
35.00 - 4.52 4.52 10.79 - 167.05 118.51 590.33 1,741.49 14.70 14.60
10
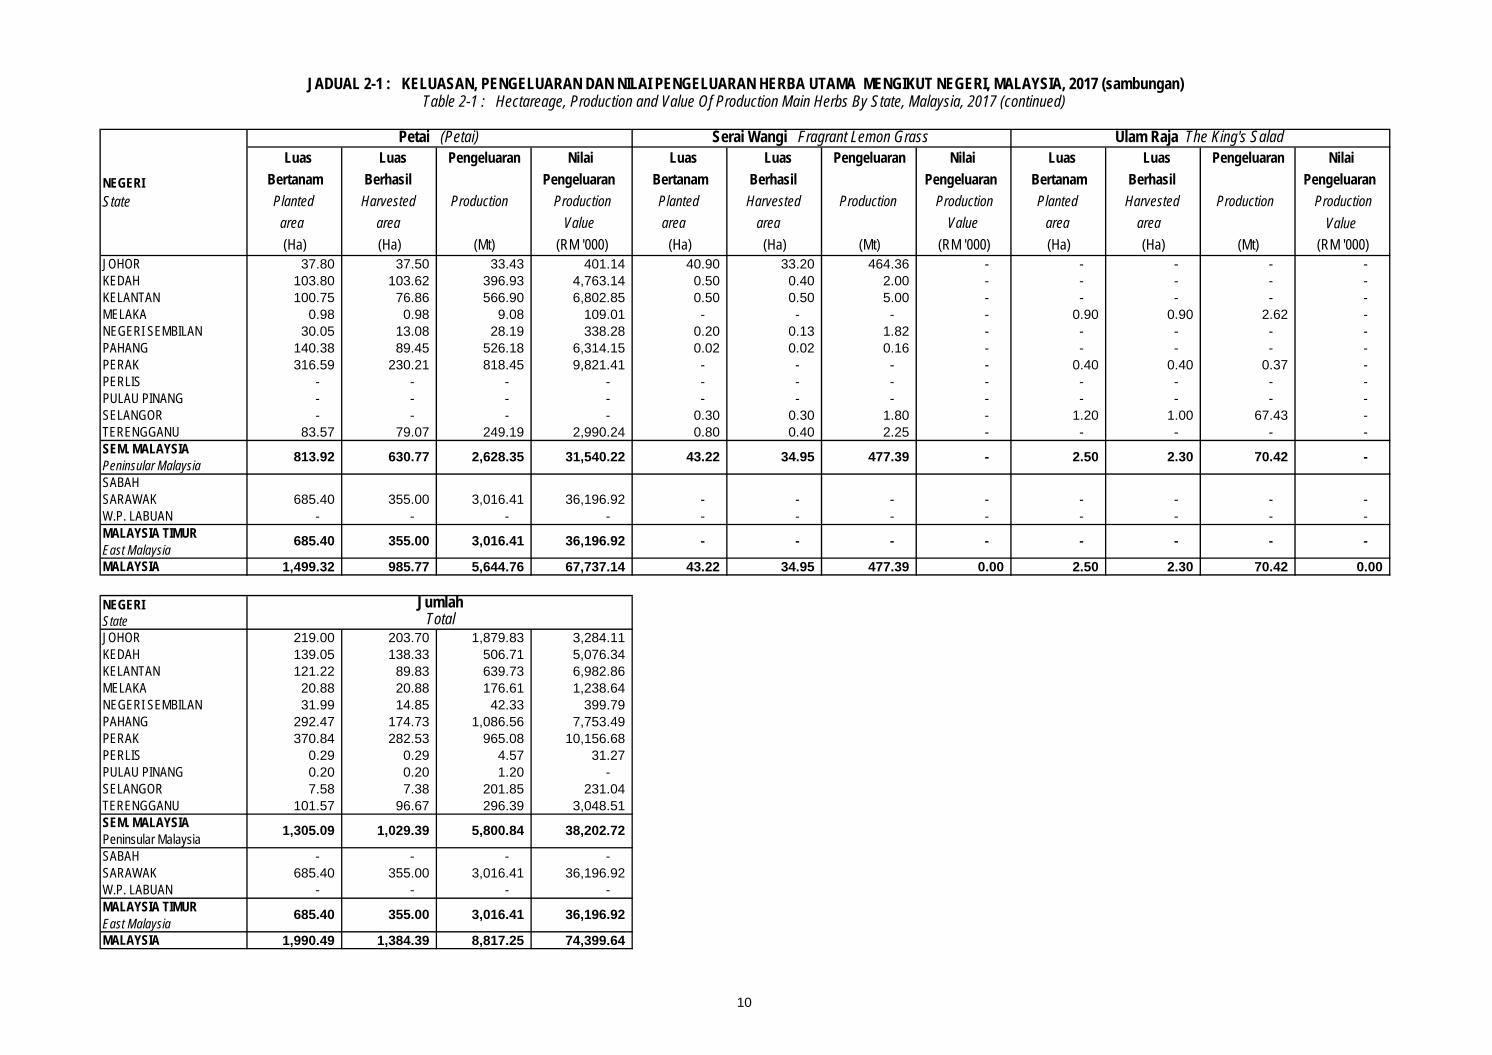
Luas Luas Pengeluaran Nilai Luas Luas Pengeluaran Nilai Luas Luas Pengeluaran Nilai Bertanam Berhasil Pengeluaran Bertanam Berhasil Pengeluaran Bertanam Berhasil Pengeluaran Planted Harvested Production Production Planted Harvested Production Production Planted Harvested Production Production
area area Value area area Value area area Value (Ha) (Ha) (Mt) (RM '000) (Ha) (Ha) (Mt) (RM '000) (Ha) (Ha) (Mt) (RM '000)
JOHOR 37.80 37.50 33.43 401.14 40.90 33.20 464.36 - - - - - KEDAH 103.80 103.62 396.93 4,763.14 0.50 0.40 2.00 - - - - - KELANTAN 100.75 76.86 566.90 6,802.85 0.50 0.50 5.00 - - - - - MELAKA 0.98 0.98 9.08 109.01 - - - - 0.90 0.90 2.62 - NEGERI SEMBILAN 30.05 13.08 28.19 338.28 0.20 0.13 1.82 - - - - - PAHANG 140.38 89.45 526.18 6,314.15 0.02 0.02 0.16 - - - - - PERAK 316.59 230.21 818.45 9,821.41 - - - - 0.40 0.40 0.37 - PERLIS - - - - - - - - - - - - PULAU PINANG - - - - - - - - - - - - SELANGOR - - - - 0.30 0.30 1.80 - 1.20 1.00 67.43 - TERENGGANU 83.57 79.07 249.19 2,990.24 0.80 0.40 2.25 - - - - - SEM. MALAYSIAPeninsular MalaysiaSABAHSARAWAK 685.40 355.00 3,016.41 36,196.92 - - - - - - - - W.P. LABUAN - - - - - - - - - - - - MALAYSIA TIMUREast MalaysiaMALAYSIA 1,499.32 985.77 5,644.76 67,737.14 43.22 34.95 477.39 0.00 2.50 2.30 70.42 0.00
NEGERI StateJOHOR 219.00 203.70 1,879.83 3,284.11 KEDAH 139.05 138.33 506.71 5,076.34 KELANTAN 121.22 89.83 639.73 6,982.86 MELAKA 20.88 20.88 176.61 1,238.64 NEGERI SEMBILAN 31.99 14.85 42.33 399.79 PAHANG 292.47 174.73 1,086.56 7,753.49 PERAK 370.84 282.53 965.08 10,156.68 PERLIS 0.29 0.29 4.57 31.27 PULAU PINANG 0.20 0.20 1.20 - SELANGOR 7.58 7.38 201.85 231.04 TERENGGANU 101.57 96.67 296.39 3,048.51 SEM. MALAYSIAPeninsular MalaysiaSABAH - - - - SARAWAK 685.40 355.00 3,016.41 36,196.92 W.P. LABUAN - - - - MALAYSIA TIMUREast MalaysiaMALAYSIA 1,990.49 1,384.39 8,817.25 74,399.64
685.40 355.00 3,016.41 36,196.92
Jumlah Total
1,305.09 1,029.39 5,800.84 38,202.72
- - - - - - 685.40 355.00 3,016.41 36,196.92 - -
477.39 - 2.50 2.30 70.42 - 813.92 630.77 2,628.35 31,540.22 43.22 34.95
JADUAL 2-1 : KELUASAN, PENGELUARAN DAN NILAI PENGELUARAN HERBA UTAMA MENGIKUT NEGERI, MALAYSIA, 2017 (sambungan)Table 2-1 : Hectareage, Production and Value Of Production Main Herbs By State, Malaysia, 2017 (continued)
NEGERI State
Petai (Petai) Serai Wangi Fragrant Lemon Grass Ulam Raja The King's Salad
11
Luas Luas Pengeluaran Nilai Luas Luas Pengeluaran Nilai Luas Luas Pengeluaran Nilai Bertanam Berhasil Pengeluaran Bertanam Berhasil Pengeluaran Bertanam Berhasil Pengeluaran Planted Harvested Production Production Planted Harvested Production Production Planted Harvested Production Production
area area Value area area Value area area Value (Ha) (Ha) (Mt) (RM '000) (Ha) (Ha) (Mt) (RM '000) (Ha) (Ha) (Mt) (RM '000)
JOHOR - - - - 2.00 2.00 4.01 - 50.97 50.97 93.86 328.51 KEDAH - - - - - - - - 0.28 0.28 0.50 1.74 KELANTAN 0.00 0.00 0.68 - - - - - MELAKA - - - - - - - - 1.00 1.00 14.99 52.47 NEGERI SEMBILAN 5.10 5.10 30.57 - - - - - PAHANG - - - - - - - - 0.21 0.21 0.43 1.51 PERAK - - - - - - - - - - - - PERLIS - - - - - - - - - - - - PULAU PINANG 0.20 0.20 4.20 - - - - - - - - - SELANGOR - - - - - - - - - - - - TERENGGANU - - - - - - - - 8.00 8.00 5.50 19.25 SEM. MALAYSIAPeninsular MalaysiaSABAH - - - - - - - - - - - - SARAWAK - - - - - - - - - - - - W.P. LABUAN - - - - - - - - - - - - MALAYSIA TIMUREast MalaysiaMALAYSIA 5.30 5.30 35.45 - 2.00 2.00 4.01 - 60.46 60.46 115.28 403.48
NEGERI State JOHOR - - - - - - - - - - - - KEDAH - - - - 0.02 0.02 0.10 - 0.20 0.20 2.00 - KELANTAN - - - - - - - - - - - - MELAKA - - - - - - - - - - - - NEGERI SEMBILAN - - - - - - - - - - - - PAHANG - - - - 0.60 0.15 0.15 - 4.00 1.20 0.28 - PERAK - - - - - - - - - - - - PERLIS - - - - - - - - - - - - PULAU PINANG - - - - - - - - - - - - SELANGOR - - - - - - - - - - - - TERENGGANU - - - - - - - - 10.00 10.00 4.70 - SEM. MALAYSIAPeninsular MalaysiaSABAH - - - - - - - - - - - - SARAWAK - - - - - - - - - - - - W.P. LABUAN - - - - - - - - - - - - MALAYSIA TIMUREast MalaysiaMALAYSIA - - - - 0.62 0.17 0.25 - 14.20 11.40 6.98 -
- - - - - - - - - - - -
0.25 - 14.20 11.40 6.98 - - - - - 0.62 0.17
Dukung Anak Gelenggang Halia Bara (Dukung Anak) (Gelenggang) Ginger
- - - - - - - - - - - -
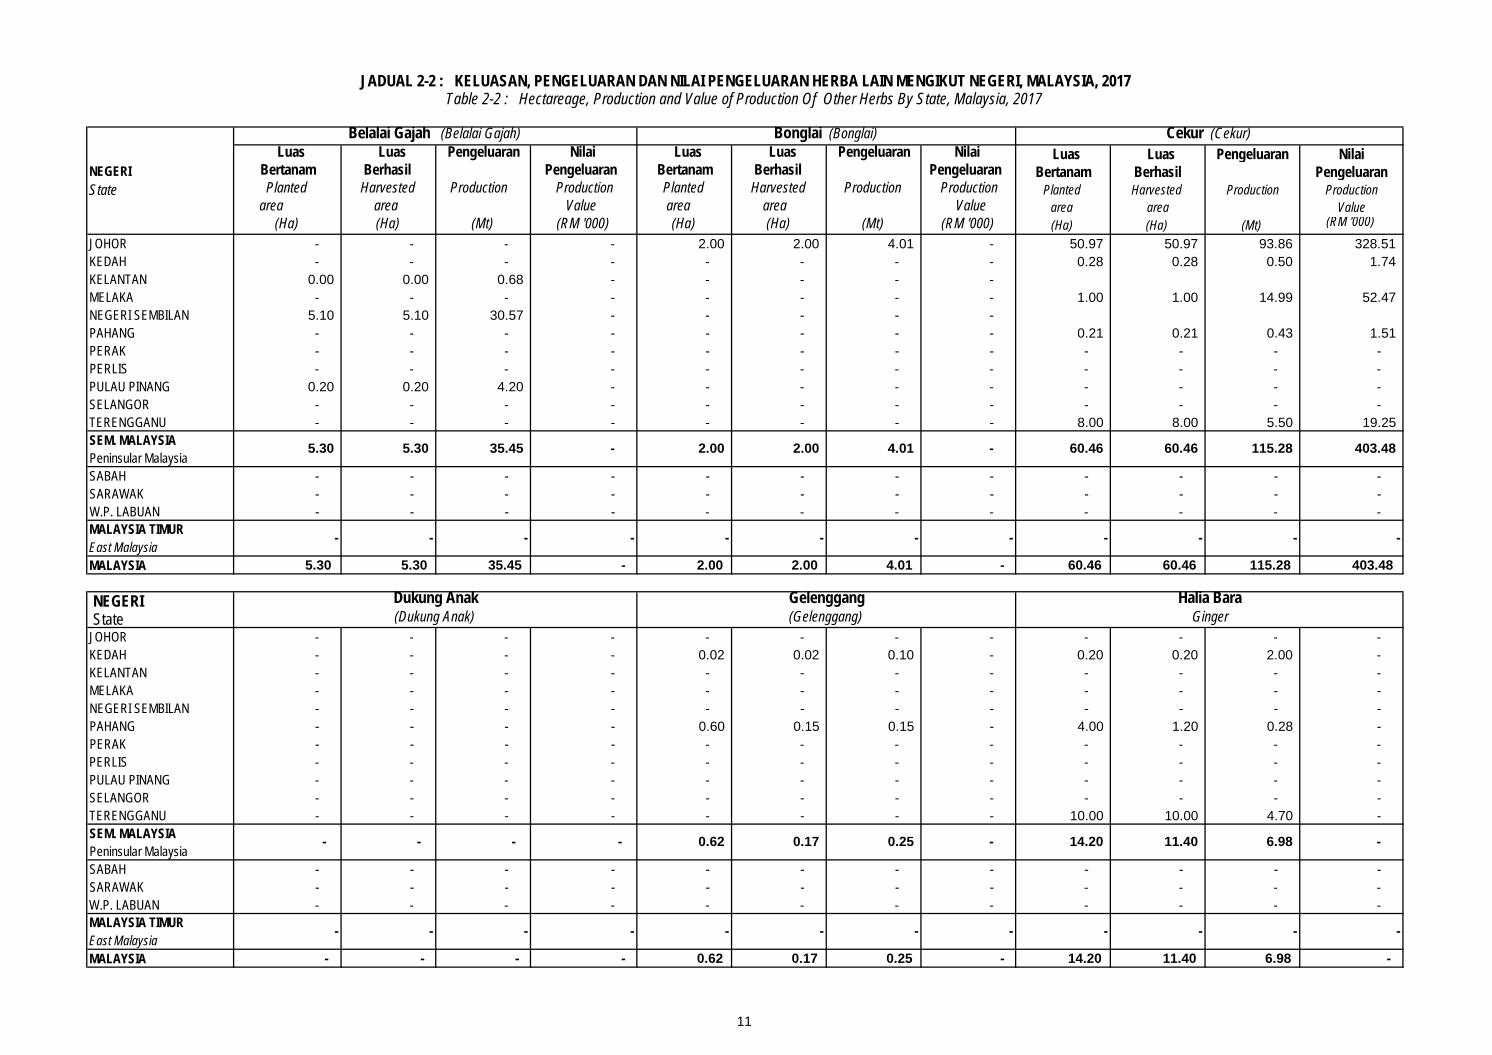
JADUAL 2-2 : KELUASAN, PENGELUARAN DAN NILAI PENGELUARAN HERBA LAIN MENGIKUT NEGERI, MALAYSIA, 2017Table 2-2 : Hectareage, Production and Value of Production Of Other Herbs By State, Malaysia, 2017
NEGERI State
Belalai Gajah (Belalai Gajah) Bonglai (Bonglai) Cekur (Cekur)
4.01 - 60.46 60.46 115.28 403.485.30 5.30 35.45 - 2.00 2.00
12
Luas Luas Pengeluaran Nilai Luas Luas Pengeluaran Nilai Luas Luas Pengeluaran Nilai Bertanam Berhasil Pengeluaran Bertanam Berhasil Pengeluaran Bertanam Berhasil Pengeluaran Planted Harvested Production Production Planted Harvested Production Production Planted Harvested Production Production
area area Value area area Value area area Value (Ha) (Ha) (Mt) (RM '000) (Ha) (Ha) (Mt) (RM '000) (Ha) (Ha) (Mt) (RM '000)
JOHOR - - - - 7.00 5.80 11.18 - KEDAH - - - - 2.33 2.33 2.28 - 0.02 0.02 0.35 - KELANTAN - - - - - - - - - - - - MELAKA - - - - - - - - - - - - NEGERI SEMBILAN - - - - - - - - - - - - PAHANG - - - - - - - - - - - - PERAK - - - - - - - - - - - - PERLIS - - - - - - - - - - - - PULAU PINANG - - - - - - - - - - - - SELANGOR - - - - - - - - - - - - TERENGGANU 5.00 5.00 9.00 - - - - - - - - - SEM. MALAYSIAPeninsular MalaysiaSABAH - - - - - - - - - - - - SARAWAK - - - - - - - - - - - - W.P. LABUAN - - - - - - - - - - - - MALAYSIA TIMUREast MalaysiaMALAYSIA 5.00 5.00 9.00 - 9.33 8.13 13.45 - 0.02 0.02 0.35 -
NEGERI State JOHOR - - - - - - - - 50.80 47.60 271.21 1,328.92 KEDAH - - - - 0.26 0.26 1.38 - 17.74 17.74 36.10 176.89 KELANTAN 0.00 0.00 2.11 - MELAKA - - - - - - - - 0.40 0.40 3.90 19.11 NEGERI SEMBILAN - - - - - - - - PAHANG - - - - - - - - 23.33 21.78 470.01 2,303.07 PERAK - - - - - - - - 0.01 0.01 0.96 4.70 PERLIS - - - - - - - - PULAU PINANG - - - - - - - - SELANGOR - - - - - - - - 4.75 4.75 278.92 1,366.73 TERENGGANU 10.80 5.80 8.54 - - - - - 0.70 0.60 13.30 65.17 SEM. MALAYSIAPeninsular MalaysiaSABAH - - - SARAWAK - - - - - - - - - - - - W.P. LABUAN - - - - - - - - - - - - MALAYSIA TIMUREast MalaysiaMALAYSIA 10.80 5.80 10.65 - 0.26 0.26 1.38 - 97.73 92.88 1,074.41 5,264.59
- - - - - - - - - - - -
1.38 0.00 97.73 92.88 1,074.41 5,264.5910.80 5.80 10.65 - 0.26 0.26
Kacip Fatimah Kaduk Kesum Fatimah's Betel Cutter (Kaduk) (Kesum)
- - - - - - - - - - - -
13.45 0.00 0.02 0.02 0.35 - 5.00 5.00 9.00 - 9.33 8.13
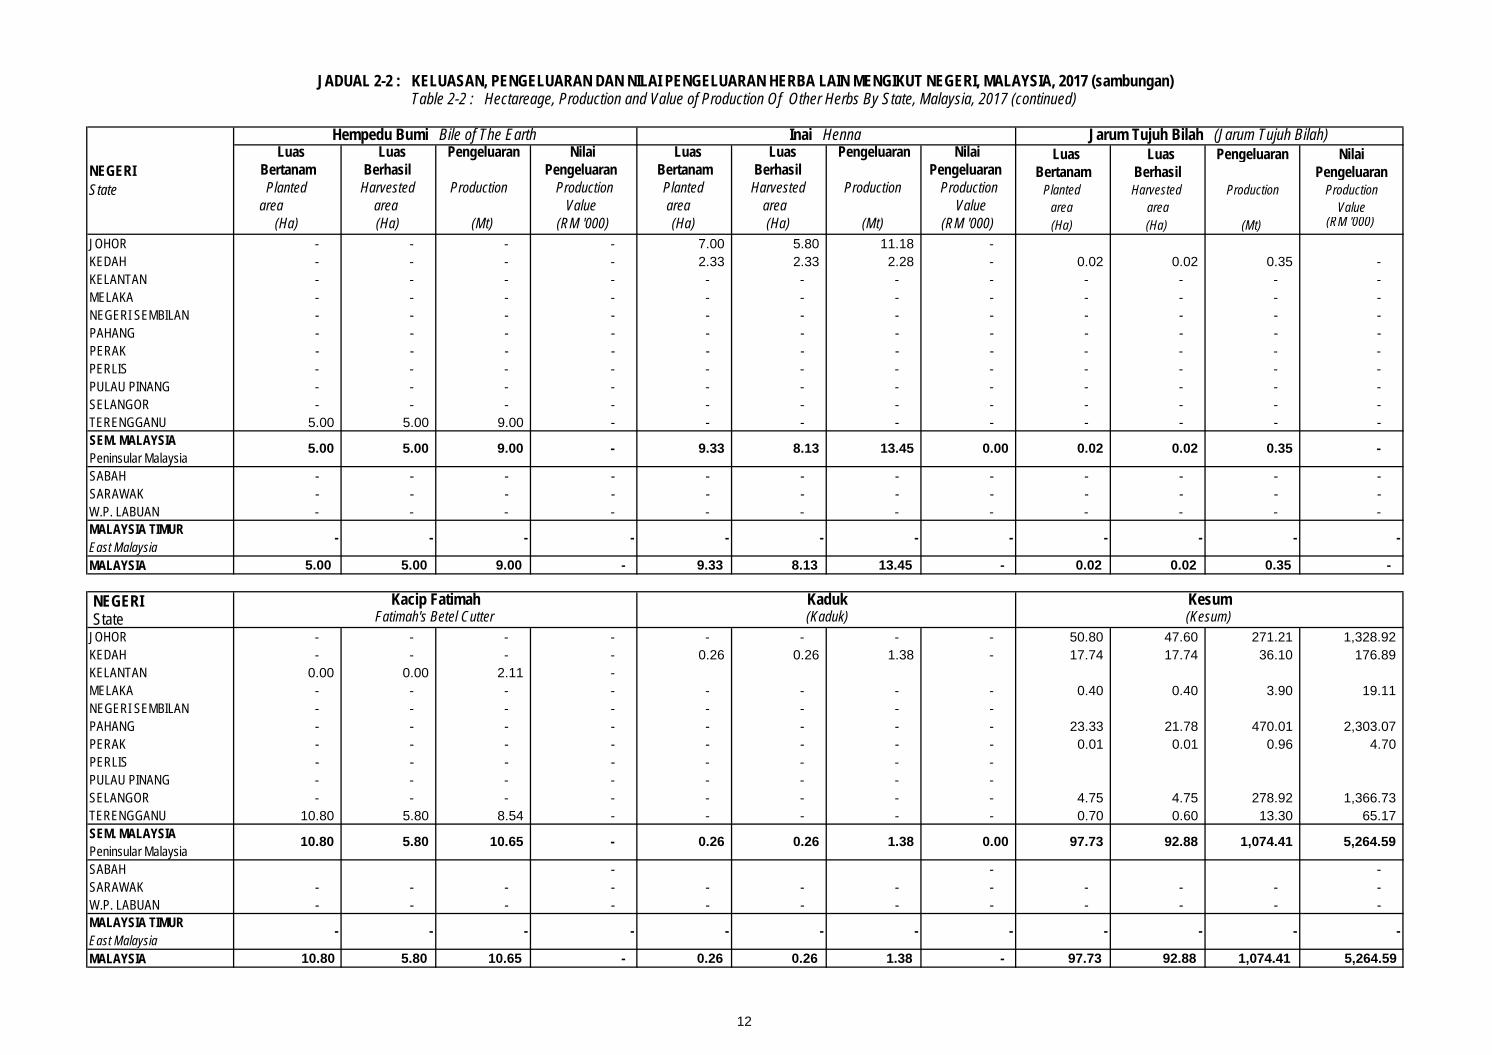
JADUAL 2-2 : KELUASAN, PENGELUARAN DAN NILAI PENGELUARAN HERBA LAIN MENGIKUT NEGERI, MALAYSIA, 2017 (sambungan)Table 2-2 : Hectareage, Production and Value of Production Of Other Herbs By State, Malaysia, 2017 (continued)
NEGERI State
Hempedu Bumi Bile of The Earth Inai Henna Jarum Tujuh Bilah (Jarum Tujuh Bilah)
13
Luas Luas Pengeluaran Nilai Luas Luas Pengeluaran Nilai Luas Luas Pengeluaran Nilai Bertanam Berhasil Pengeluaran Bertanam Berhasil Pengeluaran Bertanam Berhasil Pengeluaran Planted Harvested Production Production Planted Harvested Production Production Planted Harvested Production Production
area area Value area area Value area area Value (Ha) (Ha) (Mt) (RM '000) (Ha) (Ha) (Mt) (RM '000) (Ha) (Ha) (Mt) (RM '000)
JOHOR 0.10 0.10 0.14 - 35.10 35.10 13.83 - KEDAH 0.04 0.04 0.03 - 5.05 5.05 3.96 - KELANTAN - - - - - - - - - - - - MELAKA - - - - - - - - - - - - NEGERI SEMBILAN - - - - - - - - - - - - PAHANG - - - - - - - - - - - - PERAK - - - - - - - - - - - - PERLIS - - - - - - - - - - - - PULAU PINANG - - - - - - - - - - - - SELANGOR 0.59 0.59 3.18 - 1.00 1.00 39.00 - 0.80 0.80 13.00 - TERENGGANUSEM. MALAYSIAPeninsular MalaysiaSABAH - - - SARAWAK - - - - - - - - - - - - W.P. LABUAN - - - - - - - - - - - - MALAYSIA TIMUREast MalaysiaMALAYSIA 0.63 0.63 3.20 - 1.10 1.10 39.14 - 40.95 40.95 30.79 -
NEGERI State JOHOR - - - - - - - - - - - - KEDAH - - - - - - - - 0.50 0.50 1.60 - KELANTAN - - - - - - - - - - - - MELAKA - - - - - - - - - - - - NEGERI SEMBILAN - - - - 0.10 0.10 0.00 - - - - - PAHANG 0.20 0.20 0.18 0.86 - - - - - - - - PERAK - - - - 2.00 2.00 6.50 - - - - - PERLIS - - - - - - - - - - - - PULAU PINANG - - - - - - - - - - - - SELANGOR - - - - - - - - - - - - TERENGGANU - - - - - - - - - - - - SEM. MALAYSIAPeninsular MalaysiaSABAH - - - SARAWAK - - - - - - - - - - - - W.P. LABUAN - - - - - - - - - - - - MALAYSIA TIMUREast MalaysiaMALAYSIA 0.20 0.20 0.18 0.86 2.10 2.10 6.50 - 0.50 0.50 1.60 -
- - - - - - - - - - - -
6.50 0.00 0.50 0.50 1.60 - 0.20 0.20 0.18 0.86 2.10 2.10
Melada Pahit Pecah Beling Petai Belalang (Melada Pahit) (Pecah beling) (Petai Belalang)
- - - - - - - - - - - -
39.14 0.00 40.95 40.95 30.79 - 0.63 0.63 3.20 - 1.10 1.10
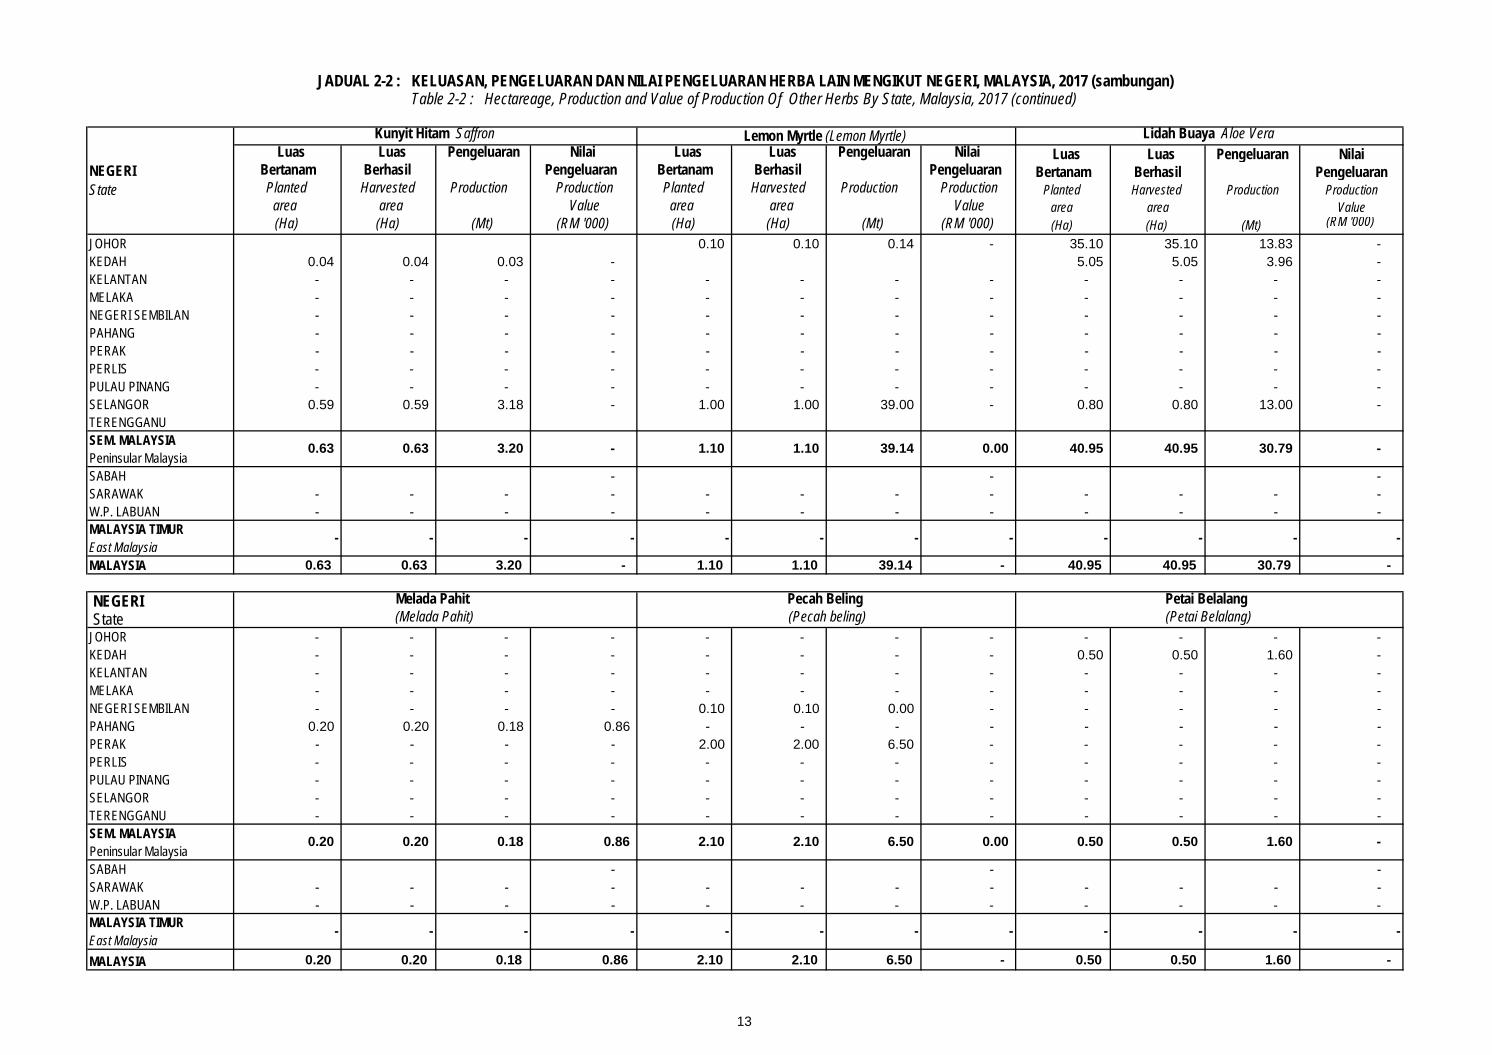
JADUAL 2-2 : KELUASAN, PENGELUARAN DAN NILAI PENGELUARAN HERBA LAIN MENGIKUT NEGERI, MALAYSIA, 2017 (sambungan)Table 2-2 : Hectareage, Production and Value of Production Of Other Herbs By State, Malaysia, 2017 (continued)
NEGERI State
Kunyit Hitam Saffron Lemon Myrtle (Lemon Myrtle) Lidah Buaya Aloe Vera
14
Luas Luas Pengeluaran Nilai Luas Luas Pengeluaran Nilai Luas Luas Pengeluaran Nilai Bertanam Berhasil Pengeluaran Bertanam Berhasil Pengeluaran Bertanam Berhasil Pengeluaran Planted Harvested Production Production Planted Harvested Production Production Planted Harvested Production Production
area area Value area area Value area area Value (Ha) (Ha) (Mt) (RM '000) (Ha) (Ha) (Mt) (RM '000) (Ha) (Ha) (Mt) (RM '000)
JOHOR - - - - 0.80 0.60 7.95 - 10.00 10.00 23.17 - KEDAH - - - - 0.18 0.18 0.54 - 4.09 4.09 7.47 - KELANTAN - - - - - - MELAKA - - - - 0.80 0.80 4.50 - 3.40 3.40 35.29 - NEGERI SEMBILAN - - - - - 2.40 2.40 1.34 - PAHANG 41.83 39.74 696.60 - 0.20 0.20 3.87 - 0.80 0.80 2.70 - PERAK - - - - 2.60 2.60 55.10 - 2.13 2.13 12.61 - PERLIS - - - - - - - - - PULAU PINANG - - - - - - - - - SELANGOR - - - - - - - - 64.16 63.76 636.67 - TERENGGANU - - - - - - - - - SEM. MALAYSIAPeninsular MalaysiaSABAH - - - - - - - - - - - - SARAWAK - - - - - - - - - - - - W.P. LABUAN - - - - - - - - - - - - MALAYSIA TIMUREast MalaysiaMALAYSIA 41.83 39.74 696.60 - 4.58 4.38 71.95 - 86.98 86.58 719.24 -
NEGERI State JOHOR - - - - 8.00 8.00 0.89 - 4.00 4.00 10.42 - KEDAH - - - - - - - - - - - - KELANTAN - - - - - - - - - - - - MELAKA - - - - - - - - - - - - NEGERI SEMBILAN - - - - - - - - - - - - PAHANG - - - - - - - - - - - - PERAK - - - - - - - - - - - - PERLIS - - - - - - - - - - - - PULAU PINANG - - - - - - - - - - - - SELANGOR - - - - - - - - - - - - TERENGGANU 0.10 0.10 2.50 - - - - - - - - - SEM. MALAYSIAPeninsular MalaysiaSABAH - - - - - - - - - - - - SARAWAK - - - - - - - - - - - - W.P. LABUAN - - - - - - - - - - - - MALAYSIA TIMUREast MalaysiaMALAYSIA 0.10 0.10 2.50 - 8.00 8.00 0.89 - 4.00 4.00 10.42 -
- - - - - - - - - - - -
0.89 - 4.00 4.00 10.42 - 0.10 0.10 2.50 - 8.00 8.00
Stevia Temu Lawak Tenggek Burung (Stevia) (Temu Lawak) Euodia Redleyi
- - - - - - - - - - - -
71.95 0.00 86.98 86.58 719.24 - 41.83 39.74 696.60 - 4.58 4.38
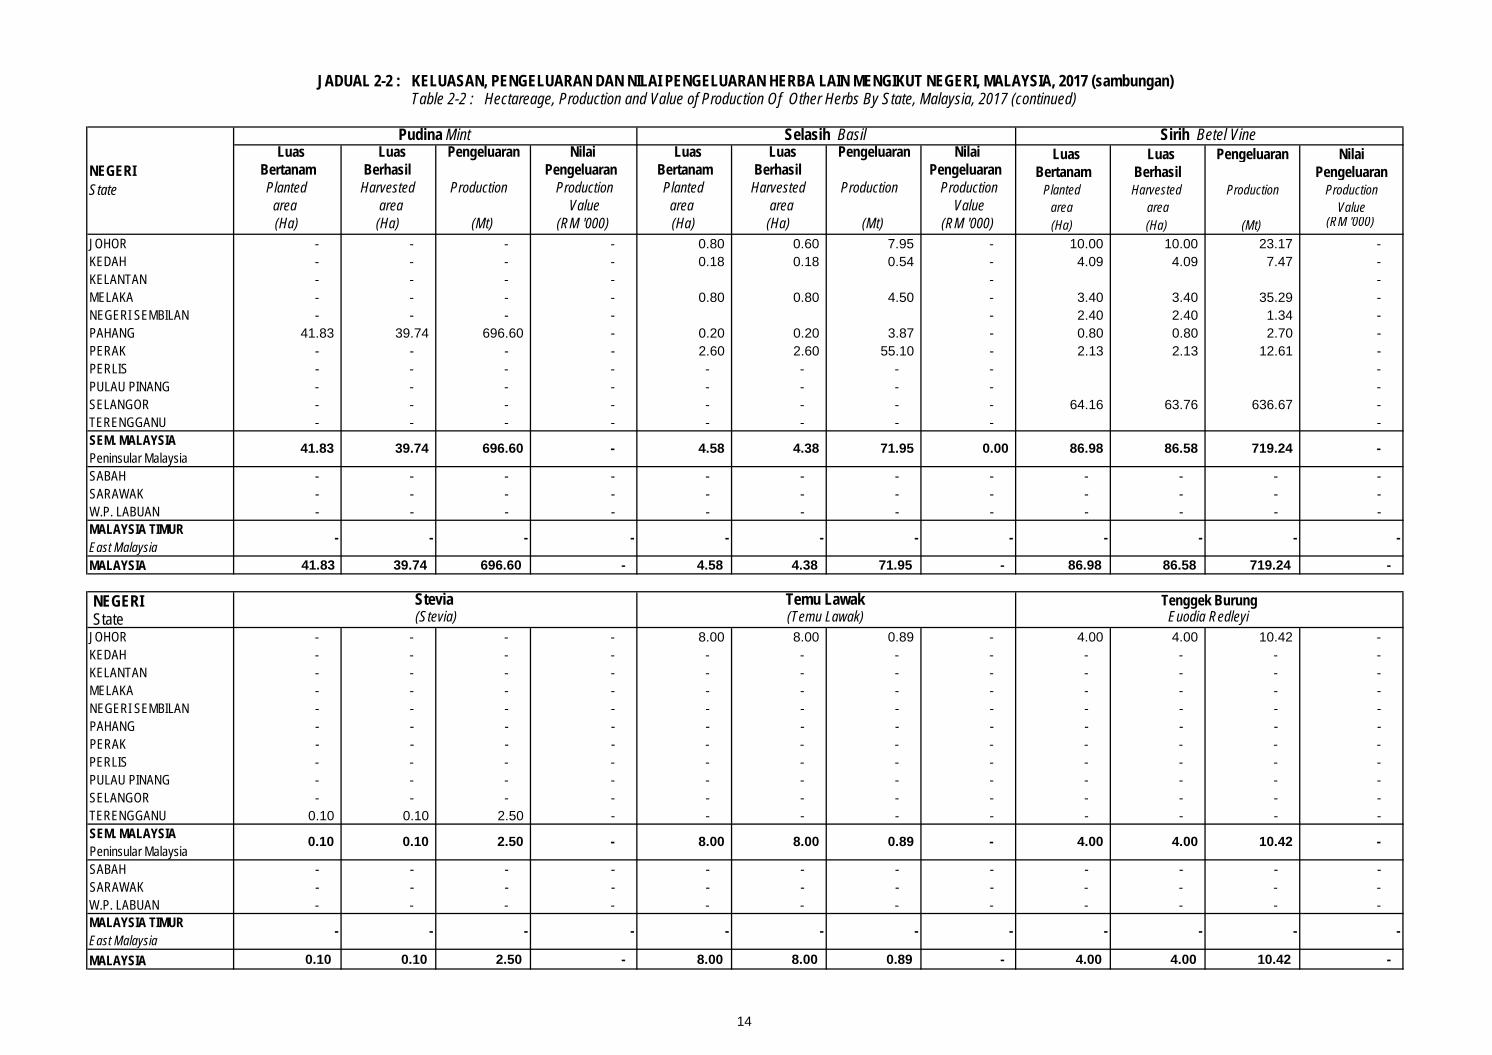
JADUAL 2-2 : KELUASAN, PENGELUARAN DAN NILAI PENGELUARAN HERBA LAIN MENGIKUT NEGERI, MALAYSIA, 2017 (sambungan)Table 2-2 : Hectareage, Production and Value of Production Of Other Herbs By State, Malaysia, 2017 (continued)
NEGERI State
Pudina Mint Selasih Basil Sirih Betel Vine
15
Luas Luas Pengeluaran Nilai Luas Luas Pengeluaran Nilai Luas Luas Pengeluaran Nilai Bertanam Berhasil Pengeluaran Bertanam Berhasil Pengeluaran Bertanam Berhasil Pengeluaran
Planted Harvested Production Production Planted Harvested Production Production Planted Harvested Production Productionarea area Value area area Value area area Value (Ha) (Ha) (Mt) (RM '000) (Ha) (Ha) (Mt) (RM '000) (Ha) (Ha) (Mt) (RM '000)
JOHOR - - - - 7.00 0.00 0.00 - 175.77 164.17 436.65 1,657.43 KEDAH - - - - - 30.71 30.71 56.30 178.63 KELANTAN - - - - 1.60 0.40 2.64 - 1.60 0.40 5.42 - MELAKA - - - - - 5.60 5.60 58.68 71.58 NEGERI SEMBILAN 1.40 0.80 13.75 - 0.10 0.10 0.03 - 9.10 8.50 45.69 - PAHANG - - - - - - - - 71.17 64.28 1,174.22 2,305.44 PERAK - - - - - - - - 6.74 6.74 75.17 4.70 PERLIS - - - - - - - - - - - - PULAU PINANG - - - - - - - - 0.20 0.20 4.20 - SELANGOR 6.90 6.90 34.00 - - - - - 78.20 77.80 1,004.77 1,366.73 TERENGGANU - - - - 20.00 20.00 20.00 - 54.60 49.50 63.54 84.42 SEM. MALAYSIAPeninsular MalaysiaSABAH - - - - - - - - - - - - SARAWAK - - - - - - - - - - - - W.P. LABUAN - - - - - - - - - - - - MALAYSIA TIMUREast MalaysiaMALAYSIA 8.30 7.70 47.75 - 28.70 20.50 22.67 - 433.69 407.90 2,924.64 5,668.93
- - - - - - - - - - - -
22.67 - 433.69 407.90 2,924.64 5,668.938.30 7.70 47.75 - 28.70 20.50
JADUAL 2-2 : KELUASAN, PENGELUARAN DAN NILAI PENGELUARAN HERBA LAIN MENGIKUT NEGERI, MALAYSIA, 2017 (sambungan)Table 2-2 : Hectareage, Production and Value of Production Of Other Herbs By State, Malaysia, 2017 (continued)
NEGERI State
Terung Pipit Turkey Berry Tongkat Ali Long Jack Jumlah Total
16
Luas Luas Nilai Luas Luas Nilai Luas Luas Nilai NEGERI Bertanam Berhasil Pengeluaran Bertanam Berhasil Pengeluaran Bertanam Berhasil PengeluaranState Planted Harvested Production Production Planted Harvested Production Production Planted Harvested Production Production
Area Area Value Area Area Value Area Area Value(Ha) (Ha) (Mt) (RM '000) (Ha) (Ha) (Mt) (RM '000) (Ha) (Ha) (Mt) (RM '000)
JOHOR 32.62 32.62 151.20 982.81 2.00 2.00 16.83 83.83 - - - - KEDAH 30.11 29.99 28.34 184.21 1.27 1.27 3.92 19.52 - - - - KELANTAN 26.53 25.13 212.57 1,381.70 64.18 37.76 444.93 2,215.75 MELAKA 7.50 7.40 158.82 1,032.32 - - - - - - - - NEGERI SEMBILAN - - - - 0.50 0.17 2.98 14.82 - - - - PAHANG 209.83 172.76 1,786.11 11,609.75 469.88 450.16 9,274.96 46,189.28 - - - - PERAK 7.80 7.80 45.83 297.88 10.02 10.02 195.50 973.59 - - - - PERLIS - - - - - - - - - - - - PULAU PINANG - - - - 1.00 1.00 19.80 98.60 - - - - SELANGOR - - - - 88.70 86.50 1,093.16 5,443.95 - - - - TERENGGANU 36.20 34.20 48.10 312.65 - - - - - - - - SEM. MALAYSIAPeninsular MalaysiaSABAH 4.20 2.70 7.10 46.15 154.20 94.80 670.70 3,340.09 2.20 1.00 0.40 - SARAWAK - - - - 322.50 290.30 2,555.90 12,728.38 - - - - W.P. LABUAN - - - - - - - - - - - - MALAYSIA TIMUREast Malaysia
NEGERI StateJOHOR 29.70 26.70 142.00 461.49 72.10 49.20 557.14 1,755.01 517.92 442.67 6,648.11 19,611.94 KEDAH 29.17 28.90 38.80 126.10 5.15 5.12 11.56 36.43 202.61 199.78 290.04 855.61 KELANTAN 110.44 68.22 850.22 2,763.20 87.86 60.42 944.65 2,975.64 8.80 2.62 33.28 98.18 MELAKA 0.10 - - - 0.30 0.30 3.42 10.77 14.42 11.93 425.13 1,254.14 NEGERI SEMBILAN - - - - - - - - 142.32 73.22 806.19 2,378.27 PAHANG 133.00 94.69 870.16 2,828.01 59.93 51.66 486.37 1,532.06 166.22 141.52 1,048.31 3,092.51 PERAK 4.91 4.85 50.87 165.32 0.41 0.31 2.94 2.94 152.84 128.44 2,861.62 8,441.79 PERLIS - - - - - - - - 0.29 0.29 1.35 3.98 PULAU PINANG - - - - - - - - 7.15 6.53 59.68 176.05 SELANGOR 94.80 89.60 1,274.96 4,143.62 70.60 66.10 992.95 3,127.79 32.90 29.60 376.48 1,110.61 TERENGGANU 8.20 8.20 83.37 270.95 11.76 10.26 61.62 194.10 - - - - SEM. MALAYSIAPeninsular MalaysiaSABAH 54.00 52.00 310.30 91.98 13.00 8.00 28.00 88.20 136.00 121.80 741.80 2,182.41 SARAWAK - - - - - - - - 178.20 121.40 847.60 2,500.42 W.P. LABUAN - - - - - - - - 0.10 0.10 3.30 9.74 MALAYSIA TIMUREast Malaysia
41,715.64 251.37 3,088.65 9,722.95 1,559.77 1,279.90 14,142.89 MALAYSIA 464.32 373.16 3,620.67 10,850.67 321.11
28.00 88.20 314.30 243.30 1,592.70 4,692.57 54.00 52.00 310.30 91.98 13.00 8.00
3,060.65 9,634.75 1,245.47 1,036.60 12,550.19 37,023.07 410.32 321.16 3,310.37 10,758.70 308.11 243.37
-
Kunyit Lengkuas Limau Kasturi Tumeric Galangal Calamondin Lime
973.98 14,278.67 71,107.80 2.20 1.00 0.40 MALAYSIA 354.79 312.60 2,438.07 15,847.47 1,114.25
3,226.60 16,068.47 2.20 1.00 0.40 - 4.20 2.70 7.10 46.15 476.70 385.10
JADUAL 2-3 : KELUASAN, PENGELUARAN DAN NILAI PENGELUARAN REMPAH-RATUS UTAMA MENGIKUT NEGERI, MALAYSIA, 2017Table 2-3 : Hectareage, Production and Value Of Production Of Spices By State, Malaysia, 2017
Bunga Kantan Pink Cone Ginger Halia Ginger Kayu Manis Cinnamon
Pengeluaran Pengeluaran Pengeluaran
11,052.07 55,039.33 - - - - 350.59 309.90 2,430.97 15,801.32 637.55 588.88
17
Luas Luas Nilai Luas Luas Nilai Luas Luas Nilai NEGERI Bertanam Berhasil Pengeluaran Bertanam Berhasil Pengeluaran Bertanam Berhasil PengeluaranState Planted Harvested Production Production Planted Harvested Production Production Planted Harvested Production Production
Area Area Value Area Area Value Area Area Value(Ha) (Ha) (Mt) (RM '000) (Ha) (Ha) (Mt) (RM '000) (Ha) (Ha) (Mt) (RM '000)
JOHOR 141.20 112.10 1,056.58 3,064.10 590.67 493.40 5,118.23 14,996.41 1,386.21 1,158.69 13,690.10 40,955.57 KEDAH 122.86 114.17 364.53 1,057.14 194.47 171.78 546.12 1,600.12 585.64 551.01 1,283.31 3,879.12 KELANTAN 215.52 123.60 1,210.31 3,509.89 84.90 61.46 655.61 1,920.94 598.23 379.21 4,351.56 14,865.31 MELAKA 6.03 6.03 77.75 225.47 56.77 55.93 681.48 1,996.73 85.12 81.59 1,346.59 4,519.43 NEGERI SEMBILAN 117.66 41.61 297.81 863.65 116.42 111.24 1,475.91 4,324.43 376.90 226.24 2,582.89 7,581.16 PAHANG 491.79 382.13 1,871.61 5,427.68 443.95 301.01 2,347.38 6,877.84 1,974.60 1,593.93 17,684.90 77,557.13 PERAK 84.48 58.72 534.31 1,549.49 56.99 51.00 571.65 1,674.93 317.45 261.14 4,262.71 13,105.93 PERLIS - - - - - - - - 0.29 0.29 1.35 3.98 PULAU PINANG 0.25 0.25 0.46 1.33 8.04 7.84 122.79 359.78 16.44 15.62 202.73 635.77 SELANGOR 89.82 86.45 1,037.38 3,008.40 72.72 67.26 782.26 2,292.03 449.54 425.51 5,557.19 19,126.40 TERENGGANU 37.36 31.92 292.44 848.07 125.60 115.90 813.34 2,383.08 219.12 200.48 1,298.87 4,008.85 SEM. MALAYSIAPeninsular MalaysiaSABAH 21.20 21.20 65.00 188.50 63.70 55.90 556.90 1,586.30 448.50 357.40 2,380.20 7,523.62 SARAWAK 42.50 32.90 152.80 443.12 - - - - 543.20 444.60 3,556.30 15,671.92 W.P. LABUAN - - - - 3.80 0.90 2.50 7.33 3.90 1.00 5.80 17.06 MALAYSIA TIMUREast Malaysia
MALAYSIA 1,370.67 1,011.08 6,960.98 20,186.83 1,818.03 1,493.62 13,674.17 40,019.90
186,238.65
63.70 54.10 217.80 631.62 67.50
7,005.14 5,696.71 58,204.51 209,451.25
23,212.61 56.80 559.40 1,593.63 995.60 803.00 5,942.30
Pengeluaran Pengeluaran Pengeluaran
1,306.97 956.98 6,743.18 19,555.21 1,750.53 1,436.82 13,114.77 38,426.27 6,009.54 4,893.71 52,262.21
JADUAL 2-3: KELUASAN, PENGELUARAN DAN NILAI PENGELUARAN REMPAH-RATUS UTAMA MENGIKUT NEGERI, MALAYSIA, 2017 (sambungan)Table 2-3 : Hectareage, Production and Value Of Production Of Spices By State, Malaysia, 2017 (continued)
Limau Nipis Lime Serai Lemon Grass Jumlah Total
18
Luas Luas Nilai Luas Luas Nilai Luas Luas Nilai NEGERI Bertanam Berhasil Pengeluaran Bertanam Berhasil Pengeluaran Bertanam Berhasil PengeluaranState Planted Harvested Production Production Planted Harvested Production Production Planted Harvested Production Production
Area Area Value Area Area Value Area Area Value(Ha) (Ha) (Mt) (RM '000) (Ha) (Ha) (Mt) (RM '000) (Ha) (Ha) (Mt) (RM '000)
JOHOR 8.00 8.00 2.29 - 7.00 7.00 0.60 - - - - - KEDAH 29.35 29.35 68.44 - 7.03 7.03 3.06 - - - - - KELANTAN 9.24 6.93 44.56 - - - - - - - - - MELAKA - - - - - - - - - - - - NEGERI SEMBILAN - - - - - - - - - - - - PAHANG 10.39 10.39 24.19 - - - - - - - - - PERAK 51.40 44.40 147.29 - - - - - - - - - PERLIS - - - - - - - - - - - - PULAU PINANG - - - - - - - - - - - - SELANGOR - - - - - - - - - - - - TERENGGANU - - - - - - - - - - - - SEM. MALAYSIAPeninsular MalaysiaSABAH - - - - - - SARAWAK - - - - - - - - 1.00 - - - W.P. LABUAN - - - - - - - - - - - - MALAYSIA TIMUREast Malaysia
NEGERI StateJOHOR 47.20 43.20 754.47 3,810.05 - - - - 2.60 2.60 5.90 - KEDAH 15.17 15.11 10.90 55.06 - - - - - - - - KELANTAN - - - - 0.04 0.04 0.35 - - - - - MELAKA - - - - - - - - - - - - NEGERI SEMBILAN 1.50 1.50 12.69 64.09 - - - - - - - - PAHANG 2.70 2.70 1.90 9.60 - - - - - - - - PERAK - - - - - - - - - - - - PERLIS 0.50 0.50 1.98 10.00 - - - - - - - - PULAU PINANG - - - - - - - - - - - - SELANGOR - - - - - - - - - - - - TERENGGANU - - - - - - - - - - - - SEM. MALAYSIAPeninsular MalaysiaSABAH - - 13.10 6.40 6.60 - SARAWAK - - - - - - - - - - - - W.P. LABUAN - - - - - - - - - - - - MALAYSIA TIMUREast Malaysia
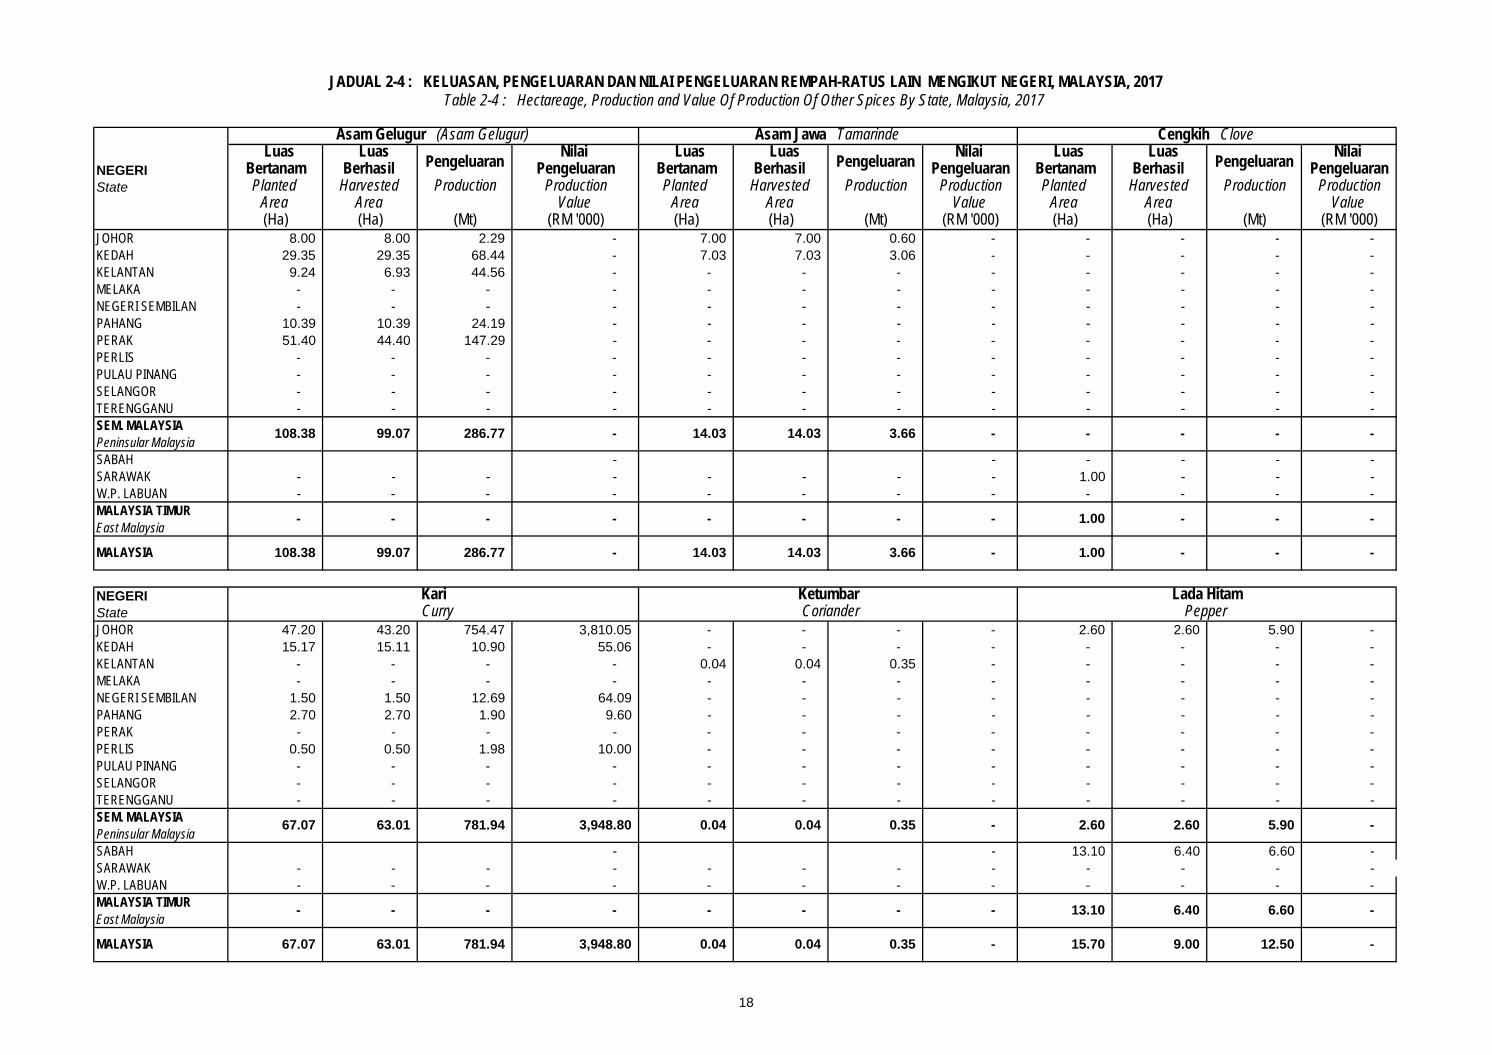
- 0.04 0.35 - 15.70 9.00 12.50 MALAYSIA 67.07 63.01 781.94 3,948.80 0.04
- - 13.10 6.40 6.60 - - - - - - -
0.35 - 2.60 2.60 5.90 - 67.07 63.01 781.94 3,948.80 0.04 0.04
-
Kari Ketumbar Lada Hitam Curry Coriander Pepper
14.03 3.66 - 1.00 - - MALAYSIA 108.38 99.07 286.77 - 14.03
- - 1.00 - - - - - - - - -
JADUAL 2-4 : KELUASAN, PENGELUARAN DAN NILAI PENGELUARAN REMPAH-RATUS LAIN MENGIKUT NEGERI, MALAYSIA, 2017Table 2-4 : Hectareage, Production and Value Of Production Of Other Spices By State, Malaysia, 2017
Asam Gelugur (Asam Gelugur) Asam Jawa Tamarinde Cengkih Clove
Pengeluaran Pengeluaran Pengeluaran
3.66 - - - - - 108.38 99.07 286.77 - 14.03 14.03
19
Luas Luas Nilai Luas Luas Nilai Luas Luas Nilai NEGERI Bertanam Berhasil Pengeluaran Bertanam Berhasil Pengeluaran Bertanam Berhasil PengeluaranState Planted Harvested Production Production Planted Harvested Production Production Planted Harvested Production Production
Area Area Value Area Area Value Area Area Value(Ha) (Ha) (Mt) (RM '000) (Ha) (Ha) (Mt) (RM '000) (Ha) (Ha) (Mt) (RM '000)
JOHOR 53.20 53.20 71.28 392.03 - - - - 3.40 3.20 7.61 22.84 KEDAH 7.98 7.38 8.24 45.29 - - - - 6.32 6.32 9.32 27.97 KELANTAN - - 2.87 15.78 - - - - - - - - MELAKA 0.30 0.30 2.31 12.73 - - - - - - - - NEGERI SEMBILAN 1.02 0.23 1.56 8.56 - - - - - - - - PAHANG 127.92 78.46 630.32 3,466.77 - - - - 0.15 0.09 0.16 0.48 PERAK 5.20 1.90 15.25 83.85 - - - - 0.30 0.30 1.12 3.36 PERLIS - - - - - - - - - - - - PULAU PINANG - - - - 23.26 23.26 94.59 - - - - - SELANGOR 23.65 23.65 205.61 1,130.84 - - - - 3.00 3.00 113.03 339.10 TERENGGANU - - - - - - - - 0.20 0.20 4.82 14.46 SEM. MALAYSIAPeninsular MalaysiaSABAH - - - SARAWAK - - - - - - - - - - - - W.P. LABUAN - - - - - - - - - - - - MALAYSIA TIMUREast Malaysia
NEGERI StateJOHOR 121.40 117.20 842.15 4,224.92 KEDAH 65.85 65.19 99.95 128.32 KELANTAN 9.28 6.97 47.78 15.78 MELAKA 0.30 0.30 2.31 12.73 NEGERI SEMBILAN 2.52 1.73 14.25 72.66 PAHANG 141.16 91.64 656.57 3,476.85 PERAK 56.90 46.60 163.66 87.21 PERLIS 0.50 0.50 1.98 10.00 PULAU PINANG 23.26 23.26 94.59 - SELANGOR 26.65 26.65 318.64 1,469.94 TERENGGANU 0.20 0.20 4.82 14.46 SEM. MALAYSIAPeninsular MalaysiaSABAH 13.10 6.40 6.60 - SARAWAK 1.00 - - - W.P. LABUAN - - - - MALAYSIA TIMUREast Malaysia
MALAYSIA 462.12 386.64 2,253.30 9,512.86
448.02 380.24 2,246.70 9,512.86
14.10 6.40 6.60 -
13.37
Jumlah Total
MALAYSIA 219.27 165.12 937.43 5,155.87 23.26 23.26 94.59 -
- - - - - -
408.20
- - - - -
13.11 136.07 408.20
Pengeluaran Pengeluaran Pengeluaran
219.27 165.12 937.43 5,155.87 23.26 23.26 94.59 - 13.37 13.11 136.07
JADUAL 2-4 : KELUASAN, PENGELUARAN DAN NILAI PENGELUARAN REMPAH-RATUS LAIN MENGIKUT NEGERI, MALAYSIA, 2017 (sambungan)Table 2-4 : Hectareage, Production and Value Of Production Of Other Spices By State, Malaysia, 2017 (continued)
Limau Purut Kaffir Lime Pala Nutmeg Selom (Selom)
BAHAGIAN 3
Section 3
KELUASAN, PENGELUARAN DAN NILAI PENGELUARAN TANAMAN
HERBA DAN REMPAH-RATUS, MENGIKUT JENIS, NEGERI DAN DAERAH, MALAYSIA,
2017
Hectareage, Production and Value of Production of Herbs and Spices
By Types, State and District, Malaysia, 2017
JOHOR
JOHORE
20
Luas Luas Pengeluaran Nilai Luas Luas Pengeluaran Nilai Luas Luas Pengeluaran Nilai Bertanam Berhasil Pengeluaran Bertanam Berhasil Pengeluaran Bertanam Berhasil Pengeluaran Planted Harvested Production Production Planted Harvested Production Production Planted Harvested Production Production
area area Value area area Value area area Value (Ha) (Ha) (Mt) (RM '000) (Ha) (Ha) (Mt) (RM '000) (Ha) (Ha) (Mt) (RM '000)
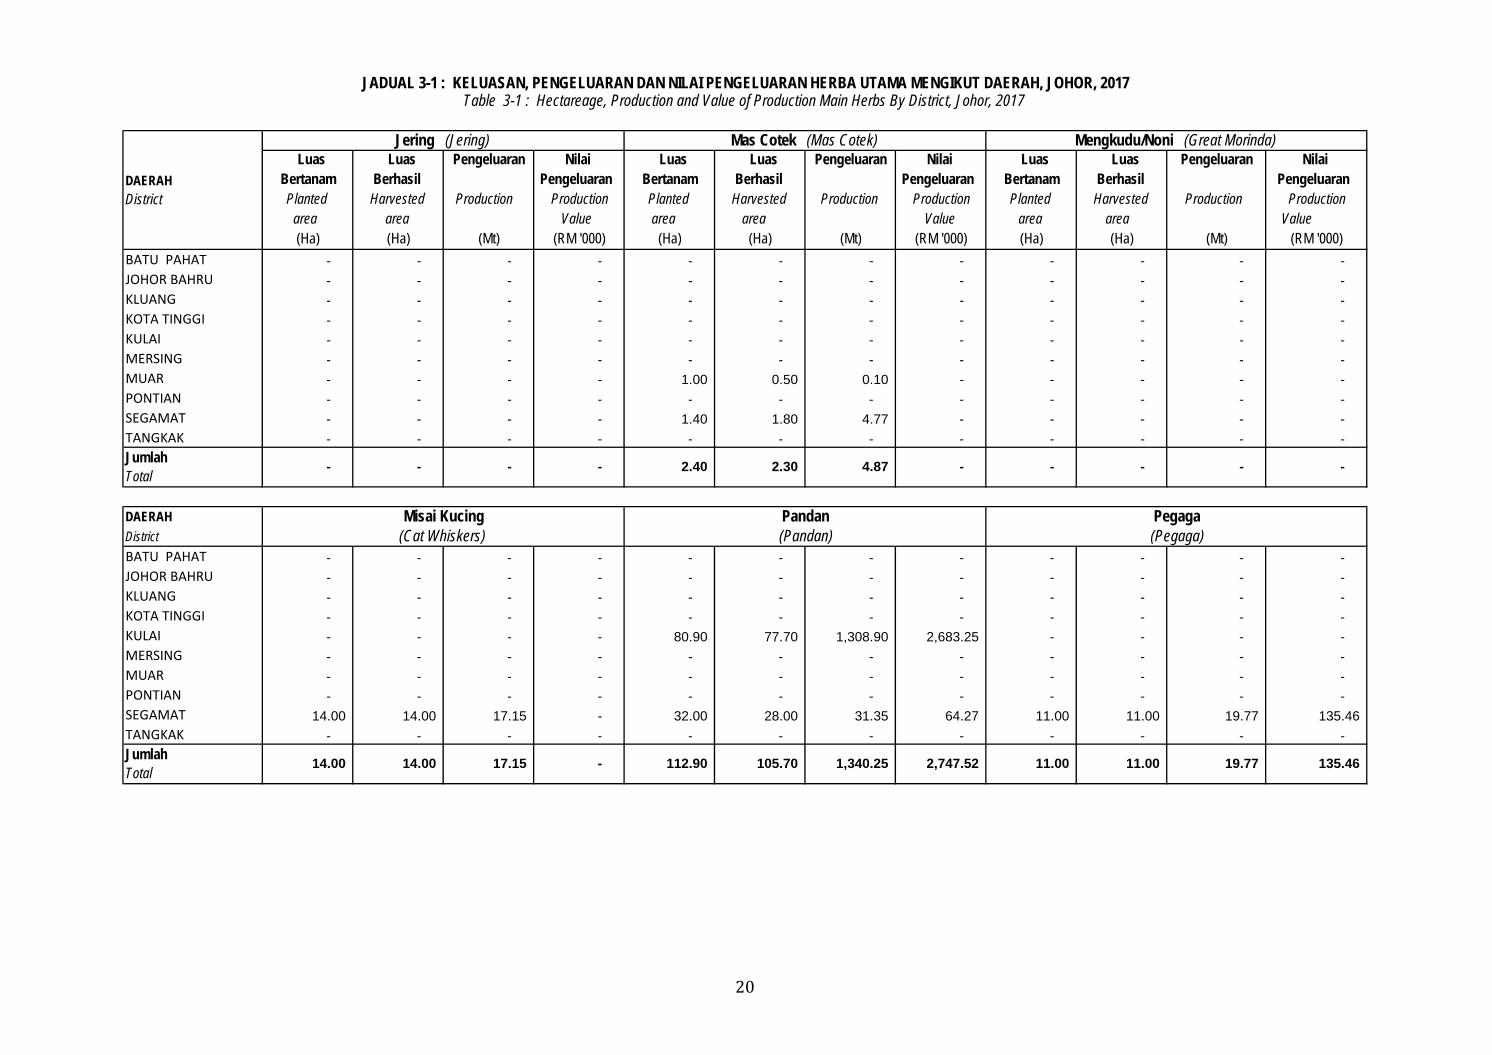
BATU PAHAT - - - - - - - - - - - - JOHOR BAHRU - - - - - - - - - - - - KLUANG - - - - - - - - - - - - KOTA TINGGI - - - - - - - - - - - - KULAI - - - - - - - - - - - - MERSING - - - - - - - - - - - - MUAR - - - - 1.00 0.50 0.10 - - - - - PONTIAN - - - - - - - - - - - - SEGAMAT - - - - 1.40 1.80 4.77 - - - - - TANGKAK - - - - - - - - - - - -
DAERAH DistrictBATU PAHAT - - - - - - - - - - - - JOHOR BAHRU - - - - - - - - - - - - KLUANG - - - - - - - - - - - - KOTA TINGGI - - - - - - - - - - - - KULAI - - - - 80.90 77.70 1,308.90 2,683.25 - - - - MERSING - - - - - - - - - - - - MUAR - - - - - - - - - - - - PONTIAN - - - - - - - - - - - - SEGAMAT 14.00 14.00 17.15 - 32.00 28.00 31.35 64.27 11.00 11.00 19.77 135.46 TANGKAK - - - - - - - - - - - -
- -
Jumlah Total
14.00 14.00 17.15 - 112.90 105.70 1,340.25 2,747.52 11.00 11.00 19.77 135.46
Jumlah Total
- - - - 2.40 2.30 4.87 -
(Cat Whiskers) (Pandan) (Pegaga)
- -
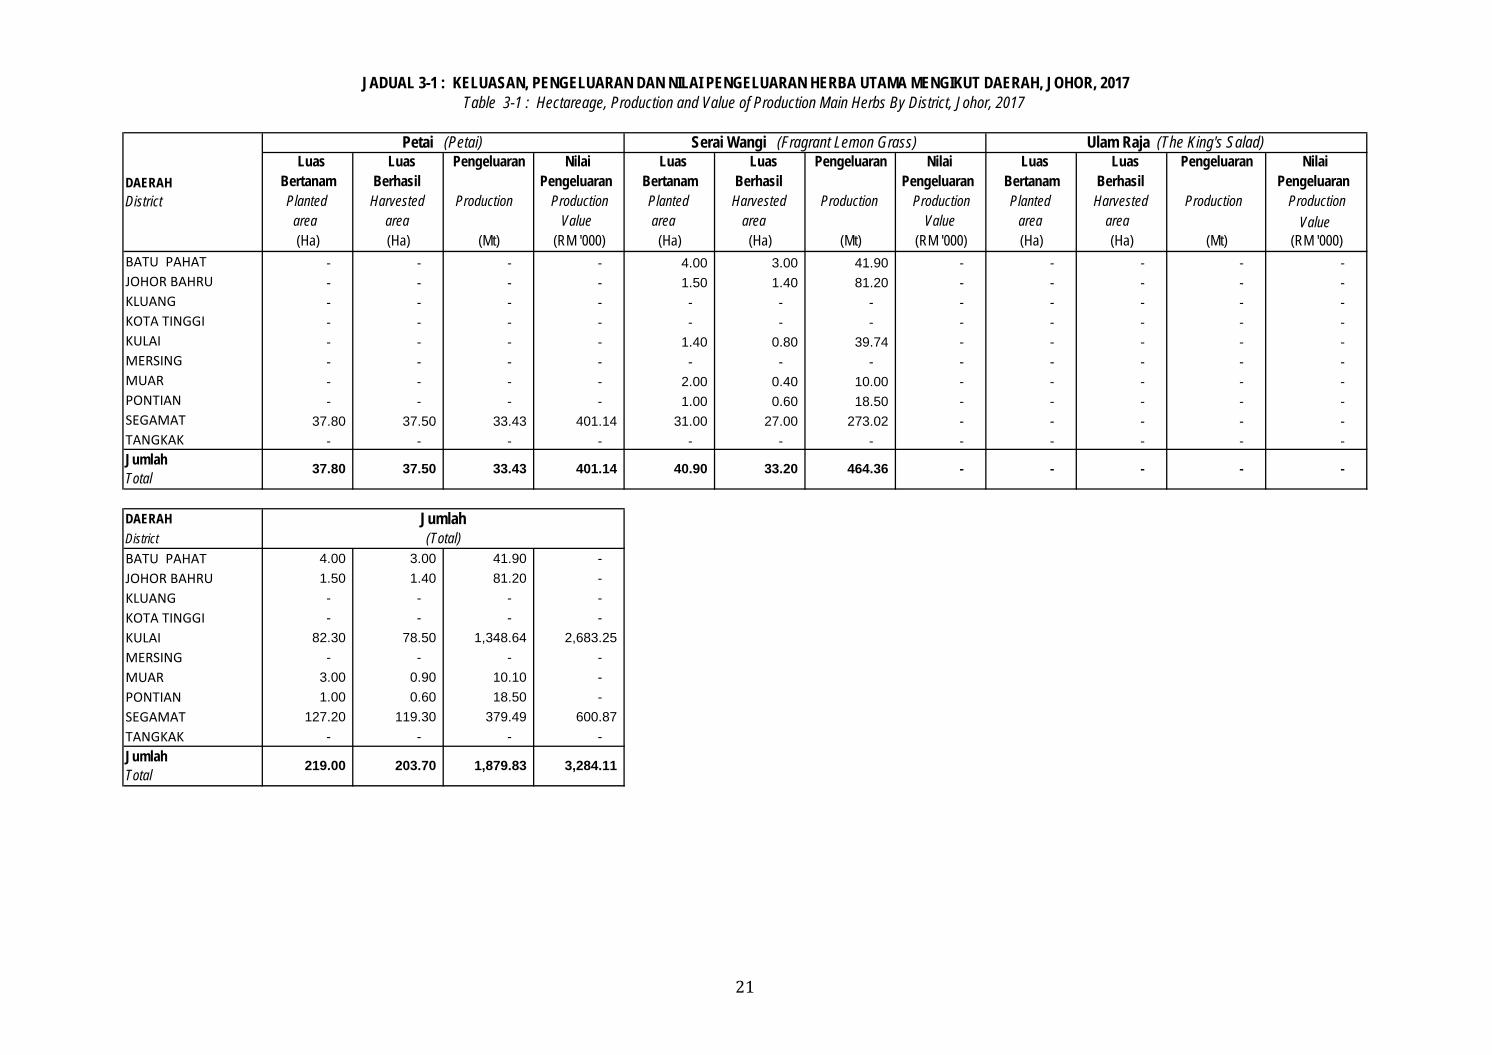
JADUAL 3-1 : KELUASAN, PENGELUARAN DAN NILAI PENGELUARAN HERBA UTAMA MENGIKUT DAERAH, JOHOR, 2017Table 3-1 : Hectareage, Production and Value of Production Main Herbs By District, Johor, 2017
DAERAH District
Jering (Jering) Mas Cotek (Mas Cotek) Mengkudu/Noni (Great Morinda)
Misai Kucing Pandan Pegaga
21
Luas Luas Pengeluaran Nilai Luas Luas Pengeluaran Nilai Luas Luas Pengeluaran Nilai Bertanam Berhasil Pengeluaran Bertanam Berhasil Pengeluaran Bertanam Berhasil Pengeluaran Planted Harvested Production Production Planted Harvested Production Production Planted Harvested Production Production
area area Value area area Value area area Value (Ha) (Ha) (Mt) (RM '000) (Ha) (Ha) (Mt) (RM '000) (Ha) (Ha) (Mt) (RM '000)
BATU PAHAT - - - - 4.00 3.00 41.90 - - - - - JOHOR BAHRU - - - - 1.50 1.40 81.20 - - - - - KLUANG - - - - - - - - - - - - KOTA TINGGI - - - - - - - - - - - - KULAI - - - - 1.40 0.80 39.74 - - - - - MERSING - - - - - - - - - - - - MUAR - - - - 2.00 0.40 10.00 - - - - - PONTIAN - - - - 1.00 0.60 18.50 - - - - - SEGAMAT 37.80 37.50 33.43 401.14 31.00 27.00 273.02 - - - - - TANGKAK - - - - - - - - - - - -
DAERAH DistrictBATU PAHAT 4.00 3.00 41.90 - JOHOR BAHRU 1.50 1.40 81.20 - KLUANG - - - - KOTA TINGGI - - - - KULAI 82.30 78.50 1,348.64 2,683.25 MERSING - - - - MUAR 3.00 0.90 10.10 - PONTIAN 1.00 0.60 18.50 - SEGAMAT 127.20 119.30 379.49 600.87 TANGKAK - - - -
- 37.80 33.43 401.14 40.90 33.20 464.36 - - 37.50 -
219.00 203.70 1,879.83 3,284.11
Jumlah (Total)
JADUAL 3-1 : KELUASAN, PENGELUARAN DAN NILAI PENGELUARAN HERBA UTAMA MENGIKUT DAERAH, JOHOR, 2017Table 3-1 : Hectareage, Production and Value of Production Main Herbs By District, Johor, 2017
DAERAH District
Petai (Petai) Serai Wangi (Fragrant Lemon Grass) Ulam Raja (The King's Salad)
Jumlah Total
-
Jumlah Total
22
Luas Luas Pengeluaran Nilai Luas Luas Pengeluaran Nilai Luas Luas Pengeluaran Nilai Bertanam Berhasil Pengeluaran Bertanam Berhasil Pengeluaran Bertanam Berhasil Pengeluaran Planted Harvested Production Production Planted Harvested Production Production Planted Harvested Production Production
area area Value area area Value area area Value (Ha) (Ha) (Mt) (RM '000) (Ha) (Ha) (Mt) (RM '000) (Ha) (Ha) (Mt) (RM '000)
BATU PAHAT - - - - 0.17 0.17 0.63 2.21 - - - - JOHOR BAHRU - - - - - - - - - - - - KLUANG - - - - - - - - - - - - KOTA TINGGI - - - - - - - - - - - - KULAI - - - - - - - - - - - - MERSING - - - - - - - - - - - - MUAR - - - - - - - - - - - - PONTIAN - - - - - - - - - - - - SEGAMAT 2.00 2.00 4.01 - 46.00 46.00 80.03 280.10 7.00 5.80 11.18 - TANGKAK - - - - 4.80 4.80 13.20 46.20 - - - -
DAERAH DistrictBATU PAHAT - - - - 0.10 0.10 0.14 - - - - - JOHOR BAHRU - - - - - - - - 0.10 0.10 0.07 - KLUANG - - - - - - - - - - - - KOTA TINGGI - - - - - - - - 35.00 35.00 13.76 - KULAI 1.40 1.40 1.80 8.82 - - - - - - - - MERSING - - - - - - - - - - - - MUAR - - - - - - - - - - - - PONTIAN - - - - - - - - - - - - SEGAMAT 49.40 46.20 269.41 1,320.10 - - - - - - - - TANGKAK - - - - - - - - - - - -
-
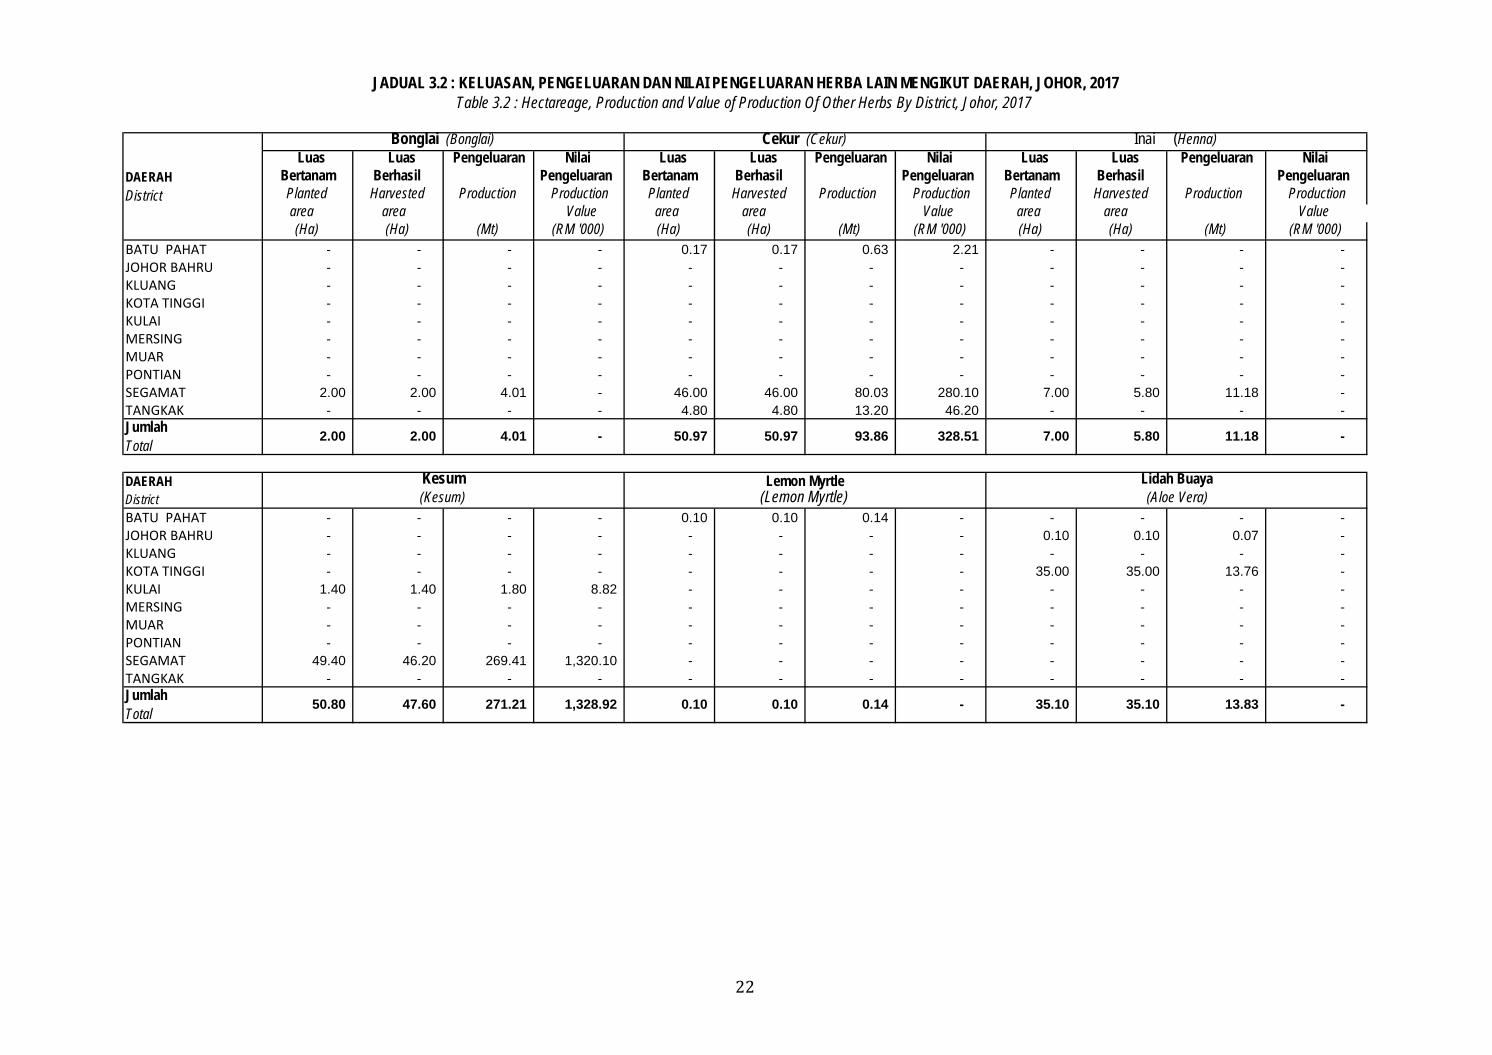
Table 3.2 : Hectareage, Production and Value of Production Of Other Herbs By District, Johor, 2017
Jumlah Total
Jumlah Total
50.80 47.60 271.21 1,328.92
Kesum Lemon Myrtle Lidah Buaya (Kesum) (Lemon Myrtle) (Aloe Vera)
13.83 0.10 0.10 0.14 - 35.10 35.10
DAERAH District
Bonglai (Bonglai) Cekur (Cekur) Inai (Henna)
2.00 2.00 4.01 - 50.97 50.97 93.86 328.51 7.00 5.80 11.18 -
JADUAL 3.2 : KELUASAN, PENGELUARAN DAN NILAI PENGELUARAN HERBA LAIN MENGIKUT DAERAH, JOHOR, 2017
23
Luas Luas Pengeluaran Nilai Luas Luas Pengeluaran Nilai Luas Luas Pengeluaran Nilai Bertanam Berhasil Pengeluaran Bertanam Berhasil Pengeluaran Bertanam Berhasil Pengeluaran Planted Harvested Production Production Planted Harvested Production Production Planted Harvested Production Production
area area Value area area Value area area Value (Ha) (Ha) (Mt) (RM '000) (Ha) (Ha) (Mt) (RM '000) (Ha) (Ha) (Mt) (RM '000)
BATU PAHAT - - - - - - - - - - - - JOHOR BAHRU - - - - - - - - - - - - KLUANG - - - - - - - - - - - - KOTA TINGGI - - - - - - - - - - - - KULAI - - - - - - - - - - - - MERSING - - - - - - - - - - - - MUAR - - - - - - - - - - - - PONTIAN - - - - 2.00 2.00 5.10 - - - - - SEGAMAT 0.80 0.60 7.95 - 8.00 8.00 18.07 - 8.00 8.00 0.89 - TANGKAK - - - - - - - - - - - -
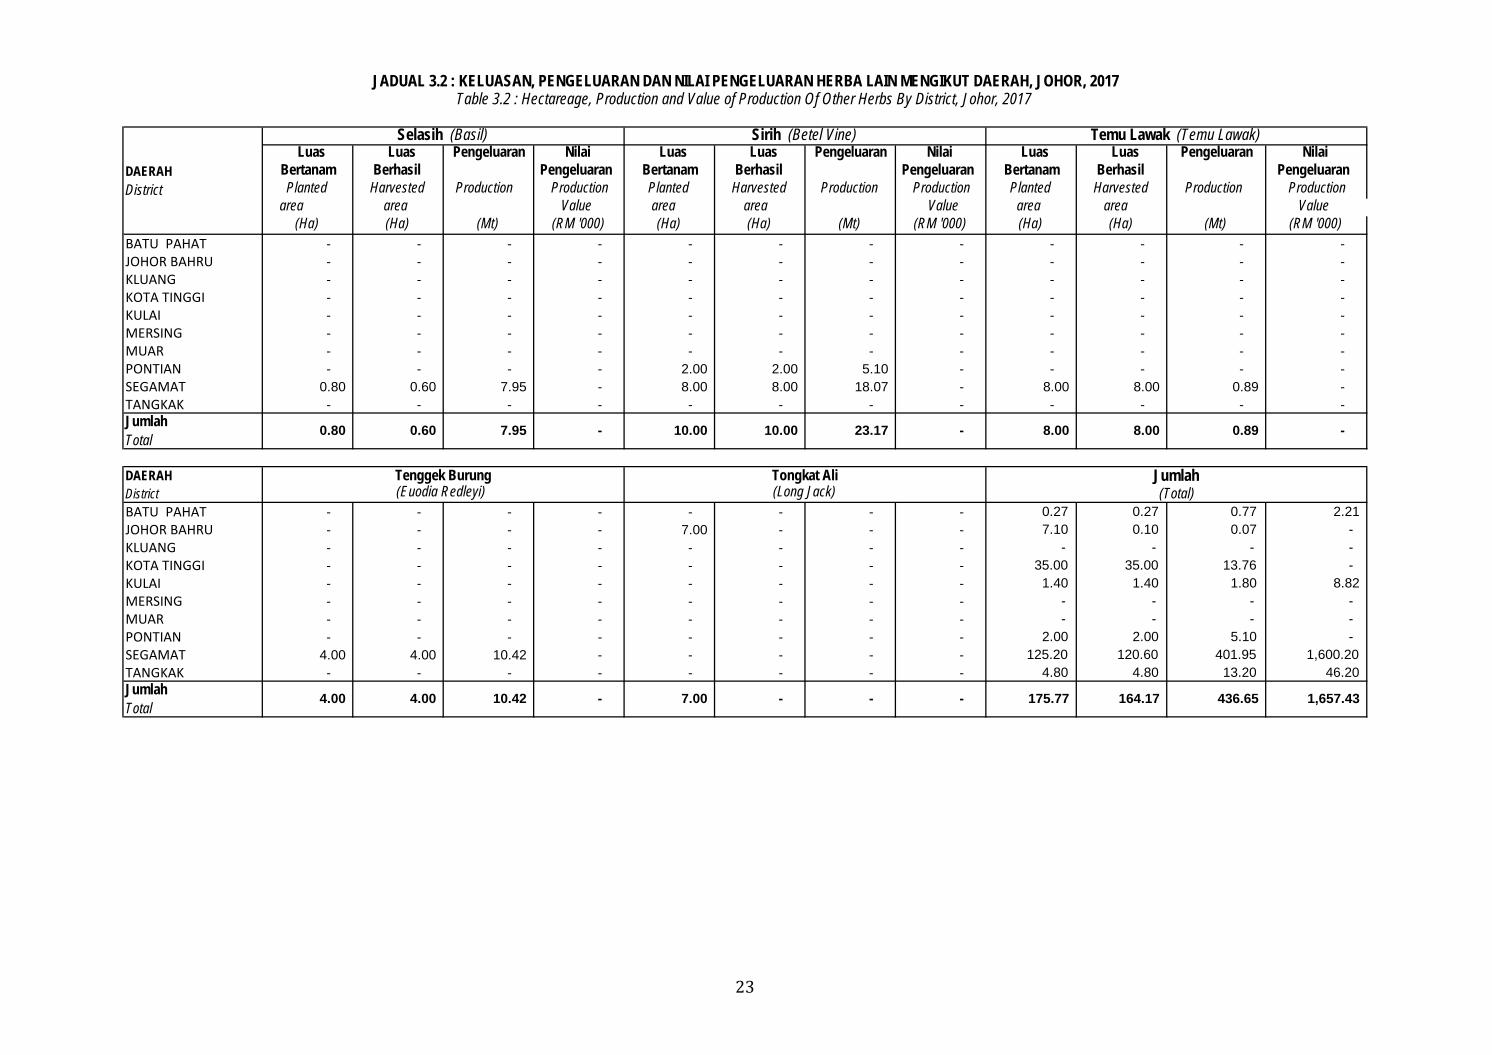
DAERAH DistrictBATU PAHAT - - - - - - - - 0.27 0.27 0.77 2.21 JOHOR BAHRU - - - - 7.00 - - - 7.10 0.10 0.07 - KLUANG - - - - - - - - - - - - KOTA TINGGI - - - - - - - - 35.00 35.00 13.76 - KULAI - - - - - - - - 1.40 1.40 1.80 8.82 MERSING - - - - - - - - - - - - MUAR - - - - - - - - - - - - PONTIAN - - - - - - - - 2.00 2.00 5.10 - SEGAMAT 4.00 4.00 10.42 - - - - - 125.20 120.60 401.95 1,600.20 TANGKAK - - - - - - - - 4.80 4.80 13.20 46.20
7.00 - - -
Jumlah
Jumlah Total
4.00 4.00 10.42 - 175.77 164.17 436.65 1,657.43
(Euodia Redleyi) (Total)
Temu Lawak (Temu Lawak)
23.17 - 8.00 8.00 0.89 - Jumlah Total
0.80 0.60 7.95
Tongkat Ali (Long Jack)
- 10.00 10.00
Tenggek Burung
JADUAL 3.2 : KELUASAN, PENGELUARAN DAN NILAI PENGELUARAN HERBA LAIN MENGIKUT DAERAH, JOHOR, 2017Table 3.2 : Hectareage, Production and Value of Production Of Other Herbs By District, Johor, 2017
DAERAH District
Selasih (Basil) Sirih (Betel Vine)
24
Luas Luas Pengeluaran Nilai Luas Luas Pengeluaran Nilai Luas Luas Pengeluaran Nilai Bertanam Berhasil Pengeluaran Bertanam Berhasil Pengeluaran Bertanam Berhasil Pengeluaran Planted Harvested Production Production Planted Harvested Production Production Planted Harvested Production Production
area area Value area area Value area area Value (Ha) (Ha) (Mt) (RM '000) (Ha) (Ha) (Mt) (RM '000) (Ha) (Ha) (Mt) (RM '000)
BATU PAHAT - - - - - - - - 9.40 9.40 54.74 355.84 JOHOR BAHRU - - - - - - - - 0.42 0.42 3.60 23.40 KLUANG - - - - - - - - - - - - KOTA TINGGI - - - - - - - - 0.60 0.60 16.44 106.84 KULAI - - - - - - - - 2.00 2.00 29.20 189.80 MERSING - - - - - - - - - - - - MUAR - - - - - - - - - - - - PONTIAN - - - - - - - - 1.20 1.20 2.73 17.73 SEGAMAT 8.00 8.00 2.29 - 7.00 7.00 0.60 - 19.00 19.00 44.49 289.20 TANGKAK - - - - - - - - - - - -
DAERAH BATU PAHAT - - - - - - - - - - - - JOHOR BAHRU - - - - - - - - - - - - KLUANG - - - - - - - - 24.00 20.00 747.10 3,772.86 KOTA TINGGI - - - - - - - - - - - - KULAI - - - - - - - - 18.80 18.80 6.30 31.82 MERSING - - - - - - - - - - - - MUAR - - - - - - - - - - - - PONTIAN - - - - - - - - - - - - SEGAMAT - - - - 2.00 2.00 16.83 83.83 4.40 4.40 1.07 5.38 TANGKAK - - - - - - - - - - - -
DAERAH BATU PAHAT - - - - - - - - - - - - JOHOR BAHRU - - - - - - - - - - - - KLUANG - - - - - - - - - - - - KOTA TINGGI - - - - - - - - - - - - KULAI - - - - - - - - - - - - MERSING - - - - - - - - - - - - MUAR - - - - - - - - - - - - PONTIAN - - - - - - - - 1.00 1.00 19.00 61.75 SEGAMAT - - - - - - - - 28.70 25.70 123.00 399.74 TANGKAK - - - - - - - - - - - -
754.47 3,810.05
32.62
26.70
7.00 2.29 32.62
29.70
Cengkih Clove
- -
-
Kari Curry
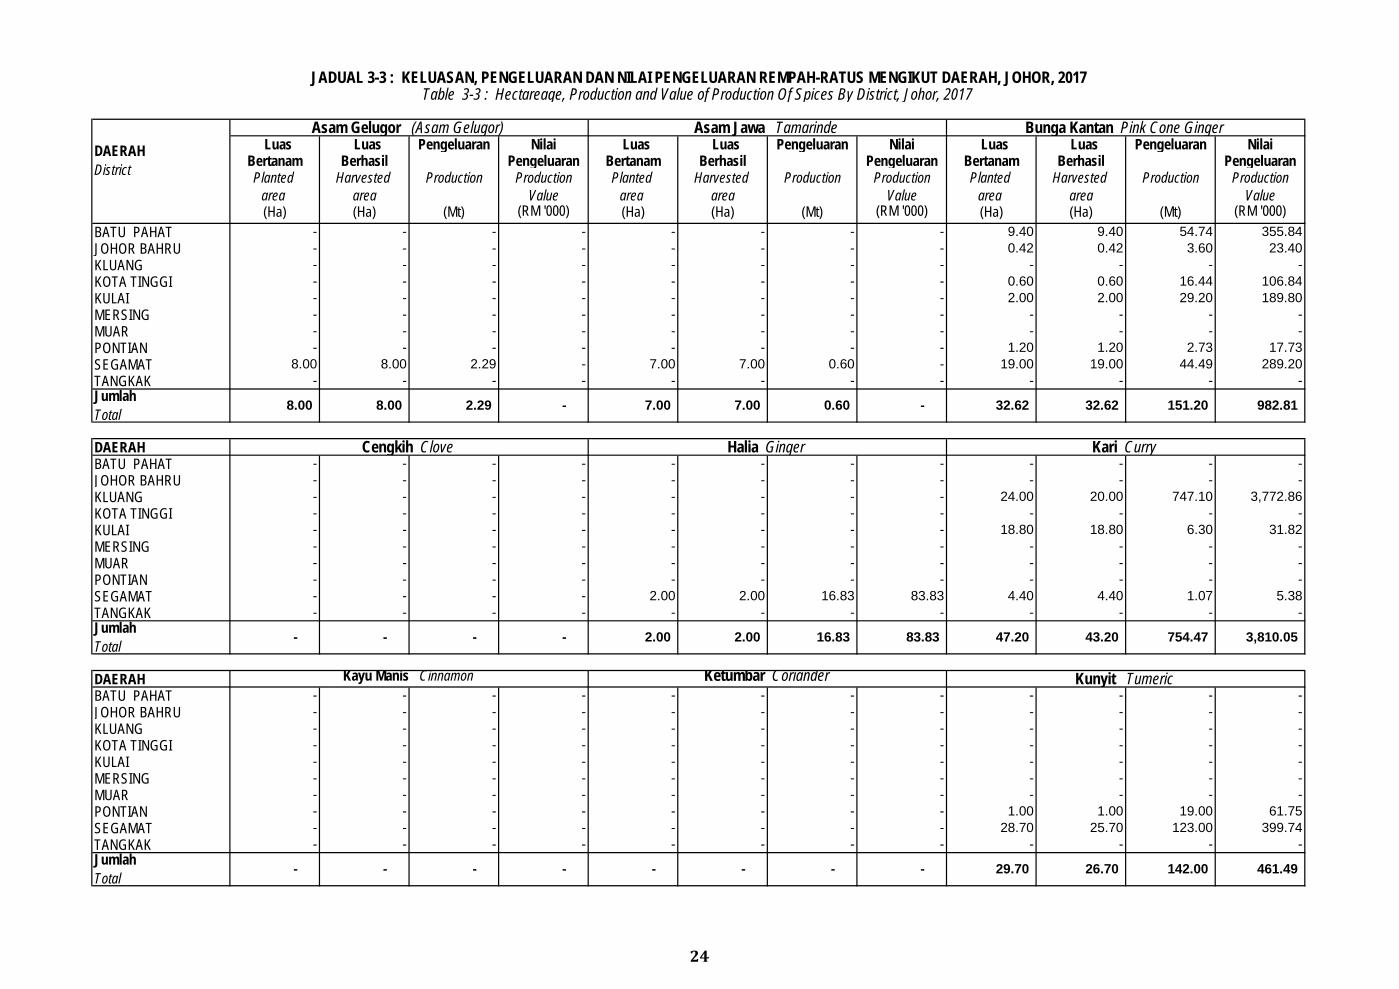
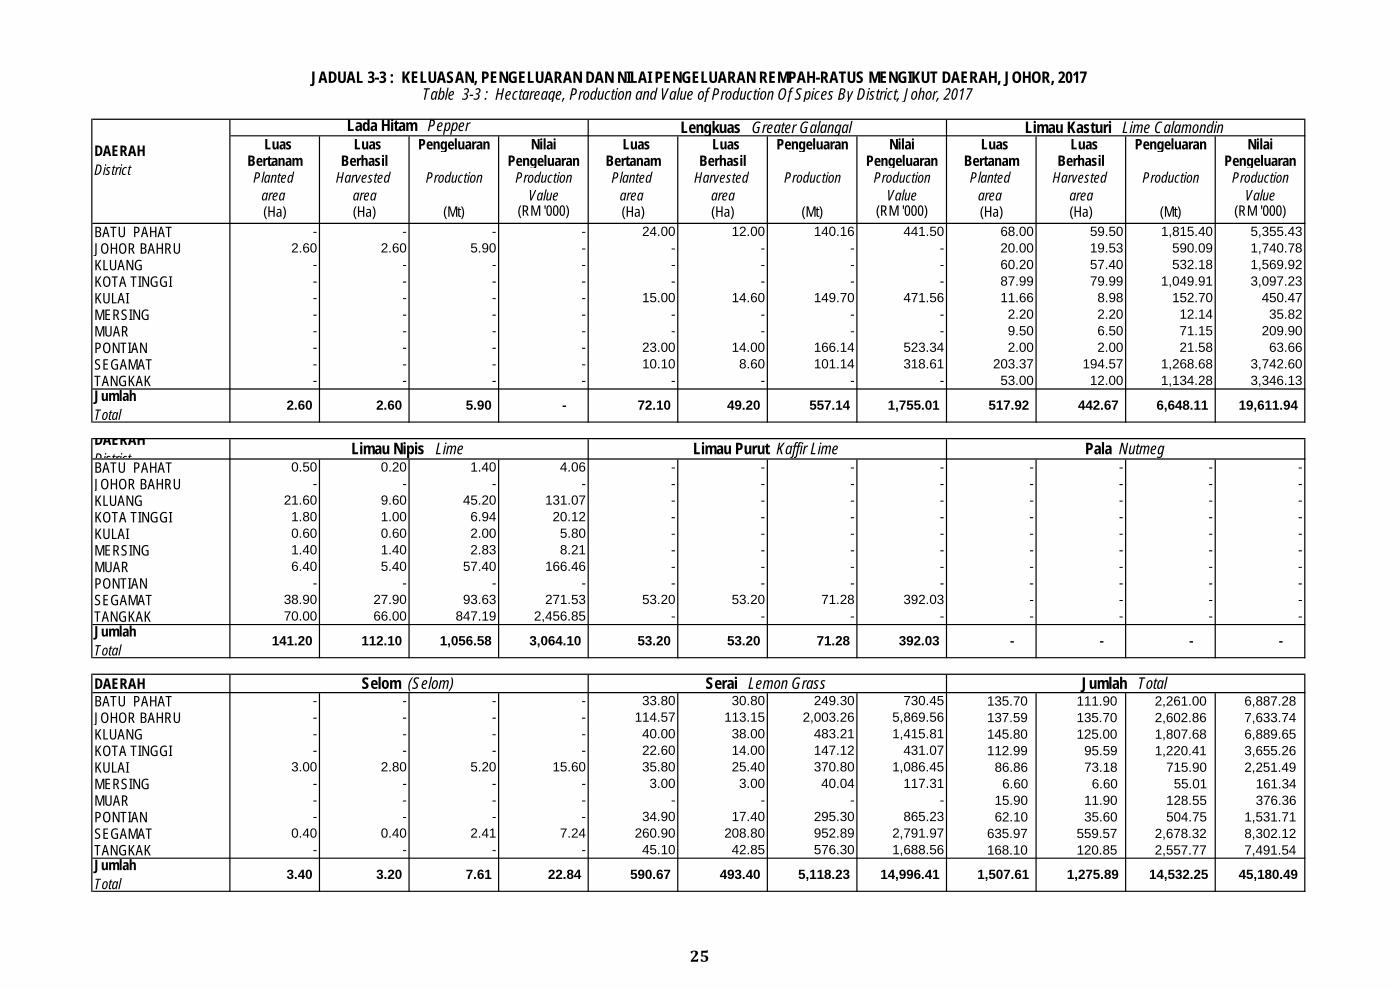
JADUAL 3-3 : KELUASAN, PENGELUARAN DAN NILAI PENGELUARAN REMPAH-RATUS MENGIKUT DAERAH, JOHOR, 2017Table 3-3 : Hectareage, Production and Value of Production Of Spices By District, Johor, 2017
DAERAH District
Asam Gelugor (Asam Gelugor) Asam Jawa Tamarinde Bunga Kantan Pink Cone Ginger
- - 151.20 982.81
2.00 2.00 16.83
Jumlah Total
Jumlah Total
Halia Ginger
47.20 43.20
Kunyit Tumeric
142.00 461.49 - -
Jumlah Total
Ketumbar Coriander
- - - -
7.00 0.60
- -
-
Kayu Manis Cinnamon
8.00 8.00
83.83
25
Luas Luas Pengeluaran Nilai Luas Luas Pengeluaran Nilai Luas Luas Pengeluaran Nilai Bertanam Berhasil Pengeluaran Bertanam Berhasil Pengeluaran Bertanam Berhasil Pengeluaran Planted Harvested Production Production Planted Harvested Production Production Planted Harvested Production Production
area area Value area area Value area area Value (Ha) (Ha) (Mt) (RM '000) (Ha) (Ha) (Mt) (RM '000) (Ha) (Ha) (Mt) (RM '000)
BATU PAHAT - - - - 24.00 12.00 140.16 441.50 68.00 59.50 1,815.40 5,355.43 JOHOR BAHRU 2.60 2.60 5.90 - - - - - 20.00 19.53 590.09 1,740.78 KLUANG - - - - - - - - 60.20 57.40 532.18 1,569.92 KOTA TINGGI - - - - - - - - 87.99 79.99 1,049.91 3,097.23 KULAI - - - - 15.00 14.60 149.70 471.56 11.66 8.98 152.70 450.47 MERSING - - - - - - - - 2.20 2.20 12.14 35.82 MUAR - - - - - - - - 9.50 6.50 71.15 209.90 PONTIAN - - - - 23.00 14.00 166.14 523.34 2.00 2.00 21.58 63.66 SEGAMAT - - - - 10.10 8.60 101.14 318.61 203.37 194.57 1,268.68 3,742.60 TANGKAK - - - - - - - - 53.00 12.00 1,134.28 3,346.13
DAERAH DistrictBATU PAHAT 0.50 0.20 1.40 4.06 - - - - - - - - JOHOR BAHRU - - - - - - - - - - - - KLUANG 21.60 9.60 45.20 131.07 - - - - - - - - KOTA TINGGI 1.80 1.00 6.94 20.12 - - - - - - - - KULAI 0.60 0.60 2.00 5.80 - - - - - - - - MERSING 1.40 1.40 2.83 8.21 - - - - - - - - MUAR 6.40 5.40 57.40 166.46 - - - - - - - - PONTIAN - - - - - - - - - - - - SEGAMAT 38.90 27.90 93.63 271.53 53.20 53.20 71.28 392.03 - - - - TANGKAK 70.00 66.00 847.19 2,456.85 - - - - - - - -
DAERAH BATU PAHAT - - - - 33.80 30.80 249.30 730.45 135.70 111.90 2,261.00 6,887.28 JOHOR BAHRU - - - - 114.57 113.15 2,003.26 5,869.56 137.59 135.70 2,602.86 7,633.74 KLUANG - - - - 40.00 38.00 483.21 1,415.81 145.80 125.00 1,807.68 6,889.65 KOTA TINGGI - - - - 22.60 14.00 147.12 431.07 112.99 95.59 1,220.41 3,655.26 KULAI 3.00 2.80 5.20 15.60 35.80 25.40 370.80 1,086.45 86.86 73.18 715.90 2,251.49 MERSING - - - - 3.00 3.00 40.04 117.31 6.60 6.60 55.01 161.34 MUAR - - - - - - - - 15.90 11.90 128.55 376.36 PONTIAN - - - - 34.90 17.40 295.30 865.23 62.10 35.60 504.75 1,531.71 SEGAMAT 0.40 0.40 2.41 7.24 260.90 208.80 952.89 2,791.97 635.97 559.57 2,678.32 8,302.12 TANGKAK - - - - 45.10 42.85 576.30 1,688.56 168.10 120.85 2,557.77 7,491.54
Pala Nutmeg
49.20
Jumlah Total
141.20 112.10 1,056.58 3,064.10
Limau Purut Kaffir Lime
442.67
53.20
2.60
Jumlah Total
Limau Kasturi Lime Calamondin
Table 3-3 : Hectareage, Production and Value of Production Of Spices By District, Johor, 2017
Limau Nipis Lime
Selom (Selom)
53.20
2.60
Serai Lemon Grass
71.28 392.03
3.40
Lengkuas Greater Galangal
Jumlah Total
- - - -
5,118.23 14,996.41 1,507.61 1,275.89 14,532.25 45,180.49 493.40 3.20 7.61 22.84 590.67
5.90 - 72.10 1,755.01 517.92 6,648.11 19,611.94 557.14
JADUAL 3-3 : KELUASAN, PENGELUARAN DAN NILAI PENGELUARAN REMPAH-RATUS MENGIKUT DAERAH, JOHOR, 2017
Jumlah Total
DAERAH District
Lada Hitam Pepper
KEDAH
KEDAH
26
Luas Luas Pengeluaran Nilai Luas Luas Pengeluaran Nilai Luas Luas Pengeluaran Nilai Bertanam Berhasil Pengeluaran Bertanam Berhasil Pengeluaran Bertanam Berhasil Pengeluaran Planted Harvested Production Production Planted Harvested Production Production Planted Harvested Production Production
area area Value area area Value area area Value (Ha) (Ha) (Mt) (RM '000) (Ha) (Ha) (Mt) (RM '000) (Ha) (Ha) (Mt) (RM '000)
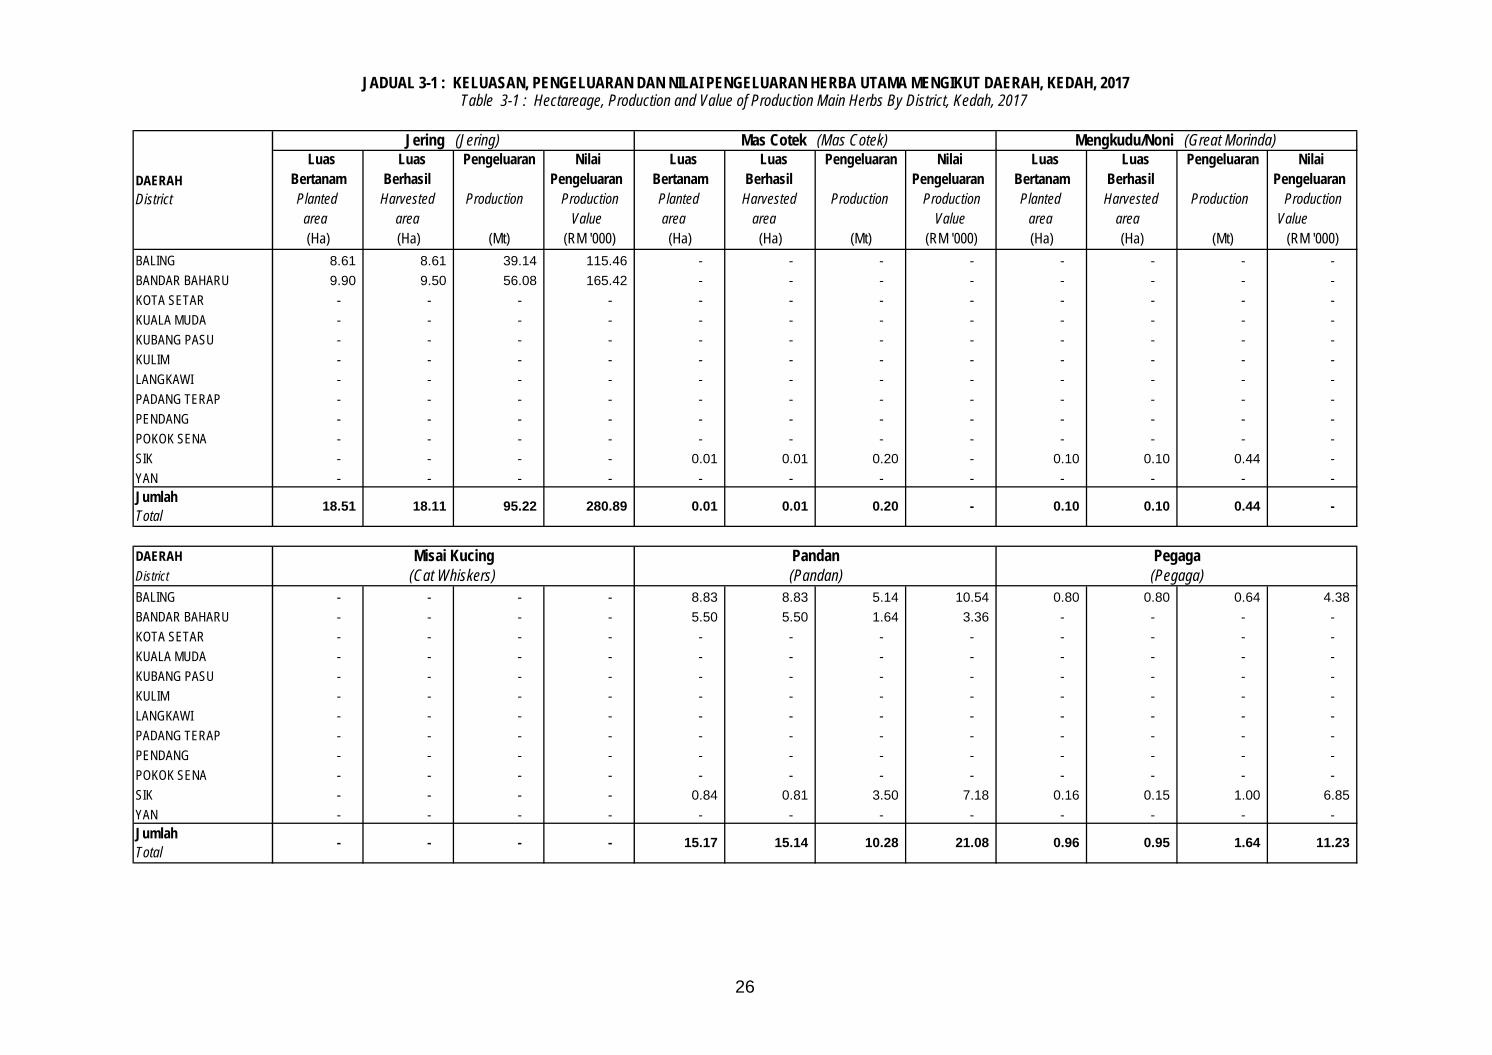
BALING 8.61 8.61 39.14 115.46 - - - - - - - - BANDAR BAHARU 9.90 9.50 56.08 165.42 - - - - - - - - KOTA SETAR - - - - - - - - - - - - KUALA MUDA - - - - - - - - - - - - KUBANG PASU - - - - - - - - - - - - KULIM - - - - - - - - - - - - LANGKAWI - - - - - - - - - - - - PADANG TERAP - - - - - - - - - - - - PENDANG - - - - - - - - - - - - POKOK SENA - - - - - - - - - - - - SIK - - - - 0.01 0.01 0.20 - 0.10 0.10 0.44 - YAN - - - - - - - - - - - -
DAERAH DistrictBALING - - - - 8.83 8.83 5.14 10.54 0.80 0.80 0.64 4.38 BANDAR BAHARU - - - - 5.50 5.50 1.64 3.36 - - - - KOTA SETAR - - - - - - - - - - - - KUALA MUDA - - - - - - - - - - - - KUBANG PASU - - - - - - - - - - - - KULIM - - - - - - - - - - - - LANGKAWI - - - - - - - - - - - - PADANG TERAP - - - - - - - - - - - - PENDANG - - - - - - - - - - - - POKOK SENA - - - - - - - - - - - - SIK - - - - 0.84 0.81 3.50 7.18 0.16 0.15 1.00 6.85 YAN - - - - - - - - - - - -
-
Misai Kucing Pandan Pegaga (Cat Whiskers) (Pandan) (Pegaga)
Jumlah Total
- - - - 15.17 15.14 10.28 21.08 0.96 0.95 1.64 11.23
JADUAL 3-1 : KELUASAN, PENGELUARAN DAN NILAI PENGELUARAN HERBA UTAMA MENGIKUT DAERAH, KEDAH, 2017Table 3-1 : Hectareage, Production and Value of Production Main Herbs By District, Kedah, 2017
DAERAH District
Jering (Jering) Mas Cotek (Mas Cotek) Mengkudu/Noni (Great Morinda)
Jumlah Total
18.51 18.11 95.22 280.89 0.01 0.01 0.20 - 0.10 0.10 0.44
27
Luas Luas Pengeluaran Nilai Luas Luas Pengeluaran Nilai Luas Luas Pengeluaran Nilai Bertanam Berhasil Pengeluaran Bertanam Berhasil Pengeluaran Bertanam Berhasil Pengeluaran Planted Harvested Production Production Planted Harvested Production Production Planted Harvested Production Production
area area Value area area Value area area Value (Ha) (Ha) (Mt) (RM '000) (Ha) (Ha) (Mt) (RM '000) (Ha) (Ha) (Mt) (RM '000)
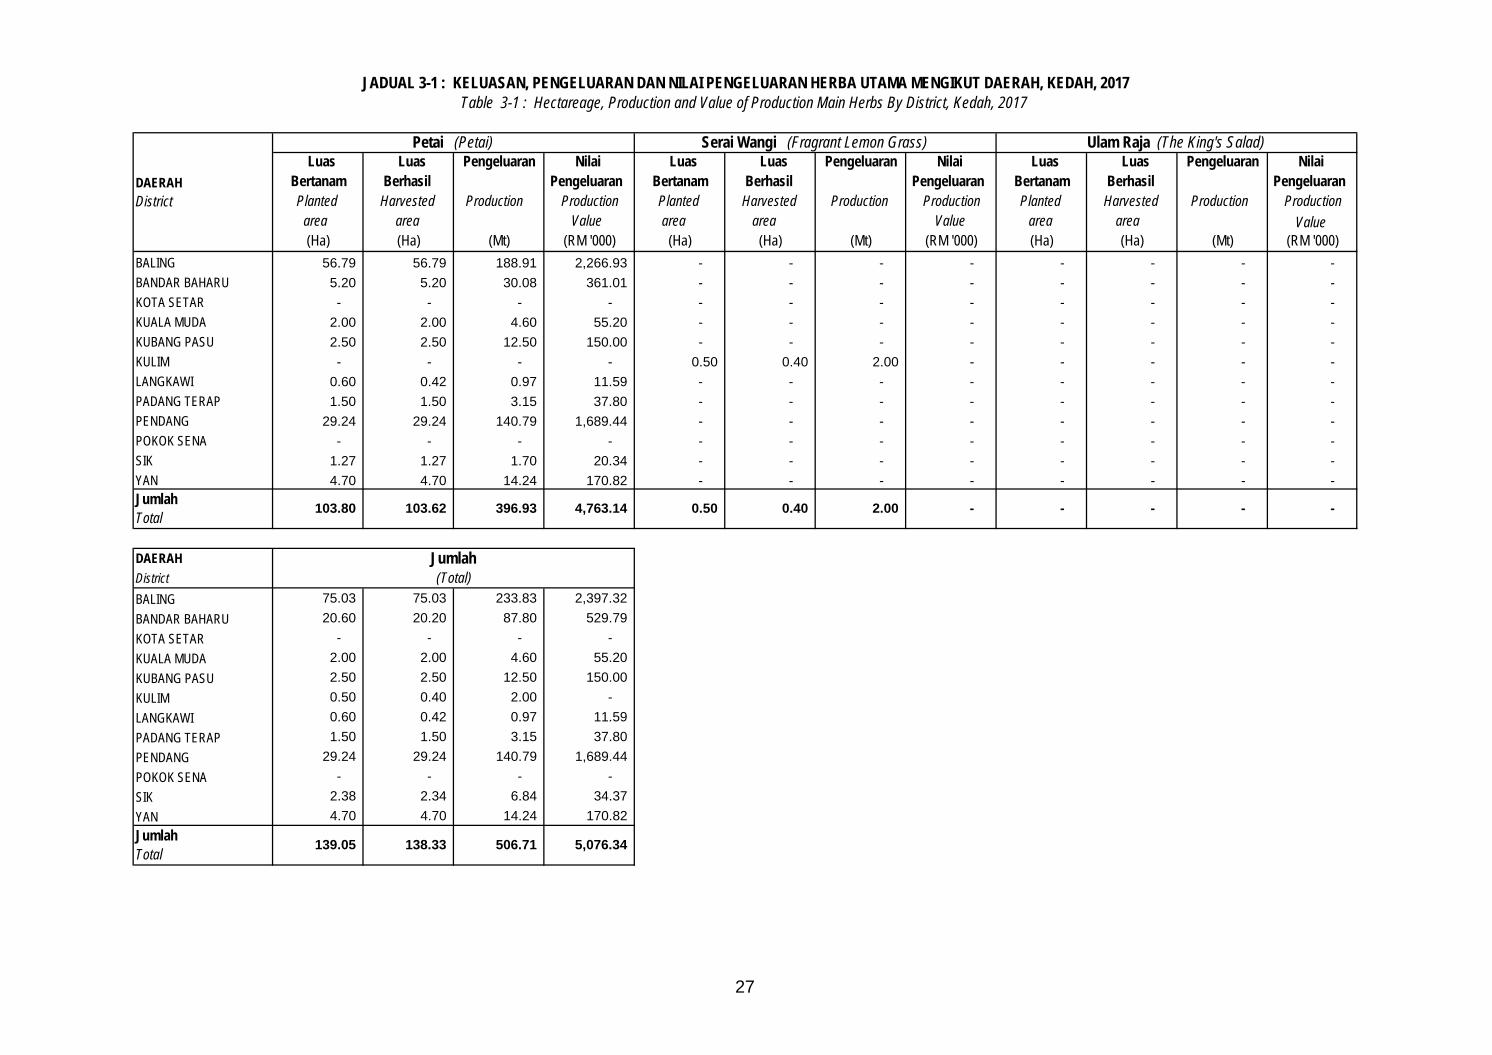
BALING 56.79 56.79 188.91 2,266.93 - - - - - - - - BANDAR BAHARU 5.20 5.20 30.08 361.01 - - - - - - - - KOTA SETAR - - - - - - - - - - - - KUALA MUDA 2.00 2.00 4.60 55.20 - - - - - - - - KUBANG PASU 2.50 2.50 12.50 150.00 - - - - - - - - KULIM - - - - 0.50 0.40 2.00 - - - - - LANGKAWI 0.60 0.42 0.97 11.59 - - - - - - - - PADANG TERAP 1.50 1.50 3.15 37.80 - - - - - - - - PENDANG 29.24 29.24 140.79 1,689.44 - - - - - - - - POKOK SENA - - - - - - - - - - - - SIK 1.27 1.27 1.70 20.34 - - - - - - - - YAN 4.70 4.70 14.24 170.82 - - - - - - - -
DAERAH DistrictBALING 75.03 75.03 233.83 2,397.32 BANDAR BAHARU 20.60 20.20 87.80 529.79 KOTA SETAR - - - - KUALA MUDA 2.00 2.00 4.60 55.20 KUBANG PASU 2.50 2.50 12.50 150.00 KULIM 0.50 0.40 2.00 - LANGKAWI 0.60 0.42 0.97 11.59 PADANG TERAP 1.50 1.50 3.15 37.80 PENDANG 29.24 29.24 140.79 1,689.44 POKOK SENA - - - - SIK 2.38 2.34 6.84 34.37 YAN 4.70 4.70 14.24 170.82
Jumlah (Total)
Jumlah Total
139.05 138.33 506.71 5,076.34
JADUAL 3-1 : KELUASAN, PENGELUARAN DAN NILAI PENGELUARAN HERBA UTAMA MENGIKUT DAERAH, KEDAH, 2017Table 3-1 : Hectareage, Production and Value of Production Main Herbs By District, Kedah, 2017
DAERAH District
Petai (Petai) Serai Wangi (Fragrant Lemon Grass) Ulam Raja (The King's Salad)
Jumlah Total
103.80 103.62 396.93 4,763.14 0.50 0.40 2.00 - - - - -
28
Luas Luas Pengeluaran Nilai Luas Luas Pengeluaran Nilai Luas Luas Pengeluaran Nilai Bertanam Berhasil Pengeluaran Bertanam Berhasil Pengeluaran Bertanam Berhasil Pengeluaran Planted Harvested Production Production Planted Harvested Production Production Planted Harvested Production Production
area area Value area area Value area area Value (Ha) (Ha) (Mt) (RM '000) (Ha) (Ha) (Mt) (RM '000) (Ha) (Ha) (Mt) (RM '000)
BALING - - - - - - - - - - - - BANDAR BAHARU - - - - - - - - - - - - KOTA SETAR - - - - - - - - - - - - KUALA MUDA - - - - - - - - - - - - KUBANG PASU - - - - - - - - - - - - KULIM - - - - - - - - - - - - LANGKAWI - - - - - - - - - - - - PADANG TERAP - - - - - - - - - - - - PENDANG - - - - - - - - - - - - POKOK SENA - - - - - - - - - - - - SIK 0.28 0.28 0.50 1.74 0.02 0.02 0.10 - 0.20 0.20 2.00 - YAN - - - - - - - - - - - -
DAERAH DistrictBALING 2.00 2.00 1.35 - - - - - - - - - BANDAR BAHARU - - - - - - - - - - - - KOTA SETAR - - - - - - - - - - - - KUALA MUDA - - - - - - - - - - - - KUBANG PASU - - - - - - - - - - - - KULIM - - - - - - - - - - - - LANGKAWI - - - - - - - - - - - - PADANG TERAP - - - - - - - - - - - - PENDANG - - - - - - - - - - - - POKOK SENA - - - - - - - - - - - - SIK 0.33 0.33 0.93 - 0.02 0.02 0.35 - 0.26 0.26 1.38 - YAN - - - - - - - - - - - - Jumlah Total
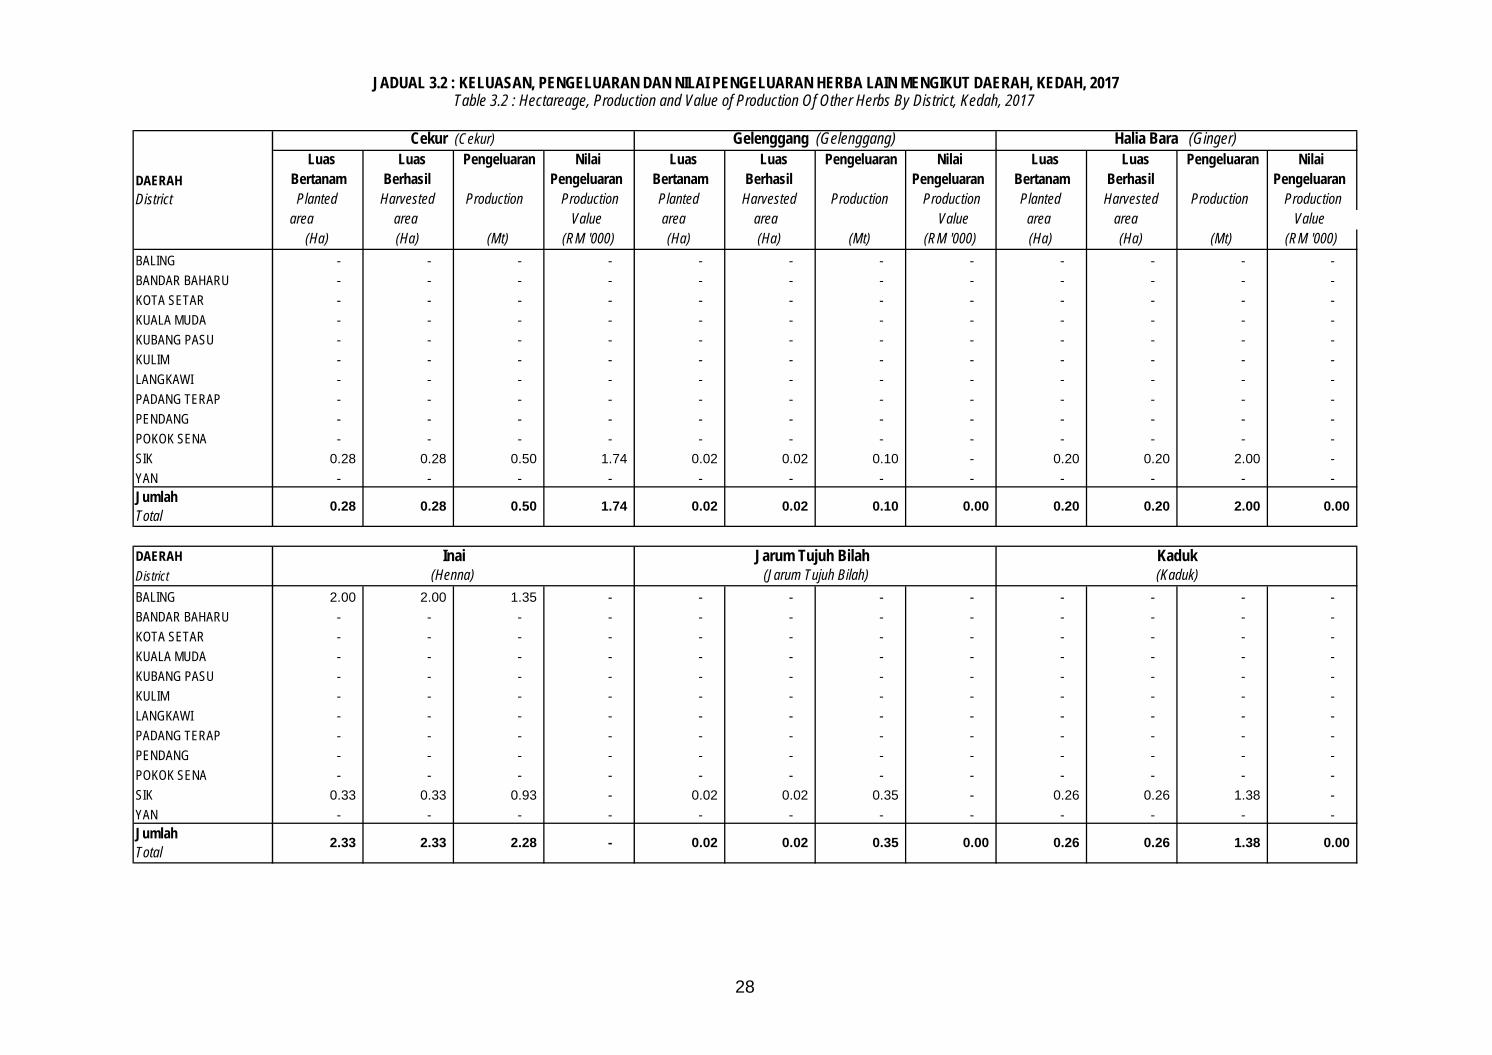
2.33 2.33 2.28 - 0.02 0.02 0.35 0.00
Jarum Tujuh Bilah Kaduk (Henna) (Jarum Tujuh Bilah) (Kaduk)
0.26 0.26 1.38 0.00
JADUAL 3.2 : KELUASAN, PENGELUARAN DAN NILAI PENGELUARAN HERBA LAIN MENGIKUT DAERAH, KEDAH, 2017Table 3.2 : Hectareage, Production and Value of Production Of Other Herbs By District, Kedah, 2017
DAERAH District
Cekur (Cekur) Gelenggang (Gelenggang) Halia Bara (Ginger)
Jumlah Total
0.28 0.28 0.50 1.74 0.02 0.02 0.10 0.00 0.20 0.20 2.00 0.00
Inai
29
Luas Luas Pengeluaran Nilai Luas Luas Pengeluaran Nilai Luas Luas Pengeluaran Nilai Bertanam Berhasil Pengeluaran Bertanam Berhasil Pengeluaran Bertanam Berhasil Pengeluaran Planted Harvested Production Production Planted Harvested Production Production Planted Harvested Production Production
area area Value area area Value area area Value (Ha) (Ha) (Mt) (RM '000) (Ha) (Ha) (Mt) (RM '000) (Ha) (Ha) (Mt) (RM '000)
BALING 10.60 10.60 4.14 20.26 0.04 0.04 0.03 - 5.00 5.00 3.50 - BANDAR BAHARU 6.30 6.30 28.75 140.89 - - - - - - - - KOTA SETAR - - - - - - - - - - - - KUALA MUDA - - - - - - - - - - - - KUBANG PASU - - - - - - - - - - - - KULIM - - - - - - - - - - - - LANGKAWI - - - - - - - - - - - - PADANG TERAP - - - - - - - - - - - - PENDANG - - - - - - - - - - - - POKOK SENA - - - - - - - - - - - - SIK 0.84 0.84 3.21 15.73 - - - - 0.05 0.05 0.46 - YAN - - - - - - - - - - - -
DAERAH DistrictBALING 0.50 0.50 1.60 - - - - - 3.00 3.00 1.70 - BANDAR BAHARU - - - - - - - - - - - - KOTA SETAR - - - - - - - - - - - - KUALA MUDA - - - - - - - - 1.00 1.00 5.22 - KUBANG PASU - - - - - - - - - - - - KULIM - - - - - - - - - - - - LANGKAWI - - - - - - - - - - - - PADANG TERAP - - - - - - - - - - - - PENDANG - - - - - - - - - - - - POKOK SENA - - - - - - - - - - - - SIK - - - - 0.18 0.18 0.54 - 0.09 0.09 0.55 - YAN - - - - - - - - - - - -
Lidah Buaya (Aloe Vera)
Jumlah Total
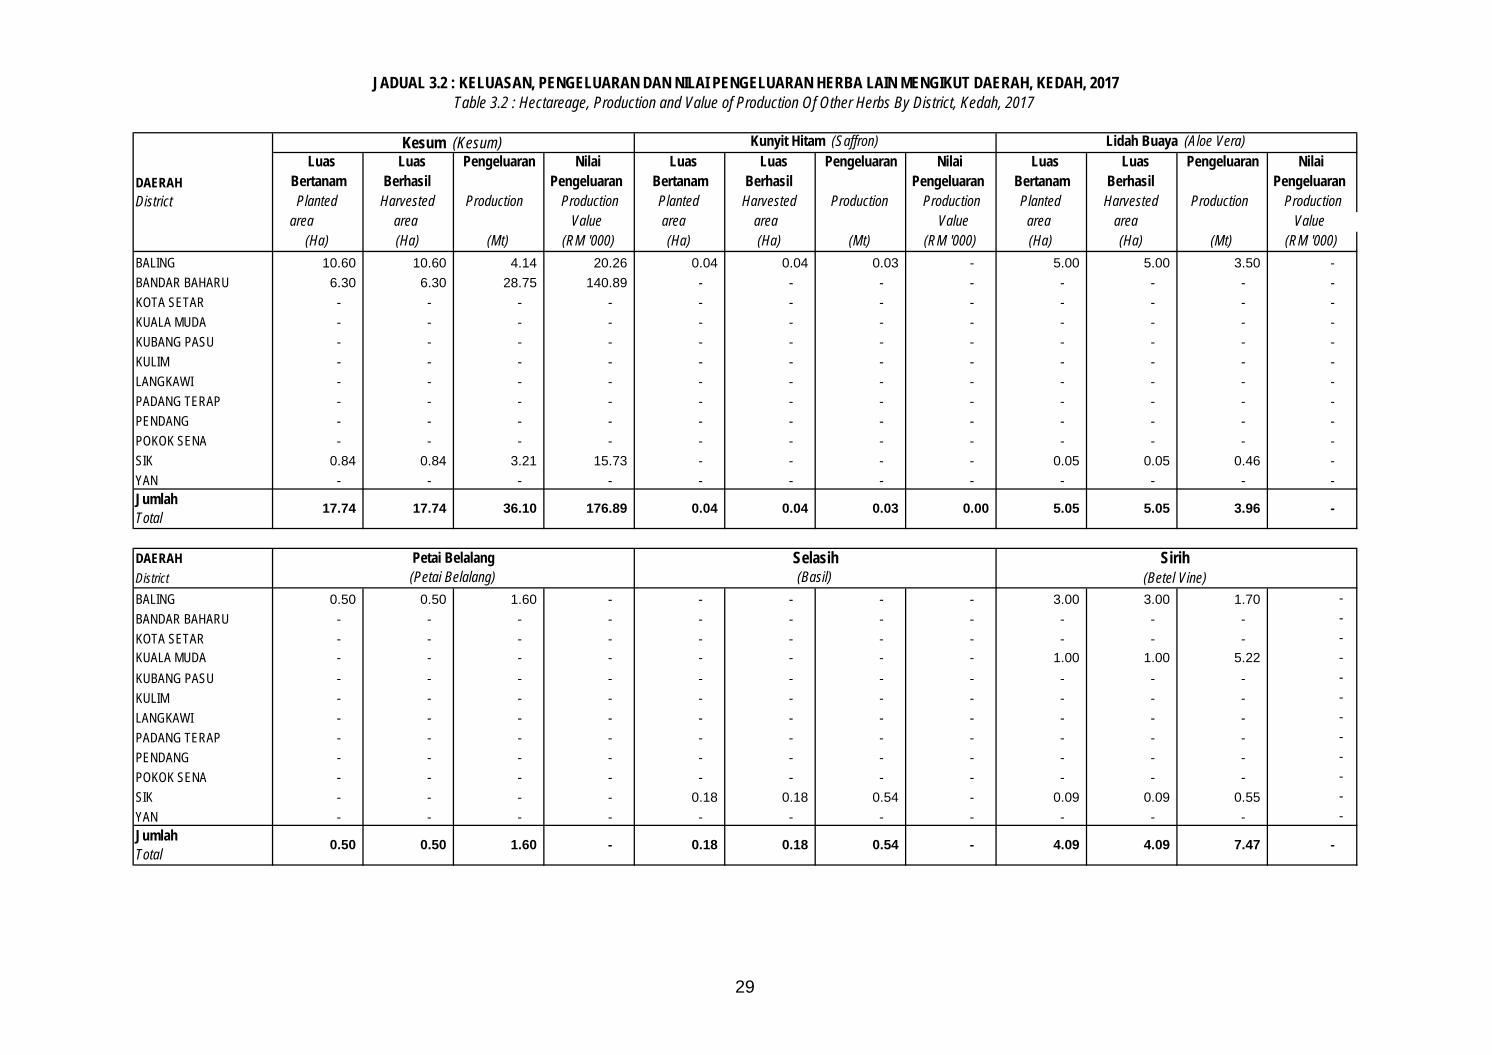
0.50 0.50 1.60 - 4.09 4.09 7.47 - 0.18 0.18 0.54 -
Jumlah Total
17.74 17.74 36.10 176.89 0.04 0.04 0.03 0.00
JADUAL 3.2 : KELUASAN, PENGELUARAN DAN NILAI PENGELUARAN HERBA LAIN MENGIKUT DAERAH, KEDAH, 2017Table 3.2 : Hectareage, Production and Value of Production Of Other Herbs By District, Kedah, 2017
DAERAH District
Kesum (Kesum) Kunyit Hitam (Saffron)
Petai Belalang Sirih (Petai Belalang) (Betel Vine)
Selasih (Basil)
5.05 5.05 3.96 -
30
Luas Luas Pengeluaran Nilai Bertanam Berhasil Pengeluaran Planted Harvested Production Production
area area Value(Ha) (Ha) (Mt) (RM '000)
BALING 21.14 21.14 12.31 20.26 BANDAR BAHARU 6.30 6.30 28.75 140.89 KOTA SETAR - - - - KUALA MUDA 1.00 1.00 5.22 - KUBANG PASU - - - - KULIM - - - - LANGKAWI - - - - PADANG TERAP - - - - PENDANG - - - - POKOK SENA - - - - SIK 2.27 2.27 10.01 17.48 YAN - - - -
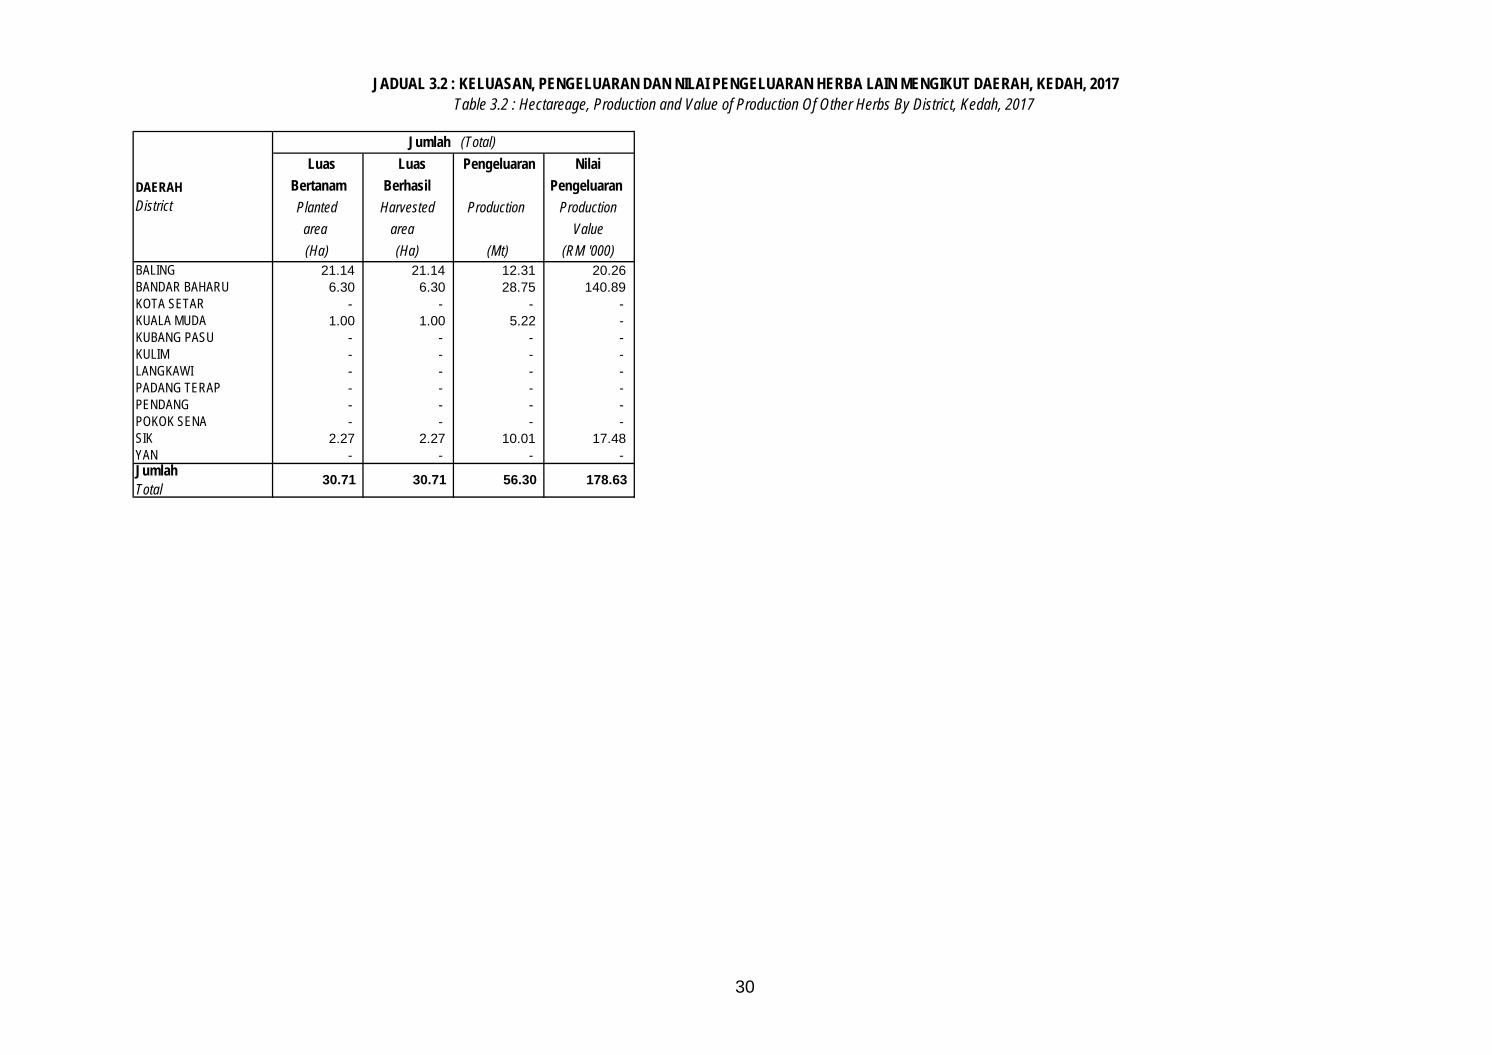
JADUAL 3.2 : KELUASAN, PENGELUARAN DAN NILAI PENGELUARAN HERBA LAIN MENGIKUT DAERAH, KEDAH, 2017Table 3.2 : Hectareage, Production and Value of Production Of Other Herbs By District, Kedah, 2017
DAERAH District
Jumlah (Total)
Jumlah Total
30.71 30.71 56.30 178.63
31
Luas Luas Pengeluaran Nilai Luas Luas Pengeluaran Nilai Luas Luas Pengeluaran Nilai Bertanam Berhasil Pengeluaran Bertanam Berhasil Pengeluaran Bertanam Berhasil Pengeluaran Planted Harvested Production Production Planted Harvested Production Production Planted Harvested Production Production
area area Value area area Value area area Value (Ha) (Ha) (Mt) (RM '000) (Ha) (Ha) (Mt) (RM '000) (Ha) (Ha) (Mt) (RM '000)
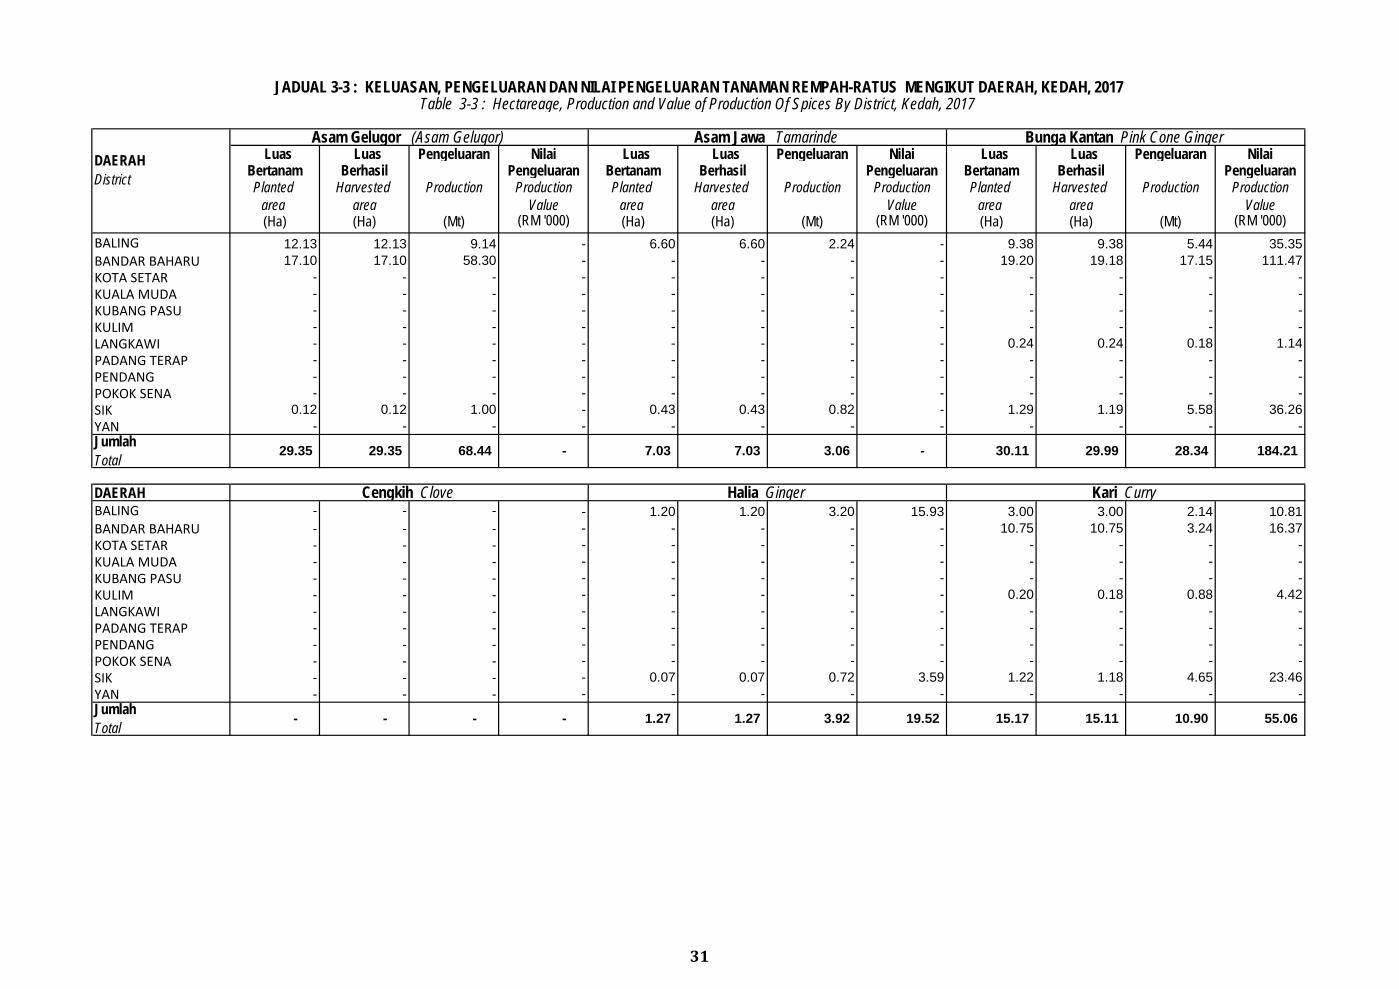
BALING 12.13 12.13 9.14 - 6.60 6.60 2.24 - 9.38 9.38 5.44 35.35 BANDAR BAHARU 17.10 17.10 58.30 - - - - - 19.20 19.18 17.15 111.47 KOTA SETAR - - - - - - - - - - - - KUALA MUDA - - - - - - - - - - - - KUBANG PASU - - - - - - - - - - - - KULIM - - - - - - - - - - - - LANGKAWI - - - - - - - - 0.24 0.24 0.18 1.14 PADANG TERAP - - - - - - - - - - - - PENDANG - - - - - - - - - - - - POKOK SENA - - - - - - - - - - - - SIK 0.12 0.12 1.00 - 0.43 0.43 0.82 - 1.29 1.19 5.58 36.26 YAN - - - - - - - - - - - -
DAERAH BALING - - - - 1.20 1.20 3.20 15.93 3.00 3.00 2.14 10.81 BANDAR BAHARU - - - - - - - - 10.75 10.75 3.24 16.37 KOTA SETAR - - - - - - - - - - - - KUALA MUDA - - - - - - - - - - - - KUBANG PASU - - - - - - - - - - - - KULIM - - - - - - - - 0.20 0.18 0.88 4.42 LANGKAWI - - - - - - - - - - - - PADANG TERAP - - - - - - - - - - - - PENDANG - - - - - - - - - - - - POKOK SENA - - - - - - - - - - - - SIK - - - - 0.07 0.07 0.72 3.59 1.22 1.18 4.65 23.46 YAN - - - - - - - - - - - -
28.34
JADUAL 3-3 : KELUASAN, PENGELUARAN DAN NILAI PENGELUARAN TANAMAN REMPAH-RATUS MENGIKUT DAERAH, KEDAH, 2017Table 3-3 : Hectareage, Production and Value of Production Of Spices By District, Kedah, 2017
DAERAH District
Asam Gelugor (Asam Gelugor) Asam Jawa Tamarinde Bunga Kantan Pink Cone Ginger
Jumlah Total
29.35 29.35 68.44 - 7.03 184.21 7.03 3.06 - 30.11 29.99
Cengkih Clove
15.17 15.11 10.90 Jumlah Total
- - - - 1.27
Halia Ginger Kari Curry
1.27 3.92 19.52 55.06
32
Luas Luas Pengeluaran Nilai Luas Luas Pengeluaran Nilai Luas Luas Pengeluaran Nilai Bertanam Berhasil Pengeluaran Bertanam Berhasil Pengeluaran Bertanam Berhasil Pengeluaran Planted Harvested Production Production Planted Harvested Production Production Planted Harvested Production Production
area area Value area area Value area area Value (Ha) (Ha) (Mt) (RM '000) (Ha) (Ha) (Mt) (RM '000) (Ha) (Ha) (Mt) (RM '000)
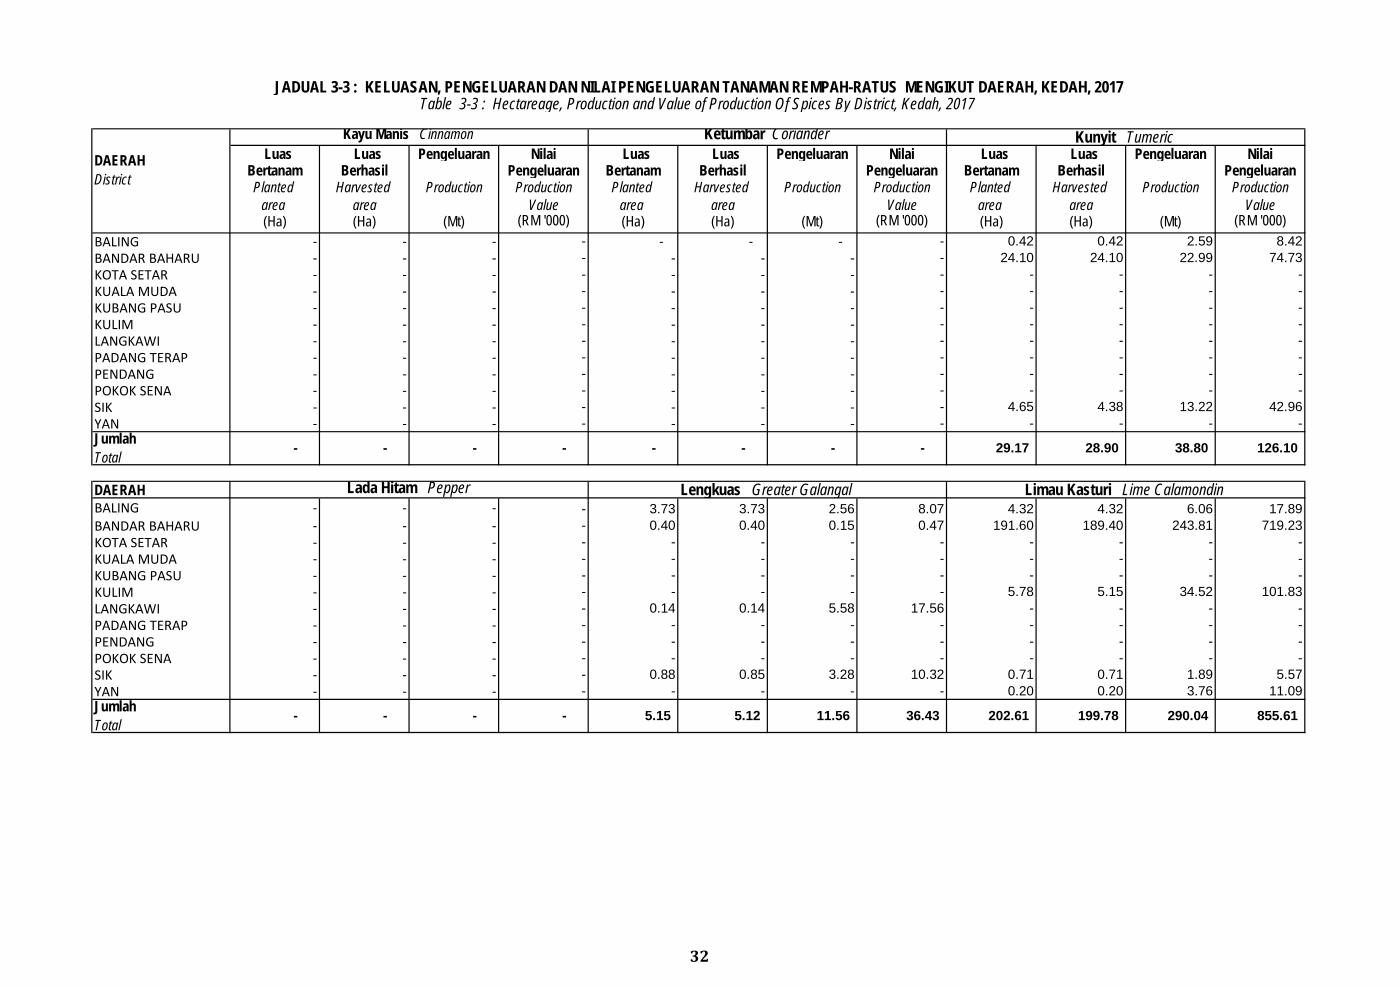
BALING - - - - - - - - 0.42 0.42 2.59 8.42 BANDAR BAHARU - - - - - - - - 24.10 24.10 22.99 74.73 KOTA SETAR - - - - - - - - - - - - KUALA MUDA - - - - - - - - - - - - KUBANG PASU - - - - - - - - - - - - KULIM - - - - - - - - - - - - LANGKAWI - - - - - - - - - - - - PADANG TERAP - - - - - - - - - - - - PENDANG - - - - - - - - - - - - POKOK SENA - - - - - - - - - - - - SIK - - - - - - - - 4.65 4.38 13.22 42.96 YAN - - - - - - - - - - - -
DAERAH BALING - - - - 3.73 3.73 2.56 8.07 4.32 4.32 6.06 17.89 BANDAR BAHARU - - - - 0.40 0.40 0.15 0.47 191.60 189.40 243.81 719.23 KOTA SETAR - - - - - - - - - - - - KUALA MUDA - - - - - - - - - - - - KUBANG PASU - - - - - - - - - - - - KULIM - - - - - - - - 5.78 5.15 34.52 101.83 LANGKAWI - - - - 0.14 0.14 5.58 17.56 - - - - PADANG TERAP - - - - - - - - - - - - PENDANG - - - - - - - - - - - - POKOK SENA - - - - - - - - - - - - SIK - - - - 0.88 0.85 3.28 10.32 0.71 0.71 1.89 5.57 YAN - - - - - - - - 0.20 0.20 3.76 11.09
JADUAL 3-3 : KELUASAN, PENGELUARAN DAN NILAI PENGELUARAN TANAMAN REMPAH-RATUS MENGIKUT DAERAH, KEDAH, 2017Table 3-3 : Hectareage, Production and Value of Production Of Spices By District, Kedah, 2017
DAERAH District
Kayu Manis Cinnamon Ketumbar Coriander Kunyit Tumeric
Jumlah Total
- - - - - - 29.17
- - - 5.15 Jumlah Total
5.12 11.56 36.43 202.61 199.78
126.10
Lada Hitam Pepper Lengkuas Greater Galangal Limau Kasturi Lime Calamondin
- -
855.61 - 290.04
38.80 28.90
33
Luas Luas Pengeluaran Nilai Luas Luas Pengeluaran Nilai Luas Luas Pengeluaran Nilai Bertanam Berhasil Pengeluaran Bertanam Berhasil Pengeluaran Bertanam Berhasil Pengeluaran Planted Harvested Production Production Planted Harvested Production Production Planted Harvested Production Production
area area Value area area Value area area Value (Ha) (Ha) (Mt) (RM '000) (Ha) (Ha) (Mt) (RM '000) (Ha) (Ha) (Mt) (RM '000)
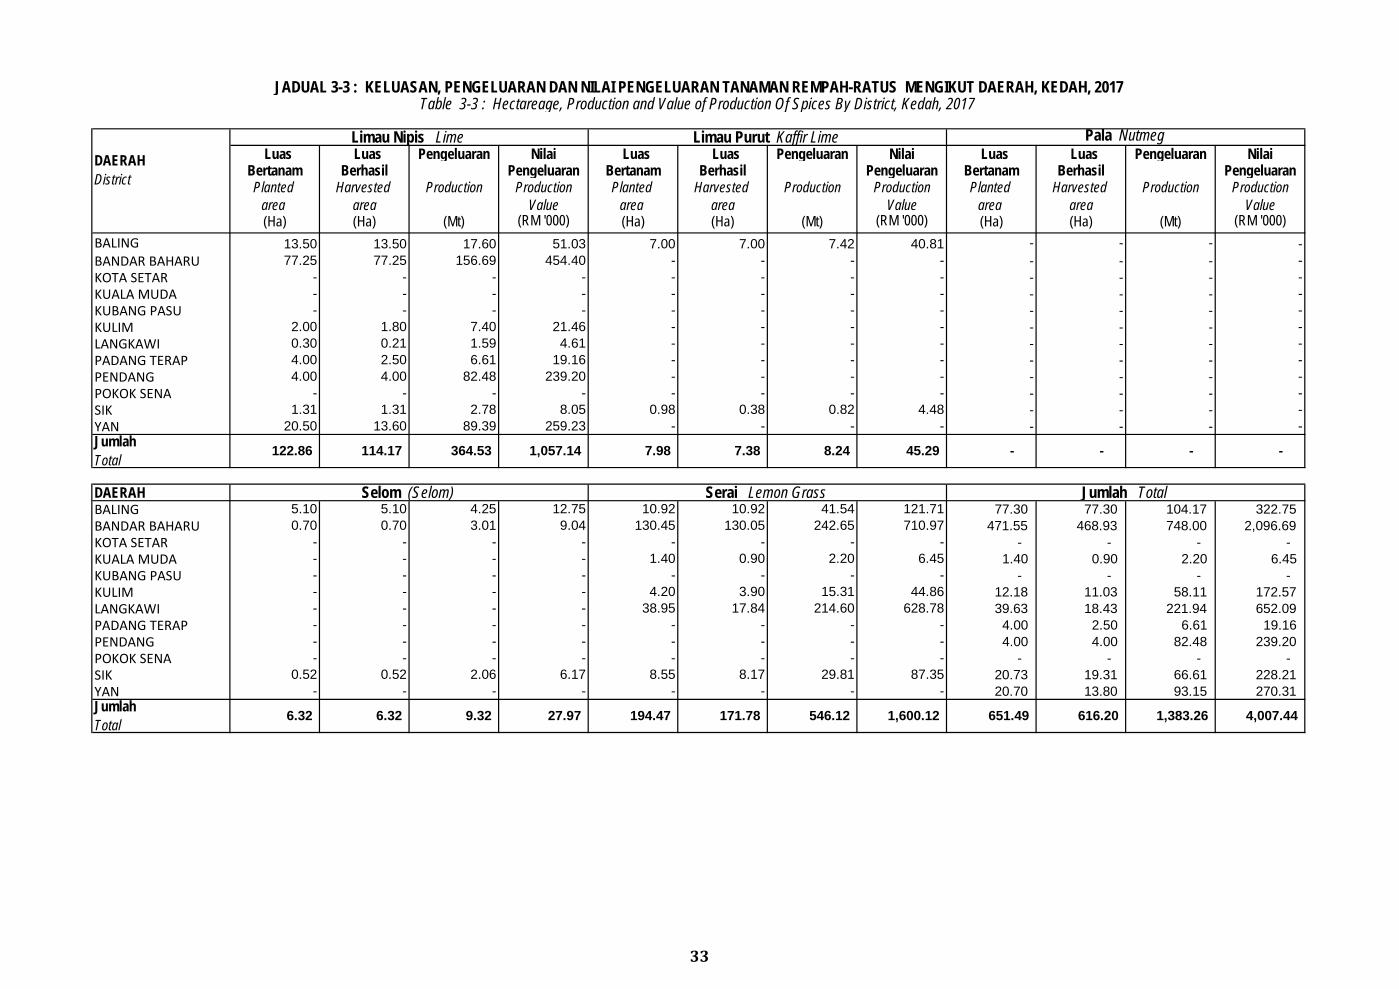
BALING 13.50 13.50 17.60 51.03 7.00 7.00 7.42 40.81 - - - - BANDAR BAHARU 77.25 77.25 156.69 454.40 - - - - - - - - KOTA SETAR - - - - - - - - - - - - KUALA MUDA - - - - - - - - - - - - KUBANG PASU - - - - - - - - - - - - KULIM 2.00 1.80 7.40 21.46 - - - - - - - - LANGKAWI 0.30 0.21 1.59 4.61 - - - - - - - - PADANG TERAP 4.00 2.50 6.61 19.16 - - - - - - - - PENDANG 4.00 4.00 82.48 239.20 - - - - - - - - POKOK SENA - - - - - - - - - - - - SIK 1.31 1.31 2.78 8.05 0.98 0.38 0.82 4.48 - - - - YAN 20.50 13.60 89.39 259.23 - - - - - - - -
DAERAH BALING 5.10 5.10 4.25 12.75 10.92 10.92 41.54 121.71 77.30 77.30 104.17 322.75 BANDAR BAHARU 0.70 0.70 3.01 9.04 130.45 130.05 242.65 710.97 471.55 468.93 748.00 2,096.69 KOTA SETAR - - - - - - - - - - - - KUALA MUDA - - - - 1.40 0.90 2.20 6.45 1.40 0.90 2.20 6.45 KUBANG PASU - - - - - - - - - - - - KULIM - - - - 4.20 3.90 15.31 44.86 12.18 11.03 58.11 172.57 LANGKAWI - - - - 38.95 17.84 214.60 628.78 39.63 18.43 221.94 652.09 PADANG TERAP - - - - - - - - 4.00 2.50 6.61 19.16 PENDANG - - - - - - - - 4.00 4.00 82.48 239.20 POKOK SENA - - - - - - - - - - - - SIK 0.52 0.52 2.06 6.17 8.55 8.17 29.81 87.35 20.73 19.31 66.61 228.21 YAN - - - - - - - - 20.70 13.80 93.15 270.31
Limau Nipis Lime
-
616.20
7.38 45.29 - - -
JADUAL 3-3 : KELUASAN, PENGELUARAN DAN NILAI PENGELUARAN TANAMAN REMPAH-RATUS MENGIKUT DAERAH, KEDAH, 2017Table 3-3 : Hectareage, Production and Value of Production Of Spices By District, Kedah, 2017
DAERAH District
Limau Purut Kaffir Lime Pala Nutmeg
546.12 1,600.12 651.49
Jumlah Total
4,007.44 1,383.26
Jumlah Total
122.86 114.17 364.53 1,057.14 7.98
6.32 6.32 9.32 27.97 194.47 Jumlah Total
Serai Lemon Grass
8.24
Selom (Selom)
171.78
KELANTAN
KELANTAN
34
Luas Luas Pengeluaran Nilai Luas Luas Pengeluaran Nilai Luas Luas Pengeluaran Nilai Bertanam Berhasil Pengeluaran Bertanam Berhasil Pengeluaran Bertanam Berhasil Pengeluaran Planted Harvested Production Production Planted Harvested Production Production Planted Harvested Production Production
area area Value area area Value area area Value (Ha) (Ha) (Mt) (RM '000) (Ha) (Ha) (Mt) (RM '000) (Ha) (Ha) (Mt) (RM '000)
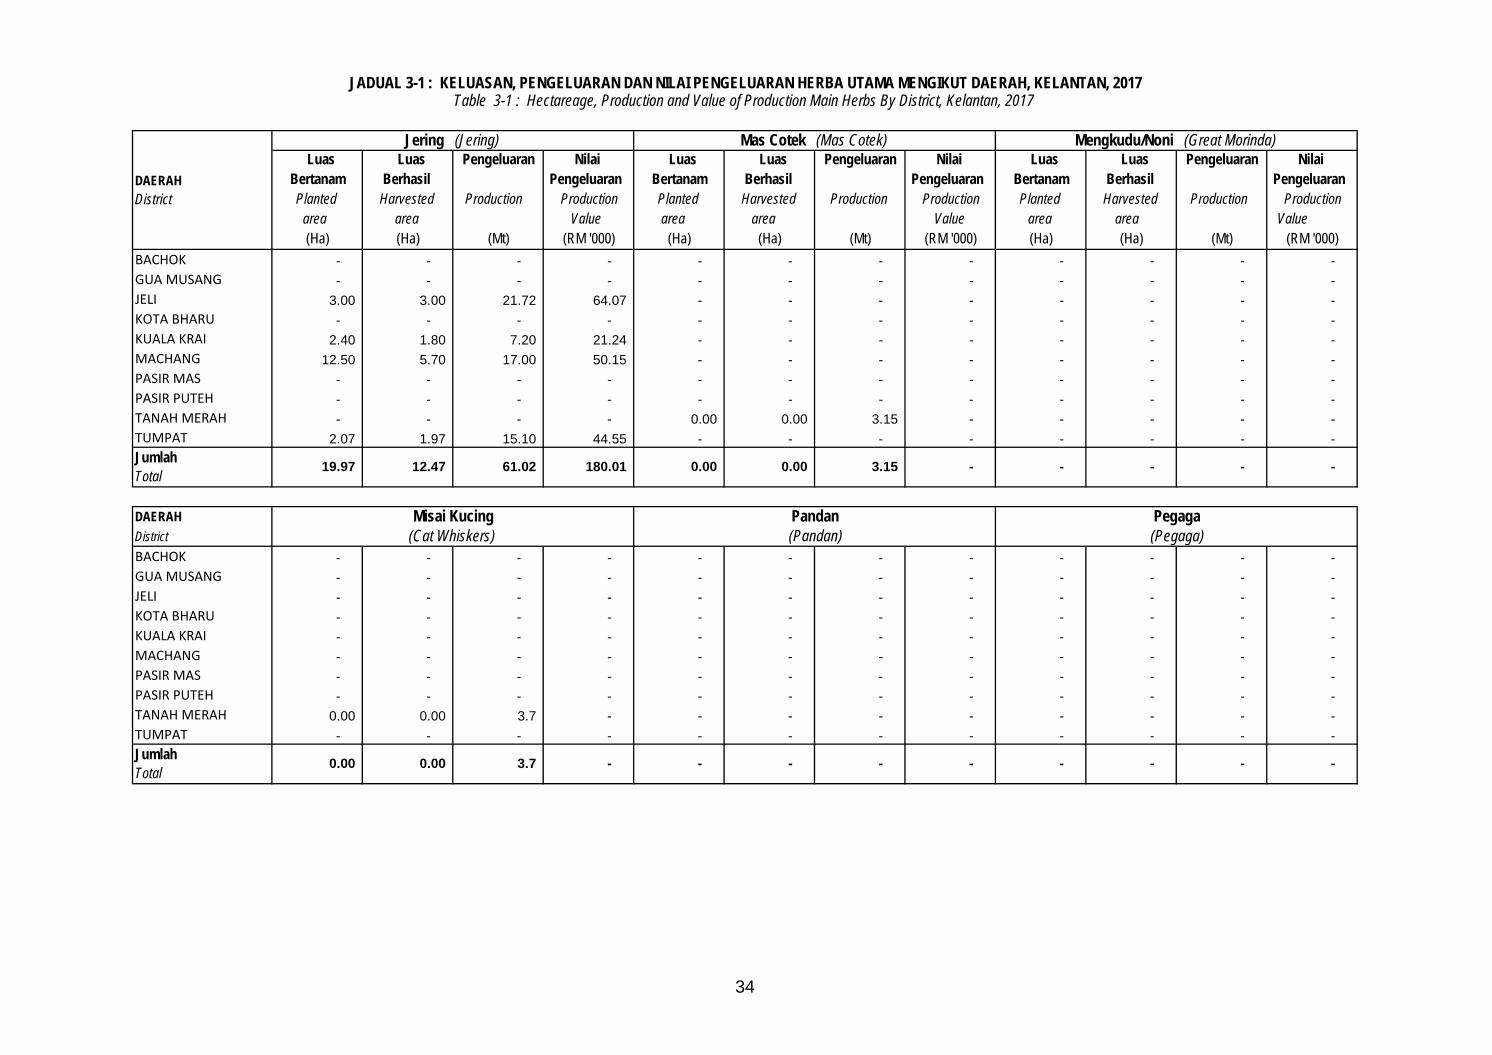
BACHOK - - - - - - - - - - - - GUA MUSANG - - - - - - - - - - - - JELI 3.00 3.00 21.72 64.07 - - - - - - - - KOTA BHARU - - - - - - - - - - - - KUALA KRAI 2.40 1.80 7.20 21.24 - - - - - - - - MACHANG 12.50 5.70 17.00 50.15 - - - - - - - - PASIR MAS - - - - - - - - - - - - PASIR PUTEH - - - - - - - - - - - - TANAH MERAH - - - - 0.00 0.00 3.15 - - - - - TUMPAT 2.07 1.97 15.10 44.55 - - - - - - - -
DAERAH DistrictBACHOK - - - - - - - - - - - - GUA MUSANG - - - - - - - - - - - - JELI - - - - - - - - - - - - KOTA BHARU - - - - - - - - - - - - KUALA KRAI - - - - - - - - - - - - MACHANG - - - - - - - - - - - - PASIR MAS - - - - - - - - - - - - PASIR PUTEH - - - - - - - - - - - - TANAH MERAH 0.00 0.00 3.7 - - - - - - - - - TUMPAT - - - - - - - - - - - -
- - - 0.00 0.00 3.15 - - Jumlah Total
19.97 12.47 61.02 180.01
Jumlah Total
JADUAL 3-1 : KELUASAN, PENGELUARAN DAN NILAI PENGELUARAN HERBA UTAMA MENGIKUT DAERAH, KELANTAN, 2017Table 3-1 : Hectareage, Production and Value of Production Main Herbs By District, Kelantan, 2017
DAERAH District
Jering (Jering) Mas Cotek (Mas Cotek) Mengkudu/Noni (Great Morinda)
- - - -
Misai Kucing Pandan Pegaga
- - - -
(Cat Whiskers) (Pandan) (Pegaga)
0.00 0.00 3.7 -
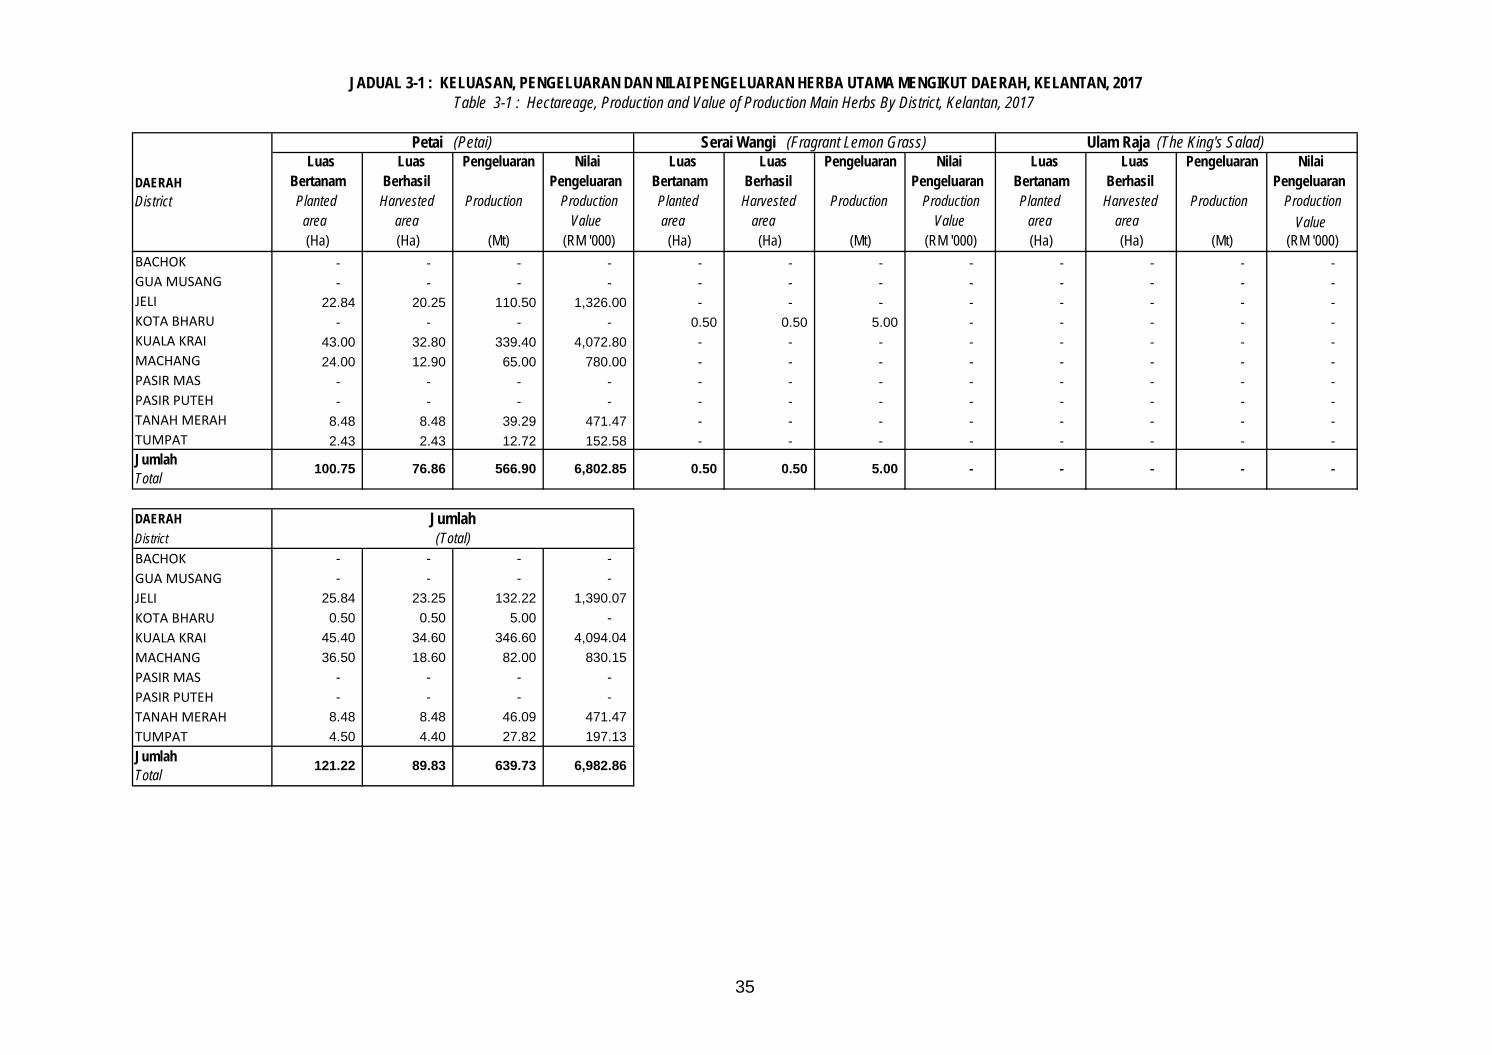
35
Luas Luas Pengeluaran Nilai Luas Luas Pengeluaran Nilai Luas Luas Pengeluaran Nilai Bertanam Berhasil Pengeluaran Bertanam Berhasil Pengeluaran Bertanam Berhasil Pengeluaran Planted Harvested Production Production Planted Harvested Production Production Planted Harvested Production Production
area area Value area area Value area area Value (Ha) (Ha) (Mt) (RM '000) (Ha) (Ha) (Mt) (RM '000) (Ha) (Ha) (Mt) (RM '000)
BACHOK - - - - - - - - - - - - GUA MUSANG - - - - - - - - - - - - JELI 22.84 20.25 110.50 1,326.00 - - - - - - - - KOTA BHARU - - - - 0.50 0.50 5.00 - - - - - KUALA KRAI 43.00 32.80 339.40 4,072.80 - - - - - - - - MACHANG 24.00 12.90 65.00 780.00 - - - - - - - - PASIR MAS - - - - - - - - - - - - PASIR PUTEH - - - - - - - - - - - - TANAH MERAH 8.48 8.48 39.29 471.47 - - - - - - - - TUMPAT 2.43 2.43 12.72 152.58 - - - - - - - -
DAERAH DistrictBACHOK - - - - GUA MUSANG - - - - JELI 25.84 23.25 132.22 1,390.07 KOTA BHARU 0.50 0.50 5.00 - KUALA KRAI 45.40 34.60 346.60 4,094.04 MACHANG 36.50 18.60 82.00 830.15 PASIR MAS - - - - PASIR PUTEH - - - - TANAH MERAH 8.48 8.48 46.09 471.47 TUMPAT 4.50 4.40 27.82 197.13
- - - - -
JADUAL 3-1 : KELUASAN, PENGELUARAN DAN NILAI PENGELUARAN HERBA UTAMA MENGIKUT DAERAH, KELANTAN, 2017Table 3-1 : Hectareage, Production and Value of Production Main Herbs By District, Kelantan, 2017
DAERAH District
Petai (Petai) Serai Wangi (Fragrant Lemon Grass) Ulam Raja (The King's Salad)
Jumlah Total
100.75 76.86 566.90 6,802.85 0.50 0.50 5.00
Jumlah (Total)
Jumlah Total
121.22 89.83 639.73 6,982.86
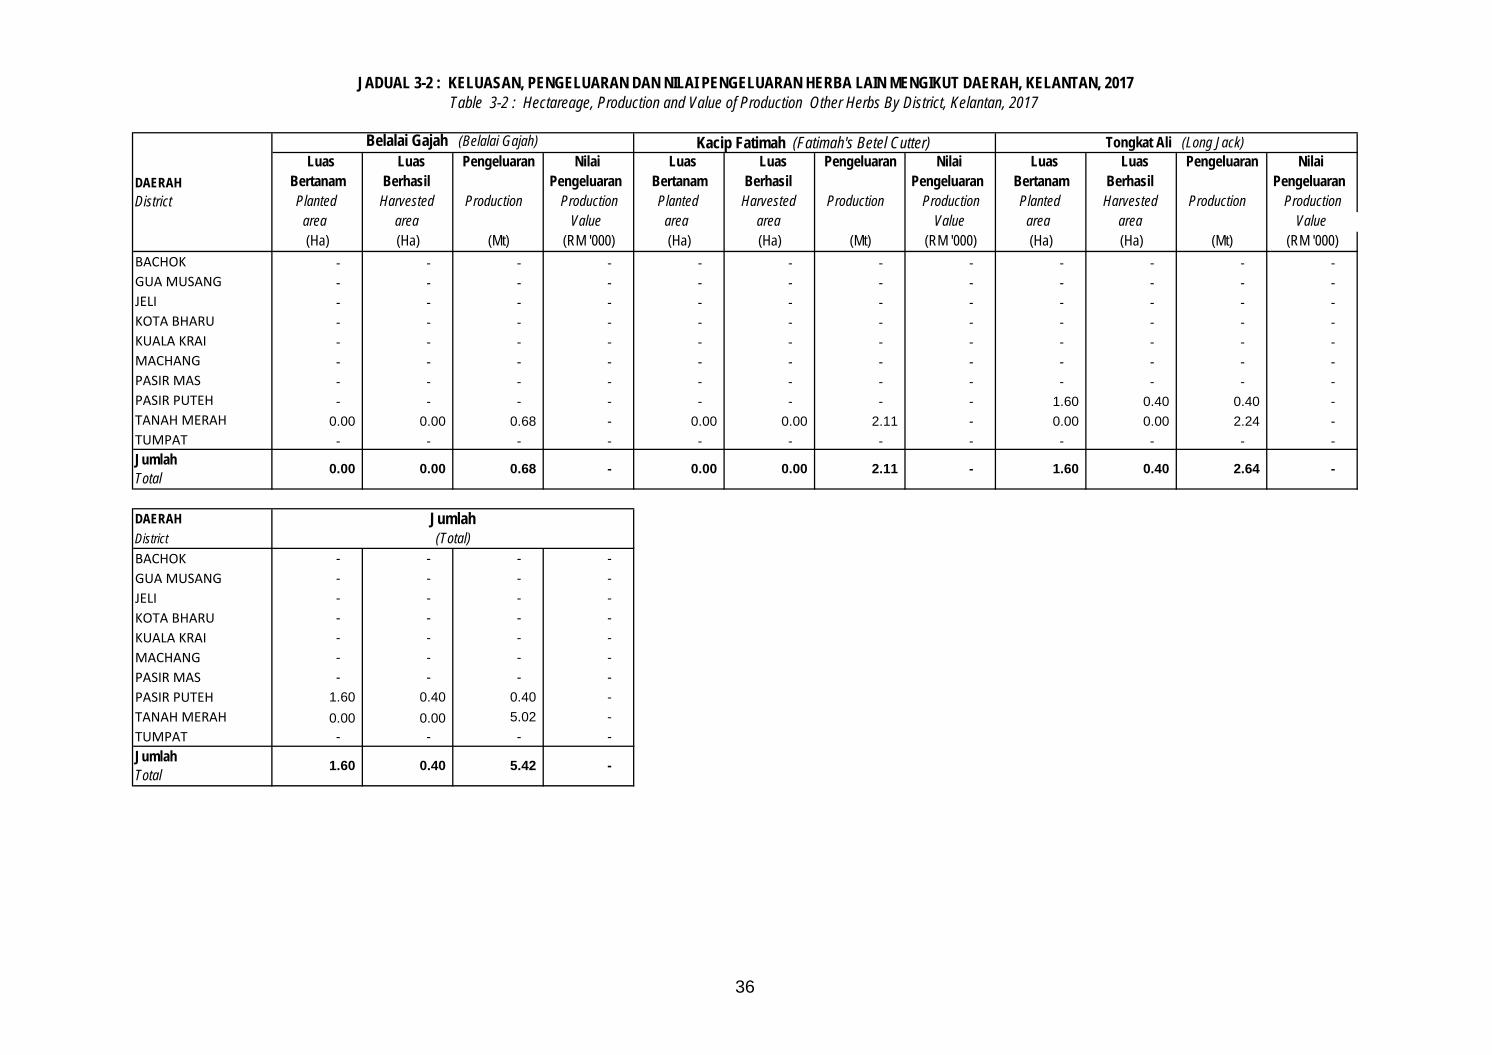
36
Luas Luas Pengeluaran Nilai Luas Luas Pengeluaran Nilai Luas Luas Pengeluaran Nilai Bertanam Berhasil Pengeluaran Bertanam Berhasil Pengeluaran Bertanam Berhasil Pengeluaran Planted Harvested Production Production Planted Harvested Production Production Planted Harvested Production Production
area area Value area area Value area area Value (Ha) (Ha) (Mt) (RM '000) (Ha) (Ha) (Mt) (RM '000) (Ha) (Ha) (Mt) (RM '000)
BACHOK - - - - - - - - - - - - GUA MUSANG - - - - - - - - - - - - JELI - - - - - - - - - - - - KOTA BHARU - - - - - - - - - - - - KUALA KRAI - - - - - - - - - - - - MACHANG - - - - - - - - - - - - PASIR MAS - - - - - - - - - - - - PASIR PUTEH - - - - - - - - 1.60 0.40 0.40 - TANAH MERAH 0.00 0.00 0.68 - 0.00 0.00 2.11 - 0.00 0.00 2.24 - TUMPAT - - - - - - - - - - - -
DAERAH DistrictBACHOK - - - - GUA MUSANG - - - - JELI - - - - KOTA BHARU - - - - KUALA KRAI - - - - MACHANG - - - - PASIR MAS - - - - PASIR PUTEH 1.60 0.40 0.40 - TANAH MERAH 0.00 0.00 5.02 - TUMPAT - - - -
DAERAH District
Belalai Gajah (Belalai Gajah) Kacip Fatimah (Fatimah's Betel Cutter)
0.00 2.11 - Jumlah Total
0.00 0.00 0.68 - 0.00
JADUAL 3-2 : KELUASAN, PENGELUARAN DAN NILAI PENGELUARAN HERBA LAIN MENGIKUT DAERAH, KELANTAN, 2017Table 3-2 : Hectareage, Production and Value of Production Other Herbs By District, Kelantan, 2017
Tongkat Ali (Long Jack)
1.60 0.40 2.64 -
Jumlah (Total)
Jumlah Total
1.60 0.40 5.42 -
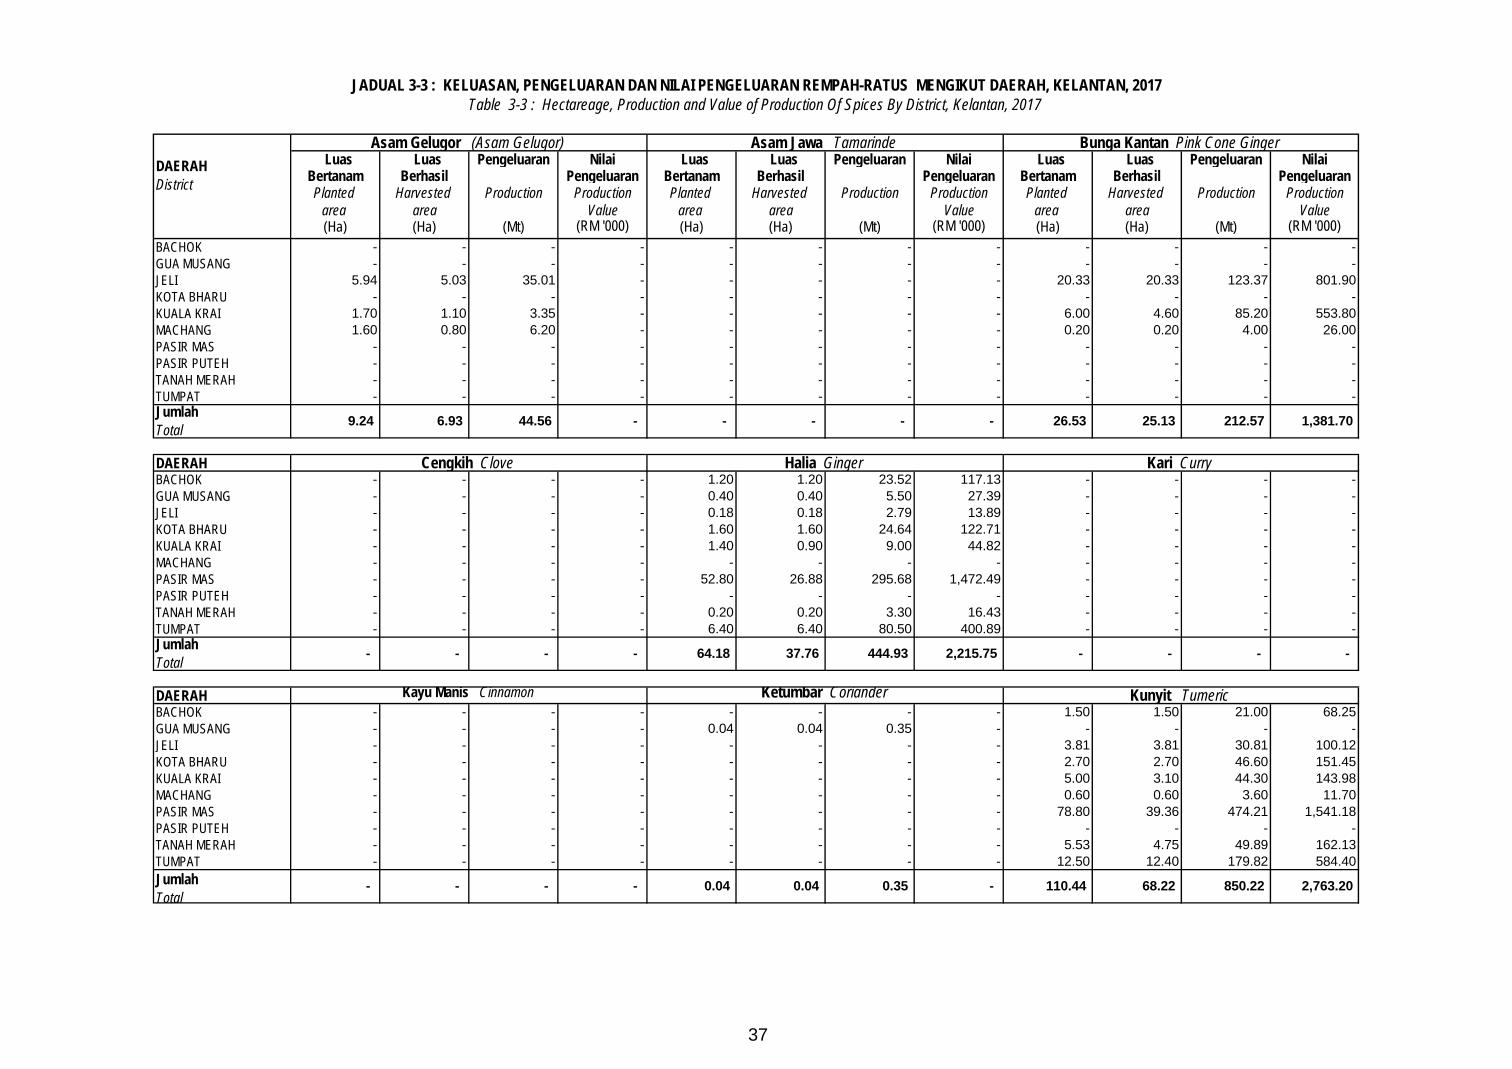
37
Luas Luas Pengeluaran Nilai Luas Luas Pengeluaran Nilai Luas Luas Pengeluaran Nilai Bertanam Berhasil Pengeluaran Bertanam Berhasil Pengeluaran Bertanam Berhasil Pengeluaran Planted Harvested Production Production Planted Harvested Production Production Planted Harvested Production Production
area area Value area area Value area area Value (Ha) (Ha) (Mt) (RM '000) (Ha) (Ha) (Mt) (RM '000) (Ha) (Ha) (Mt) (RM '000)
BACHOK - - - - - - - - - - - - GUA MUSANG - - - - - - - - - - - - JELI 5.94 5.03 35.01 - - - - - 20.33 20.33 123.37 801.90 KOTA BHARU - - - - - - - - - - - - KUALA KRAI 1.70 1.10 3.35 - - - - - 6.00 4.60 85.20 553.80 MACHANG 1.60 0.80 6.20 - - - - - 0.20 0.20 4.00 26.00 PASIR MAS - - - - - - - - - - - - PASIR PUTEH - - - - - - - - - - - - TANAH MERAH - - - - - - - - - - - - TUMPAT - - - - - - - - - - - -
DAERAH BACHOK - - - - 1.20 1.20 23.52 117.13 - - - - GUA MUSANG - - - - 0.40 0.40 5.50 27.39 - - - - JELI - - - - 0.18 0.18 2.79 13.89 - - - - KOTA BHARU - - - - 1.60 1.60 24.64 122.71 - - - - KUALA KRAI - - - - 1.40 0.90 9.00 44.82 - - - - MACHANG - - - - - - - - - - - - PASIR MAS - - - - 52.80 26.88 295.68 1,472.49 - - - - PASIR PUTEH - - - - - - - - - - - - TANAH MERAH - - - - 0.20 0.20 3.30 16.43 - - - - TUMPAT - - - - 6.40 6.40 80.50 400.89 - - - -
DAERAH BACHOK - - - - - - - - 1.50 1.50 21.00 68.25 GUA MUSANG - - - - 0.04 0.04 0.35 - - - - - JELI - - - - - - - - 3.81 3.81 30.81 100.12 KOTA BHARU - - - - - - - - 2.70 2.70 46.60 151.45 KUALA KRAI - - - - - - - - 5.00 3.10 44.30 143.98 MACHANG - - - - - - - - 0.60 0.60 3.60 11.70 PASIR MAS - - - - - - - - 78.80 39.36 474.21 1,541.18 PASIR PUTEH - - - - - - - - - - - - TANAH MERAH - - - - - - - - 5.53 4.75 49.89 162.13 TUMPAT - - - - - - - - 12.50 12.40 179.82 584.40
444.93 2,215.75 - - -
0.04 0.35 - 110.44 68.22 850.22
JADUAL 3-3 : KELUASAN, PENGELUARAN DAN NILAI PENGELUARAN REMPAH-RATUS MENGIKUT DAERAH, KELANTAN, 2017Table 3-3 : Hectareage, Production and Value of Production Of Spices By District, Kelantan, 2017
DAERAH District
Asam Gelugor (Asam Gelugor) Asam Jawa Tamarinde Bunga Kantan Pink Cone Ginger
2,763.20
Jumlah Total - - - - 64.18
Jumlah Total
- - - - 0.04
-
Kayu Manis Cinnamon Ketumbar Coriander Kunyit Tumeric
37.76
Jumlah Total 9.24 6.93 44.56 - - 1,381.70
Cengkih Clove Halia Ginger Kari Curry
- - - 26.53 25.13 212.57
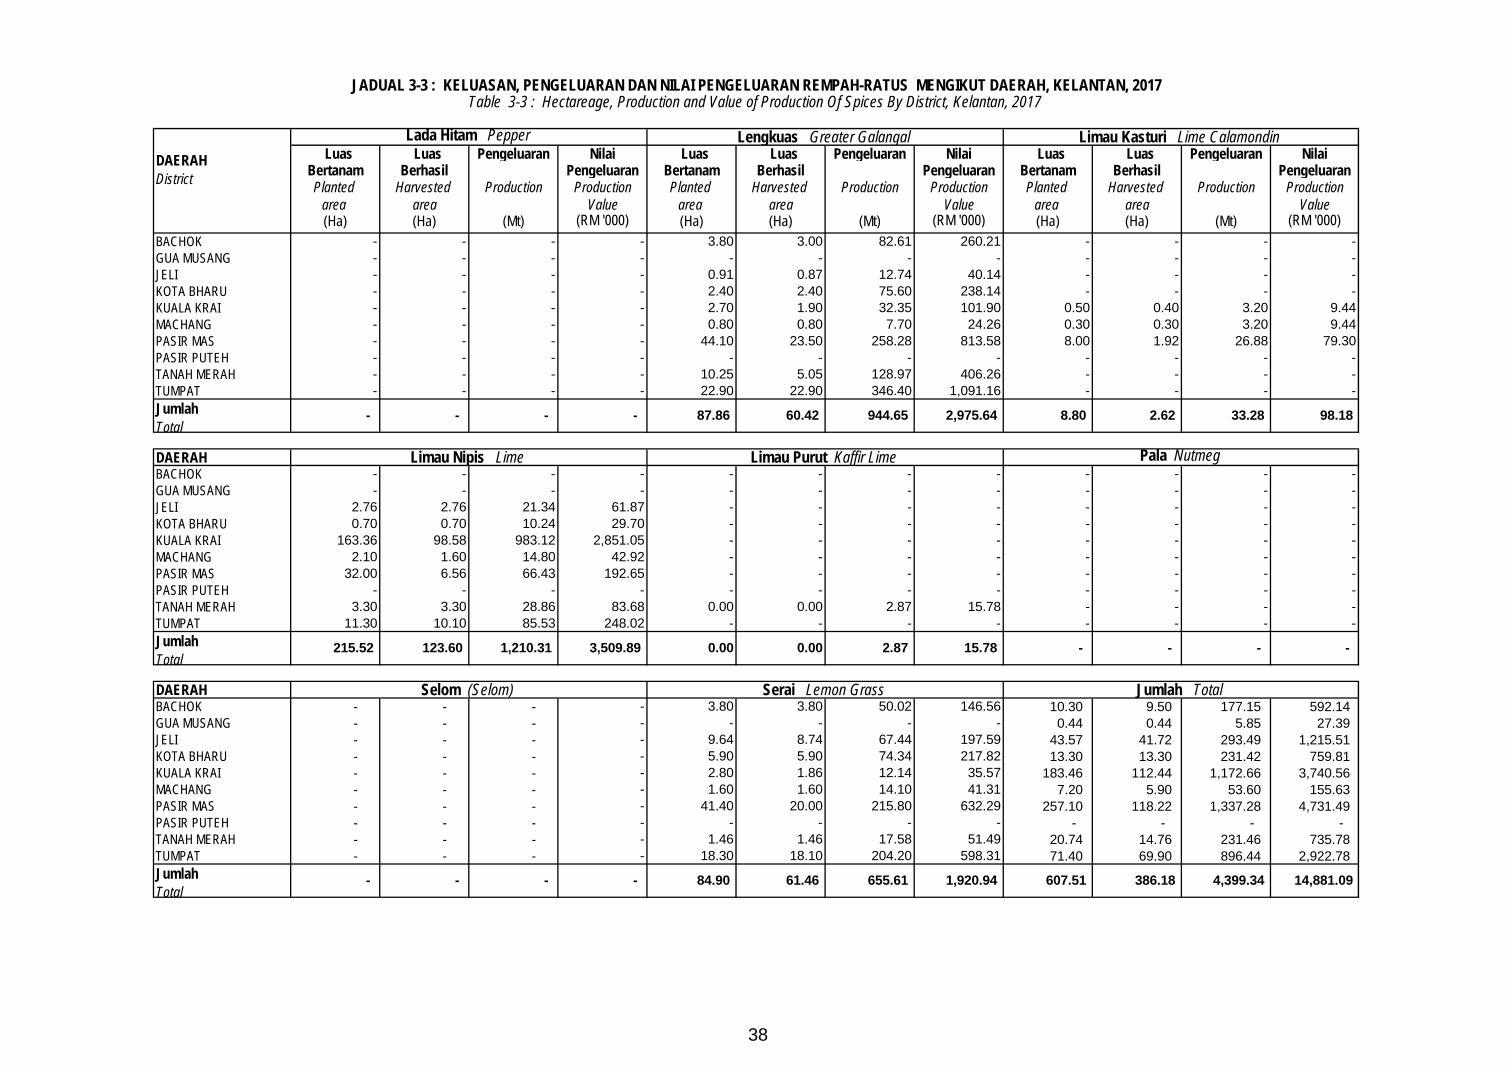
38
Luas Luas Pengeluaran Nilai Luas Luas Pengeluaran Nilai Luas Luas Pengeluaran Nilai Bertanam Berhasil Pengeluaran Bertanam Berhasil Pengeluaran Bertanam Berhasil Pengeluaran Planted Harvested Production Production Planted Harvested Production Production Planted Harvested Production Production
area area Value area area Value area area Value (Ha) (Ha) (Mt) (RM '000) (Ha) (Ha) (Mt) (RM '000) (Ha) (Ha) (Mt) (RM '000)
BACHOK - - - - 3.80 3.00 82.61 260.21 - - - - GUA MUSANG - - - - - - - - - - - - JELI - - - - 0.91 0.87 12.74 40.14 - - - - KOTA BHARU - - - - 2.40 2.40 75.60 238.14 - - - - KUALA KRAI - - - - 2.70 1.90 32.35 101.90 0.50 0.40 3.20 9.44 MACHANG - - - - 0.80 0.80 7.70 24.26 0.30 0.30 3.20 9.44 PASIR MAS - - - - 44.10 23.50 258.28 813.58 8.00 1.92 26.88 79.30 PASIR PUTEH - - - - - - - - - - - - TANAH MERAH - - - - 10.25 5.05 128.97 406.26 - - - - TUMPAT - - - - 22.90 22.90 346.40 1,091.16 - - - -
DAERAH BACHOK - - - - - - - - - - - - GUA MUSANG - - - - - - - - - - - - JELI 2.76 2.76 21.34 61.87 - - - - - - - - KOTA BHARU 0.70 0.70 10.24 29.70 - - - - - - - - KUALA KRAI 163.36 98.58 983.12 2,851.05 - - - - - - - - MACHANG 2.10 1.60 14.80 42.92 - - - - - - - - PASIR MAS 32.00 6.56 66.43 192.65 - - - - - - - - PASIR PUTEH - - - - - - - - - - - - TANAH MERAH 3.30 3.30 28.86 83.68 0.00 0.00 2.87 15.78 - - - - TUMPAT 11.30 10.10 85.53 248.02 - - - - - - - -
DAERAH BACHOK - - - - 3.80 3.80 50.02 146.56 10.30 9.50 177.15 592.14 GUA MUSANG - - - - - - - - 0.44 0.44 5.85 27.39 JELI - - - - 9.64 8.74 67.44 197.59 43.57 41.72 293.49 1,215.51 KOTA BHARU - - - - 5.90 5.90 74.34 217.82 13.30 13.30 231.42 759.81 KUALA KRAI - - - - 2.80 1.86 12.14 35.57 183.46 112.44 1,172.66 3,740.56 MACHANG - - - - 1.60 1.60 14.10 41.31 7.20 5.90 53.60 155.63 PASIR MAS - - - - 41.40 20.00 215.80 632.29 257.10 118.22 1,337.28 4,731.49 PASIR PUTEH - - - - - - - - - - - - TANAH MERAH - - - - 1.46 1.46 17.58 51.49 20.74 14.76 231.46 735.78 TUMPAT - - - - 18.30 18.10 204.20 598.31 71.40 69.90 896.44 2,922.78 Jumlah Total
- - - - 84.90
-
Selom (Selom) Serai Lemon Grass Jumlah Total
- - - 0.00 2.87 15.78
14,881.09 61.46 655.61 1,920.94 607.51 386.18 4,399.34
Limau Nipis Lime Limau Purut Kaffir Lime Pala Nutmeg
Jumlah Total
215.52 123.60 1,210.31 3,509.89 0.00
JADUAL 3-3 : KELUASAN, PENGELUARAN DAN NILAI PENGELUARAN REMPAH-RATUS MENGIKUT DAERAH, KELANTAN, 2017Table 3-3 : Hectareage, Production and Value of Production Of Spices By District, Kelantan, 2017
DAERAH District
Lada Hitam Pepper Lengkuas Greater Galangal Limau Kasturi Lime Calamondin
Jumlah Total
- - - - 87.86 60.42 944.65 2,975.64 8.80 2.62 33.28 98.18
MELAKA
MALACCA
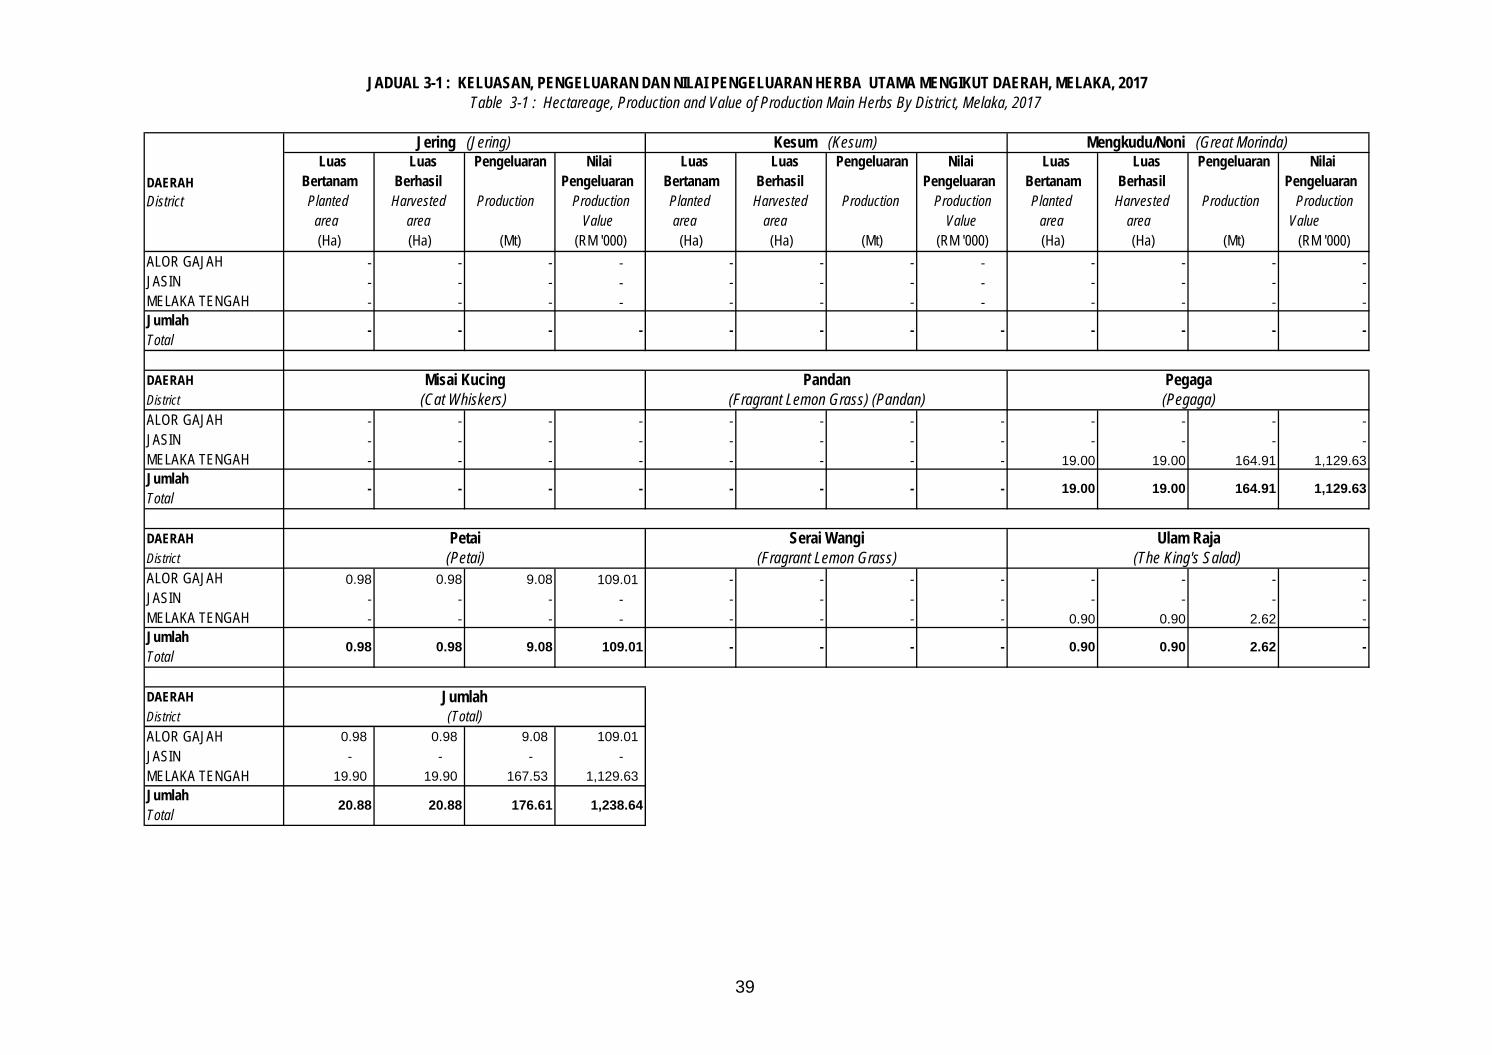
39
Luas Luas Pengeluaran Nilai Luas Luas Pengeluaran Nilai Luas Luas Pengeluaran Nilai Bertanam Berhasil Pengeluaran Bertanam Berhasil Pengeluaran Bertanam Berhasil Pengeluaran Planted Harvested Production Production Planted Harvested Production Production Planted Harvested Production Production
area area Value area area Value area area Value (Ha) (Ha) (Mt) (RM '000) (Ha) (Ha) (Mt) (RM '000) (Ha) (Ha) (Mt) (RM '000)
ALOR GAJAH - - - - - - - - - - - - JASIN - - - - - - - - - - - - MELAKA TENGAH - - - - - - - - - - - -
DAERAH DistrictALOR GAJAH - - - - - - - - - - - - JASIN - - - - - - - - - - - - MELAKA TENGAH - - - - - - - - 19.00 19.00 164.91 1,129.63
DAERAH DistrictALOR GAJAH 0.98 0.98 9.08 109.01 - - - - - - - - JASIN - - - - - - - - - - - - MELAKA TENGAH - - - - - - - - 0.90 0.90 2.62 -
DAERAH DistrictALOR GAJAH 0.98 0.98 9.08 109.01 JASIN - - - - MELAKA TENGAH 19.90 19.90 167.53 1,129.63
Petai Serai Wangi Ulam Raja (Petai) (Fragrant Lemon Grass) (The King's Salad)
- - - - 0.90 0.90 2.62 -
Jumlah Total
20.88 20.88 176.61 1,238.64
- - - - - - - -
19.00 19.00 164.91 1,129.63Jumlah Total
- - - - - - - -
Jumlah (Total)
Jumlah Total
0.98 0.98 9.08 109.01
Misai Kucing Pandan Pegaga (Cat Whiskers) (Fragrant Lemon Grass) (Pandan) (Pegaga)
JADUAL 3-1 : KELUASAN, PENGELUARAN DAN NILAI PENGELUARAN HERBA UTAMA MENGIKUT DAERAH, MELAKA, 2017Table 3-1 : Hectareage, Production and Value of Production Main Herbs By District, Melaka, 2017
DAERAH District
Jering (Jering) Kesum (Kesum) Mengkudu/Noni (Great Morinda)
Jumlah Total
- - - -
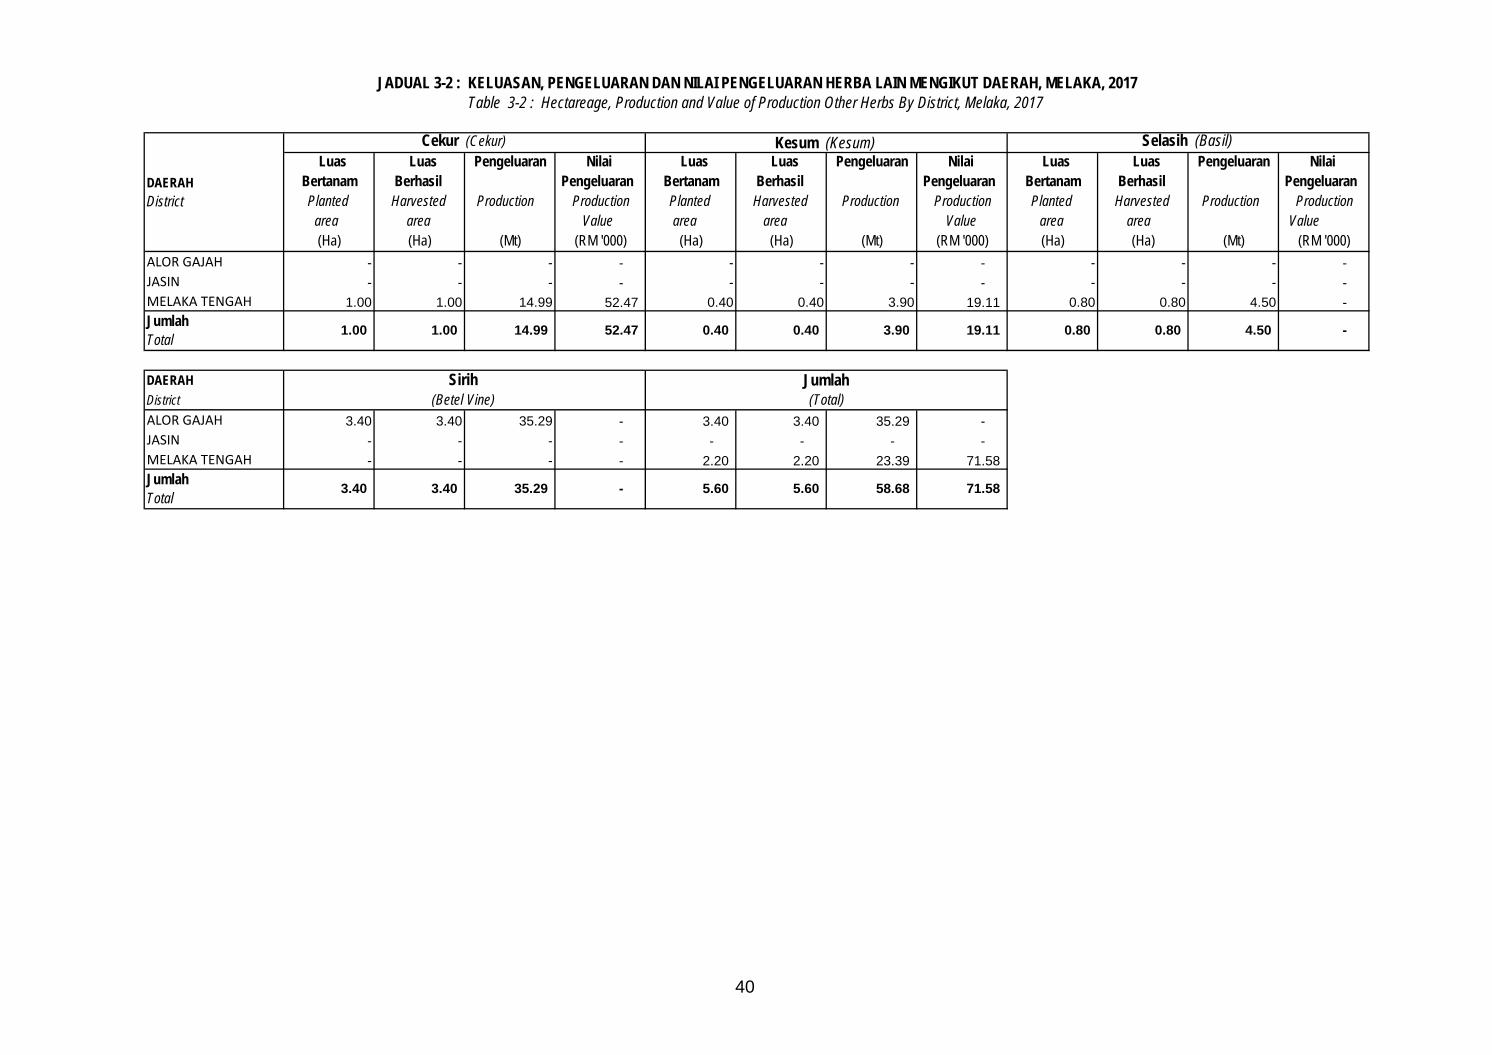
40
Luas Luas Pengeluaran Nilai Luas Luas Pengeluaran Nilai Luas Luas Pengeluaran Nilai Bertanam Berhasil Pengeluaran Bertanam Berhasil Pengeluaran Bertanam Berhasil Pengeluaran Planted Harvested Production Production Planted Harvested Production Production Planted Harvested Production Production
area area Value area area Value area area Value (Ha) (Ha) (Mt) (RM '000) (Ha) (Ha) (Mt) (RM '000) (Ha) (Ha) (Mt) (RM '000)
ALOR GAJAH - - - - - - - - - - - - JASIN - - - - - - - - - - - - MELAKA TENGAH 1.00 1.00 14.99 52.47 0.40 0.40 3.90 19.11 0.80 0.80 4.50 -
DAERAH DistrictALOR GAJAH 3.40 3.40 35.29 - 3.40 3.40 35.29 - JASIN - - - - - - - - MELAKA TENGAH - - - - 2.20 2.20 23.39 71.58
JADUAL 3-2 : KELUASAN, PENGELUARAN DAN NILAI PENGELUARAN HERBA LAIN MENGIKUT DAERAH, MELAKA, 2017Table 3-2 : Hectareage, Production and Value of Production Other Herbs By District, Melaka, 2017
DAERAH District
Cekur (Cekur) Kesum (Kesum) Selasih (Basil)
- 0.40 3.90 19.11 0.80 0.80 4.50 Jumlah Total
1.00 1.00 14.99 52.47 0.40
Sirih
Jumlah Total
3.40 3.40 35.29 - 58.68
Jumlah (Betel Vine) (Total)
5.60 5.60 71.58
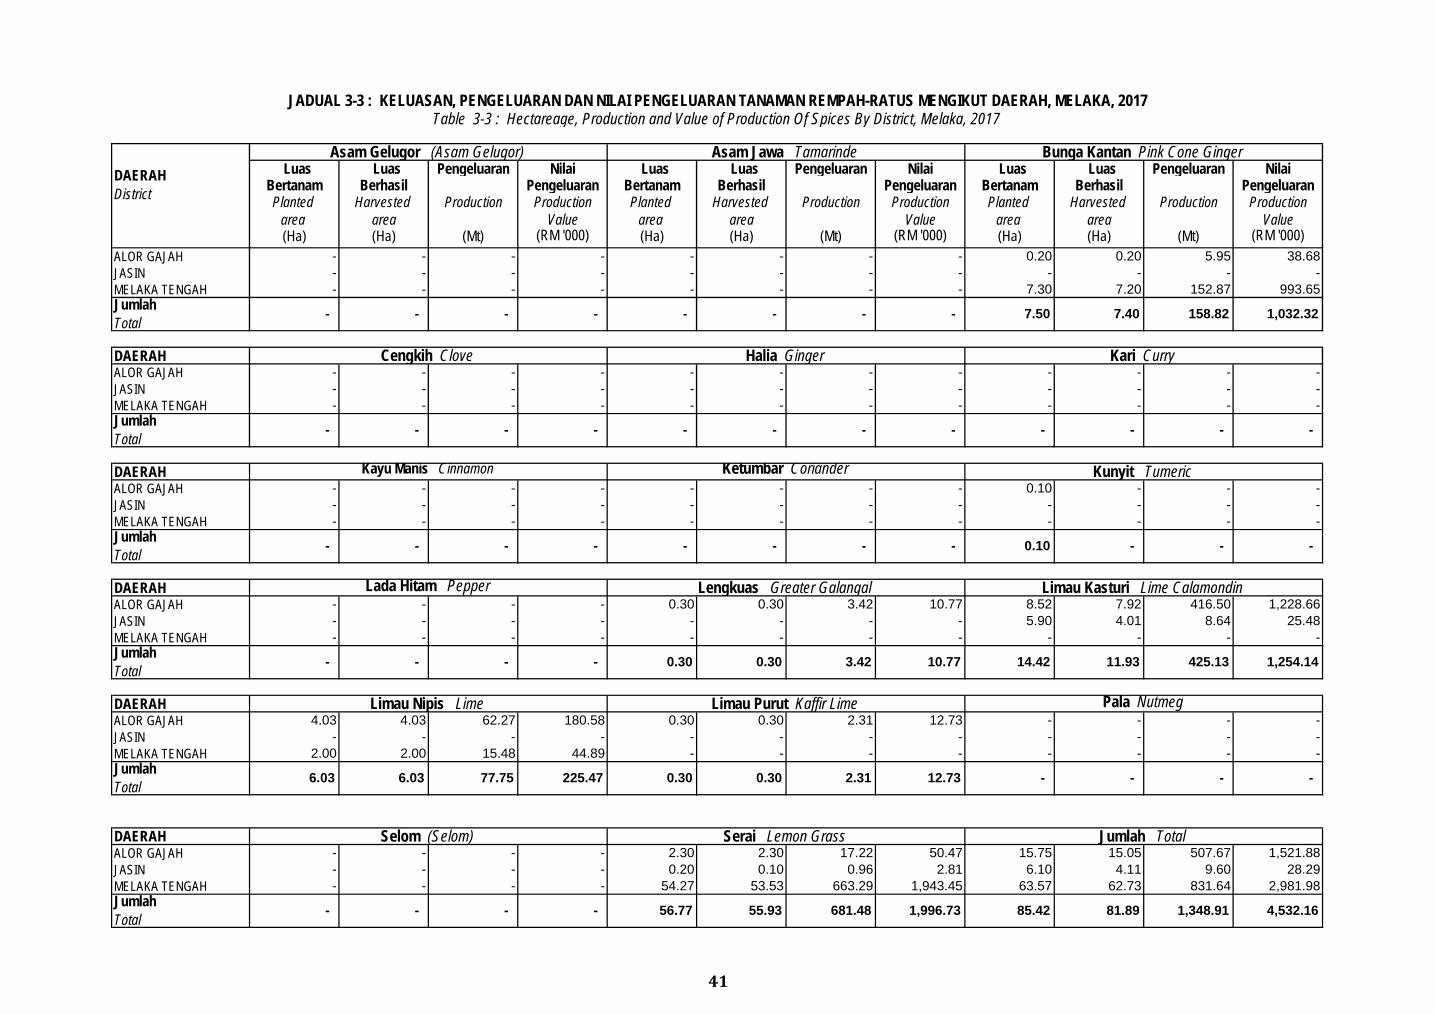
41
Luas Luas Pengeluaran Nilai Luas Luas Pengeluaran Nilai Luas Luas Pengeluaran Nilai Bertanam Berhasil Pengeluaran Bertanam Berhasil Pengeluaran Bertanam Berhasil Pengeluaran Planted Harvested Production Production Planted Harvested Production Production Planted Harvested Production Production
area area Value area area Value area area Value (Ha) (Ha) (Mt) (RM '000) (Ha) (Ha) (Mt) (RM '000) (Ha) (Ha) (Mt) (RM '000)
ALOR GAJAH - - - - - - - - 0.20 0.20 5.95 38.68 JASIN - - - - - - - - - - - - MELAKA TENGAH - - - - - - - - 7.30 7.20 152.87 993.65
DAERAH ALOR GAJAH - - - - - - - - - - - - JASIN - - - - - - - - - - - - MELAKA TENGAH - - - - - - - - - - - -
DAERAH ALOR GAJAH - - - - - - - - 0.10 - - - JASIN - - - - - - - - - - - - MELAKA TENGAH - - - - - - - - - - - -
DAERAH ALOR GAJAH - - - - 0.30 0.30 3.42 10.77 8.52 7.92 416.50 1,228.66 JASIN - - - - - - - - 5.90 4.01 8.64 25.48 MELAKA TENGAH - - - - - - - - - - - -
DAERAH ALOR GAJAH 4.03 4.03 62.27 180.58 0.30 0.30 2.31 12.73 - - - - JASIN - - - - - - - - - - - - MELAKA TENGAH 2.00 2.00 15.48 44.89 - - - - - - - -
DAERAH ALOR GAJAH - - - - 2.30 2.30 17.22 50.47 15.75 15.05 507.67 1,521.88 JASIN - - - - 0.20 0.10 0.96 2.81 6.10 4.11 9.60 28.29 MELAKA TENGAH - - - - 54.27 53.53 663.29 1,943.45 63.57 62.73 831.64 2,981.98
JADUAL 3-3 : KELUASAN, PENGELUARAN DAN NILAI PENGELUARAN TANAMAN REMPAH-RATUS MENGIKUT DAERAH, MELAKA, 2017Table 3-3 : Hectareage, Production and Value of Production Of Spices By District, Melaka, 2017
DAERAH District
Asam Gelugor (Asam Gelugor) Asam Jawa Tamarinde Bunga Kantan Pink Cone Ginger
Jumlah Total
- - - - 158.82 1,032.32
Cengkih Clove Halia Ginger Kari Curry
- - - - 7.50 7.40
Jumlah Total
- - - - - -
Kayu Manis Cinnamon Ketumbar Coriander Kunyit Tumeric
- - - - - -
Jumlah Total
- - - - - -
Lada Hitam Pepper Lengkuas Greater Galangal Limau Kasturi Lime Calamondin
- - - - 0.10 -
Jumlah Total
- - - - 425.13 1,254.14
Limau Nipis Lime Limau Purut Kaffir Lime Pala Nutmeg
0.30 0.30 3.42 10.77 14.42 11.93
4,532.16 55.93 681.48 1,996.73
Jumlah Total
6.03 6.03 77.75 225.47 - -
Selom (Selom) Serai Lemon Grass Jumlah Total
0.30 0.30 2.31 12.73 - -
85.42 81.89 1,348.91 Jumlah Total
- - - - 56.77
NEGERI SEMBILAN
NEGERI SEMBILAN
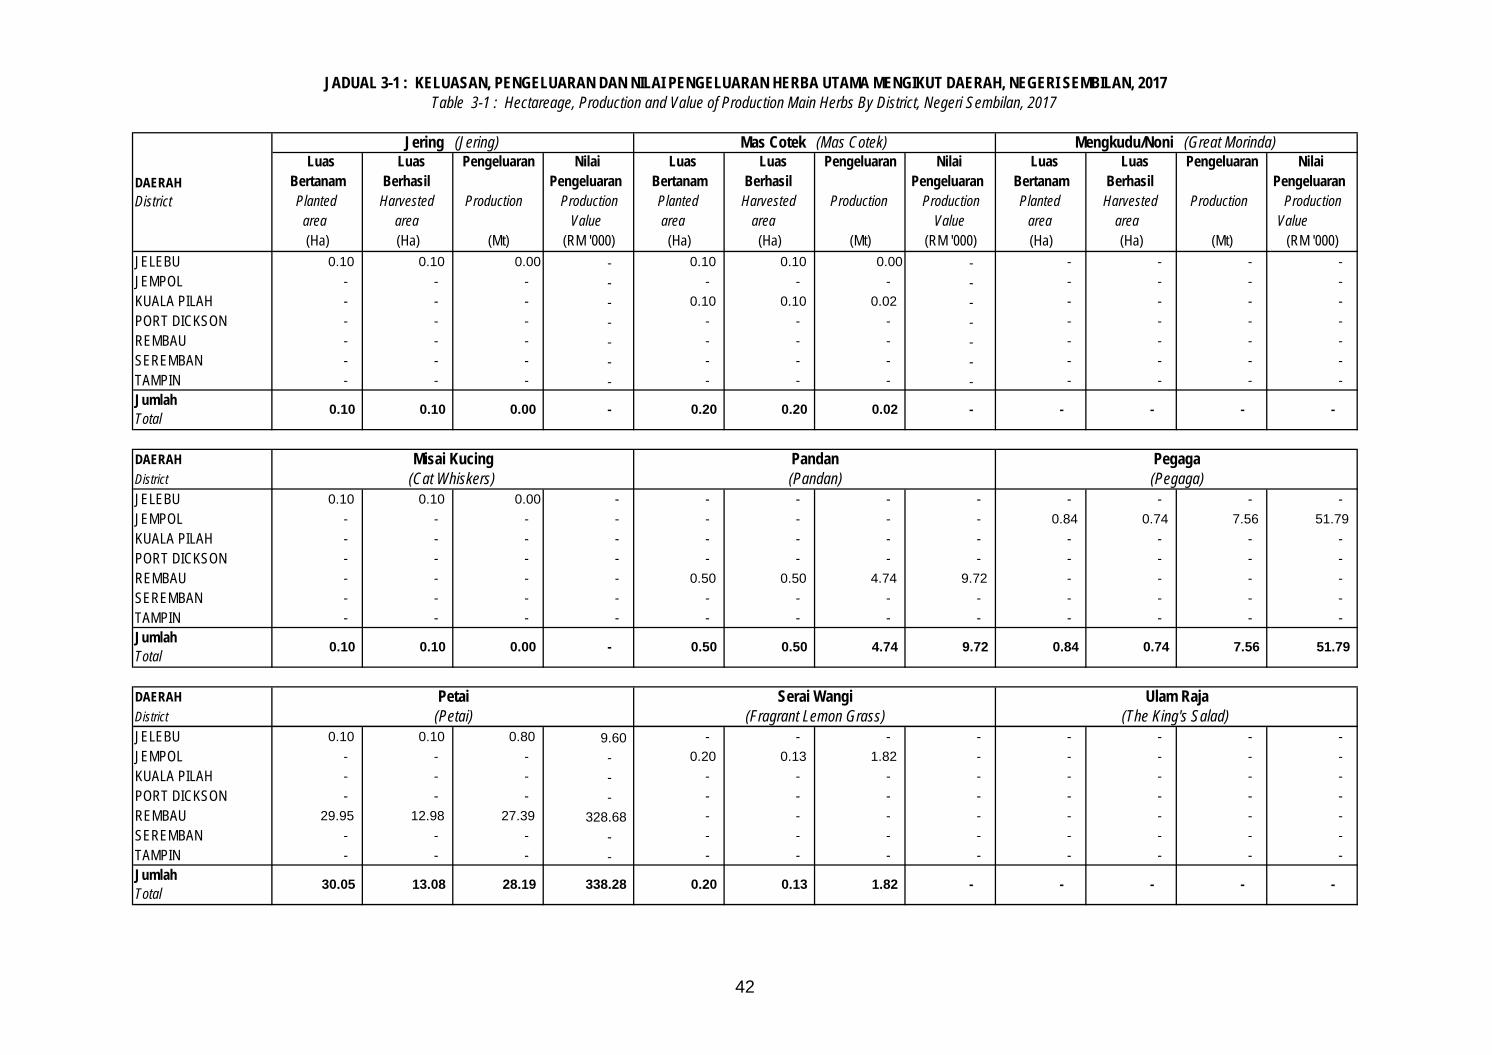
42
Luas Luas Pengeluaran Nilai Luas Luas Pengeluaran Nilai Luas Luas Pengeluaran Nilai Bertanam Berhasil Pengeluaran Bertanam Berhasil Pengeluaran Bertanam Berhasil Pengeluaran Planted Harvested Production Production Planted Harvested Production Production Planted Harvested Production Production
area area Value area area Value area area Value (Ha) (Ha) (Mt) (RM '000) (Ha) (Ha) (Mt) (RM '000) (Ha) (Ha) (Mt) (RM '000)
JELEBU 0.10 0.10 0.00 - 0.10 0.10 0.00 - - - - - JEMPOL - - - - - - - - - - - - KUALA PILAH - - - - 0.10 0.10 0.02 - - - - - PORT DICKSON - - - - - - - - - - - - REMBAU - - - - - - - - - - - - SEREMBAN - - - - - - - - - - - - TAMPIN - - - - - - - - - - - -
DAERAH DistrictJELEBU 0.10 0.10 0.00 - - - - - - - - - JEMPOL - - - - - - - - 0.84 0.74 7.56 51.79 KUALA PILAH - - - - - - - - - - - - PORT DICKSON - - - - - - - - - - - - REMBAU - - - - 0.50 0.50 4.74 9.72 - - - - SEREMBAN - - - - - - - - - - - - TAMPIN - - - - - - - - - - - -
DAERAH DistrictJELEBU 0.10 0.10 0.80 9.60 - - - - - - - - JEMPOL - - - - 0.20 0.13 1.82 - - - - - KUALA PILAH - - - - - - - - - - - - PORT DICKSON - - - - - - - - - - - - REMBAU 29.95 12.98 27.39 328.68 - - - - - - - - SEREMBAN - - - - - - - - - - - - TAMPIN - - - - - - - - - - - -
(Petai)Petai
(Fragrant Lemon Grass) (The King's Salad)
0.20 0.13 1.82 Jumlah Total
30.05 13.08 - - 28.19 338.28 -
Misai Kucing Pandan Pegaga (Cat Whiskers) (Pandan) (Pegaga)
0.50
Serai Wangi
Jumlah Total
4.74 9.72 0.10 0.10 0.00 - 0.50
0.20 0.20 0.02 -
JADUAL 3-1 : KELUASAN, PENGELUARAN DAN NILAI PENGELUARAN HERBA UTAMA MENGIKUT DAERAH, NEGERI SEMBILAN, 2017Table 3-1 : Hectareage, Production and Value of Production Main Herbs By District, Negeri Sembilan, 2017
DAERAH District
Jering (Jering) Mas Cotek (Mas Cotek) Mengkudu/Noni (Great Morinda)
Jumlah Total
0.10 0.10 0.00 - - -
- -
Ulam Raja
- -
0.84 0.74 7.56 51.79
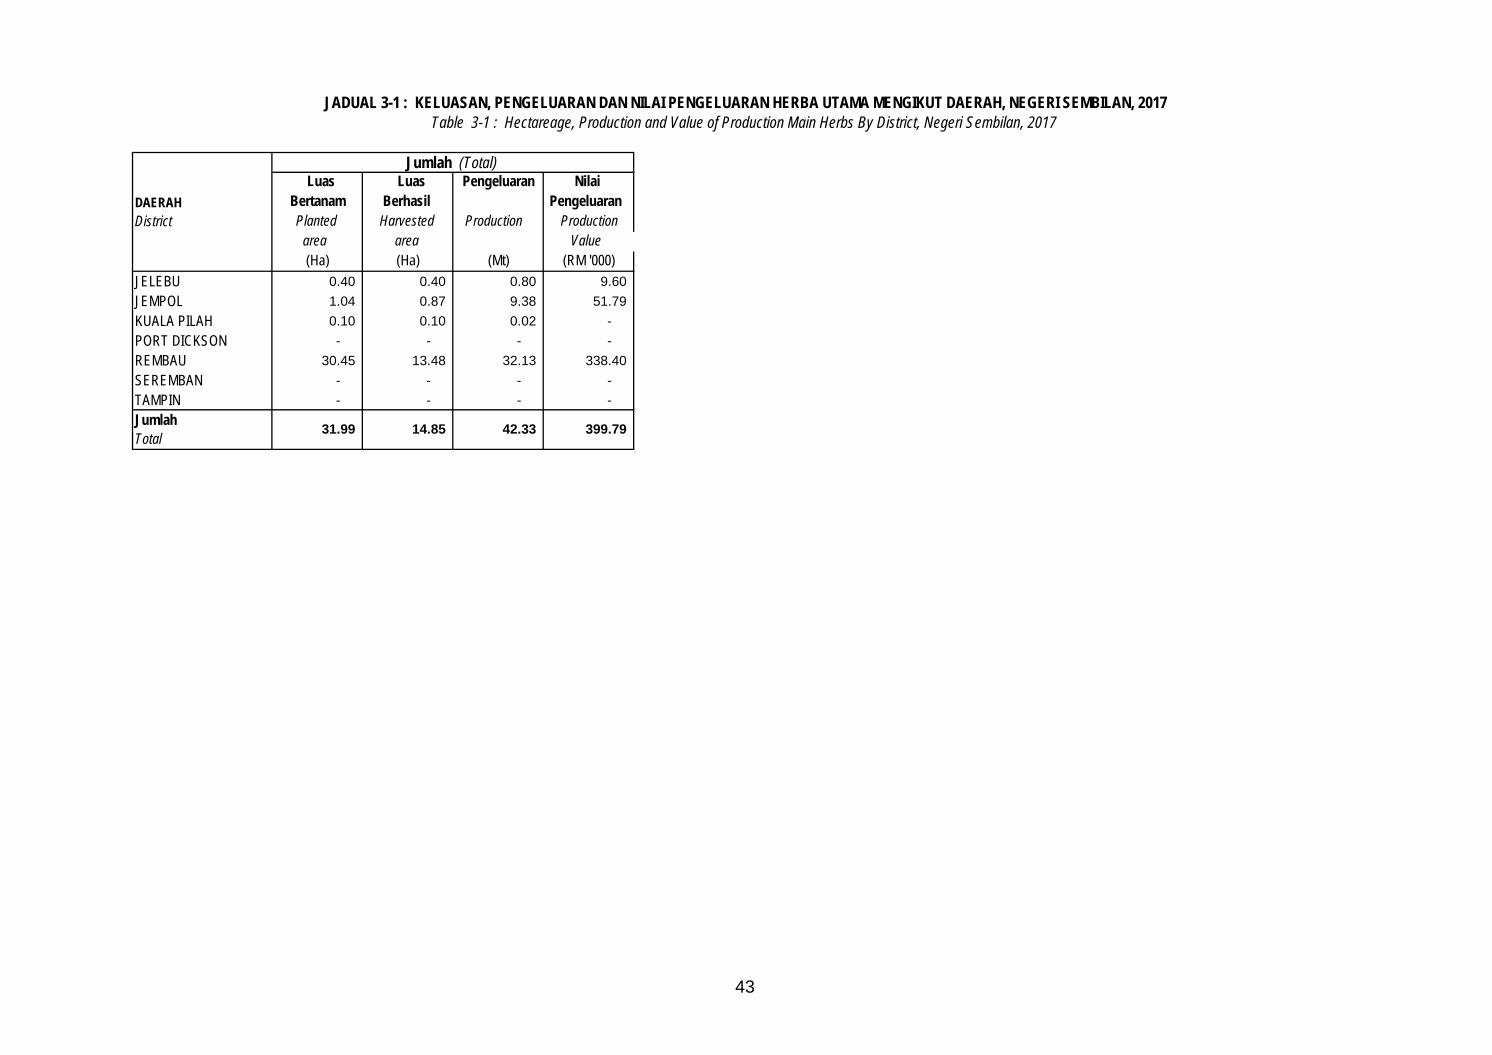
43
Luas Luas Pengeluaran Nilai Bertanam Berhasil Pengeluaran Planted Harvested Production Production
area area Value (Ha) (Ha) (Mt) (RM '000)
JELEBU 0.40 0.40 0.80 9.60 JEMPOL 1.04 0.87 9.38 51.79 KUALA PILAH 0.10 0.10 0.02 - PORT DICKSON - - - - REMBAU 30.45 13.48 32.13 338.40 SEREMBAN - - - - TAMPIN - - - -
42.33 399.79
Table 3-1 : Hectareage, Production and Value of Production Main Herbs By District, Negeri Sembilan, 2017
DAERAH District
Jumlah (Total)
JADUAL 3-1 : KELUASAN, PENGELUARAN DAN NILAI PENGELUARAN HERBA UTAMA MENGIKUT DAERAH, NEGERI SEMBILAN, 2017
Jumlah Total
31.99 14.85
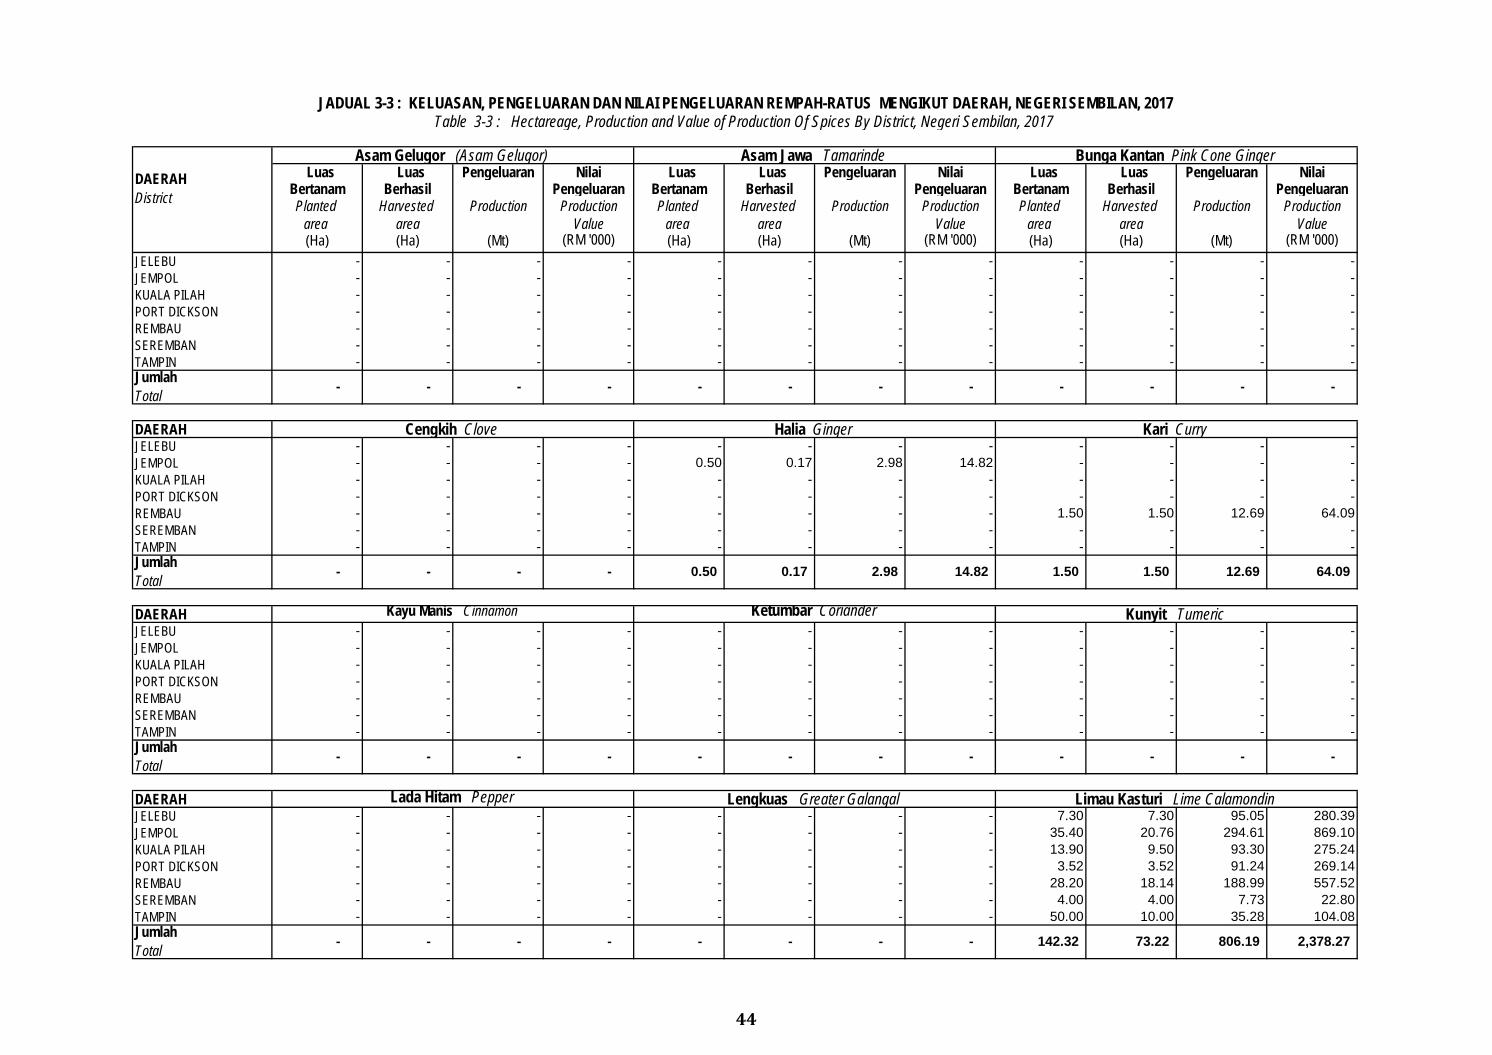
44
Luas Luas Pengeluaran Nilai Luas Luas Pengeluaran Nilai Luas Luas Pengeluaran Nilai Bertanam Berhasil Pengeluaran Bertanam Berhasil Pengeluaran Bertanam Berhasil Pengeluaran Planted Harvested Production Production Planted Harvested Production Production Planted Harvested Production Production
area area Value area area Value area area Value (Ha) (Ha) (Mt) (RM '000) (Ha) (Ha) (Mt) (RM '000) (Ha) (Ha) (Mt) (RM '000)
JELEBU - - - - - - - - - - - - JEMPOL - - - - - - - - - - - - KUALA PILAH - - - - - - - - - - - - PORT DICKSON - - - - - - - - - - - - REMBAU - - - - - - - - - - - - SEREMBAN - - - - - - - - - - - - TAMPIN - - - - - - - - - - - -
DAERAH JELEBU - - - - - - - - - - - - JEMPOL - - - - 0.50 0.17 2.98 14.82 - - - - KUALA PILAH - - - - - - - - - - - - PORT DICKSON - - - - - - - - - - - - REMBAU - - - - - - - - 1.50 1.50 12.69 64.09 SEREMBAN - - - - - - - - - - - - TAMPIN - - - - - - - - - - - -
DAERAH JELEBU - - - - - - - - - - - - JEMPOL - - - - - - - - - - - - KUALA PILAH - - - - - - - - - - - - PORT DICKSON - - - - - - - - - - - - REMBAU - - - - - - - - - - - - SEREMBAN - - - - - - - - - - - - TAMPIN - - - - - - - - - - - -
DAERAH JELEBU - - - - - - - - 7.30 7.30 95.05 280.39 JEMPOL - - - - - - - - 35.40 20.76 294.61 869.10 KUALA PILAH - - - - - - - - 13.90 9.50 93.30 275.24 PORT DICKSON - - - - - - - - 3.52 3.52 91.24 269.14 REMBAU - - - - - - - - 28.20 18.14 188.99 557.52 SEREMBAN - - - - - - - - 4.00 4.00 7.73 22.80 TAMPIN - - - - - - - - 50.00 10.00 35.28 104.08
JADUAL 3-3 : KELUASAN, PENGELUARAN DAN NILAI PENGELUARAN REMPAH-RATUS MENGIKUT DAERAH, NEGERI SEMBILAN, 2017Table 3-3 : Hectareage, Production and Value of Production Of Spices By District, Negeri Sembilan, 2017
DAERAH District
Asam Gelugor (Asam Gelugor) Asam Jawa Tamarinde Bunga Kantan Pink Cone Ginger
- Jumlah Total
- - - - - - - - - - -
64.09 0.17 2.98 14.82 1.50 1.50 12.69
Cengkih Clove Halia Ginger Kari Curry
- - - - 0.50 Jumlah Total
Kayu Manis Cinnamon Ketumbar Coriander
- - -
Lada Hitam Pepper Lengkuas Greater Galangal
- -
-
- - -
73.22
Limau Kasturi Lime Calamondin
Jumlah Total
- 142.32
Jumlah Total
- - -
Kunyit Tumeric
- - -
-
-
- - 806.19 2,378.27
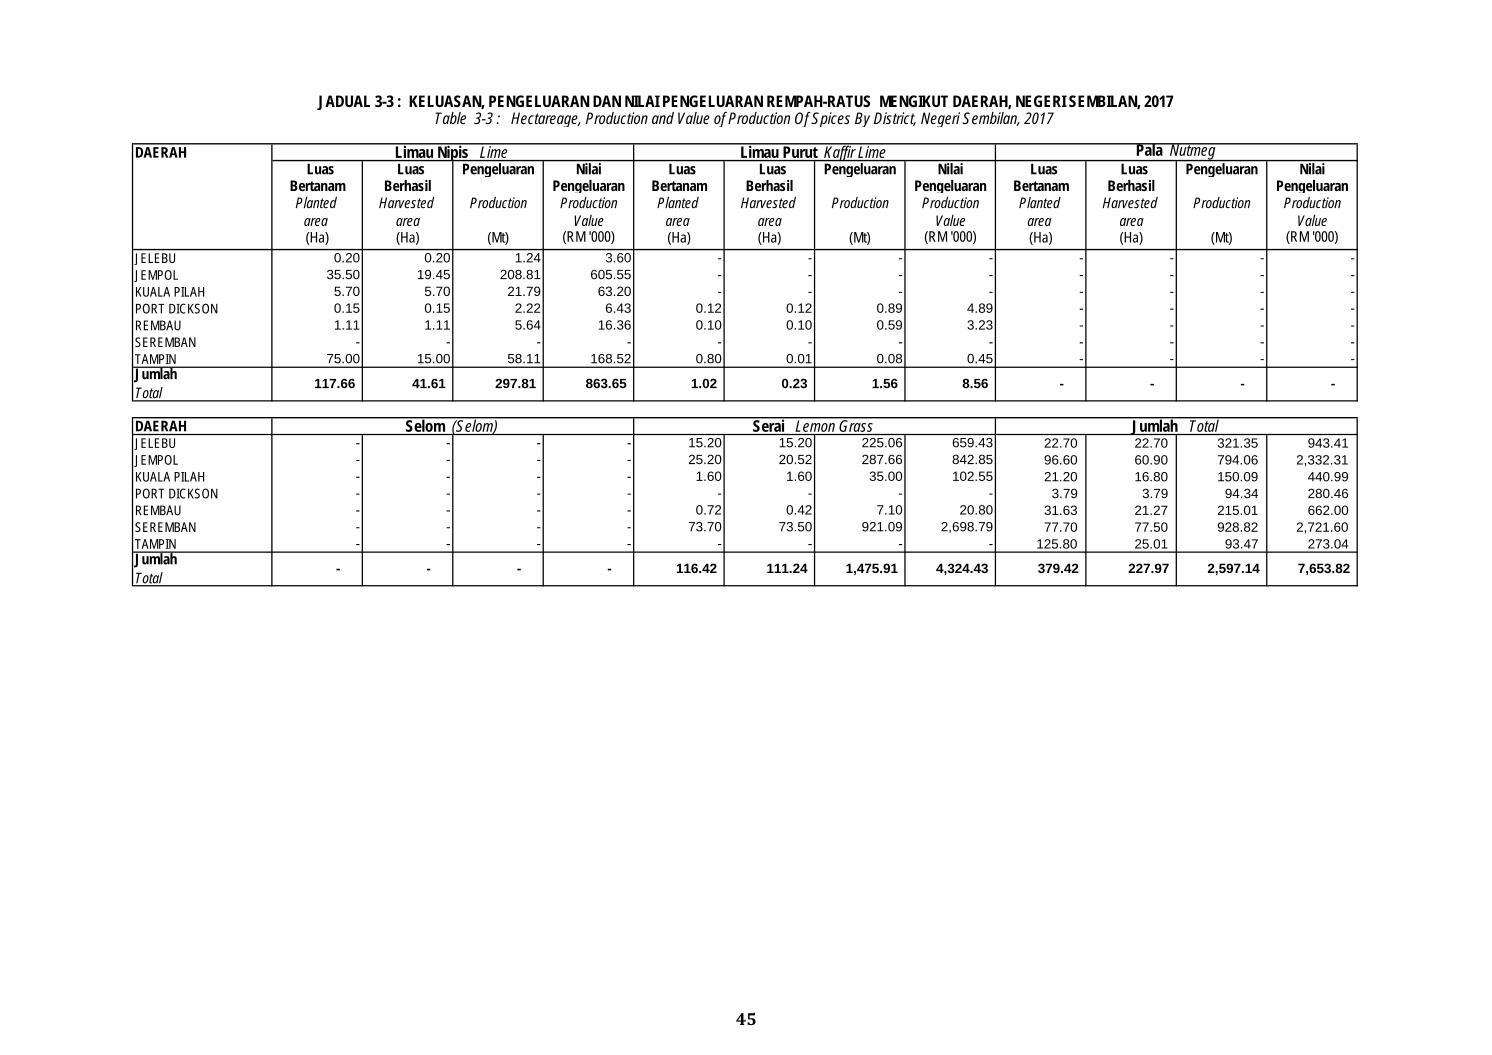
45
DAERAH Luas Luas Pengeluaran Nilai Luas Luas Pengeluaran Nilai Luas Luas Pengeluaran Nilai
Bertanam Berhasil Pengeluaran Bertanam Berhasil Pengeluaran Bertanam Berhasil Pengeluaran Planted Harvested Production Production Planted Harvested Production Production Planted Harvested Production Production
area area Value area area Value area area Value (Ha) (Ha) (Mt) (RM '000) (Ha) (Ha) (Mt) (RM '000) (Ha) (Ha) (Mt) (RM '000)
JELEBU 0.20 0.20 1.24 3.60 - - - - - - - - JEMPOL 35.50 19.45 208.81 605.55 - - - - - - - - KUALA PILAH 5.70 5.70 21.79 63.20 - - - - - - - - PORT DICKSON 0.15 0.15 2.22 6.43 0.12 0.12 0.89 4.89 - - - - REMBAU 1.11 1.11 5.64 16.36 0.10 0.10 0.59 3.23 - - - - SEREMBAN - - - - - - - - - - - - TAMPIN 75.00 15.00 58.11 168.52 0.80 0.01 0.08 0.45 - - - -
DAERAH JELEBU - - - - 15.20 15.20 225.06 659.43 22.70 22.70 321.35 943.41 JEMPOL - - - - 25.20 20.52 287.66 842.85 96.60 60.90 794.06 2,332.31 KUALA PILAH - - - - 1.60 1.60 35.00 102.55 21.20 16.80 150.09 440.99 PORT DICKSON - - - - - - - - 3.79 3.79 94.34 280.46 REMBAU - - - - 0.72 0.42 7.10 20.80 31.63 21.27 215.01 662.00 SEREMBAN - - - - 73.70 73.50 921.09 2,698.79 77.70 77.50 928.82 2,721.60 TAMPIN - - - - - - - - 125.80 25.01 93.47 273.04
1.56 8.56 - -
Pala Nutmeg
Jumlah Total
117.66 41.61 297.81 863.65
JADUAL 3-3 : KELUASAN, PENGELUARAN DAN NILAI PENGELUARAN REMPAH-RATUS MENGIKUT DAERAH, NEGERI SEMBILAN, 2017
379.42 227.97 2,597.14 7,653.82
Selom (Selom) Serai Lemon Grass Jumlah Total
Limau Nipis Lime Limau Purut Kaffir Lime
Table 3-3 : Hectareage, Production and Value of Production Of Spices By District, Negeri Sembilan, 2017
- - 1.02 0.23
Jumlah Total
- 4,324.43 111.24 1,475.91 - - - 116.42
PAHANG
PAHANG
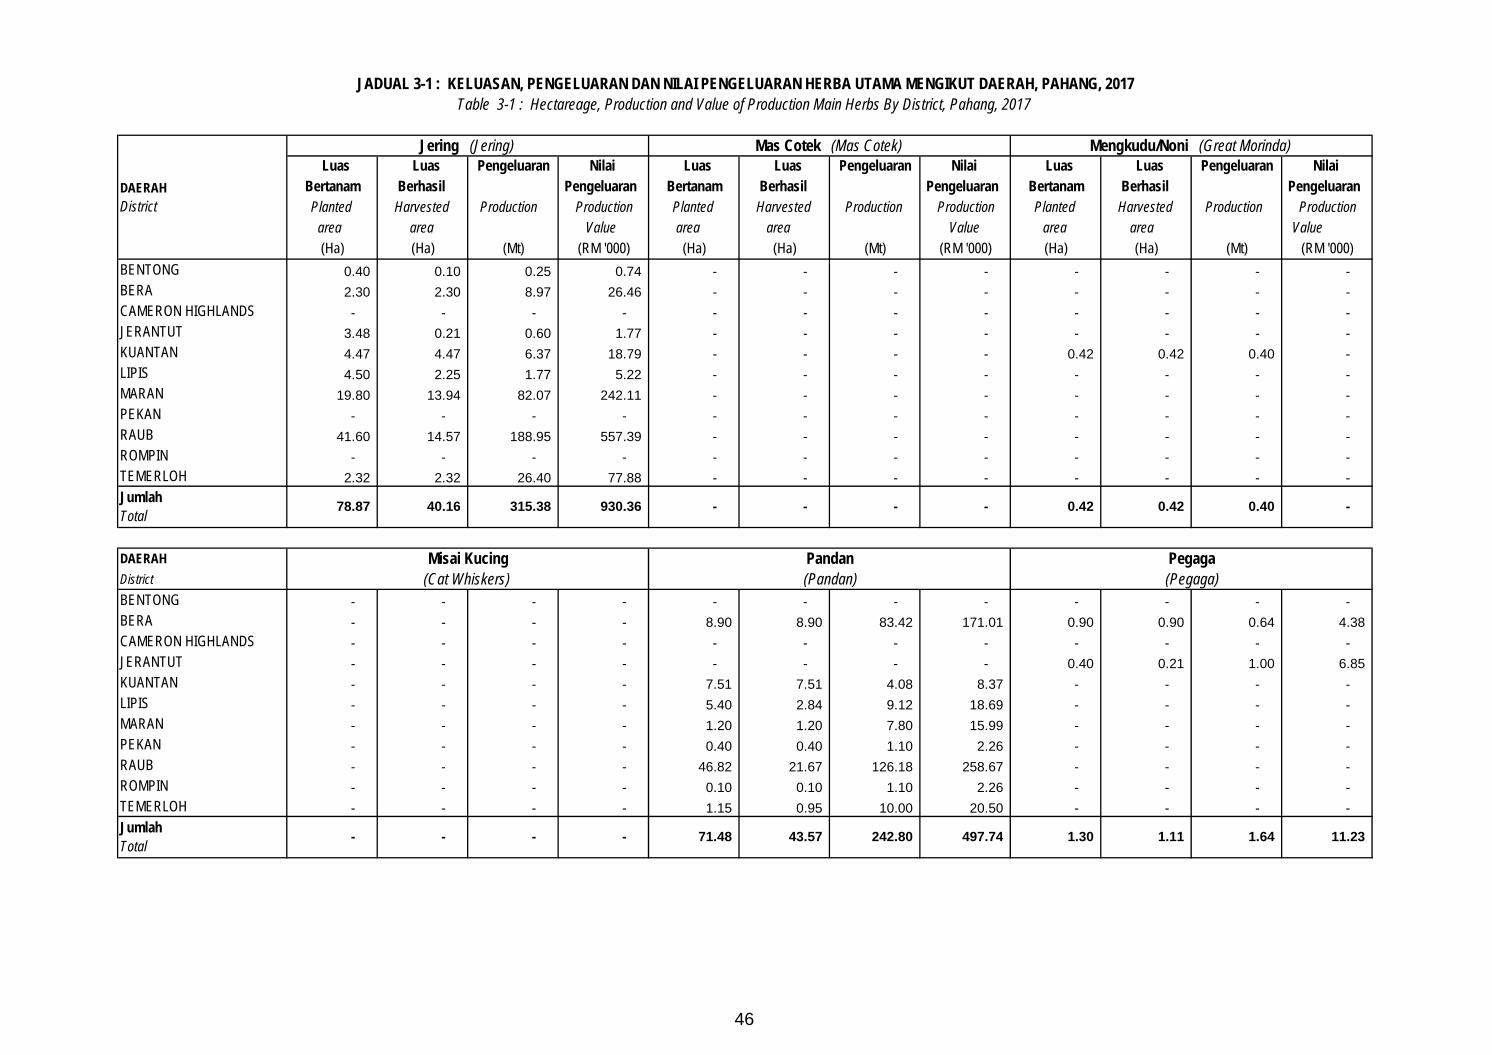
46
Luas Luas Pengeluaran Nilai Luas Luas Pengeluaran Nilai Luas Luas Pengeluaran Nilai Bertanam Berhasil Pengeluaran Bertanam Berhasil Pengeluaran Bertanam Berhasil Pengeluaran Planted Harvested Production Production Planted Harvested Production Production Planted Harvested Production Production
area area Value area area Value area area Value (Ha) (Ha) (Mt) (RM '000) (Ha) (Ha) (Mt) (RM '000) (Ha) (Ha) (Mt) (RM '000)
BENTONG 0.40 0.10 0.25 0.74 - - - - - - - - BERA 2.30 2.30 8.97 26.46 - - - - - - - - CAMERON HIGHLANDS - - - - - - - - - - - - JERANTUT 3.48 0.21 0.60 1.77 - - - - - - - - KUANTAN 4.47 4.47 6.37 18.79 - - - - 0.42 0.42 0.40 - LIPIS 4.50 2.25 1.77 5.22 - - - - - - - - MARAN 19.80 13.94 82.07 242.11 - - - - - - - - PEKAN - - - - - - - - - - - - RAUB 41.60 14.57 188.95 557.39 - - - - - - - - ROMPIN - - - - - - - - - - - - TEMERLOH 2.32 2.32 26.40 77.88 - - - - - - - -
DAERAH DistrictBENTONG - - - - - - - - - - - - BERA - - - - 8.90 8.90 83.42 171.01 0.90 0.90 0.64 4.38 CAMERON HIGHLANDS - - - - - - - - - - - - JERANTUT - - - - - - - - 0.40 0.21 1.00 6.85 KUANTAN - - - - 7.51 7.51 4.08 8.37 - - - - LIPIS - - - - 5.40 2.84 9.12 18.69 - - - - MARAN - - - - 1.20 1.20 7.80 15.99 - - - - PEKAN - - - - 0.40 0.40 1.10 2.26 - - - - RAUB - - - - 46.82 21.67 126.18 258.67 - - - - ROMPIN - - - - 0.10 0.10 1.10 2.26 - - - - TEMERLOH - - - - 1.15 0.95 10.00 20.50 - - - -
JADUAL 3-1 : KELUASAN, PENGELUARAN DAN NILAI PENGELUARAN HERBA UTAMA MENGIKUT DAERAH, PAHANG, 2017Table 3-1 : Hectareage, Production and Value of Production Main Herbs By District, Pahang, 2017
DAERAH District
Jering (Jering) Mas Cotek (Mas Cotek) Mengkudu/Noni (Great Morinda)
Jumlah Total
78.87 40.16 315.38 930.36 - - - - 0.42 0.42 0.40 -
Misai Kucing Pandan Pegaga (Cat Whiskers) (Pandan) (Pegaga)
Jumlah Total
- - - - 71.48 43.57 242.80 497.74 1.30 1.11 1.64 11.23
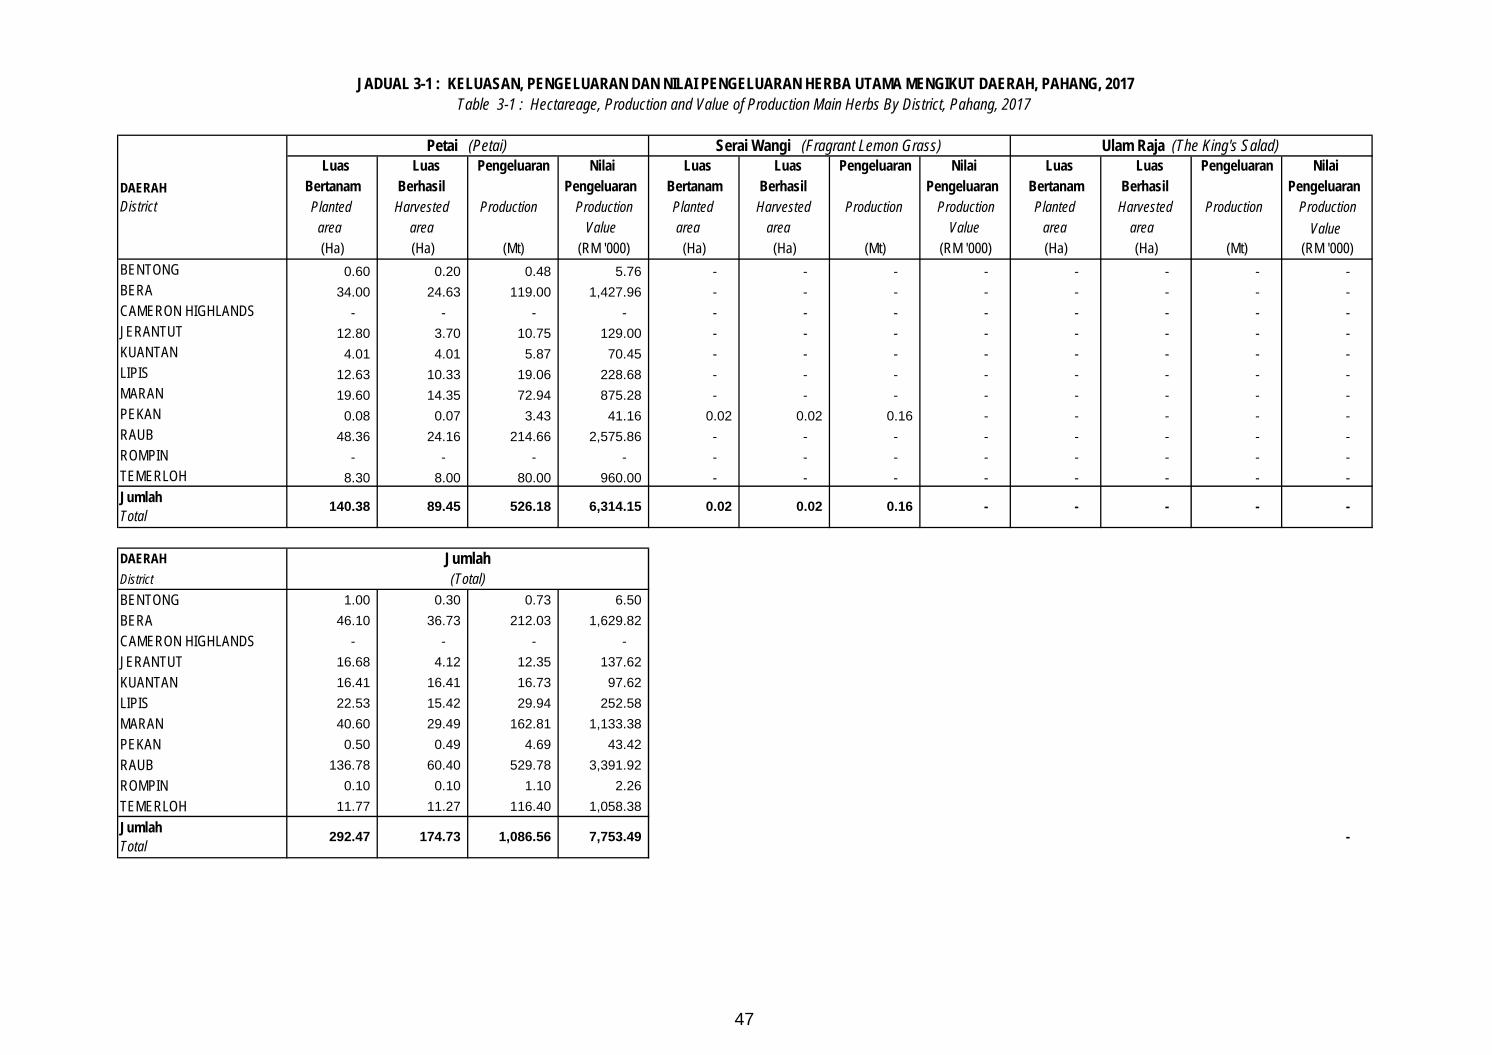
47
Luas Luas Pengeluaran Nilai Luas Luas Pengeluaran Nilai Luas Luas Pengeluaran Nilai Bertanam Berhasil Pengeluaran Bertanam Berhasil Pengeluaran Bertanam Berhasil Pengeluaran Planted Harvested Production Production Planted Harvested Production Production Planted Harvested Production Production
area area Value area area Value area area Value (Ha) (Ha) (Mt) (RM '000) (Ha) (Ha) (Mt) (RM '000) (Ha) (Ha) (Mt) (RM '000)
BENTONG 0.60 0.20 0.48 5.76 - - - - - - - - BERA 34.00 24.63 119.00 1,427.96 - - - - - - - - CAMERON HIGHLANDS - - - - - - - - - - - - JERANTUT 12.80 3.70 10.75 129.00 - - - - - - - - KUANTAN 4.01 4.01 5.87 70.45 - - - - - - - - LIPIS 12.63 10.33 19.06 228.68 - - - - - - - - MARAN 19.60 14.35 72.94 875.28 - - - - - - - - PEKAN 0.08 0.07 3.43 41.16 0.02 0.02 0.16 - - - - - RAUB 48.36 24.16 214.66 2,575.86 - - - - - - - - ROMPIN - - - - - - - - - - - - TEMERLOH 8.30 8.00 80.00 960.00 - - - - - - - -
DAERAH DistrictBENTONG 1.00 0.30 0.73 6.50 BERA 46.10 36.73 212.03 1,629.82 CAMERON HIGHLANDS - - - - JERANTUT 16.68 4.12 12.35 137.62 KUANTAN 16.41 16.41 16.73 97.62 LIPIS 22.53 15.42 29.94 252.58 MARAN 40.60 29.49 162.81 1,133.38 PEKAN 0.50 0.49 4.69 43.42 RAUB 136.78 60.40 529.78 3,391.92 ROMPIN 0.10 0.10 1.10 2.26 TEMERLOH 11.77 11.27 116.40 1,058.38
-
JADUAL 3-1 : KELUASAN, PENGELUARAN DAN NILAI PENGELUARAN HERBA UTAMA MENGIKUT DAERAH, PAHANG, 2017Table 3-1 : Hectareage, Production and Value of Production Main Herbs By District, Pahang, 2017
DAERAH District
Petai (Petai) Serai Wangi (Fragrant Lemon Grass) Ulam Raja (The King's Salad)
Jumlah Total
140.38 89.45 526.18 6,314.15 0.02 0.02 0.16 - - - - -
Jumlah (Total)
Jumlah Total
292.47 174.73 1,086.56 7,753.49
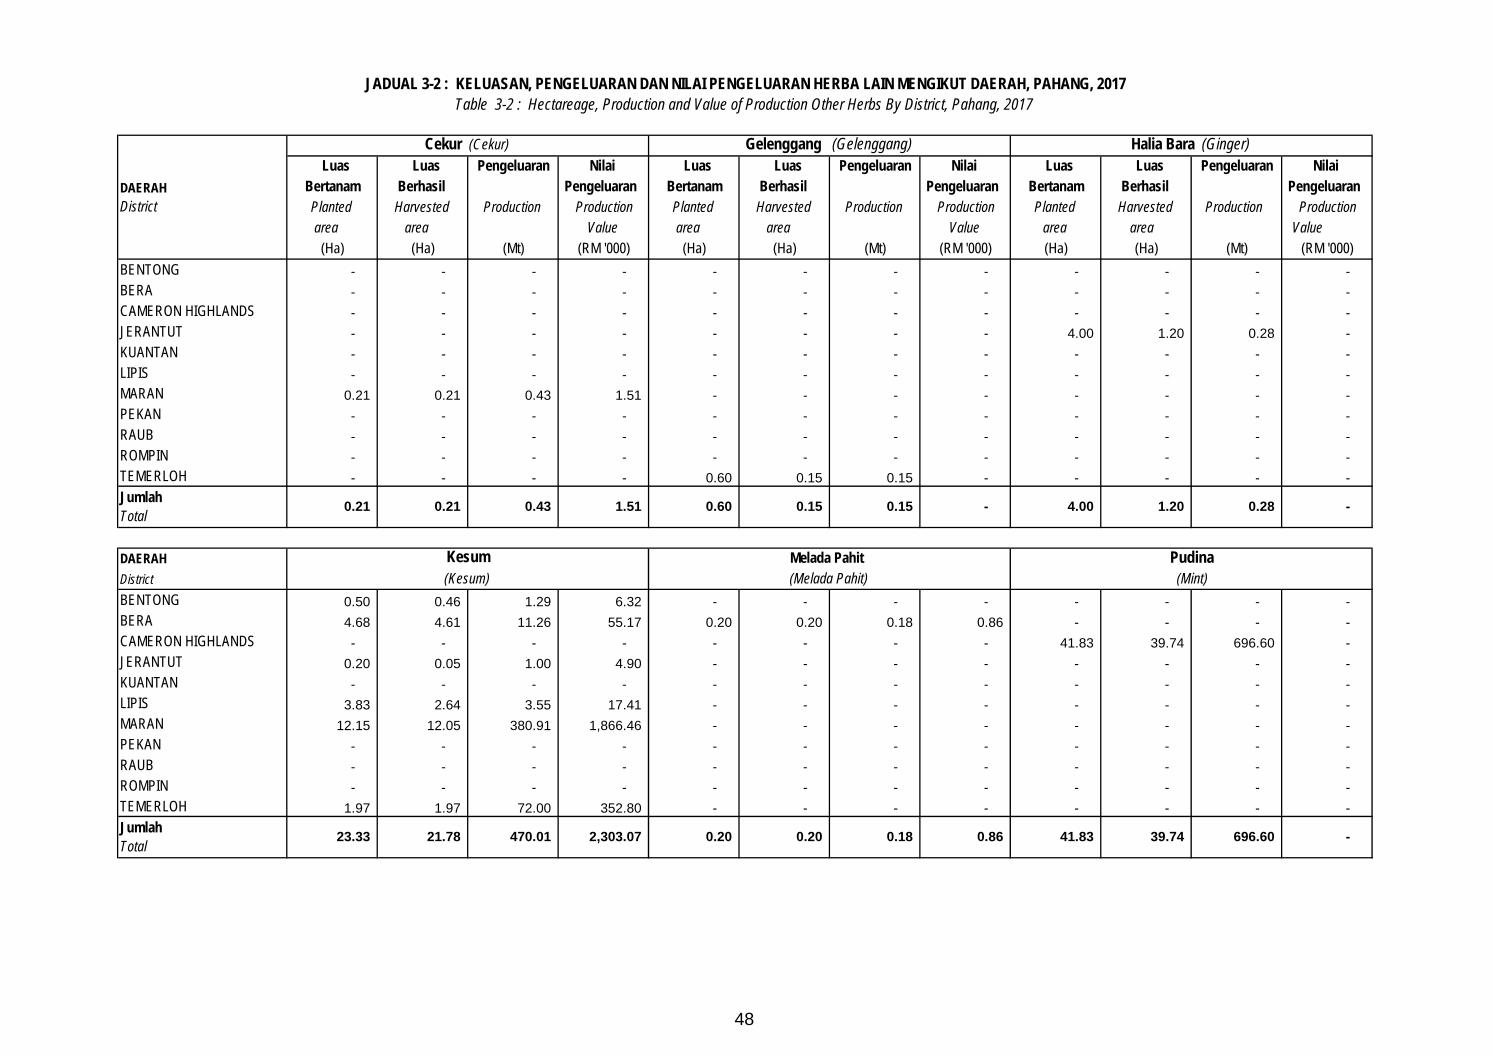
48
Luas Luas Pengeluaran Nilai Luas Luas Pengeluaran Nilai Luas Luas Pengeluaran Nilai Bertanam Berhasil Pengeluaran Bertanam Berhasil Pengeluaran Bertanam Berhasil Pengeluaran Planted Harvested Production Production Planted Harvested Production Production Planted Harvested Production Production
area area Value area area Value area area Value (Ha) (Ha) (Mt) (RM '000) (Ha) (Ha) (Mt) (RM '000) (Ha) (Ha) (Mt) (RM '000)
BENTONG - - - - - - - - - - - - BERA - - - - - - - - - - - - CAMERON HIGHLANDS - - - - - - - - - - - - JERANTUT - - - - - - - - 4.00 1.20 0.28 - KUANTAN - - - - - - - - - - - - LIPIS - - - - - - - - - - - - MARAN 0.21 0.21 0.43 1.51 - - - - - - - - PEKAN - - - - - - - - - - - - RAUB - - - - - - - - - - - - ROMPIN - - - - - - - - - - - - TEMERLOH - - - - 0.60 0.15 0.15 - - - - -
DAERAH DistrictBENTONG 0.50 0.46 1.29 6.32 - - - - - - - - BERA 4.68 4.61 11.26 55.17 0.20 0.20 0.18 0.86 - - - - CAMERON HIGHLANDS - - - - - - - - 41.83 39.74 696.60 - JERANTUT 0.20 0.05 1.00 4.90 - - - - - - - - KUANTAN - - - - - - - - - - - - LIPIS 3.83 2.64 3.55 17.41 - - - - - - - - MARAN 12.15 12.05 380.91 1,866.46 - - - - - - - - PEKAN - - - - - - - - - - - - RAUB - - - - - - - - - - - - ROMPIN - - - - - - - - - - - - TEMERLOH 1.97 1.97 72.00 352.80 - - - - - - - -
Melada Pahit Pudina
Jumlah Total
696.60 23.33 21.78 470.01 2,303.07 0.18
Kesum (Kesum) (Melada Pahit) (Mint)
JADUAL 3-2 : KELUASAN, PENGELUARAN DAN NILAI PENGELUARAN HERBA LAIN MENGIKUT DAERAH, PAHANG, 2017Table 3-2 : Hectareage, Production and Value of Production Other Herbs By District, Pahang, 2017
DAERAH District
Cekur (Cekur) Gelenggang (Gelenggang) Halia Bara (Ginger)
- 0.15 0.15 - 4.00 1.20 0.28 Jumlah Total
0.21 0.21 0.43 1.51 0.60
- 0.20 0.20 0.86 41.83 39.74
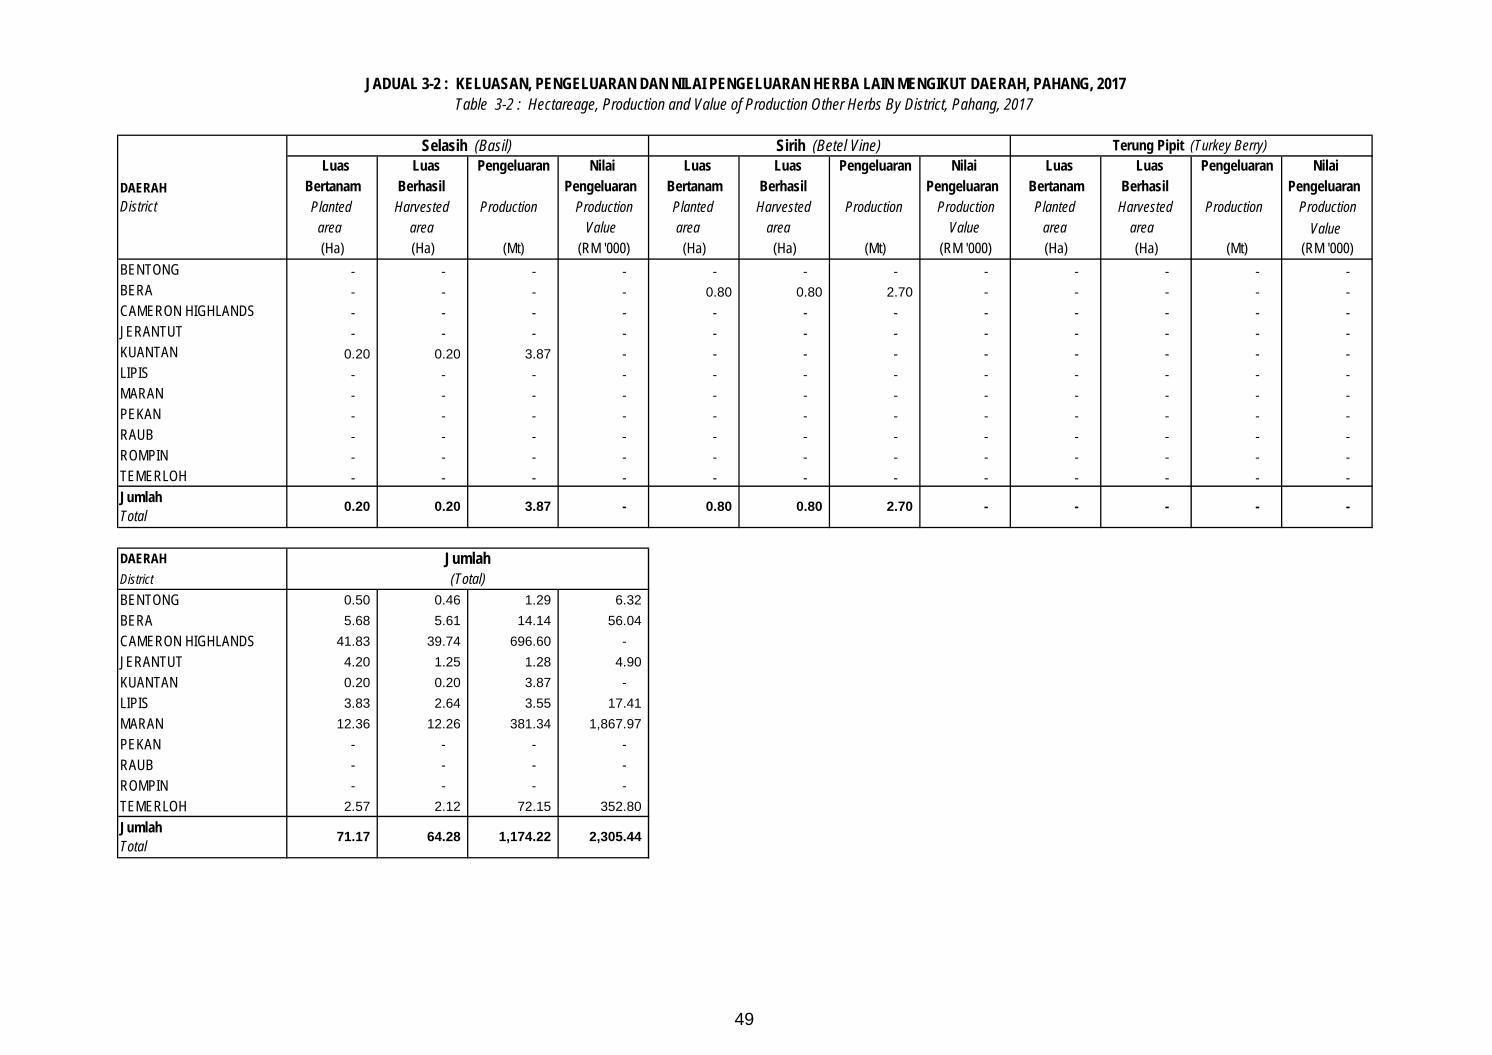
49
Luas Luas Pengeluaran Nilai Luas Luas Pengeluaran Nilai Luas Luas Pengeluaran Nilai Bertanam Berhasil Pengeluaran Bertanam Berhasil Pengeluaran Bertanam Berhasil Pengeluaran Planted Harvested Production Production Planted Harvested Production Production Planted Harvested Production Production
area area Value area area Value area area Value (Ha) (Ha) (Mt) (RM '000) (Ha) (Ha) (Mt) (RM '000) (Ha) (Ha) (Mt) (RM '000)
BENTONG - - - - - - - - - - - - BERA - - - - 0.80 0.80 2.70 - - - - - CAMERON HIGHLANDS - - - - - - - - - - - - JERANTUT - - - - - - - - - - - - KUANTAN 0.20 0.20 3.87 - - - - - - - - - LIPIS - - - - - - - - - - - - MARAN - - - - - - - - - - - - PEKAN - - - - - - - - - - - - RAUB - - - - - - - - - - - - ROMPIN - - - - - - - - - - - - TEMERLOH - - - - - - - - - - - -
DAERAH DistrictBENTONG 0.50 0.46 1.29 6.32 BERA 5.68 5.61 14.14 56.04 CAMERON HIGHLANDS 41.83 39.74 696.60 - JERANTUT 4.20 1.25 1.28 4.90 KUANTAN 0.20 0.20 3.87 - LIPIS 3.83 2.64 3.55 17.41 MARAN 12.36 12.26 381.34 1,867.97 PEKAN - - - - RAUB - - - - ROMPIN - - - - TEMERLOH 2.57 2.12 72.15 352.80 Jumlah Total
0.80 2.70 - - - - Jumlah Total
0.20 0.20 3.87 - 0.80
(Total)
71.17 64.28 1,174.22 2,305.44
-
Jumlah
Terung Pipit (Turkey Berry)Sirih (Betel Vine)Selasih (Basil)
DAERAH District
Table 3-2 : Hectareage, Production and Value of Production Other Herbs By District, Pahang, 2017JADUAL 3-2 : KELUASAN, PENGELUARAN DAN NILAI PENGELUARAN HERBA LAIN MENGIKUT DAERAH, PAHANG, 2017
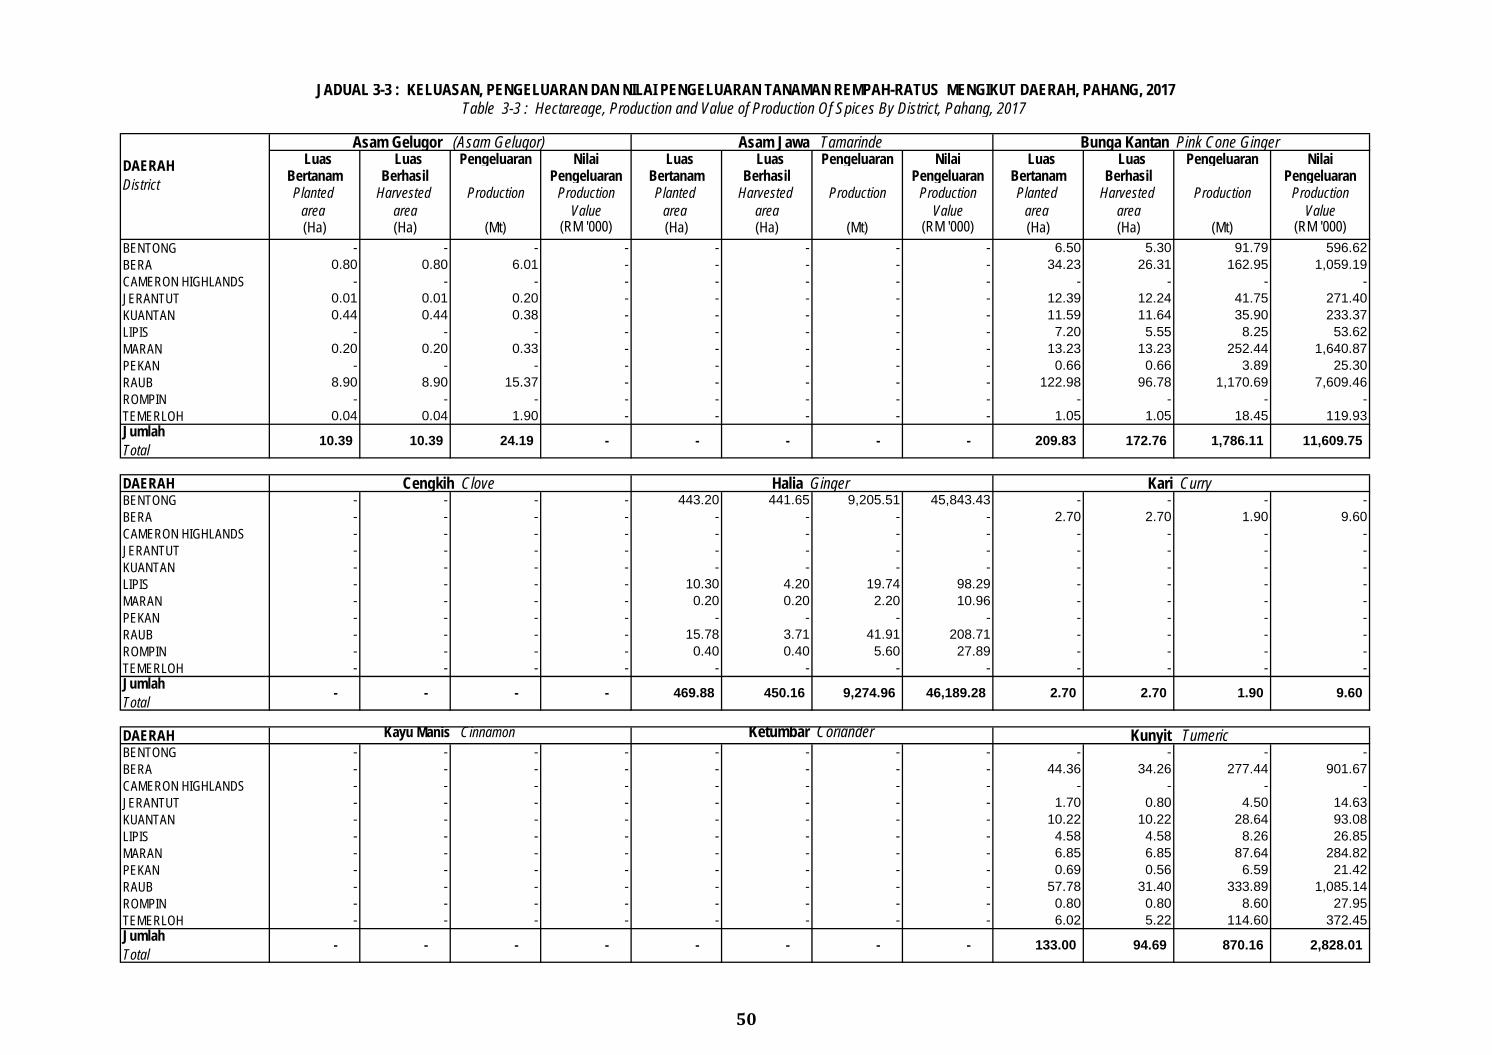
50
Luas Luas Pengeluaran Nilai Luas Luas Pengeluaran Nilai Luas Luas Pengeluaran Nilai Bertanam Berhasil Pengeluaran Bertanam Berhasil Pengeluaran Bertanam Berhasil Pengeluaran Planted Harvested Production Production Planted Harvested Production Production Planted Harvested Production Production
area area Value area area Value area area Value (Ha) (Ha) (Mt) (RM '000) (Ha) (Ha) (Mt) (RM '000) (Ha) (Ha) (Mt) (RM '000)
BENTONG - - - - - - - - 6.50 5.30 91.79 596.62 BERA 0.80 0.80 6.01 - - - - - 34.23 26.31 162.95 1,059.19 CAMERON HIGHLANDS - - - - - - - - - - - - JERANTUT 0.01 0.01 0.20 - - - - - 12.39 12.24 41.75 271.40 KUANTAN 0.44 0.44 0.38 - - - - - 11.59 11.64 35.90 233.37 LIPIS - - - - - - - - 7.20 5.55 8.25 53.62 MARAN 0.20 0.20 0.33 - - - - - 13.23 13.23 252.44 1,640.87 PEKAN - - - - - - - - 0.66 0.66 3.89 25.30 RAUB 8.90 8.90 15.37 - - - - - 122.98 96.78 1,170.69 7,609.46 ROMPIN - - - - - - - - - - - - TEMERLOH 0.04 0.04 1.90 - - - - - 1.05 1.05 18.45 119.93
DAERAH BENTONG - - - - 443.20 441.65 9,205.51 45,843.43 - - - - BERA - - - - - - - - 2.70 2.70 1.90 9.60 CAMERON HIGHLANDS - - - - - - - - - - - - JERANTUT - - - - - - - - - - - - KUANTAN - - - - - - - - - - - - LIPIS - - - - 10.30 4.20 19.74 98.29 - - - - MARAN - - - - 0.20 0.20 2.20 10.96 - - - - PEKAN - - - - - - - - - - - - RAUB - - - - 15.78 3.71 41.91 208.71 - - - - ROMPIN - - - - 0.40 0.40 5.60 27.89 - - - - TEMERLOH - - - - - - - - - - - -
DAERAH BENTONG - - - - - - - - - - - - BERA - - - - - - - - 44.36 34.26 277.44 901.67 CAMERON HIGHLANDS - - - - - - - - - - - - JERANTUT - - - - - - - - 1.70 0.80 4.50 14.63 KUANTAN - - - - - - - - 10.22 10.22 28.64 93.08 LIPIS - - - - - - - - 4.58 4.58 8.26 26.85 MARAN - - - - - - - - 6.85 6.85 87.64 284.82 PEKAN - - - - - - - - 0.69 0.56 6.59 21.42 RAUB - - - - - - - - 57.78 31.40 333.89 1,085.14 ROMPIN - - - - - - - - 0.80 0.80 8.60 27.95 TEMERLOH - - - - - - - - 6.02 5.22 114.60 372.45
- - - 133.00 94.69 870.16
9.60
Kayu Manis Cinnamon Ketumbar Coriander Kunyit Tumeric
Jumlah Total
- - - - -
450.16 9,274.96 46,189.28 2.70 2.70 1.90
2,828.01
Jumlah Total
- - - - 469.88
JADUAL 3-3 : KELUASAN, PENGELUARAN DAN NILAI PENGELUARAN TANAMAN REMPAH-RATUS MENGIKUT DAERAH, PAHANG, 2017Table 3-3 : Hectareage, Production and Value of Production Of Spices By District, Pahang, 2017
DAERAH District
Asam Gelugor (Asam Gelugor) Asam Jawa Tamarinde Bunga Kantan Pink Cone Ginger
11,609.75
Cengkih Clove Halia Ginger Kari Curry
209.83 172.76 1,786.11 - - - Jumlah Total
10.39 10.39 24.19 - -
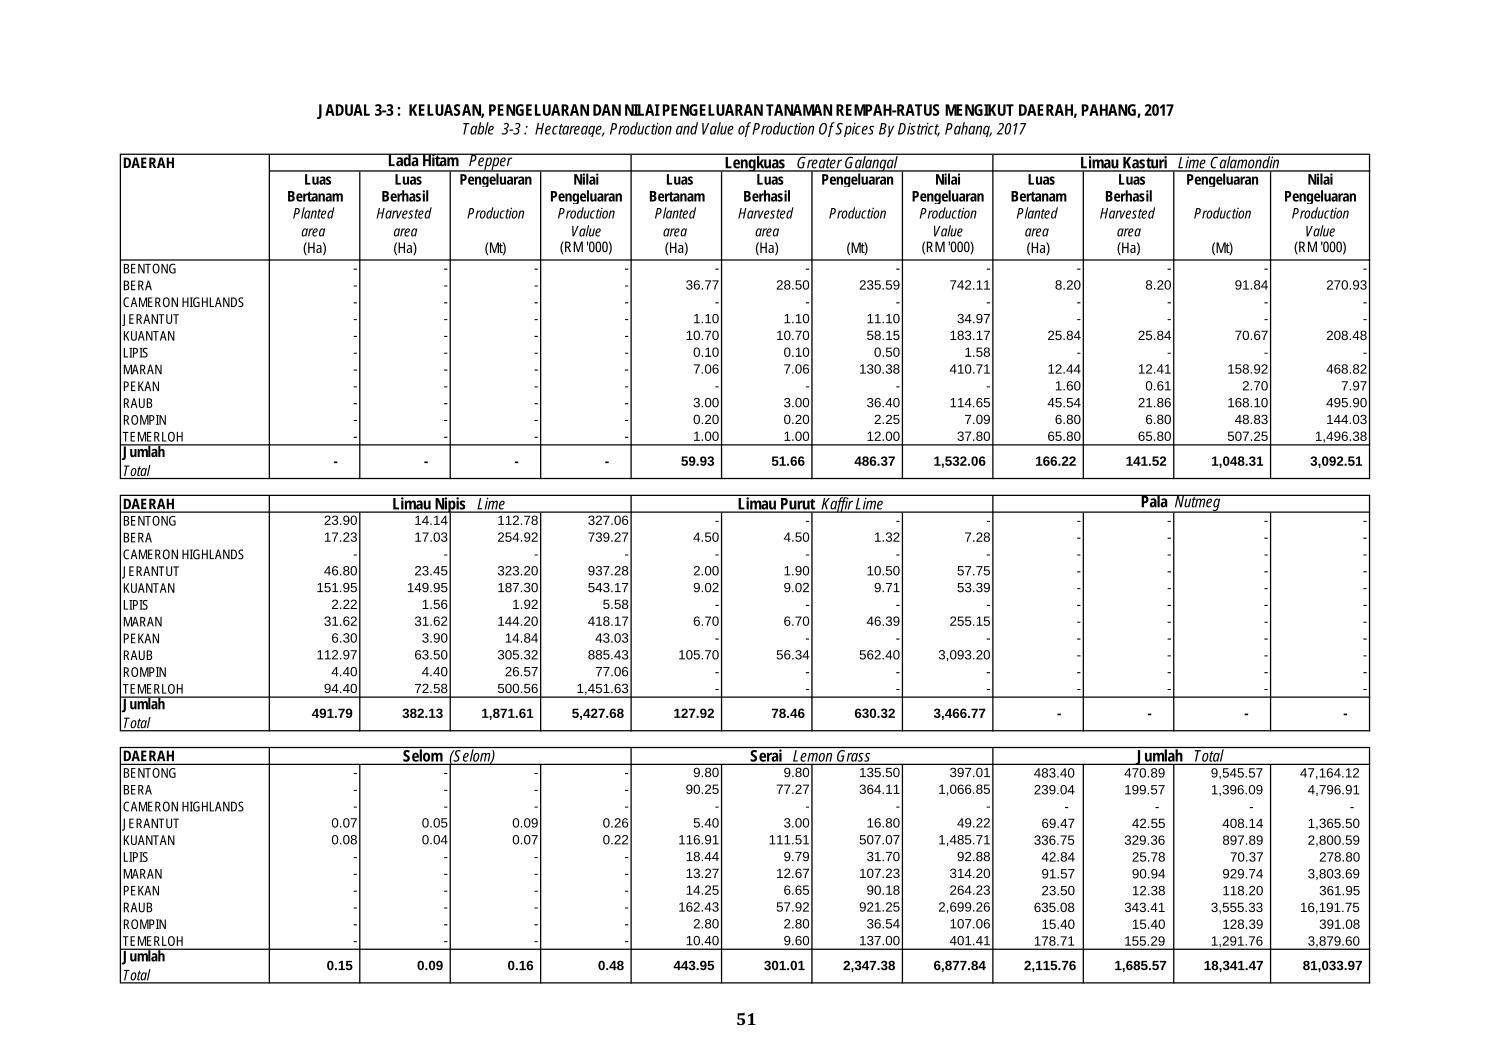
51
DAERAH Luas Luas Pengeluaran Nilai Luas Luas Pengeluaran Nilai Luas Luas Pengeluaran Nilai
Bertanam Berhasil Pengeluaran Bertanam Berhasil Pengeluaran Bertanam Berhasil Pengeluaran Planted Harvested Production Production Planted Harvested Production Production Planted Harvested Production Production
area area Value area area Value area area Value (Ha) (Ha) (Mt) (RM '000) (Ha) (Ha) (Mt) (RM '000) (Ha) (Ha) (Mt) (RM '000)
BENTONG - - - - - - - - - - - - BERA - - - - 36.77 28.50 235.59 742.11 8.20 8.20 91.84 270.93 CAMERON HIGHLANDS - - - - - - - - - - - - JERANTUT - - - - 1.10 1.10 11.10 34.97 - - - - KUANTAN - - - - 10.70 10.70 58.15 183.17 25.84 25.84 70.67 208.48 LIPIS - - - - 0.10 0.10 0.50 1.58 - - - - MARAN - - - - 7.06 7.06 130.38 410.71 12.44 12.41 158.92 468.82 PEKAN - - - - - - - - 1.60 0.61 2.70 7.97 RAUB - - - - 3.00 3.00 36.40 114.65 45.54 21.86 168.10 495.90 ROMPIN - - - - 0.20 0.20 2.25 7.09 6.80 6.80 48.83 144.03 TEMERLOH - - - - 1.00 1.00 12.00 37.80 65.80 65.80 507.25 1,496.38
DAERAH BENTONG 23.90 14.14 112.78 327.06 - - - - - - - - BERA 17.23 17.03 254.92 739.27 4.50 4.50 1.32 7.28 - - - - CAMERON HIGHLANDS - - - - - - - - - - - - JERANTUT 46.80 23.45 323.20 937.28 2.00 1.90 10.50 57.75 - - - - KUANTAN 151.95 149.95 187.30 543.17 9.02 9.02 9.71 53.39 - - - - LIPIS 2.22 1.56 1.92 5.58 - - - - - - - - MARAN 31.62 31.62 144.20 418.17 6.70 6.70 46.39 255.15 - - - - PEKAN 6.30 3.90 14.84 43.03 - - - - - - - - RAUB 112.97 63.50 305.32 885.43 105.70 56.34 562.40 3,093.20 - - - - ROMPIN 4.40 4.40 26.57 77.06 - - - - - - - - TEMERLOH 94.40 72.58 500.56 1,451.63 - - - - - - - -
DAERAH BENTONG - - - - 9.80 9.80 135.50 397.01 483.40 470.89 9,545.57 47,164.12 BERA - - - - 90.25 77.27 364.11 1,066.85 239.04 199.57 1,396.09 4,796.91 CAMERON HIGHLANDS - - - - - - - - - - - - JERANTUT 0.07 0.05 0.09 0.26 5.40 3.00 16.80 49.22 69.47 42.55 408.14 1,365.50 KUANTAN 0.08 0.04 0.07 0.22 116.91 111.51 507.07 1,485.71 336.75 329.36 897.89 2,800.59 LIPIS - - - - 18.44 9.79 31.70 92.88 42.84 25.78 70.37 278.80 MARAN - - - - 13.27 12.67 107.23 314.20 91.57 90.94 929.74 3,803.69 PEKAN - - - - 14.25 6.65 90.18 264.23 23.50 12.38 118.20 361.95 RAUB - - - - 162.43 57.92 921.25 2,699.26 635.08 343.41 3,555.33 16,191.75 ROMPIN - - - - 2.80 2.80 36.54 107.06 15.40 15.40 128.39 391.08 TEMERLOH - - - - 10.40 9.60 137.00 401.41 178.71 155.29 1,291.76 3,879.60
81,033.97 301.01 2,347.38 6,877.84 2,115.76 1,685.57 18,341.47
-
Selom (Selom) Serai Lemon Grass Jumlah Total
- - -
Jumlah Total
0.15 0.09 0.16 0.48 443.95
78.46 630.32 3,466.77
3,092.51
Limau Nipis Lime Limau Purut Kaffir Lime Pala Nutmeg
Jumlah Total
491.79 382.13 1,871.61 5,427.68 127.92
51.66 486.37 1,532.06 166.22 141.52 1,048.31 Jumlah Total
- - - - 59.93
JADUAL 3-3 : KELUASAN, PENGELUARAN DAN NILAI PENGELUARAN TANAMAN REMPAH-RATUS MENGIKUT DAERAH, PAHANG, 2017Table 3-3 : Hectareage, Production and Value of Production Of Spices By District, Pahang, 2017
Lada Hitam Pepper Lengkuas Greater Galangal Limau Kasturi Lime Calamondin
PERAK
PERAK
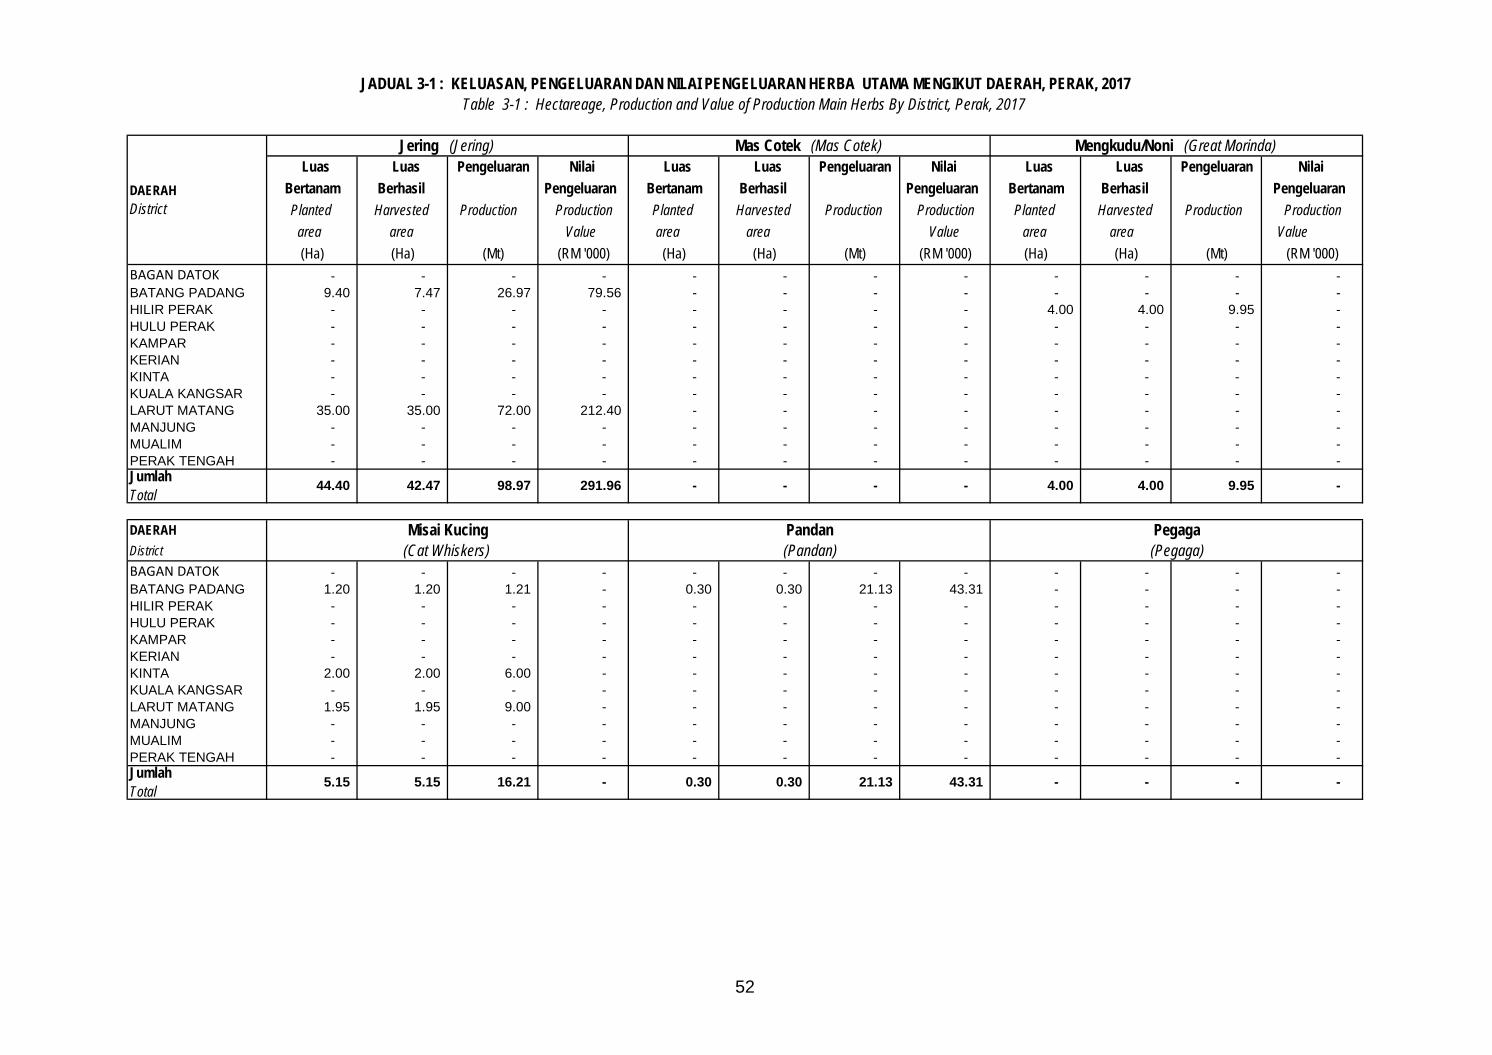
52
Luas Luas Pengeluaran Nilai Luas Luas Pengeluaran Nilai Luas Luas Pengeluaran Nilai Bertanam Berhasil Pengeluaran Bertanam Berhasil Pengeluaran Bertanam Berhasil Pengeluaran Planted Harvested Production Production Planted Harvested Production Production Planted Harvested Production Production
area area Value area area Value area area Value (Ha) (Ha) (Mt) (RM '000) (Ha) (Ha) (Mt) (RM '000) (Ha) (Ha) (Mt) (RM '000)
BAGAN DATOK - - - - - - - - - - - - BATANG PADANG 9.40 7.47 26.97 79.56 - - - - - - - - HILIR PERAK - - - - - - - - 4.00 4.00 9.95 - HULU PERAK - - - - - - - - - - - - KAMPAR - - - - - - - - - - - - KERIAN - - - - - - - - - - - - KINTA - - - - - - - - - - - - KUALA KANGSAR - - - - - - - - - - - - LARUT MATANG 35.00 35.00 72.00 212.40 - - - - - - - - MANJUNG - - - - - - - - - - - - MUALIM - - - - - - - - - - - - PERAK TENGAH - - - - - - - - - - - -
DAERAH DistrictBAGAN DATOK - - - - - - - - - - - - BATANG PADANG 1.20 1.20 1.21 - 0.30 0.30 21.13 43.31 - - - - HILIR PERAK - - - - - - - - - - - - HULU PERAK - - - - - - - - - - - - KAMPAR - - - - - - - - - - - - KERIAN - - - - - - - - - - - - KINTA 2.00 2.00 6.00 - - - - - - - - - KUALA KANGSAR - - - - - - - - - - - - LARUT MATANG 1.95 1.95 9.00 - - - - - - - - - MANJUNG - - - - - - - - - - - - MUALIM - - - - - - - - - - - - PERAK TENGAH - - - - - - - - - - - -
Misai Kucing Pandan Pegaga (Cat Whiskers) (Pandan) (Pegaga)
Jumlah Total
5.15 5.15 16.21 - 0.30 0.30 21.13 43.31 - - - -
JADUAL 3-1 : KELUASAN, PENGELUARAN DAN NILAI PENGELUARAN HERBA UTAMA MENGIKUT DAERAH, PERAK, 2017Table 3-1 : Hectareage, Production and Value of Production Main Herbs By District, Perak, 2017
DAERAH District
Jering (Jering) Mas Cotek (Mas Cotek) Mengkudu/Noni (Great Morinda)
Jumlah Total
44.40 42.47 98.97 291.96 - - - - 4.00 4.00 9.95 -
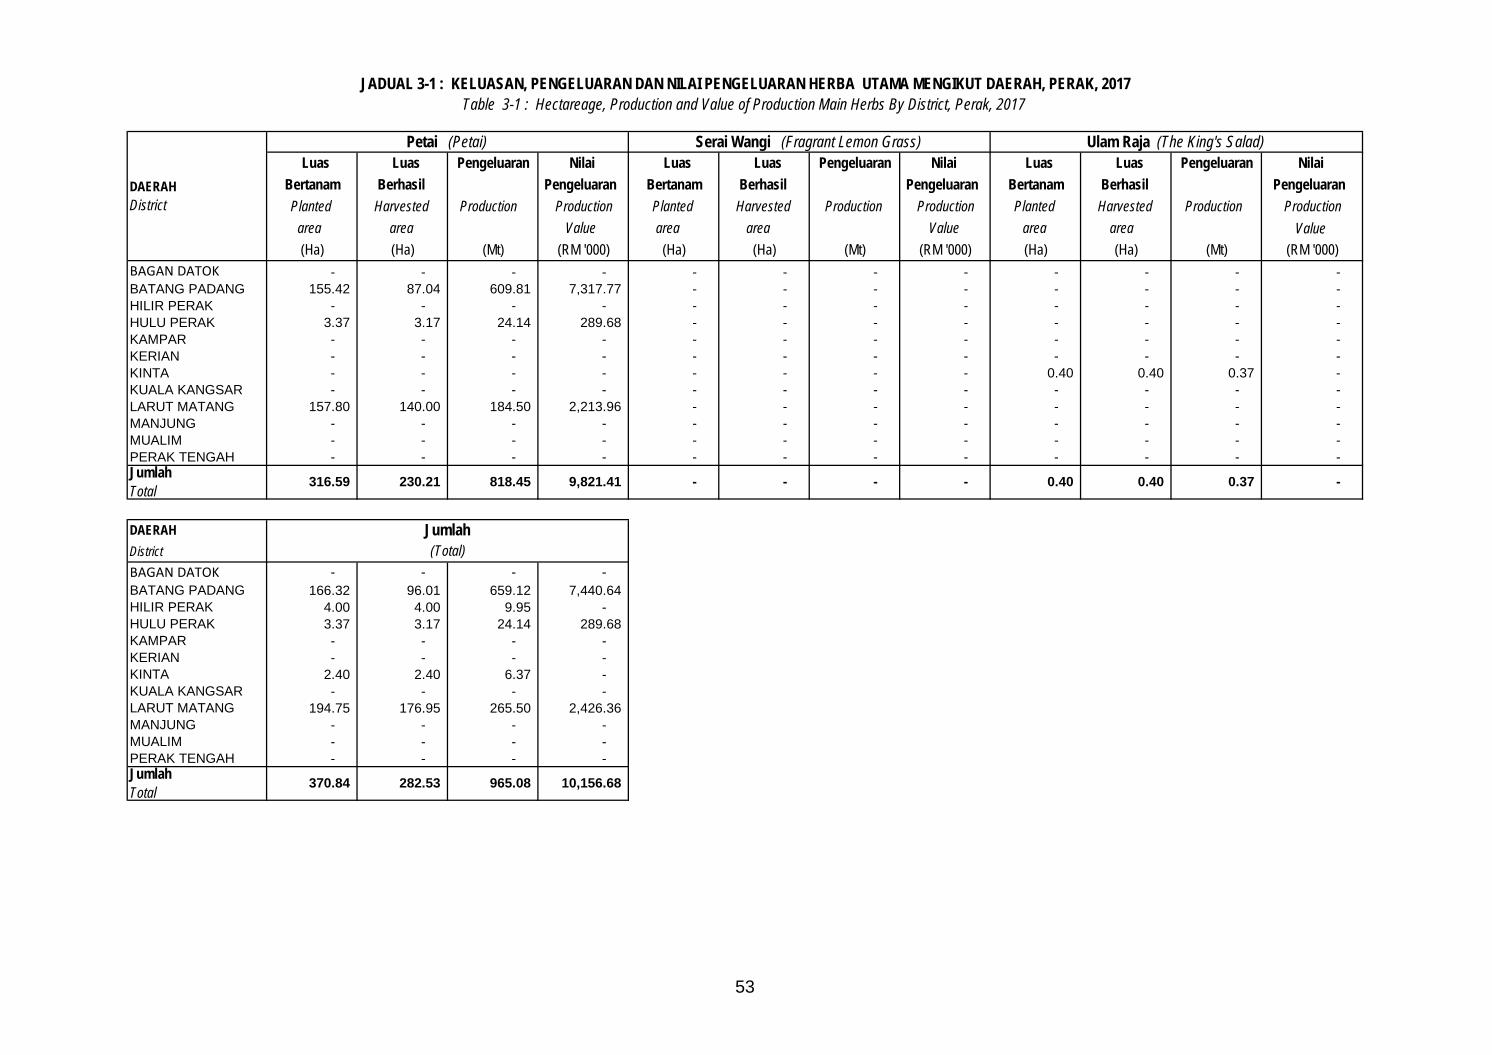
53
Luas Luas Pengeluaran Nilai Luas Luas Pengeluaran Nilai Luas Luas Pengeluaran Nilai Bertanam Berhasil Pengeluaran Bertanam Berhasil Pengeluaran Bertanam Berhasil Pengeluaran Planted Harvested Production Production Planted Harvested Production Production Planted Harvested Production Production
area area Value area area Value area area Value (Ha) (Ha) (Mt) (RM '000) (Ha) (Ha) (Mt) (RM '000) (Ha) (Ha) (Mt) (RM '000)
BAGAN DATOK - - - - - - - - - - - - BATANG PADANG 155.42 87.04 609.81 7,317.77 - - - - - - - - HILIR PERAK - - - - - - - - - - - - HULU PERAK 3.37 3.17 24.14 289.68 - - - - - - - - KAMPAR - - - - - - - - - - - - KERIAN - - - - - - - - - - - - KINTA - - - - - - - - 0.40 0.40 0.37 - KUALA KANGSAR - - - - - - - - - - - - LARUT MATANG 157.80 140.00 184.50 2,213.96 - - - - - - - - MANJUNG - - - - - - - - - - - - MUALIM - - - - - - - - - - - - PERAK TENGAH - - - - - - - - - - - -
DAERAH DistrictBAGAN DATOK - - - - BATANG PADANG 166.32 96.01 659.12 7,440.64 HILIR PERAK 4.00 4.00 9.95 - HULU PERAK 3.37 3.17 24.14 289.68 KAMPAR - - - - KERIAN - - - - KINTA 2.40 2.40 6.37 - KUALA KANGSAR - - - - LARUT MATANG 194.75 176.95 265.50 2,426.36 MANJUNG - - - - MUALIM - - - - PERAK TENGAH - - - -
Jumlah (Total)
Jumlah Total
370.84 282.53 965.08 10,156.68
JADUAL 3-1 : KELUASAN, PENGELUARAN DAN NILAI PENGELUARAN HERBA UTAMA MENGIKUT DAERAH, PERAK, 2017Table 3-1 : Hectareage, Production and Value of Production Main Herbs By District, Perak, 2017
DAERAH District
Petai (Petai) Serai Wangi (Fragrant Lemon Grass) Ulam Raja (The King's Salad)
Jumlah Total
316.59 230.21 818.45 9,821.41 - - - - 0.40 0.40 0.37 -
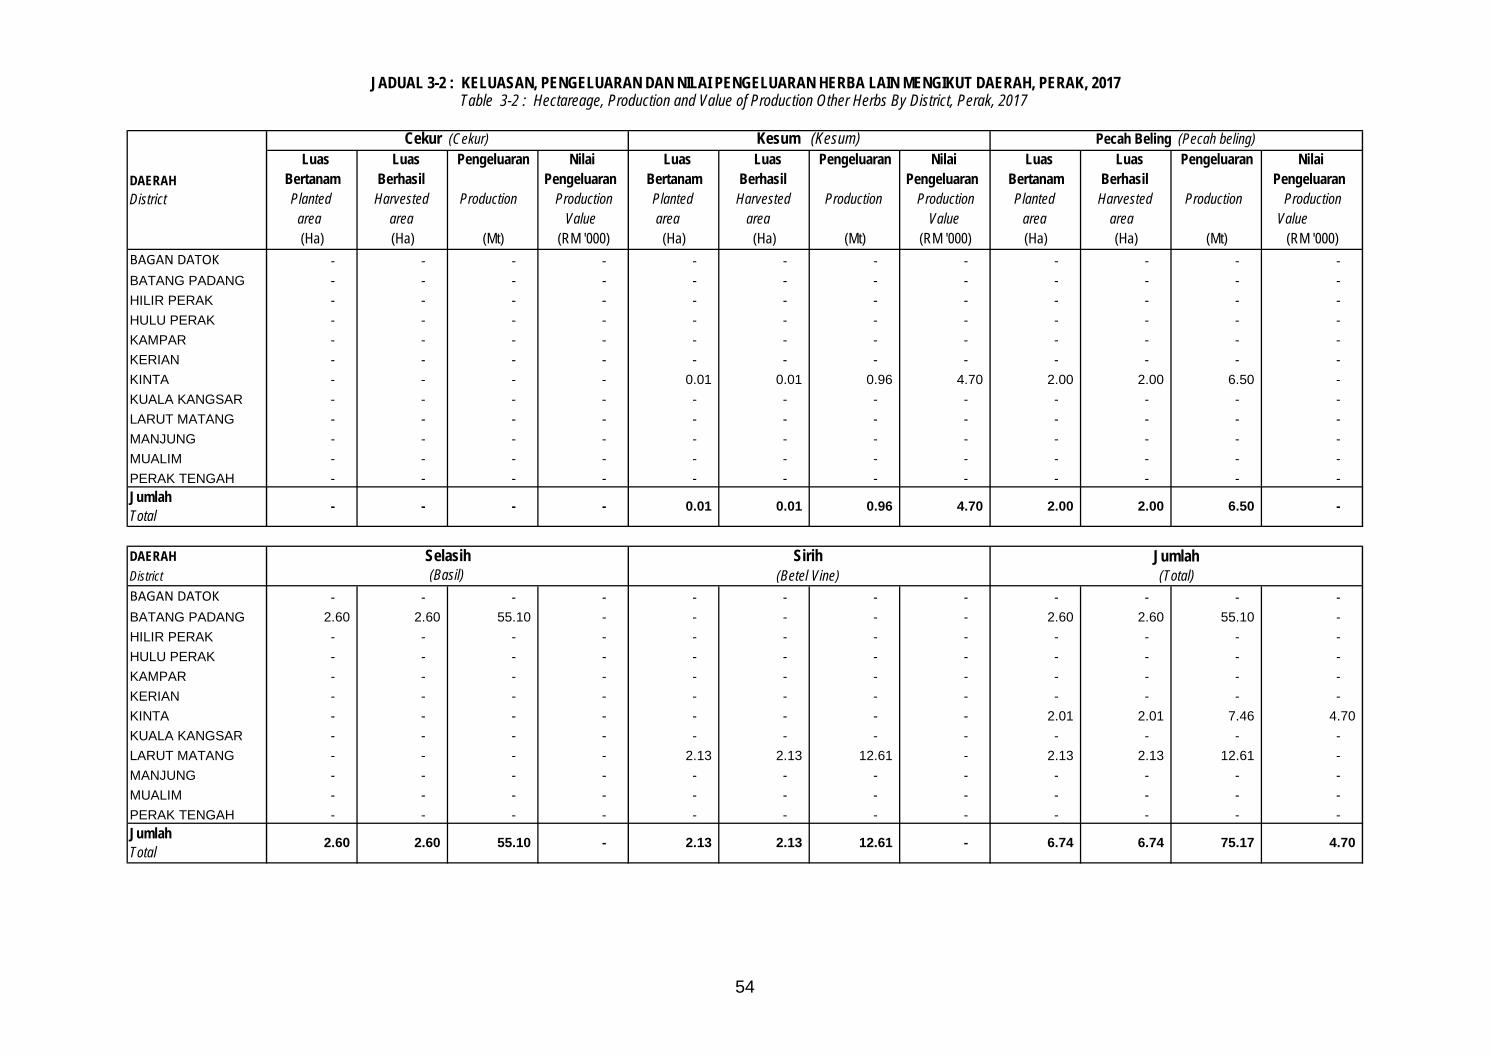
54
Luas Luas Pengeluaran Nilai Luas Luas Pengeluaran Nilai Luas Luas Pengeluaran Nilai Bertanam Berhasil Pengeluaran Bertanam Berhasil Pengeluaran Bertanam Berhasil Pengeluaran Planted Harvested Production Production Planted Harvested Production Production Planted Harvested Production Production
area area Value area area Value area area Value (Ha) (Ha) (Mt) (RM '000) (Ha) (Ha) (Mt) (RM '000) (Ha) (Ha) (Mt) (RM '000)
BAGAN DATOK - - - - - - - - - - - - BATANG PADANG - - - - - - - - - - - - HILIR PERAK - - - - - - - - - - - - HULU PERAK - - - - - - - - - - - - KAMPAR - - - - - - - - - - - - KERIAN - - - - - - - - - - - - KINTA - - - - 0.01 0.01 0.96 4.70 2.00 2.00 6.50 - KUALA KANGSAR - - - - - - - - - - - - LARUT MATANG - - - - - - - - - - - - MANJUNG - - - - - - - - - - - - MUALIM - - - - - - - - - - - - PERAK TENGAH - - - - - - - - - - - -
DAERAH DistrictBAGAN DATOK - - - - - - - - - - - - BATANG PADANG 2.60 2.60 55.10 - - - - - 2.60 2.60 55.10 - HILIR PERAK - - - - - - - - - - - - HULU PERAK - - - - - - - - - - - - KAMPAR - - - - - - - - - - - - KERIAN - - - - - - - - - - - - KINTA - - - - - - - - 2.01 2.01 7.46 4.70 KUALA KANGSAR - - - - - - - - - - - - LARUT MATANG - - - - 2.13 2.13 12.61 - 2.13 2.13 12.61 - MANJUNG - - - - - - - - - - - - MUALIM - - - - - - - - - - - - PERAK TENGAH - - - - - - - - - - - -
JADUAL 3-2 : KELUASAN, PENGELUARAN DAN NILAI PENGELUARAN HERBA LAIN MENGIKUT DAERAH, PERAK, 2017Table 3-2 : Hectareage, Production and Value of Production Other Herbs By District, Perak, 2017
DAERAH District
Cekur (Cekur) Kesum (Kesum) Pecah Beling (Pecah beling)
- 0.01 0.96 4.70 2.00 2.00 6.50 Jumlah Total
- - - - 0.01
Sirih Jumlah
Jumlah Total
75.17 2.60 2.60 55.10 - 12.61
Selasih (Basil) (Betel Vine) (Total)
4.70 2.13 2.13 - 6.74 6.74
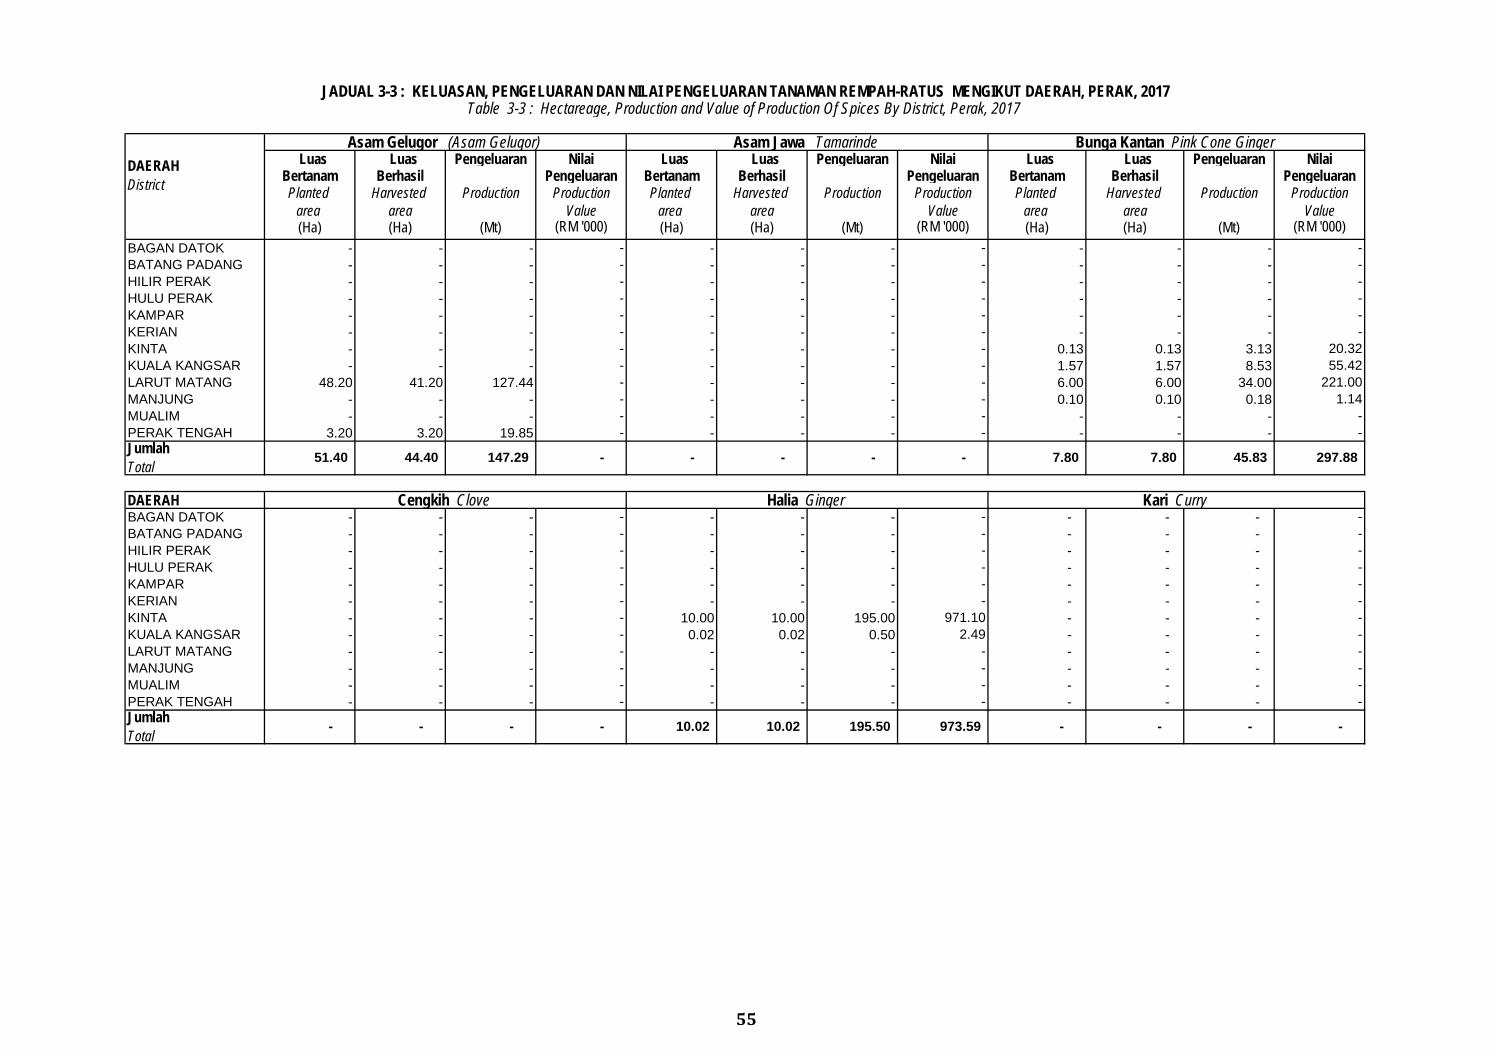
55
Luas Luas Pengeluaran Nilai Luas Luas Pengeluaran Nilai Luas Luas Pengeluaran Nilai Bertanam Berhasil Pengeluaran Bertanam Berhasil Pengeluaran Bertanam Berhasil Pengeluaran Planted Harvested Production Production Planted Harvested Production Production Planted Harvested Production Production
area area Value area area Value area area Value (Ha) (Ha) (Mt) (RM '000) (Ha) (Ha) (Mt) (RM '000) (Ha) (Ha) (Mt) (RM '000)
BAGAN DATOK - - - - - - - - - - - - BATANG PADANG - - - - - - - - - - - - HILIR PERAK - - - - - - - - - - - - HULU PERAK - - - - - - - - - - - - KAMPAR - - - - - - - - - - - - KERIAN - - - - - - - - - - - - KINTA - - - - - - - - 0.13 0.13 3.13 20.32 KUALA KANGSAR - - - - - - - - 1.57 1.57 8.53 55.42 LARUT MATANG 48.20 41.20 127.44 - - - - - 6.00 6.00 34.00 221.00 MANJUNG - - - - - - - - 0.10 0.10 0.18 1.14 MUALIM - - - - - - - - - - - - PERAK TENGAH 3.20 3.20 19.85 - - - - - - - - -
DAERAH BAGAN DATOK - - - - - - - - - - - - BATANG PADANG - - - - - - - - - - - - HILIR PERAK - - - - - - - - - - - - HULU PERAK - - - - - - - - - - - - KAMPAR - - - - - - - - - - - - KERIAN - - - - - - - - - - - - KINTA - - - - 10.00 10.00 195.00 971.10 - - - - KUALA KANGSAR - - - - 0.02 0.02 0.50 2.49 - - - - LARUT MATANG - - - - - - - - - - - - MANJUNG - - - - - - - - - - - - MUALIM - - - - - - - - - - - - PERAK TENGAH - - - - - - - - - - - -
JADUAL 3-3 : KELUASAN, PENGELUARAN DAN NILAI PENGELUARAN TANAMAN REMPAH-RATUS MENGIKUT DAERAH, PERAK, 2017Table 3-3 : Hectareage, Production and Value of Production Of Spices By District, Perak, 2017
DAERAH District
Asam Gelugor (Asam Gelugor) Asam Jawa Tamarinde Bunga Kantan Pink Cone Ginger
7.80 7.80 45.83 Jumlah Total
51.40 44.40 147.29 - -
- -
- -
195.50
-
973.59 10.02 - -
Cengkih Clove Halia Ginger Kari Curry
10.02 - -
297.88
Jumlah Total
- -
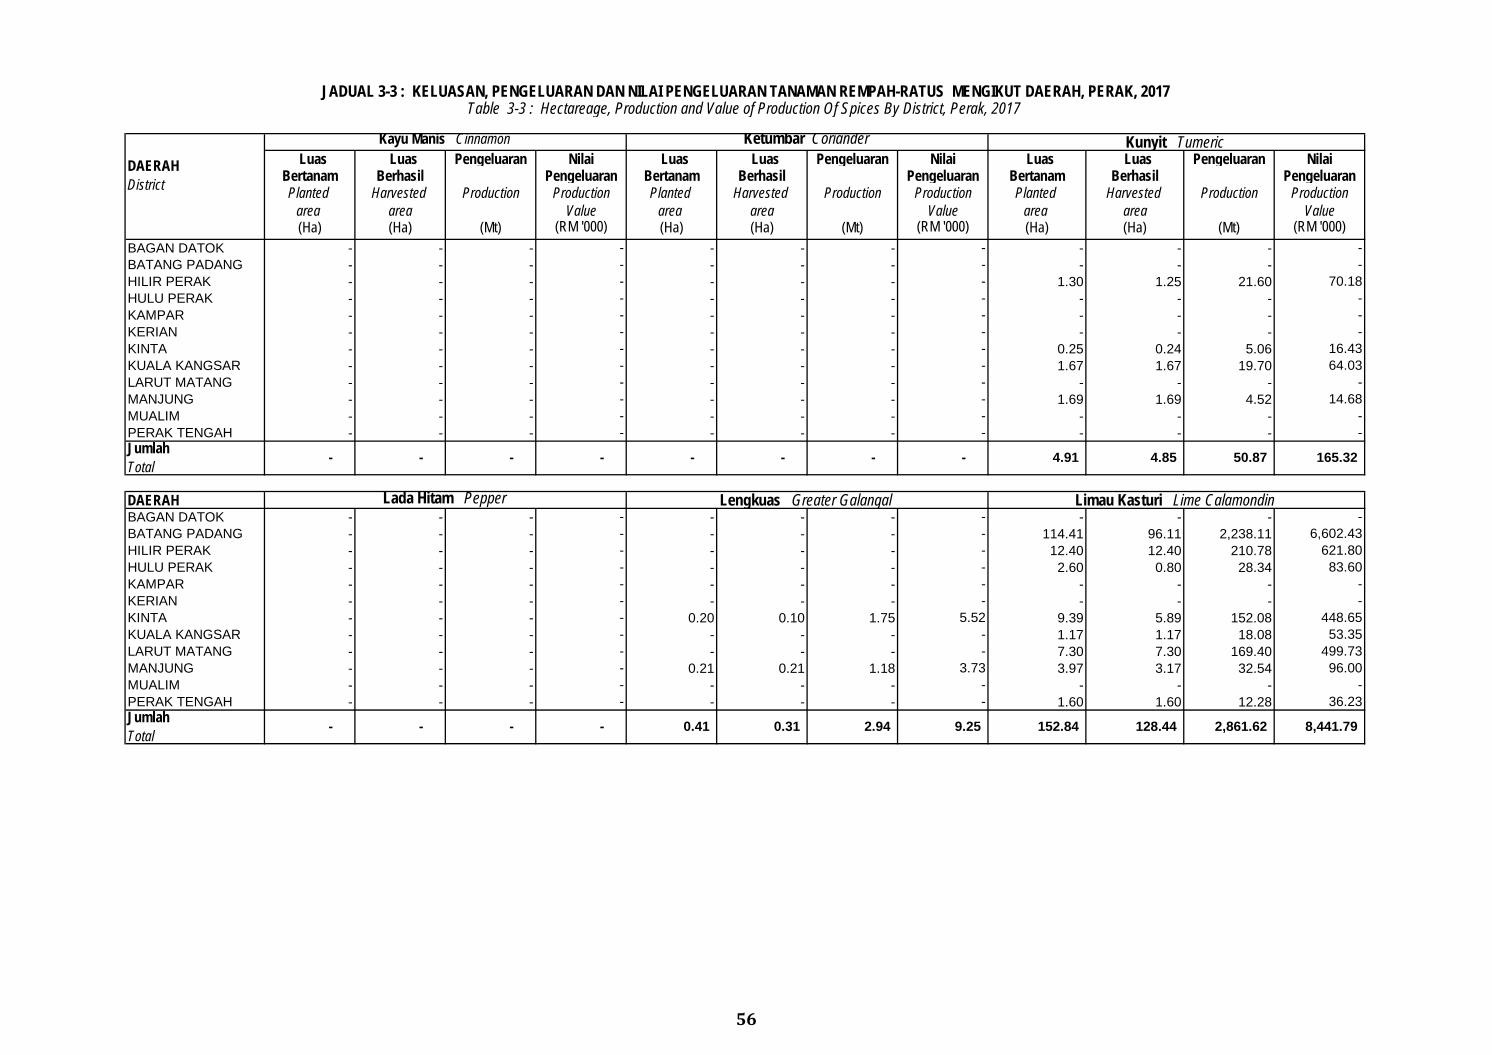
56
Luas Luas Pengeluaran Nilai Luas Luas Pengeluaran Nilai Luas Luas Pengeluaran Nilai Bertanam Berhasil Pengeluaran Bertanam Berhasil Pengeluaran Bertanam Berhasil Pengeluaran Planted Harvested Production Production Planted Harvested Production Production Planted Harvested Production Production
area area Value area area Value area area Value (Ha) (Ha) (Mt) (RM '000) (Ha) (Ha) (Mt) (RM '000) (Ha) (Ha) (Mt) (RM '000)
BAGAN DATOK - - - - - - - - - - - - BATANG PADANG - - - - - - - - - - - - HILIR PERAK - - - - - - - - 1.30 1.25 21.60 70.18 HULU PERAK - - - - - - - - - - - - KAMPAR - - - - - - - - - - - - KERIAN - - - - - - - - - - - - KINTA - - - - - - - - 0.25 0.24 5.06 16.43 KUALA KANGSAR - - - - - - - - 1.67 1.67 19.70 64.03 LARUT MATANG - - - - - - - - - - - - MANJUNG - - - - - - - - 1.69 1.69 4.52 14.68 MUALIM - - - - - - - - - - - - PERAK TENGAH - - - - - - - - - - - -
DAERAH BAGAN DATOK - - - - - - - - - - - - BATANG PADANG - - - - - - - - 114.41 96.11 2,238.11 6,602.43 HILIR PERAK - - - - - - - - 12.40 12.40 210.78 621.80 HULU PERAK - - - - - - - - 2.60 0.80 28.34 83.60 KAMPAR - - - - - - - - - - - - KERIAN - - - - - - - - - - - - KINTA - - - - 0.20 0.10 1.75 5.52 9.39 5.89 152.08 448.65 KUALA KANGSAR - - - - - - - - 1.17 1.17 18.08 53.35 LARUT MATANG - - - - - - - - 7.30 7.30 169.40 499.73 MANJUNG - - - - 0.21 0.21 1.18 3.73 3.97 3.17 32.54 96.00 MUALIM - - - - - - - - - - - - PERAK TENGAH - - - - - - - - 1.60 1.60 12.28 36.23
Kunyit Tumeric
2,861.62 8,441.79
JADUAL 3-3 : KELUASAN, PENGELUARAN DAN NILAI PENGELUARAN TANAMAN REMPAH-RATUS MENGIKUT DAERAH, PERAK, 2017Table 3-3 : Hectareage, Production and Value of Production Of Spices By District, Perak, 2017
DAERAH District
Kayu Manis Cinnamon Ketumbar Coriander
Jumlah Total
- - - - - - - - 4.91 4.85 50.87 165.32
Lada Hitam Pepper Lengkuas Greater Galangal Limau Kasturi Lime Calamondin
Jumlah Total
- - - - 0.41 0.31 2.94 9.25 152.84 128.44
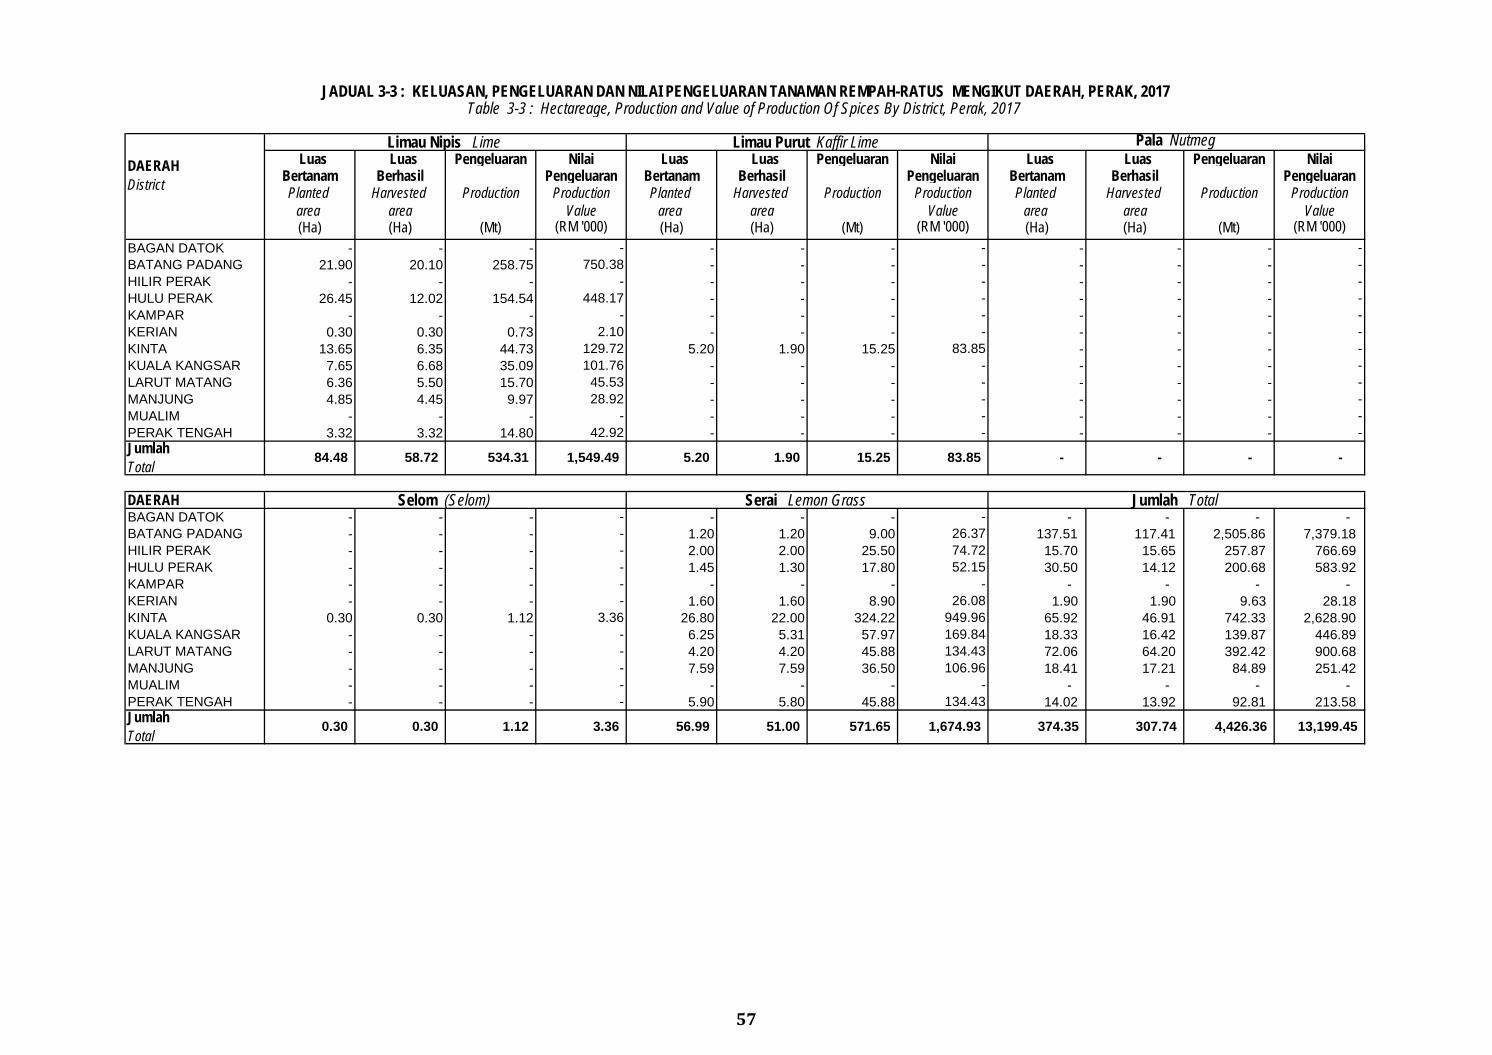
57
Luas Luas Pengeluaran Nilai Luas Luas Pengeluaran Nilai Luas Luas Pengeluaran Nilai Bertanam Berhasil Pengeluaran Bertanam Berhasil Pengeluaran Bertanam Berhasil Pengeluaran Planted Harvested Production Production Planted Harvested Production Production Planted Harvested Production Production
area area Value area area Value area area Value (Ha) (Ha) (Mt) (RM '000) (Ha) (Ha) (Mt) (RM '000) (Ha) (Ha) (Mt) (RM '000)
BAGAN DATOK - - - - - - - - - - - - BATANG PADANG 21.90 20.10 258.75 750.38 - - - - - - - - HILIR PERAK - - - - - - - - - - - - HULU PERAK 26.45 12.02 154.54 448.17 - - - - - - - - KAMPAR - - - - - - - - - - - - KERIAN 0.30 0.30 0.73 2.10 - - - - - - - - KINTA 13.65 6.35 44.73 129.72 5.20 1.90 15.25 83.85 - - - - KUALA KANGSAR 7.65 6.68 35.09 101.76 - - - - - - - - LARUT MATANG 6.36 5.50 15.70 45.53 - - - - - - - - MANJUNG 4.85 4.45 9.97 28.92 - - - - - - - - MUALIM - - - - - - - - - - - - PERAK TENGAH 3.32 3.32 14.80 42.92 - - - - - - - -
DAERAH BAGAN DATOK - - - - - - - - - - - - BATANG PADANG - - - - 1.20 1.20 9.00 26.37 137.51 117.41 2,505.86 7,379.18 HILIR PERAK - - - - 2.00 2.00 25.50 74.72 15.70 15.65 257.87 766.69 HULU PERAK - - - - 1.45 1.30 17.80 52.15 30.50 14.12 200.68 583.92 KAMPAR - - - - - - - - - - - - KERIAN - - - - 1.60 1.60 8.90 26.08 1.90 1.90 9.63 28.18 KINTA 0.30 0.30 1.12 3.36 26.80 22.00 324.22 949.96 65.92 46.91 742.33 2,628.90 KUALA KANGSAR - - - - 6.25 5.31 57.97 169.84 18.33 16.42 139.87 446.89 LARUT MATANG - - - - 4.20 4.20 45.88 134.43 72.06 64.20 392.42 900.68 MANJUNG - - - - 7.59 7.59 36.50 106.96 18.41 17.21 84.89 251.42 MUALIM - - - - - - - - - - - - PERAK TENGAH - - - - 5.90 5.80 45.88 134.43 14.02 13.92 92.81 213.58 Jumlah Total
0.30 0.30
Jumlah Total
Jumlah Total
5.20 1.90 84.48 58.72 15.25
Limau Nipis Lime
1.12 3.36 56.99 13,199.45 51.00
JADUAL 3-3 : KELUASAN, PENGELUARAN DAN NILAI PENGELUARAN TANAMAN REMPAH-RATUS MENGIKUT DAERAH, PERAK, 2017Table 3-3 : Hectareage, Production and Value of Production Of Spices By District, Perak, 2017
DAERAH District
Limau Purut Kaffir Lime Pala Nutmeg
- -
Selom (Selom)
83.85 - - 534.31 1,549.49
571.65 1,674.93 374.35 307.74
Serai Lemon Grass
4,426.36
PERLIS
PERLIS
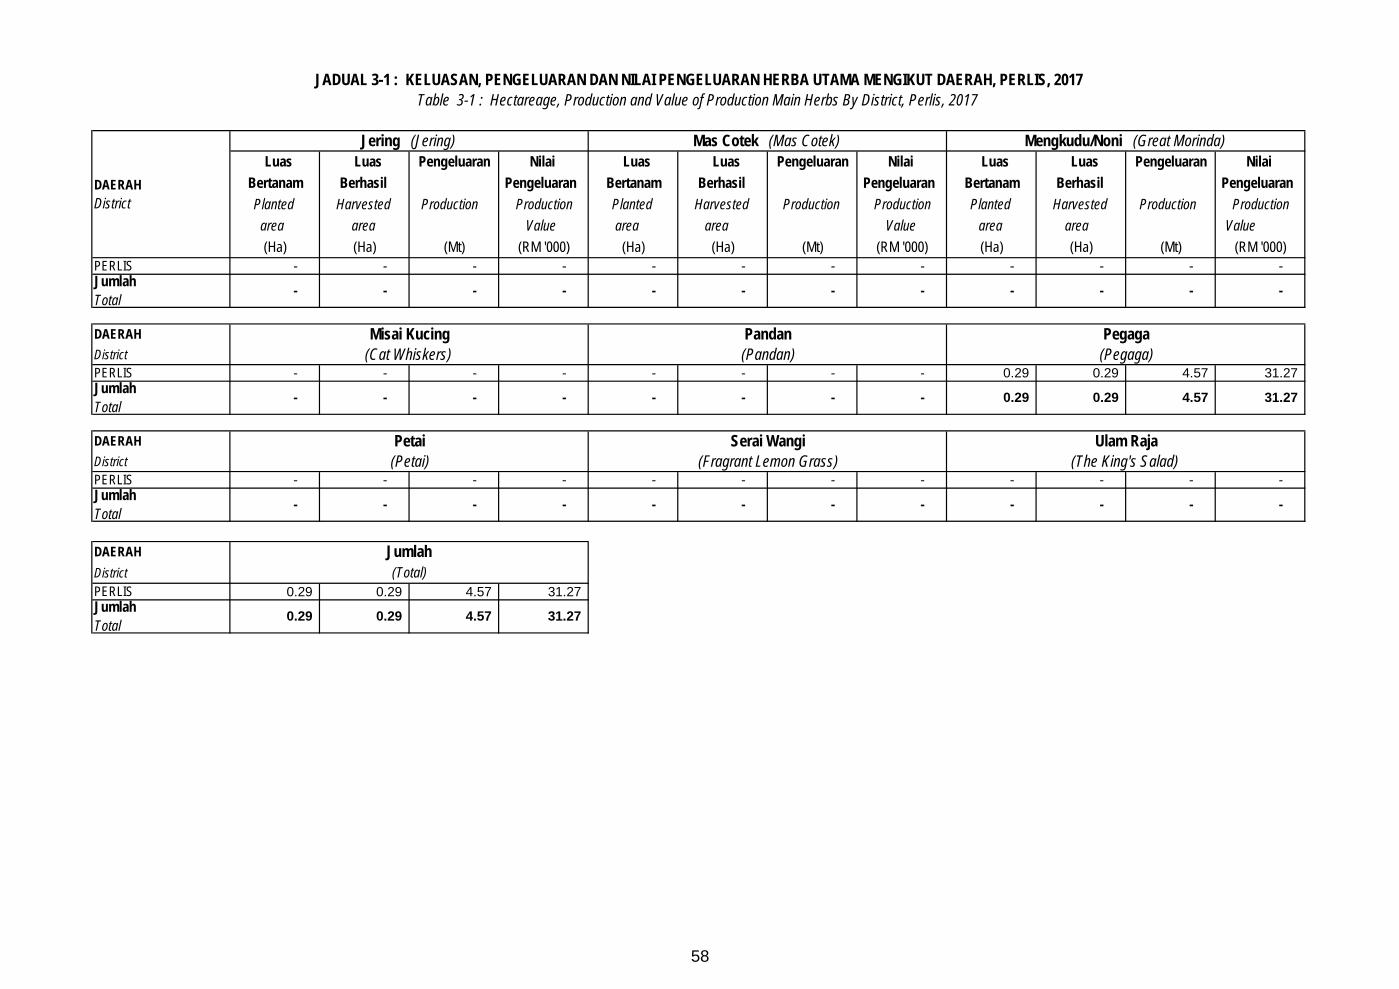
58
Luas Luas Pengeluaran Nilai Luas Luas Pengeluaran Nilai Luas Luas Pengeluaran Nilai Bertanam Berhasil Pengeluaran Bertanam Berhasil Pengeluaran Bertanam Berhasil Pengeluaran Planted Harvested Production Production Planted Harvested Production Production Planted Harvested Production Production
area area Value area area Value area area Value (Ha) (Ha) (Mt) (RM '000) (Ha) (Ha) (Mt) (RM '000) (Ha) (Ha) (Mt) (RM '000)
PERLIS - - - - - - - - - - - -
DAERAH DistrictPERLIS - - - - - - - - 0.29 0.29 4.57 31.27
DAERAH DistrictPERLIS - - - - - - - - - - - -
DAERAH DistrictPERLIS 0.29 0.29 4.57 31.27
Jumlah Total
- - - -
JADUAL 3-1 : KELUASAN, PENGELUARAN DAN NILAI PENGELUARAN HERBA UTAMA MENGIKUT DAERAH, PERLIS, 2017Table 3-1 : Hectareage, Production and Value of Production Main Herbs By District, Perlis, 2017
DAERAH District
Jering (Jering) Mas Cotek (Mas Cotek) Mengkudu/Noni (Great Morinda)
- - -
Misai Kucing Pandan Pegaga
- - - - -
Jumlah Total
- - - -
(Cat Whiskers) (Pandan) (Pegaga)
Jumlah Total
- - - - - - - - 0.29 0.29 4.57 31.27
- - -
Jumlah Total
0.29 0.29 4.57 31.27
Petai Serai Wangi Ulam Raja (Petai) (Fragrant Lemon Grass) (The King's Salad)
(Total)Jumlah
- - - - -
59
Tidak ada (Nil)
JADUAL 3-2 : KELUASAN, PENGELUARAN DAN NILAI PENGELUARAN HERBA LAIN MENGIKUT DAERAH, PERLIS, 2017Table 3-2 : Hectareage, Production and Value of Production Other Herbs By District, Perlis, 2017
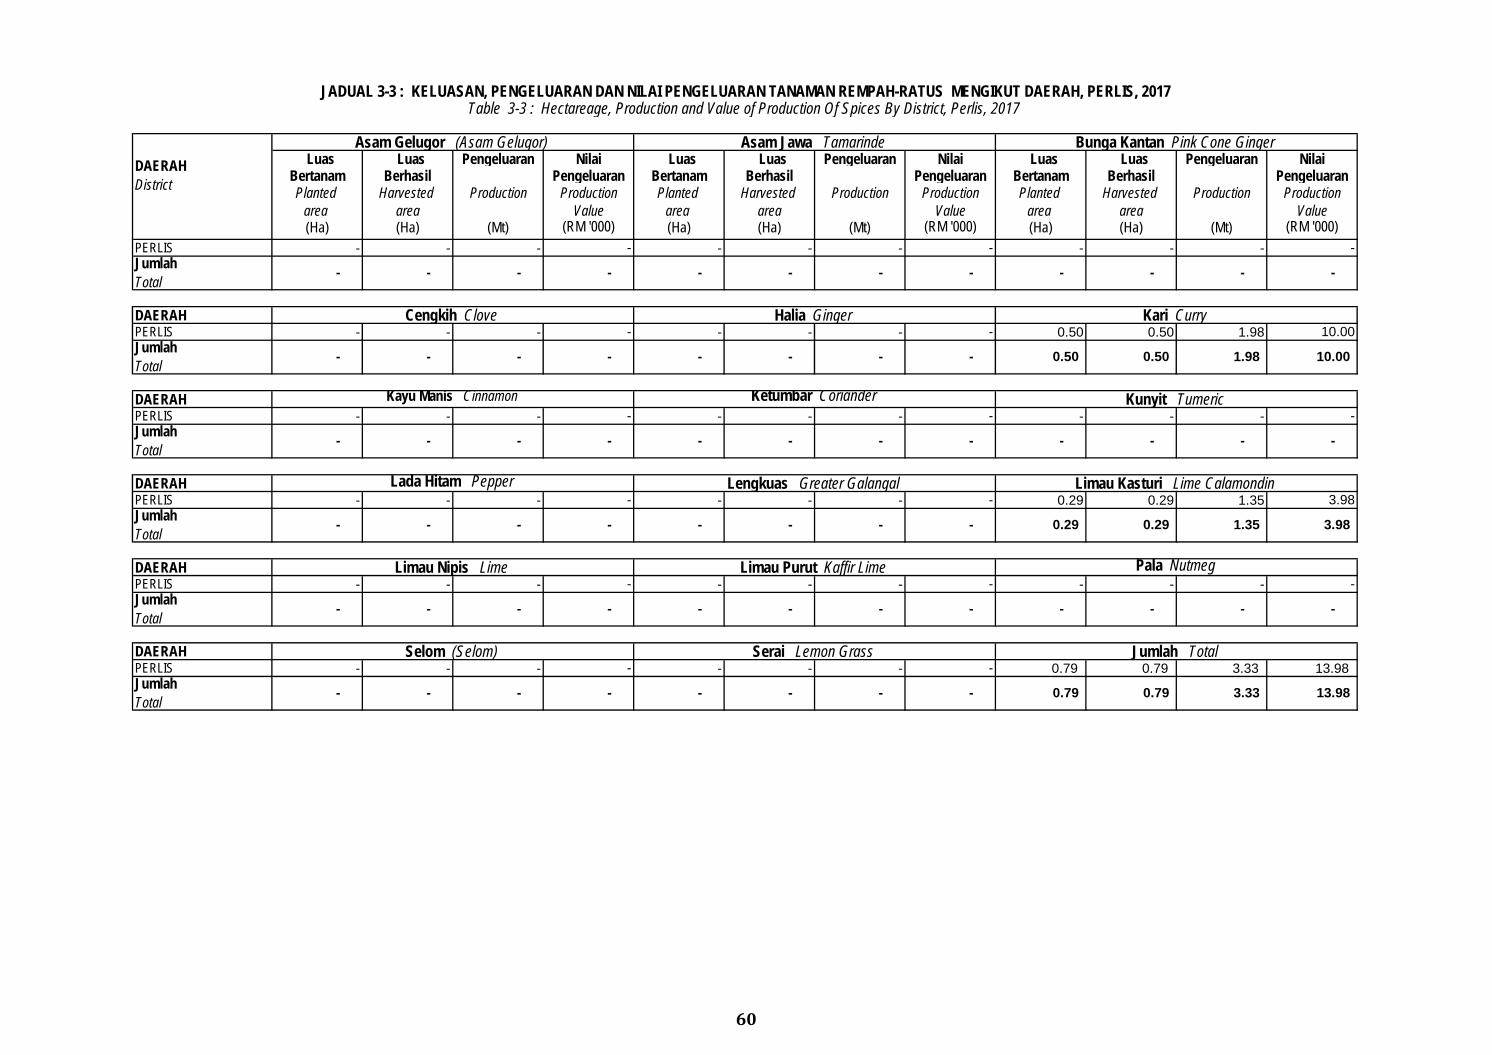
60
Luas Luas Pengeluaran Nilai Luas Luas Pengeluaran Nilai Luas Luas Pengeluaran Nilai Bertanam Berhasil Pengeluaran Bertanam Berhasil Pengeluaran Bertanam Berhasil Pengeluaran Planted Harvested Production Production Planted Harvested Production Production Planted Harvested Production Production
area area Value area area Value area area Value (Ha) (Ha) (Mt) (RM '000) (Ha) (Ha) (Mt) (RM '000) (Ha) (Ha) (Mt) (RM '000)
PERLIS - - - - - - - - - - - -
DAERAH PERLIS - - - - - - - - 0.50 0.50 1.98 10.00
DAERAH PERLIS - - - - - - - - - - - -
DAERAH PERLIS - - - - - - - - 0.29 0.29 1.35 3.98
DAERAH PERLIS - - - - - - - - - - - -
DAERAH PERLIS - - - - - - - - 0.79 0.79 3.33 13.98
-
Serai Lemon Grass Jumlah Total
13.98
Limau Nipis Lime
- - - -
- - - 0.79 0.79 3.33 -
- - -
Jumlah Total
- - - -
Selom (Selom)
Jumlah Total
- - - -
-
1.35 3.98
Limau Purut Kaffir Lime Pala Nutmeg
- - - - 0.29 0.29
- - - - -
Lada Hitam Pepper Lengkuas Greater Galangal Limau Kasturi Lime Calamondin
Jumlah Total
- - - -
Jumlah Total
- - - -
Kayu Manis Cinnamon Ketumbar Coriander Kunyit Tumeric
- - - -
- -
0.50 0.50
-
1.98 10.00
Cengkih Clove Halia Ginger Kari Curry
- - - - - - - - - -
Jumlah Total
- - - -
Jumlah Total
-
JADUAL 3-3 : KELUASAN, PENGELUARAN DAN NILAI PENGELUARAN TANAMAN REMPAH-RATUS MENGIKUT DAERAH, PERLIS, 2017Table 3-3 : Hectareage, Production and Value of Production Of Spices By District, Perlis, 2017
DAERAH District
Asam Gelugor (Asam Gelugor) Asam Jawa Tamarinde Bunga Kantan Pink Cone Ginger
PULAU PINANG
PENANG
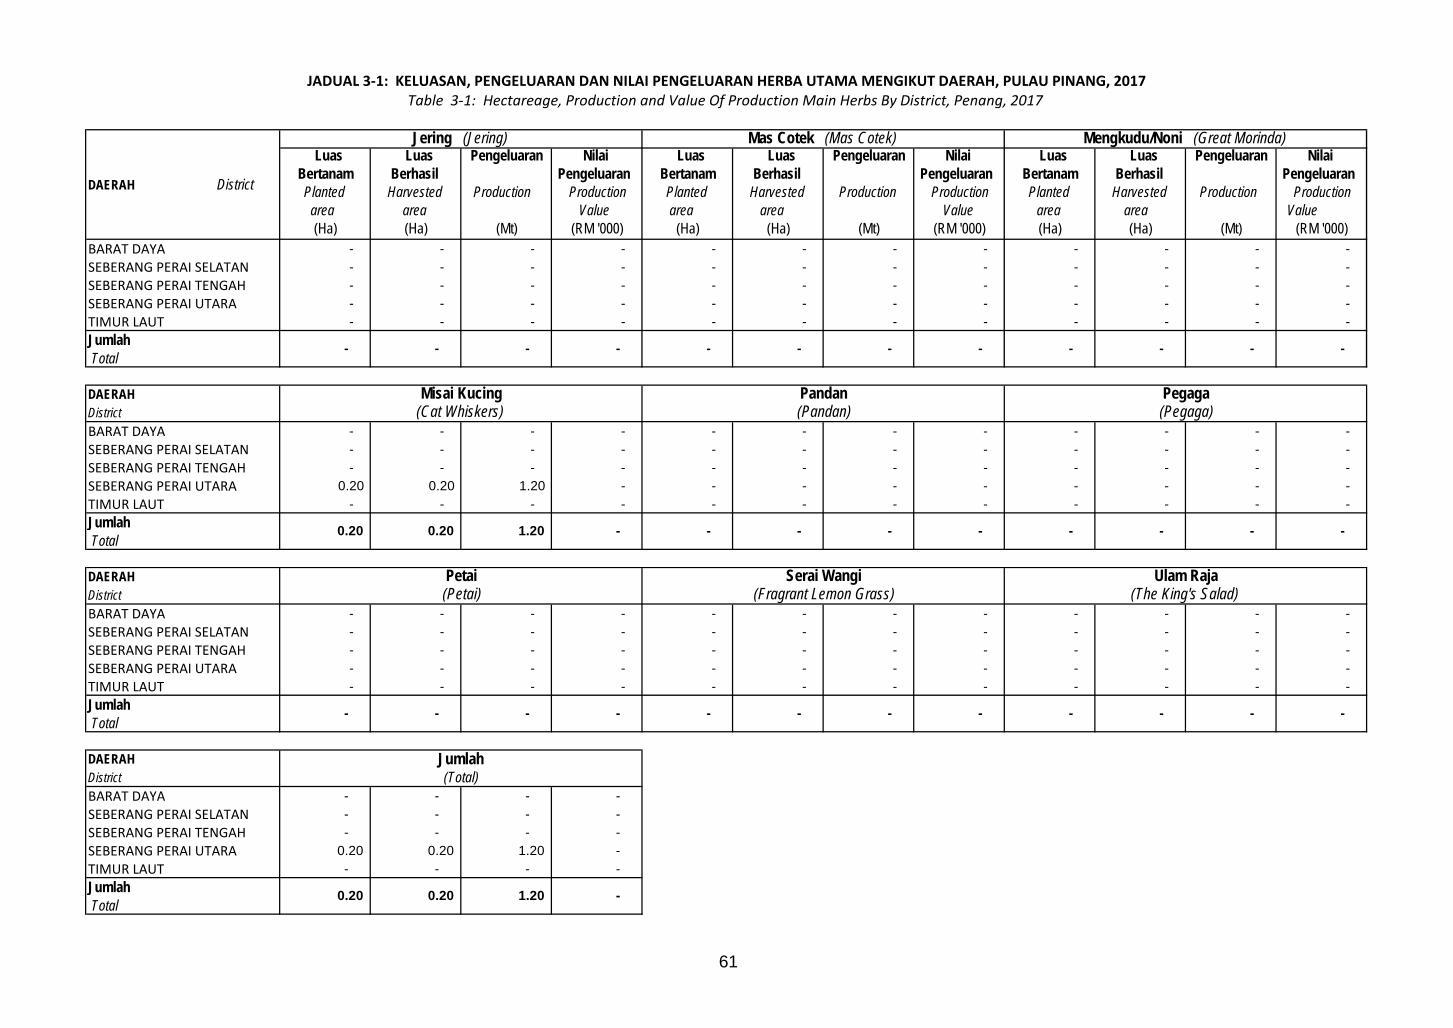
61
Luas Luas Pengeluaran Nilai Luas Luas Pengeluaran Nilai Luas Luas Pengeluaran Nilai Bertanam Berhasil Pengeluaran Bertanam Berhasil Pengeluaran Bertanam Berhasil Pengeluaran Planted Harvested Production Production Planted Harvested Production Production Planted Harvested Production Production
area area Value area area Value area area Value (Ha) (Ha) (Mt) (RM '000) (Ha) (Ha) (Mt) (RM '000) (Ha) (Ha) (Mt) (RM '000)
BARAT DAYA - - - - - - - - - - - - SEBERANG PERAI SELATAN - - - - - - - - - - - - SEBERANG PERAI TENGAH - - - - - - - - - - - - SEBERANG PERAI UTARA - - - - - - - - - - - - TIMUR LAUT - - - - - - - - - - - - Jumlah Total
DAERAH DistrictBARAT DAYA - - - - - - - - - - - - SEBERANG PERAI SELATAN - - - - - - - - - - - - SEBERANG PERAI TENGAH - - - - - - - - - - - - SEBERANG PERAI UTARA 0.20 0.20 1.20 - - - - - - - - - TIMUR LAUT - - - - - - - - - - - - Jumlah Total
DAERAH DistrictBARAT DAYA - - - - - - - - - - - - SEBERANG PERAI SELATAN - - - - - - - - - - - - SEBERANG PERAI TENGAH - - - - - - - - - - - - SEBERANG PERAI UTARA - - - - - - - - - - - - TIMUR LAUT - - - - - - - - - - - - Jumlah Total
DAERAH DistrictBARAT DAYA - - - - SEBERANG PERAI SELATAN - - - - SEBERANG PERAI TENGAH - - - - SEBERANG PERAI UTARA 0.20 0.20 1.20 - TIMUR LAUT - - - - Jumlah Total
Jumlah (Total)
0.20 0.20 1.20 -
-
Petai Serai Wangi Ulam Raja (Petai) (Fragrant Lemon Grass)
- - - - - - - -
Misai Kucing Pandan Pegaga (Cat Whiskers) (Pandan) (Pegaga)
0.20 0.20 1.20 - -
- - - - -
JADUAL 3-1: KELUASAN, PENGELUARAN DAN NILAI PENGELUARAN HERBA UTAMA MENGIKUT DAERAH, PULAU PINANG, 2017Table 3-1: Hectareage, Production and Value Of Production Main Herbs By District, Penang, 2017
DAERAH District
Jering (Jering) Mas Cotek (Mas Cotek) Mengkudu/Noni (Great Morinda)
- -
(The King's Salad)
- - -
- - -
- - - - -
- - - -
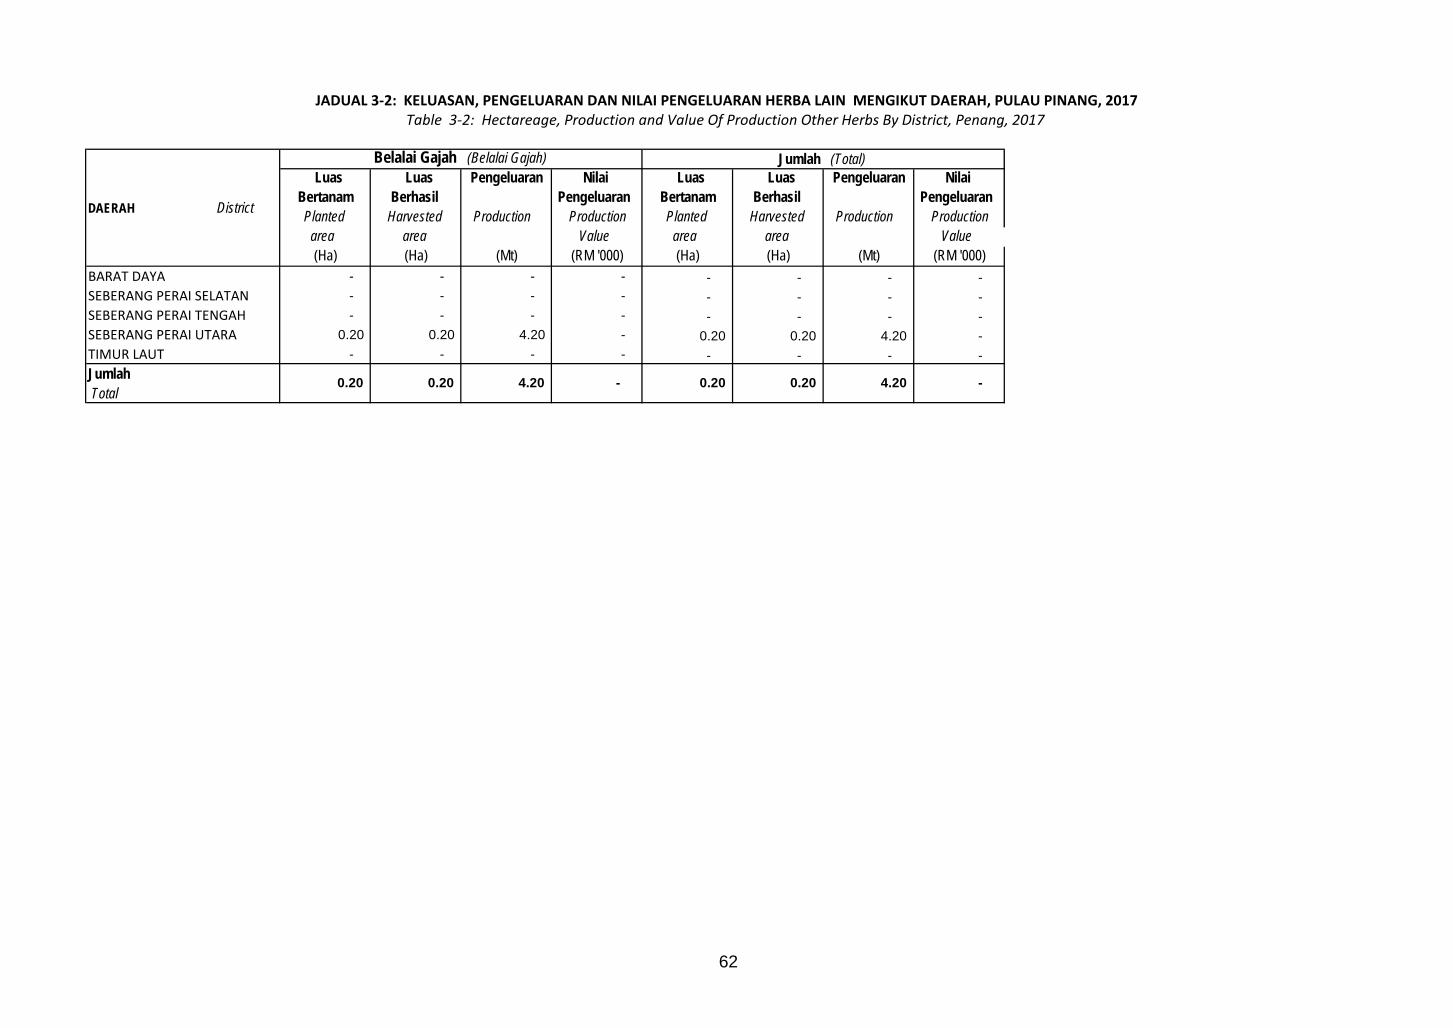
62
Luas Luas Pengeluaran Nilai Luas Luas Pengeluaran Nilai Bertanam Berhasil Pengeluaran Bertanam Berhasil Pengeluaran Planted Harvested Production Production Planted Harvested Production Production
area area Value area area Value (Ha) (Ha) (Mt) (RM '000) (Ha) (Ha) (Mt) (RM '000)
BARAT DAYA - - - - - - - - SEBERANG PERAI SELATAN - - - - - - - - SEBERANG PERAI TENGAH - - - - - - - - SEBERANG PERAI UTARA 0.20 0.20 4.20 - 0.20 0.20 4.20 - TIMUR LAUT - - - - - - - - Jumlah Total
JADUAL 3-2: KELUASAN, PENGELUARAN DAN NILAI PENGELUARAN HERBA LAIN MENGIKUT DAERAH, PULAU PINANG, 2017Table 3-2: Hectareage, Production and Value Of Production Other Herbs By District, Penang, 2017
DAERAH District
Belalai Gajah (Belalai Gajah) Jumlah (Total)
0.20 0.20 4.20 - 0.20 0.20 4.20 -
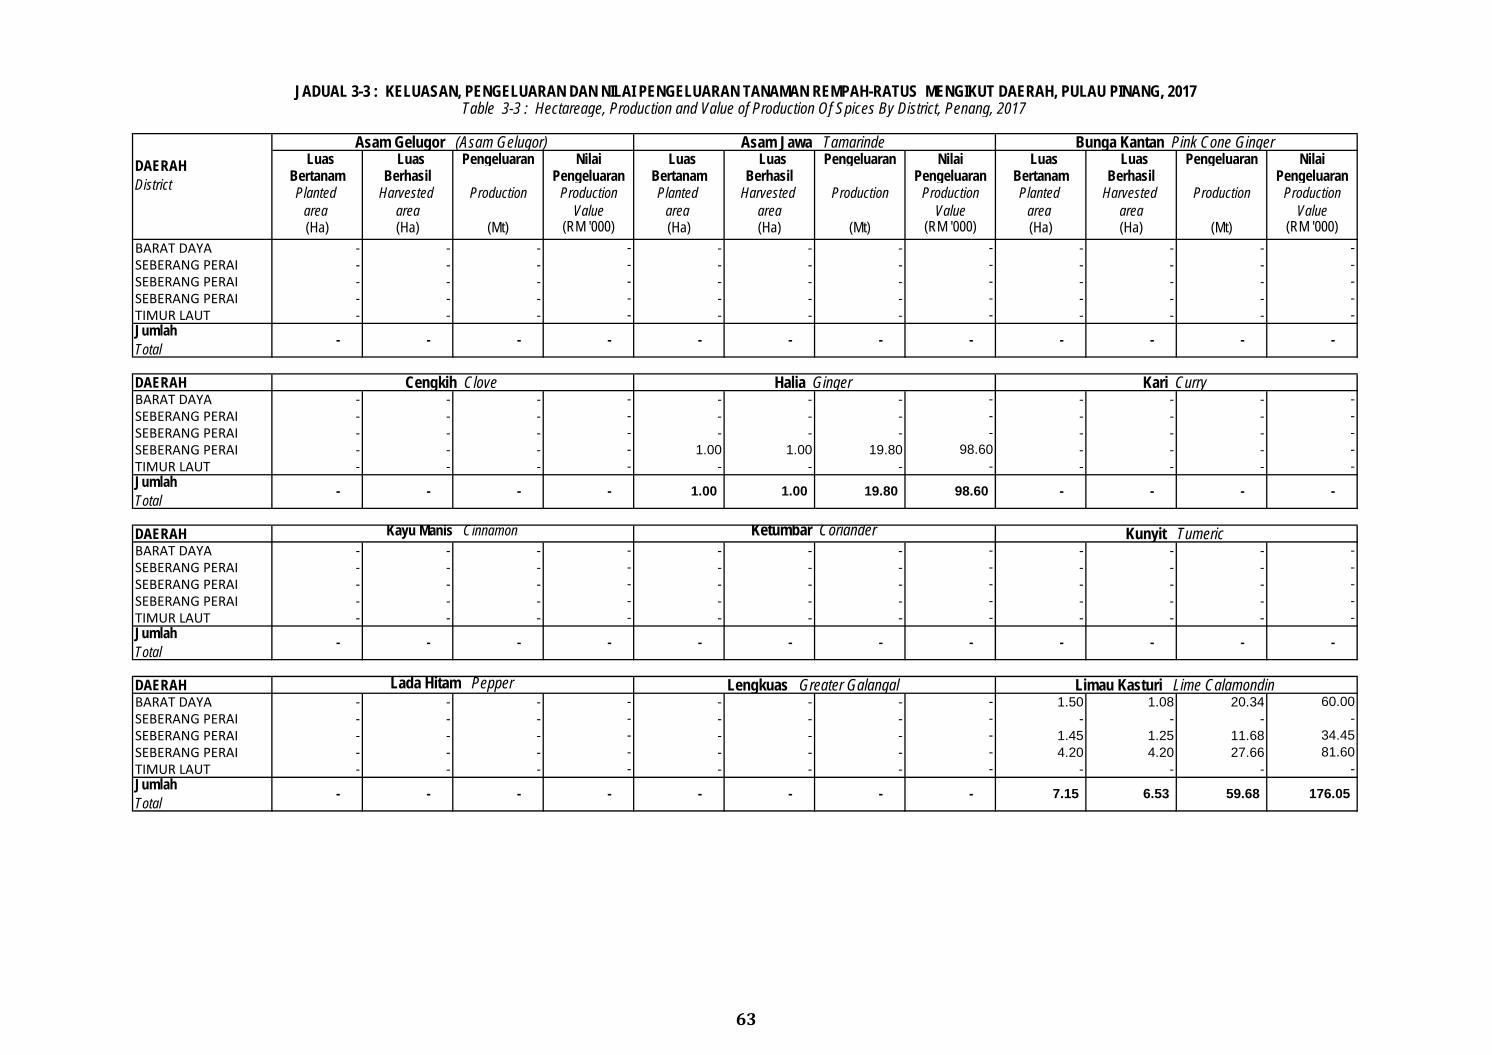
63
Luas Luas Pengeluaran Nilai Luas Luas Pengeluaran Nilai Luas Luas Pengeluaran Nilai Bertanam Berhasil Pengeluaran Bertanam Berhasil Pengeluaran Bertanam Berhasil Pengeluaran Planted Harvested Production Production Planted Harvested Production Production Planted Harvested Production Production
area area Value area area Value area area Value (Ha) (Ha) (Mt) (RM '000) (Ha) (Ha) (Mt) (RM '000) (Ha) (Ha) (Mt) (RM '000)
BARAT DAYA - - - - - - - - - - - - SEBERANG PERAI - - - - - - - - - - - - SEBERANG PERAI - - - - - - - - - - - - SEBERANG PERAI - - - - - - - - - - - - TIMUR LAUT - - - - - - - - - - - -
DAERAH BARAT DAYA - - - - - - - - - - - - SEBERANG PERAI - - - - - - - - - - - - SEBERANG PERAI - - - - - - - - - - - - SEBERANG PERAI - - - - 1.00 1.00 19.80 98.60 - - - - TIMUR LAUT - - - - - - - - - - - -
DAERAH BARAT DAYA - - - - - - - - - - - - SEBERANG PERAI - - - - - - - - - - - - SEBERANG PERAI - - - - - - - - - - - - SEBERANG PERAI - - - - - - - - - - - - TIMUR LAUT - - - - - - - - - - - -
DAERAH BARAT DAYA - - - - - - - - 1.50 1.08 20.34 60.00 SEBERANG PERAI - - - - - - - - - - - - SEBERANG PERAI - - - - - - - - 1.45 1.25 11.68 34.45 SEBERANG PERAI - - - - - - - - 4.20 4.20 27.66 81.60 TIMUR LAUT - - - - - - - - - - - -
- - -
Cengkih Clove Halia Ginger Kari Curry
- - - - - -
JADUAL 3-3 : KELUASAN, PENGELUARAN DAN NILAI PENGELUARAN TANAMAN REMPAH-RATUS MENGIKUT DAERAH, PULAU PINANG, 2017Table 3-3 : Hectareage, Production and Value of Production Of Spices By District, Penang, 2017
DAERAH District
Asam Gelugor (Asam Gelugor) Asam Jawa Tamarinde Bunga Kantan Pink Cone Ginger
-
Kayu Manis Cinnamon Ketumbar Coriander Kunyit Tumeric
1.00 1.00 19.80 98.60 - - Jumlah Total
- - - -
Jumlah Total
- -
-
Lengkuas Greater Galangal Limau Kasturi Lime Calamondin
- - -
-
- - - -
176.05 - -
- - -
- - 7.15
Lada Hitam Pepper
Jumlah Total
- -
Jumlah Total
- - - - 59.68 6.53
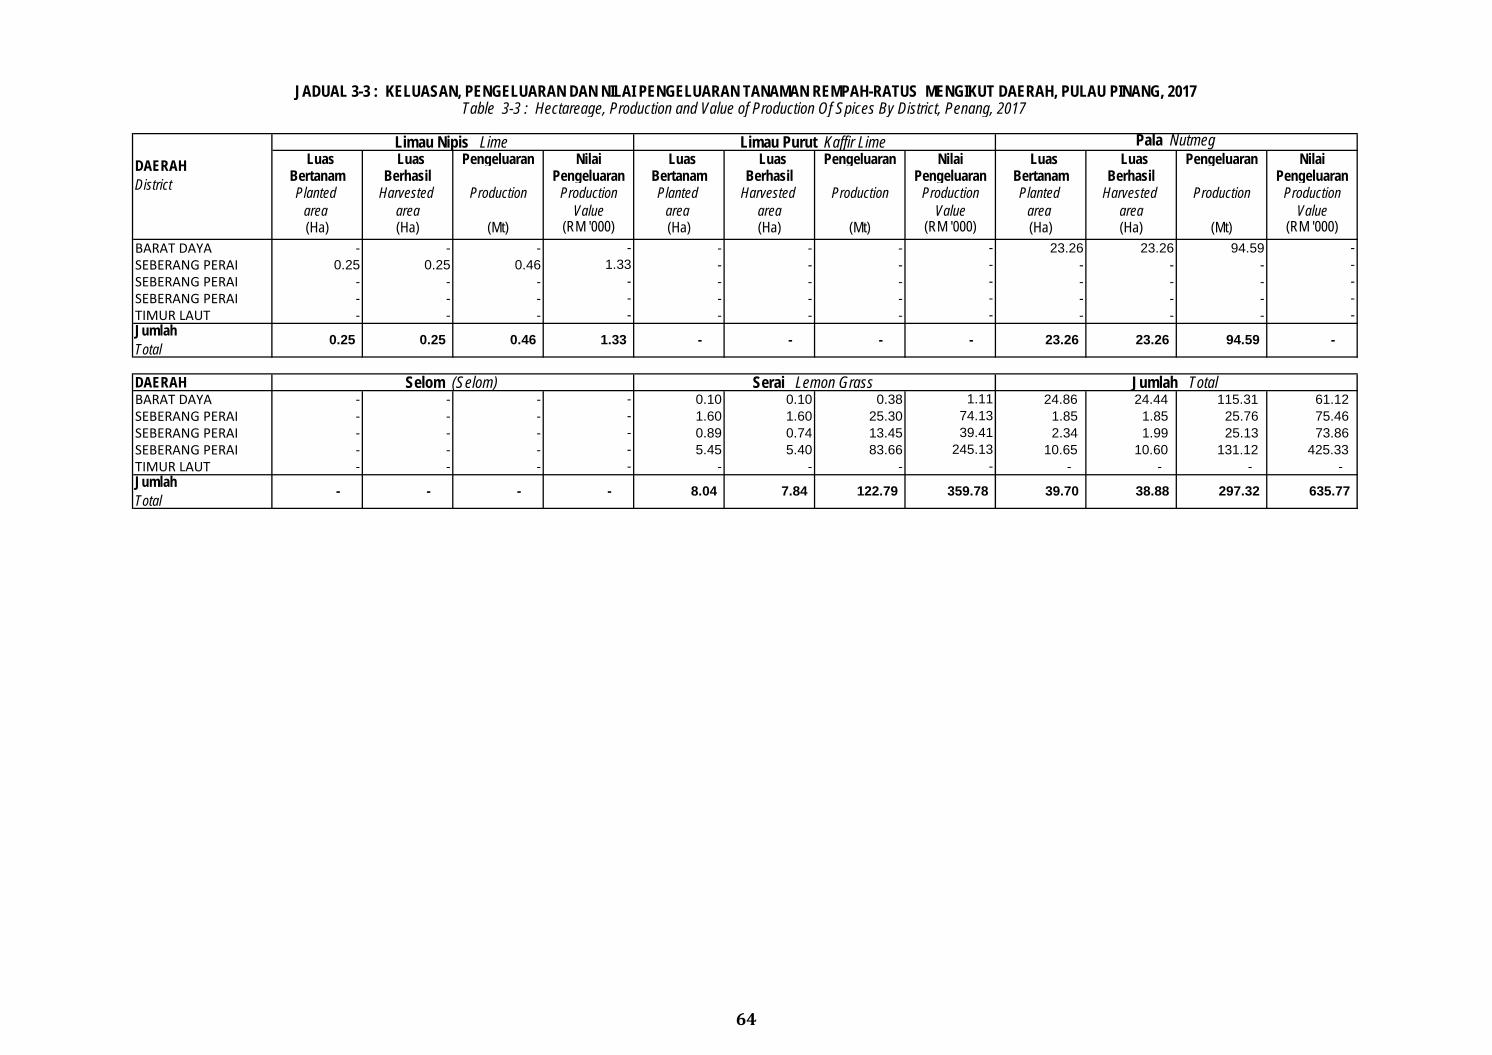
64
Luas Luas Pengeluaran Nilai Luas Luas Pengeluaran Nilai Luas Luas Pengeluaran Nilai Bertanam Berhasil Pengeluaran Bertanam Berhasil Pengeluaran Bertanam Berhasil Pengeluaran Planted Harvested Production Production Planted Harvested Production Production Planted Harvested Production Production
area area Value area area Value area area Value (Ha) (Ha) (Mt) (RM '000) (Ha) (Ha) (Mt) (RM '000) (Ha) (Ha) (Mt) (RM '000)
BARAT DAYA - - - - - - - - 23.26 23.26 94.59 - SEBERANG PERAI 0.25 0.25 0.46 1.33 - - - - - - - - SEBERANG PERAI - - - - - - - - - - - - SEBERANG PERAI - - - - - - - - - - - - TIMUR LAUT - - - - - - - - - - - -
DAERAH BARAT DAYA - - - - 0.10 0.10 0.38 1.11 24.86 24.44 115.31 61.12 SEBERANG PERAI - - - - 1.60 1.60 25.30 74.13 1.85 1.85 25.76 75.46 SEBERANG PERAI - - - - 0.89 0.74 13.45 39.41 2.34 1.99 25.13 73.86 SEBERANG PERAI - - - - 5.45 5.40 83.66 245.13 10.65 10.60 131.12 425.33 TIMUR LAUT - - - - - - - - - - - -
JADUAL 3-3 : KELUASAN, PENGELUARAN DAN NILAI PENGELUARAN TANAMAN REMPAH-RATUS MENGIKUT DAERAH, PULAU PINANG, 2017Table 3-3 : Hectareage, Production and Value of Production Of Spices By District, Penang, 2017
DAERAH District
Limau Nipis Lime Limau Purut Kaffir Lime Pala Nutmeg
Jumlah Total
- - - - 8.04 635.77
Jumlah Total
- - - - 23.26 0.25 0.25 0.46 1.33
7.84 122.79 359.78
-
Selom (Selom) Serai Lemon Grass Jumlah Total
39.70 38.88 297.32
23.26 94.59
SELANGOR
SELANGOR
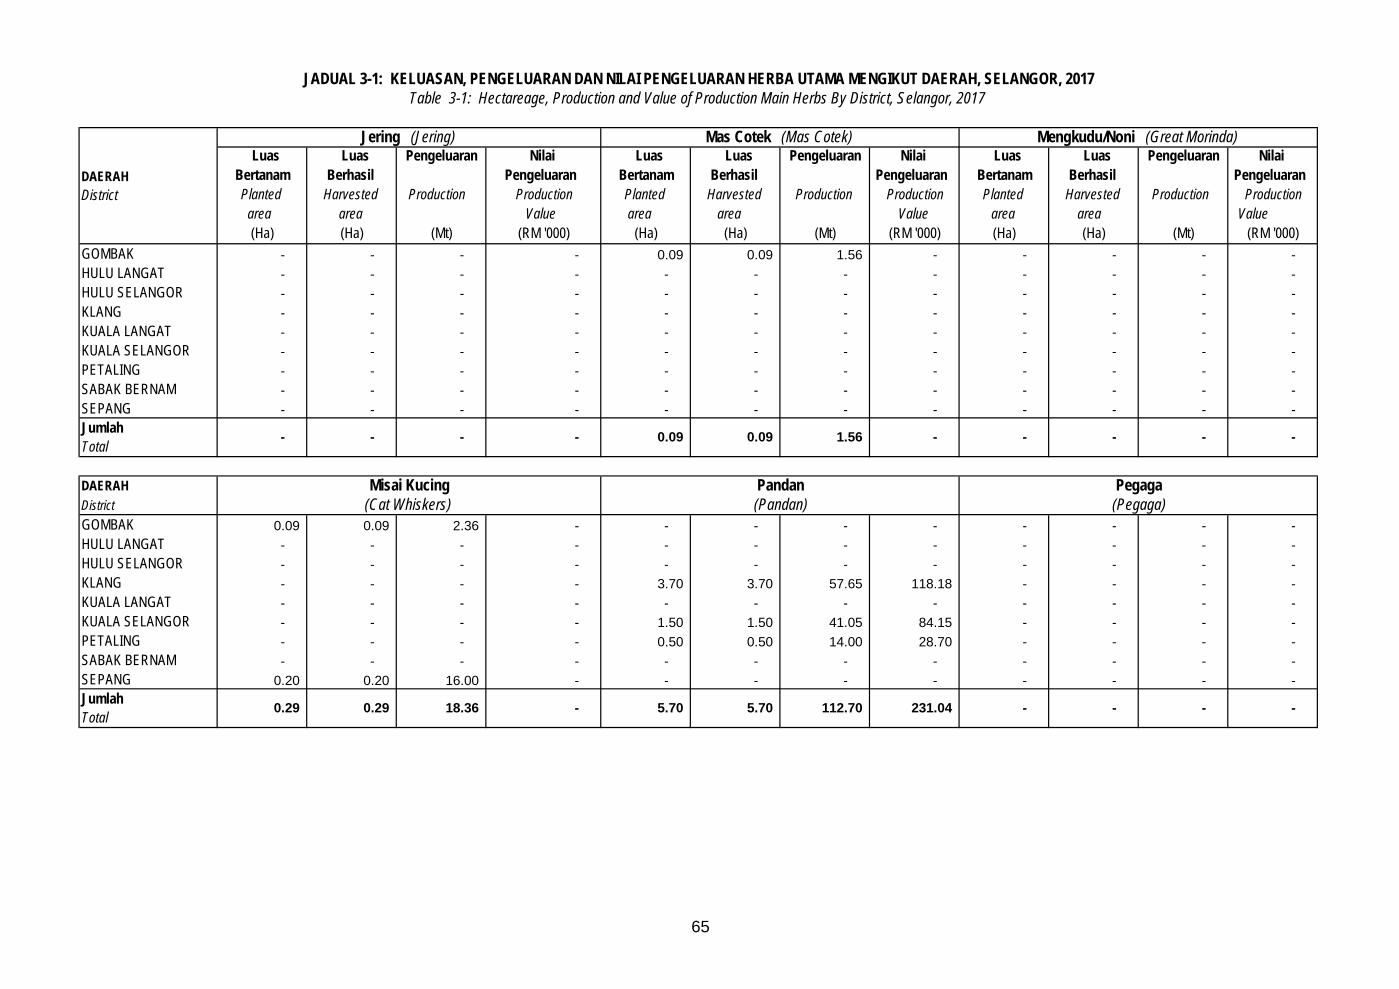
65
Luas Luas Pengeluaran Nilai Luas Luas Pengeluaran Nilai Luas Luas Pengeluaran Nilai Bertanam Berhasil Pengeluaran Bertanam Berhasil Pengeluaran Bertanam Berhasil Pengeluaran Planted Harvested Production Production Planted Harvested Production Production Planted Harvested Production Production
area area Value area area Value area area Value (Ha) (Ha) (Mt) (RM '000) (Ha) (Ha) (Mt) (RM '000) (Ha) (Ha) (Mt) (RM '000)
GOMBAK - - - - 0.09 0.09 1.56 - - - - - HULU LANGAT - - - - - - - - - - - - HULU SELANGOR - - - - - - - - - - - - KLANG - - - - - - - - - - - - KUALA LANGAT - - - - - - - - - - - - KUALA SELANGOR - - - - - - - - - - - - PETALING - - - - - - - - - - - - SABAK BERNAM - - - - - - - - - - - - SEPANG - - - - - - - - - - - -
DAERAH DistrictGOMBAK 0.09 0.09 2.36 - - - - - - - - - HULU LANGAT - - - - - - - - - - - - HULU SELANGOR - - - - - - - - - - - - KLANG - - - - 3.70 3.70 57.65 118.18 - - - - KUALA LANGAT - - - - - - - - - - - - KUALA SELANGOR - - - - 1.50 1.50 41.05 84.15 - - - - PETALING - - - - 0.50 0.50 14.00 28.70 - - - - SABAK BERNAM - - - - - - - - - - - - SEPANG 0.20 0.20 16.00 - - - - - - - - -
Jumlah Total
- - - - 0.09
JADUAL 3-1: KELUASAN, PENGELUARAN DAN NILAI PENGELUARAN HERBA UTAMA MENGIKUT DAERAH, SELANGOR, 2017Table 3-1: Hectareage, Production and Value of Production Main Herbs By District, Selangor, 2017
DAERAH District
Jering (Jering) Mas Cotek (Mas Cotek) Mengkudu/Noni (Great Morinda)
5.70
-
Misai Kucing Pandan Pegaga (Cat Whiskers) (Pandan) (Pegaga)
0.09 1.56 - - - -
- 5.70 112.70 231.04 - - - Jumlah Total
0.29 0.29 18.36 -
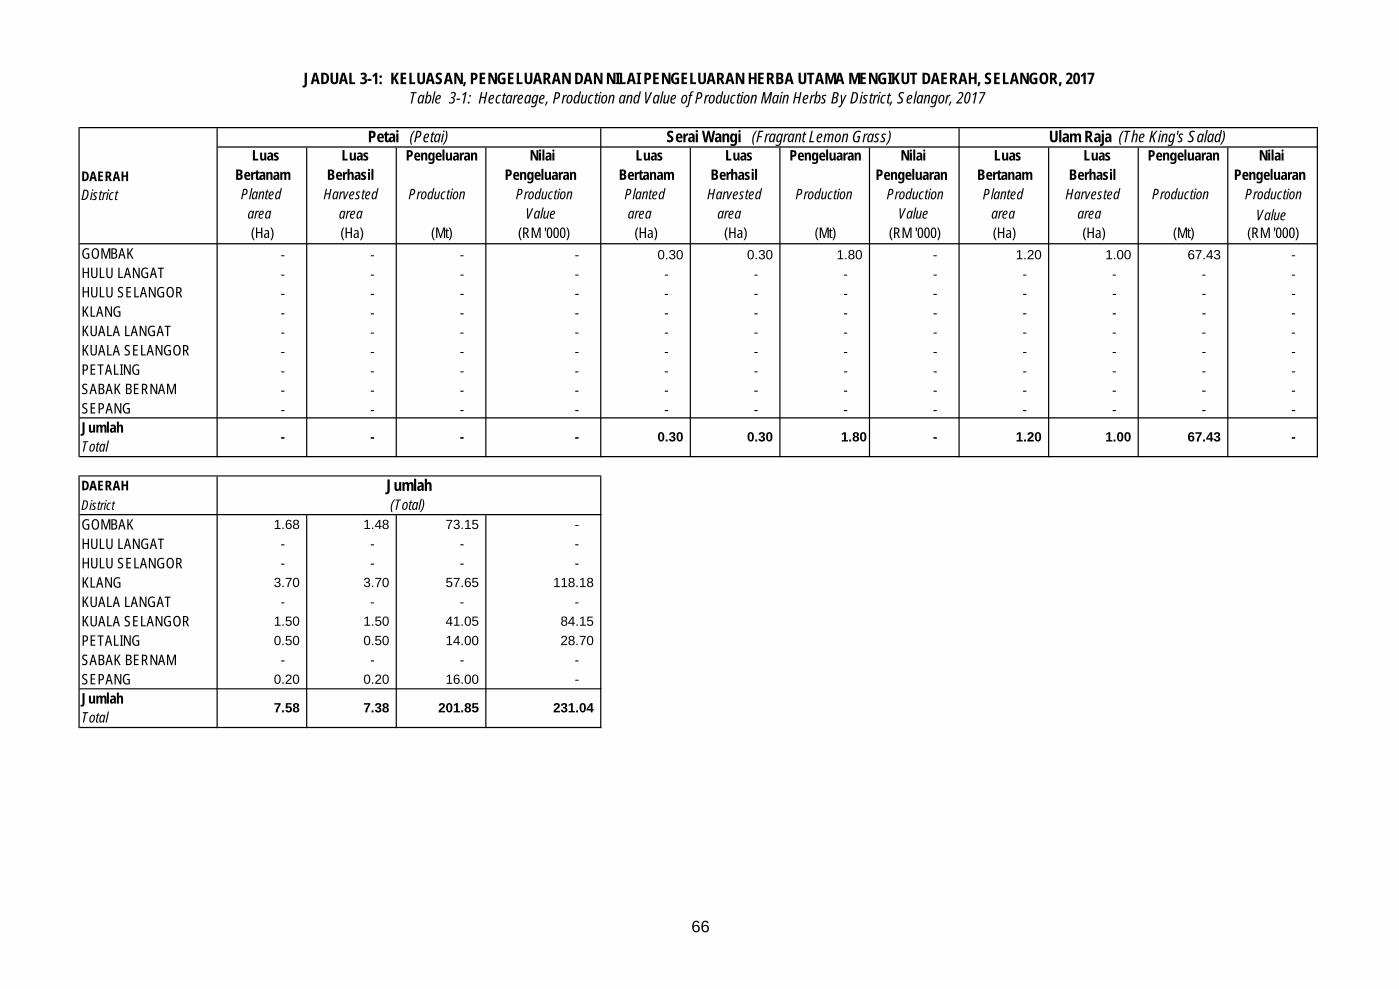
66
Luas Luas Pengeluaran Nilai Luas Luas Pengeluaran Nilai Luas Luas Pengeluaran Nilai Bertanam Berhasil Pengeluaran Bertanam Berhasil Pengeluaran Bertanam Berhasil Pengeluaran Planted Harvested Production Production Planted Harvested Production Production Planted Harvested Production Production
area area Value area area Value area area Value (Ha) (Ha) (Mt) (RM '000) (Ha) (Ha) (Mt) (RM '000) (Ha) (Ha) (Mt) (RM '000)
GOMBAK - - - - 0.30 0.30 1.80 - 1.20 1.00 67.43 - HULU LANGAT - - - - - - - - - - - - HULU SELANGOR - - - - - - - - - - - - KLANG - - - - - - - - - - - - KUALA LANGAT - - - - - - - - - - - - KUALA SELANGOR - - - - - - - - - - - - PETALING - - - - - - - - - - - - SABAK BERNAM - - - - - - - - - - - - SEPANG - - - - - - - - - - - -
DAERAH DistrictGOMBAK 1.68 1.48 73.15 - HULU LANGAT - - - - HULU SELANGOR - - - - KLANG 3.70 3.70 57.65 118.18 KUALA LANGAT - - - - KUALA SELANGOR 1.50 1.50 41.05 84.15 PETALING 0.50 0.50 14.00 28.70 SABAK BERNAM - - - - SEPANG 0.20 0.20 16.00 -
Jumlah Total
- - - - 0.30
JADUAL 3-1: KELUASAN, PENGELUARAN DAN NILAI PENGELUARAN HERBA UTAMA MENGIKUT DAERAH, SELANGOR, 2017Table 3-1: Hectareage, Production and Value of Production Main Herbs By District, Selangor, 2017
DAERAH District
Petai (Petai) Serai Wangi (Fragrant Lemon Grass) Ulam Raja (The King's Salad)
-
Jumlah (Total)
0.30 1.80 - 1.20 1.00 67.43
Jumlah Total
7.58 7.38 201.85 231.04
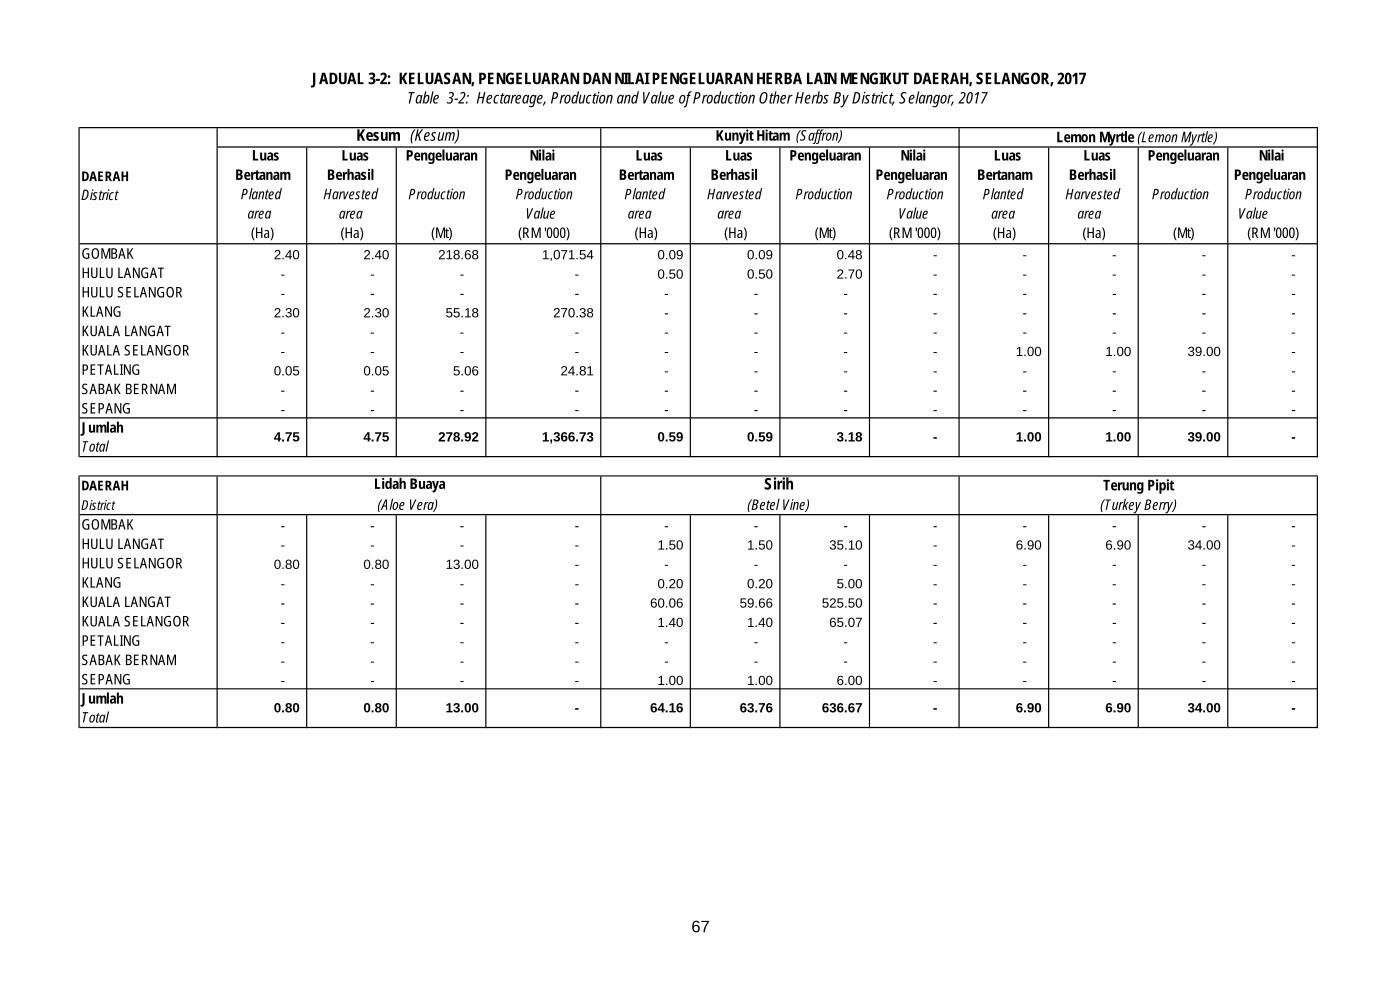
67
Luas Luas Pengeluaran Nilai Luas Luas Pengeluaran Nilai Luas Luas Pengeluaran Nilai Bertanam Berhasil Pengeluaran Bertanam Berhasil Pengeluaran Bertanam Berhasil Pengeluaran Planted Harvested Production Production Planted Harvested Production Production Planted Harvested Production Production
area area Value area area Value area area Value (Ha) (Ha) (Mt) (RM '000) (Ha) (Ha) (Mt) (RM '000) (Ha) (Ha) (Mt) (RM '000)
GOMBAK 2.40 2.40 218.68 1,071.54 0.09 0.09 0.48 - - - - - HULU LANGAT - - - - 0.50 0.50 2.70 - - - - - HULU SELANGOR - - - - - - - - - - - - KLANG 2.30 2.30 55.18 270.38 - - - - - - - - KUALA LANGAT - - - - - - - - - - - - KUALA SELANGOR - - - - - - - - 1.00 1.00 39.00 - PETALING 0.05 0.05 5.06 24.81 - - - - - - - - SABAK BERNAM - - - - - - - - - - - - SEPANG - - - - - - - - - - - -
DAERAH DistrictGOMBAK - - - - - - - - - - - - HULU LANGAT - - - - 1.50 1.50 35.10 - 6.90 6.90 34.00 - HULU SELANGOR 0.80 0.80 13.00 - - - - - - - - - KLANG - - - - 0.20 0.20 5.00 - - - - - KUALA LANGAT - - - - 60.06 59.66 525.50 - - - - - KUALA SELANGOR - - - - 1.40 1.40 65.07 - - - - - PETALING - - - - - - - - - - - - SABAK BERNAM - - - - - - - - - - - - SEPANG - - - - 1.00 1.00 6.00 - - - - -
Jumlah Total
4.75 4.75 278.92 1,366.73 0.59
JADUAL 3-2: KELUASAN, PENGELUARAN DAN NILAI PENGELUARAN HERBA LAIN MENGIKUT DAERAH, SELANGOR, 2017Table 3-2: Hectareage, Production and Value of Production Other Herbs By District, Selangor, 2017
DAERAH District
Kesum (Kesum) Kunyit Hitam (Saffron) Lemon Myrtle (Lemon Myrtle)
-
Lidah Buaya Sirih Terung Pipit (Aloe Vera) (Betel Vine) (Turkey Berry)
0.59 3.18 - 1.00 1.00 39.00
- 63.76 636.67 - 6.90 6.90 34.00 Jumlah Total
0.80 0.80 13.00 - 64.16
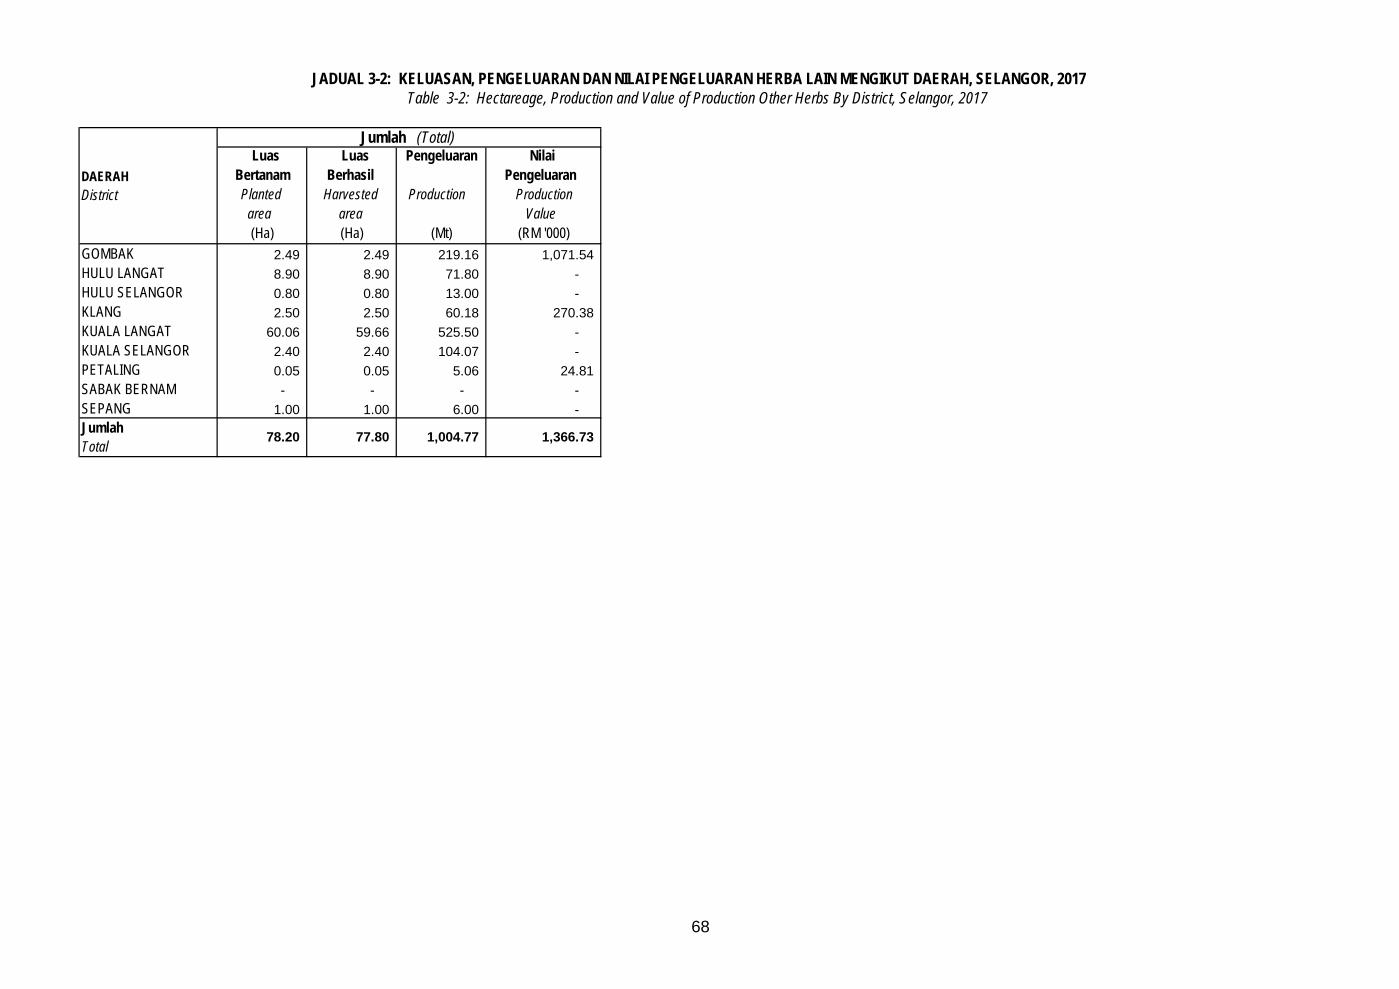
68
Luas Luas Pengeluaran Nilai Bertanam Berhasil Pengeluaran Planted Harvested Production Production
area area Value (Ha) (Ha) (Mt) (RM '000)
GOMBAK 2.49 2.49 219.16 1,071.54 HULU LANGAT 8.90 8.90 71.80 - HULU SELANGOR 0.80 0.80 13.00 - KLANG 2.50 2.50 60.18 270.38 KUALA LANGAT 60.06 59.66 525.50 - KUALA SELANGOR 2.40 2.40 104.07 - PETALING 0.05 0.05 5.06 24.81 SABAK BERNAM - - - - SEPANG 1.00 1.00 6.00 -
JADUAL 3-2: KELUASAN, PENGELUARAN DAN NILAI PENGELUARAN HERBA LAIN MENGIKUT DAERAH, SELANGOR, 2017Table 3-2: Hectareage, Production and Value of Production Other Herbs By District, Selangor, 2017
DAERAH District
Jumlah (Total)
Jumlah Total
78.20 77.80 1,004.77 1,366.73
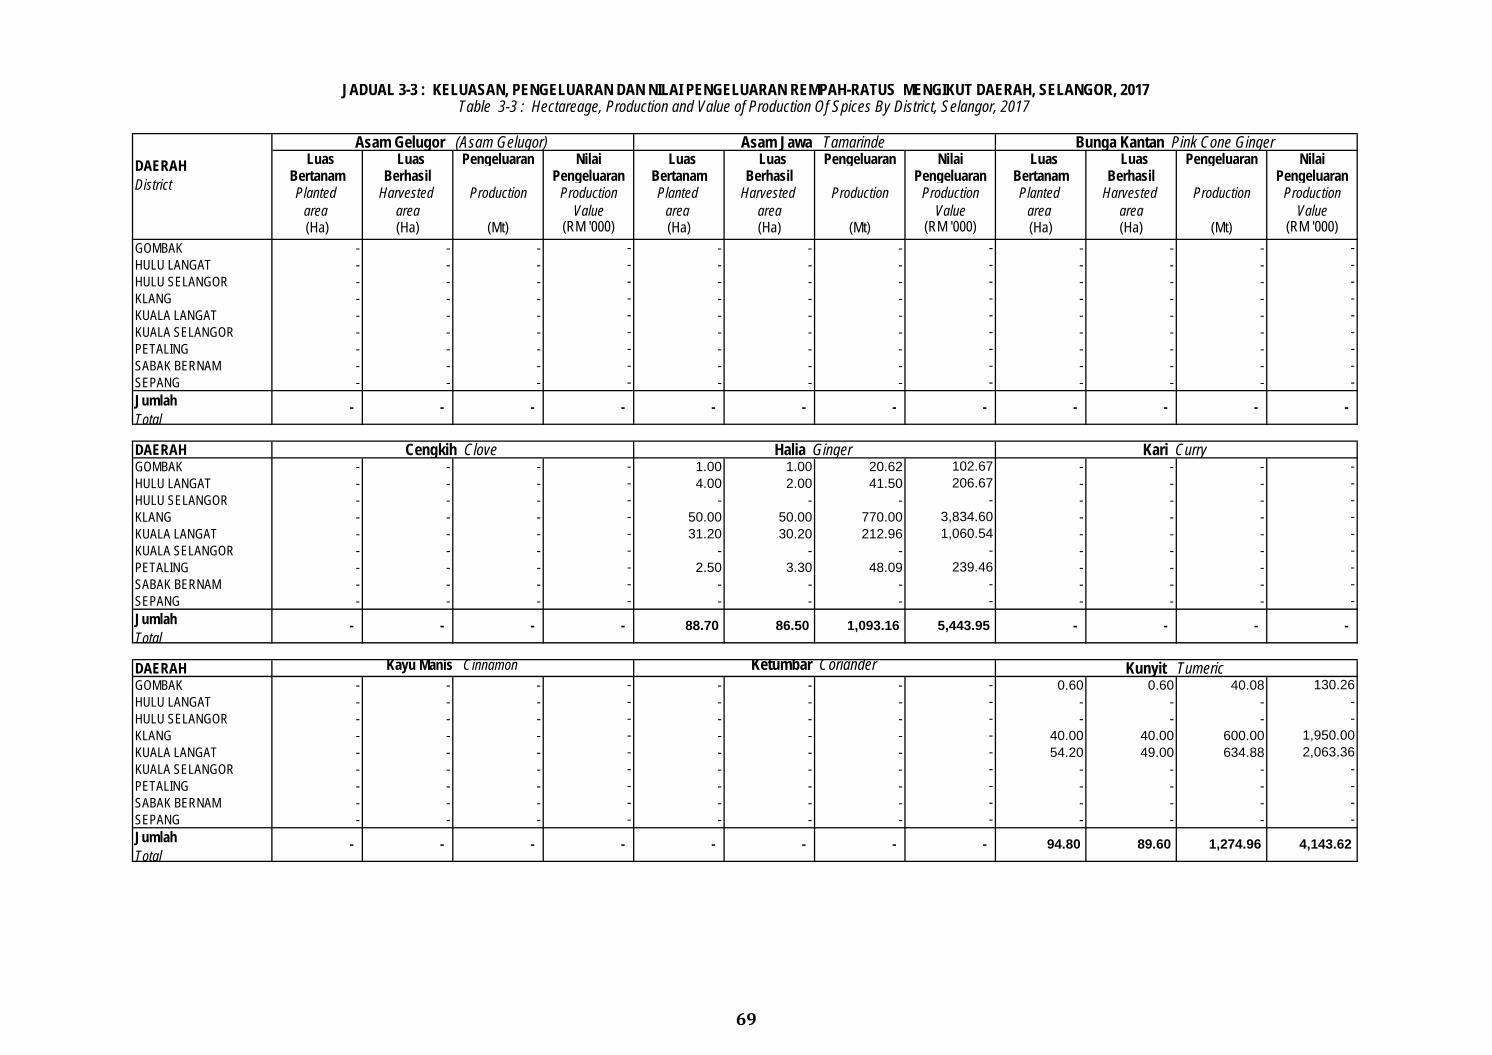
69
Luas Luas Pengeluaran Nilai Luas Luas Pengeluaran Nilai Luas Luas Pengeluaran Nilai Bertanam Berhasil Pengeluaran Bertanam Berhasil Pengeluaran Bertanam Berhasil Pengeluaran Planted Harvested Production Production Planted Harvested Production Production Planted Harvested Production Production
area area Value area area Value area area Value (Ha) (Ha) (Mt) (RM '000) (Ha) (Ha) (Mt) (RM '000) (Ha) (Ha) (Mt) (RM '000)
GOMBAK - - - - - - - - - - - - HULU LANGAT - - - - - - - - - - - - HULU SELANGOR - - - - - - - - - - - - KLANG - - - - - - - - - - - - KUALA LANGAT - - - - - - - - - - - - KUALA SELANGOR - - - - - - - - - - - - PETALING - - - - - - - - - - - - SABAK BERNAM - - - - - - - - - - - - SEPANG - - - - - - - - - - - -
DAERAH GOMBAK - - - - 1.00 1.00 20.62 102.67 - - - - HULU LANGAT - - - - 4.00 2.00 41.50 206.67 - - - - HULU SELANGOR - - - - - - - - - - - - KLANG - - - - 50.00 50.00 770.00 3,834.60 - - - - KUALA LANGAT - - - - 31.20 30.20 212.96 1,060.54 - - - - KUALA SELANGOR - - - - - - - - - - - - PETALING - - - - 2.50 3.30 48.09 239.46 - - - - SABAK BERNAM - - - - - - - - - - - - SEPANG - - - - - - - - - - - -
DAERAH GOMBAK - - - - - - - - 0.60 0.60 40.08 130.26 HULU LANGAT - - - - - - - - - - - - HULU SELANGOR - - - - - - - - - - - - KLANG - - - - - - - - 40.00 40.00 600.00 1,950.00 KUALA LANGAT - - - - - - - - 54.20 49.00 634.88 2,063.36 KUALA SELANGOR - - - - - - - - - - - - PETALING - - - - - - - - - - - - SABAK BERNAM - - - - - - - - - - - - SEPANG - - - - - - - - - - - -
Jumlah Total
- - - - 88.70
JADUAL 3-3 : KELUASAN, PENGELUARAN DAN NILAI PENGELUARAN REMPAH-RATUS MENGIKUT DAERAH, SELANGOR, 2017Table 3-3 : Hectareage, Production and Value of Production Of Spices By District, Selangor, 2017
DAERAH District
Asam Gelugor (Asam Gelugor) Asam Jawa Tamarinde Bunga Kantan Pink Cone Ginger
Cengkih Clove Halia Ginger Kari Curry
- - - - - - Jumlah Total
- - - - -
86.50 5,443.95 - - -
-
1,093.16 -
Kayu Manis Cinnamon Ketumbar Coriander Kunyit Tumeric
Jumlah Total
- - - - - - 4,143.62 - 94.80 89.60 1,274.96 -
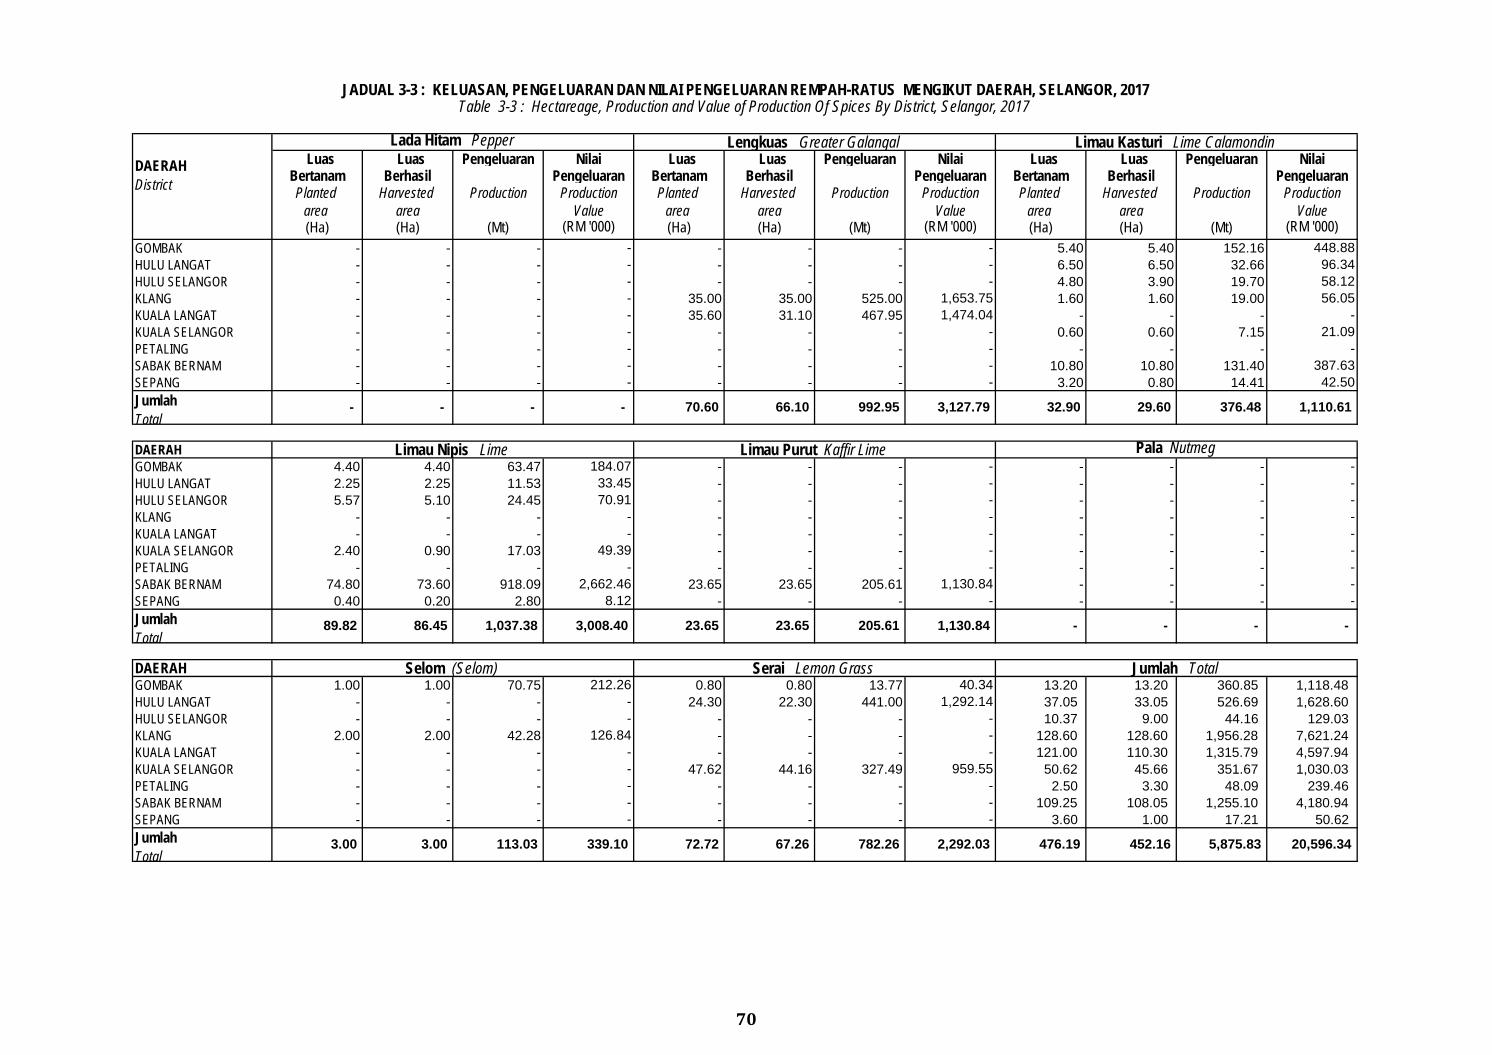
70
Luas Luas Pengeluaran Nilai Luas Luas Pengeluaran Nilai Luas Luas Pengeluaran Nilai Bertanam Berhasil Pengeluaran Bertanam Berhasil Pengeluaran Bertanam Berhasil Pengeluaran Planted Harvested Production Production Planted Harvested Production Production Planted Harvested Production Production
area area Value area area Value area area Value (Ha) (Ha) (Mt) (RM '000) (Ha) (Ha) (Mt) (RM '000) (Ha) (Ha) (Mt) (RM '000)
GOMBAK - - - - - - - - 5.40 5.40 152.16 448.88 HULU LANGAT - - - - - - - - 6.50 6.50 32.66 96.34 HULU SELANGOR - - - - - - - - 4.80 3.90 19.70 58.12 KLANG - - - - 35.00 35.00 525.00 1,653.75 1.60 1.60 19.00 56.05 KUALA LANGAT - - - - 35.60 31.10 467.95 1,474.04 - - - - KUALA SELANGOR - - - - - - - - 0.60 0.60 7.15 21.09 PETALING - - - - - - - - - - - - SABAK BERNAM - - - - - - - - 10.80 10.80 131.40 387.63 SEPANG - - - - - - - - 3.20 0.80 14.41 42.50
DAERAH GOMBAK 4.40 4.40 63.47 184.07 - - - - - - - - HULU LANGAT 2.25 2.25 11.53 33.45 - - - - - - - - HULU SELANGOR 5.57 5.10 24.45 70.91 - - - - - - - - KLANG - - - - - - - - - - - - KUALA LANGAT - - - - - - - - - - - - KUALA SELANGOR 2.40 0.90 17.03 49.39 - - - - - - - - PETALING - - - - - - - - - - - - SABAK BERNAM 74.80 73.60 918.09 2,662.46 23.65 23.65 205.61 1,130.84 - - - - SEPANG 0.40 0.20 2.80 8.12 - - - - - - - -
DAERAH GOMBAK 1.00 1.00 70.75 212.26 0.80 0.80 13.77 40.34 13.20 13.20 360.85 1,118.48 HULU LANGAT - - - - 24.30 22.30 441.00 1,292.14 37.05 33.05 526.69 1,628.60 HULU SELANGOR - - - - - - - - 10.37 9.00 44.16 129.03 KLANG 2.00 2.00 42.28 126.84 - - - - 128.60 128.60 1,956.28 7,621.24 KUALA LANGAT - - - - - - - - 121.00 110.30 1,315.79 4,597.94 KUALA SELANGOR - - - - 47.62 44.16 327.49 959.55 50.62 45.66 351.67 1,030.03 PETALING - - - - - - - - 2.50 3.30 48.09 239.46 SABAK BERNAM - - - - - - - - 109.25 108.05 1,255.10 4,180.94 SEPANG - - - - - - - - 3.60 1.00 17.21 50.62
32.90 29.60 376.48 1,110.61
JADUAL 3-3 : KELUASAN, PENGELUARAN DAN NILAI PENGELUARAN REMPAH-RATUS MENGIKUT DAERAH, SELANGOR, 2017Table 3-3 : Hectareage, Production and Value of Production Of Spices By District, Selangor, 2017
Jumlah Total
70.60 66.10 - - - -
DAERAH District
Lada Hitam Pepper Lengkuas Greater Galangal Limau Kasturi Lime Calamondin
992.95
5,875.83
Limau Nipis Lime Limau Purut Kaffir Lime Pala Nutmeg
452.16
-
Jumlah Total
- - -
20,596.34 72.72 67.26 782.26 2,292.03 476.19
3,127.79
Jumlah Total
3.00 3.00 113.03 339.10
23.65 Jumlah Total
89.82 86.45 1,037.38
Selom (Selom) Serai Lemon Grass
205.61 1,130.84 3,008.40 23.65
TERENGGANU
TERENGGANU
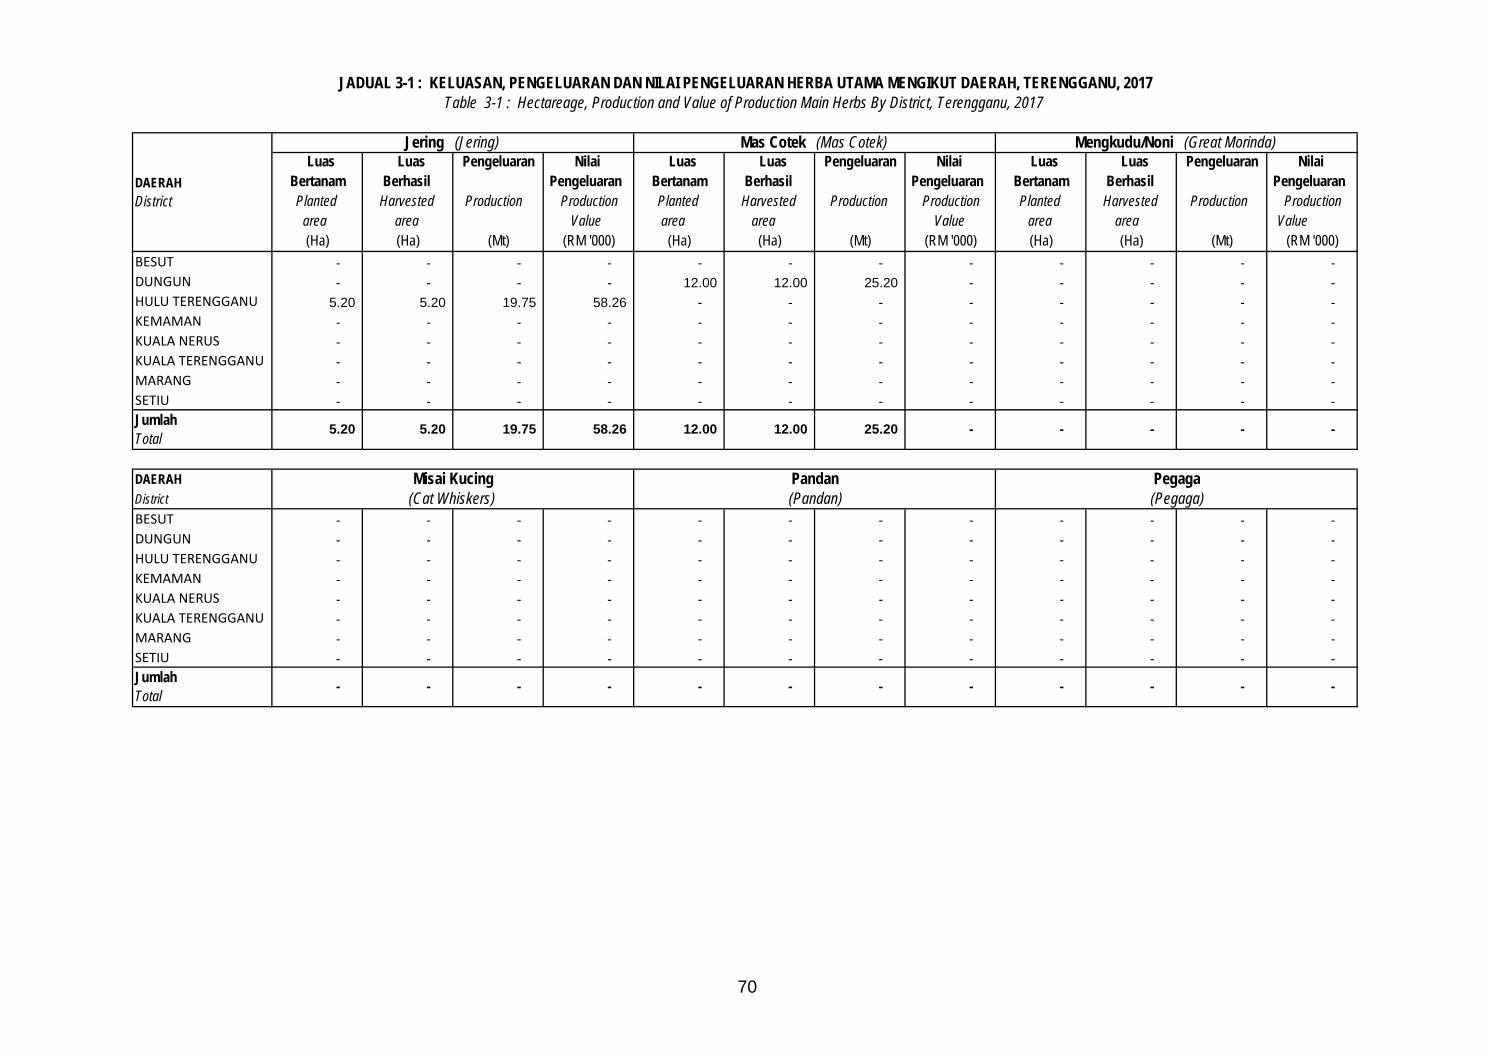
70
Luas Luas Pengeluaran Nilai Luas Luas Pengeluaran Nilai Luas Luas Pengeluaran Nilai Bertanam Berhasil Pengeluaran Bertanam Berhasil Pengeluaran Bertanam Berhasil Pengeluaran Planted Harvested Production Production Planted Harvested Production Production Planted Harvested Production Production
area area Value area area Value area area Value (Ha) (Ha) (Mt) (RM '000) (Ha) (Ha) (Mt) (RM '000) (Ha) (Ha) (Mt) (RM '000)
BESUT - - - - - - - - - - - - DUNGUN - - - - 12.00 12.00 25.20 - - - - - HULU TERENGGANU 5.20 5.20 19.75 58.26 - - - - - - - - KEMAMAN - - - - - - - - - - - - KUALA NERUS - - - - - - - - - - - - KUALA TERENGGANU - - - - - - - - - - - - MARANG - - - - - - - - - - - - SETIU - - - - - - - - - - - -
DAERAH DistrictBESUT - - - - - - - - - - - - DUNGUN - - - - - - - - - - - - HULU TERENGGANU - - - - - - - - - - - - KEMAMAN - - - - - - - - - - - - KUALA NERUS - - - - - - - - - - - - KUALA TERENGGANU - - - - - - - - - - - - MARANG - - - - - - - - - - - - SETIU - - - - - - - - - - - -
JADUAL 3-1 : KELUASAN, PENGELUARAN DAN NILAI PENGELUARAN HERBA UTAMA MENGIKUT DAERAH, TERENGGANU, 2017Table 3-1 : Hectareage, Production and Value of Production Main Herbs By District, Terengganu, 2017
DAERAH District
Jering (Jering) Mas Cotek (Mas Cotek) Mengkudu/Noni (Great Morinda)
Jumlah Total
5.20 5.20 19.75 58.26 12.00 12.00 25.20 - - - - -
Misai Kucing Pandan Pegaga (Cat Whiskers) (Pandan) (Pegaga)
Jumlah Total
- - - - - - - - - - - -
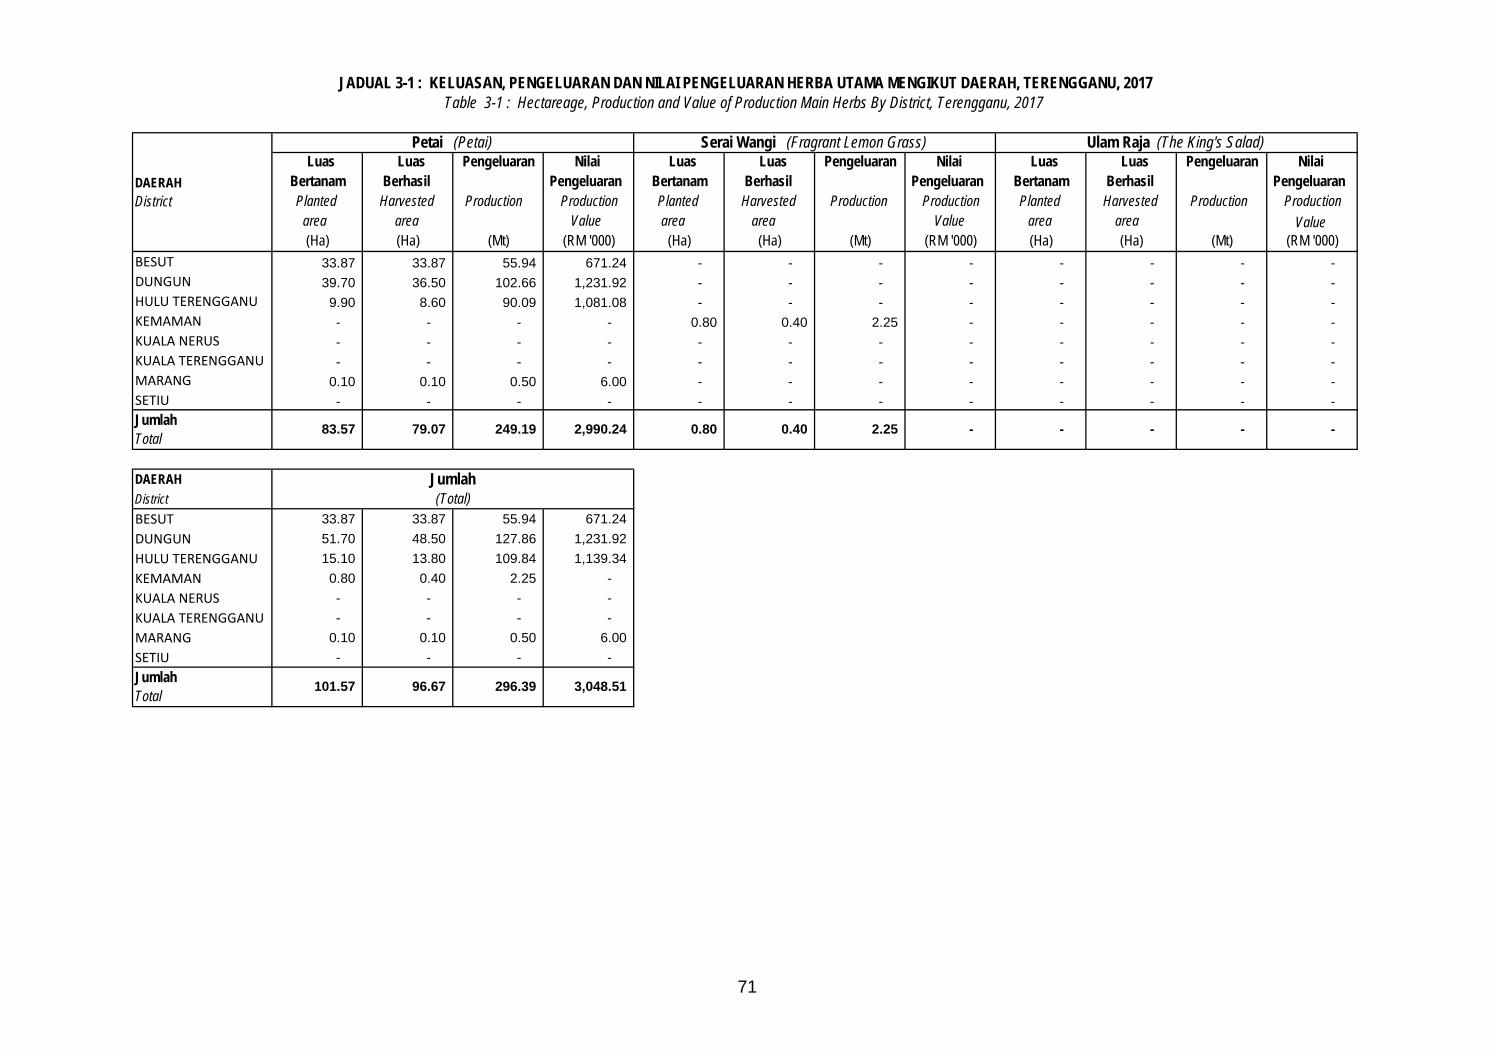
71
Luas Luas Pengeluaran Nilai Luas Luas Pengeluaran Nilai Luas Luas Pengeluaran Nilai Bertanam Berhasil Pengeluaran Bertanam Berhasil Pengeluaran Bertanam Berhasil Pengeluaran Planted Harvested Production Production Planted Harvested Production Production Planted Harvested Production Production
area area Value area area Value area area Value (Ha) (Ha) (Mt) (RM '000) (Ha) (Ha) (Mt) (RM '000) (Ha) (Ha) (Mt) (RM '000)
BESUT 33.87 33.87 55.94 671.24 - - - - - - - - DUNGUN 39.70 36.50 102.66 1,231.92 - - - - - - - - HULU TERENGGANU 9.90 8.60 90.09 1,081.08 - - - - - - - - KEMAMAN - - - - 0.80 0.40 2.25 - - - - - KUALA NERUS - - - - - - - - - - - - KUALA TERENGGANU - - - - - - - - - - - - MARANG 0.10 0.10 0.50 6.00 - - - - - - - - SETIU - - - - - - - - - - - -
DAERAH DistrictBESUT 33.87 33.87 55.94 671.24 DUNGUN 51.70 48.50 127.86 1,231.92 HULU TERENGGANU 15.10 13.80 109.84 1,139.34 KEMAMAN 0.80 0.40 2.25 - KUALA NERUS - - - - KUALA TERENGGANU - - - - MARANG 0.10 0.10 0.50 6.00 SETIU - - - -
JADUAL 3-1 : KELUASAN, PENGELUARAN DAN NILAI PENGELUARAN HERBA UTAMA MENGIKUT DAERAH, TERENGGANU, 2017Table 3-1 : Hectareage, Production and Value of Production Main Herbs By District, Terengganu, 2017
DAERAH District
Petai (Petai) Serai Wangi (Fragrant Lemon Grass) Ulam Raja (The King's Salad)
Jumlah Total
83.57 79.07 249.19 2,990.24 0.80 0.40 2.25 - - - - -
Jumlah (Total)
Jumlah Total
101.57 96.67 296.39 3,048.51
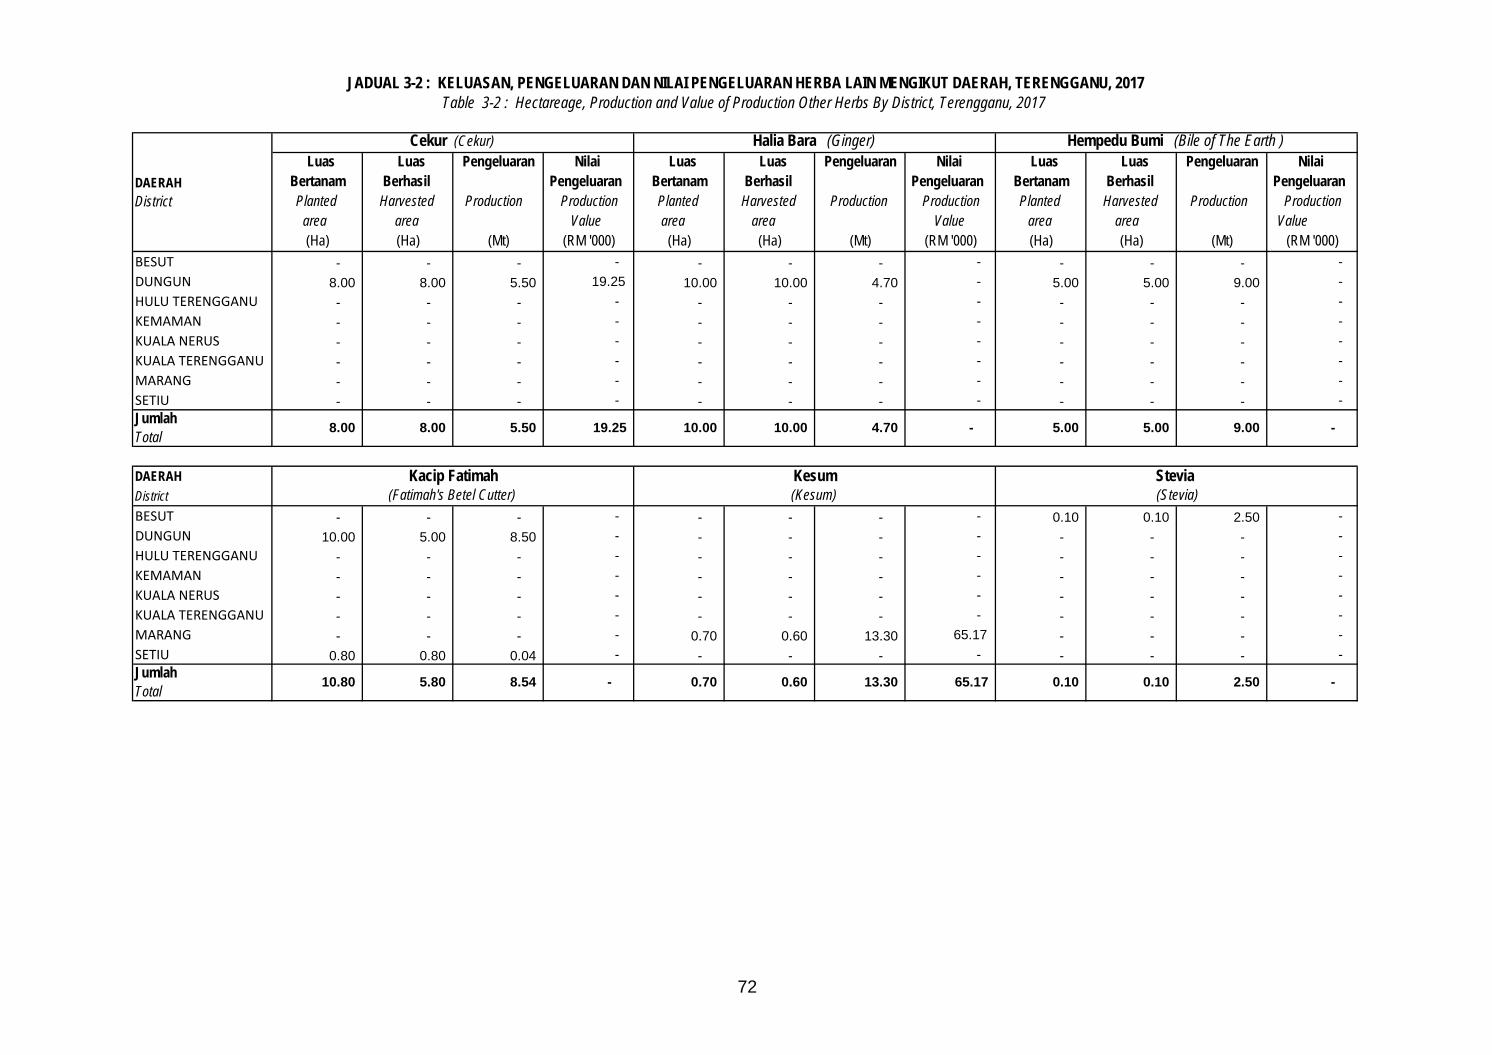
72
Luas Luas Pengeluaran Nilai Luas Luas Pengeluaran Nilai Luas Luas Pengeluaran Nilai Bertanam Berhasil Pengeluaran Bertanam Berhasil Pengeluaran Bertanam Berhasil Pengeluaran Planted Harvested Production Production Planted Harvested Production Production Planted Harvested Production Production
area area Value area area Value area area Value (Ha) (Ha) (Mt) (RM '000) (Ha) (Ha) (Mt) (RM '000) (Ha) (Ha) (Mt) (RM '000)
BESUT - - - - - - - - - - - - DUNGUN 8.00 8.00 5.50 19.25 10.00 10.00 4.70 - 5.00 5.00 9.00 - HULU TERENGGANU - - - - - - - - - - - - KEMAMAN - - - - - - - - - - - - KUALA NERUS - - - - - - - - - - - - KUALA TERENGGANU - - - - - - - - - - - - MARANG - - - - - - - - - - - - SETIU - - - - - - - - - - - -
DAERAH DistrictBESUT - - - - - - - - 0.10 0.10 2.50 - DUNGUN 10.00 5.00 8.50 - - - - - - - - - HULU TERENGGANU - - - - - - - - - - - - KEMAMAN - - - - - - - - - - - - KUALA NERUS - - - - - - - - - - - - KUALA TERENGGANU - - - - - - - - - - - - MARANG - - - - 0.70 0.60 13.30 65.17 - - - - SETIU 0.80 0.80 0.04 - - - - - - - - - Jumlah Total
2.50 10.80 -
JADUAL 3-2 : KELUASAN, PENGELUARAN DAN NILAI PENGELUARAN HERBA LAIN MENGIKUT DAERAH, TERENGGANU, 2017Table 3-2 : Hectareage, Production and Value of Production Other Herbs By District, Terengganu, 2017
DAERAH District
Cekur (Cekur) Halia Bara (Ginger) Hempedu Bumi (Bile of The Earth )
- 5.00 5.00 9.00 Jumlah Total
8.00 8.00 5.50 19.25 10.00
(Fatimah's Betel Cutter) (Kesum) (Stevia)
10.00 4.70
13.30 0.10 0.10
-
5.80 8.54 -
Kacip Fatimah Kesum Stevia
0.70 0.60 65.17
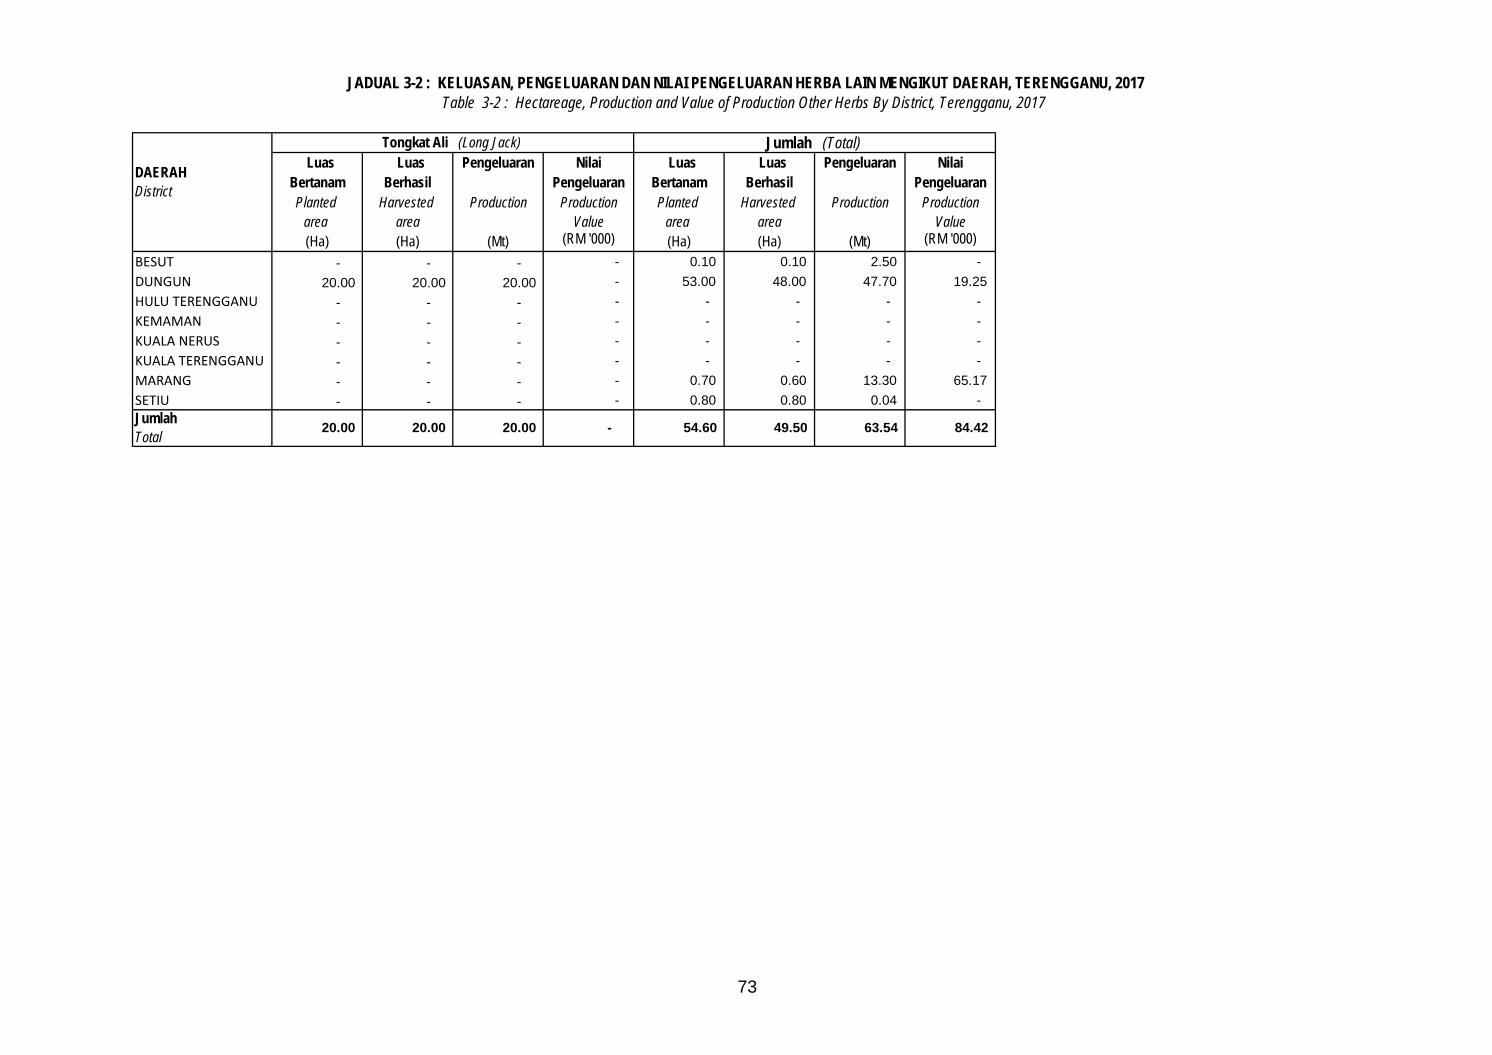
73
Luas Luas Pengeluaran Nilai Luas Luas Pengeluaran Nilai Bertanam Berhasil Pengeluaran Bertanam Berhasil Pengeluaran Planted Harvested Production Production Planted Harvested Production Production
area area Value area area Value (Ha) (Ha) (Mt) (RM '000) (Ha) (Ha) (Mt) (RM '000)
BESUT - - - - 0.10 0.10 2.50 - DUNGUN 20.00 20.00 20.00 - 53.00 48.00 47.70 19.25 HULU TERENGGANU - - - - - - - - KEMAMAN - - - - - - - - KUALA NERUS - - - - - - - - KUALA TERENGGANU - - - - - - - - MARANG - - - - 0.70 0.60 13.30 65.17 SETIU - - - - 0.80 0.80 0.04 -
JADUAL 3-2 : KELUASAN, PENGELUARAN DAN NILAI PENGELUARAN HERBA LAIN MENGIKUT DAERAH, TERENGGANU, 2017Table 3-2 : Hectareage, Production and Value of Production Other Herbs By District, Terengganu, 2017
Jumlah (Total)
DAERAH District
Tongkat Ali (Long Jack)
Jumlah Total
20.00 20.00 20.00 - 54.60 49.50 63.54 84.42
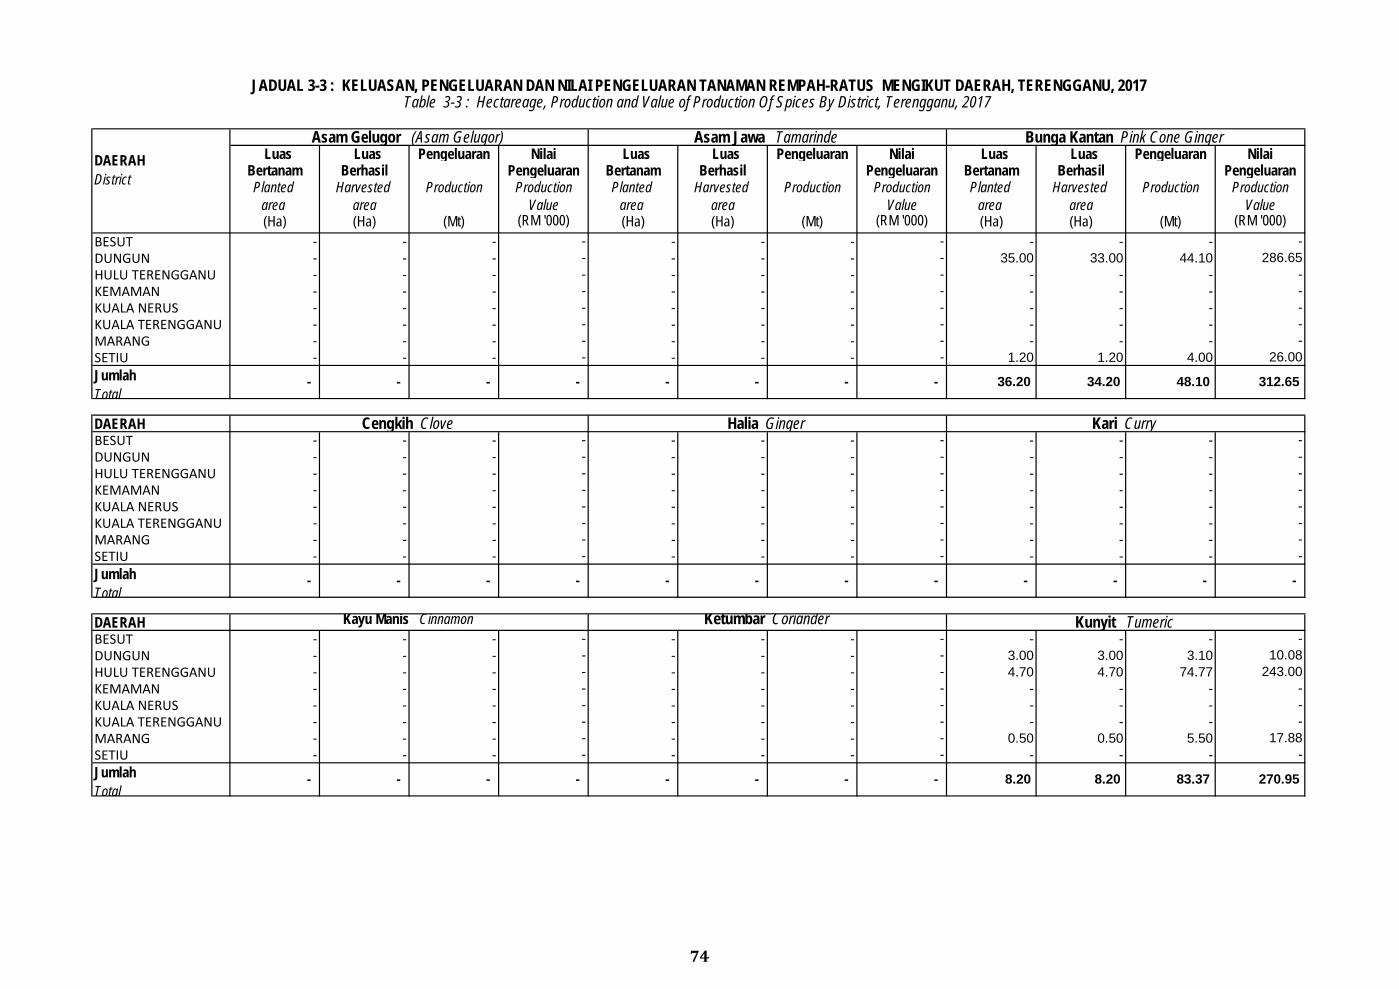
74
Luas Luas Pengeluaran Nilai Luas Luas Pengeluaran Nilai Luas Luas Pengeluaran Nilai Bertanam Berhasil Pengeluaran Bertanam Berhasil Pengeluaran Bertanam Berhasil Pengeluaran Planted Harvested Production Production Planted Harvested Production Production Planted Harvested Production Production
area area Value area area Value area area Value (Ha) (Ha) (Mt) (RM '000) (Ha) (Ha) (Mt) (RM '000) (Ha) (Ha) (Mt) (RM '000)
BESUT - - - - - - - - - - - - DUNGUN - - - - - - - - 35.00 33.00 44.10 286.65 HULU TERENGGANU - - - - - - - - - - - - KEMAMAN - - - - - - - - - - - - KUALA NERUS - - - - - - - - - - - - KUALA TERENGGANU - - - - - - - - - - - - MARANG - - - - - - - - - - - - SETIU - - - - - - - - 1.20 1.20 4.00 26.00
DAERAH BESUT - - - - - - - - - - - - DUNGUN - - - - - - - - - - - - HULU TERENGGANU - - - - - - - - - - - - KEMAMAN - - - - - - - - - - - - KUALA NERUS - - - - - - - - - - - - KUALA TERENGGANU - - - - - - - - - - - - MARANG - - - - - - - - - - - - SETIU - - - - - - - - - - - -
DAERAH BESUT - - - - - - - - - - - - DUNGUN - - - - - - - - 3.00 3.00 3.10 10.08 HULU TERENGGANU - - - - - - - - 4.70 4.70 74.77 243.00 KEMAMAN - - - - - - - - - - - - KUALA NERUS - - - - - - - - - - - - KUALA TERENGGANU - - - - - - - - - - - - MARANG - - - - - - - - 0.50 0.50 5.50 17.88 SETIU - - - - - - - - - - - -
- - - - -
- - - 8.20 8.20 83.37
JADUAL 3-3 : KELUASAN, PENGELUARAN DAN NILAI PENGELUARAN TANAMAN REMPAH-RATUS MENGIKUT DAERAH, TERENGGANU, 2017Table 3-3 : Hectareage, Production and Value of Production Of Spices By District, Terengganu, 2017
DAERAH District
Asam Gelugor (Asam Gelugor) Asam Jawa Tamarinde Bunga Kantan Pink Cone Ginger
270.95
Jumlah Total
- - - - -
Jumlah Total
- - - - -
-
Kayu Manis Cinnamon Ketumbar Coriander Kunyit Tumeric
-
Jumlah Total
- - - - - 312.65
Cengkih Clove Halia Ginger Kari Curry
- - - 36.20 34.20 48.10
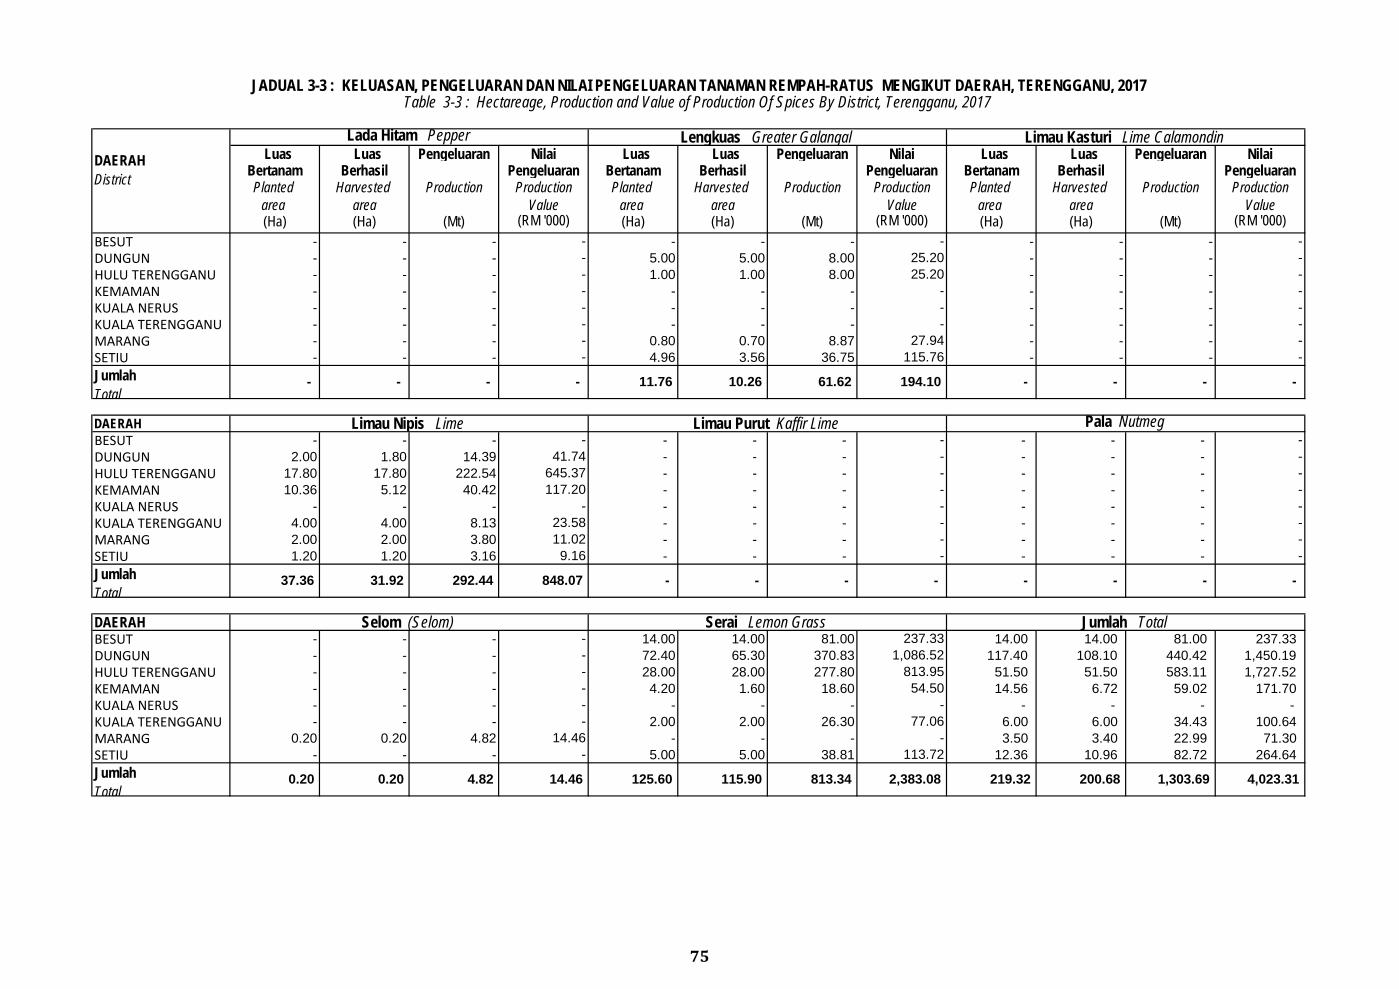
75
Luas Luas Pengeluaran Nilai Luas Luas Pengeluaran Nilai Luas Luas Pengeluaran Nilai Bertanam Berhasil Pengeluaran Bertanam Berhasil Pengeluaran Bertanam Berhasil Pengeluaran Planted Harvested Production Production Planted Harvested Production Production Planted Harvested Production Production
area area Value area area Value area area Value (Ha) (Ha) (Mt) (RM '000) (Ha) (Ha) (Mt) (RM '000) (Ha) (Ha) (Mt) (RM '000)
BESUT - - - - - - - - - - - - DUNGUN - - - - 5.00 5.00 8.00 25.20 - - - - HULU TERENGGANU - - - - 1.00 1.00 8.00 25.20 - - - - KEMAMAN - - - - - - - - - - - - KUALA NERUS - - - - - - - - - - - - KUALA TERENGGANU - - - - - - - - - - - - MARANG - - - - 0.80 0.70 8.87 27.94 - - - - SETIU - - - - 4.96 3.56 36.75 115.76 - - - -
DAERAH BESUT - - - - - - - - - - - - DUNGUN 2.00 1.80 14.39 41.74 - - - - - - - - HULU TERENGGANU 17.80 17.80 222.54 645.37 - - - - - - - - KEMAMAN 10.36 5.12 40.42 117.20 - - - - - - - - KUALA NERUS - - - - - - - - - - - - KUALA TERENGGANU 4.00 4.00 8.13 23.58 - - - - - - - - MARANG 2.00 2.00 3.80 11.02 - - - - - - - - SETIU 1.20 1.20 3.16 9.16 - - - - - - - -
DAERAH BESUT - - - - 14.00 14.00 81.00 237.33 14.00 14.00 81.00 237.33 DUNGUN - - - - 72.40 65.30 370.83 1,086.52 117.40 108.10 440.42 1,450.19 HULU TERENGGANU - - - - 28.00 28.00 277.80 813.95 51.50 51.50 583.11 1,727.52 KEMAMAN - - - - 4.20 1.60 18.60 54.50 14.56 6.72 59.02 171.70 KUALA NERUS - - - - - - - - - - - - KUALA TERENGGANU - - - - 2.00 2.00 26.30 77.06 6.00 6.00 34.43 100.64 MARANG 0.20 0.20 4.82 14.46 - - - - 3.50 3.40 22.99 71.30 SETIU - - - - 5.00 5.00 38.81 113.72 12.36 10.96 82.72 264.64 Jumlah Total
0.20 0.20 4.82 14.46 125.60
-
Selom (Selom) Serai Lemon Grass Jumlah Total
- - - - - -
4,023.31 115.90 813.34 2,383.08 219.32 200.68 1,303.69
Limau Nipis Lime Limau Purut Kaffir Lime Pala Nutmeg
Jumlah Total
37.36 31.92 292.44 848.07 -
JADUAL 3-3 : KELUASAN, PENGELUARAN DAN NILAI PENGELUARAN TANAMAN REMPAH-RATUS MENGIKUT DAERAH, TERENGGANU, 2017Table 3-3 : Hectareage, Production and Value of Production Of Spices By District, Terengganu, 2017
DAERAH District
Lada Hitam Pepper Lengkuas Greater Galangal Limau Kasturi Lime Calamondin
Jumlah Total
- - - - 11.76 10.26 61.62 194.10 - - - -
SABAH
SABAH
76
JADUAL 3-1 : KELUASAN, PENGELUARAN DAN NILAI PENGELUARAN HERBA UTAMA MENGIKUT DAERAH, SABAH, 2017Table 3-1 : Hectareage, Production and Value of Production Main Herbs By District, Sabah, 2017
Tidak ada (Nil)
JADUAL 3-2 : KELUASAN, PENGELUARAN DAN NILAI PENGELUARAN HERBA LAIN MENGIKUT DAERAH, SABAH, 2017Table 3-2 : Hectareage, Production and Value of Production Of Other Herbs By District, Sabah, 2017
Tidak ada (Nil)
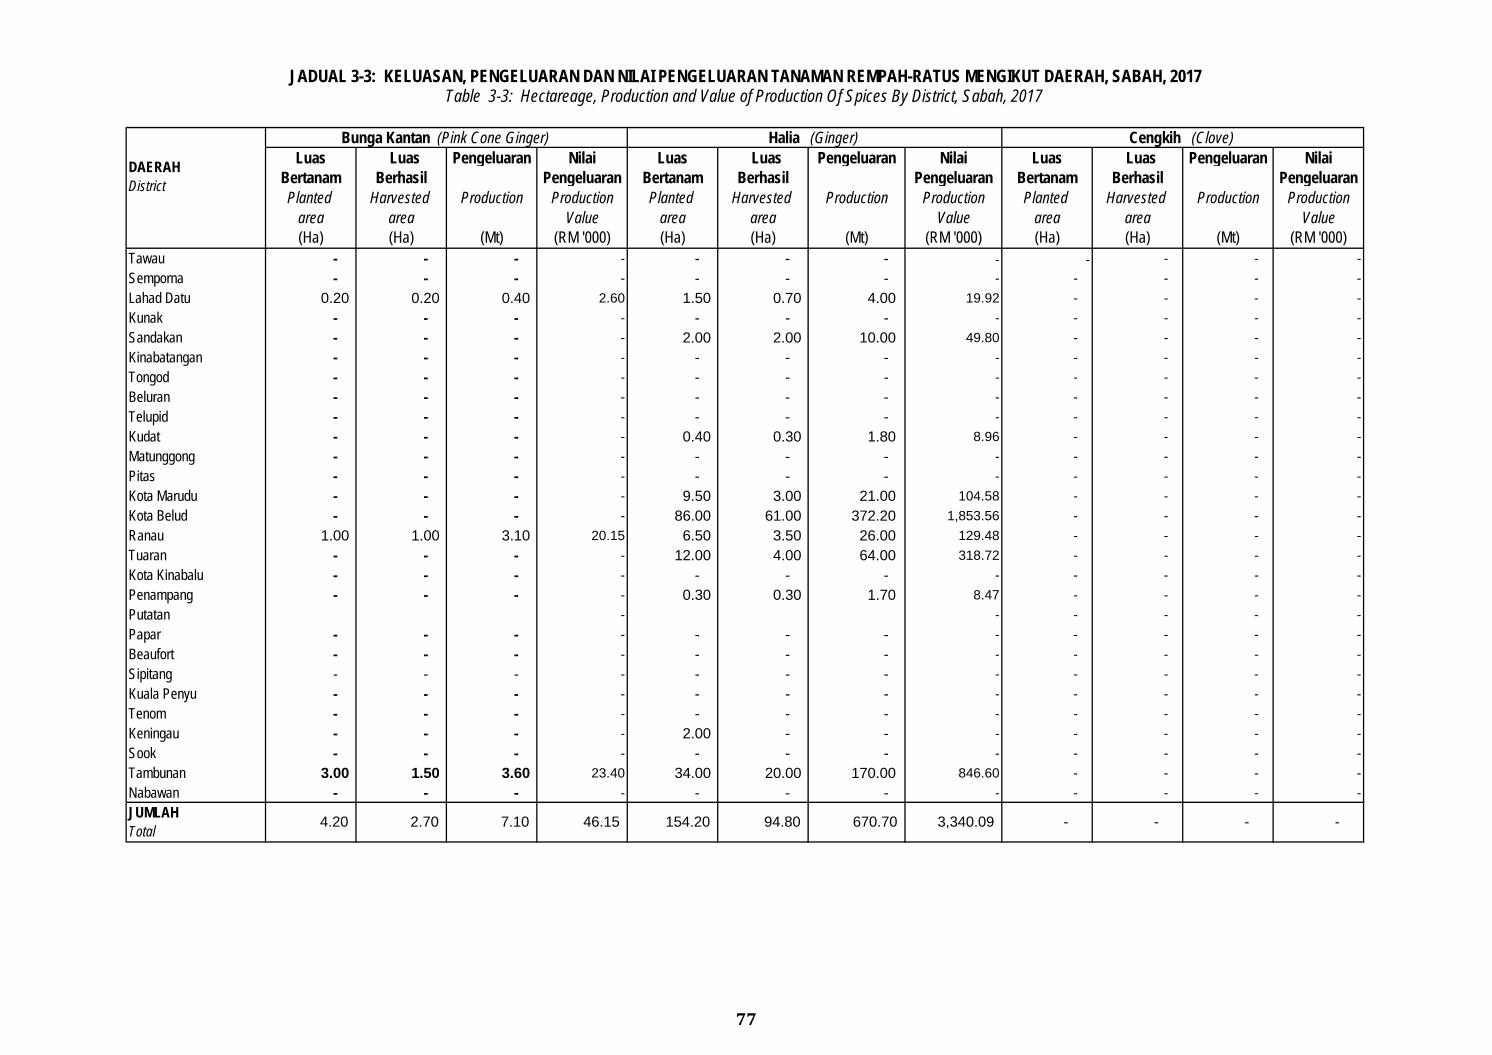
77
Luas Luas Pengeluaran Nilai Luas Luas Pengeluaran Nilai Luas Luas Pengeluaran Nilai Bertanam Berhasil Pengeluaran Bertanam Berhasil Pengeluaran Bertanam Berhasil Pengeluaran Planted Harvested Production Production Planted Harvested Production Production Planted Harvested Production Production area area Value area area Value area area Value (Ha) (Ha) (Mt) (RM '000) (Ha) (Ha) (Mt) (RM '000) (Ha) (Ha) (Mt) (RM '000)
Tawau - - - - - - - - - - - - Semporna - - - - - - - - - - - - Lahad Datu 0.20 0.20 0.40 2.60 1.50 0.70 4.00 19.92 - - - - Kunak - - - - - - - - - - - - Sandakan - - - - 2.00 2.00 10.00 49.80 - - - - Kinabatangan - - - - - - - - - - - - Tongod - - - - - - - - - - - - Beluran - - - - - - - - - - - - Telupid - - - - - - - - - - - - Kudat - - - - 0.40 0.30 1.80 8.96 - - - - Matunggong - - - - - - - - - - - - Pitas - - - - - - - - - - - - Kota Marudu - - - - 9.50 3.00 21.00 104.58 - - - - Kota Belud - - - - 86.00 61.00 372.20 1,853.56 - - - - Ranau 1.00 1.00 3.10 20.15 6.50 3.50 26.00 129.48 - - - - Tuaran - - - - 12.00 4.00 64.00 318.72 - - - - Kota Kinabalu - - - - - - - - - - - - Penampang - - - - 0.30 0.30 1.70 8.47 - - - - Putatan - - - - - - Papar - - - - - - - - - - - - Beaufort - - - - - - - - - - - - Sipitang - - - - - - - - - - - - Kuala Penyu - - - - - - - - - - - - Tenom - - - - - - - - - - - - Keningau - - - - 2.00 - - - - - - - Sook - - - - - - - - - - - - Tambunan 3.00 1.50 3.60 23.40 34.00 20.00 170.00 846.60 - - - - Nabawan - - - - - - - - - - - -
4.20 2.70 JUMLAH Total 3,340.09 670.70 - - - 7.10 46.15 154.20 94.80 -
JADUAL 3-3: KELUASAN, PENGELUARAN DAN NILAI PENGELUARAN TANAMAN REMPAH-RATUS MENGIKUT DAERAH, SABAH, 2017Table 3-3: Hectareage, Production and Value of Production Of Spices By District, Sabah, 2017
DAERAH District
Bunga Kantan (Pink Cone Ginger) Halia (Ginger) Cengkih (Clove)
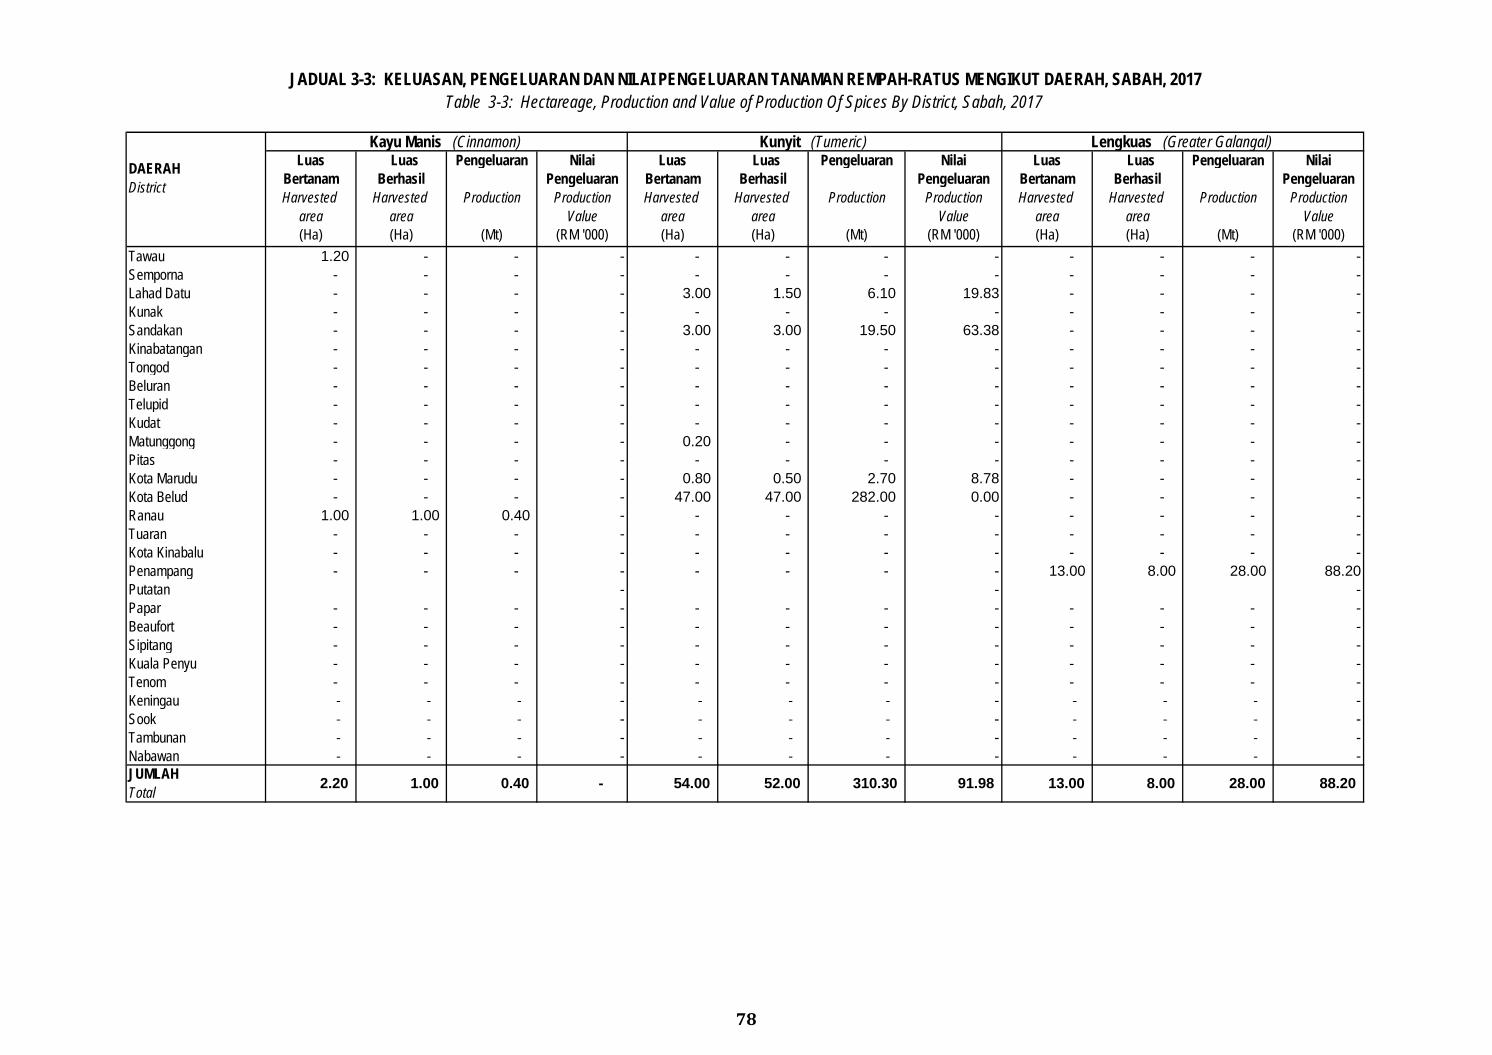
78
Luas Luas Pengeluaran Nilai Luas Luas Pengeluaran Nilai Luas Luas Pengeluaran Nilai Bertanam Berhasil Pengeluaran Bertanam Berhasil Pengeluaran Bertanam Berhasil Pengeluaran Harvested Harvested Production Production Harvested Harvested Production Production Harvested Harvested Production Production
area area Value area area Value area area Value (Ha) (Ha) (Mt) (RM '000) (Ha) (Ha) (Mt) (RM '000) (Ha) (Ha) (Mt) (RM '000)
Tawau 1.20 - - - - - - - - - - - Semporna - - - - - - - - - - - - Lahad Datu - - - - 3.00 1.50 6.10 19.83 - - - - Kunak - - - - - - - - - - - - Sandakan - - - - 3.00 3.00 19.50 63.38 - - - - Kinabatangan - - - - - - - - - - - - Tongod - - - - - - - - - - - - Beluran - - - - - - - - - - - - Telupid - - - - - - - - - - - - Kudat - - - - - - - - - - - - Matunggong - - - - 0.20 - - - - - - - Pitas - - - - - - - - - - - - Kota Marudu - - - - 0.80 0.50 2.70 8.78 - - - - Kota Belud - - - - 47.00 47.00 282.00 0.00 - - - - Ranau 1.00 1.00 0.40 - - - - - - - - - Tuaran - - - - - - - - - - - - Kota Kinabalu - - - - - - - - - - - - Penampang - - - - - - - - 13.00 8.00 28.00 88.20 Putatan - - - Papar - - - - - - - - - - - - Beaufort - - - - - - - - - - - - Sipitang - - - - - - - - - - - - Kuala Penyu - - - - - - - - - - - - Tenom - - - - - - - - - - - - Keningau - - - - - - - - - - - - Sook - - - - - - - - - - - - Tambunan - - - - - - - - - - - - Nabawan - - - - - - - - - - - -
- 2.20 1.00 0.40
JADUAL 3-3: KELUASAN, PENGELUARAN DAN NILAI PENGELUARAN TANAMAN REMPAH-RATUS MENGIKUT DAERAH, SABAH, 2017Table 3-3: Hectareage, Production and Value of Production Of Spices By District, Sabah, 2017
DAERAH District
Kayu Manis (Cinnamon) Kunyit (Tumeric) Lengkuas (Greater Galangal)
28.00 88.20 JUMLAH Total 8.00 52.00 310.30 91.98 54.00 13.00
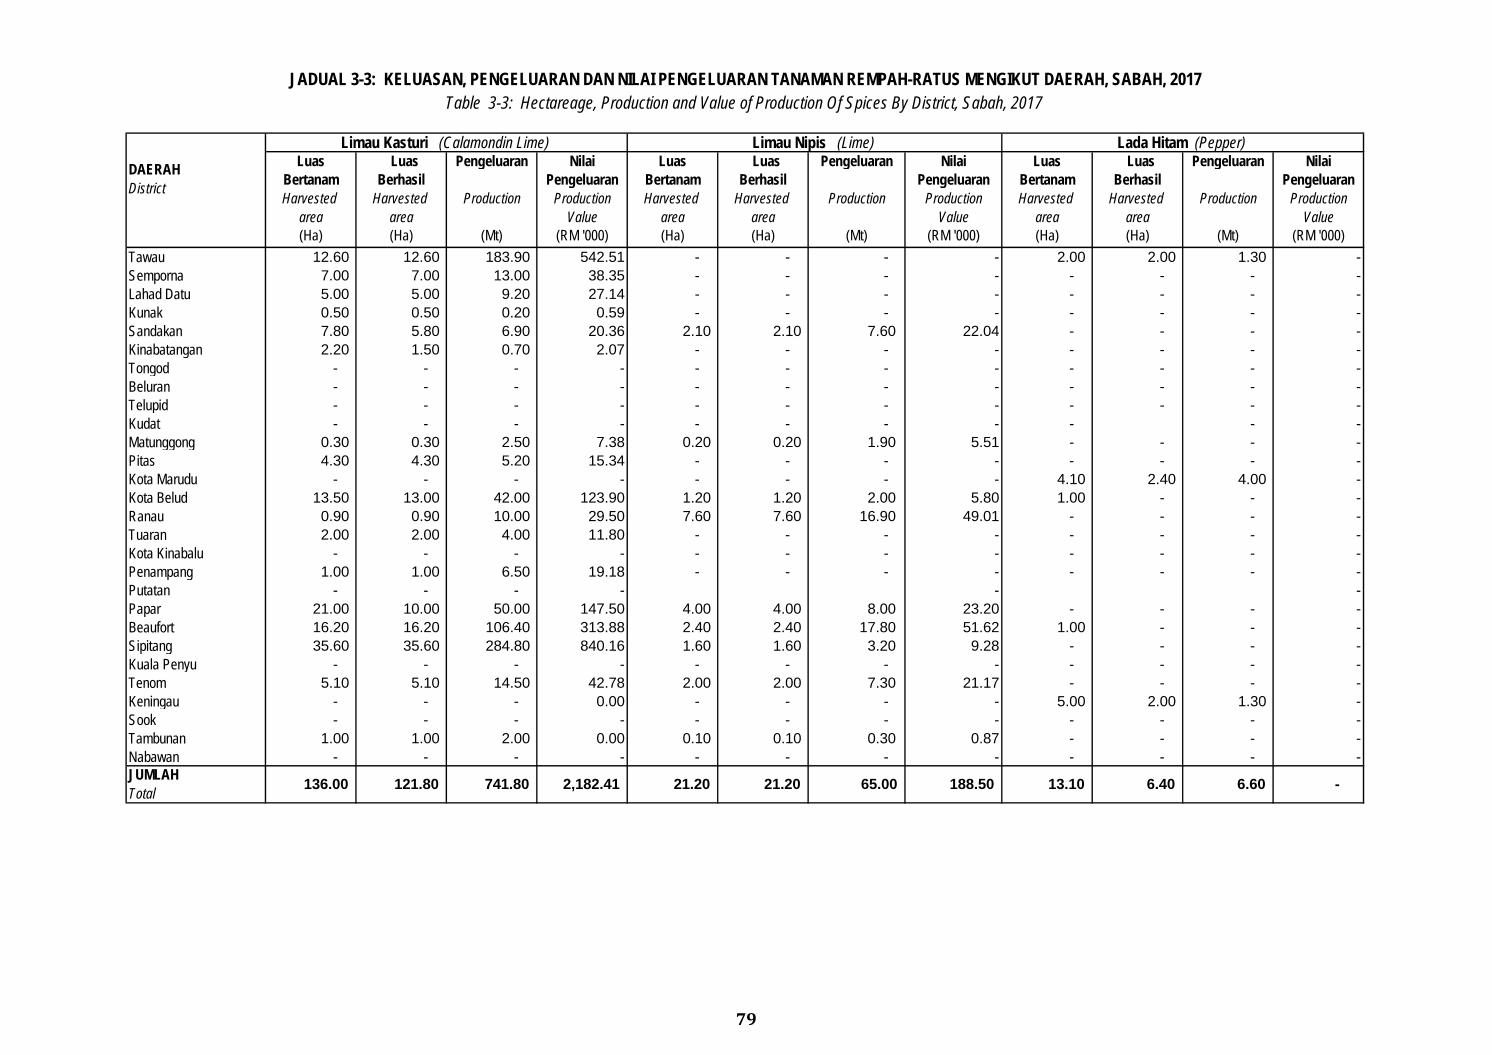
79
Luas Luas Pengeluaran Nilai Luas Luas Pengeluaran Nilai Luas Luas Pengeluaran Nilai Bertanam Berhasil Pengeluaran Bertanam Berhasil Pengeluaran Bertanam Berhasil Pengeluaran Harvested Harvested Production Production Harvested Harvested Production Production Harvested Harvested Production Production
area area Value area area Value area area Value (Ha) (Ha) (Mt) (RM '000) (Ha) (Ha) (Mt) (RM '000) (Ha) (Ha) (Mt) (RM '000)
Tawau 12.60 12.60 183.90 542.51 - - - - 2.00 2.00 1.30 - Semporna 7.00 7.00 13.00 38.35 - - - - - - - - Lahad Datu 5.00 5.00 9.20 27.14 - - - - - - - - Kunak 0.50 0.50 0.20 0.59 - - - - - - - - Sandakan 7.80 5.80 6.90 20.36 2.10 2.10 7.60 22.04 - - - - Kinabatangan 2.20 1.50 0.70 2.07 - - - - - - - - Tongod - - - - - - - - - - - - Beluran - - - - - - - - - - - - Telupid - - - - - - - - - - - - Kudat - - - - - - - - - - - Matunggong 0.30 0.30 2.50 7.38 0.20 0.20 1.90 5.51 - - - - Pitas 4.30 4.30 5.20 15.34 - - - - - - - - Kota Marudu - - - - - - - - 4.10 2.40 4.00 - Kota Belud 13.50 13.00 42.00 123.90 1.20 1.20 2.00 5.80 1.00 - - - Ranau 0.90 0.90 10.00 29.50 7.60 7.60 16.90 49.01 - - - - Tuaran 2.00 2.00 4.00 11.80 - - - - - - - - Kota Kinabalu - - - - - - - - - - - - Penampang 1.00 1.00 6.50 19.18 - - - - - - - - Putatan - - - - - - Papar 21.00 10.00 50.00 147.50 4.00 4.00 8.00 23.20 - - - - Beaufort 16.20 16.20 106.40 313.88 2.40 2.40 17.80 51.62 1.00 - - - Sipitang 35.60 35.60 284.80 840.16 1.60 1.60 3.20 9.28 - - - - Kuala Penyu - - - - - - - - - - - - Tenom 5.10 5.10 14.50 42.78 2.00 2.00 7.30 21.17 - - - - Keningau - - - 0.00 - - - - 5.00 2.00 1.30 - Sook - - - - - - - - - - - - Tambunan 1.00 1.00 2.00 0.00 0.10 0.10 0.30 0.87 - - - - Nabawan - - - - - - - - - - - -
DAERAH District
Limau Kasturi (Calamondin Lime) Limau Nipis (Lime) Lada Hitam (Pepper)
13.10 6.40 6.60 -
Table 3-3: Hectareage, Production and Value of Production Of Spices By District, Sabah, 2017
136.00 121.80
JADUAL 3-3: KELUASAN, PENGELUARAN DAN NILAI PENGELUARAN TANAMAN REMPAH-RATUS MENGIKUT DAERAH, SABAH, 2017
JUMLAH Total 741.80 2,182.41 21.20 21.20 65.00 188.50
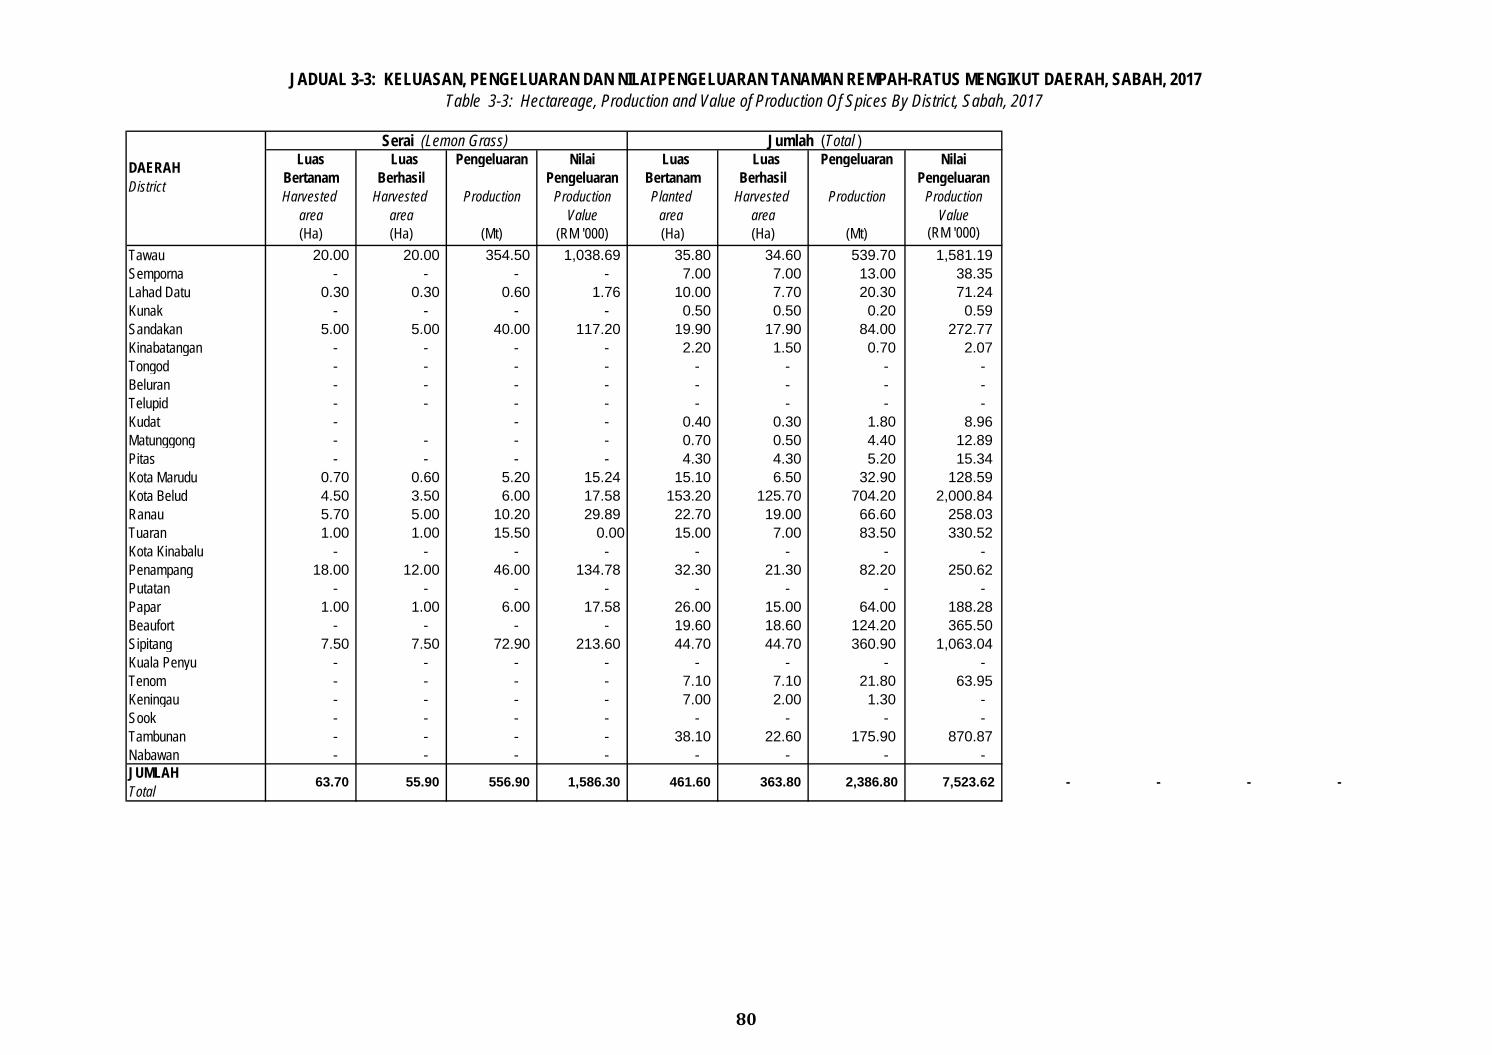
80
Luas Luas Pengeluaran Nilai Luas Luas Pengeluaran Nilai Bertanam Berhasil Pengeluaran Bertanam Berhasil Pengeluaran Harvested Harvested Production Production Planted Harvested Production Production
area area Value area area Value (Ha) (Ha) (Mt) (RM '000) (Ha) (Ha) (Mt) (RM '000)
Tawau 20.00 20.00 354.50 1,038.69 35.80 34.60 539.70 1,581.19 Semporna - - - - 7.00 7.00 13.00 38.35 Lahad Datu 0.30 0.30 0.60 1.76 10.00 7.70 20.30 71.24 Kunak - - - - 0.50 0.50 0.20 0.59 Sandakan 5.00 5.00 40.00 117.20 19.90 17.90 84.00 272.77 Kinabatangan - - - - 2.20 1.50 0.70 2.07 Tongod - - - - - - - - Beluran - - - - - - - - Telupid - - - - - - - - Kudat - - - 0.40 0.30 1.80 8.96 Matunggong - - - - 0.70 0.50 4.40 12.89 Pitas - - - - 4.30 4.30 5.20 15.34 Kota Marudu 0.70 0.60 5.20 15.24 15.10 6.50 32.90 128.59 Kota Belud 4.50 3.50 6.00 17.58 153.20 125.70 704.20 2,000.84 Ranau 5.70 5.00 10.20 29.89 22.70 19.00 66.60 258.03 Tuaran 1.00 1.00 15.50 0.00 15.00 7.00 83.50 330.52 Kota Kinabalu - - - - - - - - Penampang 18.00 12.00 46.00 134.78 32.30 21.30 82.20 250.62 Putatan - - - - - - - - Papar 1.00 1.00 6.00 17.58 26.00 15.00 64.00 188.28 Beaufort - - - - 19.60 18.60 124.20 365.50 Sipitang 7.50 7.50 72.90 213.60 44.70 44.70 360.90 1,063.04 Kuala Penyu - - - - - - - - Tenom - - - - 7.10 7.10 21.80 63.95 Keningau - - - - 7.00 2.00 1.30 - Sook - - - - - - - - Tambunan - - - - 38.10 22.60 175.90 870.87 Nabawan - - - - - - - -
- - - - JUMLAH Total
DAERAH District
Serai (Lemon Grass)
461.60 363.80
Jumlah (Total )
2,386.80 63.70 55.90 556.90 1,586.30 7,523.62
JADUAL 3-3: KELUASAN, PENGELUARAN DAN NILAI PENGELUARAN TANAMAN REMPAH-RATUS MENGIKUT DAERAH, SABAH, 2017Table 3-3: Hectareage, Production and Value of Production Of Spices By District, Sabah, 2017
SARAWAK
SARAWAK
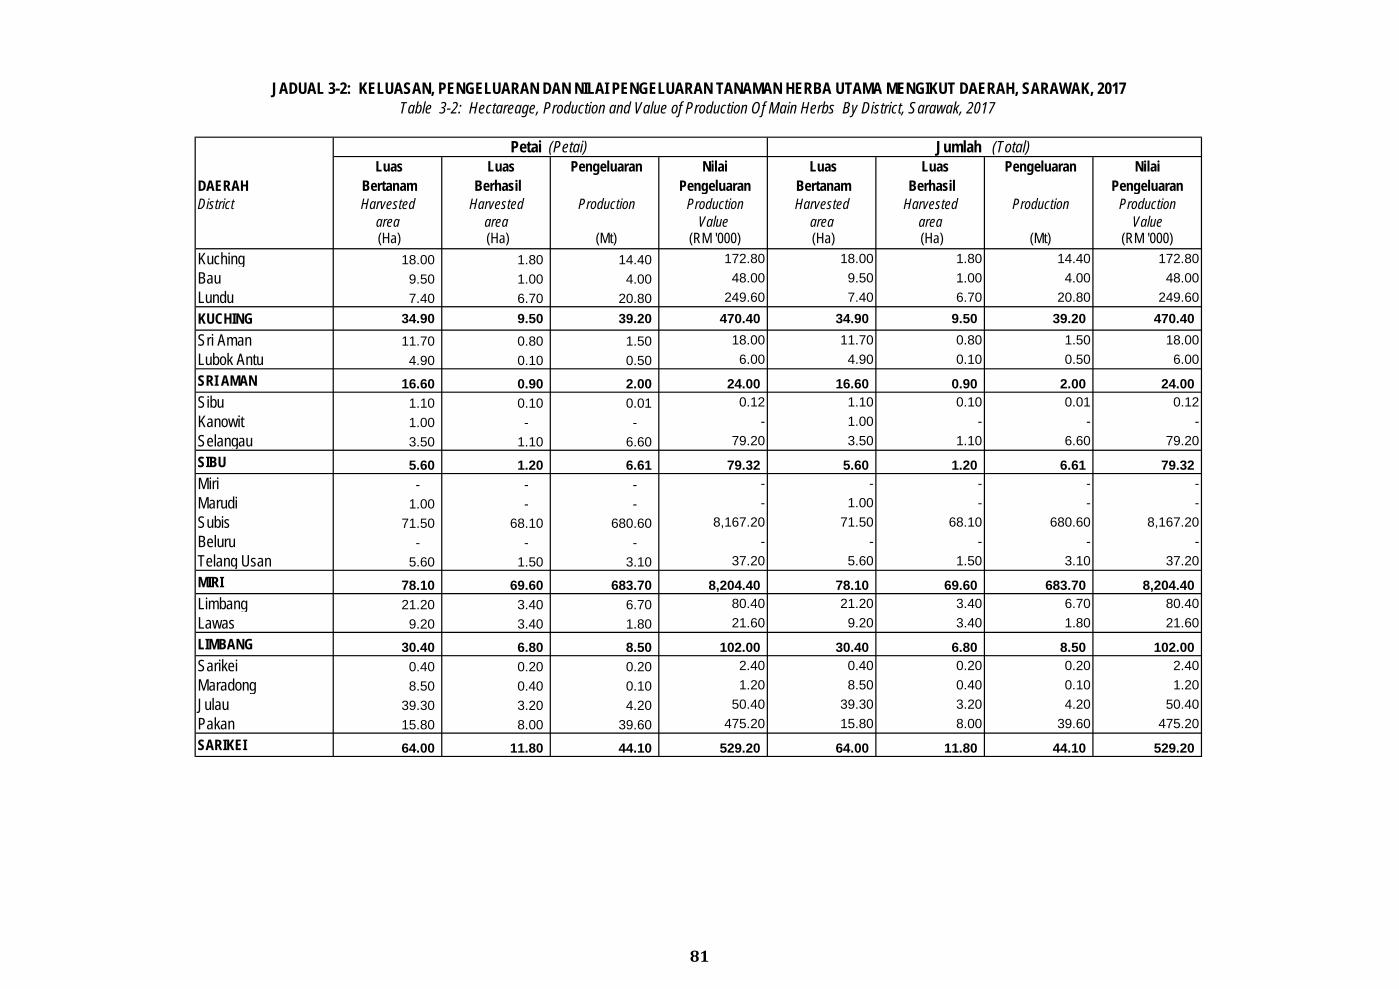
81
Luas Luas Pengeluaran Nilai Luas Luas Pengeluaran Nilai DAERAH Bertanam Berhasil Pengeluaran Bertanam Berhasil Pengeluaran District Harvested Harvested Production Production Harvested Harvested Production Production
area area Value area area Value (Ha) (Ha) (Mt) (RM '000) (Ha) (Ha) (Mt) (RM '000)
Kuching 18.00 1.80 14.40 172.80 18.00 1.80 14.40 172.80 Bau 9.50 1.00 4.00 48.00 9.50 1.00 4.00 48.00 Lundu 7.40 6.70 20.80 249.60 7.40 6.70 20.80 249.60 KUCHING 34.90 9.50 39.20 470.40 34.90 9.50 39.20 470.40 Sri Aman 11.70 0.80 1.50 18.00 11.70 0.80 1.50 18.00 Lubok Antu 4.90 0.10 0.50 6.00 4.90 0.10 0.50 6.00 SRI AMAN 16.60 0.90 2.00 24.00 16.60 0.90 2.00 24.00 Sibu 1.10 0.10 0.01 0.12 1.10 0.10 0.01 0.12 Kanowit 1.00 - - - 1.00 - - - Selangau 3.50 1.10 6.60 79.20 3.50 1.10 6.60 79.20 SIBU 5.60 1.20 6.61 79.32 5.60 1.20 6.61 79.32 Miri - - - - - - - - Marudi 1.00 - - - 1.00 - - - Subis 71.50 68.10 680.60 8,167.20 71.50 68.10 680.60 8,167.20 Beluru - - - - - - - - Telang Usan 5.60 1.50 3.10 37.20 5.60 1.50 3.10 37.20 MIRI 78.10 69.60 683.70 8,204.40 78.10 69.60 683.70 8,204.40 Limbang 21.20 3.40 6.70 80.40 21.20 3.40 6.70 80.40 Lawas 9.20 3.40 1.80 21.60 9.20 3.40 1.80 21.60 LIMBANG 30.40 6.80 8.50 102.00 30.40 6.80 8.50 102.00 Sarikei 0.40 0.20 0.20 2.40 0.40 0.20 0.20 2.40 Maradong 8.50 0.40 0.10 1.20 8.50 0.40 0.10 1.20 Julau 39.30 3.20 4.20 50.40 39.30 3.20 4.20 50.40 Pakan 15.80 8.00 39.60 475.20 15.80 8.00 39.60 475.20 SARIKEI 64.00 11.80 44.10 529.20 64.00 11.80 44.10 529.20
JADUAL 3-2: KELUASAN, PENGELUARAN DAN NILAI PENGELUARAN TANAMAN HERBA UTAMA MENGIKUT DAERAH, SARAWAK, 2017Table 3-2: Hectareage, Production and Value of Production Of Main Herbs By District, Sarawak, 2017
Petai (Petai) Jumlah (Total)
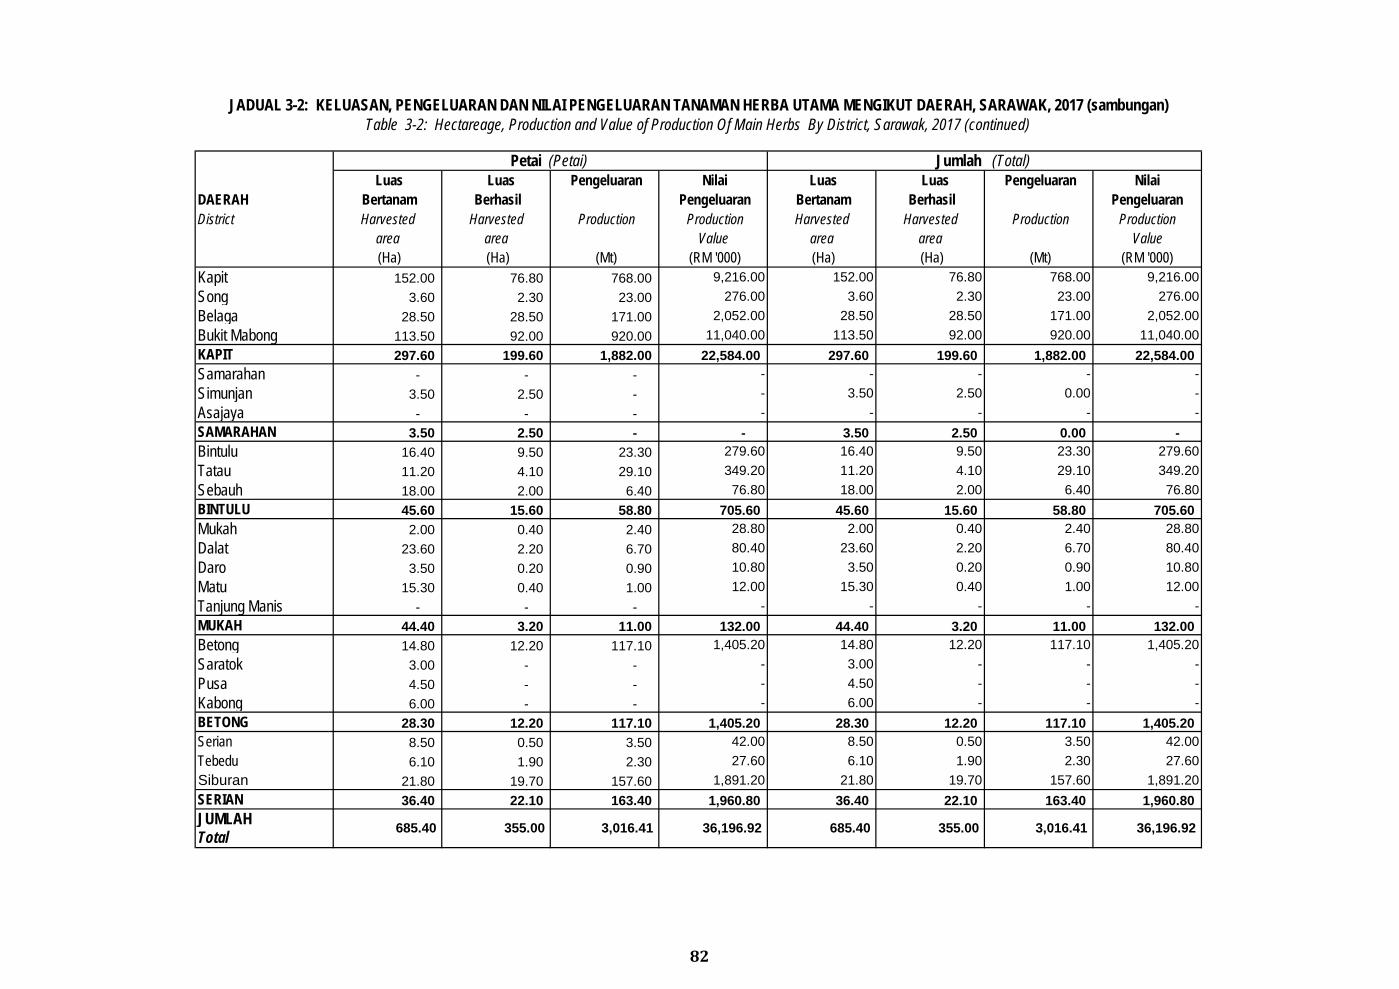
82
Luas Luas Pengeluaran Nilai Luas Luas Pengeluaran Nilai DAERAH Bertanam Berhasil Pengeluaran Bertanam Berhasil Pengeluaran District Harvested Harvested Production Production Harvested Harvested Production Production
area area Value area area Value (Ha) (Ha) (Mt) (RM '000) (Ha) (Ha) (Mt) (RM '000)
Kapit 152.00 76.80 768.00 9,216.00 152.00 76.80 768.00 9,216.00 Song 3.60 2.30 23.00 276.00 3.60 2.30 23.00 276.00 Belaga 28.50 28.50 171.00 2,052.00 28.50 28.50 171.00 2,052.00 Bukit Mabong 113.50 92.00 920.00 11,040.00 113.50 92.00 920.00 11,040.00 KAPIT 297.60 199.60 1,882.00 22,584.00 297.60 199.60 1,882.00 22,584.00 Samarahan - - - - - - - - Simunjan 3.50 2.50 - - 3.50 2.50 0.00 - Asajaya - - - - - - - - SAMARAHAN 3.50 2.50 - - 3.50 2.50 0.00 - Bintulu 16.40 9.50 23.30 279.60 16.40 9.50 23.30 279.60 Tatau 11.20 4.10 29.10 349.20 11.20 4.10 29.10 349.20 Sebauh 18.00 2.00 6.40 76.80 18.00 2.00 6.40 76.80 BINTULU 45.60 15.60 58.80 705.60 45.60 15.60 58.80 705.60 Mukah 2.00 0.40 2.40 28.80 2.00 0.40 2.40 28.80 Dalat 23.60 2.20 6.70 80.40 23.60 2.20 6.70 80.40 Daro 3.50 0.20 0.90 10.80 3.50 0.20 0.90 10.80 Matu 15.30 0.40 1.00 12.00 15.30 0.40 1.00 12.00 Tanjung Manis - - - - - - - - MUKAH 44.40 3.20 11.00 132.00 44.40 3.20 11.00 132.00 Betong 14.80 12.20 117.10 1,405.20 14.80 12.20 117.10 1,405.20 Saratok 3.00 - - - 3.00 - - - Pusa 4.50 - - - 4.50 - - - Kabong 6.00 - - - 6.00 - - - BETONG 28.30 12.20 117.10 1,405.20 28.30 12.20 117.10 1,405.20 Serian 8.50 0.50 3.50 42.00 8.50 0.50 3.50 42.00 Tebedu 6.10 1.90 2.30 27.60 6.10 1.90 2.30 27.60 Siburan 21.80 19.70 157.60 1,891.20 21.80 19.70 157.60 1,891.20 SERIAN 36.40 22.10 163.40 1,960.80 36.40 22.10 163.40 1,960.80 JUMLAHTotal
Table 3-2: Hectareage, Production and Value of Production Of Main Herbs By District, Sarawak, 2017 (continued)
Petai (Petai) Jumlah (Total)
JADUAL 3-2: KELUASAN, PENGELUARAN DAN NILAI PENGELUARAN TANAMAN HERBA UTAMA MENGIKUT DAERAH, SARAWAK, 2017 (sambungan)
355.00 3,016.41 36,196.92 685.40 355.00 3,016.41 36,196.92 685.40
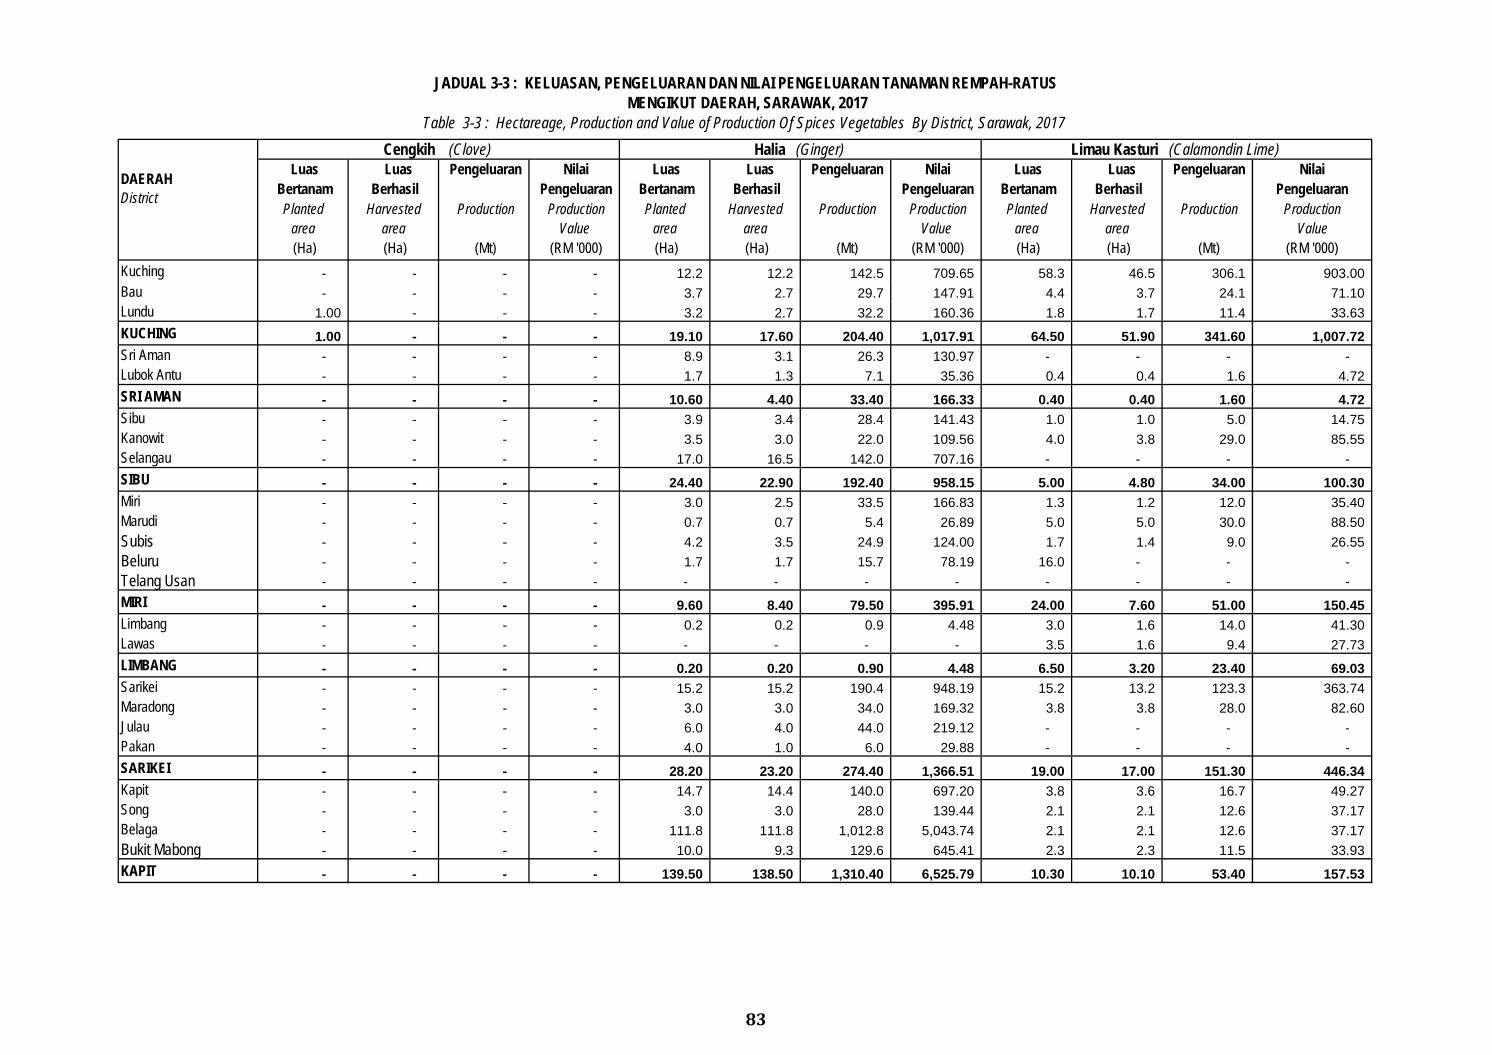
83
Luas Luas Pengeluaran Nilai Luas Luas Pengeluaran Nilai Luas Luas Pengeluaran Nilai Bertanam Berhasil Pengeluaran Bertanam Berhasil Pengeluaran Bertanam Berhasil Pengeluaran Planted Harvested Production Production Planted Harvested Production Production Planted Harvested Production Production
area area Value area area Value area area Value (Ha) (Ha) (Mt) (RM '000) (Ha) (Ha) (Mt) (RM '000) (Ha) (Ha) (Mt) (RM '000)
Kuching - - - - 12.2 12.2 142.5 709.65 58.3 46.5 306.1 903.00 Bau - - - - 3.7 2.7 29.7 147.91 4.4 3.7 24.1 71.10 Lundu 1.00 - - - 3.2 2.7 32.2 160.36 1.8 1.7 11.4 33.63 KUCHING 1.00 - - - 19.10 17.60 204.40 1,017.91 64.50 51.90 341.60 1,007.72 Sri Aman - - - - 8.9 3.1 26.3 130.97 - - - - Lubok Antu - - - - 1.7 1.3 7.1 35.36 0.4 0.4 1.6 4.72 SRI AMAN - - - - 10.60 4.40 33.40 166.33 0.40 0.40 1.60 4.72 Sibu - - - - 3.9 3.4 28.4 141.43 1.0 1.0 5.0 14.75 Kanowit - - - - 3.5 3.0 22.0 109.56 4.0 3.8 29.0 85.55 Selangau - - - - 17.0 16.5 142.0 707.16 - - - - SIBU - - - - 24.40 22.90 192.40 958.15 5.00 4.80 34.00 100.30 Miri - - - - 3.0 2.5 33.5 166.83 1.3 1.2 12.0 35.40 Marudi - - - - 0.7 0.7 5.4 26.89 5.0 5.0 30.0 88.50 Subis - - - - 4.2 3.5 24.9 124.00 1.7 1.4 9.0 26.55 Beluru - - - - 1.7 1.7 15.7 78.19 16.0 - - - Telang Usan - - - - - - - - - - - - MIRI - - - - 9.60 8.40 79.50 395.91 24.00 7.60 51.00 150.45 Limbang - - - - 0.2 0.2 0.9 4.48 3.0 1.6 14.0 41.30 Lawas - - - - - - - - 3.5 1.6 9.4 27.73 LIMBANG - - - - 0.20 0.20 0.90 4.48 6.50 3.20 23.40 69.03 Sarikei - - - - 15.2 15.2 190.4 948.19 15.2 13.2 123.3 363.74 Maradong - - - - 3.0 3.0 34.0 169.32 3.8 3.8 28.0 82.60 Julau - - - - 6.0 4.0 44.0 219.12 - - - - Pakan - - - - 4.0 1.0 6.0 29.88 - - - - SARIKEI - - - - 28.20 23.20 274.40 1,366.51 19.00 17.00 151.30 446.34 Kapit - - - - 14.7 14.4 140.0 697.20 3.8 3.6 16.7 49.27 Song - - - - 3.0 3.0 28.0 139.44 2.1 2.1 12.6 37.17 Belaga - - - - 111.8 111.8 1,012.8 5,043.74 2.1 2.1 12.6 37.17 Bukit Mabong - - - - 10.0 9.3 129.6 645.41 2.3 2.3 11.5 33.93 KAPIT - - - - 139.50 138.50 1,310.40 6,525.79 10.30 10.10 53.40 157.53
JADUAL 3-3 : KELUASAN, PENGELUARAN DAN NILAI PENGELUARAN TANAMAN REMPAH-RATUS MENGIKUT DAERAH, SARAWAK, 2017
Table 3-3 : Hectareage, Production and Value of Production Of Spices Vegetables By District, Sarawak, 2017
DAERAH District
Cengkih (Clove) Halia (Ginger) Limau Kasturi (Calamondin Lime)
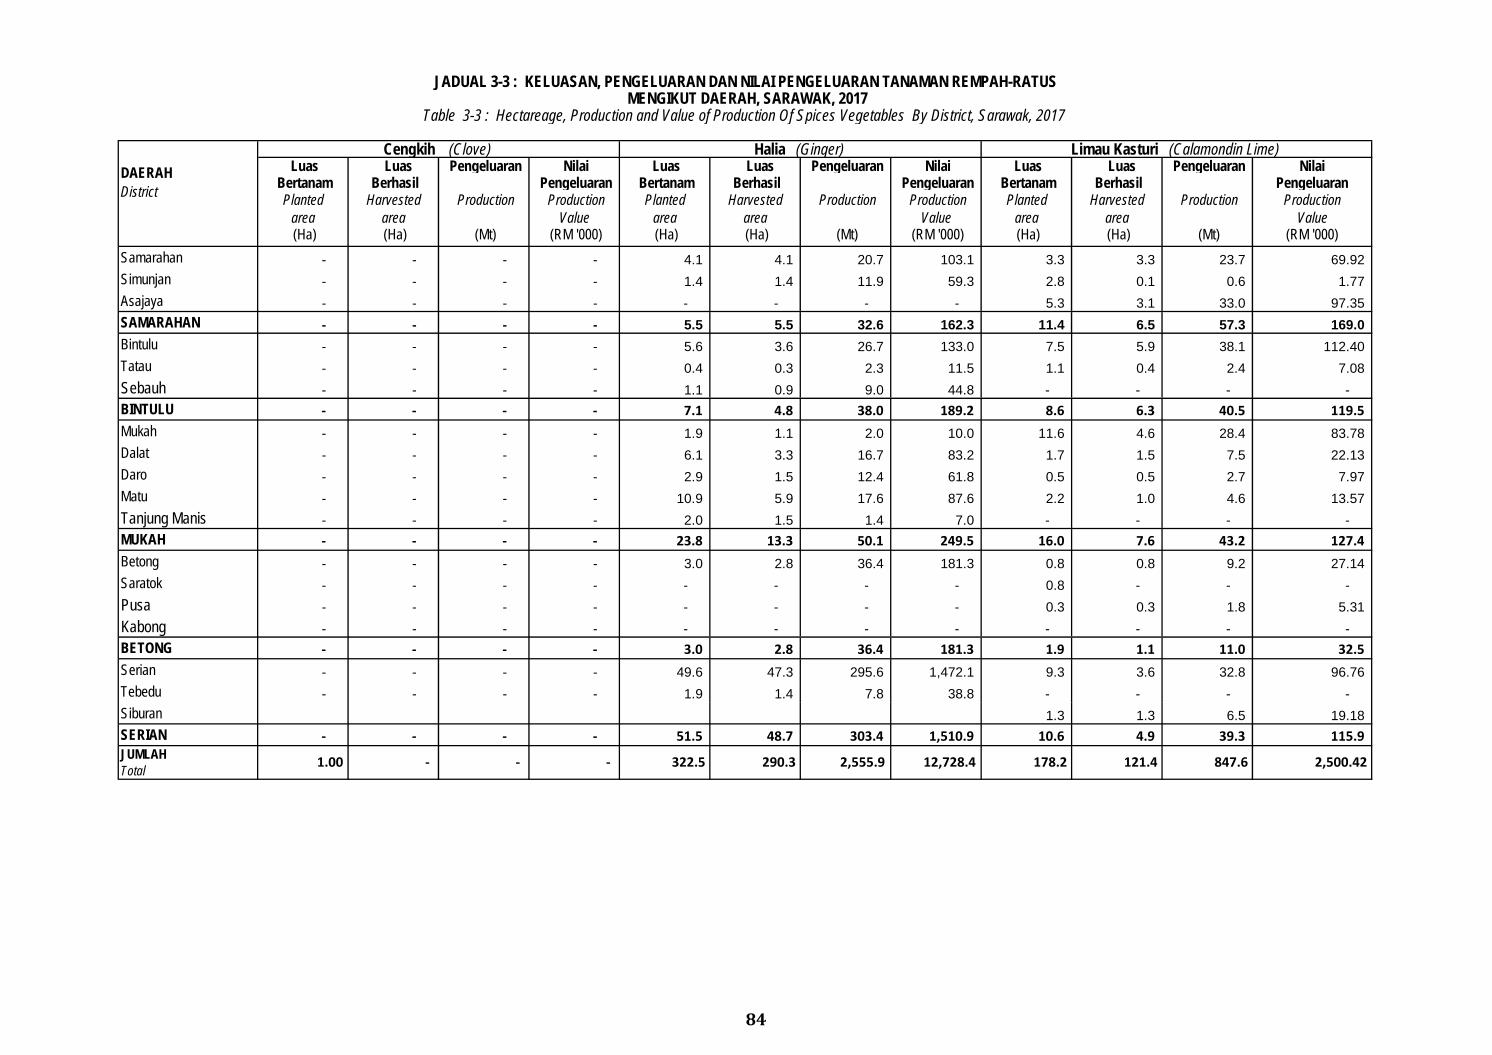
84
Luas Luas Pengeluaran Nilai Luas Luas Pengeluaran Nilai Luas Luas Pengeluaran Nilai Bertanam Berhasil Pengeluaran Bertanam Berhasil Pengeluaran Bertanam Berhasil Pengeluaran Planted Harvested Production Production Planted Harvested Production Production Planted Harvested Production Production
area area Value area area Value area area Value (Ha) (Ha) (Mt) (RM '000) (Ha) (Ha) (Mt) (RM '000) (Ha) (Ha) (Mt) (RM '000)
Samarahan - - - - 4.1 4.1 20.7 103.1 3.3 3.3 23.7 69.92 Simunjan - - - - 1.4 1.4 11.9 59.3 2.8 0.1 0.6 1.77 Asajaya - - - - - - - - 5.3 3.1 33.0 97.35 SAMARAHAN - - - - 5.5 5.5 32.6 162.3 11.4 6.5 57.3 169.0 Bintulu - - - - 5.6 3.6 26.7 133.0 7.5 5.9 38.1 112.40 Tatau - - - - 0.4 0.3 2.3 11.5 1.1 0.4 2.4 7.08 Sebauh - - - - 1.1 0.9 9.0 44.8 - - - - BINTULU - - - - 7.1 4.8 38.0 189.2 8.6 6.3 40.5 119.5 Mukah - - - - 1.9 1.1 2.0 10.0 11.6 4.6 28.4 83.78 Dalat - - - - 6.1 3.3 16.7 83.2 1.7 1.5 7.5 22.13 Daro - - - - 2.9 1.5 12.4 61.8 0.5 0.5 2.7 7.97 Matu - - - - 10.9 5.9 17.6 87.6 2.2 1.0 4.6 13.57 Tanjung Manis - - - - 2.0 1.5 1.4 7.0 - - - - MUKAH - - - - 23.8 13.3 50.1 249.5 16.0 7.6 43.2 127.4 Betong - - - - 3.0 2.8 36.4 181.3 0.8 0.8 9.2 27.14 Saratok - - - - - - - - 0.8 - - - Pusa - - - - - - - - 0.3 0.3 1.8 5.31 Kabong - - - - - - - - - - - - BETONG - - - - 3.0 2.8 36.4 181.3 1.9 1.1 11.0 32.5 Serian - - - - 49.6 47.3 295.6 1,472.1 9.3 3.6 32.8 96.76 Tebedu - - - - 1.9 1.4 7.8 38.8 - - - - Siburan 1.3 1.3 6.5 19.18 SERIAN - - - - 51.5 48.7 303.4 1,510.9 10.6 4.9 39.3 115.9 JUMLAHTotal 2,500.42 1.00 - 322.5 847.6 - - 290.3 2,555.9 12,728.4 178.2 121.4
JADUAL 3-3 : KELUASAN, PENGELUARAN DAN NILAI PENGELUARAN TANAMAN REMPAH-RATUS MENGIKUT DAERAH, SARAWAK, 2017
Table 3-3 : Hectareage, Production and Value of Production Of Spices Vegetables By District, Sarawak, 2017
Cengkih (Clove) Halia (Ginger) Limau Kasturi (Calamondin Lime)DAERAH District
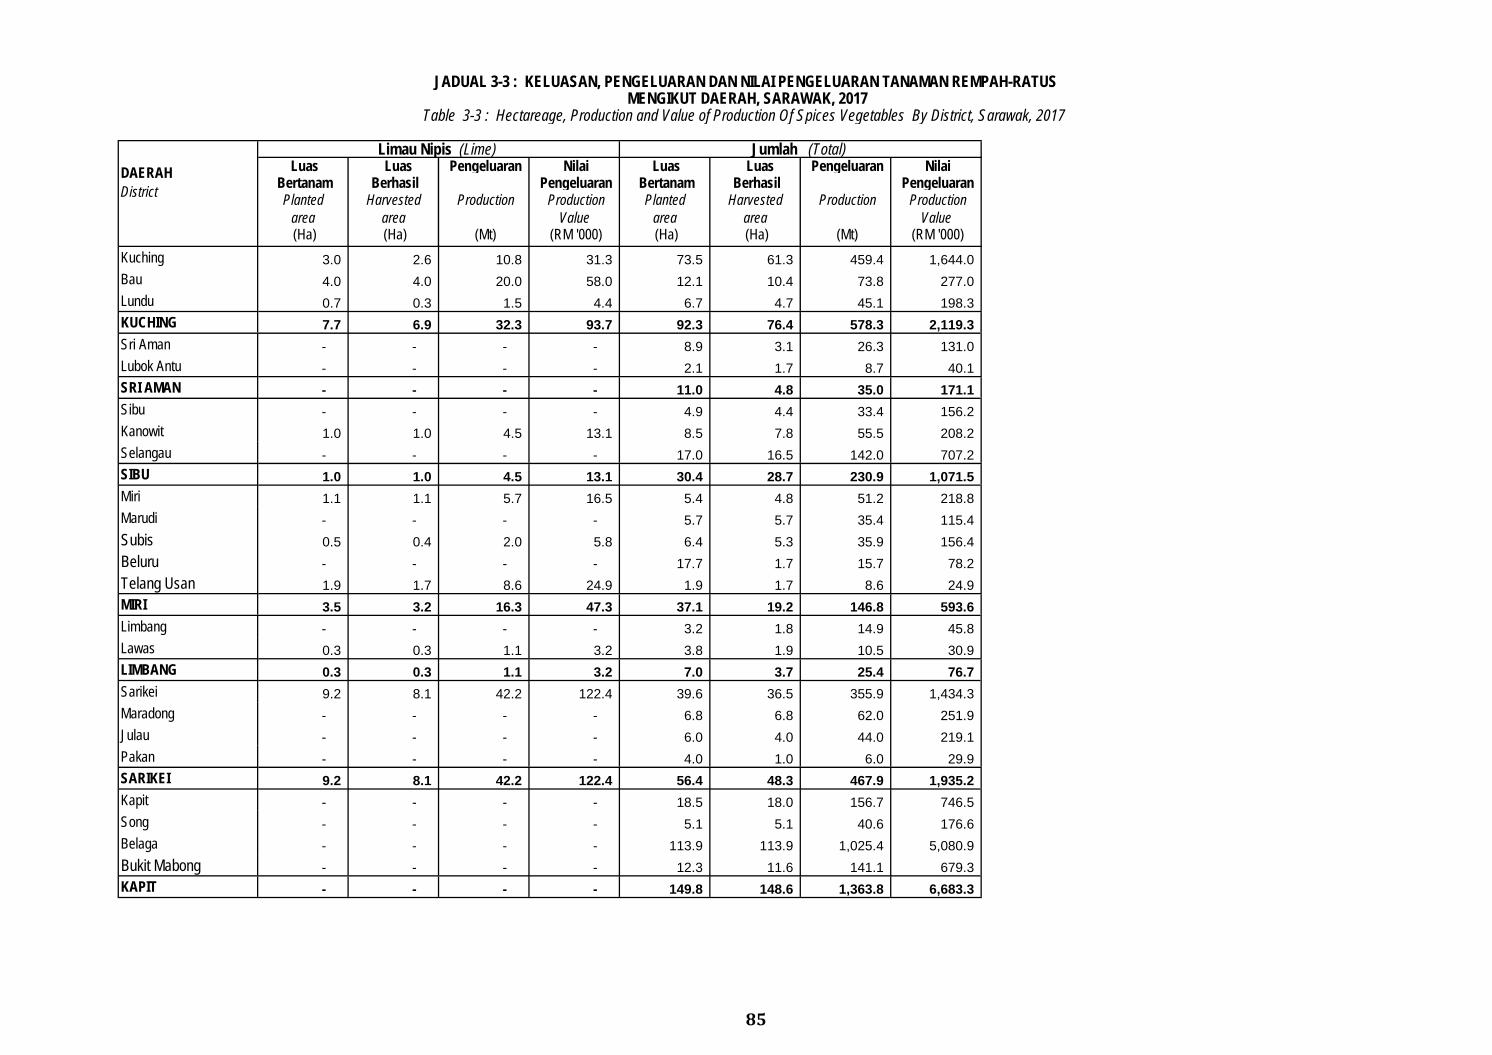
85
Luas Luas Pengeluaran Nilai Luas Luas Pengeluaran Nilai Bertanam Berhasil Pengeluaran Bertanam Berhasil Pengeluaran Planted Harvested Production Production Planted Harvested Production Production
area area Value area area Value (Ha) (Ha) (Mt) (RM '000) (Ha) (Ha) (Mt) (RM '000)
Kuching 3.0 2.6 10.8 31.3 73.5 61.3 459.4 1,644.0 Bau 4.0 4.0 20.0 58.0 12.1 10.4 73.8 277.0 Lundu 0.7 0.3 1.5 4.4 6.7 4.7 45.1 198.3 KUCHING 7.7 6.9 32.3 93.7 92.3 76.4 578.3 2,119.3 Sri Aman - - - - 8.9 3.1 26.3 131.0 Lubok Antu - - - - 2.1 1.7 8.7 40.1 SRI AMAN - - - - 11.0 4.8 35.0 171.1 Sibu - - - - 4.9 4.4 33.4 156.2 Kanowit 1.0 1.0 4.5 13.1 8.5 7.8 55.5 208.2 Selangau - - - - 17.0 16.5 142.0 707.2 SIBU 1.0 1.0 4.5 13.1 30.4 28.7 230.9 1,071.5 Miri 1.1 1.1 5.7 16.5 5.4 4.8 51.2 218.8 Marudi - - - - 5.7 5.7 35.4 115.4 Subis 0.5 0.4 2.0 5.8 6.4 5.3 35.9 156.4 Beluru - - - - 17.7 1.7 15.7 78.2 Telang Usan 1.9 1.7 8.6 24.9 1.9 1.7 8.6 24.9 MIRI 3.5 3.2 16.3 47.3 37.1 19.2 146.8 593.6 Limbang - - - - 3.2 1.8 14.9 45.8 Lawas 0.3 0.3 1.1 3.2 3.8 1.9 10.5 30.9 LIMBANG 0.3 0.3 1.1 3.2 7.0 3.7 25.4 76.7 Sarikei 9.2 8.1 42.2 122.4 39.6 36.5 355.9 1,434.3 Maradong - - - - 6.8 6.8 62.0 251.9 Julau - - - - 6.0 4.0 44.0 219.1 Pakan - - - - 4.0 1.0 6.0 29.9 SARIKEI 9.2 8.1 42.2 122.4 56.4 48.3 467.9 1,935.2 Kapit - - - - 18.5 18.0 156.7 746.5 Song - - - - 5.1 5.1 40.6 176.6 Belaga - - - - 113.9 113.9 1,025.4 5,080.9 Bukit Mabong - - - - 12.3 11.6 141.1 679.3 KAPIT - - - - 149.8 148.6 1,363.8 6,683.3
JADUAL 3-3 : KELUASAN, PENGELUARAN DAN NILAI PENGELUARAN TANAMAN REMPAH-RATUS MENGIKUT DAERAH, SARAWAK, 2017
Table 3-3 : Hectareage, Production and Value of Production Of Spices Vegetables By District, Sarawak, 2017
Limau Nipis (Lime) Jumlah (Total)DAERAH District
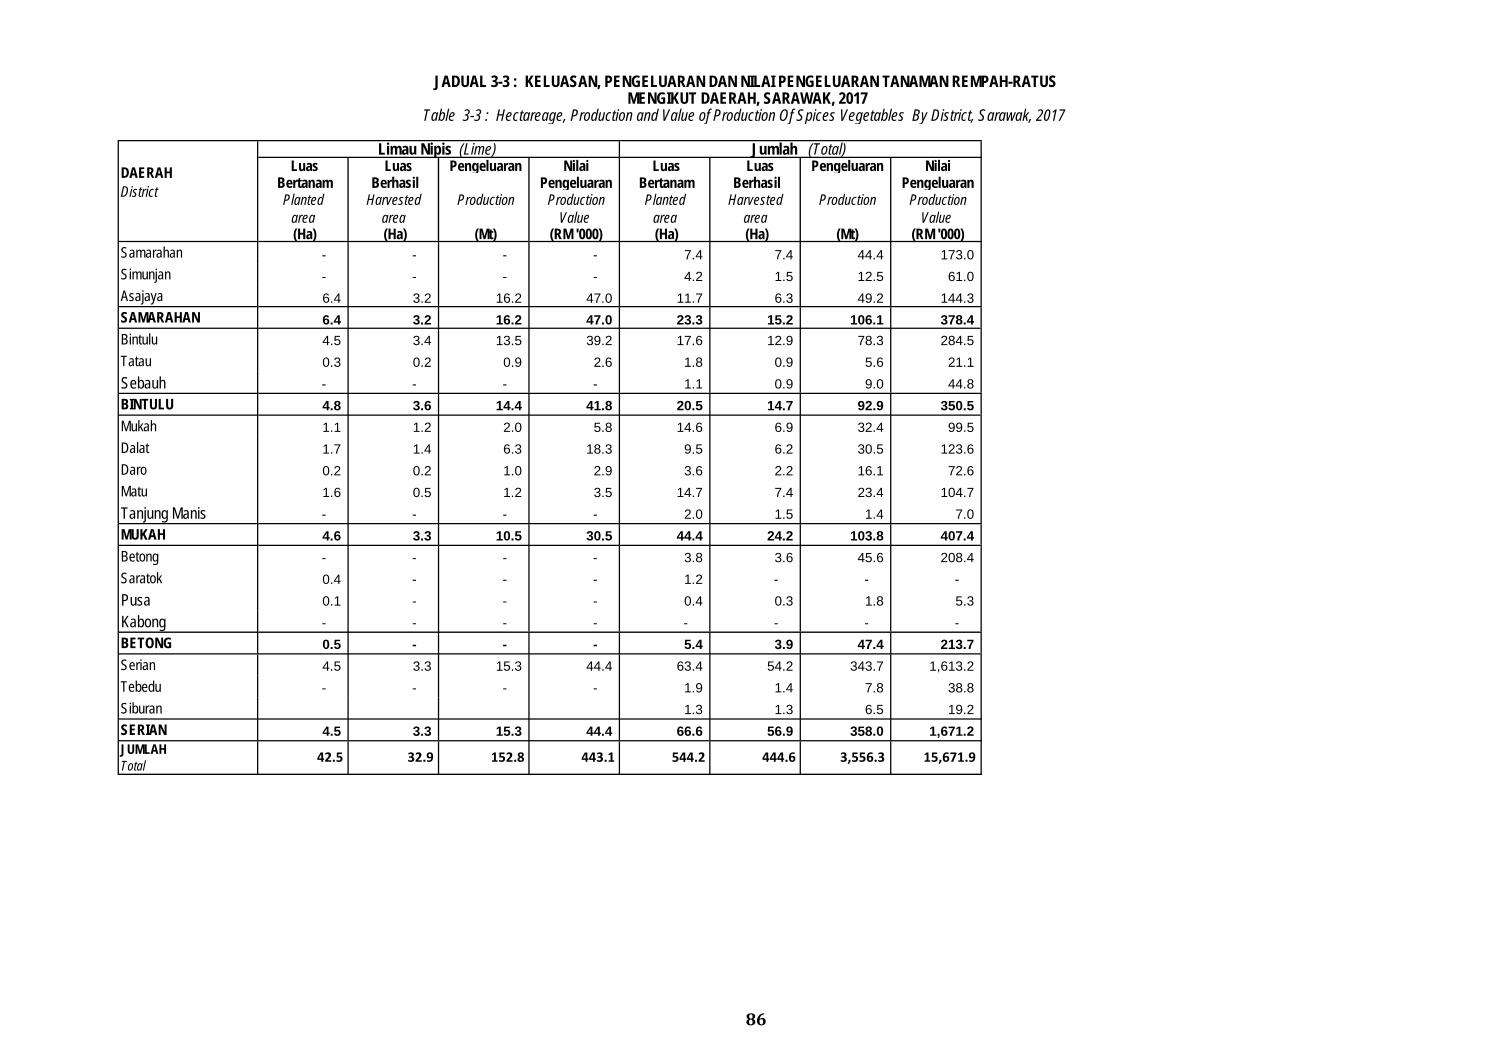
86
Luas Luas Pengeluaran Nilai Luas Luas Pengeluaran Nilai Bertanam Berhasil Pengeluaran Bertanam Berhasil Pengeluaran Planted Harvested Production Production Planted Harvested Production Production
area area Value area area Value (Ha) (Ha) (Mt) (RM '000) (Ha) (Ha) (Mt) (RM '000)
Samarahan - - - - 7.4 7.4 44.4 173.0 Simunjan - - - - 4.2 1.5 12.5 61.0 Asajaya 6.4 3.2 16.2 47.0 11.7 6.3 49.2 144.3 SAMARAHAN 6.4 3.2 16.2 47.0 23.3 15.2 106.1 378.4 Bintulu 4.5 3.4 13.5 39.2 17.6 12.9 78.3 284.5 Tatau 0.3 0.2 0.9 2.6 1.8 0.9 5.6 21.1 Sebauh - - - - 1.1 0.9 9.0 44.8 BINTULU 4.8 3.6 14.4 41.8 20.5 14.7 92.9 350.5 Mukah 1.1 1.2 2.0 5.8 14.6 6.9 32.4 99.5 Dalat 1.7 1.4 6.3 18.3 9.5 6.2 30.5 123.6 Daro 0.2 0.2 1.0 2.9 3.6 2.2 16.1 72.6 Matu 1.6 0.5 1.2 3.5 14.7 7.4 23.4 104.7 Tanjung Manis - - - - 2.0 1.5 1.4 7.0 MUKAH 4.6 3.3 10.5 30.5 44.4 24.2 103.8 407.4 Betong - - - - 3.8 3.6 45.6 208.4 Saratok 0.4 - - - 1.2 - - - Pusa 0.1 - - - 0.4 0.3 1.8 5.3 Kabong - - - - - - - - BETONG 0.5 - - - 5.4 3.9 47.4 213.7 Serian 4.5 3.3 15.3 44.4 63.4 54.2 343.7 1,613.2 Tebedu - - - - 1.9 1.4 7.8 38.8 Siburan 1.3 1.3 6.5 19.2 SERIAN 4.5 3.3 15.3 44.4 66.6 56.9 358.0 1,671.2 JUMLAHTotal
DAERAH District
Limau Nipis (Lime) Jumlah (Total)
JADUAL 3-3 : KELUASAN, PENGELUARAN DAN NILAI PENGELUARAN TANAMAN REMPAH-RATUS MENGIKUT DAERAH, SARAWAK, 2017
Table 3-3 : Hectareage, Production and Value of Production Of Spices Vegetables By District, Sarawak, 2017
42.5 32.9 152.8 443.1 544.2 444.6 3,556.3 15,671.9
WILAYAH PERSEKUTUAN LABUAN
FEDERAL TERRITORY OF LABUAN
87
Tidak ada (Nil)
JADUAL 3-2 : KELUASAN, PENGELUARAN DAN NILAI PENGELUARAN HERBA LAIN MENGIKUT DAERAH, WP LABUAN, 2017Table 3-2 : Hectareage, Production and Value of Production Of Other Herbs By District, WP Labuan, 2017
JADUAL 3-1 : KELUASAN, PENGELUARAN DAN NILAI PENGELUARAN HERBA UTAMA MENGIKUT DAERAH, WP LABUAN, 2017Table 3-1 : Hectareage, Production and Value of Production Main Herbs By District, WP Labuan, 2017
Tidak ada (Nil)
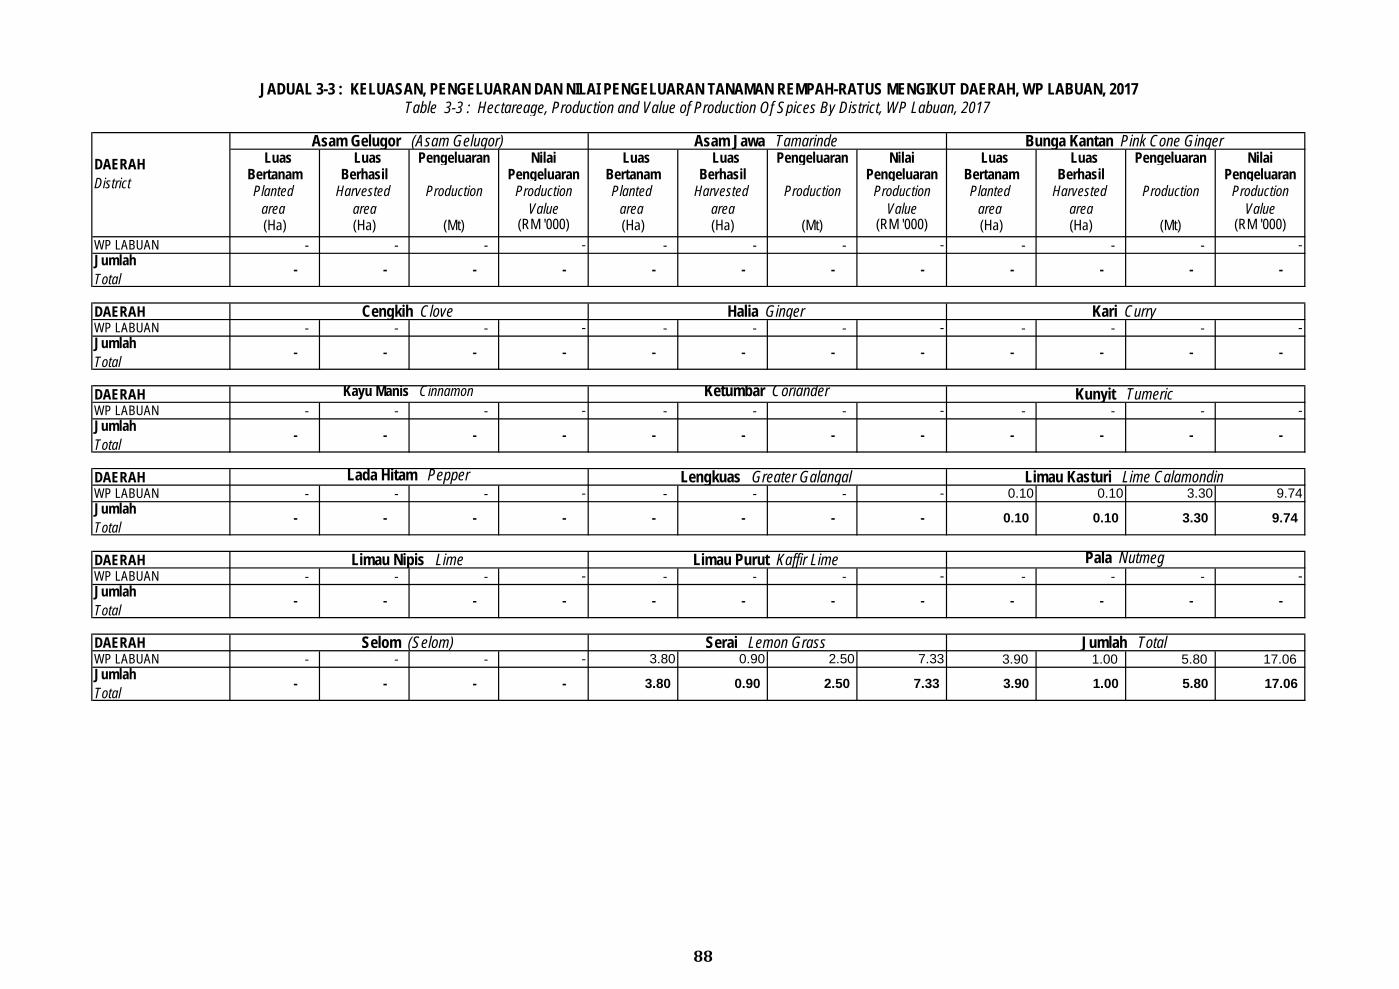
88
Luas Luas Pengeluaran Nilai Luas Luas Pengeluaran Nilai Luas Luas Pengeluaran Nilai Bertanam Berhasil Pengeluaran Bertanam Berhasil Pengeluaran Bertanam Berhasil Pengeluaran Planted Harvested Production Production Planted Harvested Production Production Planted Harvested Production Production
area area Value area area Value area area Value (Ha) (Ha) (Mt) (RM '000) (Ha) (Ha) (Mt) (RM '000) (Ha) (Ha) (Mt) (RM '000)
WP LABUAN - - - - - - - - - - - -
DAERAH WP LABUAN - - - - - - - - - - - -
DAERAH WP LABUAN - - - - - - - - - - - -
DAERAH WP LABUAN - - - - - - - - 0.10 0.10 3.30 9.74
DAERAH WP LABUAN - - - - - - - - - - - -
DAERAH WP LABUAN - - - - 3.80 0.90 2.50 7.33 3.90 1.00 5.80 17.06
JADUAL 3-3 : KELUASAN, PENGELUARAN DAN NILAI PENGELUARAN TANAMAN REMPAH-RATUS MENGIKUT DAERAH, WP LABUAN, 2017
- - -
0.90 2.50 7.33 3.90 - - - 3.80
-
Serai Lemon Grass
- - -
Jumlah Total
- Jumlah Total
- - - -
9.74
Limau Nipis Lime Limau Purut Kaffir Lime Pala Nutmeg
- - - -
1.00 5.80 Jumlah Total
-
Selom (Selom) Jumlah Total
17.06
- 0.10
- -
Lada Hitam Pepper Lengkuas Greater Galangal Limau Kasturi Lime Calamondin
- - - - - -
0.10 3.30 -
- -
Kayu Manis Cinnamon Ketumbar Coriander Kunyit Tumeric
- - - - - -
- -
Jumlah Total
- - - -
- -
Cengkih Clove Halia Ginger Kari Curry
- - - - - -
Jumlah Total
- - - -
Jumlah Total
- - - -
Table 3-3 : Hectareage, Production and Value of Production Of Spices By District, WP Labuan, 2017
DAERAH District
Asam Gelugor (Asam Gelugor) Asam Jawa Tamarinde Bunga Kantan Pink Cone Ginger
BAHAGIAN 4
Section 4
DATA SIRI MASA - KELUASAN TANAMAN HERBA DAN REMPAH-RATUS MENGIKUT
NEGERI , MALAYSIA, 2013 - 2017
Time Series Data - Hectareage Of Herbs and Spices By State,
Malaysia, 2013 – 2017
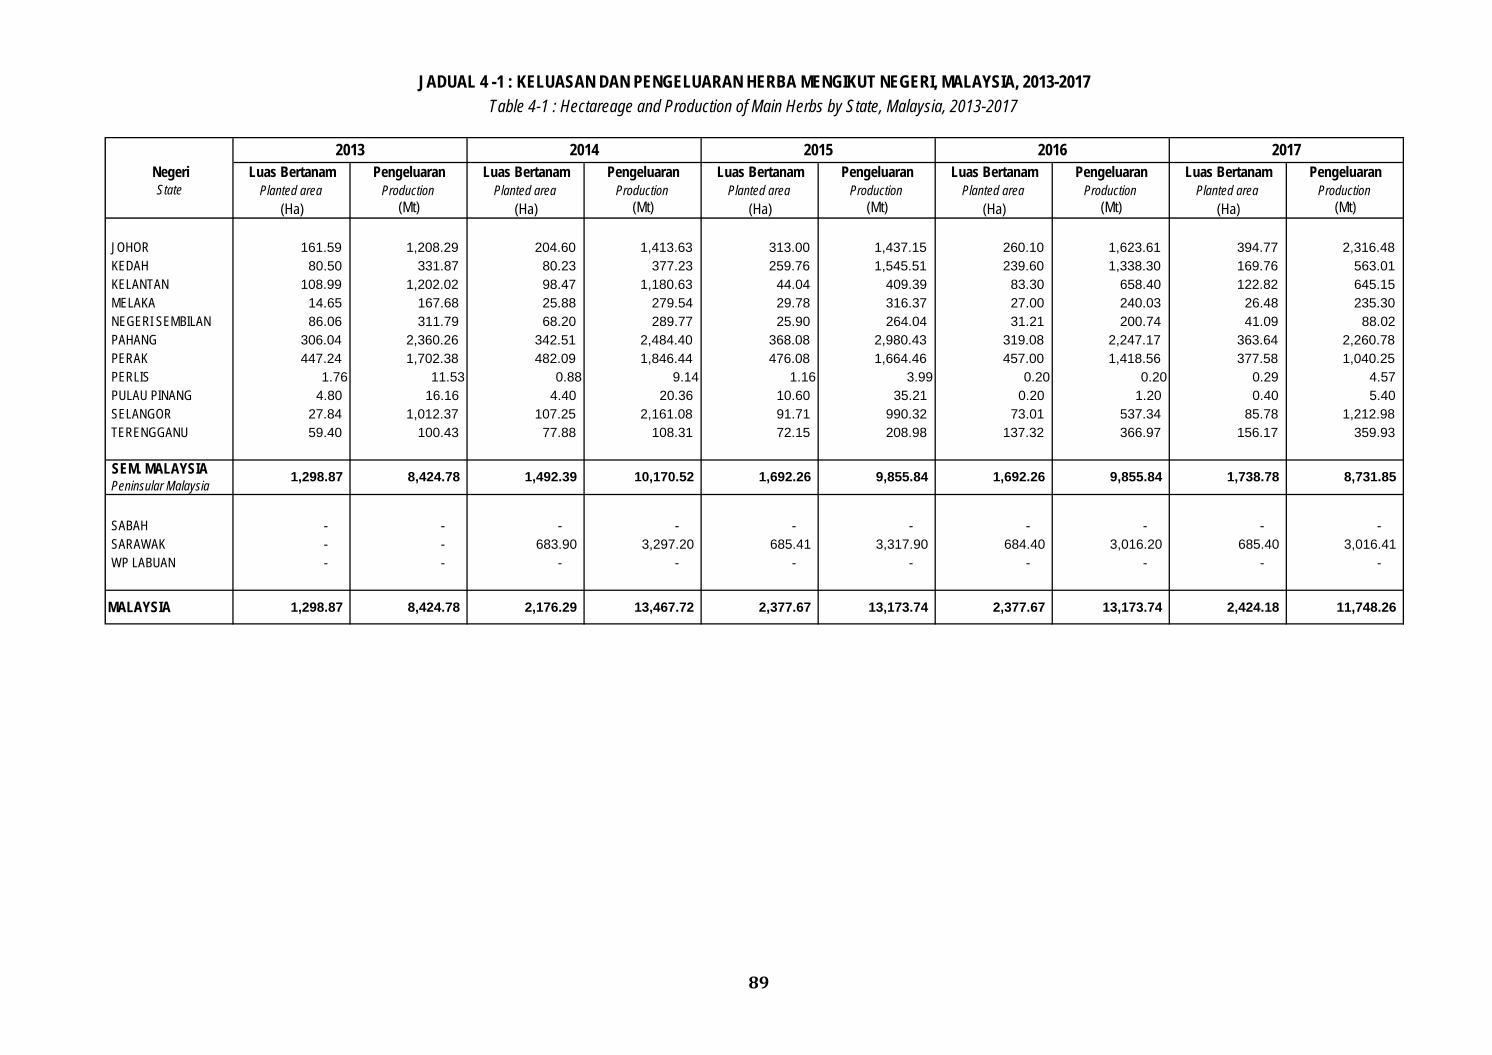
89
Luas Bertanam Pengeluaran Luas Bertanam Pengeluaran Luas Bertanam Pengeluaran Luas Bertanam Pengeluaran Luas Bertanam Pengeluaran State Planted area Production Planted area Production Planted area Production Planted area Production Planted area Production
(Ha) (Mt) (Ha) (Mt) (Ha) (Mt) (Ha) (Mt) (Ha) (Mt)
JOHOR 161.59 1,208.29 204.60 1,413.63 313.00 1,437.15 260.10 1,623.61 394.77 2,316.48 KEDAH 80.50 331.87 80.23 377.23 259.76 1,545.51 239.60 1,338.30 169.76 563.01 KELANTAN 108.99 1,202.02 98.47 1,180.63 44.04 409.39 83.30 658.40 122.82 645.15 MELAKA 14.65 167.68 25.88 279.54 29.78 316.37 27.00 240.03 26.48 235.30 NEGERI SEMBILAN 86.06 311.79 68.20 289.77 25.90 264.04 31.21 200.74 41.09 88.02 PAHANG 306.04 2,360.26 342.51 2,484.40 368.08 2,980.43 319.08 2,247.17 363.64 2,260.78 PERAK 447.24 1,702.38 482.09 1,846.44 476.08 1,664.46 457.00 1,418.56 377.58 1,040.25 PERLIS 1.76 11.53 0.88 9.14 1.16 3.99 0.20 0.20 0.29 4.57 PULAU PINANG 4.80 16.16 4.40 20.36 10.60 35.21 0.20 1.20 0.40 5.40 SELANGOR 27.84 1,012.37 107.25 2,161.08 91.71 990.32 73.01 537.34 85.78 1,212.98 TERENGGANU 59.40 100.43 77.88 108.31 72.15 208.98 137.32 366.97 156.17 359.93
SEM. MALAYSIAPeninsular Malaysia
SABAH - - - - - - - - - - SARAWAK - - 683.90 3,297.20 685.41 3,317.90 684.40 3,016.20 685.40 3,016.41 WP LABUAN - - - - - - - - - -
MALAYSIA 1,298.87 8,424.78 2,176.29 13,467.72 2,377.67 13,173.74 2,377.67 13,173.74 2,424.18 11,748.26
1,692.26 9,855.84 1,738.78 8,731.85 9,855.84
JADUAL 4 -1 : KELUASAN DAN PENGELUARAN HERBA MENGIKUT NEGERI, MALAYSIA, 2013-2017Table 4-1 : Hectareage and Production of Main Herbs by State, Malaysia, 2013-2017
Negeri 2013 2014 2015 2016 2017
1,298.87 8,424.78 1,492.39 10,170.52 1,692.26
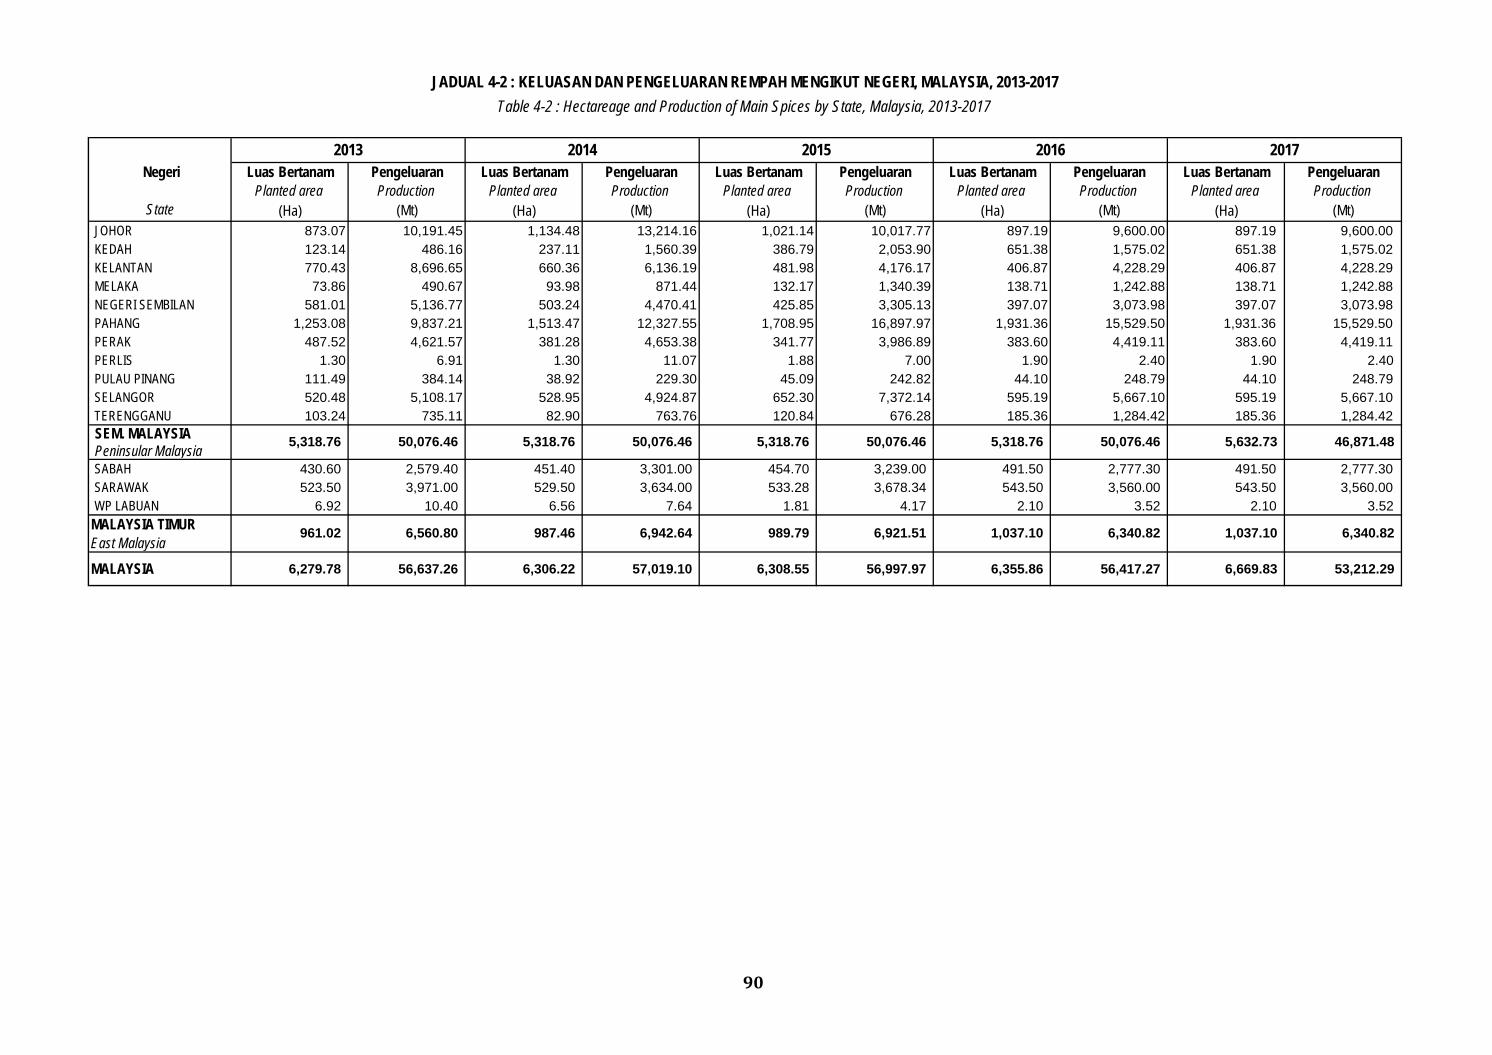
90
Luas Bertanam Pengeluaran Luas Bertanam Pengeluaran Luas Bertanam Pengeluaran Luas Bertanam Pengeluaran Luas Bertanam PengeluaranPlanted area Production Planted area Production Planted area Production Planted area Production Planted area Production
State (Ha) (Mt) (Ha) (Mt) (Ha) (Mt) (Ha) (Mt) (Ha) (Mt)JOHOR 873.07 10,191.45 1,134.48 13,214.16 1,021.14 10,017.77 897.19 9,600.00 897.19 9,600.00 KEDAH 123.14 486.16 237.11 1,560.39 386.79 2,053.90 651.38 1,575.02 651.38 1,575.02 KELANTAN 770.43 8,696.65 660.36 6,136.19 481.98 4,176.17 406.87 4,228.29 406.87 4,228.29 MELAKA 73.86 490.67 93.98 871.44 132.17 1,340.39 138.71 1,242.88 138.71 1,242.88 NEGERI SEMBILAN 581.01 5,136.77 503.24 4,470.41 425.85 3,305.13 397.07 3,073.98 397.07 3,073.98 PAHANG 1,253.08 9,837.21 1,513.47 12,327.55 1,708.95 16,897.97 1,931.36 15,529.50 1,931.36 15,529.50 PERAK 487.52 4,621.57 381.28 4,653.38 341.77 3,986.89 383.60 4,419.11 383.60 4,419.11 PERLIS 1.30 6.91 1.30 11.07 1.88 7.00 1.90 2.40 1.90 2.40 PULAU PINANG 111.49 384.14 38.92 229.30 45.09 242.82 44.10 248.79 44.10 248.79 SELANGOR 520.48 5,108.17 528.95 4,924.87 652.30 7,372.14 595.19 5,667.10 595.19 5,667.10 TERENGGANU 103.24 735.11 82.90 763.76 120.84 676.28 185.36 1,284.42 185.36 1,284.42 SEM. MALAYSIAPeninsular MalaysiaSABAH 430.60 2,579.40 451.40 3,301.00 454.70 3,239.00 491.50 2,777.30 491.50 2,777.30 SARAWAK 523.50 3,971.00 529.50 3,634.00 533.28 3,678.34 543.50 3,560.00 543.50 3,560.00 WP LABUAN 6.92 10.40 6.56 7.64 1.81 4.17 2.10 3.52 2.10 3.52
MALAYSIA TIMUREast Malaysia
MALAYSIA 6,279.78 56,637.26 6,306.22 57,019.10 6,308.55 56,997.97 6,355.86 56,417.27 6,669.83 53,212.29
46,871.48
6,340.82 961.02 6,560.80 987.46 6,942.64 989.79 6,921.51 1,037.10 6,340.82
5,318.76 50,076.46 5,318.76 50,076.46
1,037.10
5,318.76 50,076.46
JADUAL 4-2 : KELUASAN DAN PENGELUARAN REMPAH MENGIKUT NEGERI, MALAYSIA, 2013-2017Table 4-2 : Hectareage and Production of Main Spices by State, Malaysia, 2013-2017
Negeri 2013 2014 2015 2016 2017
5,318.76 50,076.46 5,632.73
BAHAGIAN 5
Section 5
DATA SIRI MASA - KELUASAN TANAMAN HERBA UTAMA, MALAYSIA, 2013 - 2017
Time Series Data - Hectareage Of Main Herbs,
Malaysia, 2013 - 2017
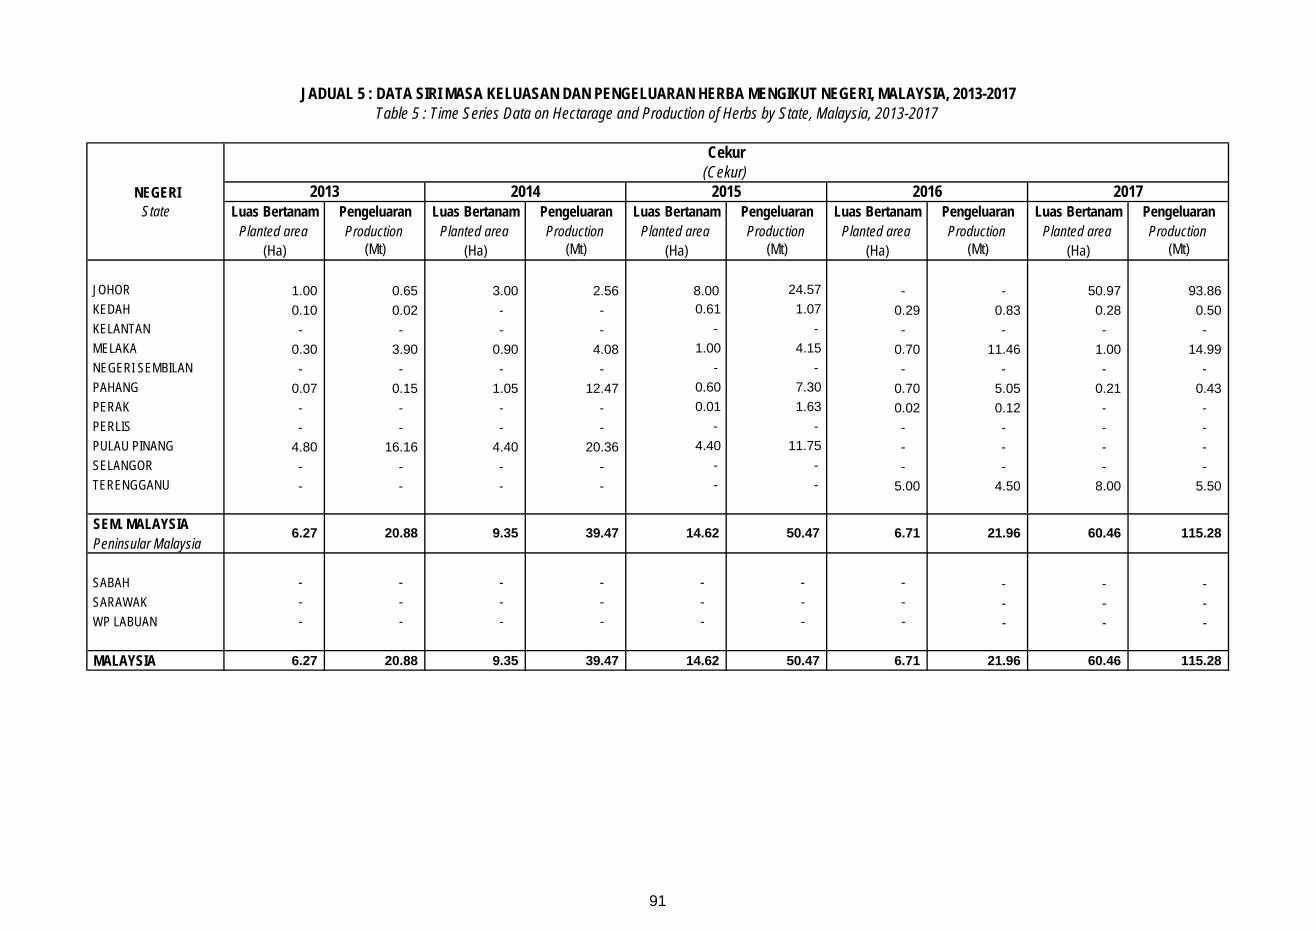
91
Luas Bertanam Pengeluaran Luas Bertanam Pengeluaran Luas Bertanam Pengeluaran Luas Bertanam Pengeluaran Luas Bertanam PengeluaranPlanted area Production Planted area Production Planted area Production Planted area Production Planted area Production
(Ha) (Mt) (Ha) (Mt) (Ha) (Mt) (Ha) (Mt) (Ha) (Mt)
JOHOR 1.00 0.65 3.00 2.56 8.00 24.57 - - 50.97 93.86 KEDAH 0.10 0.02 - - 0.61 1.07 0.29 0.83 0.28 0.50 KELANTAN - - - - - - - - - - MELAKA 0.30 3.90 0.90 4.08 1.00 4.15 0.70 11.46 1.00 14.99 NEGERI SEMBILAN - - - - - - - - - - PAHANG 0.07 0.15 1.05 12.47 0.60 7.30 0.70 5.05 0.21 0.43 PERAK - - - - 0.01 1.63 0.02 0.12 - - PERLIS - - - - - - - - - - PULAU PINANG 4.80 16.16 4.40 20.36 4.40 11.75 - - - - SELANGOR - - - - - - - - - - TERENGGANU - - - - - - 5.00 4.50 8.00 5.50
SEM. MALAYSIAPeninsular Malaysia
SABAH - - - - - - - - - - SARAWAK - - - - - - - - - - WP LABUAN - - - - - - - - - -
MALAYSIA 6.27 20.88 9.35 39.47 14.62 50.47 6.71 21.96 60.46 115.28
JADUAL 5 : DATA SIRI MASA KELUASAN DAN PENGELUARAN HERBA MENGIKUT NEGERI, MALAYSIA, 2013-2017Table 5 : Time Series Data on Hectarage and Production of Herbs by State, Malaysia, 2013-2017
NEGERI
Cekur(Cekur)
2013 2014 2015 2016 2017 State
6.27 20.88 9.35 39.47 14.62 50.47 6.71 21.96 60.46 115.28
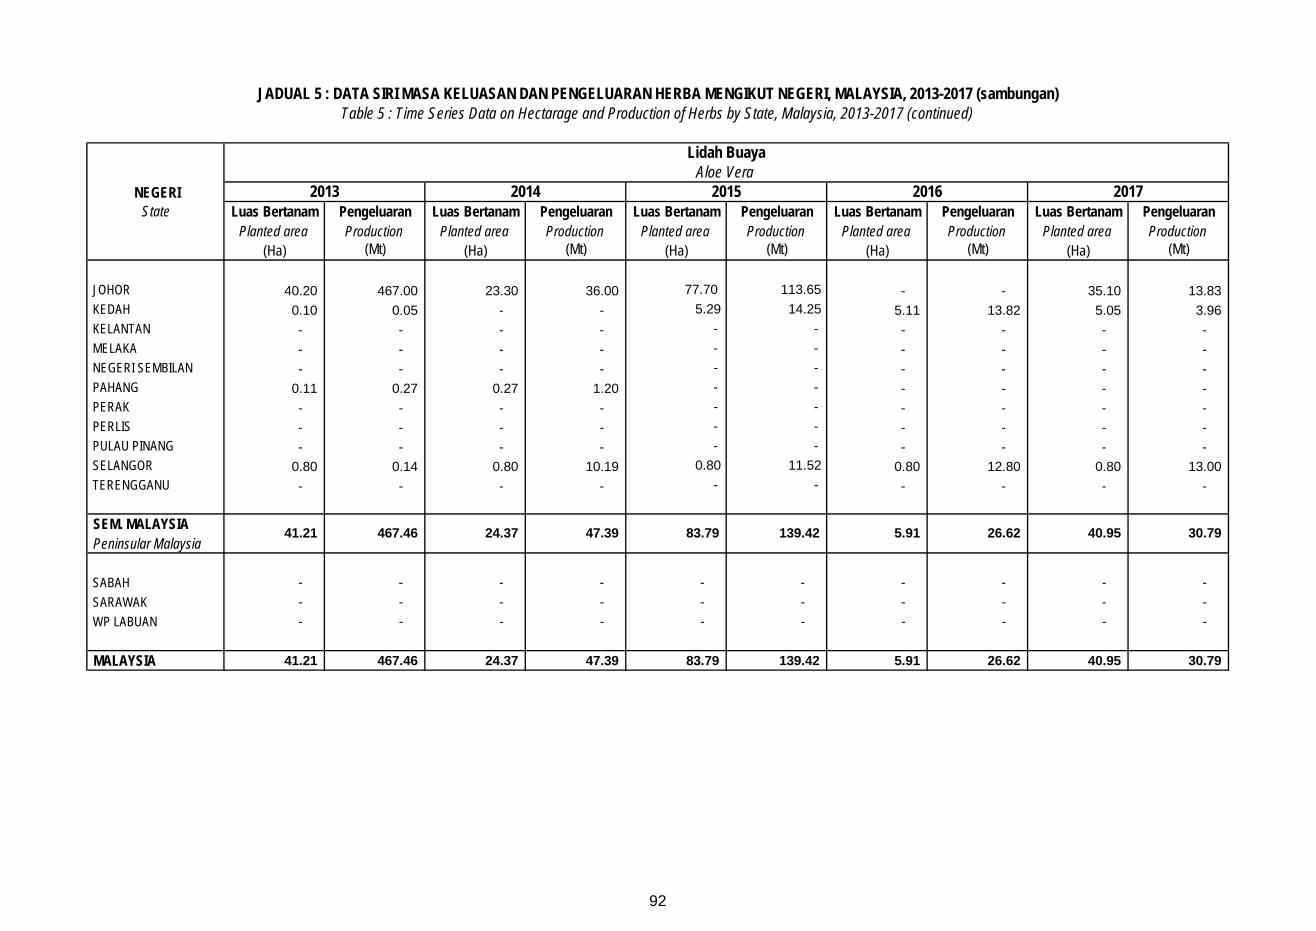
92
Luas Bertanam Pengeluaran Luas Bertanam Pengeluaran Luas Bertanam Pengeluaran Luas Bertanam Pengeluaran Luas Bertanam PengeluaranPlanted area Production Planted area Production Planted area Production Planted area Production Planted area Production
(Ha) (Mt) (Ha) (Mt) (Ha) (Mt) (Ha) (Mt) (Ha) (Mt)
JOHOR 40.20 467.00 23.30 36.00 77.70 113.65 - - 35.10 13.83 KEDAH 0.10 0.05 - - 5.29 14.25 5.11 13.82 5.05 3.96 KELANTAN - - - - - - - - - - MELAKA - - - - - - - - - - NEGERI SEMBILAN - - - - - - - - - - PAHANG 0.11 0.27 0.27 1.20 - - - - - - PERAK - - - - - - - - - - PERLIS - - - - - - - - - - PULAU PINANG - - - - - - - - - - SELANGOR 0.80 0.14 0.80 10.19 0.80 11.52 0.80 12.80 0.80 13.00 TERENGGANU - - - - - - - - - -
SEM. MALAYSIAPeninsular Malaysia
SABAH - - - - - - - - - - SARAWAK - - - - - - - - - - WP LABUAN - - - - - - - - - -
MALAYSIA 41.21 467.46 24.37 47.39 83.79 139.42 5.91 26.62 40.95 30.79
NEGERI
Lidah BuayaAloe Vera
2013 2014 State
41.21 467.46 24.37 47.39 83.79 5.91 26.62 40.95 30.79
2015 2016 2017
139.42
JADUAL 5 : DATA SIRI MASA KELUASAN DAN PENGELUARAN HERBA MENGIKUT NEGERI, MALAYSIA, 2013-2017 (sambungan)Table 5 : Time Series Data on Hectarage and Production of Herbs by State, Malaysia, 2013-2017 (continued)
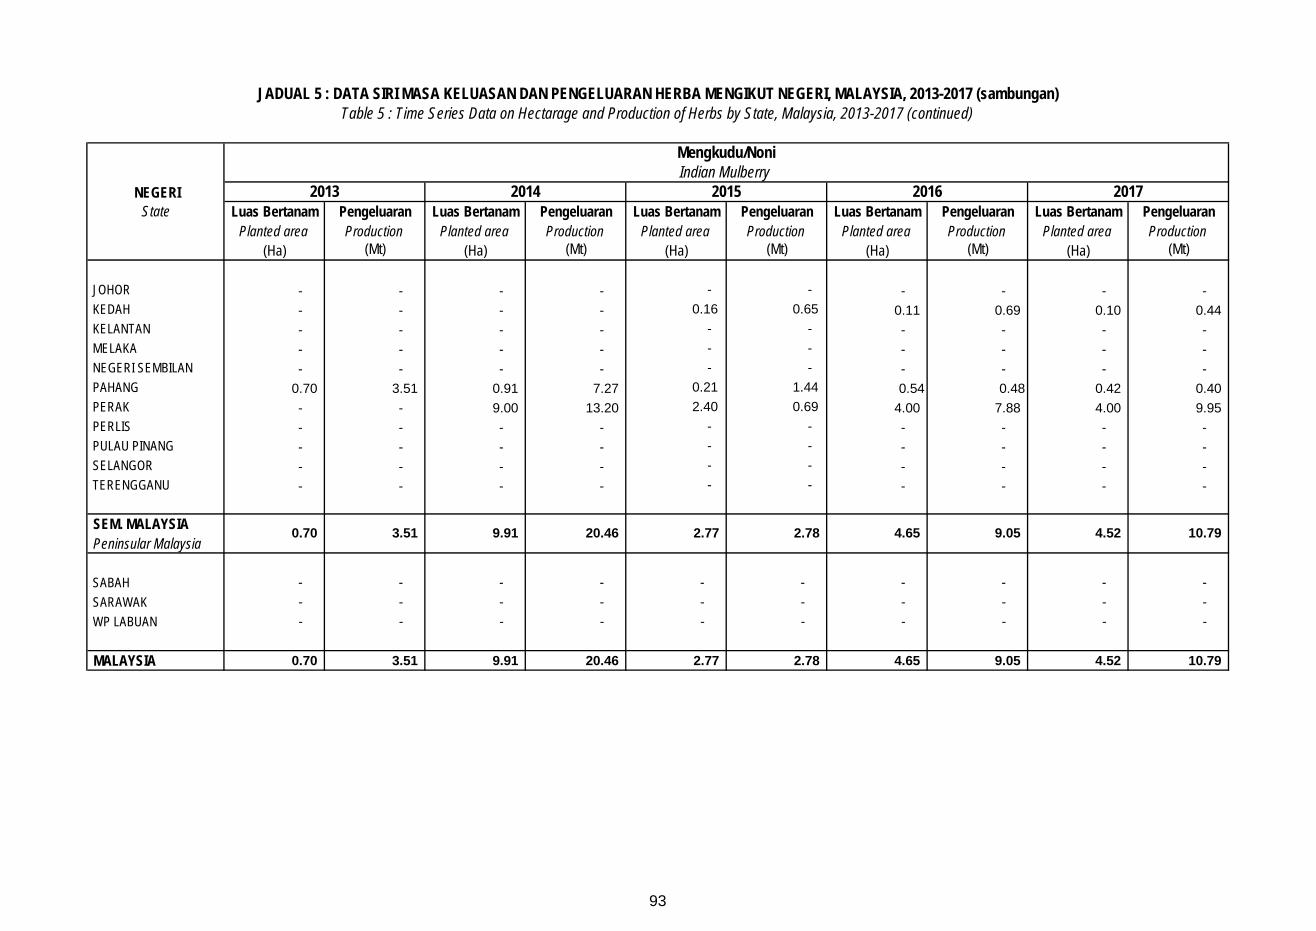
93
Luas Bertanam Pengeluaran Luas Bertanam Pengeluaran Luas Bertanam Pengeluaran Luas Bertanam Pengeluaran Luas Bertanam PengeluaranPlanted area Production Planted area Production Planted area Production Planted area Production Planted area Production
(Ha) (Mt) (Ha) (Mt) (Ha) (Mt) (Ha) (Mt) (Ha) (Mt)
JOHOR - - - - - - - - - - KEDAH - - - - 0.16 0.65 0.11 0.69 0.10 0.44 KELANTAN - - - - - - - - - - MELAKA - - - - - - - - - - NEGERI SEMBILAN - - - - - - - - - - PAHANG 0.70 3.51 0.91 7.27 0.21 1.44 0.54 0.48 0.42 0.40 PERAK - - 9.00 13.20 2.40 0.69 4.00 7.88 4.00 9.95 PERLIS - - - - - - - - - - PULAU PINANG - - - - - - - - - - SELANGOR - - - - - - - - - - TERENGGANU - - - - - - - - - -
SEM. MALAYSIAPeninsular Malaysia
SABAH - - - - - - - - - - SARAWAK - - - - - - - - - - WP LABUAN - - - - - - - - - -
MALAYSIA 0.70 3.51 9.91 20.46 2.77 2.78 4.65 9.05 4.52 10.79
JADUAL 5 : DATA SIRI MASA KELUASAN DAN PENGELUARAN HERBA MENGIKUT NEGERI, MALAYSIA, 2013-2017 (sambungan)Table 5 : Time Series Data on Hectarage and Production of Herbs by State, Malaysia, 2013-2017 (continued)
NEGERI
Mengkudu/NoniIndian Mulberry
2013 2014 2015 2016 2017
10.79
State
0.70 3.51 9.91 20.46 2.77 2.78 4.65 9.05 4.52
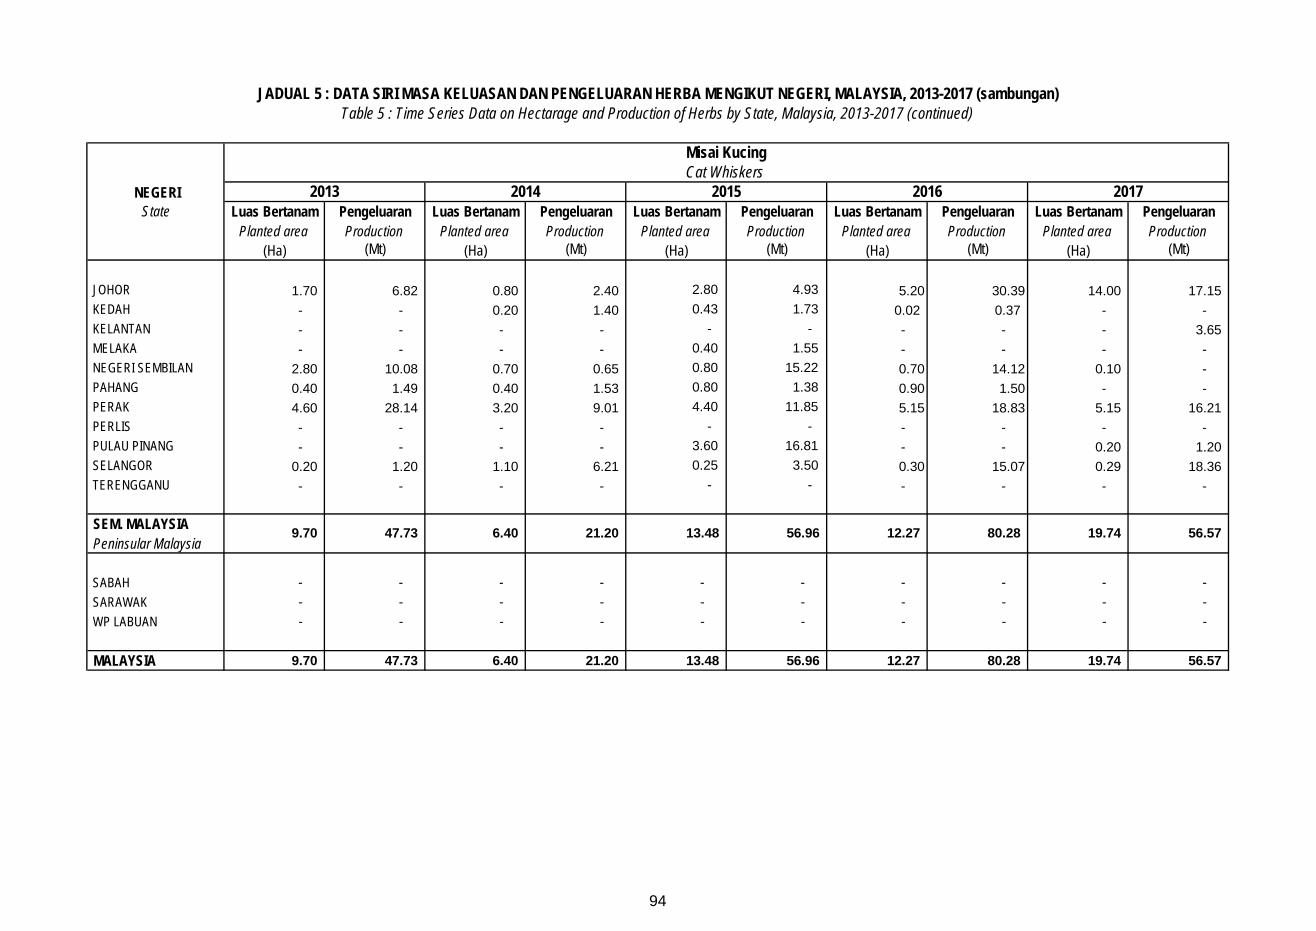
94
Luas Bertanam Pengeluaran Luas Bertanam Pengeluaran Luas Bertanam Pengeluaran Luas Bertanam Pengeluaran Luas Bertanam PengeluaranPlanted area Production Planted area Production Planted area Production Planted area Production Planted area Production
(Ha) (Mt) (Ha) (Mt) (Ha) (Mt) (Ha) (Mt) (Ha) (Mt)
JOHOR 1.70 6.82 0.80 2.40 2.80 4.93 5.20 30.39 14.00 17.15 KEDAH - - 0.20 1.40 0.43 1.73 0.02 0.37 - - KELANTAN - - - - - - - - - 3.65 MELAKA - - - - 0.40 1.55 - - - - NEGERI SEMBILAN 2.80 10.08 0.70 0.65 0.80 15.22 0.70 14.12 0.10 - PAHANG 0.40 1.49 0.40 1.53 0.80 1.38 0.90 1.50 - - PERAK 4.60 28.14 3.20 9.01 4.40 11.85 5.15 18.83 5.15 16.21 PERLIS - - - - - - - - - - PULAU PINANG - - - - 3.60 16.81 - - 0.20 1.20 SELANGOR 0.20 1.20 1.10 6.21 0.25 3.50 0.30 15.07 0.29 18.36 TERENGGANU - - - - - - - - - -
SEM. MALAYSIAPeninsular Malaysia
SABAH - - - - - - - - - - SARAWAK - - - - - - - - - - WP LABUAN - - - - - - - - - -
MALAYSIA 9.70 47.73 6.40 21.20 13.48 56.96 12.27 80.28 19.74 56.57
JADUAL 5 : DATA SIRI MASA KELUASAN DAN PENGELUARAN HERBA MENGIKUT NEGERI, MALAYSIA, 2013-2017 (sambungan)Table 5 : Time Series Data on Hectarage and Production of Herbs by State, Malaysia, 2013-2017 (continued)
12.27 80.28 19.74 56.57 13.48
NEGERI
Misai KucingCat Whiskers
20172016
56.96
State
9.70 47.73 6.40 21.20
2013 2014 2015
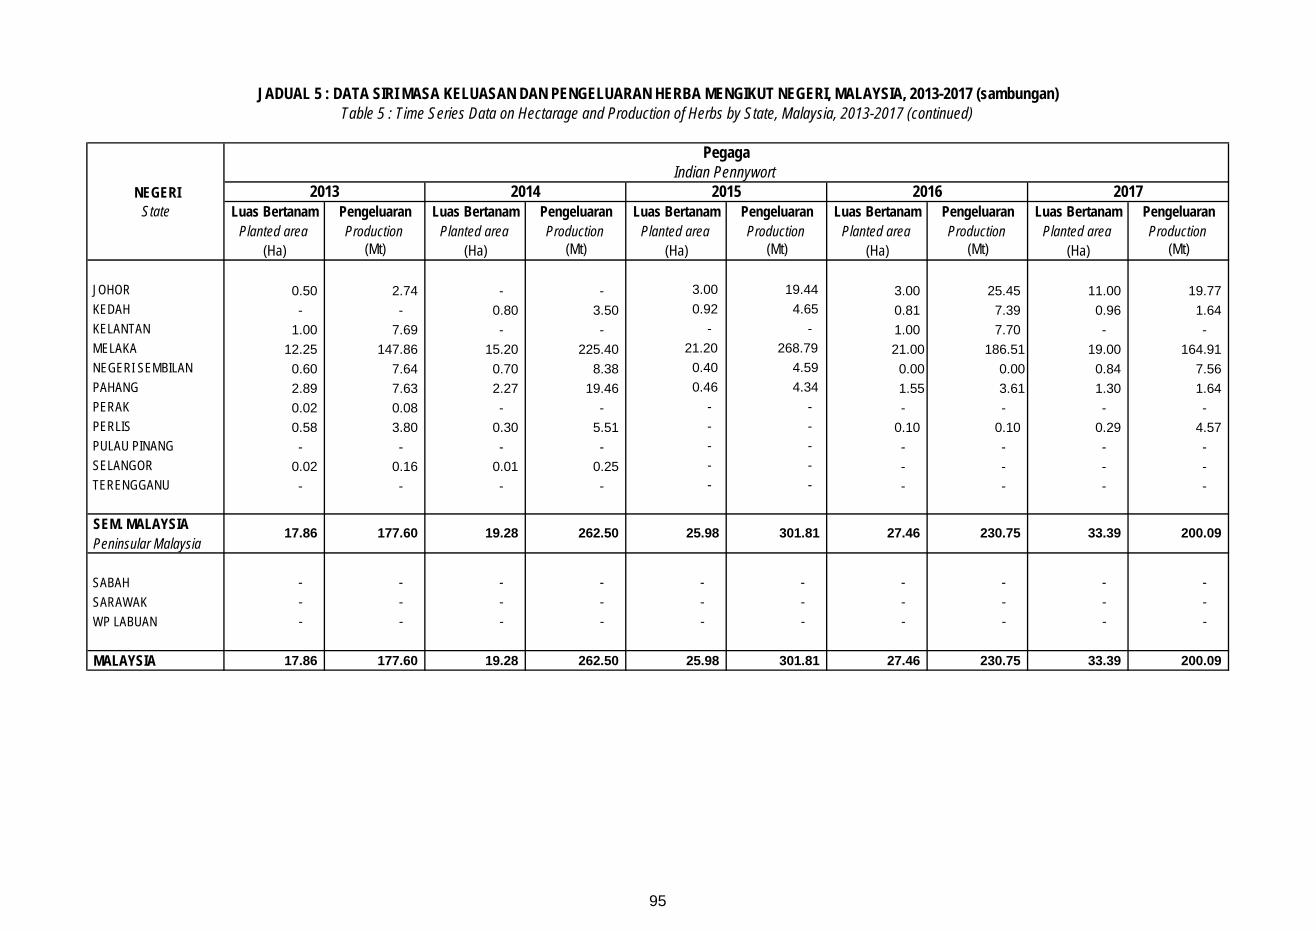
95
Luas Bertanam Pengeluaran Luas Bertanam Pengeluaran Luas Bertanam Pengeluaran Luas Bertanam Pengeluaran Luas Bertanam PengeluaranPlanted area Production Planted area Production Planted area Production Planted area Production Planted area Production
(Ha) (Mt) (Ha) (Mt) (Ha) (Mt) (Ha) (Mt) (Ha) (Mt)
JOHOR 0.50 2.74 - - 3.00 19.44 3.00 25.45 11.00 19.77 KEDAH - - 0.80 3.50 0.92 4.65 0.81 7.39 0.96 1.64 KELANTAN 1.00 7.69 - - - - 1.00 7.70 - - MELAKA 12.25 147.86 15.20 225.40 21.20 268.79 21.00 186.51 19.00 164.91 NEGERI SEMBILAN 0.60 7.64 0.70 8.38 0.40 4.59 0.00 0.00 0.84 7.56 PAHANG 2.89 7.63 2.27 19.46 0.46 4.34 1.55 3.61 1.30 1.64 PERAK 0.02 0.08 - - - - - - - - PERLIS 0.58 3.80 0.30 5.51 - - 0.10 0.10 0.29 4.57 PULAU PINANG - - - - - - - - - - SELANGOR 0.02 0.16 0.01 0.25 - - - - - - TERENGGANU - - - - - - - - - -
SEM. MALAYSIAPeninsular Malaysia
SABAH - - - - - - - - - - SARAWAK - - - - - - - - - - WP LABUAN - - - - - - - - - -
MALAYSIA 17.86 177.60 19.28 262.50 25.98 301.81 27.46 230.75 33.39 200.09
JADUAL 5 : DATA SIRI MASA KELUASAN DAN PENGELUARAN HERBA MENGIKUT NEGERI, MALAYSIA, 2013-2017 (sambungan)Table 5 : Time Series Data on Hectarage and Production of Herbs by State, Malaysia, 2013-2017 (continued)
27.46 230.75 33.39 200.09
NEGERI
PegagaIndian Pennywort
2013 2014 2015 2016 2017 State
17.86 177.60 19.28 262.50 25.98 301.81
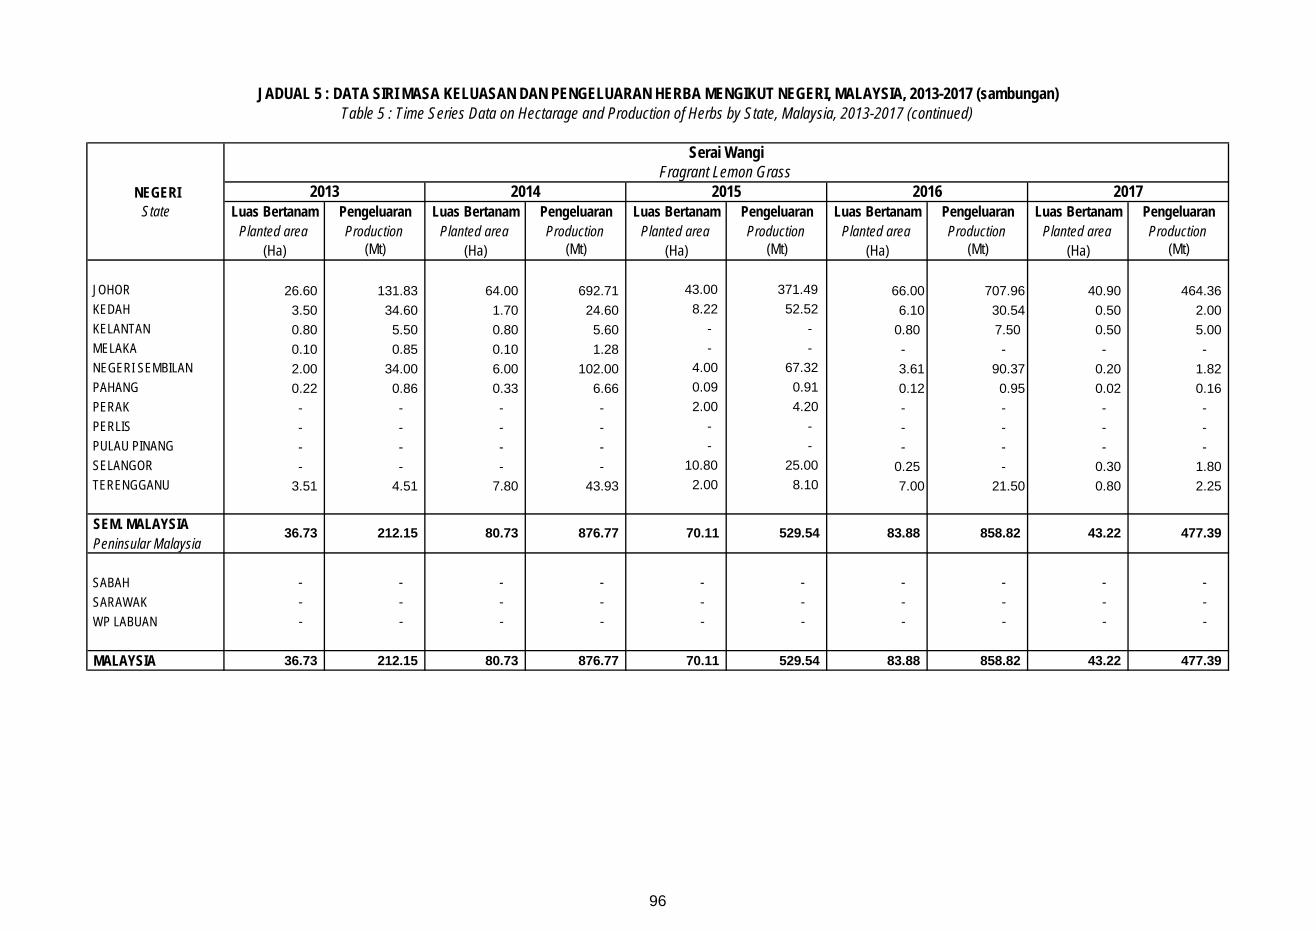
96
Luas Bertanam Pengeluaran Luas Bertanam Pengeluaran Luas Bertanam Pengeluaran Luas Bertanam Pengeluaran Luas Bertanam PengeluaranPlanted area Production Planted area Production Planted area Production Planted area Production Planted area Production
(Ha) (Mt) (Ha) (Mt) (Ha) (Mt) (Ha) (Mt) (Ha) (Mt)
JOHOR 26.60 131.83 64.00 692.71 43.00 371.49 66.00 707.96 40.90 464.36 KEDAH 3.50 34.60 1.70 24.60 8.22 52.52 6.10 30.54 0.50 2.00 KELANTAN 0.80 5.50 0.80 5.60 - - 0.80 7.50 0.50 5.00 MELAKA 0.10 0.85 0.10 1.28 - - - - - - NEGERI SEMBILAN 2.00 34.00 6.00 102.00 4.00 67.32 3.61 90.37 0.20 1.82 PAHANG 0.22 0.86 0.33 6.66 0.09 0.91 0.12 0.95 0.02 0.16 PERAK - - - - 2.00 4.20 - - - - PERLIS - - - - - - - - - - PULAU PINANG - - - - - - - - - - SELANGOR - - - - 10.80 25.00 0.25 - 0.30 1.80 TERENGGANU 3.51 4.51 7.80 43.93 2.00 8.10 7.00 21.50 0.80 2.25
SEM. MALAYSIAPeninsular Malaysia
SABAH - - - - - - - - - - SARAWAK - - - - - - - - - - WP LABUAN - - - - - - - - - -
MALAYSIA 36.73 212.15 80.73 876.77 70.11 529.54 83.88 858.82 43.22 477.39
JADUAL 5 : DATA SIRI MASA KELUASAN DAN PENGELUARAN HERBA MENGIKUT NEGERI, MALAYSIA, 2013-2017 (sambungan)Table 5 : Time Series Data on Hectarage and Production of Herbs by State, Malaysia, 2013-2017 (continued)
NEGERI
Serai WangiFragrant Lemon Grass
2013 2014 2015 2016 2017 State
36.73 212.15 80.73 876.77 70.11 529.54 83.88 858.82 43.22 477.39

97
Luas Bertanam Pengeluaran Luas Bertanam Pengeluaran Luas Bertanam Pengeluaran Luas Bertanam Pengeluaran Luas Bertanam PengeluaranPlanted area Production Planted area Production Planted area Production Planted area Production Planted area Production
(Ha) (Mt) (Ha) (Mt) (Ha) (Mt) (Ha) (Mt) (Ha) (Mt)
JOHOR 2.00 12.00 2.00 7.40 6.00 11.61 6.00 11.67 10.00 23.17 KEDAH 0.70 1.50 6.00 105.93 2.23 5.50 2.03 4.61 4.09 7.47 KELANTAN - - - - - - - - - - MELAKA 1.20 8.67 6.08 15.55 2.80 19.54 2.80 28.37 3.40 35.29 NEGERI SEMBILAN - - - - - - - - 2.40 1.34 PAHANG 2.60 7.55 1.15 9.63 0.73 7.57 0.40 3.37 0.80 2.70 PERAK 0.93 3.23 0.40 6.60 2.13 9.76 2.13 12.66 2.13 12.61 PERLIS - - - - - - - - - - PULAU PINANG - - - - - - - - - - SELANGOR 10.59 447.08 41.66 1,232.73 55.56 704.91 57.16 359.60 64.16 636.67 TERENGGANU - - - - - - - - - -
SEM. MALAYSIAPeninsular Malaysia
SABAH - - - - - - - - - - SARAWAK - - - - - - - - - - WP LABUAN - - - - - - - - - -
MALAYSIA 18.02 480.03 57.29 1,377.84 69.45 758.90 70.52 420.27 86.98 719.24
NEGERI
SirihBetel Leaf
2013 2014 2015 2016 2017
JADUAL 5 : DATA SIRI MASA KELUASAN DAN PENGELUARAN HERBA MENGIKUT NEGERI, MALAYSIA, 2013-2017 (sambungan)Table 5 : Time Series Data on Hectarage and Production of Herbs by State, Malaysia, 2013-2017 (continued)
State
18.02 480.03 57.29 1,377.84 69.45 758.90 70.52 420.27 86.98 719.24
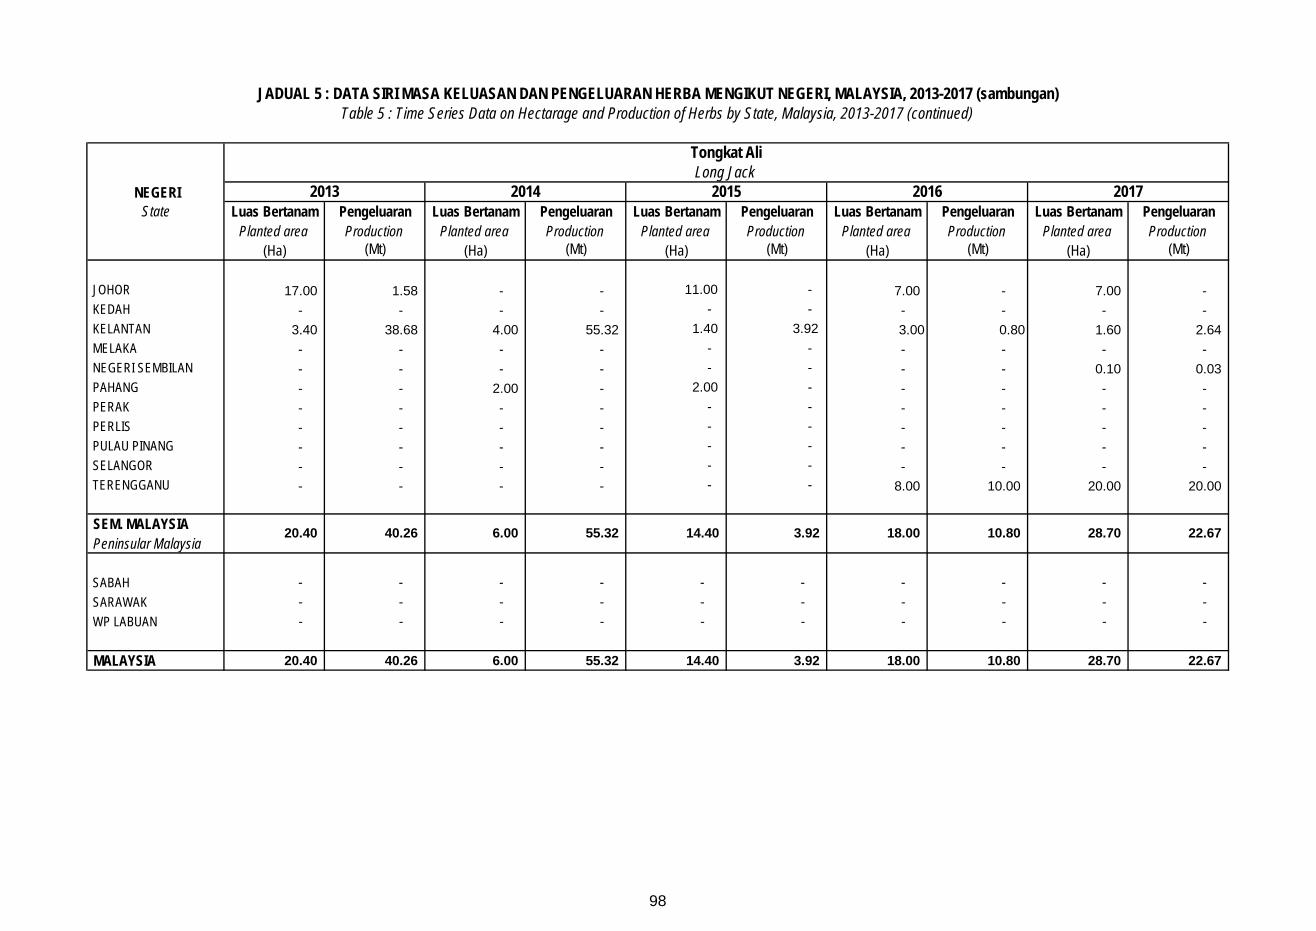
98
Luas Bertanam Pengeluaran Luas Bertanam Pengeluaran Luas Bertanam Pengeluaran Luas Bertanam Pengeluaran Luas Bertanam PengeluaranPlanted area Production Planted area Production Planted area Production Planted area Production Planted area Production
(Ha) (Mt) (Ha) (Mt) (Ha) (Mt) (Ha) (Mt) (Ha) (Mt)
JOHOR 17.00 1.58 - - 11.00 - 7.00 - 7.00 - KEDAH - - - - - - - - - - KELANTAN 3.40 38.68 4.00 55.32 1.40 3.92 3.00 0.80 1.60 2.64 MELAKA - - - - - - - - - - NEGERI SEMBILAN - - - - - - - - 0.10 0.03 PAHANG - - 2.00 - 2.00 - - - - - PERAK - - - - - - - - - - PERLIS - - - - - - - - - - PULAU PINANG - - - - - - - - - - SELANGOR - - - - - - - - - - TERENGGANU - - - - - - 8.00 10.00 20.00 20.00
SEM. MALAYSIAPeninsular Malaysia
SABAH - - - - - - - - - - SARAWAK - - - - - - - - - - WP LABUAN - - - - - - - - - -
MALAYSIA 20.40 40.26 6.00 55.32 14.40 3.92 18.00 10.80 28.70 22.67
JADUAL 5 : DATA SIRI MASA KELUASAN DAN PENGELUARAN HERBA MENGIKUT NEGERI, MALAYSIA, 2013-2017 (sambungan)Table 5 : Time Series Data on Hectarage and Production of Herbs by State, Malaysia, 2013-2017 (continued)
14.40
NEGERI
Tongkat AliLong Jack
2013 2014 2015 2016 2017
3.92 18.00 10.80 28.70 22.67
State
20.40 40.26 6.00 55.32
BAHAGIAN 6
Section 6
DATA SIRI MASA - KELUASAN TANAMAN REMPAH RATUS, MALAYSIA, 2013 - 2017
Time Series Data - Hectareage Of Spices,
Malaysia, 2013 - 2017
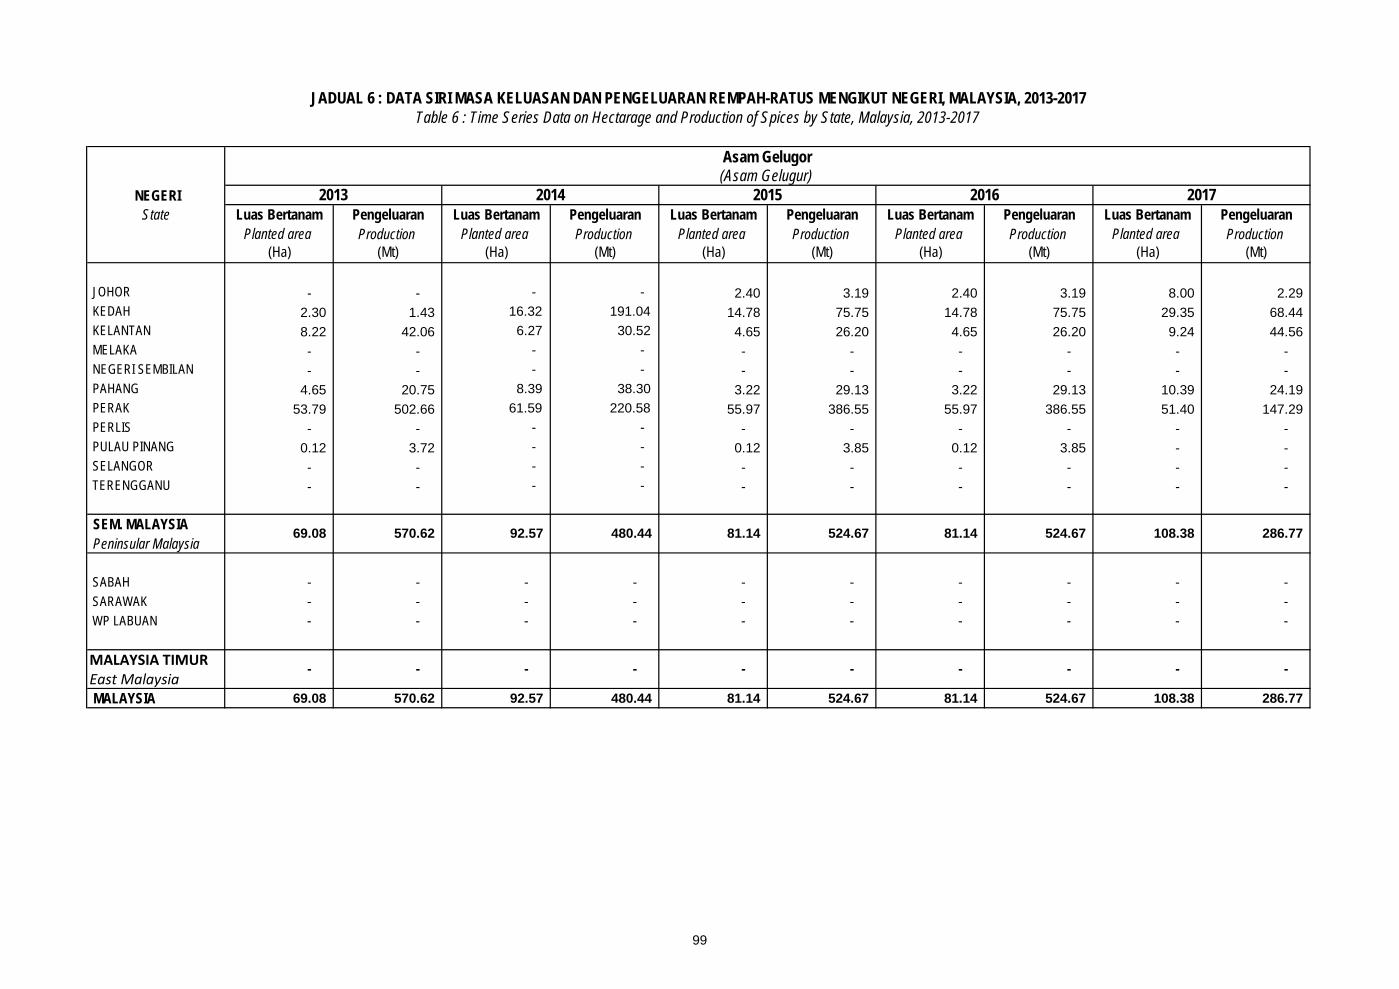
99
Luas Bertanam Pengeluaran Luas Bertanam Pengeluaran Luas Bertanam Pengeluaran Luas Bertanam Pengeluaran Luas Bertanam PengeluaranPlanted area Production Planted area Production Planted area Production Planted area Production Planted area Production
(Ha) (Mt) (Ha) (Mt) (Ha) (Mt) (Ha) (Mt) (Ha) (Mt)
JOHOR - - - - 2.40 3.19 2.40 3.19 8.00 2.29 KEDAH 2.30 1.43 16.32 191.04 14.78 75.75 14.78 75.75 29.35 68.44 KELANTAN 8.22 42.06 6.27 30.52 4.65 26.20 4.65 26.20 9.24 44.56 MELAKA - - - - - - - - - - NEGERI SEMBILAN - - - - - - - - - - PAHANG 4.65 20.75 8.39 38.30 3.22 29.13 3.22 29.13 10.39 24.19 PERAK 53.79 502.66 61.59 220.58 55.97 386.55 55.97 386.55 51.40 147.29 PERLIS - - - - - - - - - - PULAU PINANG 0.12 3.72 - - 0.12 3.85 0.12 3.85 - - SELANGOR - - - - - - - - - - TERENGGANU - - - - - - - - - -
SEM. MALAYSIAPeninsular Malaysia
SABAH - - - - - - - - - - SARAWAK - - - - - - - - - - WP LABUAN - - - - - - - - - -
MALAYSIA TIMUREast MalaysiaMALAYSIA 69.08 570.62 92.57 480.44 81.14 524.67 81.14 524.67 108.38 286.77
JADUAL 6 : DATA SIRI MASA KELUASAN DAN PENGELUARAN REMPAH-RATUS MENGIKUT NEGERI, MALAYSIA, 2013-2017Table 6 : Time Series Data on Hectarage and Production of Spices by State, Malaysia, 2013-2017
NEGERI
Asam Gelugor (Asam Gelugur)
2013 2014 2015 2016
524.67
2017
108.38 286.77
- - -
State
69.08 570.62 92.57 480.44 81.14
-
524.67 81.14
- - - - - -
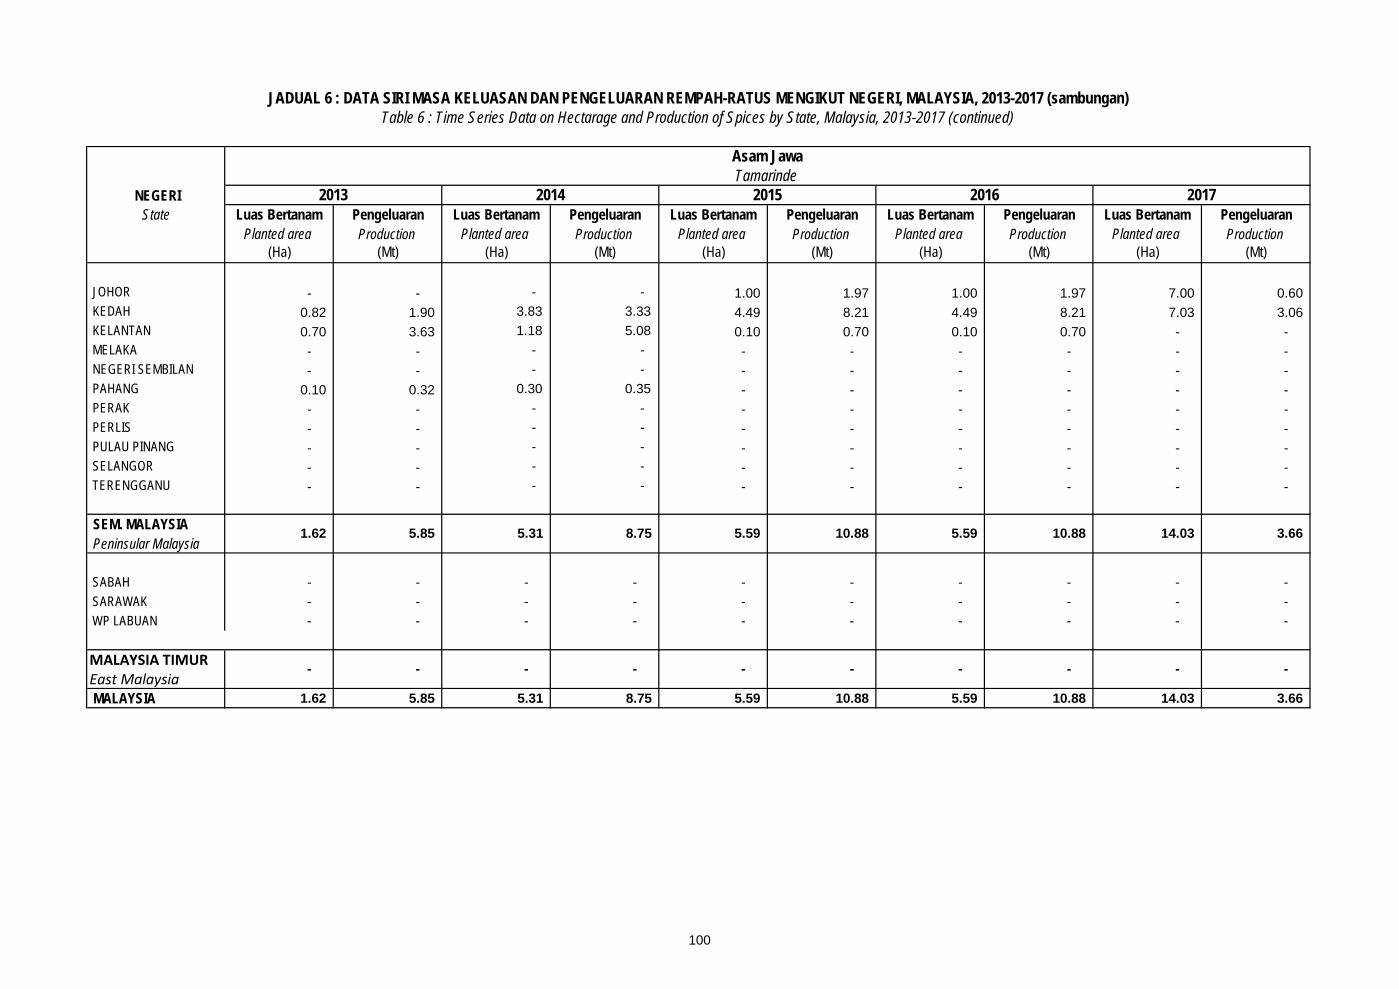
100
Luas Bertanam Pengeluaran Luas Bertanam Pengeluaran Luas Bertanam Pengeluaran Luas Bertanam Pengeluaran Luas Bertanam PengeluaranPlanted area Production Planted area Production Planted area Production Planted area Production Planted area Production
(Ha) (Mt) (Ha) (Mt) (Ha) (Mt) (Ha) (Mt) (Ha) (Mt)
JOHOR - - - - 1.00 1.97 1.00 1.97 7.00 0.60 KEDAH 0.82 1.90 3.83 3.33 4.49 8.21 4.49 8.21 7.03 3.06 KELANTAN 0.70 3.63 1.18 5.08 0.10 0.70 0.10 0.70 - - MELAKA - - - - - - - - - - NEGERI SEMBILAN - - - - - - - - - - PAHANG 0.10 0.32 0.30 0.35 - - - - - - PERAK - - - - - - - - - - PERLIS - - - - - - - - - - PULAU PINANG - - - - - - - - - - SELANGOR - - - - - - - - - - TERENGGANU - - - - - - - - - -
SEM. MALAYSIAPeninsular Malaysia
SABAH - - - - - - - - - - SARAWAK - - - - - - - - - - WP LABUAN - - - - - - - - - -
MALAYSIA TIMUREast MalaysiaMALAYSIA 1.62 5.85 5.31 8.75 5.59 10.88 5.59 10.88 14.03 3.66
- - - - -
14.03
JADUAL 6 : DATA SIRI MASA KELUASAN DAN PENGELUARAN REMPAH-RATUS MENGIKUT NEGERI, MALAYSIA, 2013-2017 (sambungan)
NEGERI
Asam Jawa Tamarinde
2013 2014 2015 2016 2017
Table 6 : Time Series Data on Hectarage and Production of Spices by State, Malaysia, 2013-2017 (continued)
State
1.62 5.85 5.31 8.75 5.59 3.66
- - - - -
10.88 5.59 10.88
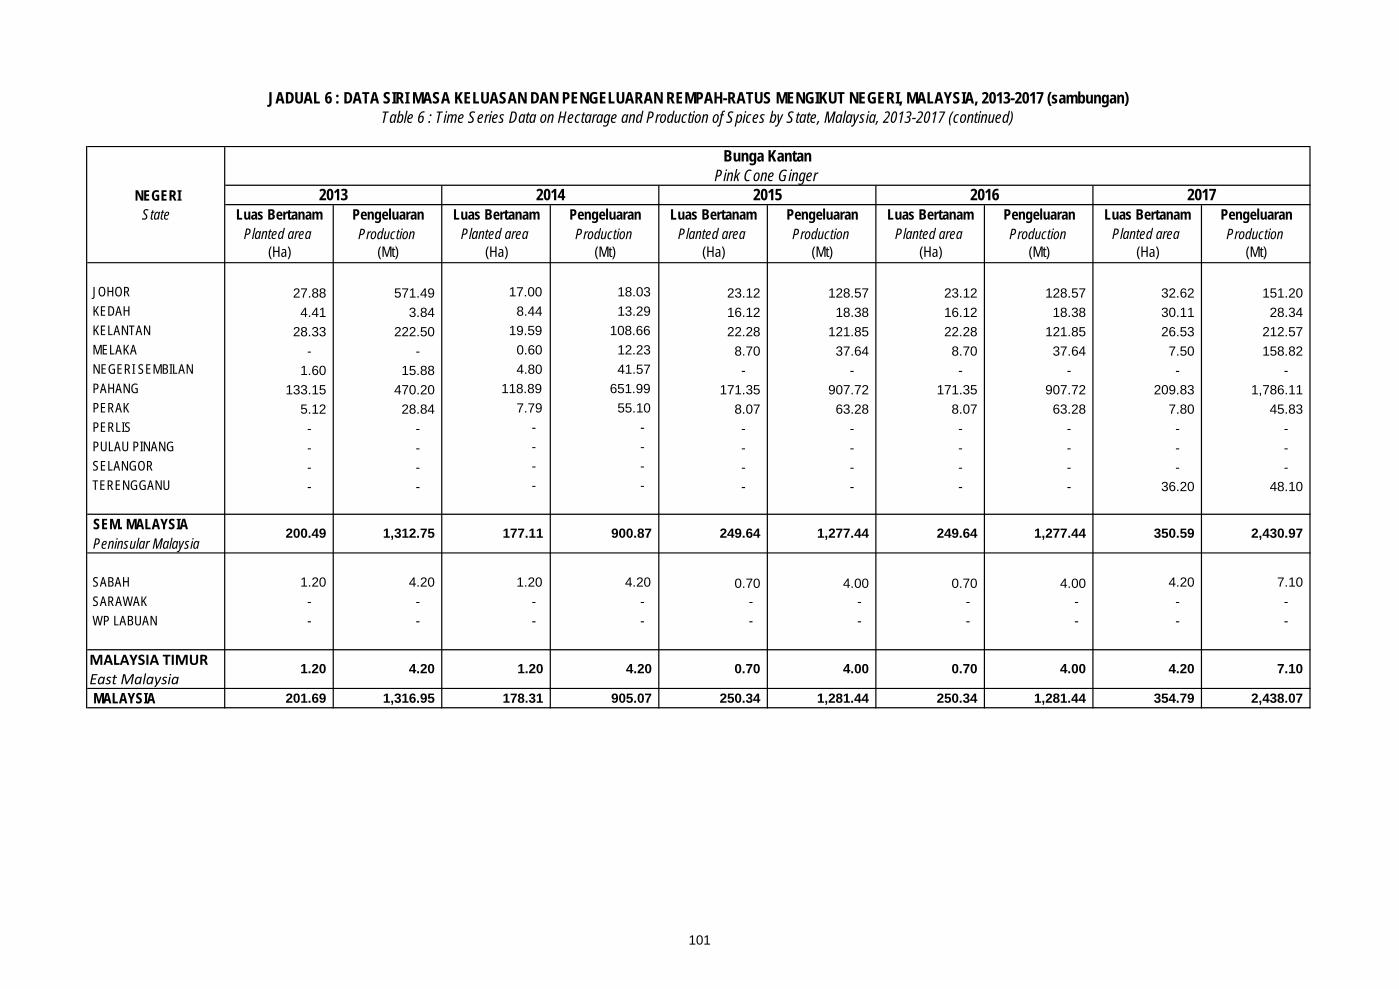
101
Luas Bertanam Pengeluaran Luas Bertanam Pengeluaran Luas Bertanam Pengeluaran Luas Bertanam Pengeluaran Luas Bertanam PengeluaranPlanted area Production Planted area Production Planted area Production Planted area Production Planted area Production
(Ha) (Mt) (Ha) (Mt) (Ha) (Mt) (Ha) (Mt) (Ha) (Mt)
JOHOR 27.88 571.49 17.00 18.03 23.12 128.57 23.12 128.57 32.62 151.20 KEDAH 4.41 3.84 8.44 13.29 16.12 18.38 16.12 18.38 30.11 28.34 KELANTAN 28.33 222.50 19.59 108.66 22.28 121.85 22.28 121.85 26.53 212.57 MELAKA - - 0.60 12.23 8.70 37.64 8.70 37.64 7.50 158.82 NEGERI SEMBILAN 1.60 15.88 4.80 41.57 - - - - - - PAHANG 133.15 470.20 118.89 651.99 171.35 907.72 171.35 907.72 209.83 1,786.11 PERAK 5.12 28.84 7.79 55.10 8.07 63.28 8.07 63.28 7.80 45.83 PERLIS - - - - - - - - - - PULAU PINANG - - - - - - - - - - SELANGOR - - - - - - - - - - TERENGGANU - - - - - - - - 36.20 48.10
SEM. MALAYSIAPeninsular Malaysia
SABAH 1.20 4.20 1.20 4.20 0.70 4.00 0.70 4.00 4.20 7.10 SARAWAK - - - - - - - - - - WP LABUAN - - - - - - - - - -
MALAYSIA TIMUREast MalaysiaMALAYSIA 201.69 1,316.95 178.31 905.07 250.34 1,281.44 250.34 1,281.44 354.79 2,438.07
Table 6 : Time Series Data on Hectarage and Production of Spices by State, Malaysia, 2013-2017 (continued)
NEGERI
Bunga KantanPink Cone Ginger
2013 2014 2015 2016 2017
JADUAL 6 : DATA SIRI MASA KELUASAN DAN PENGELUARAN REMPAH-RATUS MENGIKUT NEGERI, MALAYSIA, 2013-2017 (sambungan)
State
200.49 1,312.75 177.11 900.87 249.64
1.20 4.20 4.00 0.70
249.64 1,277.44 350.59 2,430.97 1,277.44
1.20 4.20 4.00 4.20 7.10 0.70

102
Luas Bertanam Pengeluaran Luas Bertanam Pengeluaran Luas Bertanam Pengeluaran Luas Bertanam Pengeluaran Luas Bertanam PengeluaranPlanted area Production Planted area Production Planted area Production Planted area Production Planted area Production
(Ha) (Mt) (Ha) (Mt) (Ha) (Mt) (Ha) (Mt) (Ha) (Mt)
JOHOR - - - - - - - - - - KEDAH - - - - - - - - - - KELANTAN - - - - - - - - - - MELAKA - - - - - - - - - - NEGERI SEMBILAN - - - - - - - - - - PAHANG - - - - - - - - - - PERAK - - - - - - - - - - PERLIS - - - - - - - - - - PULAU PINANG - - - - - - - - - - SELANGOR - - - - - - - - - - TERENGGANU - - - - - - - - - -
SEM. MALAYSIAPeninsular Malaysia
SABAH 1.70 1.20 - - - - - - - - SARAWAK 1.00 - 1.00 - 1.00 - 1.00 - 1.00 - WP LABUAN - - - - - - - - - -
MALAYSIA TIMUREast MalaysiaMALAYSIA 2.70 1.20 1.00 - 1.00 - 1.00 - 1.00 -
State
JADUAL 6 : DATA SIRI MASA KELUASAN DAN PENGELUARAN REMPAH-RATUS MENGIKUT NEGERI, MALAYSIA, 2013-2017 (sambungan)Table 6 : Time Series Data on Hectarage and Production of Spices by State, Malaysia, 2013-2017 (continued)
NEGERI
CengkihClove
2013 2014 2015 2016 2017
1.00 - 1.00
- - - - -
2.70 1.20 1.00 -
- - - - -
- 1.00 -

103
Luas Bertanam Pengeluaran Luas Bertanam Pengeluaran Luas Bertanam Pengeluaran Luas Bertanam Pengeluaran Luas Bertanam PengeluaranPlanted area Production Planted area Production Planted area Production Planted area Production Planted area Production
(Ha) (Mt) (Ha) (Mt) (Ha) (Mt) (Ha) (Mt) (Ha) (Mt)
JOHOR 0.40 11.30 0.40 3.36 0.50 3.16 0.50 3.16 2.00 16.83 KEDAH - - 0.60 1.17 0.91 3.13 0.91 3.13 1.27 3.92 KELANTAN 81.29 576.18 81.01 495.06 48.47 392.44 48.47 392.44 64.18 444.93 MELAKA - - - - - - - - - - NEGERI SEMBILAN - - - - - - - - 0.50 2.98 PAHANG 336.89 4,988.20 392.63 5,352.93 401.03 7,147.33 401.03 7,147.33 469.88 9,274.96 PERAK - - - - 0.30 2.00 0.30 2.00 10.02 195.50 PERLIS - - - - - - - - - - PULAU PINANG 0.30 2.00 - - 1.00 1.52 1.00 1.52 1.00 19.80 SELANGOR 18.80 234.00 112.10 1,429.13 111.60 1,587.87 111.60 1,587.87 88.70 1,093.16 TERENGGANU - - - - 0.40 0.55 0.40 0.55 - -
SEM. MALAYSIAPeninsular Malaysia
SABAH 136.50 422.90 139.20 893.70 148.30 1,152.30 148.30 1,152.30 154.20 670.70 SARAWAK 318.50 2,596.10 321.70 2,599.50 322.00 2,633.86 322.00 2,633.86 322.50 2,555.90 WP LABUAN - - - - - - - - - -
MALAYSIA TIMUREast MalaysiaMALAYSIA 892.68 8,830.68 1,047.64 10,774.86 1,034.51 12,924.16 1,034.51 12,924.16 1,114.25 14,278.67
JADUAL 6 : DATA SIRI MASA KELUASAN DAN PENGELUARAN REMPAH-RATUS MENGIKUT NEGERI, MALAYSIA, 2013-2017 (sambungan)
564.21
Table 6 : Time Series Data on Hectarage and Production of Spices by State, Malaysia, 2013-2017 (continued)
NEGERI
HaliaGinger
2013 2014 2015 2016
564.21
State
437.68 5,811.68 586.74 7,281.66 9,138.00 637.55 11,052.07
2017
9,138.00
455.00 3,019.00 460.90 3,493.20 470.30 3,786.16 470.30 3,786.16 476.70 3,226.60
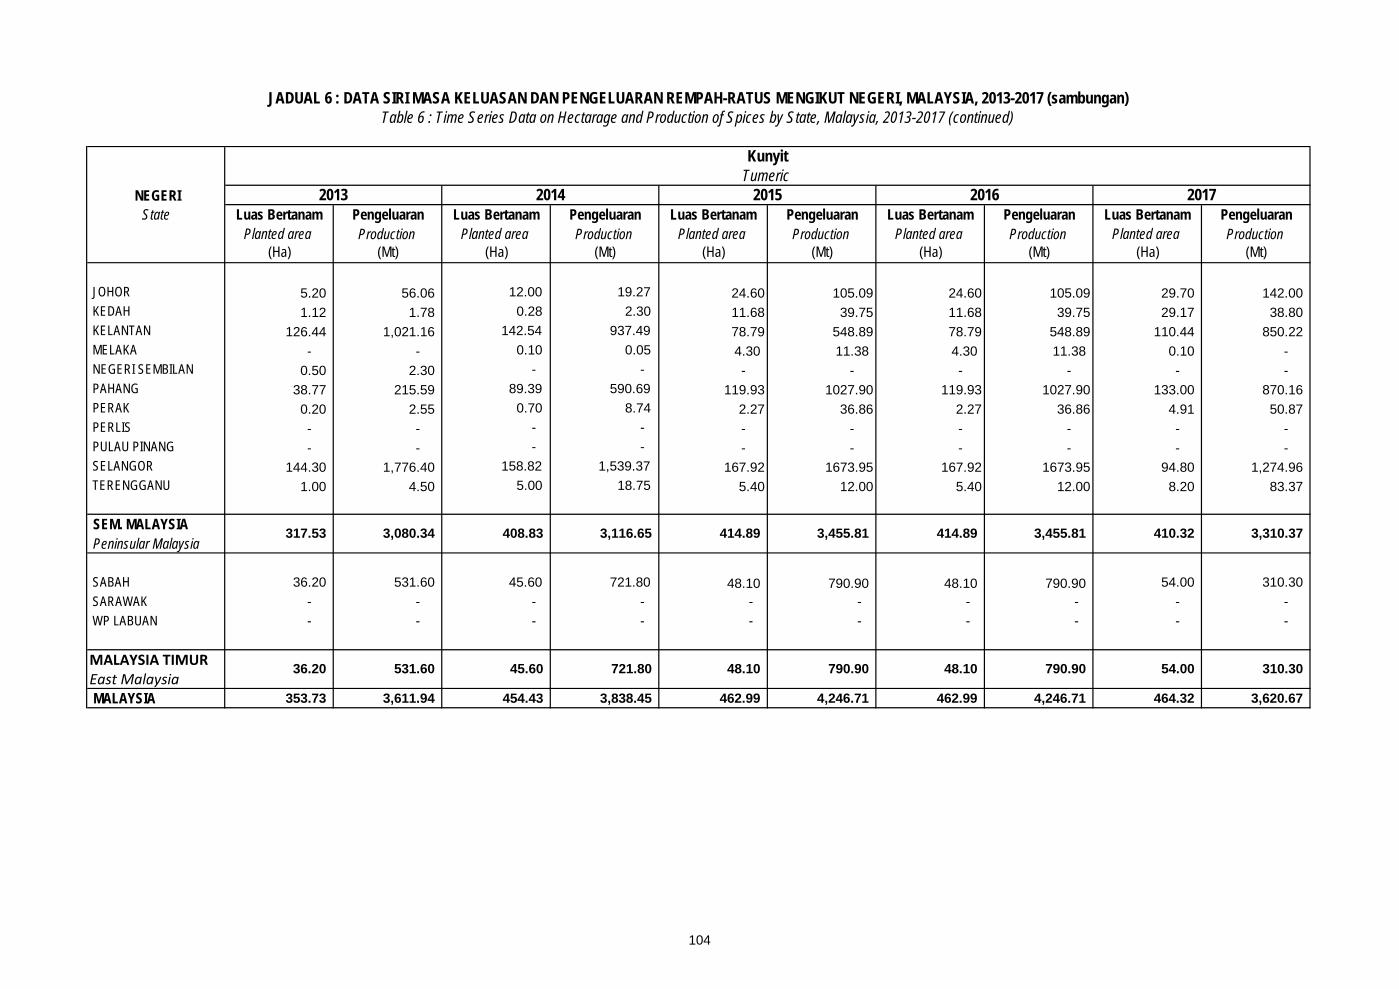
104
Luas Bertanam Pengeluaran Luas Bertanam Pengeluaran Luas Bertanam Pengeluaran Luas Bertanam Pengeluaran Luas Bertanam PengeluaranPlanted area Production Planted area Production Planted area Production Planted area Production Planted area Production
(Ha) (Mt) (Ha) (Mt) (Ha) (Mt) (Ha) (Mt) (Ha) (Mt)
JOHOR 5.20 56.06 12.00 19.27 24.60 105.09 24.60 105.09 29.70 142.00 KEDAH 1.12 1.78 0.28 2.30 11.68 39.75 11.68 39.75 29.17 38.80 KELANTAN 126.44 1,021.16 142.54 937.49 78.79 548.89 78.79 548.89 110.44 850.22 MELAKA - - 0.10 0.05 4.30 11.38 4.30 11.38 0.10 - NEGERI SEMBILAN 0.50 2.30 - - - - - - - - PAHANG 38.77 215.59 89.39 590.69 119.93 1027.90 119.93 1027.90 133.00 870.16 PERAK 0.20 2.55 0.70 8.74 2.27 36.86 2.27 36.86 4.91 50.87 PERLIS - - - - - - - - - - PULAU PINANG - - - - - - - - - - SELANGOR 144.30 1,776.40 158.82 1,539.37 167.92 1673.95 167.92 1673.95 94.80 1,274.96 TERENGGANU 1.00 4.50 5.00 18.75 5.40 12.00 5.40 12.00 8.20 83.37
SEM. MALAYSIAPeninsular Malaysia
SABAH 36.20 531.60 45.60 721.80 48.10 790.90 48.10 790.90 54.00 310.30 SARAWAK - - - - - - - - - - WP LABUAN - - - - - - - - - -
MALAYSIA TIMUREast MalaysiaMALAYSIA 353.73 3,611.94 454.43 3,838.45 462.99 4,246.71 462.99 4,246.71 464.32 3,620.67
JADUAL 6 : DATA SIRI MASA KELUASAN DAN PENGELUARAN REMPAH-RATUS MENGIKUT NEGERI, MALAYSIA, 2013-2017 (sambungan)Table 6 : Time Series Data on Hectarage and Production of Spices by State, Malaysia, 2013-2017 (continued)
NEGERI
KunyitTumeric
2013 2014 2015 2016 2017 State
317.53 3,080.34 408.83 3,116.65 414.89 414.89 3,455.81 410.32 3,455.81
36.20 531.60 45.60 721.80 48.10 790.90 48.10 790.90 54.00 310.30
3,310.37
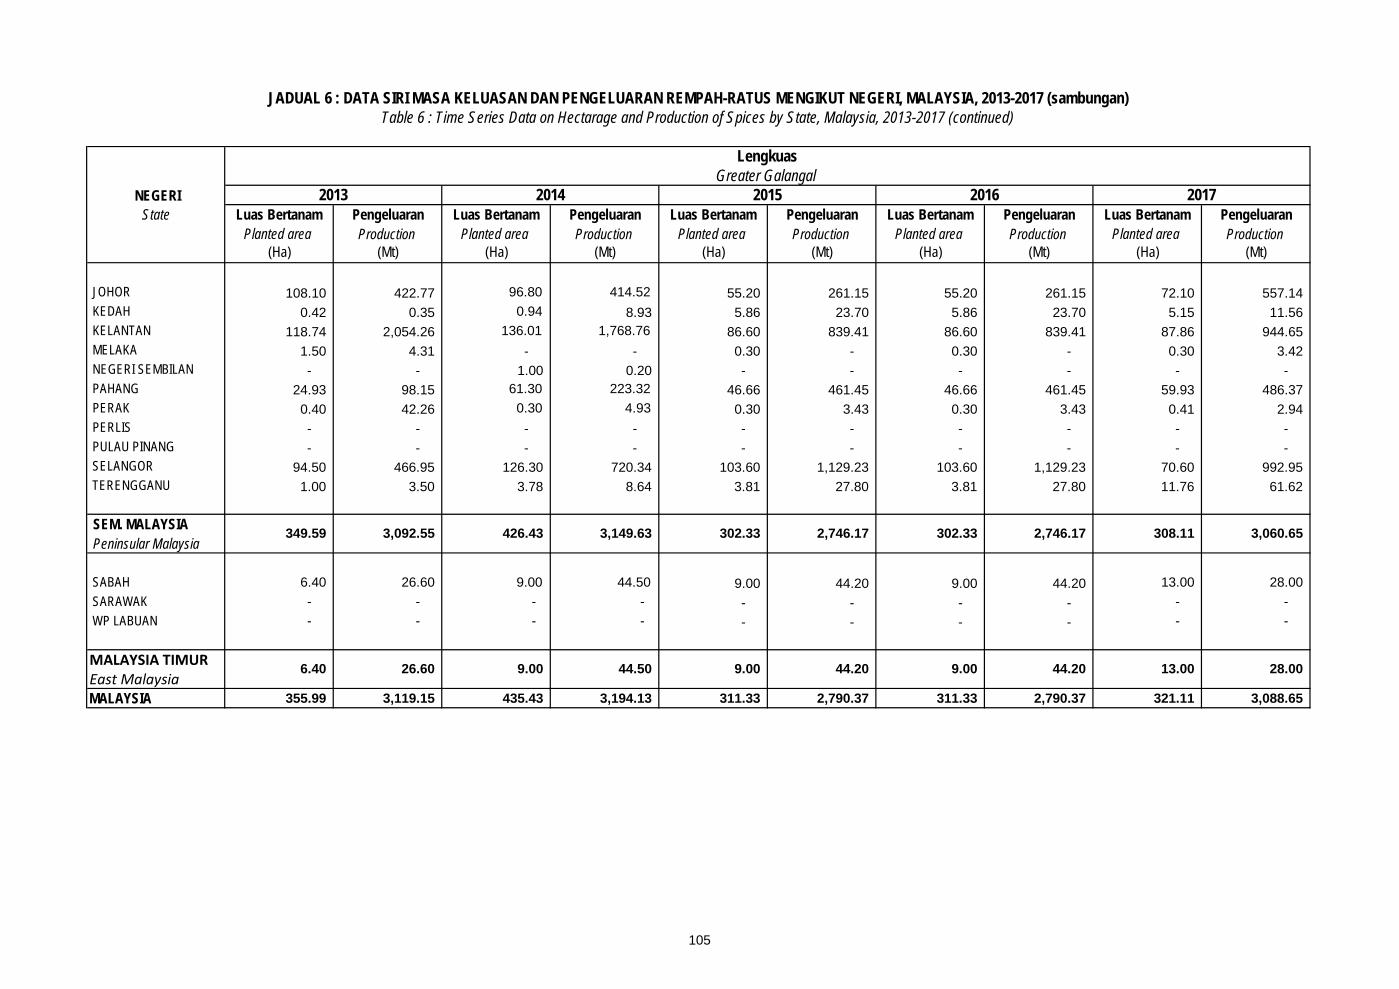
105
Luas Bertanam Pengeluaran Luas Bertanam Pengeluaran Luas Bertanam Pengeluaran Luas Bertanam Pengeluaran Luas Bertanam PengeluaranPlanted area Production Planted area Production Planted area Production Planted area Production Planted area Production
(Ha) (Mt) (Ha) (Mt) (Ha) (Mt) (Ha) (Mt) (Ha) (Mt)
JOHOR 108.10 422.77 96.80 414.52 55.20 261.15 55.20 261.15 72.10 557.14 KEDAH 0.42 0.35 0.94 8.93 5.86 23.70 5.86 23.70 5.15 11.56 KELANTAN 118.74 2,054.26 136.01 1,768.76 86.60 839.41 86.60 839.41 87.86 944.65 MELAKA 1.50 4.31 - - 0.30 - 0.30 - 0.30 3.42 NEGERI SEMBILAN - - 1.00 0.20 - - - - - - PAHANG 24.93 98.15 61.30 223.32 46.66 461.45 46.66 461.45 59.93 486.37 PERAK 0.40 42.26 0.30 4.93 0.30 3.43 0.30 3.43 0.41 2.94 PERLIS - - - - - - - - - - PULAU PINANG - - - - - - - - - - SELANGOR 94.50 466.95 126.30 720.34 103.60 1,129.23 103.60 1,129.23 70.60 992.95 TERENGGANU 1.00 3.50 3.78 8.64 3.81 27.80 3.81 27.80 11.76 61.62
SEM. MALAYSIAPeninsular Malaysia
SABAH 6.40 26.60 9.00 44.50 9.00 44.20 9.00 44.20 13.00 28.00 SARAWAK - - - - - - - - - - WP LABUAN - - - - - - - - - -
MALAYSIA TIMUREast MalaysiaMALAYSIA 355.99 3,119.15 435.43 3,194.13 311.33 2,790.37 311.33 2,790.37 321.11 3,088.65
2017
302.33 2,746.17 308.11 349.59 3,092.55 426.43 3,149.63 302.33 3,060.65 2,746.17
Greater Galangal2013 2014 2015 2016
Table 6 : Time Series Data on Hectarage and Production of Spices by State, Malaysia, 2013-2017 (continued)
NEGERI
Lengkuas
State
28.00 44.50 9.00 44.20 9.00 44.20 13.00
JADUAL 6 : DATA SIRI MASA KELUASAN DAN PENGELUARAN REMPAH-RATUS MENGIKUT NEGERI, MALAYSIA, 2013-2017 (sambungan)
6.40 26.60 9.00
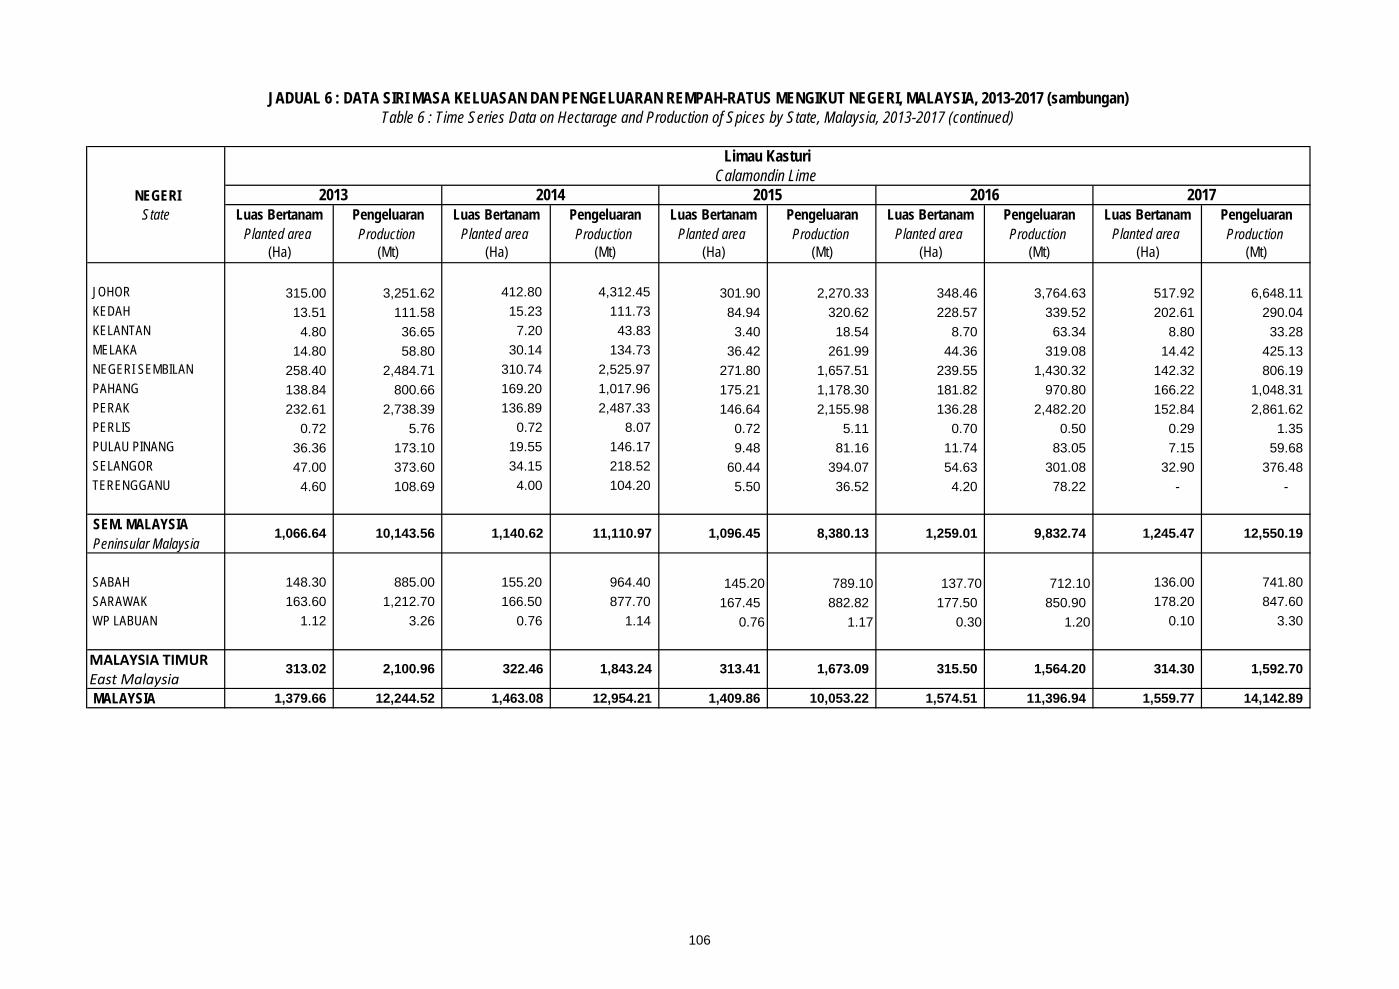
106
Luas Bertanam Pengeluaran Luas Bertanam Pengeluaran Luas Bertanam Pengeluaran Luas Bertanam Pengeluaran Luas Bertanam PengeluaranPlanted area Production Planted area Production Planted area Production Planted area Production Planted area Production
(Ha) (Mt) (Ha) (Mt) (Ha) (Mt) (Ha) (Mt) (Ha) (Mt)
JOHOR 315.00 3,251.62 412.80 4,312.45 301.90 2,270.33 348.46 3,764.63 517.92 6,648.11 KEDAH 13.51 111.58 15.23 111.73 84.94 320.62 228.57 339.52 202.61 290.04 KELANTAN 4.80 36.65 7.20 43.83 3.40 18.54 8.70 63.34 8.80 33.28 MELAKA 14.80 58.80 30.14 134.73 36.42 261.99 44.36 319.08 14.42 425.13 NEGERI SEMBILAN 258.40 2,484.71 310.74 2,525.97 271.80 1,657.51 239.55 1,430.32 142.32 806.19 PAHANG 138.84 800.66 169.20 1,017.96 175.21 1,178.30 181.82 970.80 166.22 1,048.31 PERAK 232.61 2,738.39 136.89 2,487.33 146.64 2,155.98 136.28 2,482.20 152.84 2,861.62 PERLIS 0.72 5.76 0.72 8.07 0.72 5.11 0.70 0.50 0.29 1.35 PULAU PINANG 36.36 173.10 19.55 146.17 9.48 81.16 11.74 83.05 7.15 59.68 SELANGOR 47.00 373.60 34.15 218.52 60.44 394.07 54.63 301.08 32.90 376.48 TERENGGANU 4.60 108.69 4.00 104.20 5.50 36.52 4.20 78.22 - -
SEM. MALAYSIAPeninsular Malaysia
SABAH 148.30 885.00 155.20 964.40 145.20 789.10 137.70 712.10 136.00 741.80 SARAWAK 163.60 1,212.70 166.50 877.70 167.45 882.82 177.50 850.90 178.20 847.60 WP LABUAN 1.12 3.26 0.76 1.14 0.76 1.17 0.30 1.20 0.10 3.30
MALAYSIA TIMUREast MalaysiaMALAYSIA 1,379.66 12,244.52 1,463.08 12,954.21 1,409.86 10,053.22 1,574.51 11,396.94 1,559.77 14,142.89
1,245.47 12,550.19
JADUAL 6 : DATA SIRI MASA KELUASAN DAN PENGELUARAN REMPAH-RATUS MENGIKUT NEGERI, MALAYSIA, 2013-2017 (sambungan)
313.41 1,673.09 315.50 1,564.20 314.30 1,592.70
1,259.01 9,832.74
Table 6 : Time Series Data on Hectarage and Production of Spices by State, Malaysia, 2013-2017 (continued)
NEGERI
Limau KasturiCalamondin Lime
2013 2014 2015 2016 2017 State
1,066.64 10,143.56 1,140.62 11,110.97 1,096.45 8,380.13
313.02 2,100.96 322.46 1,843.24

107
Luas Bertanam Pengeluaran Luas Bertanam Pengeluaran Luas Bertanam Pengeluaran Luas Bertanam Pengeluaran Luas Bertanam PengeluaranPlanted area Production Planted area Production Planted area Production Planted area Production Planted area Production
(Ha) (Mt) (Ha) (Mt) (Ha) (Mt) (Ha) (Mt) (Ha) (Mt)
JOHOR 108.64 959.99 78.50 396.37 88.60 703.53 99.10 506.29 141.20 1,056.58 KEDAH 33.98 90.53 26.93 110.53 80.23 423.29 116.20 327.22 122.86 364.53 KELANTAN 260.15 3,595.58 146.41 1,762.28 165.01 1,544.82 146.05 1,615.16 215.52 1,210.31 MELAKA 7.01 37.86 8.32 29.58 8.21 18.17 15.32 112.72 6.03 77.75 NEGERI SEMBILAN 131.96 432.12 70.43 548.56 53.50 303.71 28.42 248.12 117.66 297.81 PAHANG 395.05 1,983.08 399.22 2,370.87 374.98 2,267.16 577.99 2,566.20 491.79 1,871.61 PERAK 162.79 1,068.86 118.66 1,087.20 88.27 807.71 103.86 867.11 84.48 534.31 PERLIS - - - - - - - - - - PULAU PINANG 3.30 22.64 2.44 20.37 1.75 4.50 0.65 3.27 0.25 0.46 SELANGOR 95.98 793.54 43.74 556.22 69.54 1,017.12 20.59 167.44 89.82 1,037.38 TERENGGANU 38.75 249.19 23.62 288.70 34.20 218.41 35.26 443.07 37.36 292.44
SEM. MALAYSIAPeninsular Malaysia
SABAH 31.60 26.60 30.60 149.70 27.40 117.10 24.60 62.00 21.20 65.00 SARAWAK 40.40 33.40 40.30 156.80 42.83 161.66 42.50 153.20 42.50 152.80 WP LABUAN - - - - - - - - - -
MALAYSIA TIMUREast MalaysiaMALAYSIA 1,309.61 9,293.39 989.17 7,477.17 1,034.52 7,587.16 1,210.54 7,071.79 1,370.67 6,960.98
2014 2015 2016
Table 6 : Time Series Data on Hectarage and Production of Spices by State, Malaysia, 2013-2017 (continued)
NEGERI
Limau NipisLime
JADUAL 6 : DATA SIRI MASA KELUASAN DAN PENGELUARAN REMPAH-RATUS MENGIKUT NEGERI, MALAYSIA, 2013-2017 (sambungan)
State
6,743.18
2017
1,143.44 6,856.59 1,306.97 1,237.61 9,233.39 918.27 7,170.67 964.29
2013
7,308.40
217.80 72.00 60.00 70.90 306.50 70.23 278.76 67.10 215.20 63.70
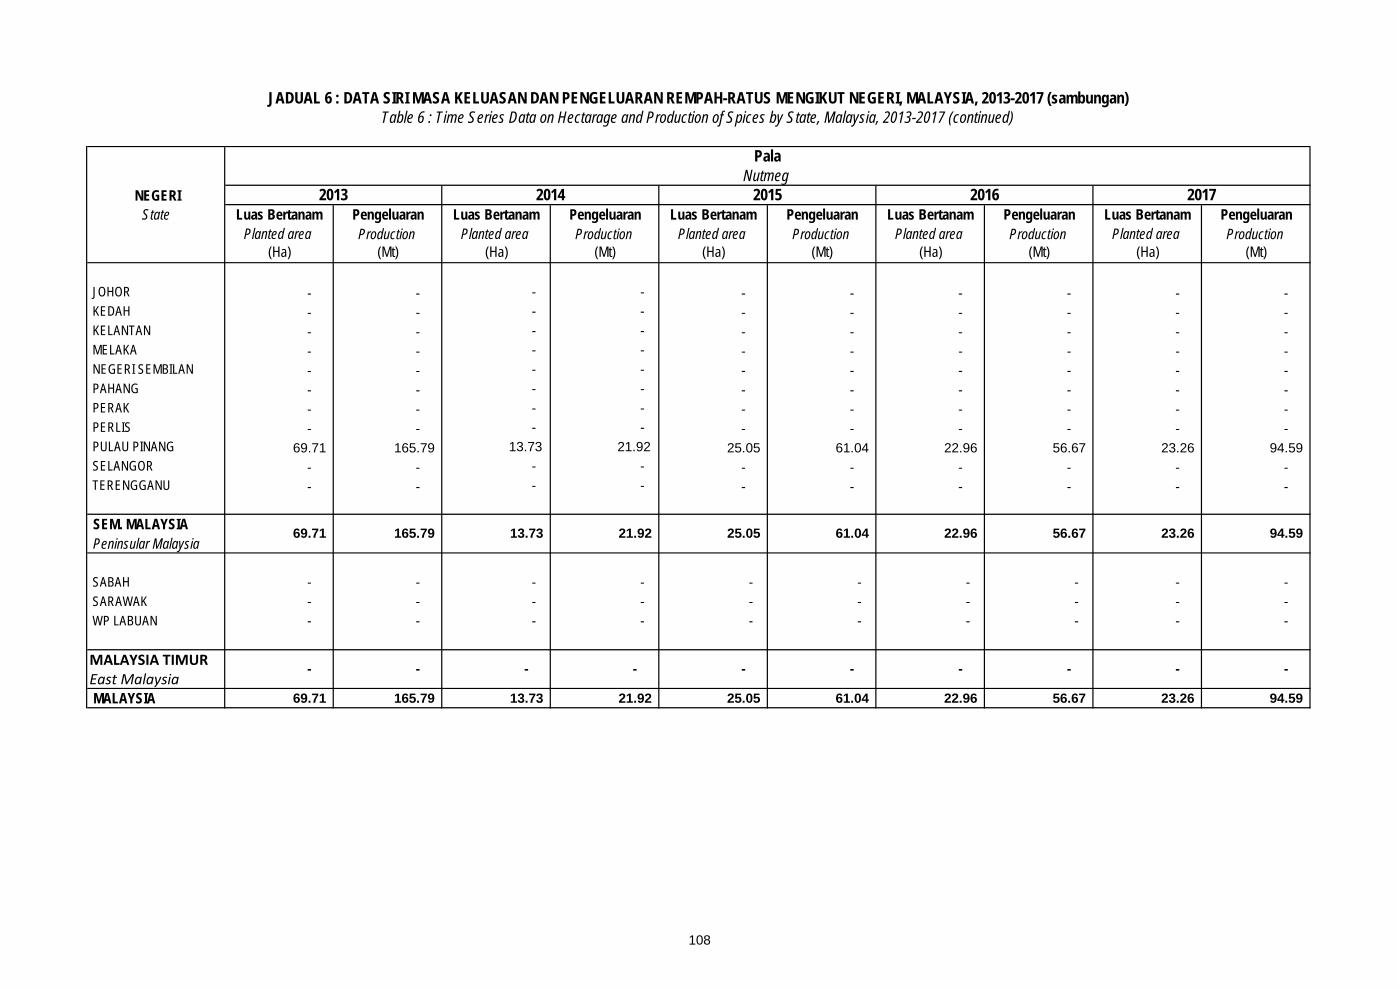
108
Luas Bertanam Pengeluaran Luas Bertanam Pengeluaran Luas Bertanam Pengeluaran Luas Bertanam Pengeluaran Luas Bertanam PengeluaranPlanted area Production Planted area Production Planted area Production Planted area Production Planted area Production
(Ha) (Mt) (Ha) (Mt) (Ha) (Mt) (Ha) (Mt) (Ha) (Mt)
JOHOR - - - - - - - - - - KEDAH - - - - - - - - - - KELANTAN - - - - - - - - - - MELAKA - - - - - - - - - - NEGERI SEMBILAN - - - - - - - - - - PAHANG - - - - - - - - - - PERAK - - - - - - - - - - PERLIS - - - - - - - - - - PULAU PINANG 69.71 165.79 13.73 21.92 25.05 61.04 22.96 56.67 23.26 94.59 SELANGOR - - - - - - - - - - TERENGGANU - - - - - - - - - -
SEM. MALAYSIAPeninsular Malaysia
SABAH - - - - - - - - - - SARAWAK - - - - - - - - - - WP LABUAN - - - - - - - - - -
MALAYSIA TIMUREast MalaysiaMALAYSIA 69.71 165.79 13.73 21.92 25.05 61.04 22.96 56.67 23.26 94.59
JADUAL 6 : DATA SIRI MASA KELUASAN DAN PENGELUARAN REMPAH-RATUS MENGIKUT NEGERI, MALAYSIA, 2013-2017 (sambungan)Table 6 : Time Series Data on Hectarage and Production of Spices by State, Malaysia, 2013-2017 (continued)
NEGERI
PalaNutmeg
2013 2014 2015 2016 2017 State
69.71 165.79 13.73 21.92
- - - -
61.04 22.96 56.67 23.26 94.59
-
25.05
- - - - -

109
Luas Bertanam Pengeluaran Luas Bertanam Pengeluaran Luas Bertanam Pengeluaran Luas Bertanam Pengeluaran Luas Bertanam PengeluaranPlanted area Production Planted area Production Planted area Production Planted area Production Planted area Production
(Ha) (Mt) (Ha) (Mt) (Ha) (Mt) (Ha) (Mt) (Ha) (Mt)
JOHOR 270.05 4,771.30 473.18 7,496.25 435.62 6,058.81 347.41 3,759.67 590.67 5,118.23 KEDAH 64.48 271.50 160.39 1,110.05 141.23 1,071.07 205.83 731.17 194.47 546.12 KELANTAN 141.76 1,144.63 119.50 971.06 72.04 676.50 55.40 450.07 84.90 655.61 MELAKA 44.95 387.66 54.32 687.79 73.09 1,003.40 70.66 773.32 56.77 681.48 NEGERI SEMBILAN 188.05 2,201.00 116.27 1,354.11 100.45 1,343.54 126.70 1,368.13 116.42 1,475.91 PAHANG 169.68 1,224.85 249.63 1,989.79 388.93 3,694.27 366.70 2,326.36 443.95 2,347.38 PERAK 30.87 230.35 55.05 788.43 39.49 527.54 60.16 606.16 56.99 571.65 PERLIS - - - - - - - - - - PULAU PINANG 1.70 16.89 3.20 40.85 7.69 90.76 7.95 95.72 8.04 122.79 SELANGOR 107.86 1,327.35 33.80 165.40 106.30 1,285.04 136.09 887.84 72.72 782.26 TERENGGANU 57.89 369.23 46.50 343.47 71.53 381.00 113.50 574.57 125.60 813.34
SEM. MALAYSIAPeninsular Malaysia
SABAH 64.50 588.40 53.40 520.40 58.80 335.30 61.10 618.80 63.70 556.90 SARAWAK - - - - - - - - - - WP LABUAN 5.80 7.14 5.80 6.50 1.05 3.00 1.80 2.32 3.80 2.50
MALAYSIA TIMUREast MalaysiaMALAYSIA 1,147.59 12,540.30 1,371.04 15,474.11 1,496.22 16,470.22 1,553.30 12,194.12 1,818.03 13,674.17
70.30 595.54 59.20 526.90 59.85 338.30 62.90 621.12 67.50 559.40
JADUAL 6 : DATA SIRI MASA KELUASAN DAN PENGELUARAN REMPAH-RATUS MENGIKUT NEGERI, MALAYSIA, 2013-2017 (sambungan)Table 6 : Time Series Data on Hectarage and Production of Spices by State, Malaysia, 2013-2017 (continued)
NEGERI State
11,944.76 1,311.84 14,947.21 1,436.37
SeraiLemon Grass
2013 2014 2015
16,131.92 1,077.29 1,490.40 11,573.01 1,750.53 13,114.77
2016 2017
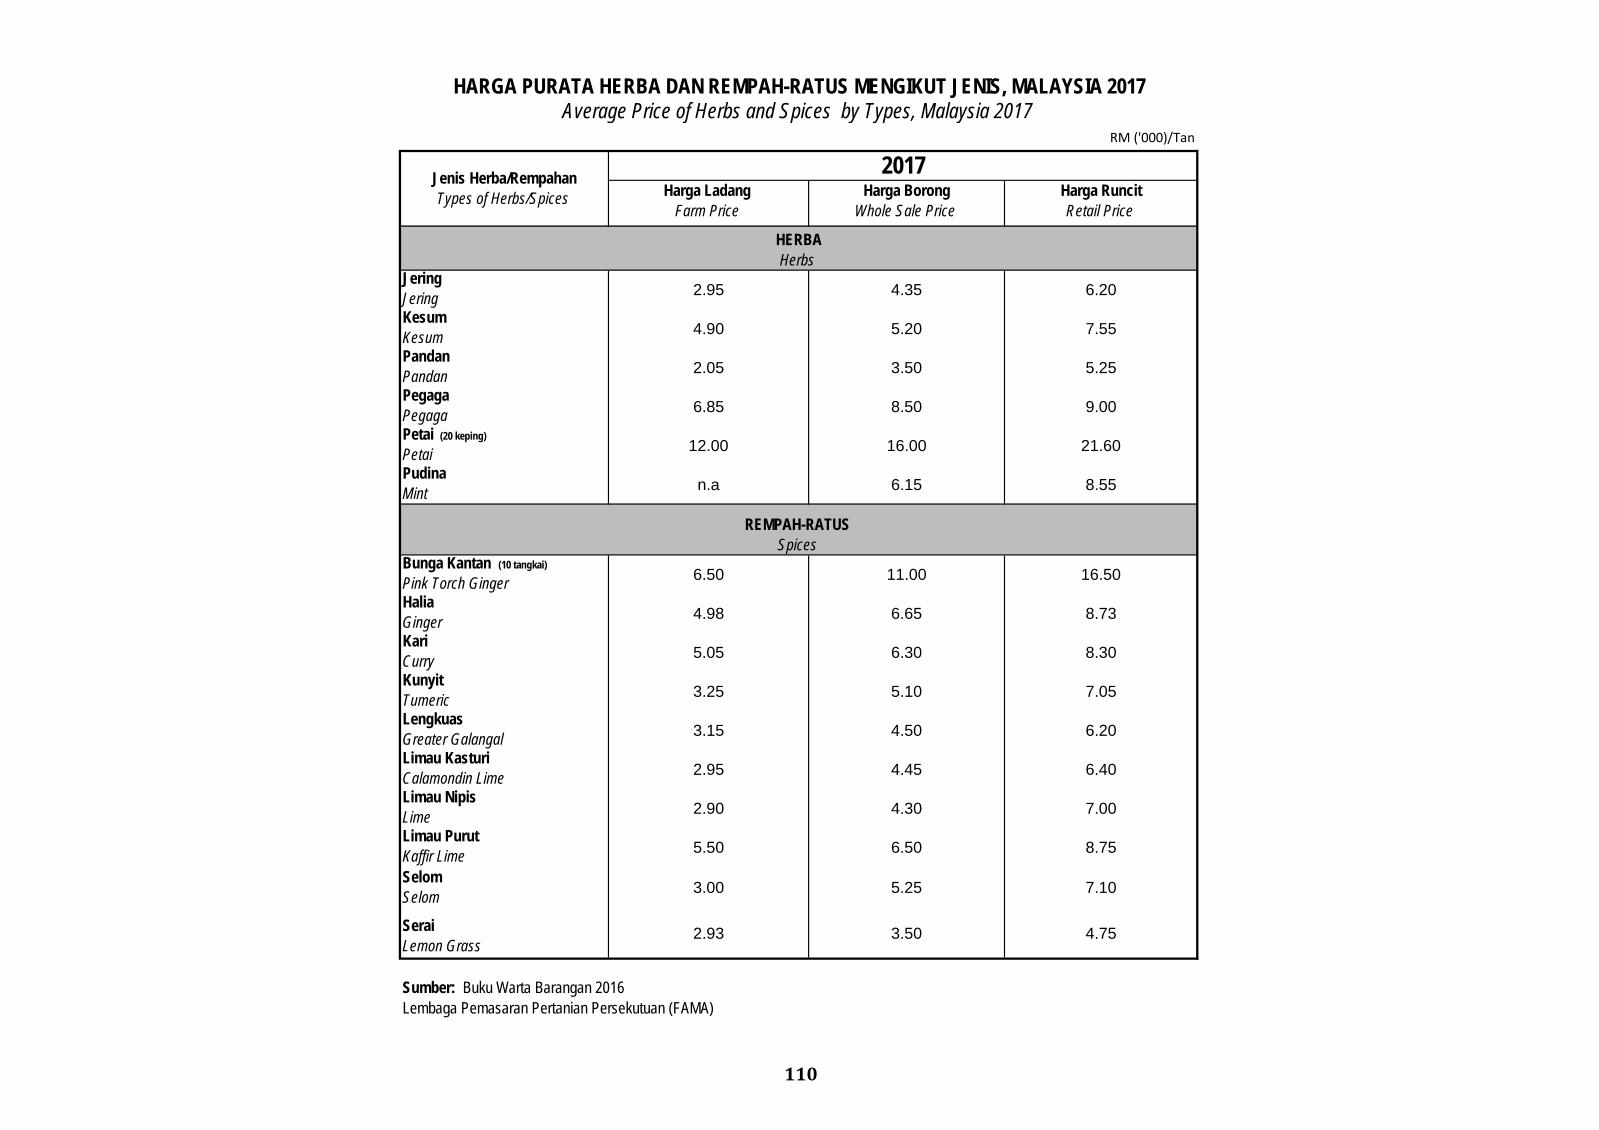
110
RM ('000)/Tan
Harga Ladang Farm Price
Harga Borong Whole Sale Price
Harga Runcit Retail Price
Jering Jering 2.95 4.35 6.20
Kesum Kesum 4.90 5.20 7.55
Pandan Pandan 2.05 3.50 5.25
Pegaga Pegaga 6.85 8.50 9.00
Petai (20 keping)
Petai 12.00 16.00 21.60
Pudina Mint n.a 6.15 8.55
Bunga Kantan (10 tangkai)
Pink Torch Ginger 6.50 11.00 16.50
Halia Ginger 4.98 6.65 8.73
Kari Curry 5.05 6.30 8.30
Kunyit Tumeric 3.25 5.10 7.05
Lengkuas Greater Galangal 3.15 4.50 6.20
Limau Kasturi Calamondin Lime 2.95 4.45 6.40
Limau Nipis Lime 2.90 4.30 7.00
Limau Purut Kaffir Lime 5.50 6.50 8.75
Selom Selom 3.00 5.25 7.10
Serai Lemon Grass
2.93 3.50 4.75
HERBA Herbs
REMPAH-RATUS Spices
Sumber: Buku Warta Barangan 2016 Lembaga Pemasaran Pertanian Persekutuan (FAMA)
HARGA PURATA HERBA DAN REMPAH-RATUS MENGIKUT JENIS, MALAYSIA 2017Average Price of Herbs and Spices by Types, Malaysia 2017
Jenis Herba/Rempahan Types of Herbs/Spices
2017
SUMBER RUJUKAN Source Of References
Sumber Rujukan Source of References
1. Lembaga Pemasaran Pertanian Persekutuan (FAMA)
- Warta Barangan – Tahun 2017