INTEGRATION OF MAHALANOBIS-TAGUCHI SYSTEM AND ACTIVITY BASED COSTING...
20
INTEGRATION OF MAHALANOBIS-TAGUCHI SYSTEM AND ACTIVITY BASED COSTING IN DECISION MAKING FOR REMANUFACTURING MOHD YAZID BIN ABU UNIVERSITI TEKNOLOGI MALAYSIA
Transcript of INTEGRATION OF MAHALANOBIS-TAGUCHI SYSTEM AND ACTIVITY BASED COSTING...
INTEGRATION OF MAHALANOBIS-TAGUCHI SYSTEM AND
ACTIVITY BASED COSTING IN DECISION MAKING FOR
REMANUFACTURING
MOHD YAZID BIN ABU
UNIVERSITI TEKNOLOGI MALAYSIA
BAHAGIAN A – Pengesahan Kerjasama* Adalah disahkan bahawa projek penyelidikan tesis ini telah dilaksanakan melalui kerjasama antara
_______________________ dengan _______________________
Disahkan oleh:
Tandatangan : Tarikh :
Nama :
Jawatan :
(Cop rasmi) * Jika penyediaan tesis/projek melibatkan kerjasama.
BAHAGIAN B – Untuk Kegunaan Pejabat Sekolah Pengajian Siswazah Tesis ini telah diperiksa dan diakui oleh: Nama dan Alamat Pemeriksa Luar : Prof. Dr. Shamsuddin bin Sulaiman
Dept of Mechanical and Manufacturing Engineering
Faculty of Engineering
Universiti Putra Malaysia
43400 Serdang
Selangor
Nama dan Alamat Pemeriksa Dalam : Prof. Madya Dr. Izman bin Sudin
Fakulti Kejuruteraan Mekanikal
UTM Johor Bahru
Disahkan oleh Timbalan Pendaftar di Sekolah Pengajian Siswazah: Tandatangan : Tarikh :
Nama : ASRAM BIN SULAIMAN @ SAIM
INTEGRATION OF MAHALANOBIS-TAGUCHI SYSTEM AND
ACTIVITY BASED COSTING IN DECISION MAKING FOR
REMANUFACTURING
MOHD YAZID BIN ABU
A thesis submitted in fulfilment of the
requirements for the award of the degree of
Doctor of Philosophy (Mechanical Engineering)
Faculty of Mechanical Engineering
Universiti Teknologi Malaysia
JANUARY 2016
vii
TABLE OF CONTENTS
CHAPTER TITLE PAGE
DECLARATION ii
DEDICATION iii
ACKNOWLEDGEMENT iv
ABSTRACT v
ABSTRAK vi
TABLE OF CONTENTS vii
LIST OF TABLES xi
LIST OF FIGURES xiv
LIST OF ABBREVIATIONS xviii
LIST OF APPENDICES xx
1 INTRODUCTION 1
1.1 Background of the Research 1
1.2 Problem Statement 4
1.3 Research Objectives 5
1.4 Research Scopes 5
1.5 Significance of Research 6
1.6 Organization of Thesis 6
2 LITERATURE REVIEW 8
2.1 Introduction 8
2.2 History of Remanufacturing 8
2.3 Definitions of Remanufacturing 9
2.3.1 Differences between Recycling, Repairing,
Reconditioning and remanufacturing 10
2.3.2 Process of Remanufacturing 11
2.3.3 Advantages of Remanufacturing 12
viii
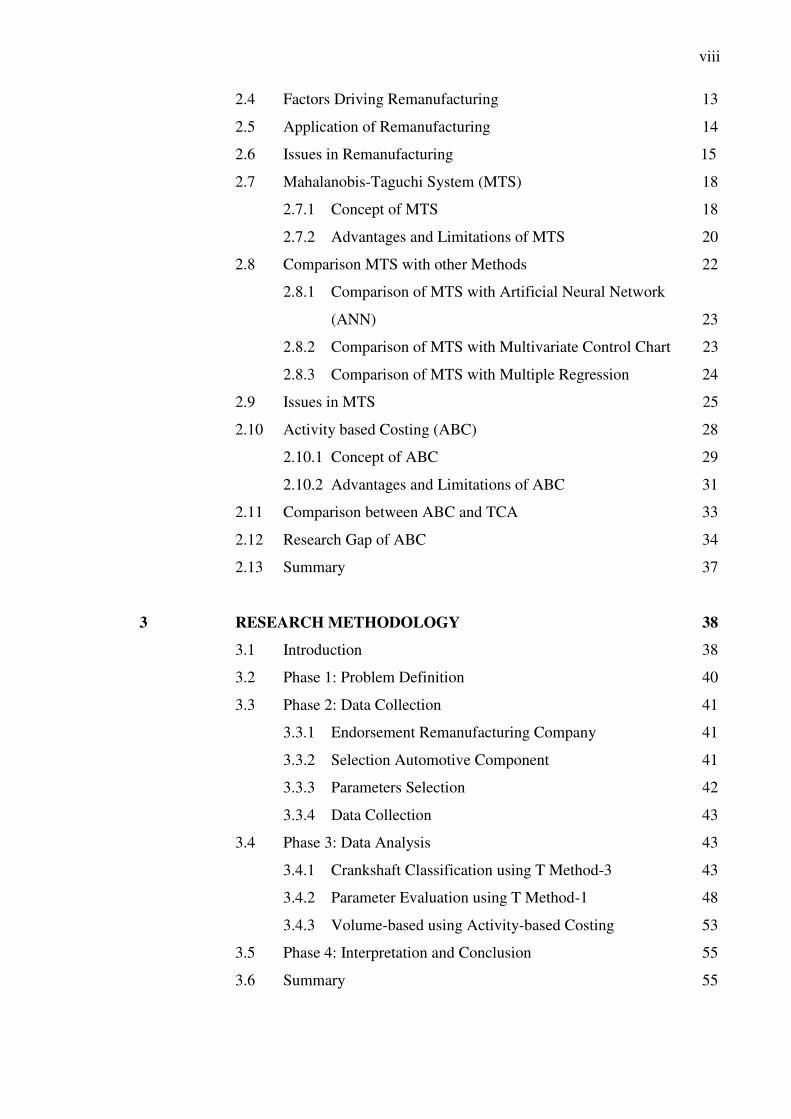
2.4 Factors Driving Remanufacturing 13
2.5 Application of Remanufacturing 14
2.6 Issues in Remanufacturing 15
2.7 Mahalanobis-Taguchi System (MTS) 18
2.7.1 Concept of MTS 18
2.7.2 Advantages and Limitations of MTS 20
2.8 Comparison MTS with other Methods 22
2.8.1 Comparison of MTS with Artificial Neural Network
(ANN) 23
2.8.2 Comparison of MTS with Multivariate Control Chart 23
2.8.3 Comparison of MTS with Multiple Regression 24
2.9 Issues in MTS 25
2.10 Activity based Costing (ABC) 28
2.10.1 Concept of ABC 29
2.10.2 Advantages and Limitations of ABC 31
2.11 Comparison between ABC and TCA 33
2.12 Research Gap of ABC 34
2.13 Summary 37
3 RESEARCH METHODOLOGY 38
3.1 Introduction 38
3.2 Phase 1: Problem Definition 40
3.3 Phase 2: Data Collection 41
3.3.1 Endorsement Remanufacturing Company 41
3.3.2 Selection Automotive Component 41
3.3.3 Parameters Selection 42
3.3.4 Data Collection 43
3.4 Phase 3: Data Analysis 43
3.4.1 Crankshaft Classification using T Method-3 43
3.4.2 Parameter Evaluation using T Method-1 48
3.4.3 Volume-based using Activity-based Costing 53
3.5 Phase 4: Interpretation and Conclusion 55
3.6 Summary 55
ix
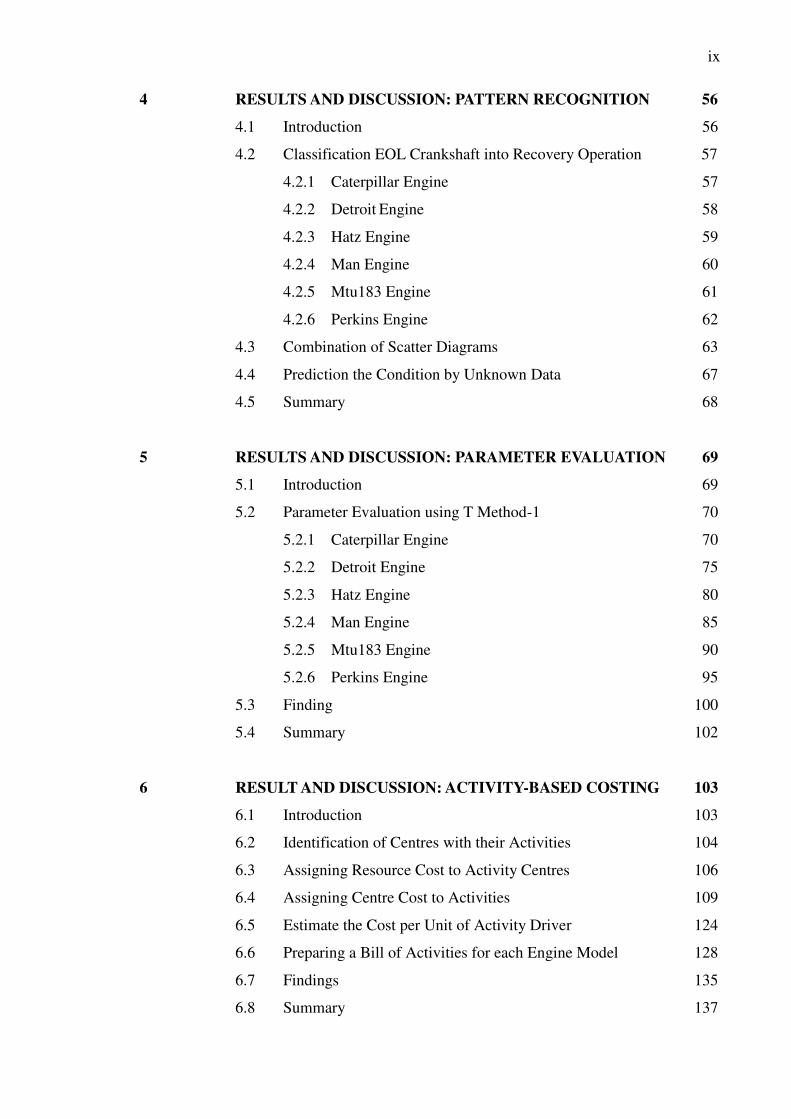
4 RESULTS AND DISCUSSION: PATTERN RECOGNITION 56
4.1 Introduction 56
4.2 Classification EOL Crankshaft into Recovery Operation 57
4.2.1 Caterpillar Engine 57
4.2.2 Detroit Engine 58
4.2.3 Hatz Engine 59
4.2.4 Man Engine 60
4.2.5 Mtu183 Engine 61
4.2.6 Perkins Engine 62
4.3 Combination of Scatter Diagrams 63
4.4 Prediction the Condition by Unknown Data 67
4.5 Summary 68
5 RESULTS AND DISCUSSION: PARAMETER EVALUATION 69
5.1 Introduction 69
5.2 Parameter Evaluation using T Method-1 70
5.2.1 Caterpillar Engine 70
5.2.2 Detroit Engine 75
5.2.3 Hatz Engine 80
5.2.4 Man Engine 85
5.2.5 Mtu183 Engine 90
5.2.6 Perkins Engine 95
5.3 Finding 100
5.4 Summary 102
6 RESULT AND DISCUSSION: ACTIVITY-BASED COSTING 103
6.1 Introduction 103
6.2 Identification of Centres with their Activities 104
6.3 Assigning Resource Cost to Activity Centres 106
6.4 Assigning Centre Cost to Activities 109
6.5 Estimate the Cost per Unit of Activity Driver 124
6.6 Preparing a Bill of Activities for each Engine Model 128
6.7 Findings 135
6.8 Summary 137
x
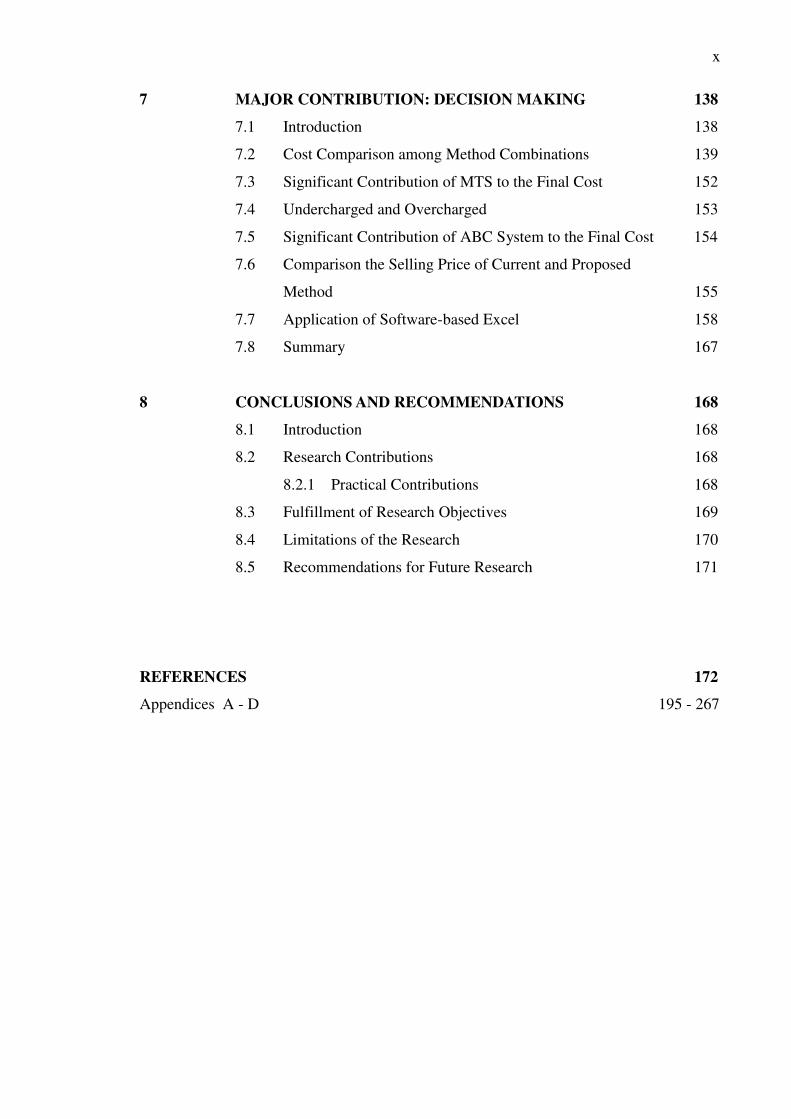
7 MAJOR CONTRIBUTION: DECISION MAKING 138
7.1 Introduction 138
7.2 Cost Comparison among Method Combinations 139
7.3 Significant Contribution of MTS to the Final Cost 152
7.4 Undercharged and Overcharged 153
7.5 Significant Contribution of ABC System to the Final Cost 154
7.6 Comparison the Selling Price of Current and Proposed
Method 155
7.7 Application of Software-based Excel 158
7.8 Summary 167
8 CONCLUSIONS AND RECOMMENDATIONS 168
8.1 Introduction 168
8.2 Research Contributions 168
8.2.1 Practical Contributions 168
8.3 Fulfillment of Research Objectives 169
8.4 Limitations of the Research 170
8.5 Recommendations for Future Research 171
REFERENCES 172
Appendices A - D 195 - 267
xi
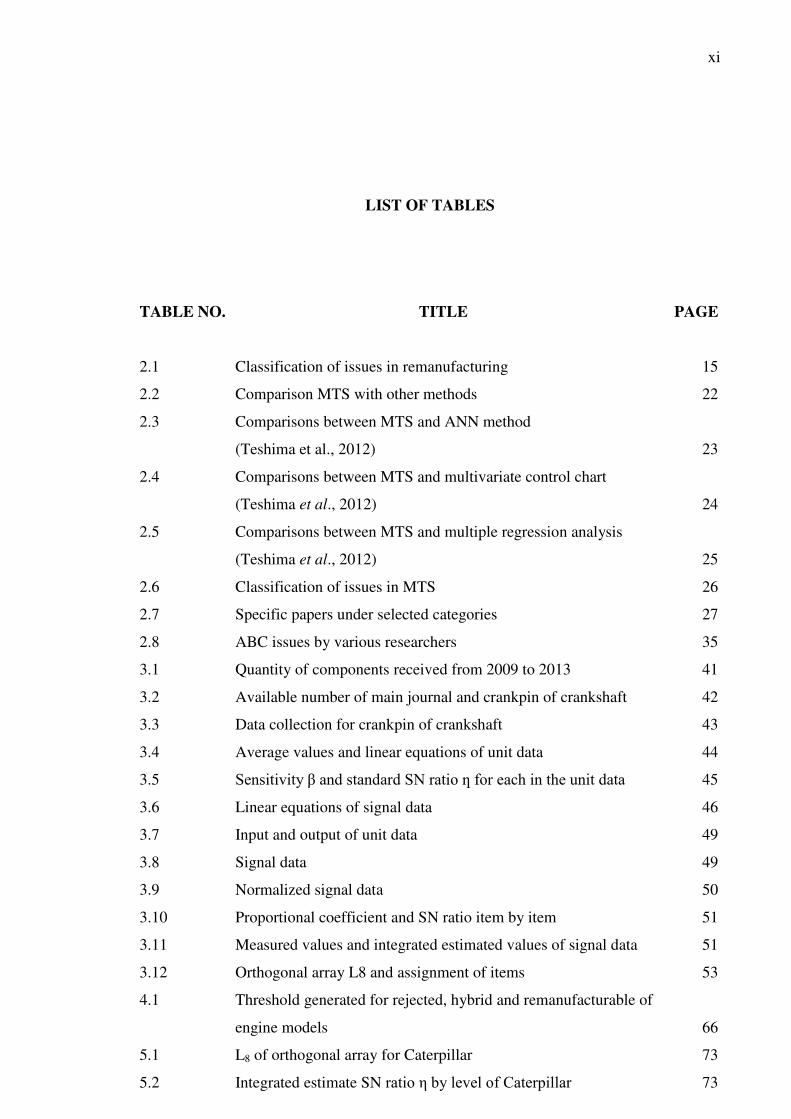
LIST OF TABLES
TABLE NO. TITLE PAGE
2.1 Classification of issues in remanufacturing 15
2.2 Comparison MTS with other methods 22
2.3 Comparisons between MTS and ANN method
(Teshima et al., 2012) 23
2.4 Comparisons between MTS and multivariate control chart
(Teshima et al., 2012) 24
2.5 Comparisons between MTS and multiple regression analysis
(Teshima et al., 2012) 25
2.6 Classification of issues in MTS 26
2.7 Specific papers under selected categories 27
2.8 ABC issues by various researchers 35
3.1 Quantity of components received from 2009 to 2013 41
3.2 Available number of main journal and crankpin of crankshaft 42
3.3 Data collection for crankpin of crankshaft 43
3.4 Average values and linear equations of unit data 44
3.5 Sensitivity β and standard SN ratio ƞ for each in the unit data 45
3.6 Linear equations of signal data 46
3.7 Input and output of unit data 49
3.8 Signal data 49
3.9 Normalized signal data 50
3.10 Proportional coefficient and SN ratio item by item 51
3.11 Measured values and integrated estimated values of signal data 51
3.12 Orthogonal array L8 and assignment of items 53
4.1 Threshold generated for rejected, hybrid and remanufacturable of
engine models 66
5.1 L8 of orthogonal array for Caterpillar 73
5.2 Integrated estimate SN ratio η by level of Caterpillar 73
xii
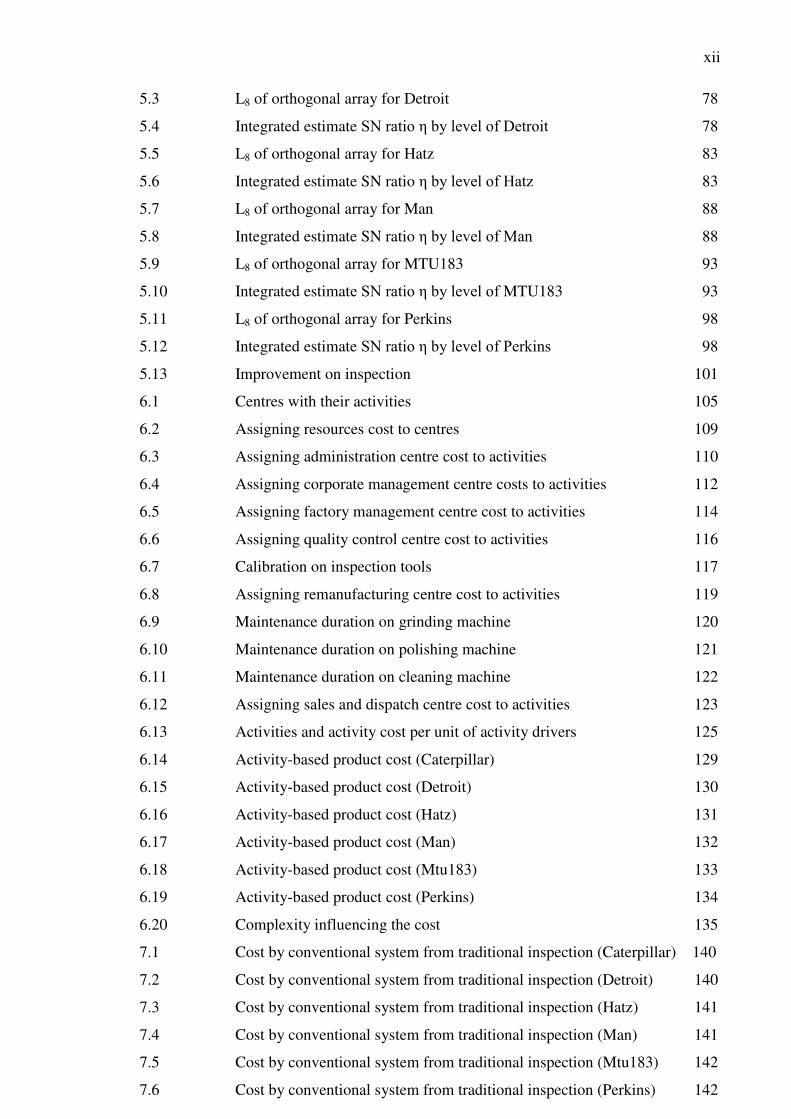
5.3 L8 of orthogonal array for Detroit 78
5.4 Integrated estimate SN ratio η by level of Detroit 78
5.5 L8 of orthogonal array for Hatz 83
5.6 Integrated estimate SN ratio η by level of Hatz 83
5.7 L8 of orthogonal array for Man 88
5.8 Integrated estimate SN ratio η by level of Man 88
5.9 L8 of orthogonal array for MTU183 93
5.10 Integrated estimate SN ratio η by level of MTU183 93
5.11 L8 of orthogonal array for Perkins 98
5.12 Integrated estimate SN ratio η by level of Perkins 98
5.13 Improvement on inspection 101
6.1 Centres with their activities 105
6.2 Assigning resources cost to centres 109
6.3 Assigning administration centre cost to activities 110
6.4 Assigning corporate management centre costs to activities 112
6.5 Assigning factory management centre cost to activities 114
6.6 Assigning quality control centre cost to activities 116
6.7 Calibration on inspection tools 117
6.8 Assigning remanufacturing centre cost to activities 119
6.9 Maintenance duration on grinding machine 120
6.10 Maintenance duration on polishing machine 121
6.11 Maintenance duration on cleaning machine 122
6.12 Assigning sales and dispatch centre cost to activities 123
6.13 Activities and activity cost per unit of activity drivers 125
6.14 Activity-based product cost (Caterpillar) 129
6.15 Activity-based product cost (Detroit) 130
6.16 Activity-based product cost (Hatz) 131
6.17 Activity-based product cost (Man) 132
6.18 Activity-based product cost (Mtu183) 133
6.19 Activity-based product cost (Perkins) 134
6.20 Complexity influencing the cost 135
7.1 Cost by conventional system from traditional inspection (Caterpillar) 140
7.2 Cost by conventional system from traditional inspection (Detroit) 140
7.3 Cost by conventional system from traditional inspection (Hatz) 141
7.4 Cost by conventional system from traditional inspection (Man) 141
7.5 Cost by conventional system from traditional inspection (Mtu183) 142
7.6 Cost by conventional system from traditional inspection (Perkins) 142
xiii
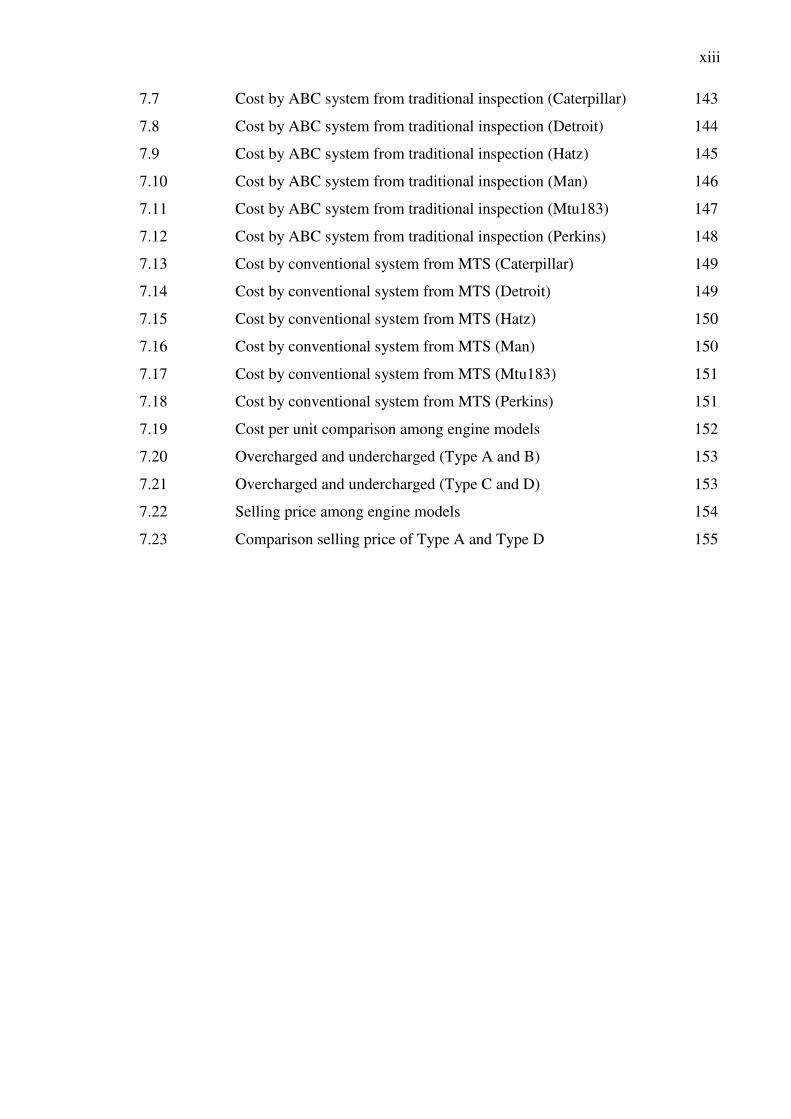
7.7 Cost by ABC system from traditional inspection (Caterpillar) 143
7.8 Cost by ABC system from traditional inspection (Detroit) 144
7.9 Cost by ABC system from traditional inspection (Hatz) 145
7.10 Cost by ABC system from traditional inspection (Man) 146
7.11 Cost by ABC system from traditional inspection (Mtu183) 147
7.12 Cost by ABC system from traditional inspection (Perkins) 148
7.13 Cost by conventional system from MTS (Caterpillar) 149
7.14 Cost by conventional system from MTS (Detroit) 149
7.15 Cost by conventional system from MTS (Hatz) 150
7.16 Cost by conventional system from MTS (Man) 150
7.17 Cost by conventional system from MTS (Mtu183) 151
7.18 Cost by conventional system from MTS (Perkins) 151
7.19 Cost per unit comparison among engine models 152
7.20 Overcharged and undercharged (Type A and B) 153
7.21 Overcharged and undercharged (Type C and D) 153
7.22 Selling price among engine models 154
7.23 Comparison selling price of Type A and Type D 155
xiv
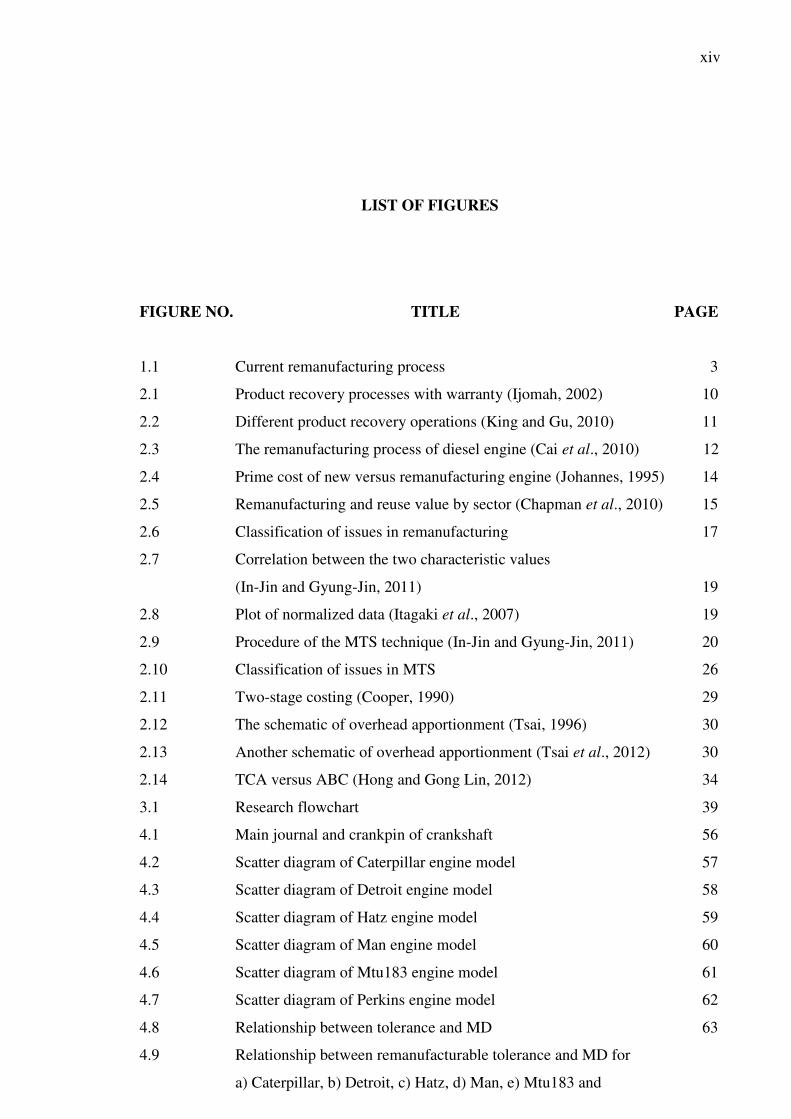
LIST OF FIGURES
FIGURE NO. TITLE PAGE
1.1 Current remanufacturing process 3
2.1 Product recovery processes with warranty (Ijomah, 2002) 10
2.2 Different product recovery operations (King and Gu, 2010) 11
2.3 The remanufacturing process of diesel engine (Cai et al., 2010) 12
2.4 Prime cost of new versus remanufacturing engine (Johannes, 1995) 14
2.5 Remanufacturing and reuse value by sector (Chapman et al., 2010) 15
2.6 Classification of issues in remanufacturing 17
2.7 Correlation between the two characteristic values
(In-Jin and Gyung-Jin, 2011) 19
2.8 Plot of normalized data (Itagaki et al., 2007) 19
2.9 Procedure of the MTS technique (In-Jin and Gyung-Jin, 2011) 20
2.10 Classification of issues in MTS 26
2.11 Two-stage costing (Cooper, 1990) 29
2.12 The schematic of overhead apportionment (Tsai, 1996) 30
2.13 Another schematic of overhead apportionment (Tsai et al., 2012) 30
2.14 TCA versus ABC (Hong and Gong Lin, 2012) 34
3.1 Research flowchart 39
4.1 Main journal and crankpin of crankshaft 56
4.2 Scatter diagram of Caterpillar engine model 57
4.3 Scatter diagram of Detroit engine model 58
4.4 Scatter diagram of Hatz engine model 59
4.5 Scatter diagram of Man engine model 60
4.6 Scatter diagram of Mtu183 engine model 61
4.7 Scatter diagram of Perkins engine model 62
4.8 Relationship between tolerance and MD 63
4.9 Relationship between remanufacturable tolerance and MD for
a) Caterpillar, b) Detroit, c) Hatz, d) Man, e) Mtu183 and
xv
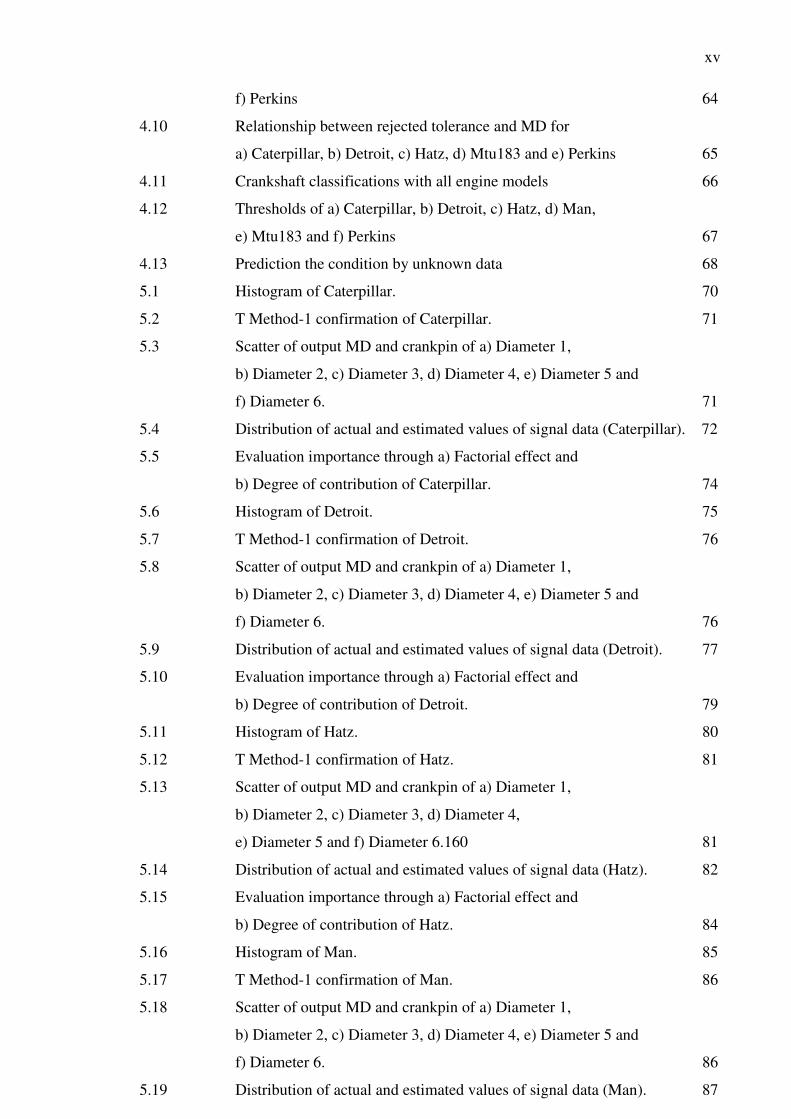
f) Perkins 64
4.10 Relationship between rejected tolerance and MD for
a) Caterpillar, b) Detroit, c) Hatz, d) Mtu183 and e) Perkins 65
4.11 Crankshaft classifications with all engine models 66
4.12 Thresholds of a) Caterpillar, b) Detroit, c) Hatz, d) Man,
e) Mtu183 and f) Perkins 67
4.13 Prediction the condition by unknown data 68
5.1 Histogram of Caterpillar. 70
5.2 T Method-1 confirmation of Caterpillar. 71
5.3 Scatter of output MD and crankpin of a) Diameter 1,
b) Diameter 2, c) Diameter 3, d) Diameter 4, e) Diameter 5 and
f) Diameter 6. 71
5.4 Distribution of actual and estimated values of signal data (Caterpillar). 72
5.5 Evaluation importance through a) Factorial effect and
b) Degree of contribution of Caterpillar. 74
5.6 Histogram of Detroit. 75
5.7 T Method-1 confirmation of Detroit. 76
5.8 Scatter of output MD and crankpin of a) Diameter 1,
b) Diameter 2, c) Diameter 3, d) Diameter 4, e) Diameter 5 and
f) Diameter 6. 76
5.9 Distribution of actual and estimated values of signal data (Detroit). 77
5.10 Evaluation importance through a) Factorial effect and
b) Degree of contribution of Detroit. 79
5.11 Histogram of Hatz. 80
5.12 T Method-1 confirmation of Hatz. 81
5.13 Scatter of output MD and crankpin of a) Diameter 1,
b) Diameter 2, c) Diameter 3, d) Diameter 4,
e) Diameter 5 and f) Diameter 6.160 81
5.14 Distribution of actual and estimated values of signal data (Hatz). 82
5.15 Evaluation importance through a) Factorial effect and
b) Degree of contribution of Hatz. 84
5.16 Histogram of Man. 85
5.17 T Method-1 confirmation of Man. 86
5.18 Scatter of output MD and crankpin of a) Diameter 1,
b) Diameter 2, c) Diameter 3, d) Diameter 4, e) Diameter 5 and
f) Diameter 6. 86
5.19 Distribution of actual and estimated values of signal data (Man). 87
xvi
5.20 Evaluation importance through a) Factorial effect and
b) Degree of contribution of Man. 89
5.21 Histogram of Mtu183. 90
5.22 T Method-1 confirmation of Mtu183. 91
5.23 Scatter of output MD and crankpin of a) Diameter 1,
b) Diameter 2, c) Diameter 3, d) Diameter 4, e) Diameter 5 and
f) Diameter 6. 91
5.24 Distribution of actual and estimated values of signal data (Mtu183). 92
5.25 Evaluation importance through a) Factorial effect and
b) Degree of contribution of Mtu183. 94
5.26 Histogram of Perkins. 95
5.27 T Method-1 confirmation of Perkins. 96
5.28 Scatter of output MD and crankpin of a) Diameter 1,
b) Diameter 2, c) Diameter 3, d) Diameter 4, e) Diameter 5 and
f) Diameter 6. 96
5.29 Distribution of actual and estimated values of signal data (Perkins). 97
5.30 Evaluation importance through a) Factorial effect and
b) Degree of contribution of Perkins. 99
5.31 Histogram and scatter diagram of a) 8 unit data,
b) 9 unit data and c) 12 unit data. 100
5.32 Quantity effect on a) Proportional coefficient β and b) SN ratio η. 101
6.1 Complexity influencing the cost 136
7.1 Combinations of method 139
7.2 Decision making situations under conventional and ABC system 157
7.3 Ranking of engine model 158
7.4 Interface with important aspects 159
7.5 Interface of pattern recognition 159
7.6 Data from user need to be analyzed 160
7.7 Result of MD value of a) unit data and b) signal data 160
7.8 Scatter diagram of a) single and b) combination 161
7.9 Interface of parameter evaluation 161
7.10 Data from user need to be analyzed 162
7.11 Output of (a) setting of US, (b) computation process and
(c) general estimation. 162
7.12 Allocation of overhead, each department and overhead categories 163
7.13 Allocation of percentage for each activity based on particular
department with their percentage of overhead types 163
xvii
7.14 Generating cost per unit of activity driver 164
7.15 Generating cost per unit of crankshaft 164
7.16 Decision either to reject or remanufacture 165
7.17 Comparing graphs of ABC system and TCA 165
7.18 Flow chart using software-based excel 166
xviii
LIST OF ABBREVIATIONS
ABC - Activity based costing
ANN - Artificial neural network
ARPA - Automotive parts rebuilders association
BPN - Back propagation neural network
CM - Cellular manufacturing
COQ - Cost of quality
DT - Decision tree
ED - Euclidian distance
EOL - End of life
EOUP - End of use product
FMIS - Farm management information system
FMS - Flexible manufacturing system
FSC - Finite state classifier
GHG - Greenhouse gases
IMQC - International management of quality control
JPJ - Jabatan Pengangkutan Jalan
LCC - Low cost country
LR - Logistic regression
LVQ - Learning vector quantization
MD - Mahalanobis distance
MTI - Motor Teknologi Industri
MTS - Mahalanobis Taguchi system
NN - Neural network
OA - Orthogonal array
OEM - Original equipment manufacturer
PAC - Preoperative assessment center
PFABC - Performance focused activity based costing
PFM - Principal feature measure
xix
R-LCS - Rote learning classifier system
SD - Signal data
SME - Small and medium enterprise
SVM - Support vector machine
TCA - Traditional costing system
TDABC - Time driven activity based costing
TPM - Traditional procurement market
TRI - The remanufacturing institute
UD - Unit data
VCRAM - Commercial rebuild vehicle association of Malaysia
VTE - Venous thromboembolism
xx
LIST OF APPENDICES
APPENDIX TITLE PAGE
A Analysis of results the pattern recognition on
crankpin diameter 195
B Analysis of results the important parameters on
crankpin diameter 221
C Coding of excel-based programming 238
D Disseminations of knowledge through publications 265