MALAYSIA PERANGKAAN PEMBUATAN BULANAN · Rakaman Bunyi Atau Video Atau PeralatanRakaman Bunyi Atau...
106
MALAYSIA PERANGKAAN PEMBUATAN BULANAN MONTHLY MANUFACTURING STATISTICS JULAI 2013 Dikeluarkan pada : 11 September 2013 Released on JABATAN PERANGKAAN MALAYSIA DEPARTMENT OF STATISTICS, MALAYSIA
Transcript of MALAYSIA PERANGKAAN PEMBUATAN BULANAN · Rakaman Bunyi Atau Video Atau PeralatanRakaman Bunyi Atau...
MALAYSIA
PERANGKAAN PEMBUATAN BULANAN
MONTHLY
MANUFACTURING STATISTICS
JULAI 2013
Dikeluarkan pada : 11 September 2013 Released on
JABATAN PERANGKAAN MALAYSIA DEPARTMENT OF STATISTICS, MALAYSIA
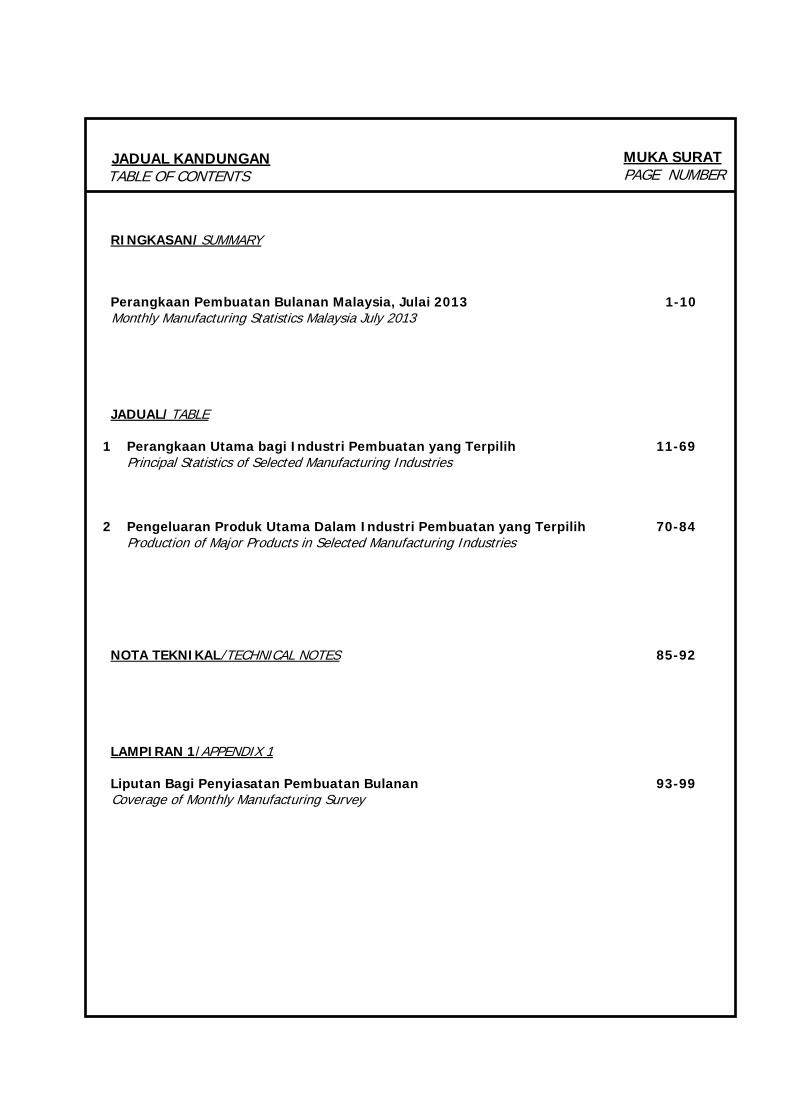
TABLE OF CONTENTS
JADUAL KANDUNGAN
PAGE NUMBER MUKA SURAT
RINGKASAN/SUMMARY
Perangkaan Pembuatan Bulanan Malaysia, Julai 2013 Monthly Manufacturing Statistics Malaysia July 2013
1-10
JADUAL/TABLE
1 Perangkaan Utama bagi Industri Pembuatan yang Terpilih Principal Statistics of Selected Manufacturing Industries
11-69
2 Pengeluaran Produk Utama Dalam Industri Pembuatan yang Terpilih Production of Major Products in Selected Manufacturing Industries
70-84
NOTA TEKNIKAL/TECHNICAL NOTES 85-92
LAMPIRAN 1/APPENDIX 1 Liputan Bagi Penyiasatan Pembuatan Bulanan Coverage of Monthly Manufacturing Survey
93-99
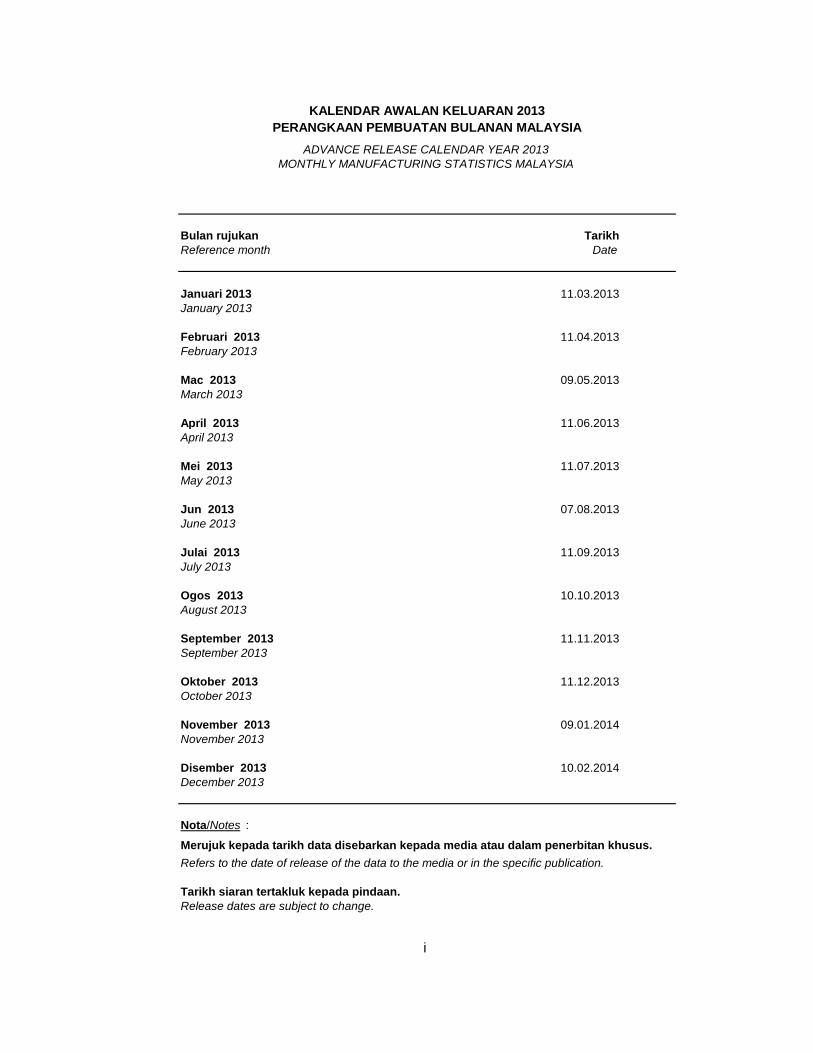
Bulan rujukan TarikhReference month Date
Januari 2013 11.03.2013January 2013
Februari 2013 11.04.2013February 2013
Mac 2013 09.05.2013March 2013
April 2013 11.06.2013April 2013
Mei 2013 11.07.2013May 2013
Jun 2013 07.08.2013June 2013
Julai 2013 11.09.2013July 2013
Ogos 2013 10.10.2013August 2013
September 2013 11.11.2013September 2013
Oktober 2013 11.12.2013October 2013
November 2013 09.01.2014November 2013
Disember 2013 10.02.2014December 2013
Nota/Notes :
Merujuk kepada tarikh data disebarkan kepada media atau dalam penerbitan khusus.Refers to the date of release of the data to the media or in the specific publication.
Tarikh siaran tertakluk kepada pindaan.Release dates are subject to change.
i
MONTHLY MANUFACTURING STATISTICS MALAYSIAADVANCE RELEASE CALENDAR YEAR 2013
PERANGKAAN PEMBUATAN BULANAN MALAYSIAKALENDAR AWALAN KELUARAN 2013
RINGKASAN
SUMMARY
PERANGKAAN PEMBUATAN BULANAN MALAYSIA, JULAI 2013*
PRESTASI BULAN JULAI 2013
1. NILAI JUALAN
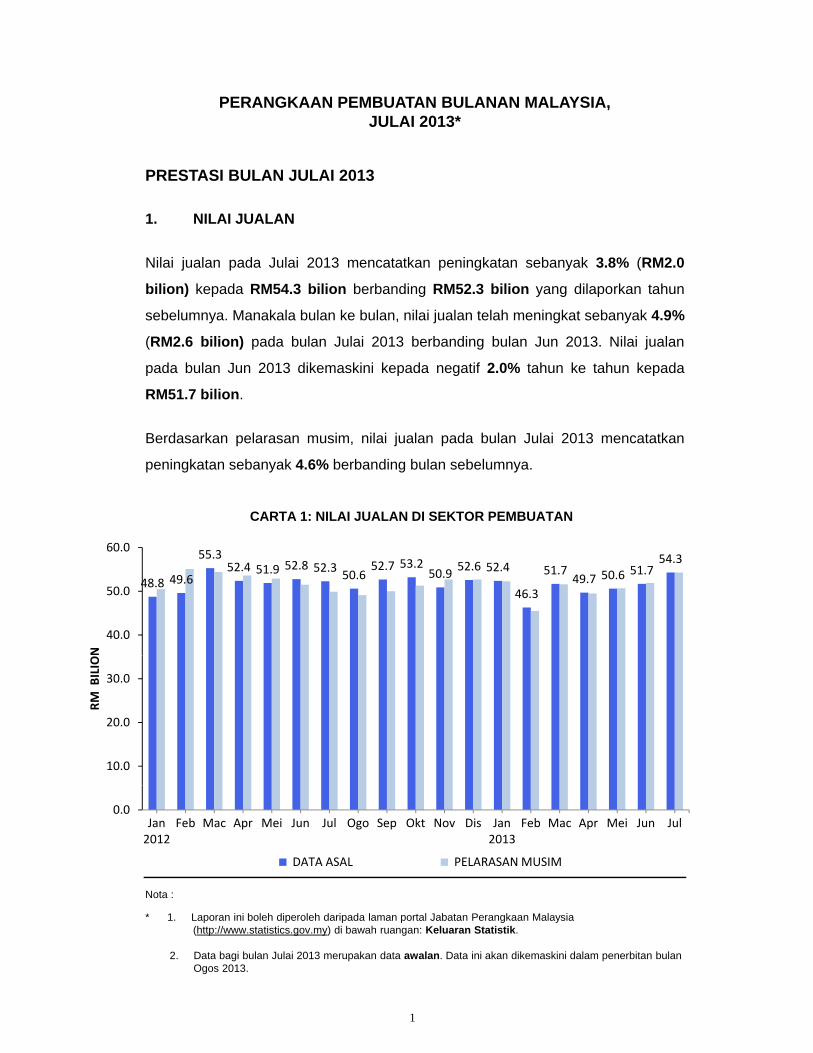
Nilai jualan pada Julai 2013 mencatatkan peningkatan sebanyak 3.8% (RM2.0Nilai jualan pada Julai 2013 mencatatkan peningkatan sebanyak 3.8% (RM2.0
bilion) kepada RM54.3 bilion berbanding RM52.3 bilion yang dilaporkan tahun
sebelumnya. Manakala bulan ke bulan, nilai jualan telah meningkat sebanyak 4.9%
(RM2.6 bilion) pada bulan Julai 2013 berbanding bulan Jun 2013. Nilai jualan
pada bulan Jun 2013 dikemaskini kepada negatif 2.0% tahun ke tahun kepada
RM51 7 bilionRM51.7 bilion.
Berdasarkan pelarasan musim, nilai jualan pada bulan Julai 2013 mencatatkan
peningkatan sebanyak 4.6% berbanding bulan sebelumnya.
CARTA 1: NILAI JUALAN DI SEKTOR PEMBUATAN
48.8 49.6
55.352.4 51.9 52.8 52.3
50.652.7 53.2
50.952.6 52.4
46.3
51.749.7 50.6 51.7
54.3
40.0
50.0
60.0
N
10.0
20.0
30.0
RM BILIO
Nota :
* 1 L i i b l h di l h d i d l t l J b t P k M l i
0.0Jan2012
Feb Mac Apr Mei Jun Jul Ogo Sep Okt Nov Dis Jan2013
Feb Mac Apr Mei Jun Jul
DATA ASAL PELARASAN MUSIM
1
* 1. Laporan ini boleh diperoleh daripada laman portal Jabatan Perangkaan Malaysia(http://www.statistics.gov.my) di bawah ruangan: Keluaran Statistik.
2. Data bagi bulan Julai 2013 merupakan data awalan. Data ini akan dikemaskini dalam penerbitan bulanOgos 2013.
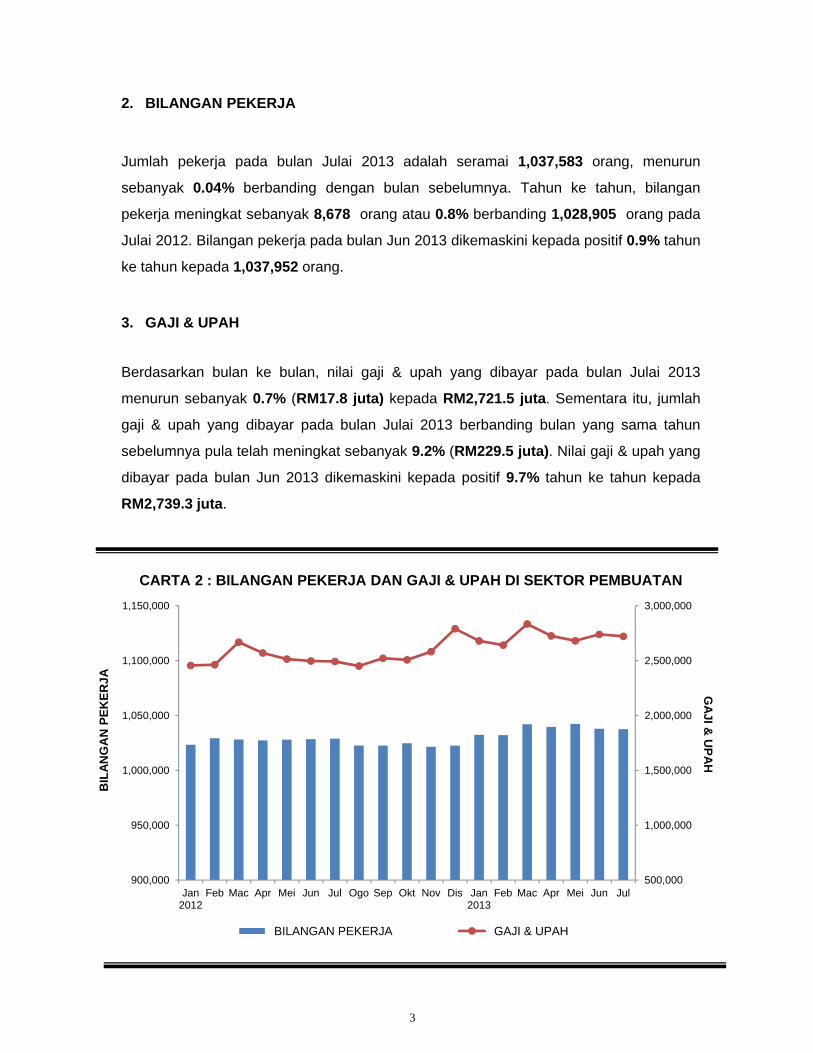
Peningkatan nilai jualan pada bulan Julai 2013 berbanding bulan yang sama tahun
sebelumnya adalah disebabkan oleh peningkatan dalam 64 daripada 116 industri
(55.2%) yang diliputi dalam penyiasatan. Jadual A dan B berikut menunjukkan lima (5)
industri utama yang mencatatkan peningkatan dan penurunan nilai jualan tahun ke
tahun.
JADUAL A : PENINGKATAN NILAI JUALAN MENGIKUT INDUSTRI PEMBUATAN (PERUBAHAN PERATUSAN DARI BULAN YANG SAMA TAHUN SEBELUMNYA)
IndustriNilai Jualan (RM juta) Peningkatan
Julai, 2012 Julai, 2013 (RM juta) %
Pembuatan Produk Petroleum Bertapis 11,204.4 12,653.1 1,448.7 12.9
Pembuatan Penerima Televisyen dan Radio, Rakaman Bunyi Atau Video Atau Peralatan 2 160 3 2 580 5 420 2 19 5Rakaman Bunyi Atau Video Atau Peralatan Rakaman Semula dan Barangan Berkaitan
2,160.3 2,580.5 420.2 19.5
Pembuatan Pemancar Televisyen dan Radio dan Peralatan Untuk Talian Telefon dan Telegraf
861.9 1,135.0 273.1 31.7
Pembuatan Injap dan Tiub Elektronik dan Papan Litar Bercetak
2,001.6 2,173.6 172.0 8.6
JADUAL B : PENURUNAN NILAI JUALAN MENGIKUT INDUSTRI PEMBUATAN(PERUBAHAN PERATUSAN DARI BULAN YANG SAMA TAHUN SEBELUMNYA)
Pembuatan Kenderaan Bermotor 1,799.0 1,967.4 168.4 9.4
IndustriNilai Jualan (RM juta) Penurunan
Julai, 2012 Julai, 2013 (RM juta) %
Pembuatan Peranti Semi-Konduktor 5,213.8 4,508.9 704.9 13.5
P b t B i A d K l li 2 201 4 1 923 7 277 7 12 6Pembuatan Besi Asas dan Keluli 2,201.4 1,923.7 277.7 12.6
Pembuatan Kimia Perindustrian Asas Lain Kecuali Baja dan Sebatian Nitrojen 2,488.9 2,313.4 175.5 7.1
Pengilangan Semula Getah dan Prosesan Susu Getah
907.6 744.6 163.0 18.0
Pembuatan Minyak dan Lemak Lain Daripada
2
Pembuatan Minyak dan Lemak Lain DaripadaSayur-Sayuran dan Haiwan Lain
493.5 361.5 132.0 26.7
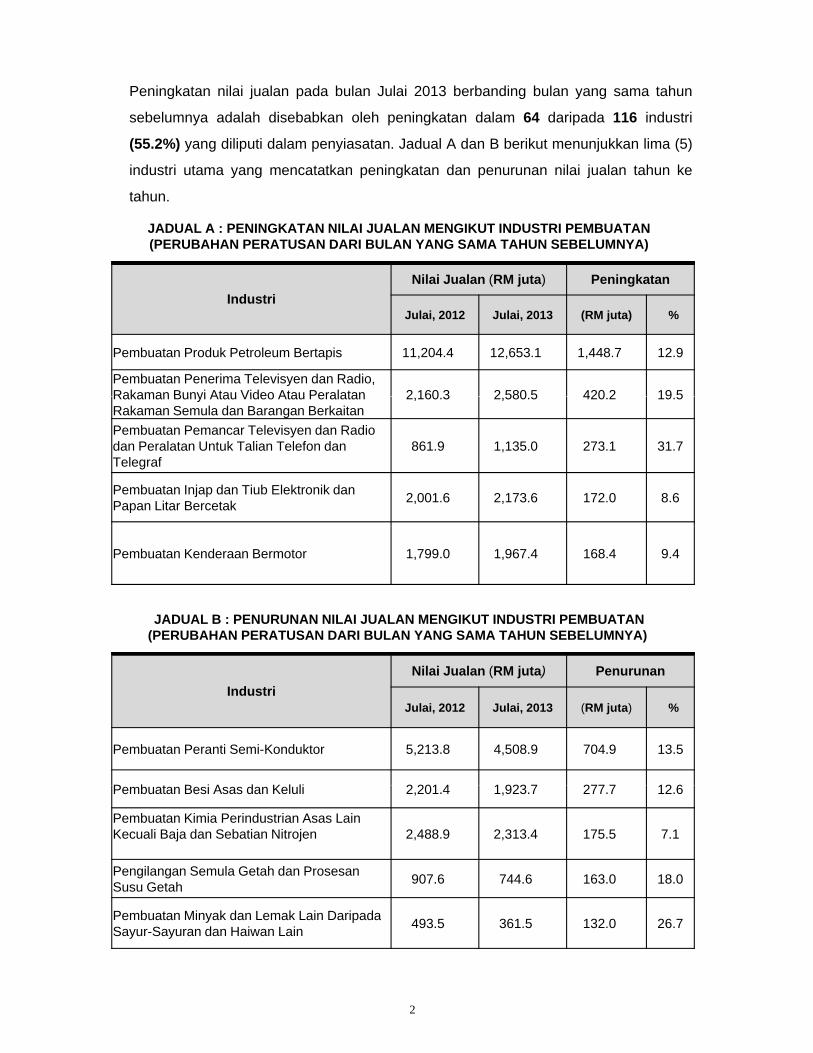
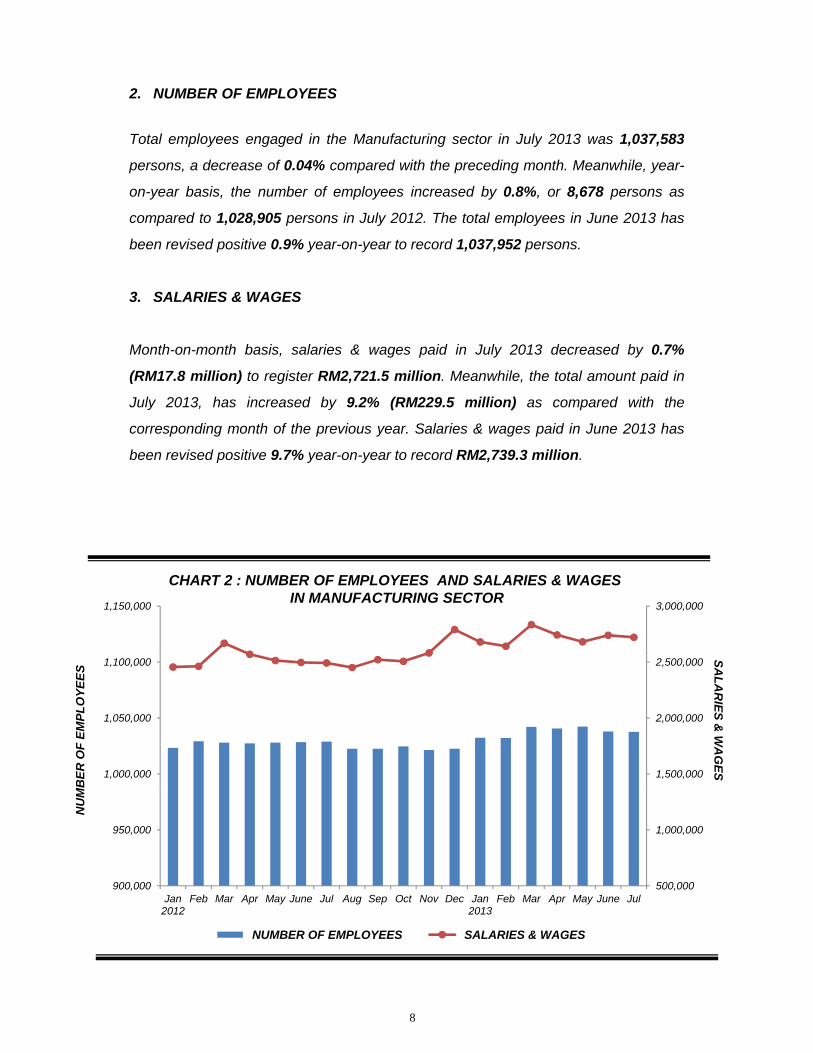
2. BILANGAN PEKERJA
Jumlah pekerja pada bulan Julai 2013 adalah seramai 1,037,583 orang, menurun
sebanyak 0.04% berbanding dengan bulan sebelumnya. Tahun ke tahun, bilangan
pekerja meningkat sebanyak 8,678 orang atau 0.8% berbanding 1,028,905 orang pada
Julai 2012. Bilangan pekerja pada bulan Jun 2013 dikemaskini kepada positif 0.9% tahun
ke tahun kepada 1 037 952 orangke tahun kepada 1,037,952 orang.
3. GAJI & UPAH
Berdasarkan bulan ke bulan, nilai gaji & upah yang dibayar pada bulan Julai 2013
menurun sebanyak 0 7% (RM17 8 juta) kepada RM2 721 5 juta Sementara itu jumlahmenurun sebanyak 0.7% (RM17.8 juta) kepada RM2,721.5 juta. Sementara itu, jumlah
gaji & upah yang dibayar pada bulan Julai 2013 berbanding bulan yang sama tahun
sebelumnya pula telah meningkat sebanyak 9.2% (RM229.5 juta). Nilai gaji & upah yang
dibayar pada bulan Jun 2013 dikemaskini kepada positif 9.7% tahun ke tahun kepada
RM2,739.3 juta.
CARTA 2 : BILANGAN PEKERJA DAN GAJI & UPAH DI SEKTOR PEMBUATAN3,000,0001,150,000
1,500,000
2,000,000
2,500,000
1,000,000
1,050,000
1,100,000
GA
JI & U
PAH
BIL
AN
GA
N P
EKER
JA
500,000
1,000,000
900,000
950,000
Jan2012
Feb Mac Apr Mei Jun Jul Ogo Sep Okt Nov Dis Jan2013
Feb Mac Apr Mei Jun Jul
B
3
BILANGAN PEKERJA GAJI & UPAH
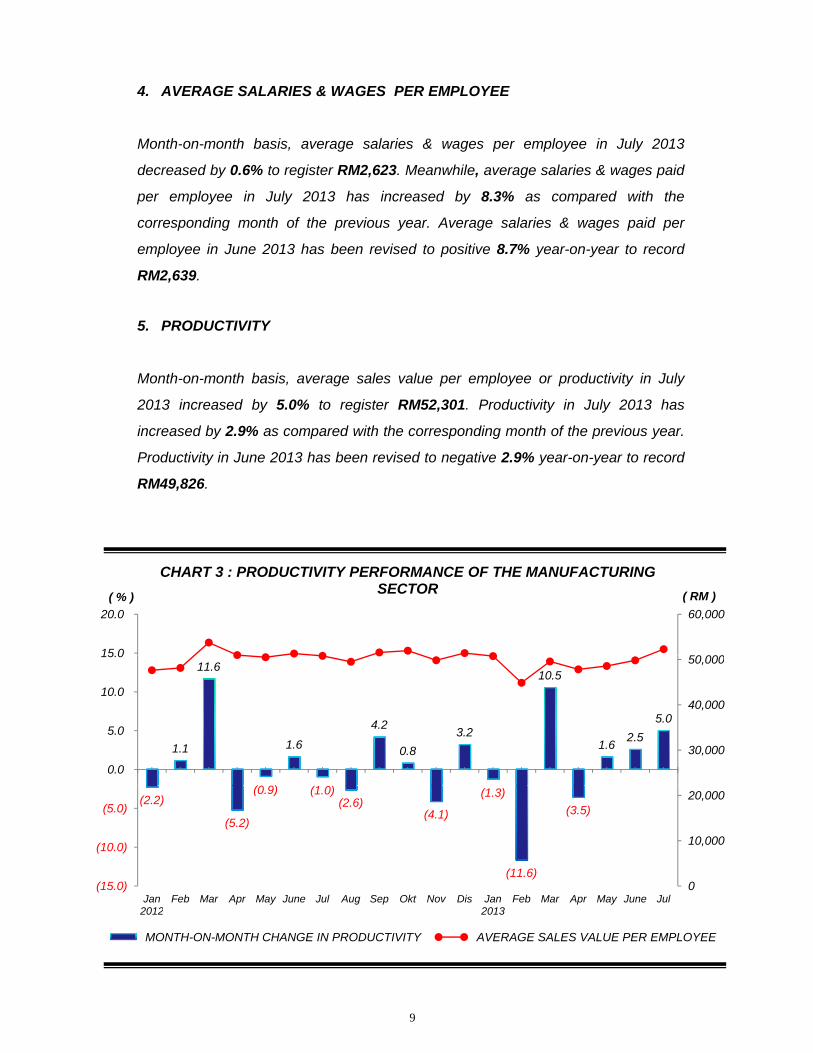
4. PURATA GAJI & UPAH SETIAP PEKERJA
Berdasarkan bulan ke bulan, purata gaji & upah yang dibayar bagi setiap pekerja
pada bulan Julai 2013 menurun sebanyak 0.6% kepada RM2,623. Sementara itu.
purata gaji & upah setiap pekerja pada bulan Julai 2013 berbanding bulan yang
sama tahun sebelumnya mencatatkan peningkatan sebanyak 8.3%. Purata gaji &
upah pada bulan Jun 2013 dikemaskini kepada positif 8.7% tahun ke tahun kepada
RM2,639.
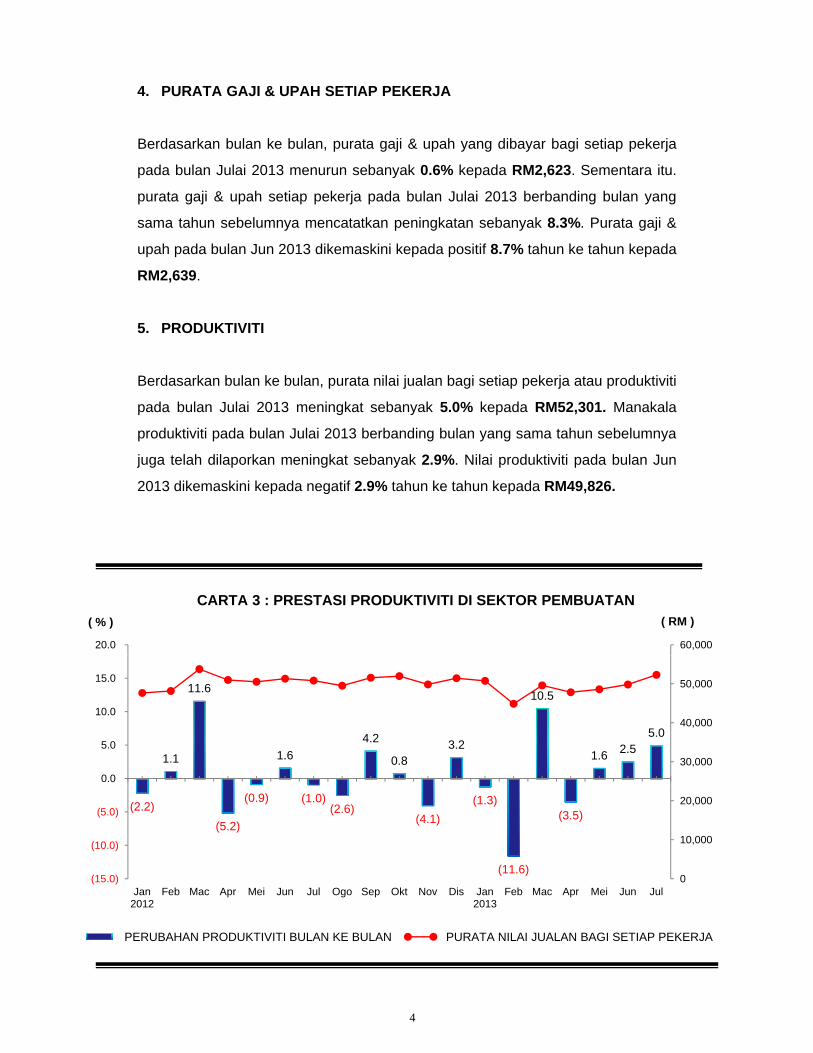
5. PRODUKTIVITI
Berdasarkan bulan ke bulan, purata nilai jualan bagi setiap pekerja atau produktiviti
pada bulan Julai 2013 meningkat sebanyak 5.0% kepada RM52,301. Manakala
produktiviti pada bulan Julai 2013 berbanding bulan yang sama tahun sebelumnya
juga telah dilaporkan meningkat sebanyak 2.9%. Nilai produktiviti pada bulan Jun
2013 dikemaskini kepada negatif 2.9% tahun ke tahun kepada RM49,826.
60,00020.0
( RM )( % )
CARTA 3 : PRESTASI PRODUKTIVITI DI SEKTOR PEMBUATAN
1.1
11.6
1.6
4.2
0.8 3.2
10.5
1.6 2.5 5.0
30,000
40,000
50,000
0.0
5.0
10.0
15.0
(2.2)
(5.2)
(0.9) (1.0)(2.6)
(4.1)
(1.3)
(11.6)
(3.5)
0
10,000
20,000
(15.0)
(10.0)
(5.0)
Jan2012
Feb Mac Apr Mei Jun Jul Ogo Sep Okt Nov Dis Jan2013
Feb Mac Apr Mei Jun Jul
4
PERUBAHAN PRODUKTIVITI BULAN KE BULAN PURATA NILAI JUALAN BAGI SETIAP PEKERJA
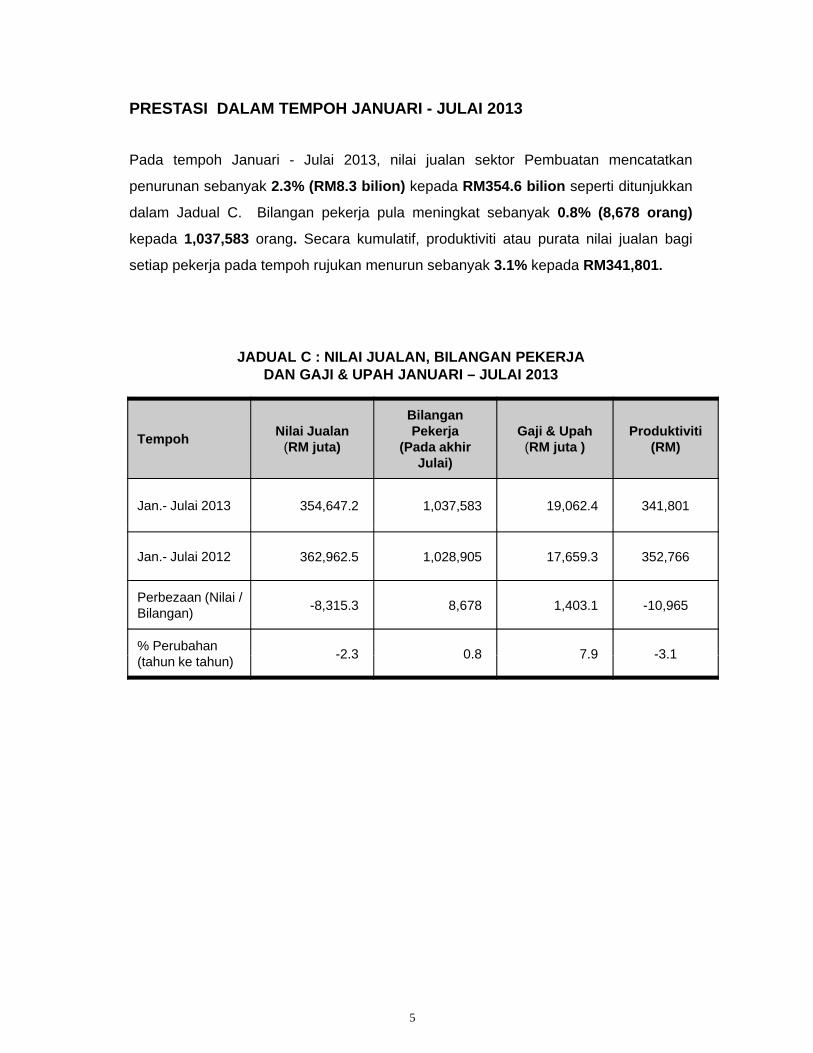
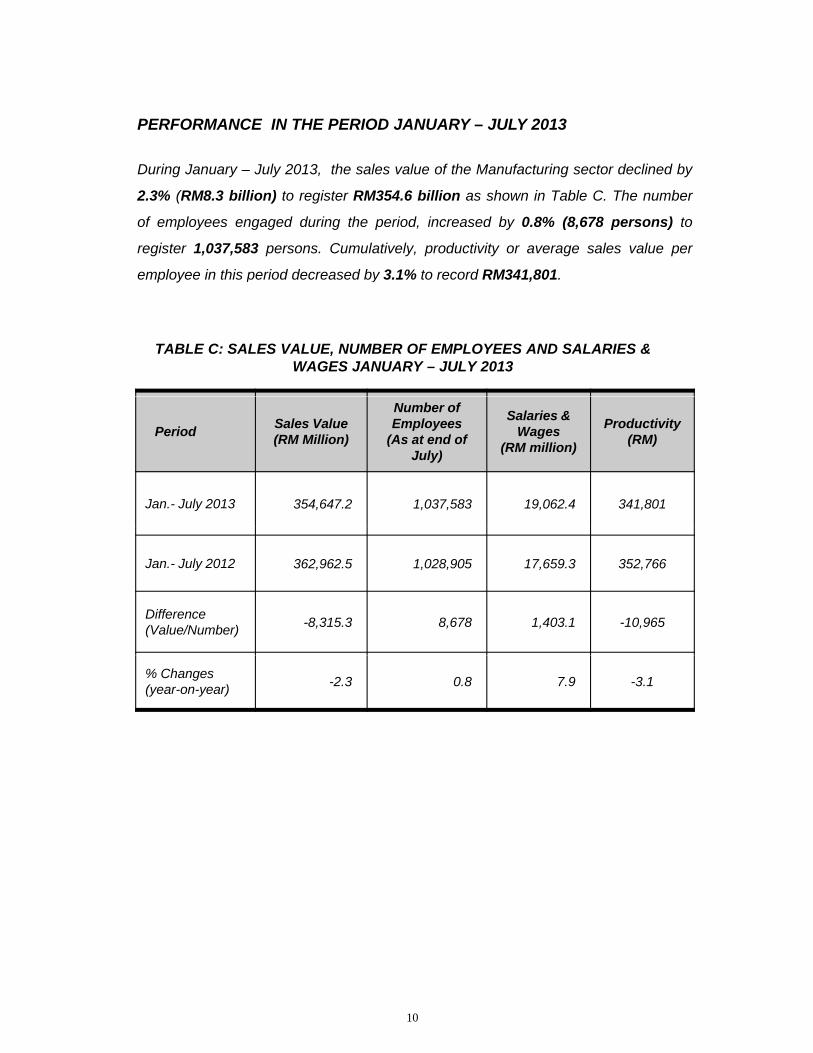
PRESTASI DALAM TEMPOH JANUARI - JULAI 2013
Pada tempoh Januari - Julai 2013, nilai jualan sektor Pembuatan mencatatkan
penurunan sebanyak 2.3% (RM8.3 bilion) kepada RM354.6 bilion seperti ditunjukkan
dalam Jadual C. Bilangan pekerja pula meningkat sebanyak 0.8% (8,678 orang)
kepada 1,037,583 orang. Secara kumulatif, produktiviti atau purata nilai jualan bagi
setiap pekerja pada tempoh rujukan menurun sebanyak 3 1% kepada RM341 801setiap pekerja pada tempoh rujukan menurun sebanyak 3.1% kepada RM341,801.
JADUAL C : NILAI JUALAN, BILANGAN PEKERJADAN GAJI & UPAH JANUARI – JULAI 2013
Tempoh Nilai Jualan(RM juta)
Bilangan Pekerja
(Pada akhir Julai)
Gaji & Upah(RM juta )
Produktiviti(RM)
Jan.- Julai 2013 354,647.2 1,037,583 19,062.4 341,801
Jan.- Julai 2012 362,962.5 1,028,905 17,659.3 352,766
Perbezaan (Nilai / Bilangan)
-8,315.3 8,678 1,403.1 -10,965
% Perubahan -2 3 0 8 7 9 -3 1
(tahun ke tahun)2.3 0.8 7.9 3.1
5
MONTHLY MANUFACTURING STATISTICS MALAYSIA, JULY 2013*
PERFORMANCE IN JULY 2013
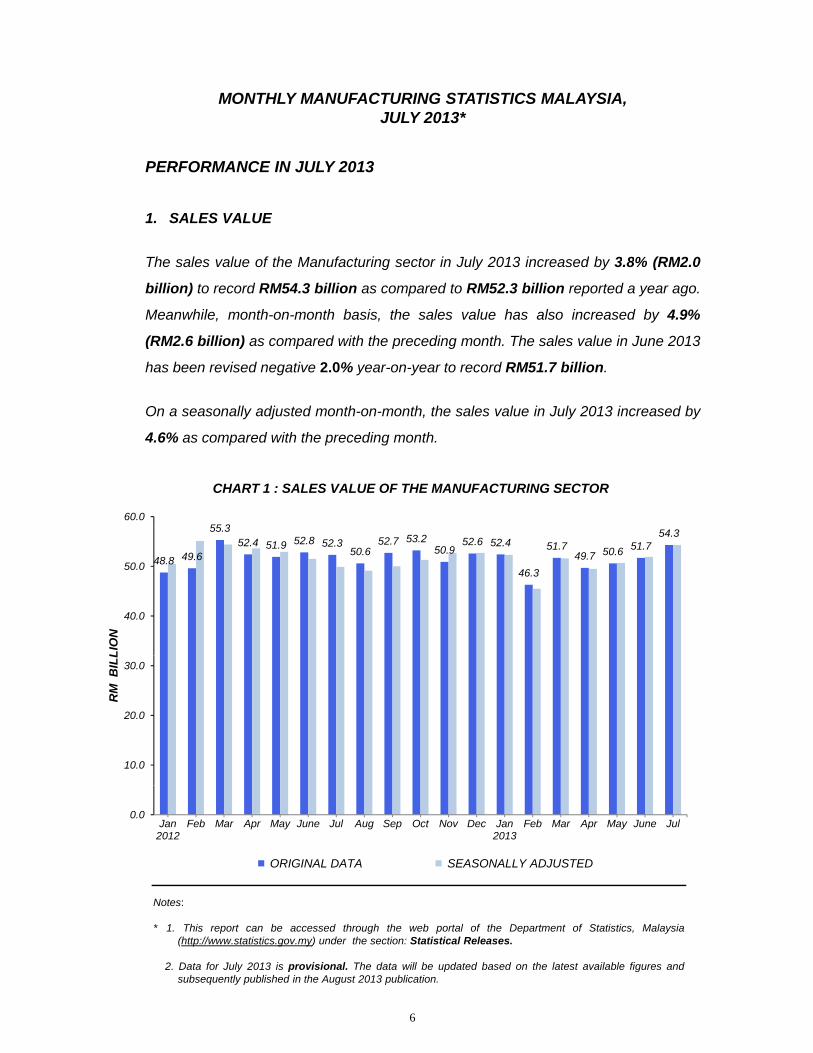
1. SALES VALUE
The sales value of the Manufacturing sector in July 2013 increased by 3.8% (RM2.0The sales value of the Manufacturing sector in July 2013 increased by 3.8% (RM2.0
billion) to record RM54.3 billion as compared to RM52.3 billion reported a year ago.
Meanwhile, month-on-month basis, the sales value has also increased by 4.9%
(RM2.6 billion) as compared with the preceding month. The sales value in June 2013
has been revised negative 2.0% year-on-year to record RM51.7 billion.
On a seasonally adjusted month-on-month, the sales value in July 2013 increased by
4.6% as compared with the preceding month.
55 360.0
CHART 1 : SALES VALUE OF THE MANUFACTURING SECTOR
48.8 49.6
55.352.4 51.9 52.8 52.3
50.652.7 53.2
50.952.6 52.4
46.3
51.749.7 50.6 51.7
54.3
40.0
50.0
LIO
N
10.0
20.0
30.0
RM
BIL
L
Notes:
0.0Jan
2012Feb Mar Apr May June Jul Aug Sep Oct Nov Dec Jan
2013Feb Mar Apr May June Jul
ORIGINAL DATA SEASONALLY ADJUSTED
6
* 1. This report can be accessed through the web portal of the Department of Statistics, Malaysia(http://www.statistics.gov.my) under the section: Statistical Releases.
2. Data for July 2013 is provisional. The data will be updated based on the latest available figures andsubsequently published in the August 2013 publication.
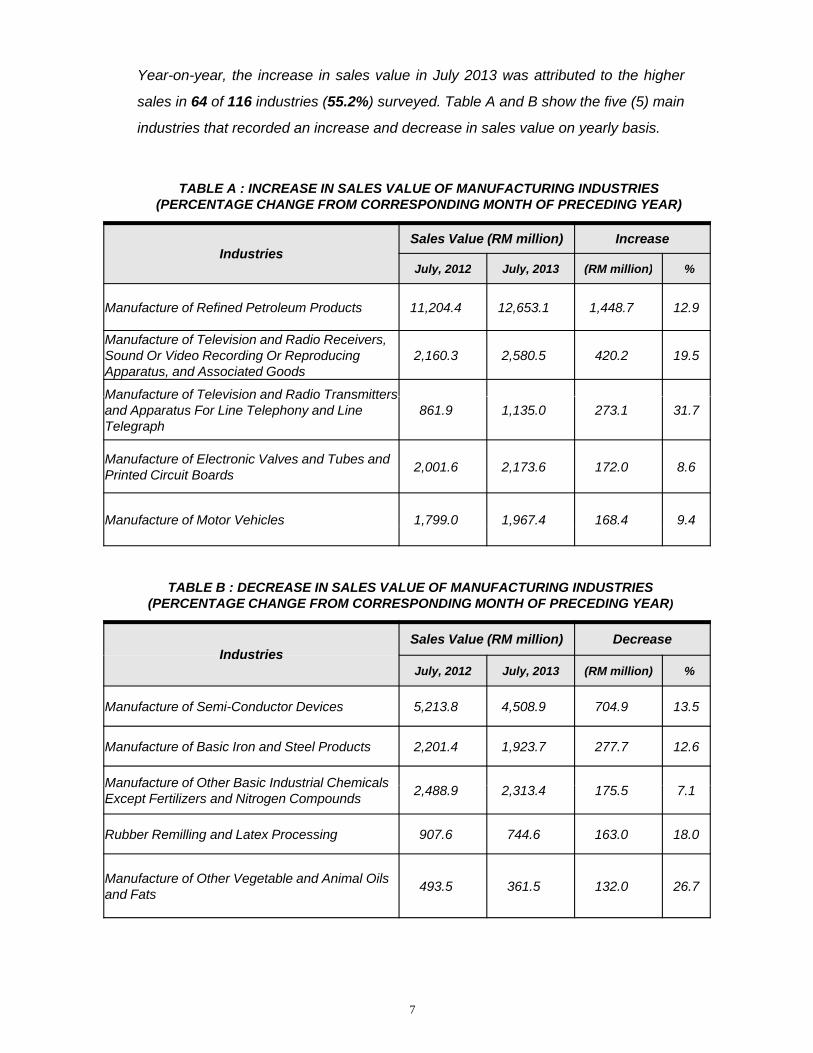
Year-on-year, the increase in sales value in July 2013 was attributed to the higher
sales in 64 of 116 industries (55.2%) surveyed. Table A and B show the five (5) main
industries that recorded an increase and decrease in sales value on yearly basis.
IndustriesSales Value (RM million) Increase
July 2012 July 2013 (RM million) %
TABLE A : INCREASE IN SALES VALUE OF MANUFACTURING INDUSTRIES(PERCENTAGE CHANGE FROM CORRESPONDING MONTH OF PRECEDING YEAR)
July, 2012 July, 2013 (RM million) %
Manufacture of Refined Petroleum Products 11,204.4 12,653.1 1,448.7 12.9
Manufacture of Television and Radio Receivers, Sound Or Video Recording Or Reproducing Apparatus, and Associated Goods
2,160.3 2,580.5 420.2 19.5
Manufacture of Television and Radio TransmittersManufacture of Television and Radio Transmitters and Apparatus For Line Telephony and Line Telegraph
861.9 1,135.0 273.1 31.7
Manufacture of Electronic Valves and Tubes and Printed Circuit Boards
2,001.6 2,173.6 172.0 8.6
Manufacture of Motor Vehicles 1,799.0 1,967.4 168.4 9.4
IndustriesSales Value (RM million) Decrease
TABLE B : DECREASE IN SALES VALUE OF MANUFACTURING INDUSTRIES(PERCENTAGE CHANGE FROM CORRESPONDING MONTH OF PRECEDING YEAR)
, ,
IndustriesJuly, 2012 July, 2013 (RM million) %
Manufacture of Semi-Conductor Devices 5,213.8 4,508.9 704.9 13.5
Manufacture of Basic Iron and Steel Products 2,201.4 1,923.7 277.7 12.6
Manufacture of Other Basic Industrial ChemicalsManufacture of Other Basic Industrial Chemicals Except Fertilizers and Nitrogen Compounds
2,488.9 2,313.4 175.5 7.1
Rubber Remilling and Latex Processing 907.6 744.6 163.0 18.0
Manufacture of Other Vegetable and Animal Oils and Fats
493.5 361.5 132.0 26.7
7
2. NUMBER OF EMPLOYEES
Total employees engaged in the Manufacturing sector in July 2013 was 1 037 583Total employees engaged in the Manufacturing sector in July 2013 was 1,037,583
persons, a decrease of 0.04% compared with the preceding month. Meanwhile, year-
on-year basis, the number of employees increased by 0.8%, or 8,678 persons as
compared to 1,028,905 persons in July 2012. The total employees in June 2013 has
been revised positive 0.9% year-on-year to record 1,037,952 persons.
3. SALARIES & WAGES
Month-on-month basis, salaries & wages paid in July 2013 decreased by 0.7%
(RM17.8 million) to register RM2,721.5 million. Meanwhile, the total amount paid in
July 2013, has increased by 9.2% (RM229.5 million) as compared with the
corresponding month of the previous year. Salaries & wages paid in June 2013 has
been revised positive 9.7% year-on-year to record RM2,739.3 million.
CHART 2 : NUMBER OF EMPLOYEES AND SALARIES & WAGESIN MANUFACTURING SECTOR
3,000,0001,150,000
1,500,000
2,000,000
2,500,000
1,000,000
1,050,000
1,100,000 SA
LA
RIE
S &
WA
GE
SB
ER
OF
EM
PL
OY
EE
S
500,000
1,000,000
900,000
950,000
Jan2012
Feb Mar Apr May June Jul Aug Sep Oct Nov Dec Jan2013
Feb Mar Apr May June Jul
NU
MB
8
NUMBER OF EMPLOYEES SALARIES & WAGES
4. AVERAGE SALARIES & WAGES PER EMPLOYEE
Month-on-month basis, average salaries & wages per employee in July 2013
decreased by 0.6% to register RM2,623. Meanwhile, average salaries & wages paid
per employee in July 2013 has increased by 8.3% as compared with the
corresponding month of the previous year. Average salaries & wages paid per
employee in June 2013 has been revised to positive 8.7% year-on-year to record
RM2,639.
5. PRODUCTIVITY
Month-on-month basis, average sales value per employee or productivity in July
2013 increased by 5.0% to register RM52,301. Productivity in July 2013 has
increased by 2.9% as compared with the corresponding month of the previous year.
Productivity in June 2013 has been revised to negative 2.9% year-on-year to record
RM49,826.
50 000
60,000
15 0
20.0
( RM )( % )
CHART 3 : PRODUCTIVITY PERFORMANCE OF THE MANUFACTURING SECTOR
1.1
11.6
( )
1.6
4.2
0.8
3.2
10.5
1.6 2.5
5.0
30,000
40,000
50,000
0.0
5.0
10.0
15.0
(2.2)
(5.2)
(0.9) (1.0)(2.6)
(4.1)
(1.3)
(11.6)
(3.5)
0
10,000
20,000
(15.0)
(10.0)
(5.0)
Jan2012
Feb Mar Apr May June Jul Aug Sep Okt Nov Dis Jan2013
Feb Mar Apr May June Jul
9
MONTH-ON-MONTH CHANGE IN PRODUCTIVITY AVERAGE SALES VALUE PER EMPLOYEE
PERFORMANCE IN THE PERIOD JANUARY – JULY 2013
During January – July 2013, the sales value of the Manufacturing sector declined by
2.3% (RM8.3 billion) to register RM354.6 billion as shown in Table C. The number
of employees engaged during the period, increased by 0.8% (8,678 persons) to
register 1,037,583 persons. Cumulatively, productivity or average sales value per
employee in this period decreased by 3.1% to record RM341,801.
TABLE C: SALES VALUE, NUMBER OF EMPLOYEES AND SALARIES & WAGES JANUARY – JULY 2013
PeriodSales Value (RM Million)
Number of Employees
(As at end of July)
Salaries & Wages
(RM million)
Productivity(RM)
Jan.- July 2013 354,647.2 1,037,583 19,062.4 341,801
Jan.- July 2012 362,962.5 1,028,905 17,659.3 352,766
Difference (Value/Number)
-8,315.3 8,678 1,403.1 -10,965
% Changes(year-on-year)
-2.3 0.8 7.9 -3.1
10
JADUAL
TABLE
TEMPOH BILANGANPeriod PEKERJA
BERGAJIPADAAKHIR
TEMPOHNumber ofemployeesengagedat end of
period
Data Asal (Original Data)
Pelarasan Musim (Seasonally Adjusted)
Data Asal (Original Data)
Pelarasan Musim (Seasonally Adjusted)
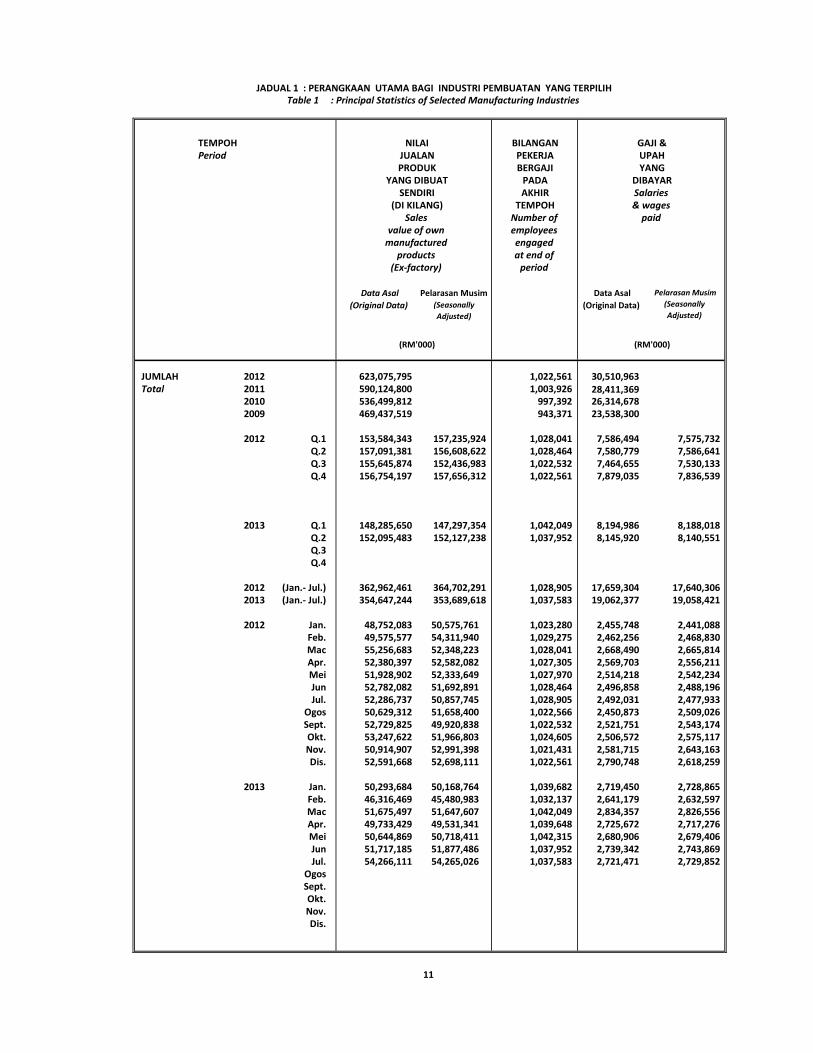
JUMLAH 2012 623,075,795 1,022,561 30,510,963 Total 2011 590,124,800 1,003,926 28,411,369
2010 536,499,812 997,392 26,314,678 2009 469,437,519 943,371 23,538,300
2012 Q.1 153,584,343 157,235,924 1,028,041 7,586,494 7,575,732 Q.2 157,091,381 156,608,622 1,028,464 7,580,779 7,586,641 Q.3 155,645,874 152,436,983 1,022,532 7,464,655 7,530,133 Q.4 156,754,197 157,656,312 1,022,561 7,879,035 7,836,539
2013 Q.1 148,285,650 147,297,354 1,042,049 8,194,986 8,188,018 Q.2 152,095,483 152,127,238 1,037,952 8,145,920 8,140,551 Q.3 Q.4
2012 (Jan.- Jul.) 362,962,461 364,702,291 1,028,905 17,659,304 17,640,306 2013 (Jan.- Jul.) 354,647,244 353,689,618 1,037,583 19,062,377 19,058,421
2012 Jan. 48,752,083 50,575,761 1,023,280 2,455,748 2,441,088 Feb. 49,575,577 54,311,940 1,029,275 2,462,256 2,468,830 Mac 55,256,683 52,348,223 1,028,041 2,668,490 2,665,814 Apr. 52,380,397 52,582,082 1,027,305 2,569,703 2,556,211 Mei 51,928,902 52,333,649 1,027,970 2,514,218 2,542,234 Jun 52,782,082 51,692,891 1,028,464 2,496,858 2,488,196 Jul. 52,286,737 50,857,745 1,028,905 2,492,031 2,477,933
Ogos 50,629,312 51,658,400 1,022,566 2,450,873 2,509,026 Sept. 52,729,825 49,920,838 1,022,532 2,521,751 2,543,174 Okt. 53,247,622 51,966,803 1,024,605 2,506,572 2,575,117 Nov. 50,914,907 52,991,398 1,021,431 2,581,715 2,643,163 Dis. 52,591,668 52,698,111 1,022,561 2,790,748 2,618,259
2013 Jan. 50,293,684 50,168,764 1,039,682 2,719,450 2,728,865 Feb. 46,316,469 45,480,983 1,032,137 2,641,179 2,632,597
Mac 51,675,497 51,647,607 1,042,049 2,834,357 2,826,556 Apr. 49,733,429 49,531,341 1,039,648 2,725,672 2,717,276 Mei 50,644,869 50,718,411 1,042,315 2,680,906 2,679,406 Jun 51,717,185 51,877,486 1,037,952 2,739,342 2,743,869 Jul. 54,266,111 54,265,026 1,037,583 2,721,471 2,729,852
Ogos Sept. Okt. Nov. Dis.
products(Ex-factory)
(RM'000) (RM'000)
11
manufactured
PRODUK YANGYANG DIBUAT DIBAYAR
SENDIRI Salaries(DI KILANG) & wages
Sales paidvalue of own
JADUAL 1 : PERANGKAAN UTAMA BAGI INDUSTRI PEMBUATAN YANG TERPILIH Table 1 : Principal Statistics of Selected Manufacturing Industries
NILAI GAJI &JUALAN UPAH
BIL. KETERANGAN INDUSTRI LIPUTAN TEMPOH NILAI BILANGAN GAJI &No. (KOD INDUSTRI) BILANGAN Period JUALAN PEKERJA UPAH
Industry description PEKERJA PRODUK BERGAJI YANG(Industry code) Employment YANG DIBUAT PADA DIBAYAR
coverage SENDIRI AKHIR Salaries(DI KILANG) TEMPOH & wages
Sales Number of paidvalue of own employees
manufactured engagedproducts at end of
(Ex-factory) period
(RM'000) (RM'000)
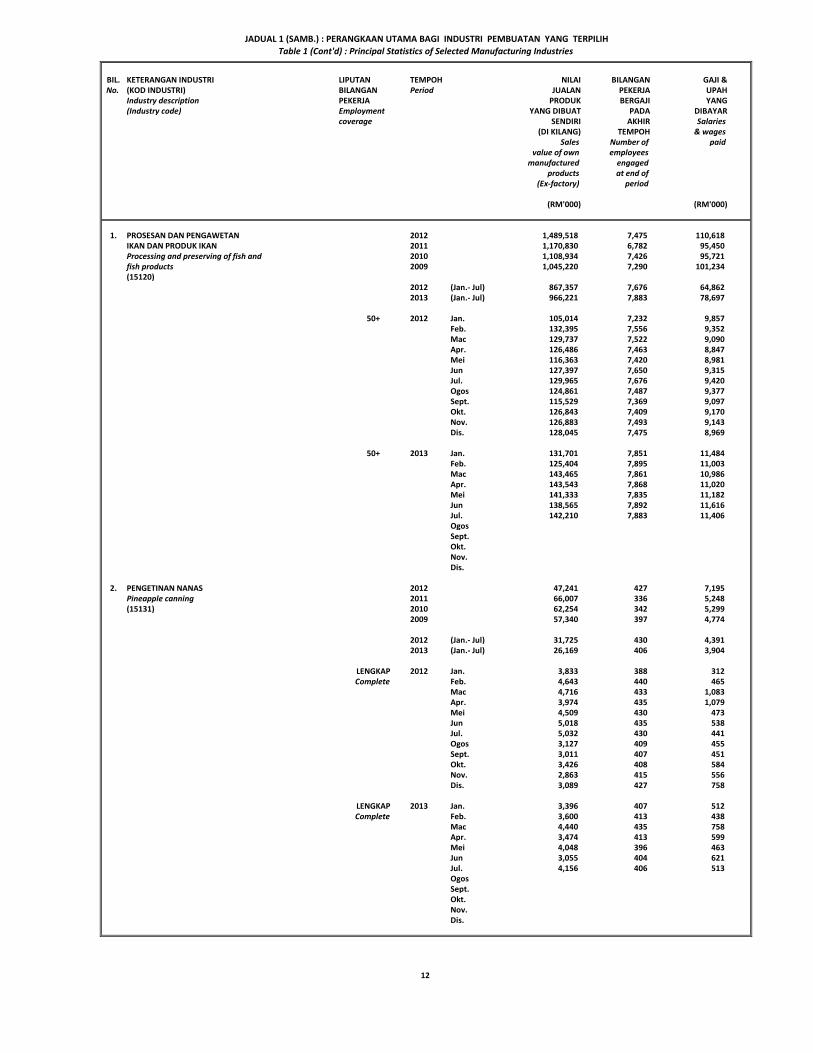
1. PROSESAN DAN PENGAWETAN 2012 1,489,518 7,475 110,618IKAN DAN PRODUK IKAN 2011 1,170,830 6,782 95,450Processing and preserving of fish and 2010 1,108,934 7,426 95,721fish products 2009 1,045,220 7,290 101,234 (15120)
2012 (Jan.- Jul) 867,357 7,676 64,8622013 (Jan.- Jul) 966,221 7,883 78,697
50+ 2012 Jan. 105,014 7,232 9,857Feb. 132,395 7,556 9,352Mac 129,737 7,522 9,090Apr. 126,486 7,463 8,847Mei 116,363 7,420 8,981Jun 127,397 7,650 9,315Jul. 129,965 7,676 9,420Ogos 124,861 7,487 9,377Sept. 115,529 7,369 9,097Okt. 126,843 7,409 9,170Nov. 126,883 7,493 9,143Dis. 128,045 7,475 8,969
50+ 2013 Jan. 131,701 7,851 11,484Feb. 125,404 7,895 11,003Mac 143,465 7,861 10,986Apr. 143,543 7,868 11,020Mei 141,333 7,835 11,182Jun 138,565 7,892 11,616Jul. 142,210 7,883 11,406OgosSept.Okt.Nov.Dis.
2. PENGETINAN NANAS 2012 47,241 427 7,195Pineapple canning 2011 66,007 336 5,248(15131) 2010 62,254 342 5,299
2009 57,340 397 4,774
2012 (Jan.- Jul) 31,725 430 4,3912013 (Jan.- Jul) 26,169 406 3,904
LENGKAP 2012 Jan. 3,833 388 312 Complete Feb. 4,643 440 465
Mac 4,716 433 1,083 Apr. 3,974 435 1,079 Mei 4,509 430 473 Jun 5,018 435 538 Jul. 5,032 430 441 Ogos 3,127 409 455 Sept. 3,011 407 451 Okt. 3,426 408 584 Nov. 2,863 415 556 Dis. 3,089 427 758
LENGKAP 2013 Jan. 3,396 407 512Complete Feb. 3,600 413 438
Mac 4,440 435 758Apr. 3,474 413 599Mei 4,048 396 463Jun 3,055 404 621Jul. 4,156 406 513OgosSept.Okt.Nov.Dis.
JADUAL 1 (SAMB.) : PERANGKAAN UTAMA BAGI INDUSTRI PEMBUATAN YANG TERPILIHTable 1 (Cont'd) : Principal Statistics of Selected Manufacturing Industries
12
BIL. KETERANGAN INDUSTRI LIPUTAN TEMPOH NILAI BILANGAN GAJI &No. (KOD INDUSTRI) BILANGAN Period JUALAN PEKERJA UPAH
Industry description PEKERJA PRODUK BERGAJI YANG(Industry code) Employment YANG DIBUAT PADA DIBAYAR
coverage SENDIRI AKHIR Salaries(DI KILANG) TEMPOH & wages
Sales Number of paidvalue of own employees
manufactured engagedproducts at end of
(Ex-factory) period
(RM'000) (RM'000)
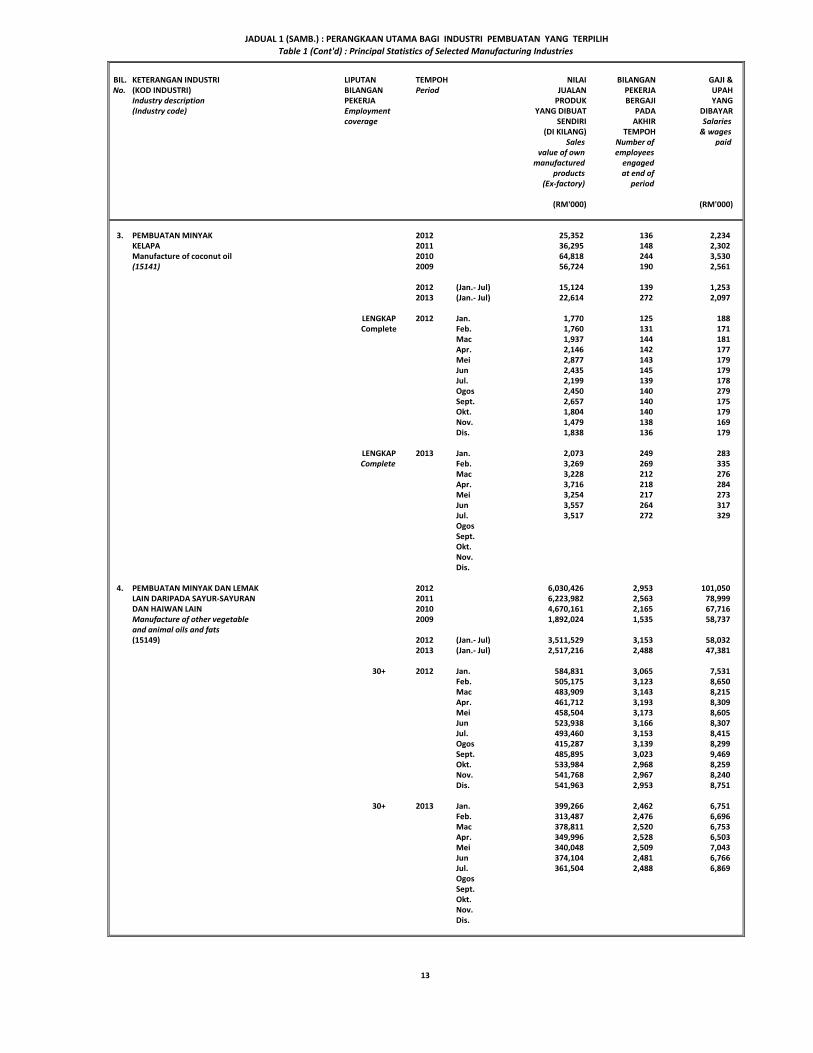
3. PEMBUATAN MINYAK 2012 25,352 136 2,234KELAPA 2011 36,295 148 2,302Manufacture of coconut oil 2010 64,818 244 3,530(15141) 2009 56,724 190 2,561
2012 (Jan.- Jul) 15,124 139 1,2532013 (Jan.- Jul) 22,614 272 2,097
LENGKAP 2012 Jan. 1,770 125 188Complete Feb. 1,760 131 171
Mac 1,937 144 181Apr. 2,146 142 177Mei 2,877 143 179Jun 2,435 145 179Jul. 2,199 139 178Ogos 2,450 140 279Sept. 2,657 140 175Okt. 1,804 140 179Nov. 1,479 138 169Dis. 1,838 136 179
LENGKAP 2013 Jan. 2,073 249 283Complete Feb. 3,269 269 335
Mac 3,228 212 276Apr. 3,716 218 284Mei 3,254 217 273Jun 3,557 264 317Jul. 3,517 272 329OgosSept.Okt.Nov.Dis.
4. PEMBUATAN MINYAK DAN LEMAK 2012 6,030,426 2,953 101,050LAIN DARIPADA SAYUR-SAYURAN 2011 6,223,982 2,563 78,999DAN HAIWAN LAIN 2010 4,670,161 2,165 67,716Manufacture of other vegetable 2009 1,892,024 1,535 58,737and animal oils and fats(15149) 2012 (Jan.- Jul) 3,511,529 3,153 58,032
2013 (Jan.- Jul) 2,517,216 2,488 47,381
30+ 2012 Jan. 584,831 3,065 7,531Feb. 505,175 3,123 8,650Mac 483,909 3,143 8,215Apr. 461,712 3,193 8,309Mei 458,504 3,173 8,605Jun 523,938 3,166 8,307Jul. 493,460 3,153 8,415Ogos 415,287 3,139 8,299Sept. 485,895 3,023 9,469Okt. 533,984 2,968 8,259Nov. 541,768 2,967 8,240Dis. 541,963 2,953 8,751
30+ 2013 Jan. 399,266 2,462 6,751Feb. 313,487 2,476 6,696Mac 378,811 2,520 6,753Apr. 349,996 2,528 6,503Mei 340,048 2,509 7,043Jun 374,104 2,481 6,766Jul. 361,504 2,488 6,869OgosSept.Okt.Nov.Dis.
JADUAL 1 (SAMB.) : PERANGKAAN UTAMA BAGI INDUSTRI PEMBUATAN YANG TERPILIHTable 1 (Cont'd) : Principal Statistics of Selected Manufacturing Industries
13
BIL. KETERANGAN INDUSTRI LIPUTAN TEMPOH NILAI BILANGAN GAJI &No. (KOD INDUSTRI) BILANGAN Period JUALAN PEKERJA UPAH
Industry description PEKERJA PRODUK BERGAJI YANG(Industry code) Employment YANG DIBUAT PADA DIBAYAR
coverage SENDIRI AKHIR Salaries(DI KILANG) TEMPOH & wages
Sales Number of paidvalue of own employees
manufactured engagedproducts at end of
(Ex-factory) period
(RM'000) (RM'000)
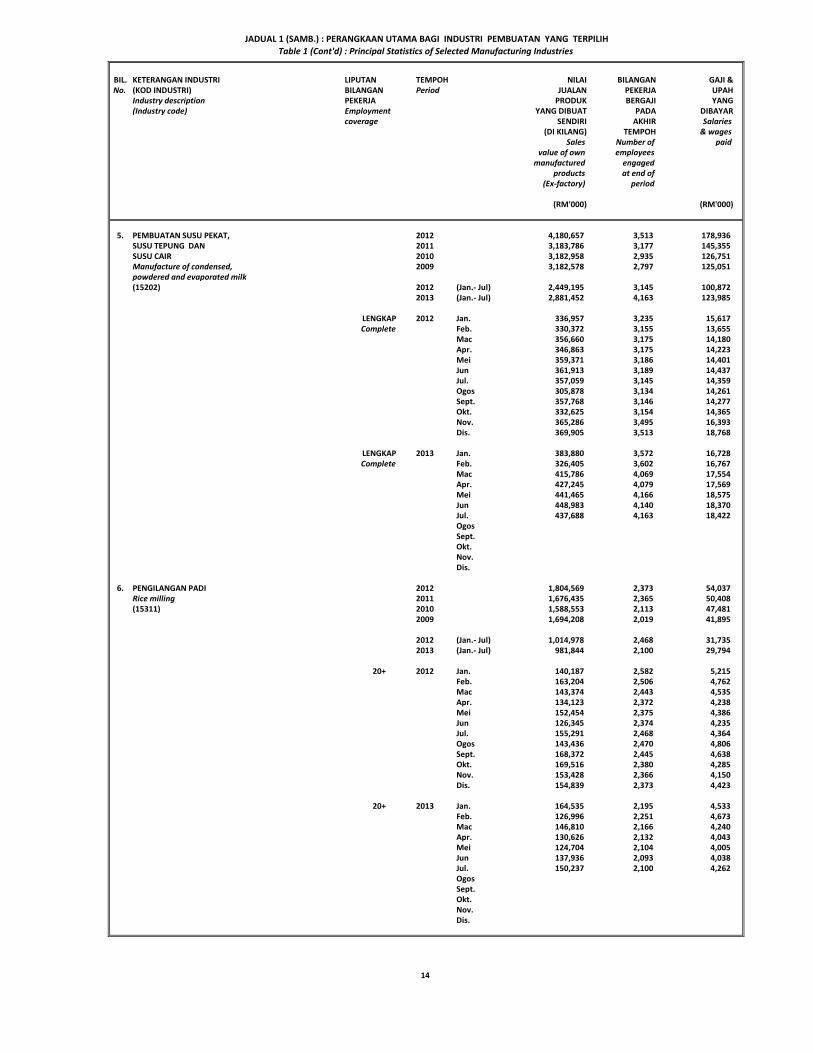
5. PEMBUATAN SUSU PEKAT, 2012 4,180,657 3,513 178,936SUSU TEPUNG DAN 2011 3,183,786 3,177 145,355SUSU CAIR 2010 3,182,958 2,935 126,751Manufacture of condensed, 2009 3,182,578 2,797 125,051 powdered and evaporated milk(15202) 2012 (Jan.- Jul) 2,449,195 3,145 100,872
2013 (Jan.- Jul) 2,881,452 4,163 123,985
LENGKAP 2012 Jan. 336,957 3,235 15,617Complete Feb. 330,372 3,155 13,655
Mac 356,660 3,175 14,180Apr. 346,863 3,175 14,223Mei 359,371 3,186 14,401Jun 361,913 3,189 14,437Jul. 357,059 3,145 14,359Ogos 305,878 3,134 14,261Sept. 357,768 3,146 14,277Okt. 332,625 3,154 14,365Nov. 365,286 3,495 16,393Dis. 369,905 3,513 18,768
LENGKAP 2013 Jan. 383,880 3,572 16,728Complete Feb. 326,405 3,602 16,767
Mac 415,786 4,069 17,554Apr. 427,245 4,079 17,569Mei 441,465 4,166 18,575Jun 448,983 4,140 18,370Jul. 437,688 4,163 18,422OgosSept.Okt.Nov.Dis.
6. PENGILANGAN PADI 2012 1,804,569 2,373 54,037Rice milling 2011 1,676,435 2,365 50,408(15311) 2010 1,588,553 2,113 47,481
2009 1,694,208 2,019 41,895
2012 (Jan.- Jul) 1,014,978 2,468 31,7352013 (Jan.- Jul) 981,844 2,100 29,794
20+ 2012 Jan. 140,187 2,582 5,215Feb. 163,204 2,506 4,762Mac 143,374 2,443 4,535Apr. 134,123 2,372 4,238Mei 152,454 2,375 4,386Jun 126,345 2,374 4,235Jul. 155,291 2,468 4,364Ogos 143,436 2,470 4,806Sept. 168,372 2,445 4,638Okt. 169,516 2,380 4,285Nov. 153,428 2,366 4,150Dis. 154,839 2,373 4,423
20+ 2013 Jan. 164,535 2,195 4,533Feb. 126,996 2,251 4,673Mac 146,810 2,166 4,240Apr. 130,626 2,132 4,043Mei 124,704 2,104 4,005Jun 137,936 2,093 4,038Jul. 150,237 2,100 4,262OgosSept.Okt.Nov.Dis.
JADUAL 1 (SAMB.) : PERANGKAAN UTAMA BAGI INDUSTRI PEMBUATAN YANG TERPILIHTable 1 (Cont'd) : Principal Statistics of Selected Manufacturing Industries
14
BIL. KETERANGAN INDUSTRI LIPUTAN TEMPOH NILAI BILANGAN GAJI &No. (KOD INDUSTRI) BILANGAN Period JUALAN PEKERJA UPAH
Industry description PEKERJA PRODUK BERGAJI YANG(Industry code) Employment YANG DIBUAT PADA DIBAYAR
coverage SENDIRI AKHIR Salaries(DI KILANG) TEMPOH & wages
Sales Number of paidvalue of own employees
manufactured engagedproducts at end of
(Ex-factory) period
(RM'000) (RM'000)
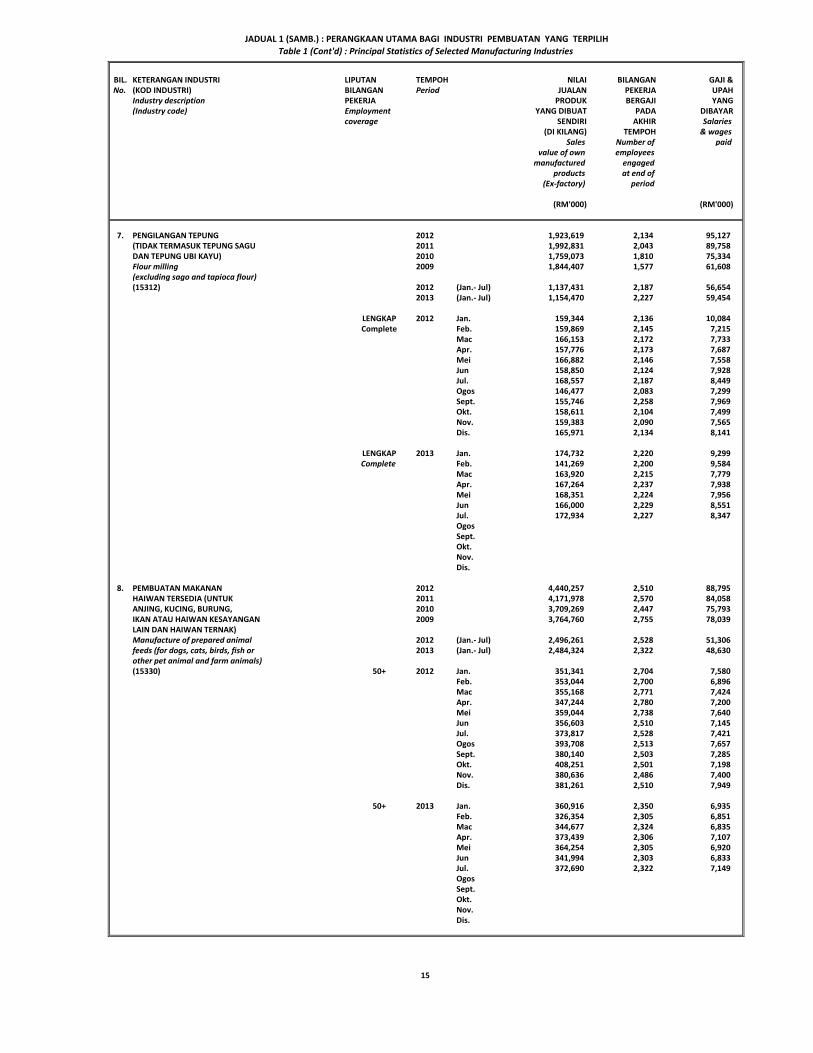
7. PENGILANGAN TEPUNG 2012 1,923,619 2,134 95,127(TIDAK TERMASUK TEPUNG SAGU 2011 1,992,831 2,043 89,758DAN TEPUNG UBI KAYU) 2010 1,759,073 1,810 75,334Flour milling 2009 1,844,407 1,577 61,608 (excluding sago and tapioca flour)(15312) 2012 (Jan.- Jul) 1,137,431 2,187 56,654
2013 (Jan.- Jul) 1,154,470 2,227 59,454
LENGKAP 2012 Jan. 159,344 2,136 10,084Complete Feb. 159,869 2,145 7,215
Mac 166,153 2,172 7,733Apr. 157,776 2,173 7,687Mei 166,882 2,146 7,558Jun 158,850 2,124 7,928Jul. 168,557 2,187 8,449Ogos 146,477 2,083 7,299Sept. 155,746 2,258 7,969Okt. 158,611 2,104 7,499Nov. 159,383 2,090 7,565Dis. 165,971 2,134 8,141
LENGKAP 2013 Jan. 174,732 2,220 9,299Complete Feb. 141,269 2,200 9,584
Mac 163,920 2,215 7,779Apr. 167,264 2,237 7,938Mei 168,351 2,224 7,956Jun 166,000 2,229 8,551Jul. 172,934 2,227 8,347OgosSept.Okt.Nov.Dis.
8. PEMBUATAN MAKANAN 2012 4,440,257 2,510 88,795HAIWAN TERSEDIA (UNTUK 2011 4,171,978 2,570 84,058ANJING, KUCING, BURUNG, 2010 3,709,269 2,447 75,793IKAN ATAU HAIWAN KESAYANGAN 2009 3,764,760 2,755 78,039 LAIN DAN HAIWAN TERNAK)Manufacture of prepared animal 2012 (Jan.- Jul) 2,496,261 2,528 51,306feeds (for dogs, cats, birds, fish or 2013 (Jan.- Jul) 2,484,324 2,322 48,630other pet animal and farm animals)(15330) 50+ 2012 Jan. 351,341 2,704 7,580
Feb. 353,044 2,700 6,896Mac 355,168 2,771 7,424Apr. 347,244 2,780 7,200Mei 359,044 2,738 7,640Jun 356,603 2,510 7,145Jul. 373,817 2,528 7,421Ogos 393,708 2,513 7,657Sept. 380,140 2,503 7,285Okt. 408,251 2,501 7,198Nov. 380,636 2,486 7,400Dis. 381,261 2,510 7,949
50+ 2013 Jan. 360,916 2,350 6,935Feb. 326,354 2,305 6,851Mac 344,677 2,324 6,835Apr. 373,439 2,306 7,107Mei 364,254 2,305 6,920Jun 341,994 2,303 6,833Jul. 372,690 2,322 7,149OgosSept.Okt.Nov.Dis.
JADUAL 1 (SAMB.) : PERANGKAAN UTAMA BAGI INDUSTRI PEMBUATAN YANG TERPILIHTable 1 (Cont'd) : Principal Statistics of Selected Manufacturing Industries
15
BIL. KETERANGAN INDUSTRI LIPUTAN TEMPOH NILAI BILANGAN GAJI &No. (KOD INDUSTRI) BILANGAN Period JUALAN PEKERJA UPAH
Industry description PEKERJA PRODUK BERGAJI YANG(Industry code) Employment YANG DIBUAT PADA DIBAYAR
coverage SENDIRI AKHIR Salaries(DI KILANG) TEMPOH & wages
Sales Number of paidvalue of own employees
manufactured engagedproducts at end of
(Ex-factory) period
(RM'000) (RM'000)
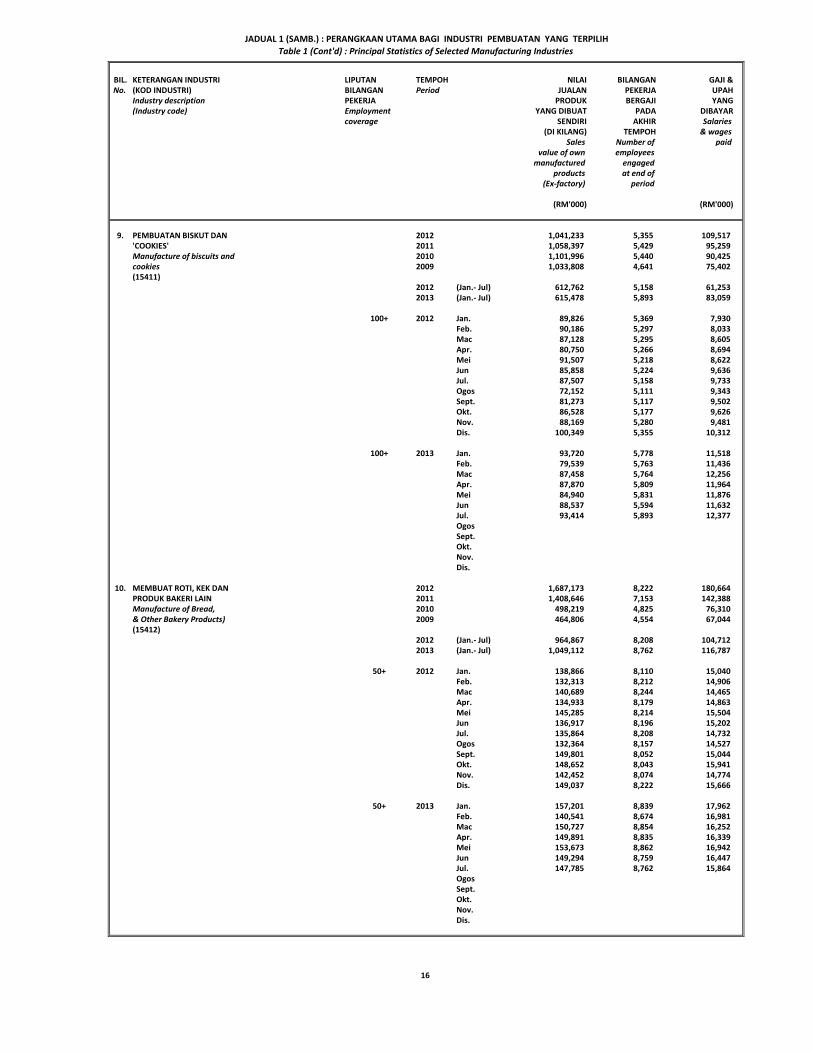
9. PEMBUATAN BISKUT DAN 2012 1,041,233 5,355 109,517'COOKIES' 2011 1,058,397 5,429 95,259Manufacture of biscuits and 2010 1,101,996 5,440 90,425cookies 2009 1,033,808 4,641 75,402 (15411)
2012 (Jan.- Jul) 612,762 5,158 61,2532013 (Jan.- Jul) 615,478 5,893 83,059
100+ 2012 Jan. 89,826 5,369 7,930Feb. 90,186 5,297 8,033Mac 87,128 5,295 8,605Apr. 80,750 5,266 8,694Mei 91,507 5,218 8,622Jun 85,858 5,224 9,636Jul. 87,507 5,158 9,733Ogos 72,152 5,111 9,343Sept. 81,273 5,117 9,502Okt. 86,528 5,177 9,626Nov. 88,169 5,280 9,481Dis. 100,349 5,355 10,312
100+ 2013 Jan. 93,720 5,778 11,518Feb. 79,539 5,763 11,436Mac 87,458 5,764 12,256Apr. 87,870 5,809 11,964Mei 84,940 5,831 11,876Jun 88,537 5,594 11,632Jul. 93,414 5,893 12,377OgosSept.Okt.Nov.Dis.
10. MEMBUAT ROTI, KEK DAN 2012 1,687,173 8,222 180,664PRODUK BAKERI LAIN 2011 1,408,646 7,153 142,388Manufacture of Bread, 2010 498,219 4,825 76,310& Other Bakery Products) 2009 464,806 4,554 67,044 (15412)
2012 (Jan.- Jul) 964,867 8,208 104,7122013 (Jan.- Jul) 1,049,112 8,762 116,787
50+ 2012 Jan. 138,866 8,110 15,040Feb. 132,313 8,212 14,906Mac 140,689 8,244 14,465Apr. 134,933 8,179 14,863Mei 145,285 8,214 15,504Jun 136,917 8,196 15,202Jul. 135,864 8,208 14,732Ogos 132,364 8,157 14,527Sept. 149,801 8,052 15,044Okt. 148,652 8,043 15,941Nov. 142,452 8,074 14,774Dis. 149,037 8,222 15,666
50+ 2013 Jan. 157,201 8,839 17,962Feb. 140,541 8,674 16,981Mac 150,727 8,854 16,252Apr. 149,891 8,835 16,339Mei 153,673 8,862 16,942Jun 149,294 8,759 16,447Jul. 147,785 8,762 15,864OgosSept.Okt.Nov.Dis.
JADUAL 1 (SAMB.) : PERANGKAAN UTAMA BAGI INDUSTRI PEMBUATAN YANG TERPILIHTable 1 (Cont'd) : Principal Statistics of Selected Manufacturing Industries
16

BIL. KETERANGAN INDUSTRI LIPUTAN TEMPOH NILAI BILANGAN GAJI &No. (KOD INDUSTRI) BILANGAN Period JUALAN PEKERJA UPAH
Industry description PEKERJA PRODUK BERGAJI YANG(Industry code) Employment YANG DIBUAT PADA DIBAYAR
coverage SENDIRI AKHIR Salaries(DI KILANG) TEMPOH & wages
Sales Number of paidvalue of own employees
manufactured engagedproducts at end of
(Ex-factory) period
(RM'000) (RM'000)
11. PEMBUATAN GULA 2012 3,656,181 2,028 78,871Manufacture of sugar 2011 3,731,431 2,078 79,971(15420) 2010 3,085,765 2,056 71,256
2009 2,262,747 2,058 56,691
2012 (Jan.- Jul) 2,092,038 1,987 48,0592013 (Jan.- Jul) 2,347,344 2,088 54,446
LENGKAP 2012 Jan. 319,664 2,027 5,434Complete Feb. 280,649 2,052 5,811
Mac 298,605 2,056 5,511Apr. 283,910 2,004 13,997Mei 293,620 2,064 5,190Jun 297,091 2,010 6,827Jul. 318,499 1,987 5,289Ogos 287,208 1,990 6,971Sept. 277,015 2,012 5,268Okt. 333,273 2,003 5,814Nov. 331,847 2,000 5,662Dis. 334,800 2,028 7,097
LENGKAP 2013 Jan. 339,752 2,064 6,297Complete Feb. 301,379 2,066 6,158
Mac 315,650 2,060 5,737Apr. 325,689 2,083 10,673Mei 335,210 2,088 11,235Jun 350,234 2,082 6,176Jul. 379,430 2,088 8,170OgosSept.Okt.Nov.Dis.
12. PEMBUATAN PRODUK KOKO 2012 3,793,899 2,385 89,728Manufacture of cocoa 2011 4,628,422 2,205 78,802 products 2010 4,297,461 1,903 69,819(15431) 2009 3,382,702 1,680 65,215
2012 (Jan.- Jul) 2,190,924 2,282 50,1282013 (Jan.- Jul) 2,134,569 2,560 60,946
LENGKAP 2012 Jan. 346,888 2,228 6,699Complete Feb. 340,353 2,220 7,040
Mac 296,417 2,190 7,188Apr. 306,965 2,249 6,730Mei 329,420 2,256 7,035Jun 289,745 2,290 8,272Jul. 281,136 2,282 7,164Ogos 291,276 2,339 7,530Sept. 314,857 2,272 6,910Okt. 324,450 2,367 7,587Nov. 330,567 2,393 8,948Dis. 341,825 2,385 8,625
LENGKAP 2013 Jan. 306,115 2,412 7,509Complete Feb. 275,237 2,414 8,329
Mac 370,049 2,433 8,083Apr. 279,990 2,555 10,092Mei 309,558 2,556 8,599Jun 306,115 2,549 8,786Jul. 287,505 2,560 9,548OgosSept.Okt.Nov.Dis.
JADUAL 1 (SAMB.) : PERANGKAAN UTAMA BAGI INDUSTRI PEMBUATAN YANG TERPILIHTable 1 (Cont'd) : Principal Statistics of Selected Manufacturing Industries
17

BIL. KETERANGAN INDUSTRI LIPUTAN TEMPOH NILAI BILANGAN GAJI &No. (KOD INDUSTRI) BILANGAN Period JUALAN PEKERJA UPAH
Industry description PEKERJA PRODUK BERGAJI YANG(Industry code) Employment YANG DIBUAT PADA DIBAYAR
coverage SENDIRI AKHIR Salaries(DI KILANG) TEMPOH & wages
Sales Number of paidvalue of own employees
manufactured engagedproducts at end of
(Ex-factory) period
(RM'000) (RM'000)
13. PEMBUATAN PRODUK COKLAT 2012 946,328 3,746 90,664DAN KONFEKSI GULA 2011 868,425 3,585 88,002Manufacture of chocolate products 2010 771,745 3,301 80,229and sugar confectionery 2009 526,953 3,209 63,011 (15432)
2012 (Jan.- Jul) 559,725 3,812 55,3502013 (Jan.- Jul) 711,591 4,870 67,855
100+ 2012 Jan. 74,278 3,522 7,615Feb. 81,440 3,683 8,504Mac 77,466 3,451 7,614Apr. 80,621 3,621 7,865Mei 81,353 3,643 7,944Jun 80,666 3,766 7,668Jul. 83,901 3,812 8,140Ogos 67,623 3,559 6,340Sept. 78,309 3,380 6,424Okt. 80,642 3,662 7,179Nov. 79,009 3,631 7,282Dis. 81,020 3,746 8,089
100+ 2013 Jan. 103,243 4,731 9,475Feb. 86,820 4,614 9,450Mac 99,737 4,824 9,803Apr. 104,627 4,918 9,584Mei 117,799 4,941 9,732Jun 99,649 4,898 9,980Jul. 99,716 4,870 9,831OgosSept.Okt.Nov.Dis.
14. PEMBUATAN PELBAGAI JENIS 2012 966,124 3,271 81,049SOS, TERMASUK BAHAN 2011 884,616 3,143 79,186PERASA SEPERTI MONOSODIUM 2010 790,332 2,845 66,627GLUTAMAT 2009 651,351 2,495 61,576 Manufacture of sauces includingflavouring extracts such as 2012 (Jan.- Jul) 574,805 3,362 46,020monosodium glutamate 2013 (Jan.- Jul) 585,134 3,475 54,739(15496)
30+ 2012 Jan. 75,024 3,183 6,139Feb. 75,075 3,211 6,269Mac 84,097 3,152 7,077Apr. 81,569 3,344 6,492Mei 86,896 3,309 6,660Jun 85,676 3,331 6,669Jul. 86,468 3,362 6,714Ogos 82,505 3,216 6,579Sept. 81,719 3,249 6,430Okt. 77,679 3,236 6,694Nov. 78,090 3,254 6,612Dis. 71,326 3,271 8,714
30+ 2013 Jan. 95,157 3,311 7,782Feb. 71,274 3,266 7,626Mac 80,582 3,265 8,517Apr. 77,736 3,265 7,737Mei 82,160 3,211 7,663Jun 87,811 3,454 7,690Jul. 90,414 3,475 7,724OgosSept.Okt.Nov.Dis.
JADUAL 1 (SAMB.) : PERANGKAAN UTAMA BAGI INDUSTRI PEMBUATAN YANG TERPILIHTable 1 (Cont'd) : Principal Statistics of Selected Manufacturing Industries
18
BIL. KETERANGAN INDUSTRI LIPUTAN TEMPOH NILAI BILANGAN GAJI &No. (KOD INDUSTRI) BILANGAN Period JUALAN PEKERJA UPAH
Industry description PEKERJA PRODUK BERGAJI YANG(Industry code) Employment YANG DIBUAT PADA DIBAYAR
coverage SENDIRI AKHIR Salaries(DI KILANG) TEMPOH & wages
Sales Number of paidvalue of own employees
manufactured engagedproducts at end of
(Ex-factory) period
(RM'000) (RM'000)
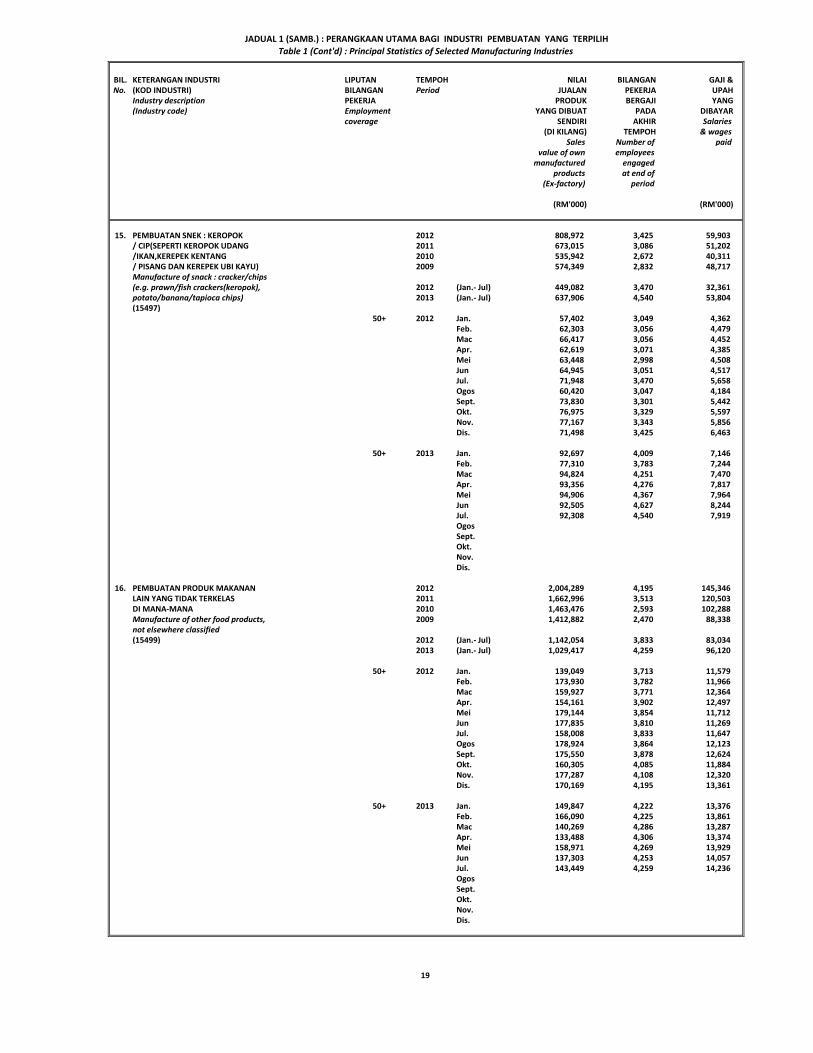
15. PEMBUATAN SNEK : KEROPOK 2012 808,972 3,425 59,903/ CIP(SEPERTI KEROPOK UDANG 2011 673,015 3,086 51,202/IKAN,KEREPEK KENTANG 2010 535,942 2,672 40,311/ PISANG DAN KEREPEK UBI KAYU) 2009 574,349 2,832 48,717 Manufacture of snack : cracker/chips(e.g. prawn/fish crackers(keropok), 2012 (Jan.- Jul) 449,082 3,470 32,361potato/banana/tapioca chips) 2013 (Jan.- Jul) 637,906 4,540 53,804(15497)
50+ 2012 Jan. 57,402 3,049 4,362Feb. 62,303 3,056 4,479Mac 66,417 3,056 4,452Apr. 62,619 3,071 4,385Mei 63,448 2,998 4,508Jun 64,945 3,051 4,517Jul. 71,948 3,470 5,658Ogos 60,420 3,047 4,184Sept. 73,830 3,301 5,442Okt. 76,975 3,329 5,597Nov. 77,167 3,343 5,856Dis. 71,498 3,425 6,463
50+ 2013 Jan. 92,697 4,009 7,146Feb. 77,310 3,783 7,244Mac 94,824 4,251 7,470Apr. 93,356 4,276 7,817Mei 94,906 4,367 7,964Jun 92,505 4,627 8,244Jul. 92,308 4,540 7,919OgosSept.Okt.Nov.Dis.
16. PEMBUATAN PRODUK MAKANAN 2012 2,004,289 4,195 145,346LAIN YANG TIDAK TERKELAS 2011 1,662,996 3,513 120,503DI MANA-MANA 2010 1,463,476 2,593 102,288Manufacture of other food products, 2009 1,412,882 2,470 88,338 not elsewhere classified(15499) 2012 (Jan.- Jul) 1,142,054 3,833 83,034
2013 (Jan.- Jul) 1,029,417 4,259 96,120
50+ 2012 Jan. 139,049 3,713 11,579Feb. 173,930 3,782 11,966Mac 159,927 3,771 12,364Apr. 154,161 3,902 12,497Mei 179,144 3,854 11,712Jun 177,835 3,810 11,269Jul. 158,008 3,833 11,647Ogos 178,924 3,864 12,123Sept. 175,550 3,878 12,624Okt. 160,305 4,085 11,884Nov. 177,287 4,108 12,320Dis. 170,169 4,195 13,361
50+ 2013 Jan. 149,847 4,222 13,376Feb. 166,090 4,225 13,861Mac 140,269 4,286 13,287Apr. 133,488 4,306 13,374Mei 158,971 4,269 13,929Jun 137,303 4,253 14,057Jul. 143,449 4,259 14,236OgosSept.Okt.Nov.Dis.
JADUAL 1 (SAMB.) : PERANGKAAN UTAMA BAGI INDUSTRI PEMBUATAN YANG TERPILIHTable 1 (Cont'd) : Principal Statistics of Selected Manufacturing Industries
19

BIL. KETERANGAN INDUSTRI LIPUTAN TEMPOH NILAI BILANGAN GAJI &No. (KOD INDUSTRI) BILANGAN Period JUALAN PEKERJA UPAH
Industry description PEKERJA PRODUK BERGAJI YANG(Industry code) Employment YANG DIBUAT PADA DIBAYAR
coverage SENDIRI AKHIR Salaries(DI KILANG) TEMPOH & wages
Sales Number of paidvalue of own employees
manufactured engagedproducts at end of
(Ex-factory) period
(RM'000) (RM'000)
17. PEMBUATAN MINUMAN RINGAN 2012 1,705,483 1,993 81,689Manufacture of soft drinks 2011 1,567,793 2,103 78,066(15541) 2010 1,578,314 1,693 59,460
2009 1,250,802 2,008 60,795
2012 (Jan.- Jul) 999,897 2,047 45,7322013 (Jan.- Jul) 1,080,529 2,284 57,077
100+ 2012 Jan. 159,069 2,086 7,140Feb. 119,991 2,121 6,687Mac 126,835 2,118 6,569Apr. 125,741 2,080 6,363Mei 144,910 2,077 6,329Jun 160,504 2,029 5,815Jul. 162,847 2,047 6,829Ogos 149,780 2,010 6,415Sept. 147,974 2,010 7,404Okt. 139,855 1,967 6,268Nov. 117,308 1,977 8,586Dis. 150,669 1,993 7,284
100+ 2013 Jan. 170,055 3,569 11,237Feb. 121,179 2,136 7,096Mac 119,853 2,122 7,831Apr. 147,787 2,154 7,053Mei 157,078 2,214 7,729Jun 187,894 2,260 7,642Jul. 176,683 2,284 8,489OgosSept.Okt.Nov.Dis.
18. PENGELUARAN AIR MINERAL 2012 371,799 1,521 24,880Production of mineral water 2011 259,123 1,293 19,418(15542) 2010 230,879 1,150 19,335
2009 203,744 1,113 18,703
2012 (Jan.- Jul) 213,100 1,522 14,2432013 (Jan.- Jul) 254,460 1,825 18,386
50+ 2012 Jan. 28,680 1,474 2,144Feb. 28,258 1,498 1,866Mac 30,262 1,491 1,973Apr. 30,517 1,501 2,028Mei 30,198 1,501 2,061Jun 31,253 1,519 2,061Jul. 33,932 1,522 2,110Ogos 33,659 1,549 2,114Sept. 30,908 1,547 2,109Okt. 31,464 1,538 2,117Nov. 32,232 1,544 2,209Dis. 30,436 1,521 2,088
50+ 2013 Jan. 33,409 1,764 2,546Feb. 32,356 1,805 2,470Mac 35,584 1,831 2,578Apr. 38,566 1,832 2,606Mei 35,088 1,817 2,607Jun 39,374 1,836 2,775Jul. 40,083 1,825 2,804OgosSept.Okt.Nov.Dis.
JADUAL 1 (SAMB.) : PERANGKAAN UTAMA BAGI INDUSTRI PEMBUATAN YANG TERPILIHTable 1 (Cont'd) : Principal Statistics of Selected Manufacturing Industries
20
BIL. KETERANGAN INDUSTRI LIPUTAN TEMPOH NILAI BILANGAN GAJI &No. (KOD INDUSTRI) BILANGAN Period JUALAN PEKERJA UPAH
Industry description PEKERJA PRODUK BERGAJI YANG(Industry code) Employment YANG DIBUAT PADA DIBAYAR
coverage SENDIRI AKHIR Salaries(DI KILANG) TEMPOH & wages
Sales Number of paidvalue of own employees
manufactured engagedproducts at end of
(Ex-factory) period
(RM'000) (RM'000)
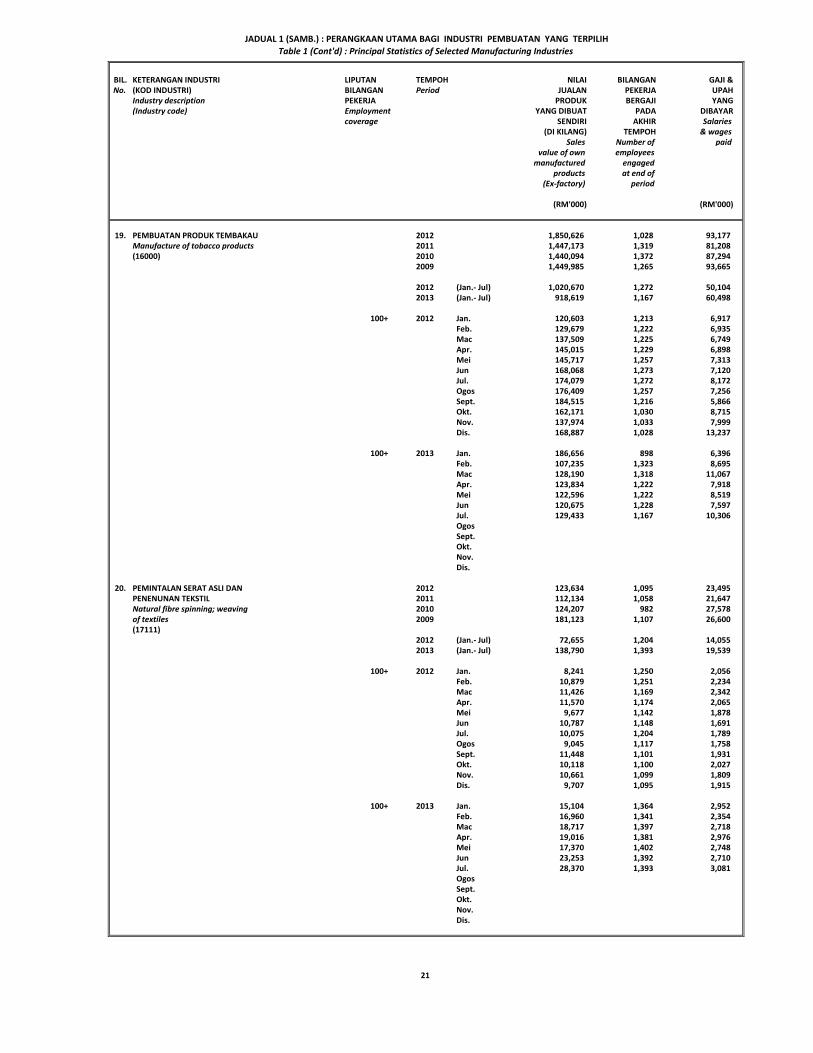
19. PEMBUATAN PRODUK TEMBAKAU 2012 1,850,626 1,028 93,177Manufacture of tobacco products 2011 1,447,173 1,319 81,208(16000) 2010 1,440,094 1,372 87,294
2009 1,449,985 1,265 93,665
2012 (Jan.- Jul) 1,020,670 1,272 50,1042013 (Jan.- Jul) 918,619 1,167 60,498
100+ 2012 Jan. 120,603 1,213 6,917Feb. 129,679 1,222 6,935Mac 137,509 1,225 6,749Apr. 145,015 1,229 6,898Mei 145,717 1,257 7,313Jun 168,068 1,273 7,120Jul. 174,079 1,272 8,172Ogos 176,409 1,257 7,256Sept. 184,515 1,216 5,866Okt. 162,171 1,030 8,715Nov. 137,974 1,033 7,999Dis. 168,887 1,028 13,237
100+ 2013 Jan. 186,656 898 6,396Feb. 107,235 1,323 8,695Mac 128,190 1,318 11,067Apr. 123,834 1,222 7,918Mei 122,596 1,222 8,519Jun 120,675 1,228 7,597Jul. 129,433 1,167 10,306OgosSept.Okt.Nov.Dis.
20. PEMINTALAN SERAT ASLI DAN 2012 123,634 1,095 23,495PENENUNAN TEKSTIL 2011 112,134 1,058 21,647Natural fibre spinning; weaving 2010 124,207 982 27,578of textiles 2009 181,123 1,107 26,600 (17111)
2012 (Jan.- Jul) 72,655 1,204 14,0552013 (Jan.- Jul) 138,790 1,393 19,539
100+ 2012 Jan. 8,241 1,250 2,056Feb. 10,879 1,251 2,234Mac 11,426 1,169 2,342Apr. 11,570 1,174 2,065Mei 9,677 1,142 1,878Jun 10,787 1,148 1,691Jul. 10,075 1,204 1,789Ogos 9,045 1,117 1,758Sept. 11,448 1,101 1,931Okt. 10,118 1,100 2,027Nov. 10,661 1,099 1,809Dis. 9,707 1,095 1,915
100+ 2013 Jan. 15,104 1,364 2,952Feb. 16,960 1,341 2,354Mac 18,717 1,397 2,718Apr. 19,016 1,381 2,976Mei 17,370 1,402 2,748Jun 23,253 1,392 2,710Jul. 28,370 1,393 3,081OgosSept.Okt.Nov.Dis.
JADUAL 1 (SAMB.) : PERANGKAAN UTAMA BAGI INDUSTRI PEMBUATAN YANG TERPILIHTable 1 (Cont'd) : Principal Statistics of Selected Manufacturing Industries
21
BIL. KETERANGAN INDUSTRI LIPUTAN TEMPOH NILAI BILANGAN GAJI &No. (KOD INDUSTRI) BILANGAN Period JUALAN PEKERJA UPAH
Industry description PEKERJA PRODUK BERGAJI YANG(Industry code) Employment YANG DIBUAT PADA DIBAYAR
coverage SENDIRI AKHIR Salaries(DI KILANG) TEMPOH & wages
Sales Number of paidvalue of own employees
manufactured engagedproducts at end of
(Ex-factory) period
(RM'000) (RM'000)
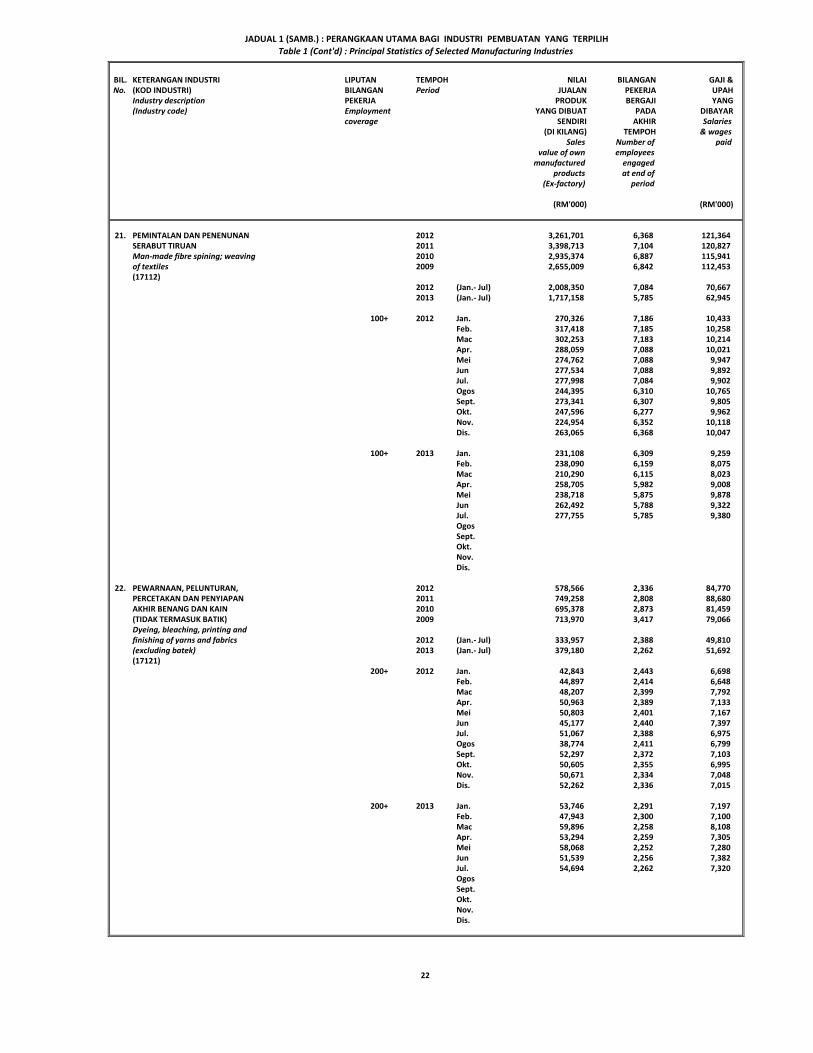
21. PEMINTALAN DAN PENENUNAN 2012 3,261,701 6,368 121,364SERABUT TIRUAN 2011 3,398,713 7,104 120,827Man-made fibre spining; weaving 2010 2,935,374 6,887 115,941of textiles 2009 2,655,009 6,842 112,453 (17112)
2012 (Jan.- Jul) 2,008,350 7,084 70,6672013 (Jan.- Jul) 1,717,158 5,785 62,945
100+ 2012 Jan. 270,326 7,186 10,433Feb. 317,418 7,185 10,258Mac 302,253 7,183 10,214Apr. 288,059 7,088 10,021Mei 274,762 7,088 9,947Jun 277,534 7,088 9,892Jul. 277,998 7,084 9,902Ogos 244,395 6,310 10,765Sept. 273,341 6,307 9,805Okt. 247,596 6,277 9,962Nov. 224,954 6,352 10,118Dis. 263,065 6,368 10,047
100+ 2013 Jan. 231,108 6,309 9,259Feb. 238,090 6,159 8,075Mac 210,290 6,115 8,023Apr. 258,705 5,982 9,008Mei 238,718 5,875 9,878Jun 262,492 5,788 9,322Jul. 277,755 5,785 9,380OgosSept.Okt.Nov.Dis.
22. PEWARNAAN, PELUNTURAN, 2012 578,566 2,336 84,770PERCETAKAN DAN PENYIAPAN 2011 749,258 2,808 88,680AKHIR BENANG DAN KAIN 2010 695,378 2,873 81,459(TIDAK TERMASUK BATIK) 2009 713,970 3,417 79,066 Dyeing, bleaching, printing andfinishing of yarns and fabrics 2012 (Jan.- Jul) 333,957 2,388 49,810(excluding batek) 2013 (Jan.- Jul) 379,180 2,262 51,692(17121)
200+ 2012 Jan. 42,843 2,443 6,698Feb. 44,897 2,414 6,648Mac 48,207 2,399 7,792Apr. 50,963 2,389 7,133Mei 50,803 2,401 7,167Jun 45,177 2,440 7,397Jul. 51,067 2,388 6,975Ogos 38,774 2,411 6,799Sept. 52,297 2,372 7,103Okt. 50,605 2,355 6,995Nov. 50,671 2,334 7,048Dis. 52,262 2,336 7,015
200+ 2013 Jan. 53,746 2,291 7,197Feb. 47,943 2,300 7,100Mac 59,896 2,258 8,108Apr. 53,294 2,259 7,305Mei 58,068 2,252 7,280Jun 51,539 2,256 7,382Jul. 54,694 2,262 7,320OgosSept.Okt.Nov.Dis.
JADUAL 1 (SAMB.) : PERANGKAAN UTAMA BAGI INDUSTRI PEMBUATAN YANG TERPILIHTable 1 (Cont'd) : Principal Statistics of Selected Manufacturing Industries
22
BIL. KETERANGAN INDUSTRI LIPUTAN TEMPOH NILAI BILANGAN GAJI &No. (KOD INDUSTRI) BILANGAN Period JUALAN PEKERJA UPAH
Industry description PEKERJA PRODUK BERGAJI YANG(Industry code) Employment YANG DIBUAT PADA DIBAYAR
coverage SENDIRI AKHIR Salaries(DI KILANG) TEMPOH & wages
Sales Number of paidvalue of own employees
manufactured engagedproducts at end of
(Ex-factory) period
(RM'000) (RM'000)
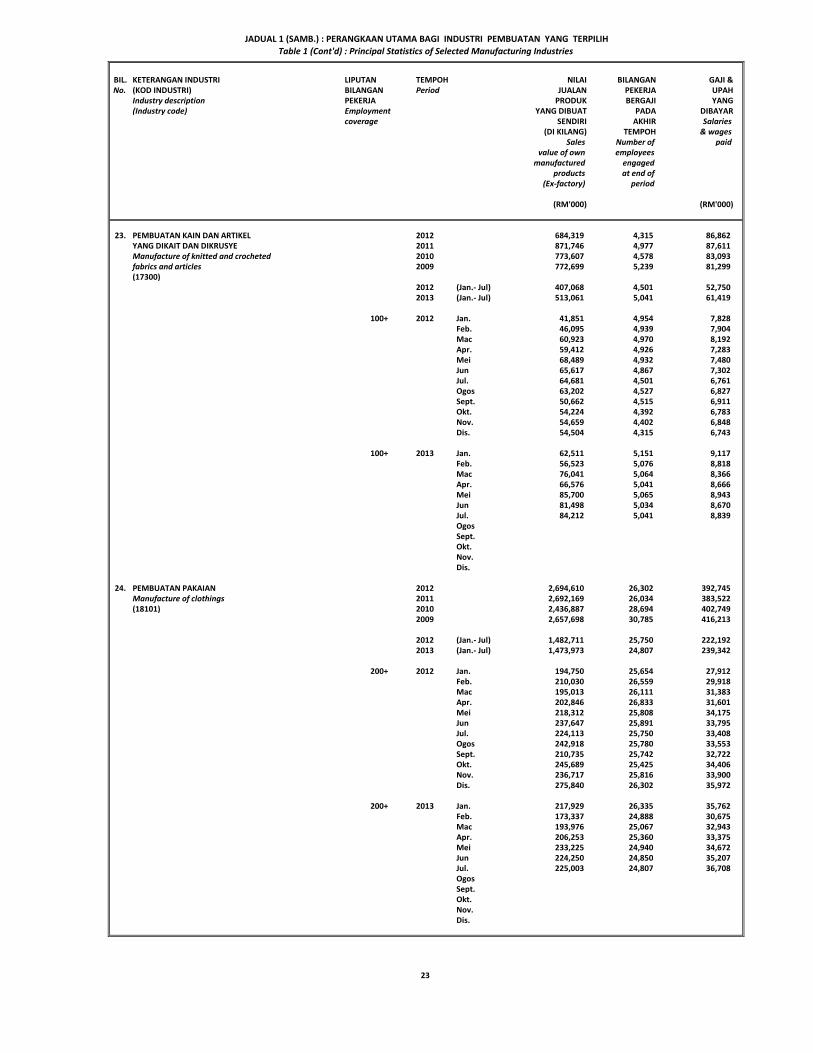
23. PEMBUATAN KAIN DAN ARTIKEL 2012 684,319 4,315 86,862YANG DIKAIT DAN DIKRUSYE 2011 871,746 4,977 87,611Manufacture of knitted and crocheted 2010 773,607 4,578 83,093fabrics and articles 2009 772,699 5,239 81,299 (17300)
2012 (Jan.- Jul) 407,068 4,501 52,7502013 (Jan.- Jul) 513,061 5,041 61,419
100+ 2012 Jan. 41,851 4,954 7,828Feb. 46,095 4,939 7,904Mac 60,923 4,970 8,192Apr. 59,412 4,926 7,283Mei 68,489 4,932 7,480Jun 65,617 4,867 7,302Jul. 64,681 4,501 6,761Ogos 63,202 4,527 6,827Sept. 50,662 4,515 6,911Okt. 54,224 4,392 6,783Nov. 54,659 4,402 6,848Dis. 54,504 4,315 6,743
100+ 2013 Jan. 62,511 5,151 9,117Feb. 56,523 5,076 8,818Mac 76,041 5,064 8,366Apr. 66,576 5,041 8,666Mei 85,700 5,065 8,943Jun 81,498 5,034 8,670Jul. 84,212 5,041 8,839OgosSept.Okt.Nov.Dis.
24. PEMBUATAN PAKAIAN 2012 2,694,610 26,302 392,745Manufacture of clothings 2011 2,692,169 26,034 383,522(18101) 2010 2,436,887 28,694 402,749
2009 2,657,698 30,785 416,213
2012 (Jan.- Jul) 1,482,711 25,750 222,1922013 (Jan.- Jul) 1,473,973 24,807 239,342
200+ 2012 Jan. 194,750 25,654 27,912Feb. 210,030 26,559 29,918Mac 195,013 26,111 31,383Apr. 202,846 26,833 31,601Mei 218,312 25,808 34,175Jun 237,647 25,891 33,795Jul. 224,113 25,750 33,408Ogos 242,918 25,780 33,553Sept. 210,735 25,742 32,722Okt. 245,689 25,425 34,406Nov. 236,717 25,816 33,900Dis. 275,840 26,302 35,972
200+ 2013 Jan. 217,929 26,335 35,762Feb. 173,337 24,888 30,675Mac 193,976 25,067 32,943Apr. 206,253 25,360 33,375Mei 233,225 24,940 34,672Jun 224,250 24,850 35,207Jul. 225,003 24,807 36,708OgosSept.Okt.Nov.Dis.
JADUAL 1 (SAMB.) : PERANGKAAN UTAMA BAGI INDUSTRI PEMBUATAN YANG TERPILIHTable 1 (Cont'd) : Principal Statistics of Selected Manufacturing Industries
23
BIL. KETERANGAN INDUSTRI LIPUTAN TEMPOH NILAI BILANGAN GAJI &No. (KOD INDUSTRI) BILANGAN Period JUALAN PEKERJA UPAH
Industry description PEKERJA PRODUK BERGAJI YANG(Industry code) Employment YANG DIBUAT PADA DIBAYAR
coverage SENDIRI AKHIR Salaries(DI KILANG) TEMPOH & wages
Sales Number of paidvalue of own employees
manufactured engagedproducts at end of
(Ex-factory) period
(RM'000) (RM'000)
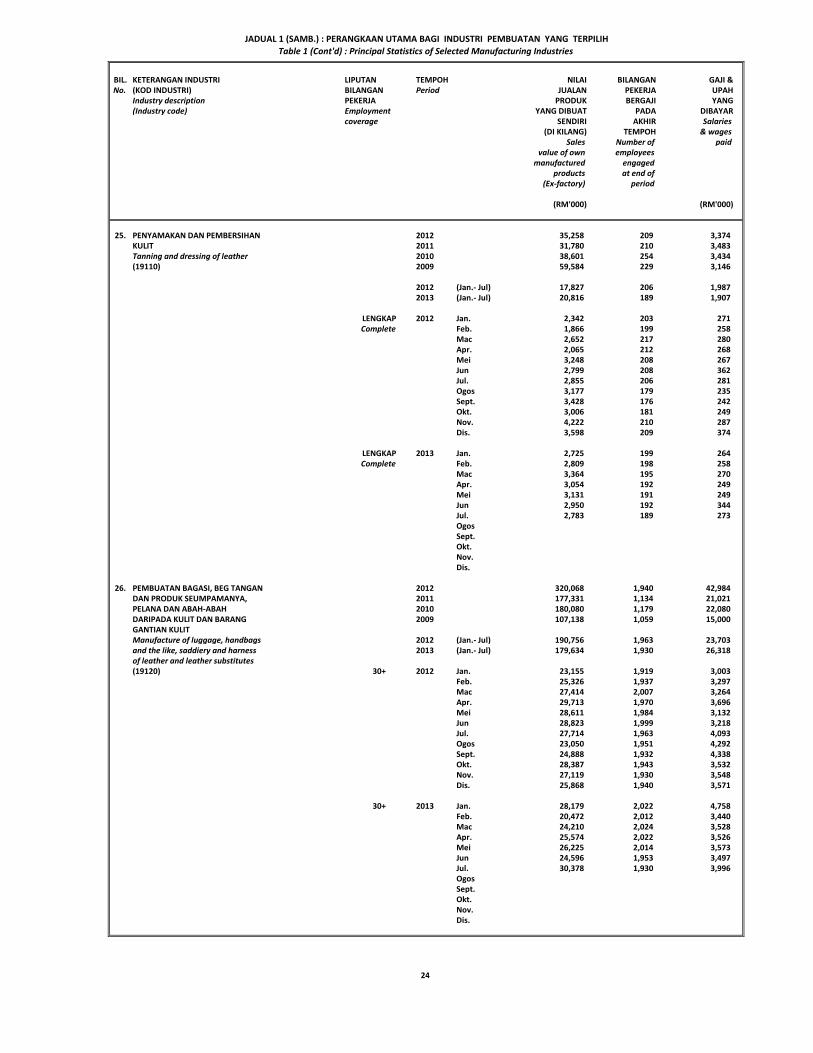
25. PENYAMAKAN DAN PEMBERSIHAN 2012 35,258 209 3,374KULIT 2011 31,780 210 3,483Tanning and dressing of leather 2010 38,601 254 3,434(19110) 2009 59,584 229 3,146
2012 (Jan.- Jul) 17,827 206 1,9872013 (Jan.- Jul) 20,816 189 1,907
LENGKAP 2012 Jan. 2,342 203 271Complete Feb. 1,866 199 258
Mac 2,652 217 280Apr. 2,065 212 268Mei 3,248 208 267Jun 2,799 208 362Jul. 2,855 206 281Ogos 3,177 179 235Sept. 3,428 176 242Okt. 3,006 181 249Nov. 4,222 210 287Dis. 3,598 209 374
LENGKAP 2013 Jan. 2,725 199 264Complete Feb. 2,809 198 258
Mac 3,364 195 270Apr. 3,054 192 249Mei 3,131 191 249Jun 2,950 192 344Jul. 2,783 189 273OgosSept.Okt.Nov.Dis.
26. PEMBUATAN BAGASI, BEG TANGAN 2012 320,068 1,940 42,984DAN PRODUK SEUMPAMANYA, 2011 177,331 1,134 21,021PELANA DAN ABAH-ABAH 2010 180,080 1,179 22,080DARIPADA KULIT DAN BARANG 2009 107,138 1,059 15,000 GANTIAN KULITManufacture of luggage, handbags 2012 (Jan.- Jul) 190,756 1,963 23,703and the like, saddiery and harness 2013 (Jan.- Jul) 179,634 1,930 26,318of leather and leather substitutes(19120) 30+ 2012 Jan. 23,155 1,919 3,003
Feb. 25,326 1,937 3,297Mac 27,414 2,007 3,264Apr. 29,713 1,970 3,696Mei 28,611 1,984 3,132Jun 28,823 1,999 3,218Jul. 27,714 1,963 4,093Ogos 23,050 1,951 4,292Sept. 24,888 1,932 4,338Okt. 28,387 1,943 3,532Nov. 27,119 1,930 3,548Dis. 25,868 1,940 3,571
30+ 2013 Jan. 28,179 2,022 4,758Feb. 20,472 2,012 3,440Mac 24,210 2,024 3,528Apr. 25,574 2,022 3,526Mei 26,225 2,014 3,573Jun 24,596 1,953 3,497Jul. 30,378 1,930 3,996OgosSept.Okt.Nov.Dis.
JADUAL 1 (SAMB.) : PERANGKAAN UTAMA BAGI INDUSTRI PEMBUATAN YANG TERPILIHTable 1 (Cont'd) : Principal Statistics of Selected Manufacturing Industries
24
BIL. KETERANGAN INDUSTRI LIPUTAN TEMPOH NILAI BILANGAN GAJI &No. (KOD INDUSTRI) BILANGAN Period JUALAN PEKERJA UPAH
Industry description PEKERJA PRODUK BERGAJI YANG(Industry code) Employment YANG DIBUAT PADA DIBAYAR
coverage SENDIRI AKHIR Salaries(DI KILANG) TEMPOH & wages
Sales Number of paidvalue of own employees
manufactured engagedproducts at end of
(Ex-factory) period
(RM'000) (RM'000)
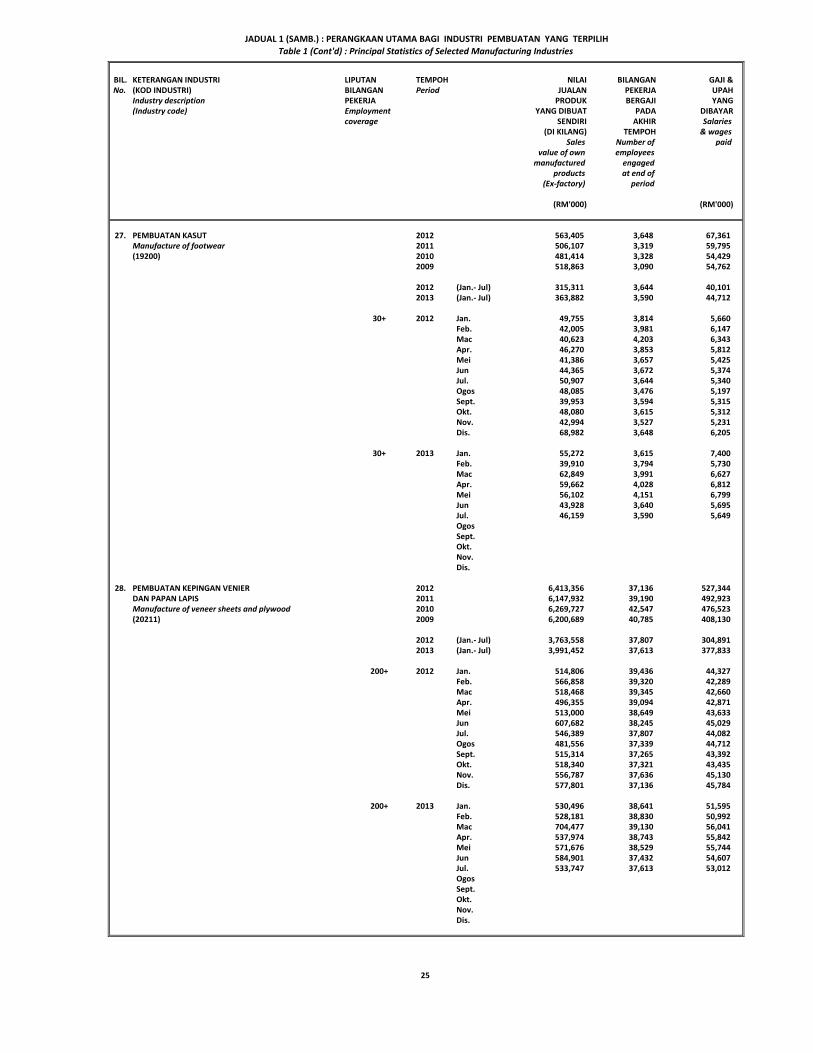
27. PEMBUATAN KASUT 2012 563,405 3,648 67,361Manufacture of footwear 2011 506,107 3,319 59,795(19200) 2010 481,414 3,328 54,429
2009 518,863 3,090 54,762
2012 (Jan.- Jul) 315,311 3,644 40,1012013 (Jan.- Jul) 363,882 3,590 44,712
30+ 2012 Jan. 49,755 3,814 5,660Feb. 42,005 3,981 6,147Mac 40,623 4,203 6,343Apr. 46,270 3,853 5,812Mei 41,386 3,657 5,425Jun 44,365 3,672 5,374Jul. 50,907 3,644 5,340Ogos 48,085 3,476 5,197Sept. 39,953 3,594 5,315Okt. 48,080 3,615 5,312Nov. 42,994 3,527 5,231Dis. 68,982 3,648 6,205
30+ 2013 Jan. 55,272 3,615 7,400Feb. 39,910 3,794 5,730Mac 62,849 3,991 6,627Apr. 59,662 4,028 6,812Mei 56,102 4,151 6,799Jun 43,928 3,640 5,695Jul. 46,159 3,590 5,649OgosSept.Okt.Nov.Dis.
28. PEMBUATAN KEPINGAN VENIER 2012 6,413,356 37,136 527,344DAN PAPAN LAPIS 2011 6,147,932 39,190 492,923Manufacture of veneer sheets and plywood 2010 6,269,727 42,547 476,523(20211) 2009 6,200,689 40,785 408,130
2012 (Jan.- Jul) 3,763,558 37,807 304,8912013 (Jan.- Jul) 3,991,452 37,613 377,833
200+ 2012 Jan. 514,806 39,436 44,327Feb. 566,858 39,320 42,289Mac 518,468 39,345 42,660Apr. 496,355 39,094 42,871Mei 513,000 38,649 43,633Jun 607,682 38,245 45,029Jul. 546,389 37,807 44,082Ogos 481,556 37,339 44,712Sept. 515,314 37,265 43,392Okt. 518,340 37,321 43,435Nov. 556,787 37,636 45,130Dis. 577,801 37,136 45,784
200+ 2013 Jan. 530,496 38,641 51,595Feb. 528,181 38,830 50,992Mac 704,477 39,130 56,041Apr. 537,974 38,743 55,842Mei 571,676 38,529 55,744Jun 584,901 37,432 54,607Jul. 533,747 37,613 53,012OgosSept.Okt.Nov.Dis.
JADUAL 1 (SAMB.) : PERANGKAAN UTAMA BAGI INDUSTRI PEMBUATAN YANG TERPILIHTable 1 (Cont'd) : Principal Statistics of Selected Manufacturing Industries
25
BIL. KETERANGAN INDUSTRI LIPUTAN TEMPOH NILAI BILANGAN GAJI &No. (KOD INDUSTRI) BILANGAN Period JUALAN PEKERJA UPAH
Industry description PEKERJA PRODUK BERGAJI YANG(Industry code) Employment YANG DIBUAT PADA DIBAYAR
coverage SENDIRI AKHIR Salaries(DI KILANG) TEMPOH & wages
Sales Number of paidvalue of own employees
manufactured engagedproducts at end of
(Ex-factory) period
(RM'000) (RM'000)
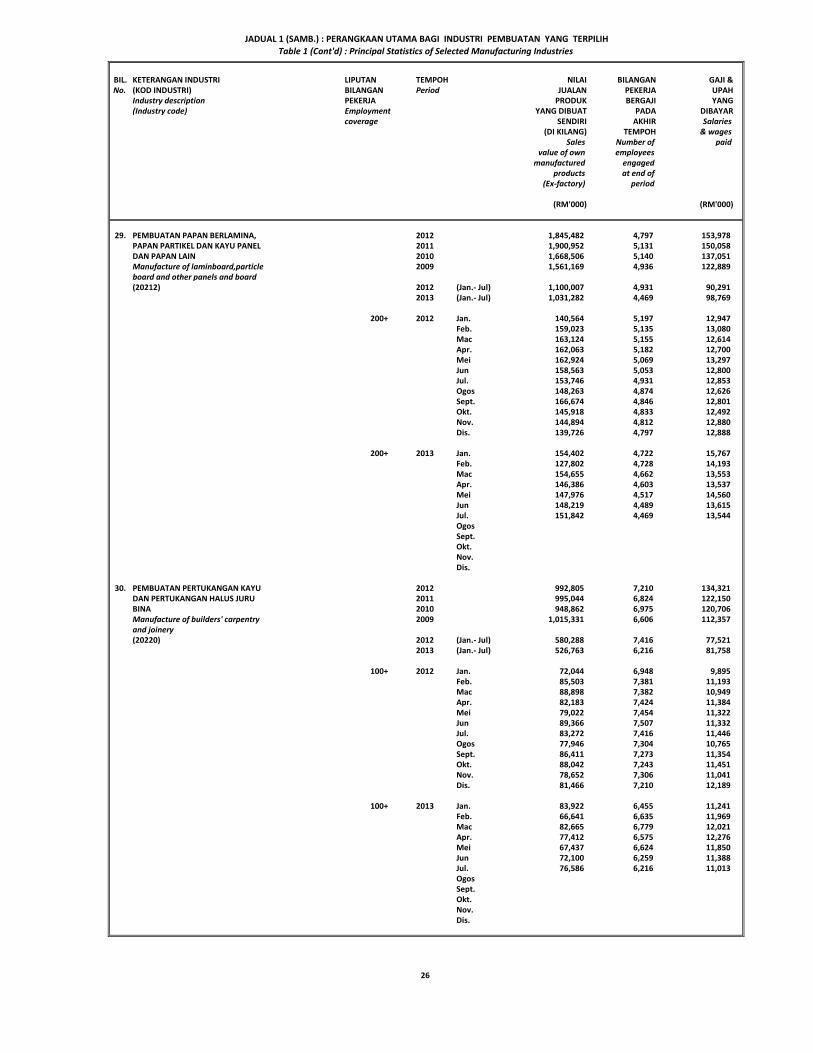
29. PEMBUATAN PAPAN BERLAMINA, 2012 1,845,482 4,797 153,978PAPAN PARTIKEL DAN KAYU PANEL 2011 1,900,952 5,131 150,058DAN PAPAN LAIN 2010 1,668,506 5,140 137,051Manufacture of laminboard,particle 2009 1,561,169 4,936 122,889 board and other panels and board(20212) 2012 (Jan.- Jul) 1,100,007 4,931 90,291
2013 (Jan.- Jul) 1,031,282 4,469 98,769
200+ 2012 Jan. 140,564 5,197 12,947Feb. 159,023 5,135 13,080Mac 163,124 5,155 12,614Apr. 162,063 5,182 12,700Mei 162,924 5,069 13,297Jun 158,563 5,053 12,800Jul. 153,746 4,931 12,853Ogos 148,263 4,874 12,626Sept. 166,674 4,846 12,801Okt. 145,918 4,833 12,492Nov. 144,894 4,812 12,880Dis. 139,726 4,797 12,888
200+ 2013 Jan. 154,402 4,722 15,767Feb. 127,802 4,728 14,193Mac 154,655 4,662 13,553Apr. 146,386 4,603 13,537Mei 147,976 4,517 14,560Jun 148,219 4,489 13,615Jul. 151,842 4,469 13,544OgosSept.Okt.Nov.Dis.
30. PEMBUATAN PERTUKANGAN KAYU 2012 992,805 7,210 134,321DAN PERTUKANGAN HALUS JURU 2011 995,044 6,824 122,150BINA 2010 948,862 6,975 120,706Manufacture of builders' carpentry 2009 1,015,331 6,606 112,357 and joinery(20220) 2012 (Jan.- Jul) 580,288 7,416 77,521
2013 (Jan.- Jul) 526,763 6,216 81,758
100+ 2012 Jan. 72,044 6,948 9,895Feb. 85,503 7,381 11,193Mac 88,898 7,382 10,949Apr. 82,183 7,424 11,384Mei 79,022 7,454 11,322Jun 89,366 7,507 11,332Jul. 83,272 7,416 11,446Ogos 77,946 7,304 10,765Sept. 86,411 7,273 11,354Okt. 88,042 7,243 11,451Nov. 78,652 7,306 11,041Dis. 81,466 7,210 12,189
100+ 2013 Jan. 83,922 6,455 11,241Feb. 66,641 6,635 11,969Mac 82,665 6,779 12,021Apr. 77,412 6,575 12,276Mei 67,437 6,624 11,850Jun 72,100 6,259 11,388Jul. 76,586 6,216 11,013OgosSept.Okt.Nov.Dis.
JADUAL 1 (SAMB.) : PERANGKAAN UTAMA BAGI INDUSTRI PEMBUATAN YANG TERPILIHTable 1 (Cont'd) : Principal Statistics of Selected Manufacturing Industries
26

BIL. KETERANGAN INDUSTRI LIPUTAN TEMPOH NILAI BILANGAN GAJI &No. (KOD INDUSTRI) BILANGAN Period JUALAN PEKERJA UPAH
Industry description PEKERJA PRODUK BERGAJI YANG(Industry code) Employment YANG DIBUAT PADA DIBAYAR
coverage SENDIRI AKHIR Salaries(DI KILANG) TEMPOH & wages
Sales Number of paidvalue of own employees
manufactured engagedproducts at end of
(Ex-factory) period
(RM'000) (RM'000)
31. PEMBUATAN PALPA, KERTAS 2012 2,094,355 6,415 174,463DAN KERTAS TEBAL 2011 1,932,248 5,354 148,922Manufacture of pulp, papers 2010 1,429,084 3,953 126,263and paperboard 2009 1,771,687 4,085 141,023 (21010)
2012 (Jan.- Jul) 1,208,002 6,232 100,1242013 (Jan.- Jul) 1,311,139 6,690 109,795
50+ 2012 Jan. 159,355 5,624 13,767Feb. 174,530 5,792 14,155Mac 187,197 5,941 13,891Apr. 171,060 6,023 14,255Mei 172,817 5,980 14,452Jun 168,459 5,994 15,114Jul. 174,584 6,232 14,490Ogos 167,280 6,208 14,594Sept. 181,460 6,341 15,470Okt. 195,312 6,368 14,758Nov. 163,093 6,376 14,491Dis. 179,208 6,415 15,026
50+ 2013 Jan. 200,911 6,581 15,298Feb. 162,999 6,624 15,183Mac 203,808 6,786 15,450Apr. 163,663 6,914 15,392Mei 193,462 6,903 16,665Jun 187,292 6,779 15,666Jul. 199,004 6,690 16,141OgosSept.Okt.Nov.Dis.
32. PEMBUATAN KERTAS GELUGUR 2012 3,716,603 12,196 295,314DAN KERTAS TEBAL DAN 2011 3,613,766 11,416 292,367BEKAS DARIPADA KERTAS 2010 3,577,490 11,278 265,004DAN KERTAS TEBAL 2009 2,827,450 10,311 213,521 Manufacture of corrugated paperand paperboard and of containers 2012 (Jan.- Jul) 2,202,474 12,227 171,402 of paper and paperboard 2013 (Jan.- Jul) 2,122,816 11,512 177,642(21020)
100+ 2012 Jan. 279,285 11,800 26,916Feb. 310,241 12,106 23,986Mac 320,223 12,133 23,872Apr. 308,133 11,723 23,326Mei 351,600 12,008 24,179Jun 314,200 12,174 24,436Jul. 318,792 12,227 24,687Ogos 286,706 12,163 24,235Sept. 310,474 12,262 24,633Okt. 315,765 12,253 24,833Nov. 304,675 12,241 24,580Dis. 296,509 12,196 25,631
100+ 2013 Jan. 294,836 11,390 26,577Feb. 261,239 11,454 24,978Mac 305,464 11,449 24,657Apr. 313,836 11,397 24,780Mei 305,947 11,387 24,883Jun 307,125 11,346 25,693Jul. 334,369 11,512 26,074OgosSept.Okt.Nov.Dis.
JADUAL 1 (SAMB.) : PERANGKAAN UTAMA BAGI INDUSTRI PEMBUATAN YANG TERPILIHTable 1 (Cont'd) : Principal Statistics of Selected Manufacturing Industries
27
BIL. KETERANGAN INDUSTRI LIPUTAN TEMPOH NILAI BILANGAN GAJI &No. (KOD INDUSTRI) BILANGAN Period JUALAN PEKERJA UPAH
Industry description PEKERJA PRODUK BERGAJI YANG(Industry code) Employment YANG DIBUAT PADA DIBAYAR
coverage SENDIRI AKHIR Salaries(DI KILANG) TEMPOH & wages
Sales Number of paidvalue of own employees
manufactured engagedproducts at end of
(Ex-factory) period
(RM'000) (RM'000)
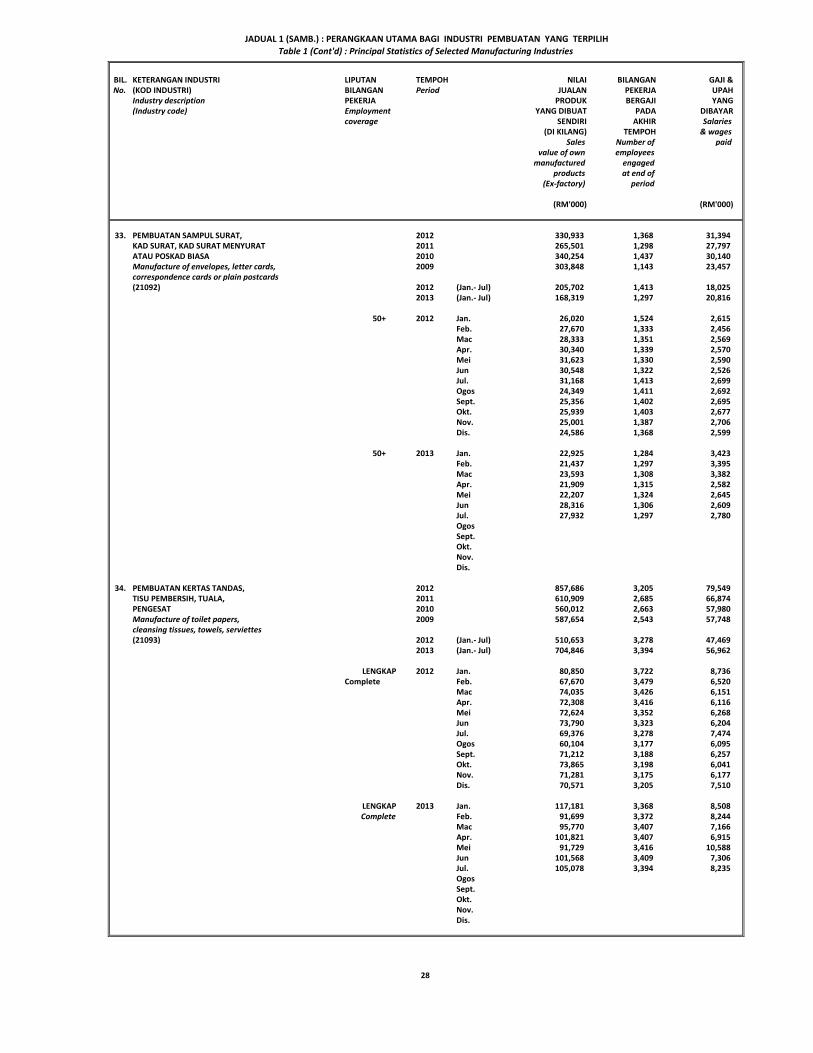
33. PEMBUATAN SAMPUL SURAT, 2012 330,933 1,368 31,394KAD SURAT, KAD SURAT MENYURAT 2011 265,501 1,298 27,797ATAU POSKAD BIASA 2010 340,254 1,437 30,140Manufacture of envelopes, letter cards, 2009 303,848 1,143 23,457 correspondence cards or plain postcards(21092) 2012 (Jan.- Jul) 205,702 1,413 18,025
2013 (Jan.- Jul) 168,319 1,297 20,816
50+ 2012 Jan. 26,020 1,524 2,615Feb. 27,670 1,333 2,456Mac 28,333 1,351 2,569Apr. 30,340 1,339 2,570Mei 31,623 1,330 2,590Jun 30,548 1,322 2,526Jul. 31,168 1,413 2,699Ogos 24,349 1,411 2,692Sept. 25,356 1,402 2,695Okt. 25,939 1,403 2,677Nov. 25,001 1,387 2,706Dis. 24,586 1,368 2,599
50+ 2013 Jan. 22,925 1,284 3,423Feb. 21,437 1,297 3,395Mac 23,593 1,308 3,382Apr. 21,909 1,315 2,582Mei 22,207 1,324 2,645Jun 28,316 1,306 2,609Jul. 27,932 1,297 2,780OgosSept.Okt.Nov.Dis.
34. PEMBUATAN KERTAS TANDAS, 2012 857,686 3,205 79,549TISU PEMBERSIH, TUALA, 2011 610,909 2,685 66,874PENGESAT 2010 560,012 2,663 57,980Manufacture of toilet papers, 2009 587,654 2,543 57,748 cleansing tissues, towels, serviettes(21093) 2012 (Jan.- Jul) 510,653 3,278 47,469
2013 (Jan.- Jul) 704,846 3,394 56,962
LENGKAP 2012 Jan. 80,850 3,722 8,736Complete Feb. 67,670 3,479 6,520
Mac 74,035 3,426 6,151Apr. 72,308 3,416 6,116Mei 72,624 3,352 6,268Jun 73,790 3,323 6,204Jul. 69,376 3,278 7,474Ogos 60,104 3,177 6,095Sept. 71,212 3,188 6,257Okt. 73,865 3,198 6,041Nov. 71,281 3,175 6,177Dis. 70,571 3,205 7,510
LENGKAP 2013 Jan. 117,181 3,368 8,508Complete Feb. 91,699 3,372 8,244
Mac 95,770 3,407 7,166Apr. 101,821 3,407 6,915Mei 91,729 3,416 10,588Jun 101,568 3,409 7,306Jul. 105,078 3,394 8,235OgosSept.Okt.Nov.Dis.
JADUAL 1 (SAMB.) : PERANGKAAN UTAMA BAGI INDUSTRI PEMBUATAN YANG TERPILIHTable 1 (Cont'd) : Principal Statistics of Selected Manufacturing Industries
28
BIL. KETERANGAN INDUSTRI LIPUTAN TEMPOH NILAI BILANGAN GAJI &No. (KOD INDUSTRI) BILANGAN Period JUALAN PEKERJA UPAH
Industry description PEKERJA PRODUK BERGAJI YANG(Industry code) Employment YANG DIBUAT PADA DIBAYAR
coverage SENDIRI AKHIR Salaries(DI KILANG) TEMPOH & wages
Sales Number of paidvalue of own employees
manufactured engagedproducts at end of
(Ex-factory) period
(RM'000) (RM'000)
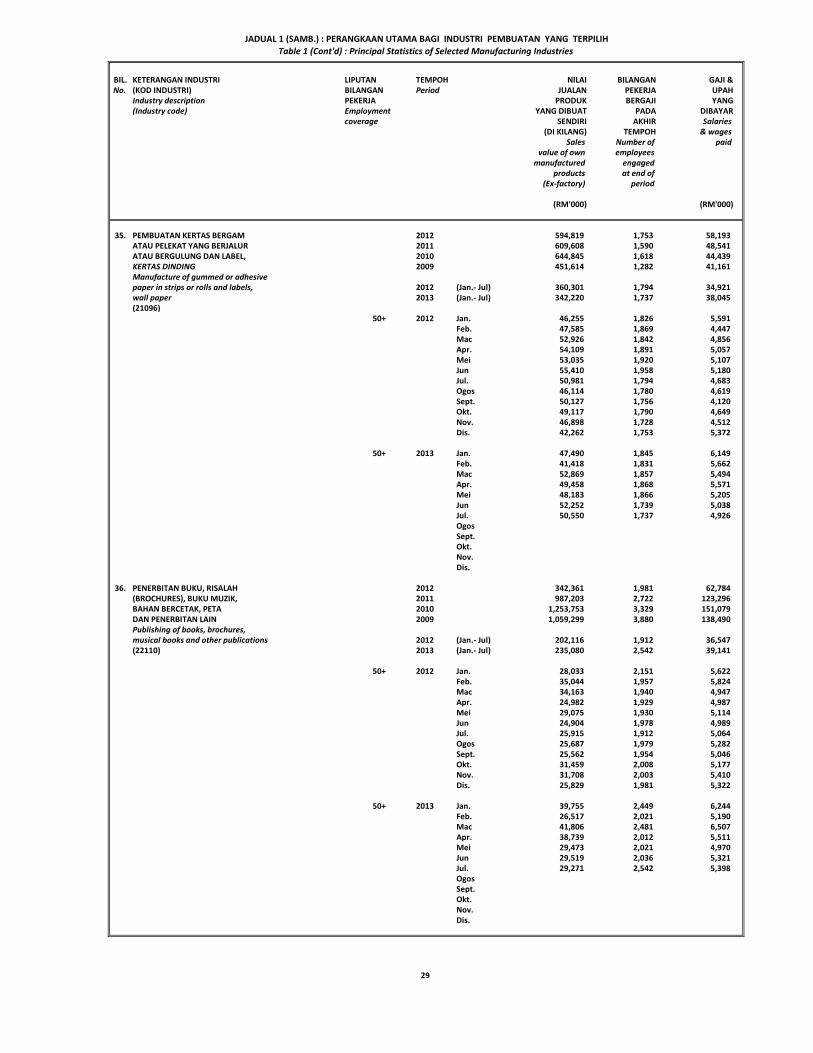
35. PEMBUATAN KERTAS BERGAM 2012 594,819 1,753 58,193ATAU PELEKAT YANG BERJALUR 2011 609,608 1,590 48,541ATAU BERGULUNG DAN LABEL, 2010 644,845 1,618 44,439KERTAS DINDING 2009 451,614 1,282 41,161 Manufacture of gummed or adhesivepaper in strips or rolls and labels, 2012 (Jan.- Jul) 360,301 1,794 34,921wall paper 2013 (Jan.- Jul) 342,220 1,737 38,045(21096)
50+ 2012 Jan. 46,255 1,826 5,591Feb. 47,585 1,869 4,447Mac 52,926 1,842 4,856Apr. 54,109 1,891 5,057Mei 53,035 1,920 5,107Jun 55,410 1,958 5,180Jul. 50,981 1,794 4,683Ogos 46,114 1,780 4,619Sept. 50,127 1,756 4,120Okt. 49,117 1,790 4,649Nov. 46,898 1,728 4,512Dis. 42,262 1,753 5,372
50+ 2013 Jan. 47,490 1,845 6,149Feb. 41,418 1,831 5,662Mac 52,869 1,857 5,494Apr. 49,458 1,868 5,571Mei 48,183 1,866 5,205Jun 52,252 1,739 5,038Jul. 50,550 1,737 4,926OgosSept.Okt.Nov.Dis.
36. PENERBITAN BUKU, RISALAH 2012 342,361 1,981 62,784(BROCHURES), BUKU MUZIK, 2011 987,203 2,722 123,296BAHAN BERCETAK, PETA 2010 1,253,753 3,329 151,079DAN PENERBITAN LAIN 2009 1,059,299 3,880 138,490 Publishing of books, brochures, musical books and other publications 2012 (Jan.- Jul) 202,116 1,912 36,547(22110) 2013 (Jan.- Jul) 235,080 2,542 39,141
50+ 2012 Jan. 28,033 2,151 5,622Feb. 35,044 1,957 5,824Mac 34,163 1,940 4,947Apr. 24,982 1,929 4,987Mei 29,075 1,930 5,114Jun 24,904 1,978 4,989Jul. 25,915 1,912 5,064Ogos 25,687 1,979 5,282Sept. 25,562 1,954 5,046Okt. 31,459 2,008 5,177Nov. 31,708 2,003 5,410Dis. 25,829 1,981 5,322
50+ 2013 Jan. 39,755 2,449 6,244Feb. 26,517 2,021 5,190Mac 41,806 2,481 6,507Apr. 38,739 2,012 5,511Mei 29,473 2,021 4,970Jun 29,519 2,036 5,321Jul. 29,271 2,542 5,398OgosSept.Okt.Nov.Dis.
JADUAL 1 (SAMB.) : PERANGKAAN UTAMA BAGI INDUSTRI PEMBUATAN YANG TERPILIHTable 1 (Cont'd) : Principal Statistics of Selected Manufacturing Industries
29
BIL. KETERANGAN INDUSTRI LIPUTAN TEMPOH NILAI BILANGAN GAJI &No. (KOD INDUSTRI) BILANGAN Period JUALAN PEKERJA UPAH
Industry description PEKERJA PRODUK BERGAJI YANG(Industry code) Employment YANG DIBUAT PADA DIBAYAR
coverage SENDIRI AKHIR Salaries(DI KILANG) TEMPOH & wages
Sales Number of paidvalue of own employees
manufactured engagedproducts at end of
(Ex-factory) period
(RM'000) (RM'000)
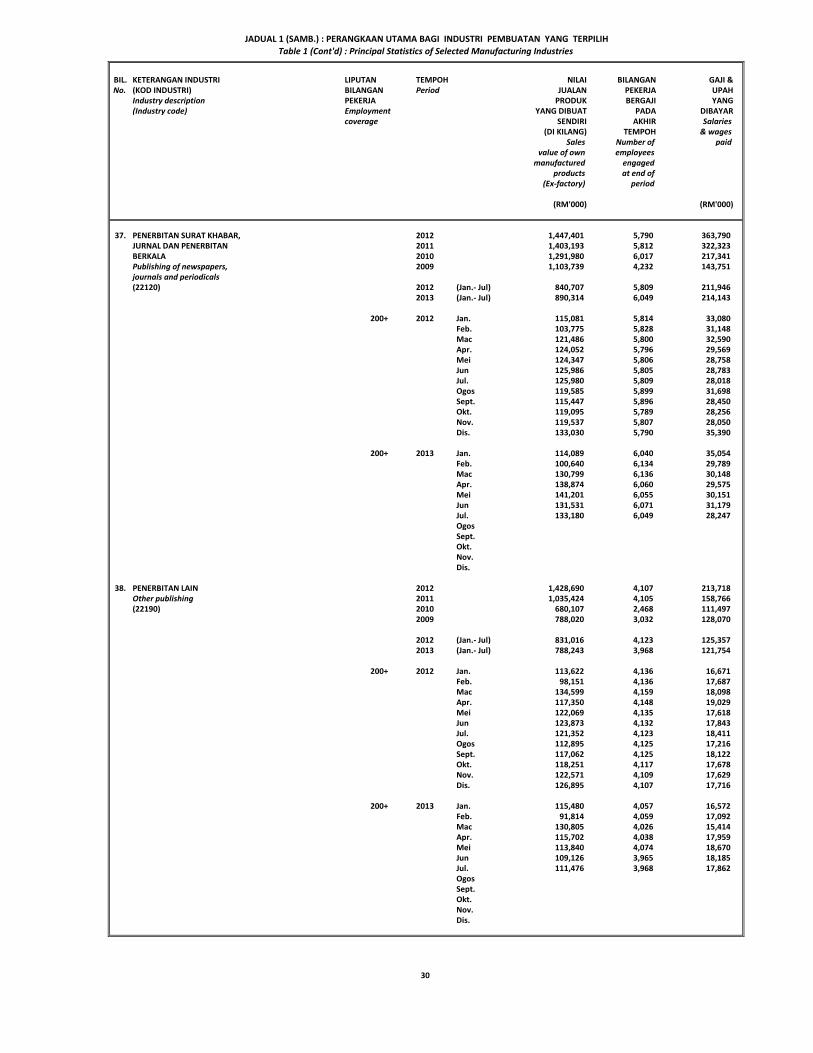
37. PENERBITAN SURAT KHABAR, 2012 1,447,401 5,790 363,790JURNAL DAN PENERBITAN 2011 1,403,193 5,812 322,323BERKALA 2010 1,291,980 6,017 217,341Publishing of newspapers, 2009 1,103,739 4,232 143,751 journals and periodicals(22120) 2012 (Jan.- Jul) 840,707 5,809 211,946
2013 (Jan.- Jul) 890,314 6,049 214,143
200+ 2012 Jan. 115,081 5,814 33,080Feb. 103,775 5,828 31,148Mac 121,486 5,800 32,590Apr. 124,052 5,796 29,569Mei 124,347 5,806 28,758Jun 125,986 5,805 28,783Jul. 125,980 5,809 28,018Ogos 119,585 5,899 31,698Sept. 115,447 5,896 28,450Okt. 119,095 5,789 28,256Nov. 119,537 5,807 28,050Dis. 133,030 5,790 35,390
200+ 2013 Jan. 114,089 6,040 35,054Feb. 100,640 6,134 29,789Mac 130,799 6,136 30,148Apr. 138,874 6,060 29,575Mei 141,201 6,055 30,151Jun 131,531 6,071 31,179Jul. 133,180 6,049 28,247OgosSept.Okt.Nov.Dis.
38. PENERBITAN LAIN 2012 1,428,690 4,107 213,718Other publishing 2011 1,035,424 4,105 158,766(22190) 2010 680,107 2,468 111,497
2009 788,020 3,032 128,070
2012 (Jan.- Jul) 831,016 4,123 125,3572013 (Jan.- Jul) 788,243 3,968 121,754
200+ 2012 Jan. 113,622 4,136 16,671Feb. 98,151 4,136 17,687Mac 134,599 4,159 18,098Apr. 117,350 4,148 19,029Mei 122,069 4,135 17,618Jun 123,873 4,132 17,843Jul. 121,352 4,123 18,411Ogos 112,895 4,125 17,216Sept. 117,062 4,125 18,122Okt. 118,251 4,117 17,678Nov. 122,571 4,109 17,629Dis. 126,895 4,107 17,716
200+ 2013 Jan. 115,480 4,057 16,572Feb. 91,814 4,059 17,092Mac 130,805 4,026 15,414Apr. 115,702 4,038 17,959Mei 113,840 4,074 18,670Jun 109,126 3,965 18,185Jul. 111,476 3,968 17,862OgosSept.Okt.Nov.Dis.
JADUAL 1 (SAMB.) : PERANGKAAN UTAMA BAGI INDUSTRI PEMBUATAN YANG TERPILIHTable 1 (Cont'd) : Principal Statistics of Selected Manufacturing Industries
30

BIL. KETERANGAN INDUSTRI LIPUTAN TEMPOH NILAI BILANGAN GAJI &No. (KOD INDUSTRI) BILANGAN Period JUALAN PEKERJA UPAH
Industry description PEKERJA PRODUK BERGAJI YANG(Industry code) Employment YANG DIBUAT PADA DIBAYAR
coverage SENDIRI AKHIR Salaries(DI KILANG) TEMPOH & wages
Sales Number of paidvalue of own employees
manufactured engagedproducts at end of
(Ex-factory) period
(RM'000) (RM'000)
39. PERCETAKAN 2012 1,008,513 5,457 132,710Printing 2011 808,988 4,316 104,521(22210) 2010 638,055 3,483 74,086
2009 521,829 2,963 61,594
2012 (Jan.- Jul) 575,526 5,266 76,8642013 (Jan.- Jul) 613,959 5,955 86,524
50+ 2012 Jan. 70,693 5,372 11,592Feb. 79,782 5,620 10,620Mac 90,404 5,519 10,904Apr. 84,516 5,489 10,889Mei 84,031 5,342 10,678Jun 86,646 5,471 11,003Jul. 79,454 5,266 11,178Ogos 74,122 5,195 10,857Sept. 80,305 5,294 10,982Okt. 89,907 5,427 11,302Nov. 96,102 5,451 11,193Dis. 92,551 5,457 11,512
50+ 2013 Jan. 88,084 5,672 12,393Feb. 73,732 5,643 12,494Mac 90,874 5,699 12,268Apr. 87,572 5,652 12,127Mei 90,801 5,687 12,167Jun 91,881 5,942 12,644Jul. 91,015 5,955 12,431OgosSept.Okt.Nov.Dis.
40. AKTIVITI PERKHIDMATAN 2012 1,828,839 10,686 308,405BERKAITAN PERCETAKAN 2011 1,752,318 10,490 284,844Service activities related to printing 2010 1,742,036 9,904 259,838(22220) 2009 1,849,522 10,307 254,218
2012 (Jan.- Jul) 1,050,620 10,684 175,8972013 (Jan.- Jul) 1,069,038 10,265 181,733
50+ 2012 Jan. 141,089 10,616 26,224Feb. 145,545 10,635 24,768Mac 145,732 10,684 24,431Apr. 147,068 10,778 24,710Mei 158,937 10,782 25,507Jun 156,819 10,774 24,793Jul. 155,430 10,684 25,464Ogos 144,937 10,581 24,571Sept. 145,869 10,559 26,679Okt. 159,359 10,515 26,995Nov. 165,646 10,410 25,139Dis. 162,408 10,686 29,124
50+ 2013 Jan. 150,498 10,254 25,136Feb. 133,872 10,686 25,080Mac 147,184 10,707 24,591Apr. 161,188 10,709 27,798Mei 164,801 10,724 27,241Jun 150,995 10,739 25,912Jul. 160,500 10,265 25,975OgosSept.Okt.Nov.Dis.
JADUAL 1 (SAMB.) : PERANGKAAN UTAMA BAGI INDUSTRI PEMBUATAN YANG TERPILIHTable 1 (Cont'd) : Principal Statistics of Selected Manufacturing Industries
31
BIL. KETERANGAN INDUSTRI LIPUTAN TEMPOH NILAI BILANGAN GAJI &No. (KOD INDUSTRI) BILANGAN Period JUALAN PEKERJA UPAH
Industry description PEKERJA PRODUK BERGAJI YANG(Industry code) Employment YANG DIBUAT PADA DIBAYAR
coverage SENDIRI AKHIR Salaries(DI KILANG) TEMPOH & wages
Sales Number of paidvalue of own employees
manufactured engagedproducts at end of
(Ex-factory) period
(RM'000) (RM'000)
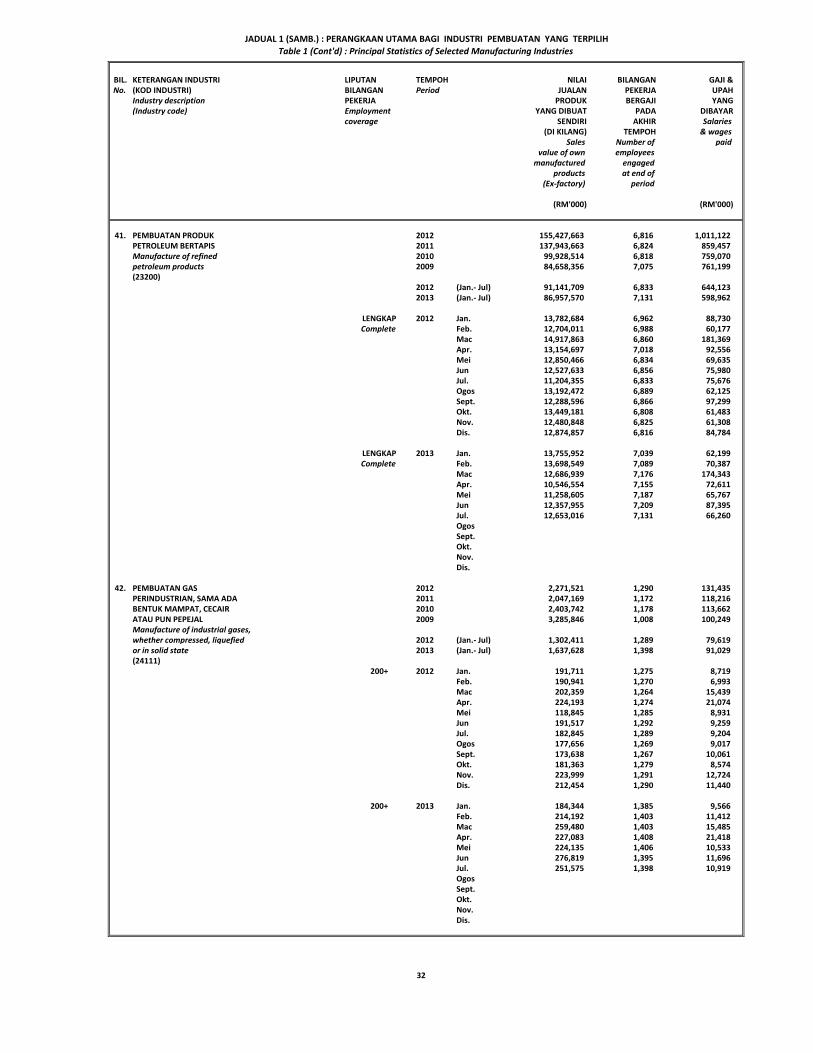
41. PEMBUATAN PRODUK 2012 155,427,663 6,816 1,011,122PETROLEUM BERTAPIS 2011 137,943,663 6,824 859,457Manufacture of refined 2010 99,928,514 6,818 759,070petroleum products 2009 84,658,356 7,075 761,199 (23200)
2012 (Jan.- Jul) 91,141,709 6,833 644,1232013 (Jan.- Jul) 86,957,570 7,131 598,962
LENGKAP 2012 Jan. 13,782,684 6,962 88,730Complete Feb. 12,704,011 6,988 60,177
Mac 14,917,863 6,860 181,369Apr. 13,154,697 7,018 92,556Mei 12,850,466 6,834 69,635Jun 12,527,633 6,856 75,980Jul. 11,204,355 6,833 75,676Ogos 13,192,472 6,889 62,125Sept. 12,288,596 6,866 97,299Okt. 13,449,181 6,808 61,483Nov. 12,480,848 6,825 61,308Dis. 12,874,857 6,816 84,784
LENGKAP 2013 Jan. 13,755,952 7,039 62,199Complete Feb. 13,698,549 7,089 70,387
Mac 12,686,939 7,176 174,343Apr. 10,546,554 7,155 72,611Mei 11,258,605 7,187 65,767Jun 12,357,955 7,209 87,395Jul. 12,653,016 7,131 66,260OgosSept.Okt.Nov.Dis.
42. PEMBUATAN GAS 2012 2,271,521 1,290 131,435PERINDUSTRIAN, SAMA ADA 2011 2,047,169 1,172 118,216BENTUK MAMPAT, CECAIR 2010 2,403,742 1,178 113,662ATAU PUN PEPEJAL 2009 3,285,846 1,008 100,249 Manufacture of industrial gases,whether compressed, liquefied 2012 (Jan.- Jul) 1,302,411 1,289 79,619or in solid state 2013 (Jan.- Jul) 1,637,628 1,398 91,029(24111)
200+ 2012 Jan. 191,711 1,275 8,719Feb. 190,941 1,270 6,993Mac 202,359 1,264 15,439Apr. 224,193 1,274 21,074Mei 118,845 1,285 8,931Jun 191,517 1,292 9,259Jul. 182,845 1,289 9,204Ogos 177,656 1,269 9,017Sept. 173,638 1,267 10,061Okt. 181,363 1,279 8,574Nov. 223,999 1,291 12,724Dis. 212,454 1,290 11,440
200+ 2013 Jan. 184,344 1,385 9,566Feb. 214,192 1,403 11,412Mac 259,480 1,403 15,485Apr. 227,083 1,408 21,418Mei 224,135 1,406 10,533Jun 276,819 1,395 11,696Jul. 251,575 1,398 10,919OgosSept.Okt.Nov.Dis.
JADUAL 1 (SAMB.) : PERANGKAAN UTAMA BAGI INDUSTRI PEMBUATAN YANG TERPILIHTable 1 (Cont'd) : Principal Statistics of Selected Manufacturing Industries
32

BIL. KETERANGAN INDUSTRI LIPUTAN TEMPOH NILAI BILANGAN GAJI &No. (KOD INDUSTRI) BILANGAN Period JUALAN PEKERJA UPAH
Industry description PEKERJA PRODUK BERGAJI YANG(Industry code) Employment YANG DIBUAT PADA DIBAYAR
coverage SENDIRI AKHIR Salaries(DI KILANG) TEMPOH & wages
Sales Number of paidvalue of own employees
manufactured engagedproducts at end of
(Ex-factory) period
(RM'000) (RM'000)
43. PEMBUATAN KIMIA 2012 30,663,829 9,123 730,731PERINDUSTRIAN ASAS LAIN 2011 32,458,644 8,895 790,373KECUALI BAJA DAN 2010 28,207,480 8,638 645,955SEBATIAN NITROJEN 2009 20,529,943 9,473 618,804 Manufacture of other basicindustrial chemicals except 2012 (Jan.- Jul) 18,178,692 8,996 444,012fertilizers and nitrogen compounds 2013 (Jan.- Jul) 16,388,985 9,256 455,567(24119)
100+ 2012 Jan. 2,651,703 8,807 50,432Feb. 2,641,071 8,846 53,564Mac 2,782,785 8,804 89,650Apr. 2,639,409 8,829 80,800Mei 2,433,703 8,883 61,751Jun 2,541,109 9,008 53,844Jul. 2,488,912 8,996 53,971Ogos 2,445,652 9,188 54,257Sept. 2,397,327 9,206 62,276Okt. 2,606,744 9,204 54,976Nov. 2,436,577 9,096 53,748Dis. 2,598,837 9,123 61,462
100+ 2013 Jan. 2,500,470 9,131 57,326Feb. 2,319,563 9,229 55,468Mac 2,596,751 9,353 88,395Apr. 2,162,831 9,274 81,576Mei 2,117,001 9,232 55,493Jun 2,378,949 9,269 61,625Jul. 2,313,420 9,256 55,684OgosSept.Okt.Nov.Dis.
44. PEMBUATAN BAJA DAN 2012 3,442,490 1,945 126,837SEBATIAN NITROJEN 2011 2,917,082 1,926 169,193Manufacture of fertilizers 2010 2,289,509 1,865 130,063and nitrogen compounds 2009 2,430,188 1,836 104,898 (24120)
2012 (Jan.- Jul) 2,158,393 1,979 77,9102013 (Jan.- Jul) 2,226,946 2,173 85,433
50+ 2012 Jan. 257,960 1,885 9,573Feb. 280,795 1,810 9,477Mac 380,524 1,893 16,059Apr. 319,797 1,948 10,483Mei 364,283 1,961 9,840Jun 248,447 1,972 12,012Jul. 306,587 1,979 10,466Ogos 186,175 1,951 9,370Sept. 267,431 1,949 9,264Okt. 279,069 1,949 9,272Nov. 303,902 1,945 8,977Dis. 247,520 1,945 12,044
50+ 2013 Jan. 283,669 2,176 10,594Feb. 318,986 2,193 10,585Mac 383,093 2,189 16,290Apr. 327,510 2,166 12,251Mei 319,931 2,151 11,001Jun 293,251 2,166 13,247Jul. 300,506 2,173 11,465OgosSept.Okt.Nov.Dis.
JADUAL 1 (SAMB.) : PERANGKAAN UTAMA BAGI INDUSTRI PEMBUATAN YANG TERPILIHTable 1 (Cont'd) : Principal Statistics of Selected Manufacturing Industries
33
BIL. KETERANGAN INDUSTRI LIPUTAN TEMPOH NILAI BILANGAN GAJI &No. (KOD INDUSTRI) BILANGAN Period JUALAN PEKERJA UPAH
Industry description PEKERJA PRODUK BERGAJI YANG(Industry code) Employment YANG DIBUAT PADA DIBAYAR
coverage SENDIRI AKHIR Salaries(DI KILANG) TEMPOH & wages
Sales Number of paidvalue of own employees
manufactured engagedproducts at end of
(Ex-factory) period
(RM'000) (RM'000)
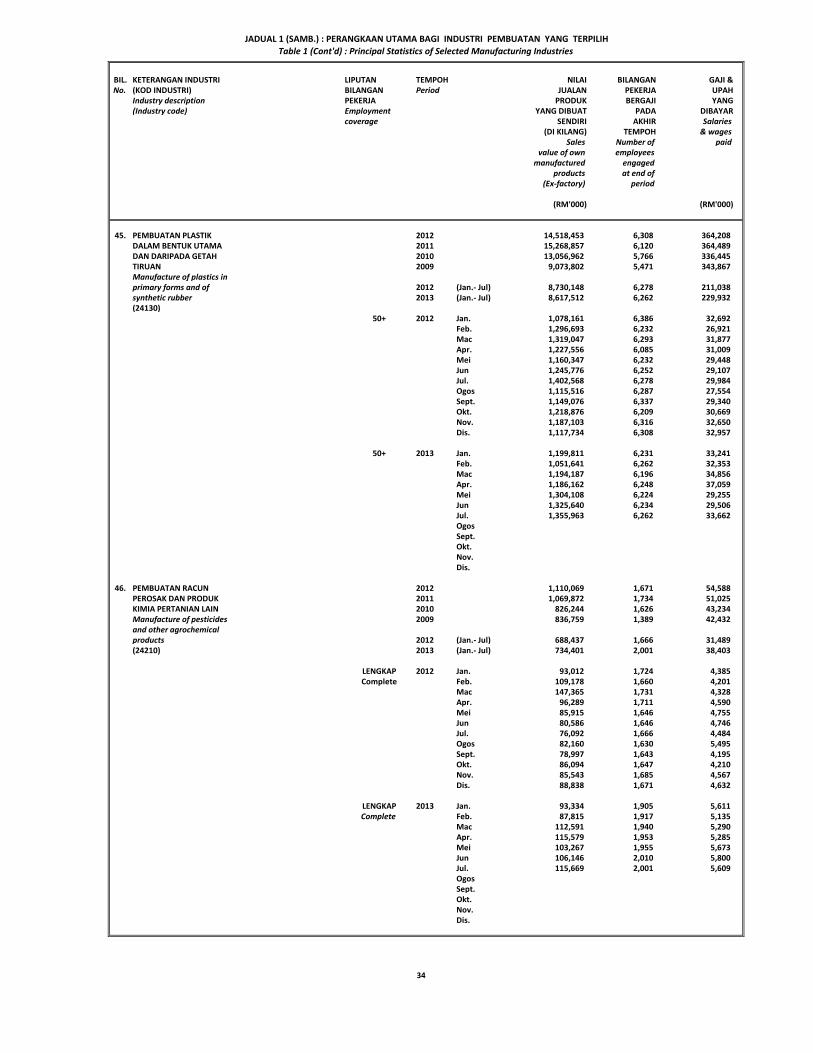
45. PEMBUATAN PLASTIK 2012 14,518,453 6,308 364,208DALAM BENTUK UTAMA 2011 15,268,857 6,120 364,489DAN DARIPADA GETAH 2010 13,056,962 5,766 336,445TIRUAN 2009 9,073,802 5,471 343,867 Manufacture of plastics inprimary forms and of 2012 (Jan.- Jul) 8,730,148 6,278 211,038synthetic rubber 2013 (Jan.- Jul) 8,617,512 6,262 229,932(24130)
50+ 2012 Jan. 1,078,161 6,386 32,692Feb. 1,296,693 6,232 26,921Mac 1,319,047 6,293 31,877Apr. 1,227,556 6,085 31,009Mei 1,160,347 6,232 29,448Jun 1,245,776 6,252 29,107Jul. 1,402,568 6,278 29,984Ogos 1,115,516 6,287 27,554Sept. 1,149,076 6,337 29,340Okt. 1,218,876 6,209 30,669Nov. 1,187,103 6,316 32,650Dis. 1,117,734 6,308 32,957
50+ 2013 Jan. 1,199,811 6,231 33,241Feb. 1,051,641 6,262 32,353Mac 1,194,187 6,196 34,856Apr. 1,186,162 6,248 37,059Mei 1,304,108 6,224 29,255Jun 1,325,640 6,234 29,506Jul. 1,355,963 6,262 33,662OgosSept.Okt.Nov.Dis.
46. PEMBUATAN RACUN 2012 1,110,069 1,671 54,588PEROSAK DAN PRODUK 2011 1,069,872 1,734 51,025KIMIA PERTANIAN LAIN 2010 826,244 1,626 43,234Manufacture of pesticides 2009 836,759 1,389 42,432 and other agrochemicalproducts 2012 (Jan.- Jul) 688,437 1,666 31,489(24210) 2013 (Jan.- Jul) 734,401 2,001 38,403
LENGKAP 2012 Jan. 93,012 1,724 4,385Complete Feb. 109,178 1,660 4,201
Mac 147,365 1,731 4,328Apr. 96,289 1,711 4,590Mei 85,915 1,646 4,755Jun 80,586 1,646 4,746Jul. 76,092 1,666 4,484Ogos 82,160 1,630 5,495Sept. 78,997 1,643 4,195Okt. 86,094 1,647 4,210Nov. 85,543 1,685 4,567Dis. 88,838 1,671 4,632
LENGKAP 2013 Jan. 93,334 1,905 5,611Complete Feb. 87,815 1,917 5,135
Mac 112,591 1,940 5,290Apr. 115,579 1,953 5,285Mei 103,267 1,955 5,673Jun 106,146 2,010 5,800Jul. 115,669 2,001 5,609OgosSept.Okt.Nov.Dis.
JADUAL 1 (SAMB.) : PERANGKAAN UTAMA BAGI INDUSTRI PEMBUATAN YANG TERPILIHTable 1 (Cont'd) : Principal Statistics of Selected Manufacturing Industries
34
BIL. KETERANGAN INDUSTRI LIPUTAN TEMPOH NILAI BILANGAN GAJI &No. (KOD INDUSTRI) BILANGAN Period JUALAN PEKERJA UPAH
Industry description PEKERJA PRODUK BERGAJI YANG(Industry code) Employment YANG DIBUAT PADA DIBAYAR
coverage SENDIRI AKHIR Salaries(DI KILANG) TEMPOH & wages
Sales Number of paidvalue of own employees
manufactured engagedproducts at end of
(Ex-factory) period
(RM'000) (RM'000)
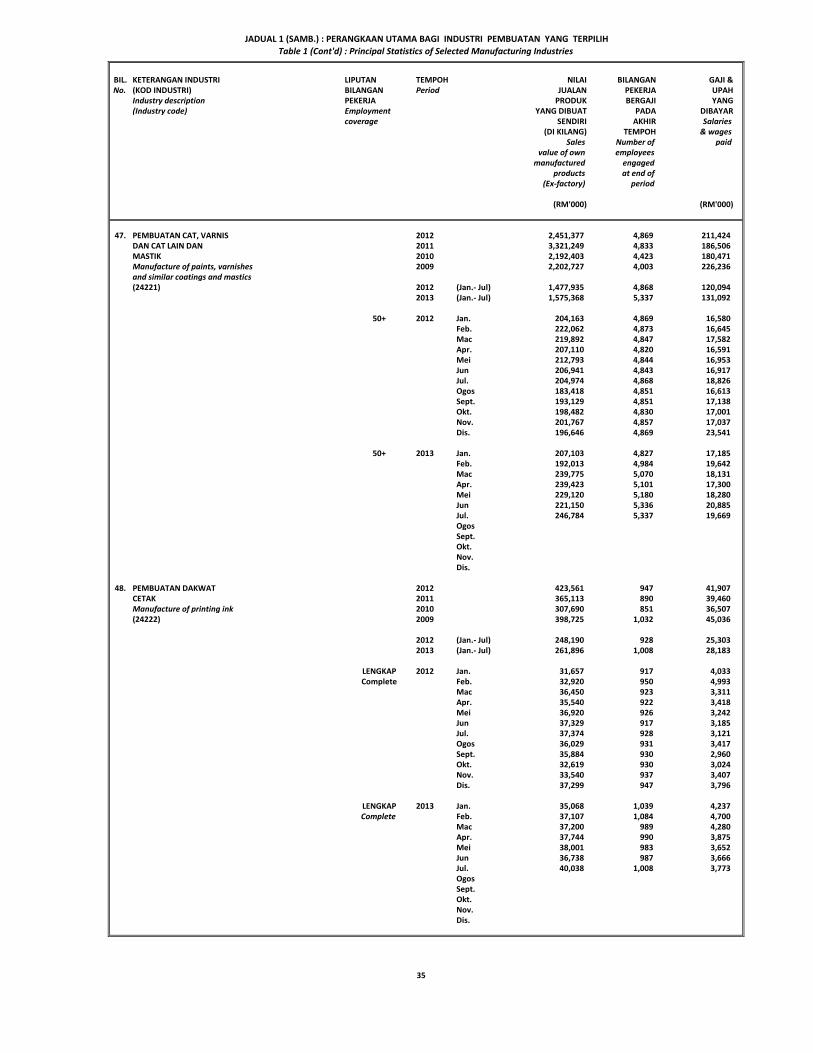
47. PEMBUATAN CAT, VARNIS 2012 2,451,377 4,869 211,424DAN CAT LAIN DAN 2011 3,321,249 4,833 186,506MASTIK 2010 2,192,403 4,423 180,471Manufacture of paints, varnishes 2009 2,202,727 4,003 226,236 and similar coatings and mastics(24221) 2012 (Jan.- Jul) 1,477,935 4,868 120,094
2013 (Jan.- Jul) 1,575,368 5,337 131,092
50+ 2012 Jan. 204,163 4,869 16,580Feb. 222,062 4,873 16,645Mac 219,892 4,847 17,582Apr. 207,110 4,820 16,591Mei 212,793 4,844 16,953Jun 206,941 4,843 16,917Jul. 204,974 4,868 18,826Ogos 183,418 4,851 16,613Sept. 193,129 4,851 17,138Okt. 198,482 4,830 17,001Nov. 201,767 4,857 17,037Dis. 196,646 4,869 23,541
50+ 2013 Jan. 207,103 4,827 17,185Feb. 192,013 4,984 19,642Mac 239,775 5,070 18,131Apr. 239,423 5,101 17,300Mei 229,120 5,180 18,280Jun 221,150 5,336 20,885Jul. 246,784 5,337 19,669OgosSept.Okt.Nov.Dis.
48. PEMBUATAN DAKWAT 2012 423,561 947 41,907CETAK 2011 365,113 890 39,460Manufacture of printing ink 2010 307,690 851 36,507(24222) 2009 398,725 1,032 45,036
2012 (Jan.- Jul) 248,190 928 25,3032013 (Jan.- Jul) 261,896 1,008 28,183
LENGKAP 2012 Jan. 31,657 917 4,033Complete Feb. 32,920 950 4,993
Mac 36,450 923 3,311Apr. 35,540 922 3,418Mei 36,920 926 3,242Jun 37,329 917 3,185Jul. 37,374 928 3,121Ogos 36,029 931 3,417Sept. 35,884 930 2,960Okt. 32,619 930 3,024Nov. 33,540 937 3,407Dis. 37,299 947 3,796
LENGKAP 2013 Jan. 35,068 1,039 4,237Complete Feb. 37,107 1,084 4,700
Mac 37,200 989 4,280Apr. 37,744 990 3,875Mei 38,001 983 3,652Jun 36,738 987 3,666Jul. 40,038 1,008 3,773OgosSept.Okt.Nov.Dis.
JADUAL 1 (SAMB.) : PERANGKAAN UTAMA BAGI INDUSTRI PEMBUATAN YANG TERPILIHTable 1 (Cont'd) : Principal Statistics of Selected Manufacturing Industries
35

BIL. KETERANGAN INDUSTRI LIPUTAN TEMPOH NILAI BILANGAN GAJI &No. (KOD INDUSTRI) BILANGAN Period JUALAN PEKERJA UPAH
Industry description PEKERJA PRODUK BERGAJI YANG(Industry code) Employment YANG DIBUAT PADA DIBAYAR
coverage SENDIRI AKHIR Salaries(DI KILANG) TEMPOH & wages
Sales Number of paidvalue of own employees
manufactured engagedproducts at end of
(Ex-factory) period
(RM'000) (RM'000)
49. PEMBUATAN PRODUK 2012 1,709,786 7,832 253,595FARMASEUTIKAL, 2011 1,365,372 6,253 178,669KIMIA PERUBATAN DAN 2010 1,187,166 5,850 160,630BOTANI 2009 1,184,088 5,702 149,594 Manufacture of pharmaceuticals, medicinal 2012 (Jan.- Jul) 1,016,877 8,129 145,908chemicals and botanical 2013 (Jan.- Jul) 940,241 7,808 152,265products(24230) 100+ 2012 Jan. 124,165 7,576 18,669
Feb. 137,561 7,786 18,677Mac 148,439 7,851 19,749Apr. 148,083 8,057 22,787Mei 159,542 8,149 21,804Jun 149,916 8,132 21,618Jul. 149,171 8,129 22,604Ogos 133,063 8,093 23,153Sept. 145,627 8,046 21,871Okt. 139,015 7,868 19,583Nov. 139,403 7,823 19,908Dis. 135,801 7,832 23,172
100+ 2013 Jan. 124,292 7,450 22,688Feb. 121,934 7,422 20,005Mac 143,562 7,467 23,742Apr. 140,810 7,475 21,374Mei 136,680 7,663 21,284Jun 133,565 7,829 20,759Jul. 139,398 7,808 22,413OgosSept.Okt.Nov.Dis.
50. PEMBUATAN SABUN DAN 2012 1,630,484 4,055 148,112BAHAN CUCI, PERSEDIAAN 2011 1,549,912 3,740 161,212PENGILAT DAN PENCUCI, 2010 1,521,314 3,717 155,683PEWANGI DAN PRODUK 2009 1,656,878 3,597 138,456 DANDANAN DIRIManufacture of soap and 2012 (Jan.- Jul) 984,903 4,404 90,877detergents, cleaning and 2013 (Jan.- Jul) 1,036,650 5,464 97,856polishing preparations, perfumes and toilet 50+ 2012 Jan. 120,648 4,082 14,013(24240) Feb. 137,714 4,463 14,030
Mac 148,091 4,352 14,593Apr. 137,421 4,544 12,934Mei 145,510 4,389 11,819Jun 146,717 4,333 11,655Jul. 148,802 4,404 11,833Ogos 122,526 4,277 11,088Sept. 132,230 4,319 11,188Okt. 135,520 4,370 10,836Nov. 134,649 4,148 10,296Dis. 120,656 4,055 13,827
50+ 2013 Jan. 139,314 5,340 14,166Feb. 123,493 5,327 13,016Mac 151,419 5,789 13,660Apr. 149,444 5,776 14,186Mei 158,633 5,889 14,165Jun 159,160 5,975 14,682Jul. 155,187 5,464 13,981OgosSept.Okt.Nov.Dis.
JADUAL 1 (SAMB.) : PERANGKAAN UTAMA BAGI INDUSTRI PEMBUATAN YANG TERPILIHTable 1 (Cont'd) : Principal Statistics of Selected Manufacturing Industries
36
BIL. KETERANGAN INDUSTRI LIPUTAN TEMPOH NILAI BILANGAN GAJI &No. (KOD INDUSTRI) BILANGAN Period JUALAN PEKERJA UPAH
Industry description PEKERJA PRODUK BERGAJI YANG(Industry code) Employment YANG DIBUAT PADA DIBAYAR
coverage SENDIRI AKHIR Salaries(DI KILANG) TEMPOH & wages
Sales Number of paidvalue of own employees
manufactured engagedproducts at end of
(Ex-factory) period
(RM'000) (RM'000)
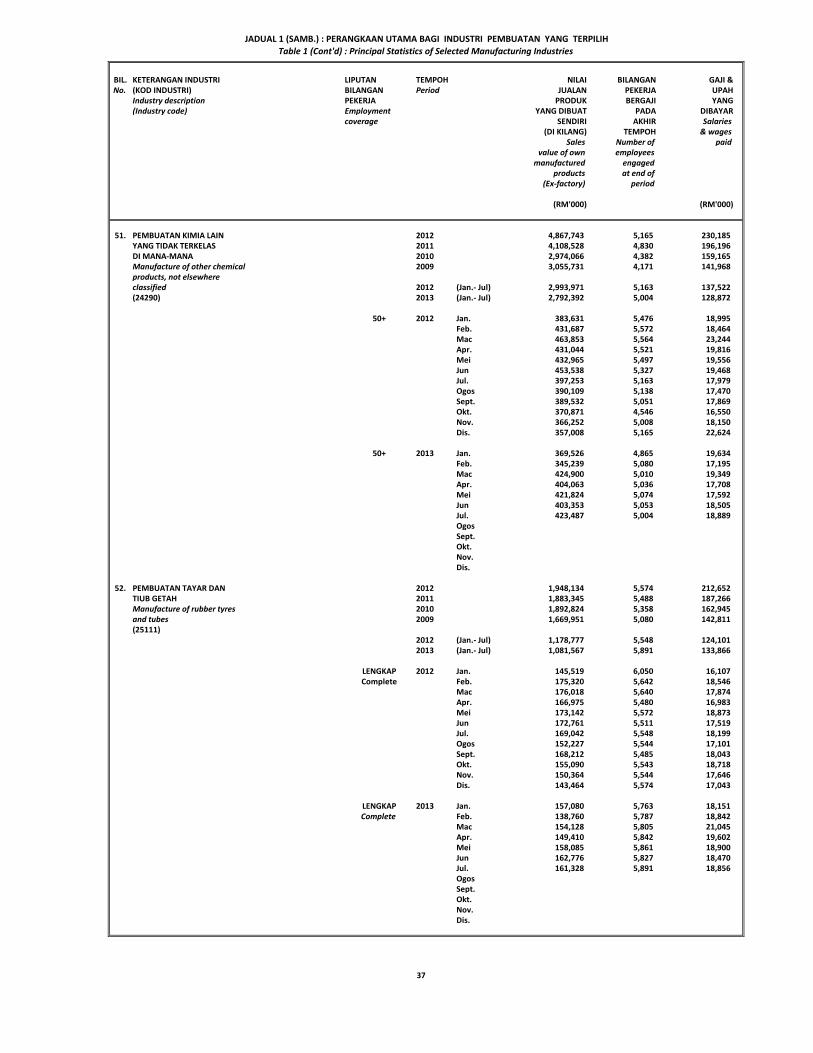
51. PEMBUATAN KIMIA LAIN 2012 4,867,743 5,165 230,185YANG TIDAK TERKELAS 2011 4,108,528 4,830 196,196DI MANA-MANA 2010 2,974,066 4,382 159,165Manufacture of other chemical 2009 3,055,731 4,171 141,968 products, not elsewhereclassified 2012 (Jan.- Jul) 2,993,971 5,163 137,522(24290) 2013 (Jan.- Jul) 2,792,392 5,004 128,872
50+ 2012 Jan. 383,631 5,476 18,995Feb. 431,687 5,572 18,464Mac 463,853 5,564 23,244Apr. 431,044 5,521 19,816Mei 432,965 5,497 19,556Jun 453,538 5,327 19,468Jul. 397,253 5,163 17,979Ogos 390,109 5,138 17,470Sept. 389,532 5,051 17,869Okt. 370,871 4,546 16,550Nov. 366,252 5,008 18,150Dis. 357,008 5,165 22,624
50+ 2013 Jan. 369,526 4,865 19,634Feb. 345,239 5,080 17,195Mac 424,900 5,010 19,349Apr. 404,063 5,036 17,708Mei 421,824 5,074 17,592Jun 403,353 5,053 18,505Jul. 423,487 5,004 18,889OgosSept.Okt.Nov.Dis.
52. PEMBUATAN TAYAR DAN 2012 1,948,134 5,574 212,652TIUB GETAH 2011 1,883,345 5,488 187,266Manufacture of rubber tyres 2010 1,892,824 5,358 162,945and tubes 2009 1,669,951 5,080 142,811 (25111)
2012 (Jan.- Jul) 1,178,777 5,548 124,1012013 (Jan.- Jul) 1,081,567 5,891 133,866
LENGKAP 2012 Jan. 145,519 6,050 16,107Complete Feb. 175,320 5,642 18,546
Mac 176,018 5,640 17,874Apr. 166,975 5,480 16,983Mei 173,142 5,572 18,873Jun 172,761 5,511 17,519Jul. 169,042 5,548 18,199Ogos 152,227 5,544 17,101Sept. 168,212 5,485 18,043Okt. 155,090 5,543 18,718Nov. 150,364 5,544 17,646Dis. 143,464 5,574 17,043
LENGKAP 2013 Jan. 157,080 5,763 18,151Complete Feb. 138,760 5,787 18,842
Mac 154,128 5,805 21,045Apr. 149,410 5,842 19,602Mei 158,085 5,861 18,900Jun 162,776 5,827 18,470Jul. 161,328 5,891 18,856OgosSept.Okt.Nov.Dis.
JADUAL 1 (SAMB.) : PERANGKAAN UTAMA BAGI INDUSTRI PEMBUATAN YANG TERPILIHTable 1 (Cont'd) : Principal Statistics of Selected Manufacturing Industries
37
BIL. KETERANGAN INDUSTRI LIPUTAN TEMPOH NILAI BILANGAN GAJI &No. (KOD INDUSTRI) BILANGAN Period JUALAN PEKERJA UPAH
Industry description PEKERJA PRODUK BERGAJI YANG(Industry code) Employment YANG DIBUAT PADA DIBAYAR
coverage SENDIRI AKHIR Salaries(DI KILANG) TEMPOH & wages
Sales Number of paidvalue of own employees
manufactured engagedproducts at end of
(Ex-factory) period
(RM'000) (RM'000)
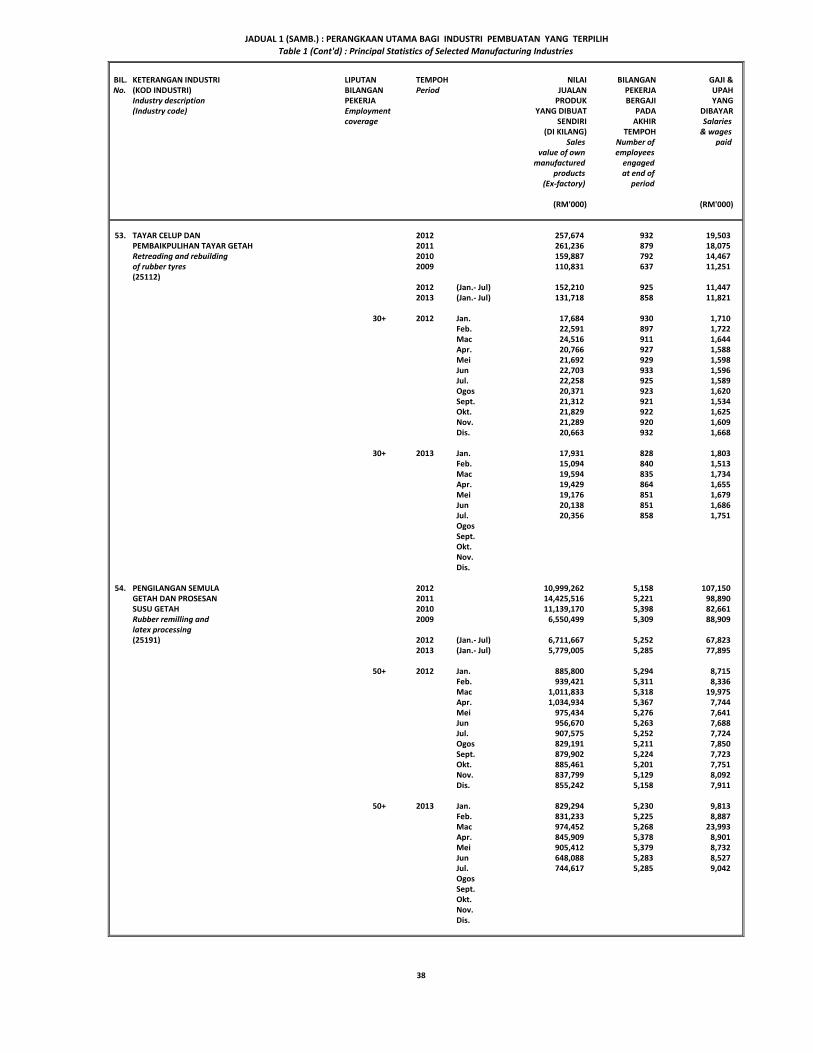
53. TAYAR CELUP DAN 2012 257,674 932 19,503PEMBAIKPULIHAN TAYAR GETAH 2011 261,236 879 18,075Retreading and rebuilding 2010 159,887 792 14,467of rubber tyres 2009 110,831 637 11,251 (25112)
2012 (Jan.- Jul) 152,210 925 11,4472013 (Jan.- Jul) 131,718 858 11,821
30+ 2012 Jan. 17,684 930 1,710Feb. 22,591 897 1,722Mac 24,516 911 1,644Apr. 20,766 927 1,588Mei 21,692 929 1,598Jun 22,703 933 1,596Jul. 22,258 925 1,589Ogos 20,371 923 1,620Sept. 21,312 921 1,534Okt. 21,829 922 1,625Nov. 21,289 920 1,609Dis. 20,663 932 1,668
30+ 2013 Jan. 17,931 828 1,803Feb. 15,094 840 1,513Mac 19,594 835 1,734Apr. 19,429 864 1,655Mei 19,176 851 1,679Jun 20,138 851 1,686Jul. 20,356 858 1,751OgosSept.Okt.Nov.Dis.
54. PENGILANGAN SEMULA 2012 10,999,262 5,158 107,150GETAH DAN PROSESAN 2011 14,425,516 5,221 98,890SUSU GETAH 2010 11,139,170 5,398 82,661Rubber remilling and 2009 6,550,499 5,309 88,909 latex processing(25191) 2012 (Jan.- Jul) 6,711,667 5,252 67,823
2013 (Jan.- Jul) 5,779,005 5,285 77,895
50+ 2012 Jan. 885,800 5,294 8,715Feb. 939,421 5,311 8,336Mac 1,011,833 5,318 19,975Apr. 1,034,934 5,367 7,744Mei 975,434 5,276 7,641Jun 956,670 5,263 7,688Jul. 907,575 5,252 7,724Ogos 829,191 5,211 7,850Sept. 879,902 5,224 7,723Okt. 885,461 5,201 7,751Nov. 837,799 5,129 8,092Dis. 855,242 5,158 7,911
50+ 2013 Jan. 829,294 5,230 9,813Feb. 831,233 5,225 8,887Mac 974,452 5,268 23,993Apr. 845,909 5,378 8,901Mei 905,412 5,379 8,732Jun 648,088 5,283 8,527Jul. 744,617 5,285 9,042OgosSept.Okt.Nov.Dis.
JADUAL 1 (SAMB.) : PERANGKAAN UTAMA BAGI INDUSTRI PEMBUATAN YANG TERPILIHTable 1 (Cont'd) : Principal Statistics of Selected Manufacturing Industries
38

BIL. KETERANGAN INDUSTRI LIPUTAN TEMPOH NILAI BILANGAN GAJI &No. (KOD INDUSTRI) BILANGAN Period JUALAN PEKERJA UPAH
Industry description PEKERJA PRODUK BERGAJI YANG(Industry code) Employment YANG DIBUAT PADA DIBAYAR
coverage SENDIRI AKHIR Salaries(DI KILANG) TEMPOH & wages
Sales Number of paidvalue of own employees
manufactured engagedproducts at end of
(Ex-factory) period
(RM'000) (RM'000)
55. PEMBUATAN SARUNG TANGAN 2012 9,830,953 39,325 674,390GETAH 2011 8,482,728 33,635 599,623Manufacture of rubber gloves 2010 7,785,434 34,590 549,264(25193) 2009 6,427,253 31,814 483,032
2012 (Jan.- Jul) 5,553,042 37,410 377,9552013 (Jan.- Jul) 5,689,596 39,300 487,061
200+ 2012 Jan. 710,177 34,983 53,318Feb. 700,721 34,950 50,975Mac 777,594 34,818 52,033Apr. 789,891 35,133 54,110Mei 866,181 36,288 54,941Jun 835,341 36,533 55,119Jul. 873,137 37,410 57,459Ogos 854,539 37,995 55,736Sept. 833,202 38,717 57,080Okt. 856,844 38,854 60,573Nov. 855,170 38,916 59,188Dis. 878,156 39,325 63,858
200+ 2013 Jan. 812,459 39,196 67,206Feb. 775,705 38,746 67,718Mac 840,885 38,825 71,645Apr. 831,868 38,177 69,407Mei 824,710 39,083 72,290Jun 801,597 39,404 68,466Jul. 802,372 39,300 70,329OgosSept.Okt.Nov.Dis.
56. PEMBUATAN PRODUK GETAH LAIN 2012 4,107,915 21,049 469,642YANG TIDAK TERKELAS 2011 3,986,492 20,692 451,602DI MANA-MANA 2010 3,727,320 20,538 420,261Manufacture of other rubber 2009 3,464,264 18,945 374,901 products, not elsewhereclassified 2012 (Jan.- Jul) 2,470,364 21,612 272,448(25199) 2013 (Jan.- Jul) 2,312,579 21,597 308,120
100+ 2012 Jan. 328,033 20,825 38,347Feb. 345,489 20,978 38,643Mac 367,125 21,063 38,357Apr. 366,551 21,508 39,270Mei 354,986 21,370 39,284Jun 344,033 21,195 38,502Jul. 364,147 21,612 40,045Ogos 313,670 21,537 39,007Sept. 332,113 21,176 38,441Okt. 347,740 21,213 41,544Nov. 336,492 21,088 38,395Dis. 307,536 21,049 39,807
100+ 2013 Jan. 337,430 21,269 44,725Feb. 308,149 21,406 42,829Mac 315,015 21,385 43,319Apr. 313,971 21,382 44,055Mei 353,423 21,510 43,536Jun 350,212 21,348 43,752Jul. 334,379 21,597 45,904OgosSept.Okt.Nov.Dis.
JADUAL 1 (SAMB.) : PERANGKAAN UTAMA BAGI INDUSTRI PEMBUATAN YANG TERPILIHTable 1 (Cont'd) : Principal Statistics of Selected Manufacturing Industries
39
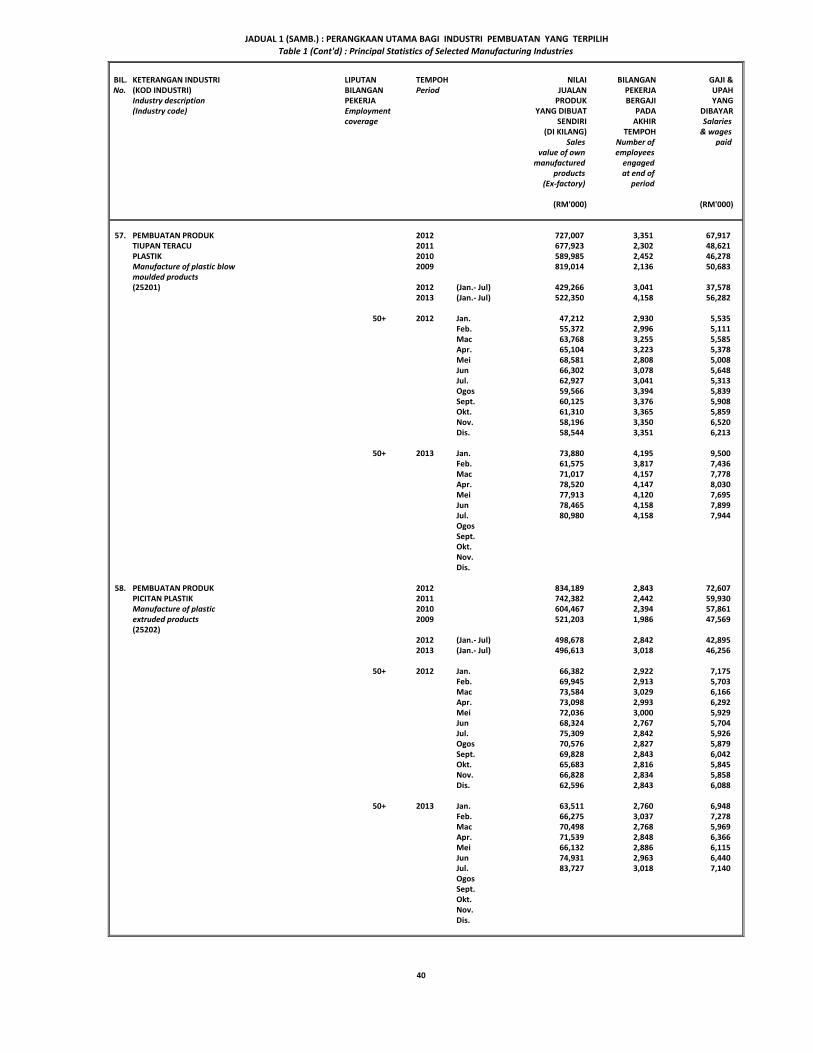
BIL. KETERANGAN INDUSTRI LIPUTAN TEMPOH NILAI BILANGAN GAJI &No. (KOD INDUSTRI) BILANGAN Period JUALAN PEKERJA UPAH
Industry description PEKERJA PRODUK BERGAJI YANG(Industry code) Employment YANG DIBUAT PADA DIBAYAR
coverage SENDIRI AKHIR Salaries(DI KILANG) TEMPOH & wages
Sales Number of paidvalue of own employees
manufactured engagedproducts at end of
(Ex-factory) period
(RM'000) (RM'000)
57. PEMBUATAN PRODUK 2012 727,007 3,351 67,917TIUPAN TERACU 2011 677,923 2,302 48,621PLASTIK 2010 589,985 2,452 46,278Manufacture of plastic blow 2009 819,014 2,136 50,683 moulded products(25201) 2012 (Jan.- Jul) 429,266 3,041 37,578
2013 (Jan.- Jul) 522,350 4,158 56,282
50+ 2012 Jan. 47,212 2,930 5,535Feb. 55,372 2,996 5,111Mac 63,768 3,255 5,585Apr. 65,104 3,223 5,378Mei 68,581 2,808 5,008Jun 66,302 3,078 5,648Jul. 62,927 3,041 5,313Ogos 59,566 3,394 5,839Sept. 60,125 3,376 5,908Okt. 61,310 3,365 5,859Nov. 58,196 3,350 6,520Dis. 58,544 3,351 6,213
50+ 2013 Jan. 73,880 4,195 9,500Feb. 61,575 3,817 7,436Mac 71,017 4,157 7,778Apr. 78,520 4,147 8,030Mei 77,913 4,120 7,695Jun 78,465 4,158 7,899Jul. 80,980 4,158 7,944OgosSept.Okt.Nov.Dis.
58. PEMBUATAN PRODUK 2012 834,189 2,843 72,607PICITAN PLASTIK 2011 742,382 2,442 59,930Manufacture of plastic 2010 604,467 2,394 57,861extruded products 2009 521,203 1,986 47,569 (25202)
2012 (Jan.- Jul) 498,678 2,842 42,8952013 (Jan.- Jul) 496,613 3,018 46,256
50+ 2012 Jan. 66,382 2,922 7,175Feb. 69,945 2,913 5,703Mac 73,584 3,029 6,166Apr. 73,098 2,993 6,292Mei 72,036 3,000 5,929Jun 68,324 2,767 5,704Jul. 75,309 2,842 5,926Ogos 70,576 2,827 5,879Sept. 69,828 2,843 6,042Okt. 65,683 2,816 5,845Nov. 66,828 2,834 5,858Dis. 62,596 2,843 6,088
50+ 2013 Jan. 63,511 2,760 6,948Feb. 66,275 3,037 7,278Mac 70,498 2,768 5,969Apr. 71,539 2,848 6,366Mei 66,132 2,886 6,115Jun 74,931 2,963 6,440Jul. 83,727 3,018 7,140OgosSept.Okt.Nov.Dis.
JADUAL 1 (SAMB.) : PERANGKAAN UTAMA BAGI INDUSTRI PEMBUATAN YANG TERPILIHTable 1 (Cont'd) : Principal Statistics of Selected Manufacturing Industries
40
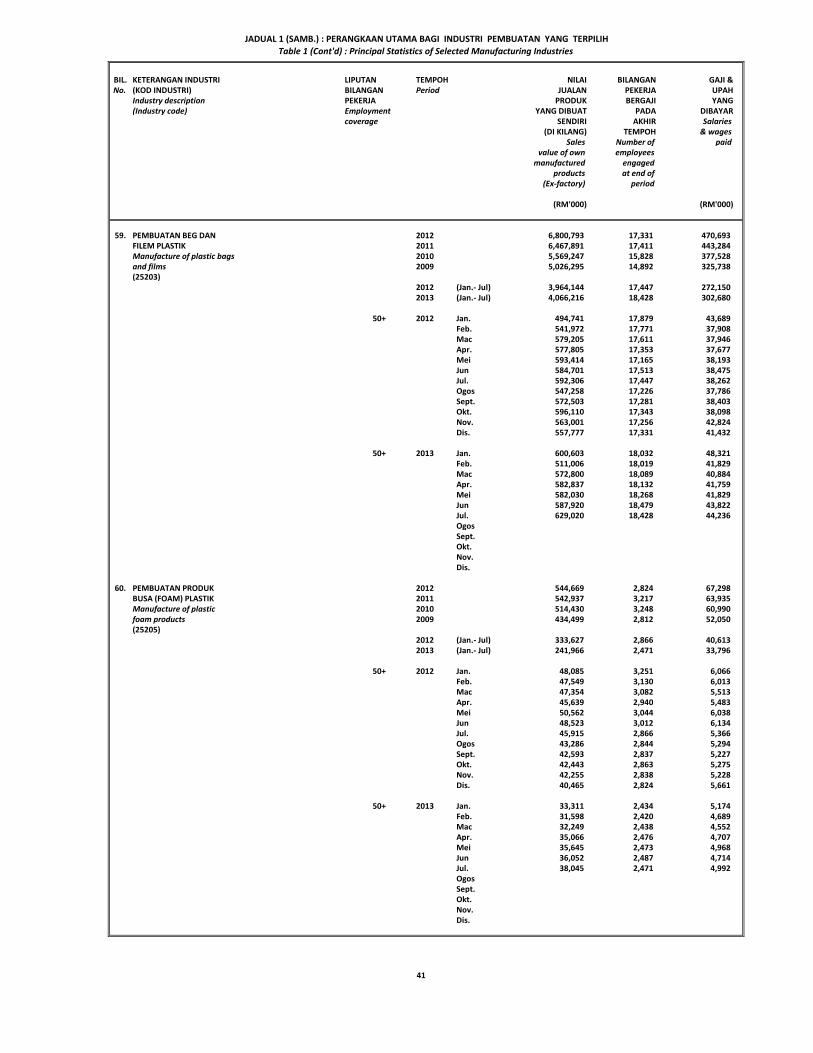
BIL. KETERANGAN INDUSTRI LIPUTAN TEMPOH NILAI BILANGAN GAJI &No. (KOD INDUSTRI) BILANGAN Period JUALAN PEKERJA UPAH
Industry description PEKERJA PRODUK BERGAJI YANG(Industry code) Employment YANG DIBUAT PADA DIBAYAR
coverage SENDIRI AKHIR Salaries(DI KILANG) TEMPOH & wages
Sales Number of paidvalue of own employees
manufactured engagedproducts at end of
(Ex-factory) period
(RM'000) (RM'000)
59. PEMBUATAN BEG DAN 2012 6,800,793 17,331 470,693FILEM PLASTIK 2011 6,467,891 17,411 443,284Manufacture of plastic bags 2010 5,569,247 15,828 377,528and films 2009 5,026,295 14,892 325,738 (25203)
2012 (Jan.- Jul) 3,964,144 17,447 272,1502013 (Jan.- Jul) 4,066,216 18,428 302,680
50+ 2012 Jan. 494,741 17,879 43,689Feb. 541,972 17,771 37,908
Mac 579,205 17,611 37,946Apr. 577,805 17,353 37,677Mei 593,414 17,165 38,193Jun 584,701 17,513 38,475Jul. 592,306 17,447 38,262Ogos 547,258 17,226 37,786Sept. 572,503 17,281 38,403Okt. 596,110 17,343 38,098Nov. 563,001 17,256 42,824Dis. 557,777 17,331 41,432
50+ 2013 Jan. 600,603 18,032 48,321Feb. 511,006 18,019 41,829
Mac 572,800 18,089 40,884Apr. 582,837 18,132 41,759Mei 582,030 18,268 41,829Jun 587,920 18,479 43,822Jul. 629,020 18,428 44,236OgosSept.Okt.Nov.Dis.
60. PEMBUATAN PRODUK 2012 544,669 2,824 67,298BUSA (FOAM) PLASTIK 2011 542,937 3,217 63,935Manufacture of plastic 2010 514,430 3,248 60,990foam products 2009 434,499 2,812 52,050 (25205)
2012 (Jan.- Jul) 333,627 2,866 40,6132013 (Jan.- Jul) 241,966 2,471 33,796
50+ 2012 Jan. 48,085 3,251 6,066Feb. 47,549 3,130 6,013Mac 47,354 3,082 5,513Apr. 45,639 2,940 5,483Mei 50,562 3,044 6,038Jun 48,523 3,012 6,134Jul. 45,915 2,866 5,366Ogos 43,286 2,844 5,294Sept. 42,593 2,837 5,227Okt. 42,443 2,863 5,275Nov. 42,255 2,838 5,228Dis. 40,465 2,824 5,661
50+ 2013 Jan. 33,311 2,434 5,174Feb. 31,598 2,420 4,689Mac 32,249 2,438 4,552Apr. 35,066 2,476 4,707Mei 35,645 2,473 4,968Jun 36,052 2,487 4,714Jul. 38,045 2,471 4,992OgosSept.Okt.Nov.Dis.
JADUAL 1 (SAMB.) : PERANGKAAN UTAMA BAGI INDUSTRI PEMBUATAN YANG TERPILIHTable 1 (Cont'd) : Principal Statistics of Selected Manufacturing Industries
41
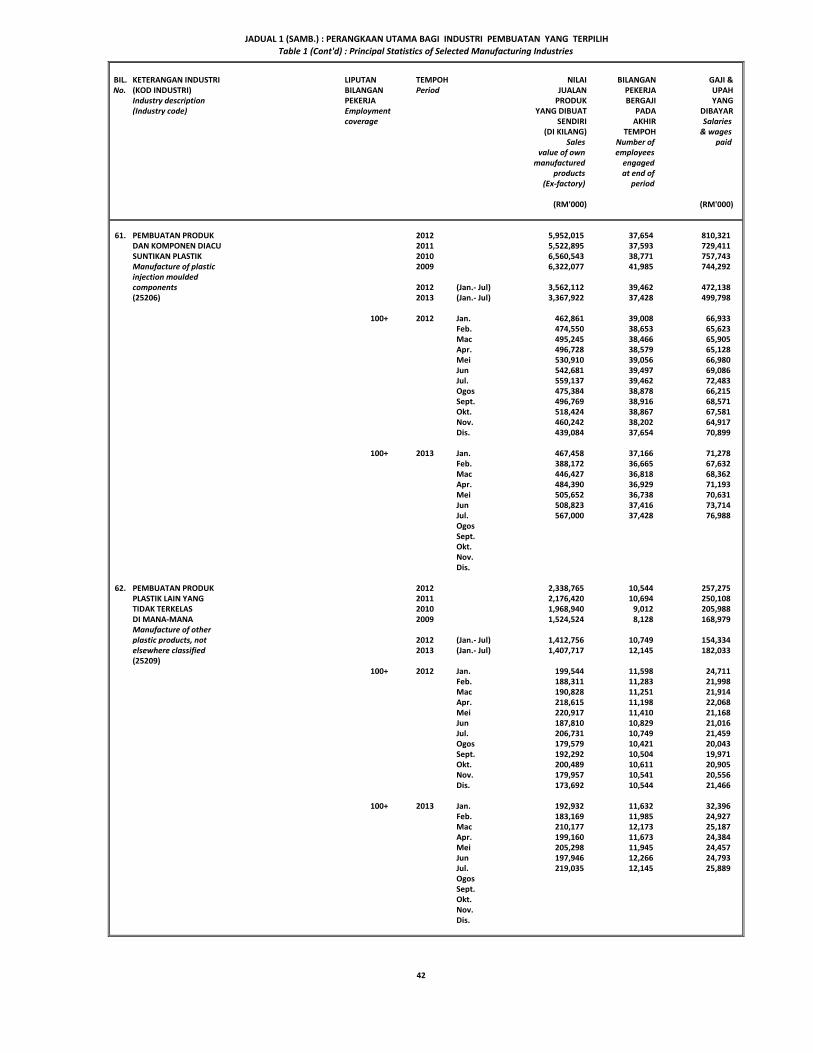
BIL. KETERANGAN INDUSTRI LIPUTAN TEMPOH NILAI BILANGAN GAJI &No. (KOD INDUSTRI) BILANGAN Period JUALAN PEKERJA UPAH
Industry description PEKERJA PRODUK BERGAJI YANG(Industry code) Employment YANG DIBUAT PADA DIBAYAR
coverage SENDIRI AKHIR Salaries(DI KILANG) TEMPOH & wages
Sales Number of paidvalue of own employees
manufactured engagedproducts at end of
(Ex-factory) period
(RM'000) (RM'000)
61. PEMBUATAN PRODUK 2012 5,952,015 37,654 810,321DAN KOMPONEN DIACU 2011 5,522,895 37,593 729,411SUNTIKAN PLASTIK 2010 6,560,543 38,771 757,743Manufacture of plastic 2009 6,322,077 41,985 744,292 injection moulded components 2012 (Jan.- Jul) 3,562,112 39,462 472,138(25206) 2013 (Jan.- Jul) 3,367,922 37,428 499,798
100+ 2012 Jan. 462,861 39,008 66,933Feb. 474,550 38,653 65,623Mac 495,245 38,466 65,905Apr. 496,728 38,579 65,128Mei 530,910 39,056 66,980Jun 542,681 39,497 69,086Jul. 559,137 39,462 72,483Ogos 475,384 38,878 66,215Sept. 496,769 38,916 68,571Okt. 518,424 38,867 67,581Nov. 460,242 38,202 64,917Dis. 439,084 37,654 70,899
100+ 2013 Jan. 467,458 37,166 71,278Feb. 388,172 36,665 67,632Mac 446,427 36,818 68,362Apr. 484,390 36,929 71,193Mei 505,652 36,738 70,631Jun 508,823 37,416 73,714Jul. 567,000 37,428 76,988OgosSept.Okt.Nov.Dis.
62. PEMBUATAN PRODUK 2012 2,338,765 10,544 257,275PLASTIK LAIN YANG 2011 2,176,420 10,694 250,108TIDAK TERKELAS 2010 1,968,940 9,012 205,988DI MANA-MANA 2009 1,524,524 8,128 168,979 Manufacture of otherplastic products, not 2012 (Jan.- Jul) 1,412,756 10,749 154,334elsewhere classified 2013 (Jan.- Jul) 1,407,717 12,145 182,033(25209)
100+ 2012 Jan. 199,544 11,598 24,711Feb. 188,311 11,283 21,998Mac 190,828 11,251 21,914Apr. 218,615 11,198 22,068Mei 220,917 11,410 21,168Jun 187,810 10,829 21,016Jul. 206,731 10,749 21,459Ogos 179,579 10,421 20,043Sept. 192,292 10,504 19,971Okt. 200,489 10,611 20,905Nov. 179,957 10,541 20,556Dis. 173,692 10,544 21,466
100+ 2013 Jan. 192,932 11,632 32,396Feb. 183,169 11,985 24,927Mac 210,177 12,173 25,187Apr. 199,160 11,673 24,384Mei 205,298 11,945 24,457Jun 197,946 12,266 24,793Jul. 219,035 12,145 25,889OgosSept.Okt.Nov.Dis.
JADUAL 1 (SAMB.) : PERANGKAAN UTAMA BAGI INDUSTRI PEMBUATAN YANG TERPILIHTable 1 (Cont'd) : Principal Statistics of Selected Manufacturing Industries
42
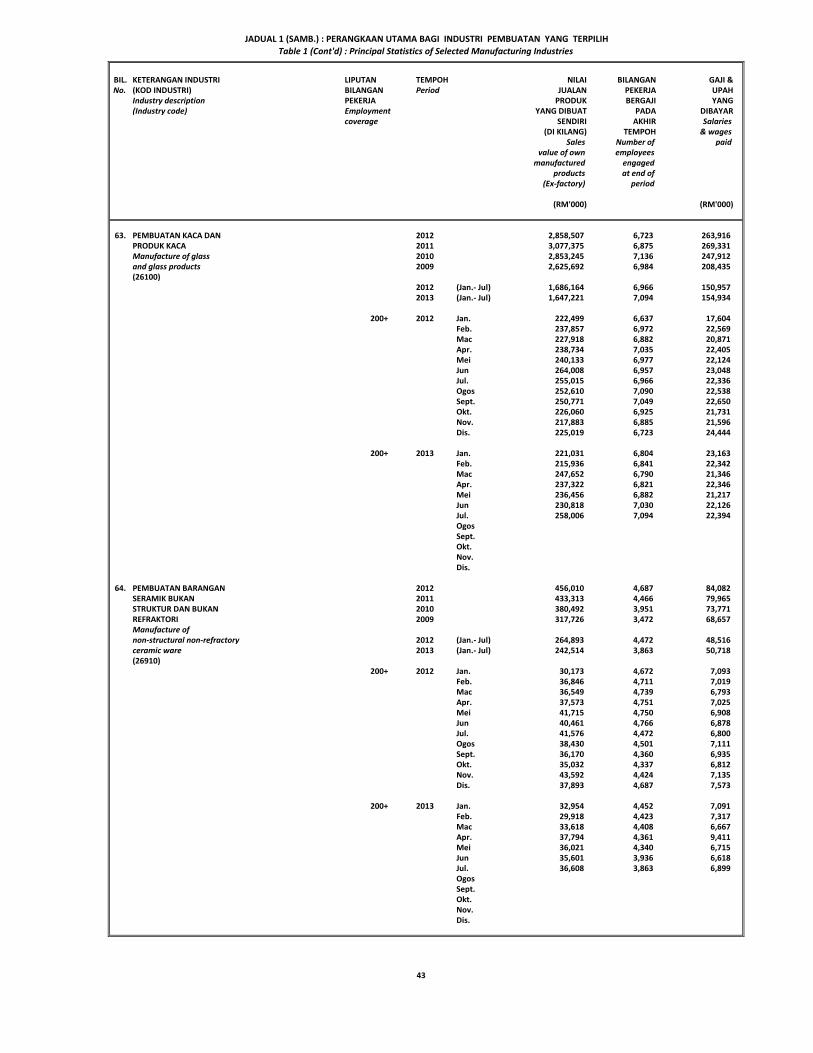
BIL. KETERANGAN INDUSTRI LIPUTAN TEMPOH NILAI BILANGAN GAJI &No. (KOD INDUSTRI) BILANGAN Period JUALAN PEKERJA UPAH
Industry description PEKERJA PRODUK BERGAJI YANG(Industry code) Employment YANG DIBUAT PADA DIBAYAR
coverage SENDIRI AKHIR Salaries(DI KILANG) TEMPOH & wages
Sales Number of paidvalue of own employees
manufactured engagedproducts at end of
(Ex-factory) period
(RM'000) (RM'000)
63. PEMBUATAN KACA DAN 2012 2,858,507 6,723 263,916PRODUK KACA 2011 3,077,375 6,875 269,331Manufacture of glass 2010 2,853,245 7,136 247,912and glass products 2009 2,625,692 6,984 208,435 (26100)
2012 (Jan.- Jul) 1,686,164 6,966 150,9572013 (Jan.- Jul) 1,647,221 7,094 154,934
200+ 2012 Jan. 222,499 6,637 17,604Feb. 237,857 6,972 22,569Mac 227,918 6,882 20,871Apr. 238,734 7,035 22,405Mei 240,133 6,977 22,124Jun 264,008 6,957 23,048Jul. 255,015 6,966 22,336Ogos 252,610 7,090 22,538Sept. 250,771 7,049 22,650Okt. 226,060 6,925 21,731Nov. 217,883 6,885 21,596Dis. 225,019 6,723 24,444
200+ 2013 Jan. 221,031 6,804 23,163Feb. 215,936 6,841 22,342Mac 247,652 6,790 21,346Apr. 237,322 6,821 22,346Mei 236,456 6,882 21,217Jun 230,818 7,030 22,126Jul. 258,006 7,094 22,394OgosSept.Okt.Nov.Dis.
64. PEMBUATAN BARANGAN 2012 456,010 4,687 84,082SERAMIK BUKAN 2011 433,313 4,466 79,965STRUKTUR DAN BUKAN 2010 380,492 3,951 73,771REFRAKTORI 2009 317,726 3,472 68,657 Manufacture ofnon-structural non-refractory 2012 (Jan.- Jul) 264,893 4,472 48,516ceramic ware 2013 (Jan.- Jul) 242,514 3,863 50,718(26910)
200+ 2012 Jan. 30,173 4,672 7,093Feb. 36,846 4,711 7,019Mac 36,549 4,739 6,793Apr. 37,573 4,751 7,025Mei 41,715 4,750 6,908Jun 40,461 4,766 6,878Jul. 41,576 4,472 6,800Ogos 38,430 4,501 7,111Sept. 36,170 4,360 6,935Okt. 35,032 4,337 6,812Nov. 43,592 4,424 7,135Dis. 37,893 4,687 7,573
200+ 2013 Jan. 32,954 4,452 7,091Feb. 29,918 4,423 7,317Mac 33,618 4,408 6,667Apr. 37,794 4,361 9,411Mei 36,021 4,340 6,715Jun 35,601 3,936 6,618Jul. 36,608 3,863 6,899OgosSept.Okt.Nov.Dis.
JADUAL 1 (SAMB.) : PERANGKAAN UTAMA BAGI INDUSTRI PEMBUATAN YANG TERPILIHTable 1 (Cont'd) : Principal Statistics of Selected Manufacturing Industries
43
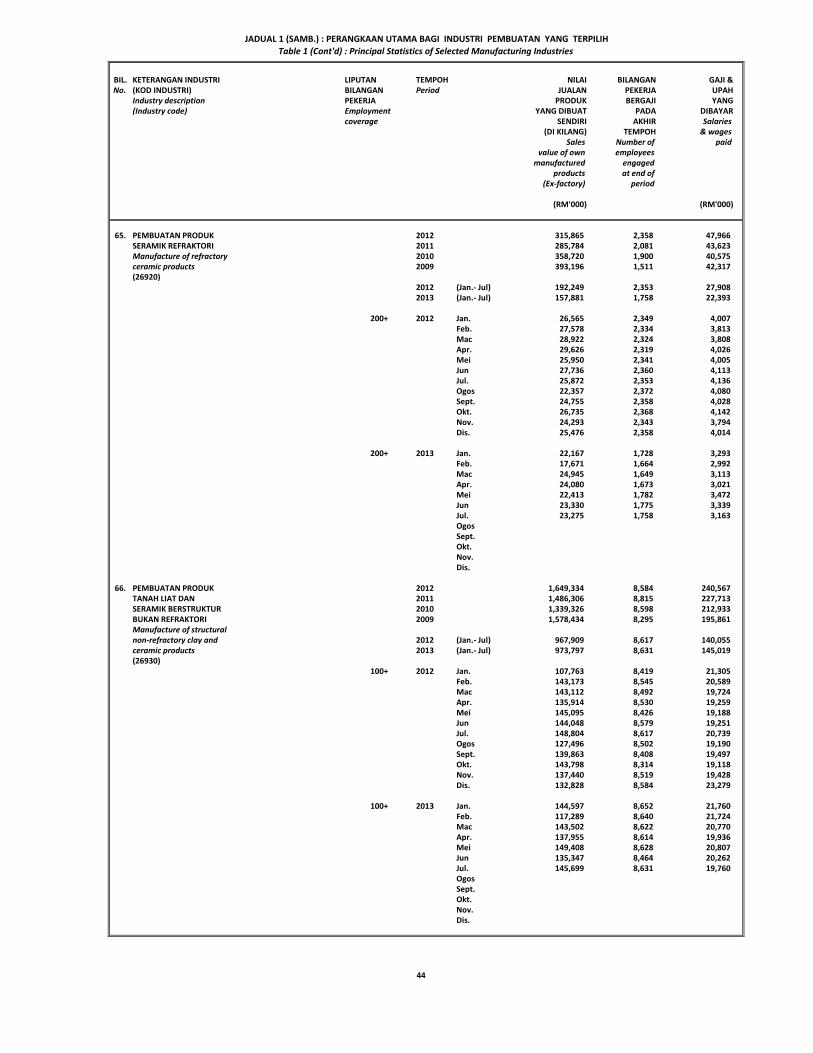
BIL. KETERANGAN INDUSTRI LIPUTAN TEMPOH NILAI BILANGAN GAJI &No. (KOD INDUSTRI) BILANGAN Period JUALAN PEKERJA UPAH
Industry description PEKERJA PRODUK BERGAJI YANG(Industry code) Employment YANG DIBUAT PADA DIBAYAR
coverage SENDIRI AKHIR Salaries(DI KILANG) TEMPOH & wages
Sales Number of paidvalue of own employees
manufactured engagedproducts at end of
(Ex-factory) period
(RM'000) (RM'000)
65. PEMBUATAN PRODUK 2012 315,865 2,358 47,966SERAMIK REFRAKTORI 2011 285,784 2,081 43,623Manufacture of refractory 2010 358,720 1,900 40,575ceramic products 2009 393,196 1,511 42,317 (26920)
2012 (Jan.- Jul) 192,249 2,353 27,9082013 (Jan.- Jul) 157,881 1,758 22,393
200+ 2012 Jan. 26,565 2,349 4,007Feb. 27,578 2,334 3,813Mac 28,922 2,324 3,808Apr. 29,626 2,319 4,026Mei 25,950 2,341 4,005Jun 27,736 2,360 4,113Jul. 25,872 2,353 4,136Ogos 22,357 2,372 4,080Sept. 24,755 2,358 4,028Okt. 26,735 2,368 4,142Nov. 24,293 2,343 3,794Dis. 25,476 2,358 4,014
200+ 2013 Jan. 22,167 1,728 3,293Feb. 17,671 1,664 2,992Mac 24,945 1,649 3,113Apr. 24,080 1,673 3,021Mei 22,413 1,782 3,472Jun 23,330 1,775 3,339Jul. 23,275 1,758 3,163OgosSept.Okt.Nov.Dis.
66. PEMBUATAN PRODUK 2012 1,649,334 8,584 240,567TANAH LIAT DAN 2011 1,486,306 8,815 227,713SERAMIK BERSTRUKTUR 2010 1,339,326 8,598 212,933BUKAN REFRAKTORI 2009 1,578,434 8,295 195,861 Manufacture of structural non-refractory clay and 2012 (Jan.- Jul) 967,909 8,617 140,055ceramic products 2013 (Jan.- Jul) 973,797 8,631 145,019(26930)
100+ 2012 Jan. 107,763 8,419 21,305Feb. 143,173 8,545 20,589Mac 143,112 8,492 19,724Apr. 135,914 8,530 19,259Mei 145,095 8,426 19,188Jun 144,048 8,579 19,251Jul. 148,804 8,617 20,739Ogos 127,496 8,502 19,190Sept. 139,863 8,408 19,497Okt. 143,798 8,314 19,118Nov. 137,440 8,519 19,428Dis. 132,828 8,584 23,279
100+ 2013 Jan. 144,597 8,652 21,760Feb. 117,289 8,640 21,724Mac 143,502 8,622 20,770Apr. 137,955 8,614 19,936Mei 149,408 8,628 20,807Jun 135,347 8,464 20,262Jul. 145,699 8,631 19,760OgosSept.Okt.Nov.Dis.
JADUAL 1 (SAMB.) : PERANGKAAN UTAMA BAGI INDUSTRI PEMBUATAN YANG TERPILIHTable 1 (Cont'd) : Principal Statistics of Selected Manufacturing Industries
44
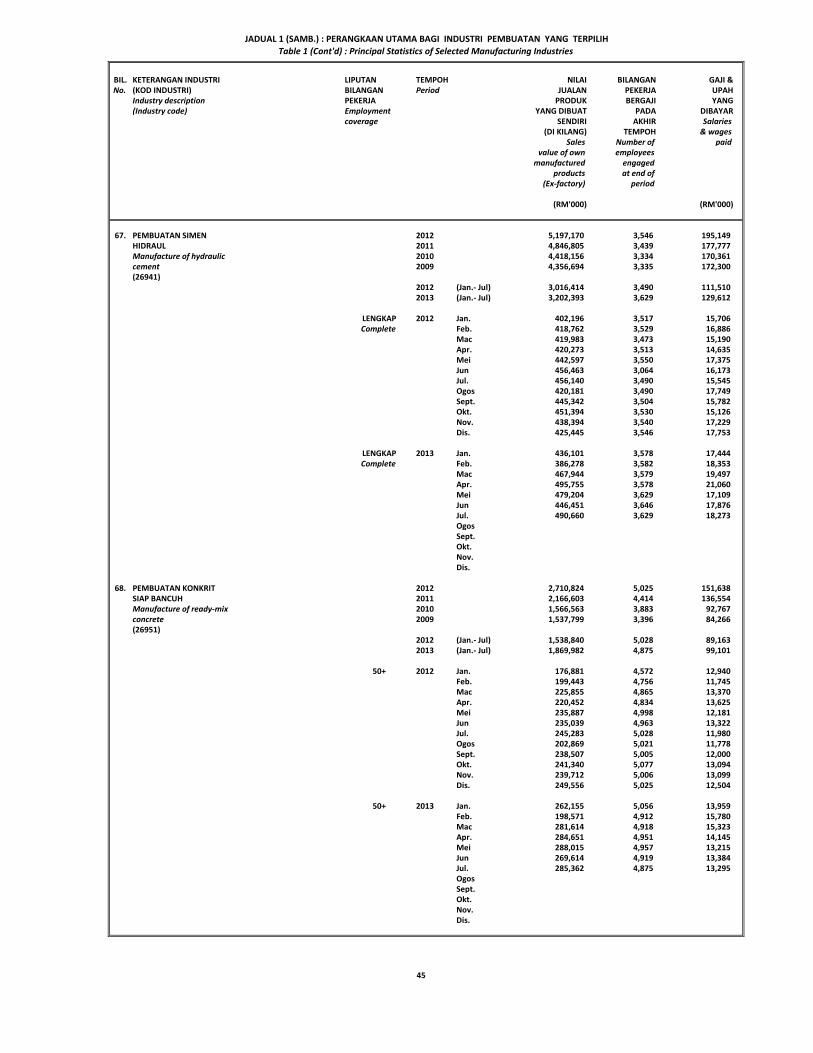
BIL. KETERANGAN INDUSTRI LIPUTAN TEMPOH NILAI BILANGAN GAJI &No. (KOD INDUSTRI) BILANGAN Period JUALAN PEKERJA UPAH
Industry description PEKERJA PRODUK BERGAJI YANG(Industry code) Employment YANG DIBUAT PADA DIBAYAR
coverage SENDIRI AKHIR Salaries(DI KILANG) TEMPOH & wages
Sales Number of paidvalue of own employees
manufactured engagedproducts at end of
(Ex-factory) period
(RM'000) (RM'000)
67. PEMBUATAN SIMEN 2012 5,197,170 3,546 195,149HIDRAUL 2011 4,846,805 3,439 177,777Manufacture of hydraulic 2010 4,418,156 3,334 170,361cement 2009 4,356,694 3,335 172,300 (26941)
2012 (Jan.- Jul) 3,016,414 3,490 111,5102013 (Jan.- Jul) 3,202,393 3,629 129,612
LENGKAP 2012 Jan. 402,196 3,517 15,706Complete Feb. 418,762 3,529 16,886
Mac 419,983 3,473 15,190Apr. 420,273 3,513 14,635Mei 442,597 3,550 17,375Jun 456,463 3,064 16,173Jul. 456,140 3,490 15,545Ogos 420,181 3,490 17,749Sept. 445,342 3,504 15,782Okt. 451,394 3,530 15,126Nov. 438,394 3,540 17,229Dis. 425,445 3,546 17,753
LENGKAP 2013 Jan. 436,101 3,578 17,444Complete Feb. 386,278 3,582 18,353
Mac 467,944 3,579 19,497Apr. 495,755 3,578 21,060Mei 479,204 3,629 17,109Jun 446,451 3,646 17,876Jul. 490,660 3,629 18,273OgosSept.Okt.Nov.Dis.
68. PEMBUATAN KONKRIT 2012 2,710,824 5,025 151,638SIAP BANCUH 2011 2,166,603 4,414 136,554Manufacture of ready-mix 2010 1,566,563 3,883 92,767concrete 2009 1,537,799 3,396 84,266 (26951)
2012 (Jan.- Jul) 1,538,840 5,028 89,1632013 (Jan.- Jul) 1,869,982 4,875 99,101
50+ 2012 Jan. 176,881 4,572 12,940Feb. 199,443 4,756 11,745Mac 225,855 4,865 13,370Apr. 220,452 4,834 13,625Mei 235,887 4,998 12,181Jun 235,039 4,963 13,322Jul. 245,283 5,028 11,980Ogos 202,869 5,021 11,778Sept. 238,507 5,005 12,000Okt. 241,340 5,077 13,094Nov. 239,712 5,006 13,099Dis. 249,556 5,025 12,504
50+ 2013 Jan. 262,155 5,056 13,959Feb. 198,571 4,912 15,780Mac 281,614 4,918 15,323Apr. 284,651 4,951 14,145Mei 288,015 4,957 13,215Jun 269,614 4,919 13,384Jul. 285,362 4,875 13,295OgosSept.Okt.Nov.Dis.
JADUAL 1 (SAMB.) : PERANGKAAN UTAMA BAGI INDUSTRI PEMBUATAN YANG TERPILIHTable 1 (Cont'd) : Principal Statistics of Selected Manufacturing Industries
45
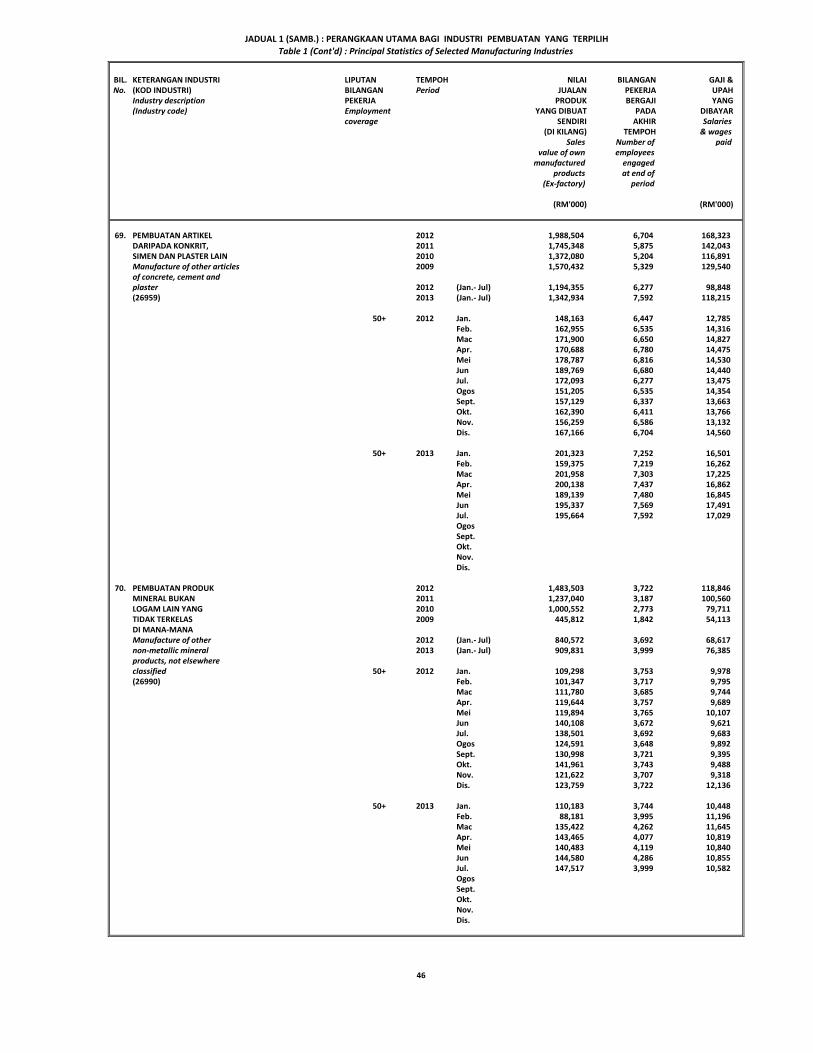
BIL. KETERANGAN INDUSTRI LIPUTAN TEMPOH NILAI BILANGAN GAJI &No. (KOD INDUSTRI) BILANGAN Period JUALAN PEKERJA UPAH
Industry description PEKERJA PRODUK BERGAJI YANG(Industry code) Employment YANG DIBUAT PADA DIBAYAR
coverage SENDIRI AKHIR Salaries(DI KILANG) TEMPOH & wages
Sales Number of paidvalue of own employees
manufactured engagedproducts at end of
(Ex-factory) period
(RM'000) (RM'000)
69. PEMBUATAN ARTIKEL 2012 1,988,504 6,704 168,323DARIPADA KONKRIT, 2011 1,745,348 5,875 142,043SIMEN DAN PLASTER LAIN 2010 1,372,080 5,204 116,891Manufacture of other articles 2009 1,570,432 5,329 129,540 of concrete, cement and plaster 2012 (Jan.- Jul) 1,194,355 6,277 98,848(26959) 2013 (Jan.- Jul) 1,342,934 7,592 118,215
50+ 2012 Jan. 148,163 6,447 12,785Feb. 162,955 6,535 14,316Mac 171,900 6,650 14,827Apr. 170,688 6,780 14,475Mei 178,787 6,816 14,530Jun 189,769 6,680 14,440Jul. 172,093 6,277 13,475Ogos 151,205 6,535 14,354Sept. 157,129 6,337 13,663Okt. 162,390 6,411 13,766Nov. 156,259 6,586 13,132Dis. 167,166 6,704 14,560
50+ 2013 Jan. 201,323 7,252 16,501Feb. 159,375 7,219 16,262Mac 201,958 7,303 17,225Apr. 200,138 7,437 16,862Mei 189,139 7,480 16,845Jun 195,337 7,569 17,491Jul. 195,664 7,592 17,029OgosSept.Okt.Nov.Dis.
70. PEMBUATAN PRODUK 2012 1,483,503 3,722 118,846MINERAL BUKAN 2011 1,237,040 3,187 100,560LOGAM LAIN YANG 2010 1,000,552 2,773 79,711TIDAK TERKELAS 2009 445,812 1,842 54,113 DI MANA-MANAManufacture of other 2012 (Jan.- Jul) 840,572 3,692 68,617non-metallic mineral 2013 (Jan.- Jul) 909,831 3,999 76,385products, not elsewhere classified 50+ 2012 Jan. 109,298 3,753 9,978(26990) Feb. 101,347 3,717 9,795
Mac 111,780 3,685 9,744Apr. 119,644 3,757 9,689Mei 119,894 3,765 10,107Jun 140,108 3,672 9,621Jul. 138,501 3,692 9,683Ogos 124,591 3,648 9,892Sept. 130,998 3,721 9,395Okt. 141,961 3,743 9,488Nov. 121,622 3,707 9,318Dis. 123,759 3,722 12,136
50+ 2013 Jan. 110,183 3,744 10,448Feb. 88,181 3,995 11,196Mac 135,422 4,262 11,645Apr. 143,465 4,077 10,819Mei 140,483 4,119 10,840Jun 144,580 4,286 10,855Jul. 147,517 3,999 10,582OgosSept.Okt.Nov.Dis.
JADUAL 1 (SAMB.) : PERANGKAAN UTAMA BAGI INDUSTRI PEMBUATAN YANG TERPILIHTable 1 (Cont'd) : Principal Statistics of Selected Manufacturing Industries
46
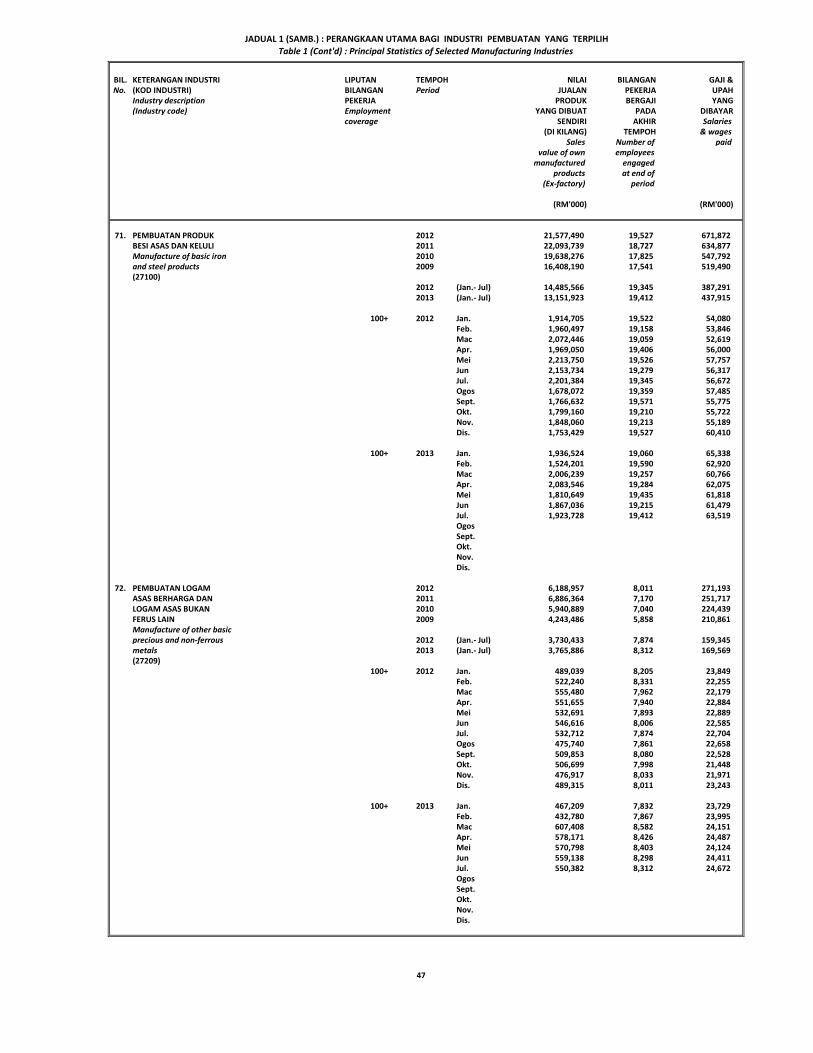
BIL. KETERANGAN INDUSTRI LIPUTAN TEMPOH NILAI BILANGAN GAJI &No. (KOD INDUSTRI) BILANGAN Period JUALAN PEKERJA UPAH
Industry description PEKERJA PRODUK BERGAJI YANG(Industry code) Employment YANG DIBUAT PADA DIBAYAR
coverage SENDIRI AKHIR Salaries(DI KILANG) TEMPOH & wages
Sales Number of paidvalue of own employees
manufactured engagedproducts at end of
(Ex-factory) period
(RM'000) (RM'000)
71. PEMBUATAN PRODUK 2012 21,577,490 19,527 671,872BESI ASAS DAN KELULI 2011 22,093,739 18,727 634,877Manufacture of basic iron 2010 19,638,276 17,825 547,792and steel products 2009 16,408,190 17,541 519,490 (27100)
2012 (Jan.- Jul) 14,485,566 19,345 387,2912013 (Jan.- Jul) 13,151,923 19,412 437,915
100+ 2012 Jan. 1,914,705 19,522 54,080Feb. 1,960,497 19,158 53,846Mac 2,072,446 19,059 52,619Apr. 1,969,050 19,406 56,000Mei 2,213,750 19,526 57,757Jun 2,153,734 19,279 56,317Jul. 2,201,384 19,345 56,672Ogos 1,678,072 19,359 57,485Sept. 1,766,632 19,571 55,775Okt. 1,799,160 19,210 55,722Nov. 1,848,060 19,213 55,189Dis. 1,753,429 19,527 60,410
100+ 2013 Jan. 1,936,524 19,060 65,338Feb. 1,524,201 19,590 62,920Mac 2,006,239 19,257 60,766Apr. 2,083,546 19,284 62,075Mei 1,810,649 19,435 61,818Jun 1,867,036 19,215 61,479Jul. 1,923,728 19,412 63,519OgosSept.Okt.Nov.Dis.
72. PEMBUATAN LOGAM 2012 6,188,957 8,011 271,193ASAS BERHARGA DAN 2011 6,886,364 7,170 251,717LOGAM ASAS BUKAN 2010 5,940,889 7,040 224,439FERUS LAIN 2009 4,243,486 5,858 210,861 Manufacture of other basicprecious and non-ferrous 2012 (Jan.- Jul) 3,730,433 7,874 159,345metals 2013 (Jan.- Jul) 3,765,886 8,312 169,569(27209)
100+ 2012 Jan. 489,039 8,205 23,849Feb. 522,240 8,331 22,255Mac 555,480 7,962 22,179Apr. 551,655 7,940 22,884Mei 532,691 7,893 22,889Jun 546,616 8,006 22,585Jul. 532,712 7,874 22,704Ogos 475,740 7,861 22,658Sept. 509,853 8,080 22,528Okt. 506,699 7,998 21,448Nov. 476,917 8,033 21,971Dis. 489,315 8,011 23,243
100+ 2013 Jan. 467,209 7,832 23,729Feb. 432,780 7,867 23,995Mac 607,408 8,582 24,151Apr. 578,171 8,426 24,487Mei 570,798 8,403 24,124Jun 559,138 8,298 24,411Jul. 550,382 8,312 24,672OgosSept.Okt.Nov.Dis.
JADUAL 1 (SAMB.) : PERANGKAAN UTAMA BAGI INDUSTRI PEMBUATAN YANG TERPILIHTable 1 (Cont'd) : Principal Statistics of Selected Manufacturing Industries
47

BIL. KETERANGAN INDUSTRI LIPUTAN TEMPOH NILAI BILANGAN GAJI &No. (KOD INDUSTRI) BILANGAN Period JUALAN PEKERJA UPAH
Industry description PEKERJA PRODUK BERGAJI YANG(Industry code) Employment YANG DIBUAT PADA DIBAYAR
coverage SENDIRI AKHIR Salaries(DI KILANG) TEMPOH & wages
Sales Number of paidvalue of own employees
manufactured engagedproducts at end of
(Ex-factory) period
(RM'000) (RM'000)
73. PEMBUATAN PRODUK 2012 2,035,107 8,816 254,457STRUKTUR LOGAM 2011 1,909,297 8,502 226,220Manufacture of structural 2010 1,520,216 6,689 162,886metal products 2009 1,662,715 5,929 147,180 (28110)
2012 (Jan.- Jul) 1,198,149 9,107 149,6322013 (Jan.- Jul) 1,094,586 9,642 162,906
20+ 2012 Jan. 160,958 8,972 22,041Feb. 171,349 9,074 21,436Mac 187,600 9,198 21,261Apr. 168,530 9,250 20,873Mei 177,276 9,239 21,731Jun 164,388 9,127 21,011Jul. 168,048 9,107 21,279Ogos 157,504 9,012 21,098Sept. 168,683 8,910 20,540Okt. 161,314 8,829 20,734Nov. 173,981 8,865 21,346Dis. 175,476 8,816 21,107
20+ 2013 Jan. 179,991 8,803 23,782Feb. 129,173 8,783 20,686Mac 163,325 9,296 23,064Apr. 152,066 9,621 24,165Mei 152,096 9,578 23,986Jun 158,133 9,320 22,502Jul. 159,802 9,642 24,721OgosSept.Okt.Nov.Dis.
74. PEMBUATAN TANGKI, 2012 785,936 2,740 89,541TAKUNGAN DAN KONTENA 2011 882,264 2,597 88,444LOGAM 2010 682,901 2,775 67,325Manufacture of tanks, reservoirs 2009 729,885 2,272 60,934 and containers of metals(28120) 2012 (Jan.- Jul) 455,349 2,787 52,127
2013 (Jan.- Jul) 429,142 2,360 47,287
50+ 2012 Jan. 51,896 2,639 8,764Feb. 74,237 2,619 6,581Mac 68,883 2,866 7,286Apr. 73,505 2,892 7,520Mei 72,100 2,784 7,312Jun 69,909 2,800 7,454Jul. 44,819 2,787 7,210Ogos 66,771 2,714 7,475Sept. 61,587 2,774 7,347Okt. 62,636 2,721 7,685Nov. 62,580 2,767 7,243Dis. 77,013 2,740 7,664
50+ 2013 Jan. 73,440 2,680 7,766Feb. 50,905 2,640 6,767Mac 60,210 2,641 7,048Apr. 69,967 2,469 6,793Mei 60,002 2,539 6,320Jun 61,060 2,335 5,847Jul. 53,558 2,360 6,746OgosSept.Okt.Nov.Dis.
JADUAL 1 (SAMB.) : PERANGKAAN UTAMA BAGI INDUSTRI PEMBUATAN YANG TERPILIHTable 1 (Cont'd) : Principal Statistics of Selected Manufacturing Industries
48
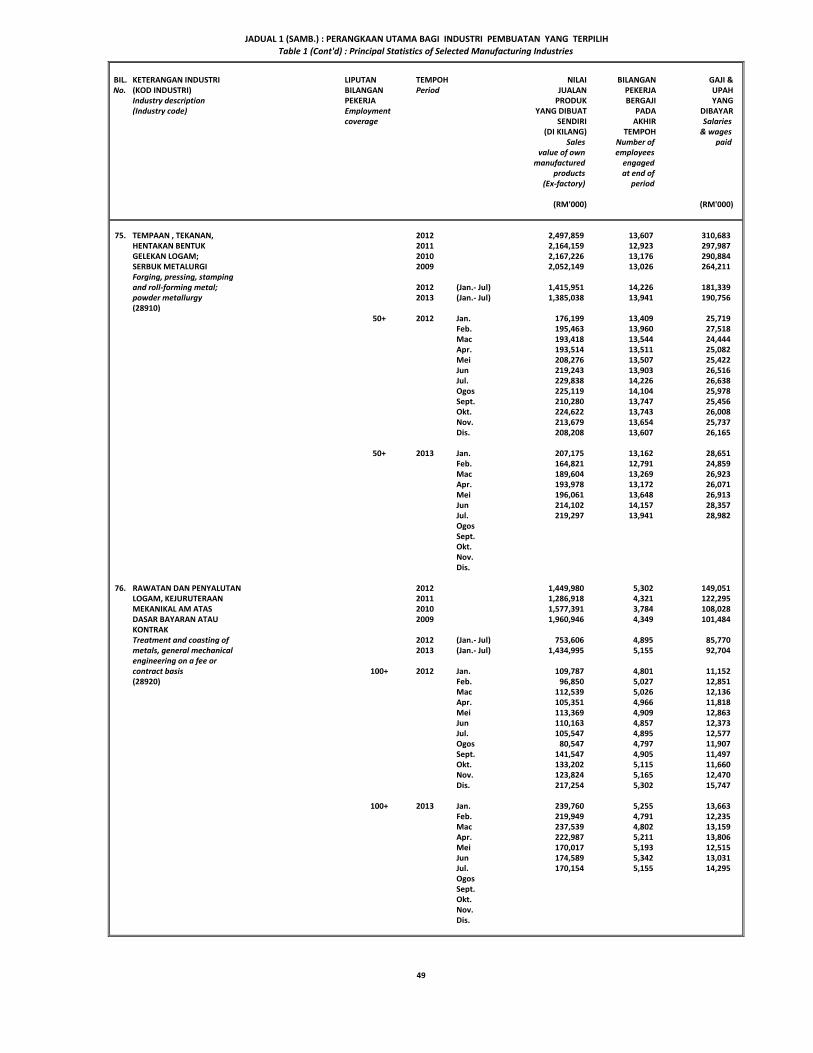
BIL. KETERANGAN INDUSTRI LIPUTAN TEMPOH NILAI BILANGAN GAJI &No. (KOD INDUSTRI) BILANGAN Period JUALAN PEKERJA UPAH
Industry description PEKERJA PRODUK BERGAJI YANG(Industry code) Employment YANG DIBUAT PADA DIBAYAR
coverage SENDIRI AKHIR Salaries(DI KILANG) TEMPOH & wages
Sales Number of paidvalue of own employees
manufactured engagedproducts at end of
(Ex-factory) period
(RM'000) (RM'000)
75. TEMPAAN , TEKANAN, 2012 2,497,859 13,607 310,683HENTAKAN BENTUK 2011 2,164,159 12,923 297,987GELEKAN LOGAM; 2010 2,167,226 13,176 290,884SERBUK METALURGI 2009 2,052,149 13,026 264,211 Forging, pressing, stampingand roll-forming metal; 2012 (Jan.- Jul) 1,415,951 14,226 181,339powder metallurgy 2013 (Jan.- Jul) 1,385,038 13,941 190,756(28910)
50+ 2012 Jan. 176,199 13,409 25,719Feb. 195,463 13,960 27,518Mac 193,418 13,544 24,444Apr. 193,514 13,511 25,082Mei 208,276 13,507 25,422Jun 219,243 13,903 26,516Jul. 229,838 14,226 26,638Ogos 225,119 14,104 25,978Sept. 210,280 13,747 25,456Okt. 224,622 13,743 26,008Nov. 213,679 13,654 25,737Dis. 208,208 13,607 26,165
50+ 2013 Jan. 207,175 13,162 28,651Feb. 164,821 12,791 24,859Mac 189,604 13,269 26,923Apr. 193,978 13,172 26,071Mei 196,061 13,648 26,913Jun 214,102 14,157 28,357Jul. 219,297 13,941 28,982OgosSept.Okt.Nov.Dis.
76. RAWATAN DAN PENYALUTAN 2012 1,449,980 5,302 149,051LOGAM, KEJURUTERAAN 2011 1,286,918 4,321 122,295MEKANIKAL AM ATAS 2010 1,577,391 3,784 108,028DASAR BAYARAN ATAU 2009 1,960,946 4,349 101,484 KONTRAKTreatment and coasting of 2012 (Jan.- Jul) 753,606 4,895 85,770metals, general mechanical 2013 (Jan.- Jul) 1,434,995 5,155 92,704engineering on a fee or contract basis 100+ 2012 Jan. 109,787 4,801 11,152(28920) Feb. 96,850 5,027 12,851
Mac 112,539 5,026 12,136Apr. 105,351 4,966 11,818Mei 113,369 4,909 12,863Jun 110,163 4,857 12,373Jul. 105,547 4,895 12,577Ogos 80,547 4,797 11,907Sept. 141,547 4,905 11,497Okt. 133,202 5,115 11,660Nov. 123,824 5,165 12,470Dis. 217,254 5,302 15,747
100+ 2013 Jan. 239,760 5,255 13,663Feb. 219,949 4,791 12,235Mac 237,539 4,802 13,159Apr. 222,987 5,211 13,806Mei 170,017 5,193 12,515Jun 174,589 5,342 13,031Jul. 170,154 5,155 14,295OgosSept.Okt.Nov.Dis.
JADUAL 1 (SAMB.) : PERANGKAAN UTAMA BAGI INDUSTRI PEMBUATAN YANG TERPILIHTable 1 (Cont'd) : Principal Statistics of Selected Manufacturing Industries
49
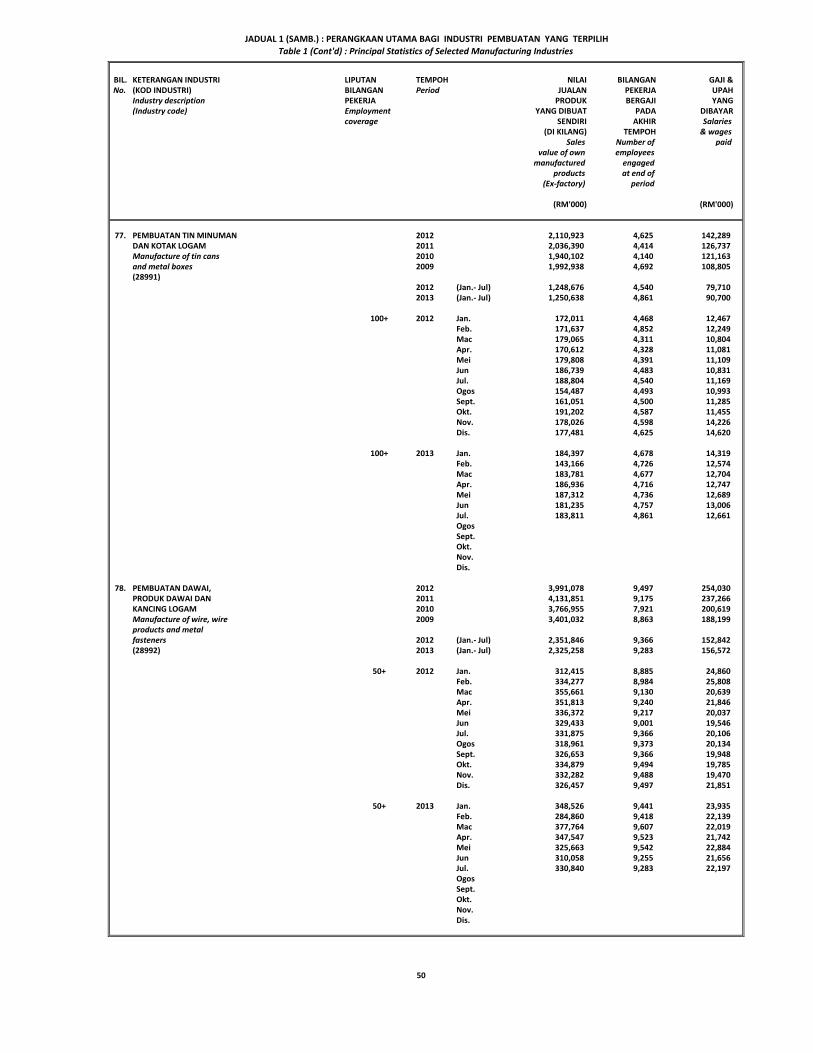
BIL. KETERANGAN INDUSTRI LIPUTAN TEMPOH NILAI BILANGAN GAJI &No. (KOD INDUSTRI) BILANGAN Period JUALAN PEKERJA UPAH
Industry description PEKERJA PRODUK BERGAJI YANG(Industry code) Employment YANG DIBUAT PADA DIBAYAR
coverage SENDIRI AKHIR Salaries(DI KILANG) TEMPOH & wages
Sales Number of paidvalue of own employees
manufactured engagedproducts at end of
(Ex-factory) period
(RM'000) (RM'000)
77. PEMBUATAN TIN MINUMAN 2012 2,110,923 4,625 142,289DAN KOTAK LOGAM 2011 2,036,390 4,414 126,737Manufacture of tin cans 2010 1,940,102 4,140 121,163and metal boxes 2009 1,992,938 4,692 108,805 (28991)
2012 (Jan.- Jul) 1,248,676 4,540 79,7102013 (Jan.- Jul) 1,250,638 4,861 90,700
100+ 2012 Jan. 172,011 4,468 12,467Feb. 171,637 4,852 12,249Mac 179,065 4,311 10,804Apr. 170,612 4,328 11,081Mei 179,808 4,391 11,109Jun 186,739 4,483 10,831Jul. 188,804 4,540 11,169Ogos 154,487 4,493 10,993Sept. 161,051 4,500 11,285Okt. 191,202 4,587 11,455Nov. 178,026 4,598 14,226Dis. 177,481 4,625 14,620
100+ 2013 Jan. 184,397 4,678 14,319Feb. 143,166 4,726 12,574Mac 183,781 4,677 12,704Apr. 186,936 4,716 12,747Mei 187,312 4,736 12,689Jun 181,235 4,757 13,006Jul. 183,811 4,861 12,661OgosSept.Okt.Nov.Dis.
78. PEMBUATAN DAWAI, 2012 3,991,078 9,497 254,030PRODUK DAWAI DAN 2011 4,131,851 9,175 237,266KANCING LOGAM 2010 3,766,955 7,921 200,619Manufacture of wire, wire 2009 3,401,032 8,863 188,199 products and metal fasteners 2012 (Jan.- Jul) 2,351,846 9,366 152,842(28992) 2013 (Jan.- Jul) 2,325,258 9,283 156,572
50+ 2012 Jan. 312,415 8,885 24,860Feb. 334,277 8,984 25,808Mac 355,661 9,130 20,639Apr. 351,813 9,240 21,846Mei 336,372 9,217 20,037Jun 329,433 9,001 19,546Jul. 331,875 9,366 20,106Ogos 318,961 9,373 20,134Sept. 326,653 9,366 19,948Okt. 334,879 9,494 19,785Nov. 332,282 9,488 19,470Dis. 326,457 9,497 21,851
50+ 2013 Jan. 348,526 9,441 23,935Feb. 284,860 9,418 22,139Mac 377,764 9,607 22,019Apr. 347,547 9,523 21,742Mei 325,663 9,542 22,884Jun 310,058 9,255 21,656Jul. 330,840 9,283 22,197OgosSept.Okt.Nov.Dis.
JADUAL 1 (SAMB.) : PERANGKAAN UTAMA BAGI INDUSTRI PEMBUATAN YANG TERPILIHTable 1 (Cont'd) : Principal Statistics of Selected Manufacturing Industries
50
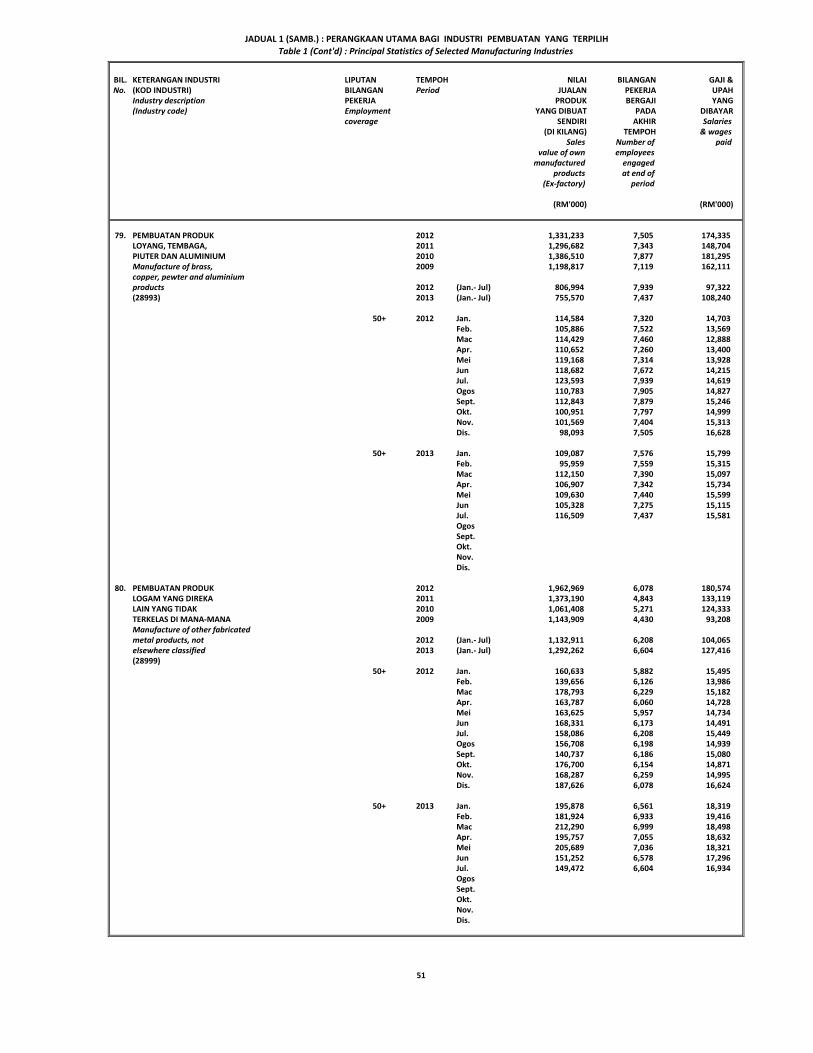
BIL. KETERANGAN INDUSTRI LIPUTAN TEMPOH NILAI BILANGAN GAJI &No. (KOD INDUSTRI) BILANGAN Period JUALAN PEKERJA UPAH
Industry description PEKERJA PRODUK BERGAJI YANG(Industry code) Employment YANG DIBUAT PADA DIBAYAR
coverage SENDIRI AKHIR Salaries(DI KILANG) TEMPOH & wages
Sales Number of paidvalue of own employees
manufactured engagedproducts at end of
(Ex-factory) period
(RM'000) (RM'000)
79. PEMBUATAN PRODUK 2012 1,331,233 7,505 174,335LOYANG, TEMBAGA, 2011 1,296,682 7,343 148,704PIUTER DAN ALUMINIUM 2010 1,386,510 7,877 181,295Manufacture of brass, 2009 1,198,817 7,119 162,111 copper, pewter and aluminiumproducts 2012 (Jan.- Jul) 806,994 7,939 97,322(28993) 2013 (Jan.- Jul) 755,570 7,437 108,240
50+ 2012 Jan. 114,584 7,320 14,703Feb. 105,886 7,522 13,569Mac 114,429 7,460 12,888Apr. 110,652 7,260 13,400Mei 119,168 7,314 13,928Jun 118,682 7,672 14,215Jul. 123,593 7,939 14,619Ogos 110,783 7,905 14,827Sept. 112,843 7,879 15,246Okt. 100,951 7,797 14,999Nov. 101,569 7,404 15,313Dis. 98,093 7,505 16,628
50+ 2013 Jan. 109,087 7,576 15,799Feb. 95,959 7,559 15,315Mac 112,150 7,390 15,097Apr. 106,907 7,342 15,734Mei 109,630 7,440 15,599Jun 105,328 7,275 15,115Jul. 116,509 7,437 15,581OgosSept.Okt.Nov.Dis.
80. PEMBUATAN PRODUK 2012 1,962,969 6,078 180,574LOGAM YANG DIREKA 2011 1,373,190 4,843 133,119LAIN YANG TIDAK 2010 1,061,408 5,271 124,333TERKELAS DI MANA-MANA 2009 1,143,909 4,430 93,208 Manufacture of other fabricatedmetal products, not 2012 (Jan.- Jul) 1,132,911 6,208 104,065elsewhere classified 2013 (Jan.- Jul) 1,292,262 6,604 127,416(28999)
50+ 2012 Jan. 160,633 5,882 15,495Feb. 139,656 6,126 13,986Mac 178,793 6,229 15,182Apr. 163,787 6,060 14,728Mei 163,625 5,957 14,734Jun 168,331 6,173 14,491Jul. 158,086 6,208 15,449Ogos 156,708 6,198 14,939Sept. 140,737 6,186 15,080Okt. 176,700 6,154 14,871Nov. 168,287 6,259 14,995Dis. 187,626 6,078 16,624
50+ 2013 Jan. 195,878 6,561 18,319Feb. 181,924 6,933 19,416Mac 212,290 6,999 18,498Apr. 195,757 7,055 18,632Mei 205,689 7,036 18,321Jun 151,252 6,578 17,296Jul. 149,472 6,604 16,934OgosSept.Okt.Nov.Dis.
JADUAL 1 (SAMB.) : PERANGKAAN UTAMA BAGI INDUSTRI PEMBUATAN YANG TERPILIHTable 1 (Cont'd) : Principal Statistics of Selected Manufacturing Industries
51

BIL. KETERANGAN INDUSTRI LIPUTAN TEMPOH NILAI BILANGAN GAJI &No. (KOD INDUSTRI) BILANGAN Period JUALAN PEKERJA UPAH
Industry description PEKERJA PRODUK BERGAJI YANG(Industry code) Employment YANG DIBUAT PADA DIBAYAR
coverage SENDIRI AKHIR Salaries(DI KILANG) TEMPOH & wages
Sales Number of paidvalue of own employees
manufactured engagedproducts at end of
(Ex-factory) period
(RM'000) (RM'000)
81. PEMBUATAN PAM, PEMAMPAT 2012 1,241,309 2,126 70,911KEPALA PAIP DAN INJAP 2011 860,642 1,884 60,568Manufacture of pumps, 2010 943,046 1,790 58,538compressors, tape and valves 2009 986,984 1,585 52,469(29120)
2012 (Jan.- Jul) 694,722 2,131 39,0662013 (Jan.- Jul) 768,342 2,199 48,391
200+ 2012 Jan. 81,107 2,003 5,418Feb. 88,312 2,117 5,944Mac 93,590 2,110 5,733Apr. 117,111 1,977 5,554Mei 106,932 2,018 5,554Jun 92,980 2,074 5,413Jul. 114,690 2,131 5,450Ogos 109,094 2,124 5,663Sept. 136,034 2,112 6,073Okt. 95,886 2,126 5,670Nov. 95,414 2,134 5,645Dis. 110,159 2,126 8,794
200+ 2013 Jan. 95,764 2,144 6,093Feb. 92,661 2,136 6,623Mac 110,423 2,177 6,281Apr. 113,014 2,206 7,065Mei 114,477 2,424 7,421Jun 121,663 2,407 7,682Jul. 120,340 2,199 7,226OgosSept.Okt.Nov.Dis.
82. PEMBUATAN MESIN 2012 4,319,352 6,684 236,340PENYAMAN UDARA, MESIN 2011 4,610,565 6,668 247,321PENYEJUK DAN PENGALIH 2010 4,297,059 6,274 212,097UDARA 2009 3,423,453 5,080 166,120 Manufacture of air-conditioning,refrigerating and ventilating 2012 (Jan.- Jul) 2,709,750 6,492 135,072machinery 2013 (Jan.- Jul) 2,725,346 6,784 148,184(29191)
200+ 2012 Jan. 379,327 6,652 19,147Feb. 396,167 6,636 20,848Mac 410,424 6,630 18,445Apr. 427,893 6,594 20,137Mei 401,251 6,519 19,268Jun 364,531 6,440 18,249Jul. 330,157 6,492 18,978Ogos 293,020 6,871 18,533Sept. 318,116 6,739 20,726Okt. 337,903 6,774 19,531Nov. 325,957 6,675 19,628Dis. 334,606 6,684 22,850
200+ 2013 Jan. 371,879 6,386 19,323Feb. 364,325 6,255 20,198Mac 401,548 6,502 22,066Apr. 468,348 6,415 20,968Mei 397,452 6,582 20,994Jun 363,599 6,829 23,041Jul. 358,195 6,784 21,594OgosSept.Okt.Nov.Dis.
JADUAL 1 (SAMB.) : PERANGKAAN UTAMA BAGI INDUSTRI PEMBUATAN YANG TERPILIHTable 1 (Cont'd) : Principal Statistics of Selected Manufacturing Industries
52
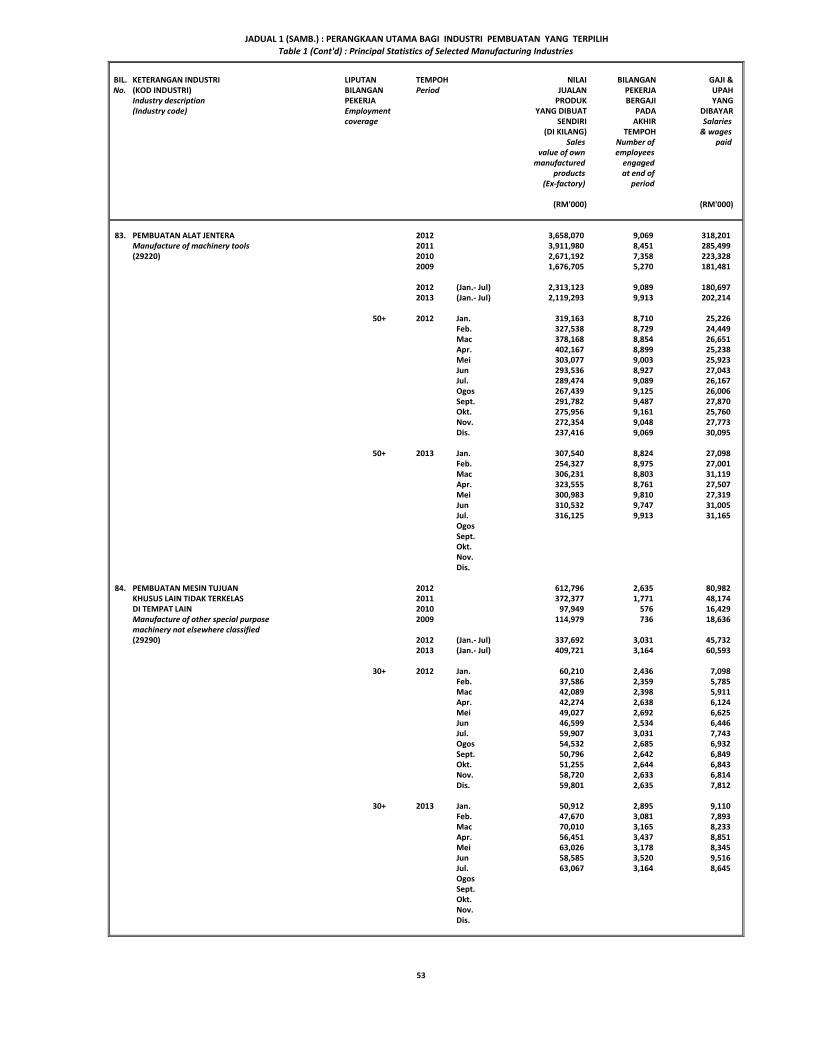
BIL. KETERANGAN INDUSTRI LIPUTAN TEMPOH NILAI BILANGAN GAJI &No. (KOD INDUSTRI) BILANGAN Period JUALAN PEKERJA UPAH
Industry description PEKERJA PRODUK BERGAJI YANG(Industry code) Employment YANG DIBUAT PADA DIBAYAR
coverage SENDIRI AKHIR Salaries(DI KILANG) TEMPOH & wages
Sales Number of paidvalue of own employees
manufactured engagedproducts at end of
(Ex-factory) period
(RM'000) (RM'000)
83. PEMBUATAN ALAT JENTERA 2012 3,658,070 9,069 318,201Manufacture of machinery tools 2011 3,911,980 8,451 285,499(29220) 2010 2,671,192 7,358 223,328
2009 1,676,705 5,270 181,481
2012 (Jan.- Jul) 2,313,123 9,089 180,6972013 (Jan.- Jul) 2,119,293 9,913 202,214
50+ 2012 Jan. 319,163 8,710 25,226Feb. 327,538 8,729 24,449Mac 378,168 8,854 26,651Apr. 402,167 8,899 25,238Mei 303,077 9,003 25,923Jun 293,536 8,927 27,043Jul. 289,474 9,089 26,167Ogos 267,439 9,125 26,006Sept. 291,782 9,487 27,870Okt. 275,956 9,161 25,760Nov. 272,354 9,048 27,773Dis. 237,416 9,069 30,095
50+ 2013 Jan. 307,540 8,824 27,098Feb. 254,327 8,975 27,001Mac 306,231 8,803 31,119Apr. 323,555 8,761 27,507Mei 300,983 9,810 27,319Jun 310,532 9,747 31,005Jul. 316,125 9,913 31,165OgosSept.Okt.Nov.Dis.
84. PEMBUATAN MESIN TUJUAN 2012 612,796 2,635 80,982KHUSUS LAIN TIDAK TERKELAS 2011 372,377 1,771 48,174DI TEMPAT LAIN 2010 97,949 576 16,429Manufacture of other special purpose 2009 114,979 736 18,636 machinery not elsewhere classified(29290) 2012 (Jan.- Jul) 337,692 3,031 45,732
2013 (Jan.- Jul) 409,721 3,164 60,593
30+ 2012 Jan. 60,210 2,436 7,098Feb. 37,586 2,359 5,785Mac 42,089 2,398 5,911Apr. 42,274 2,638 6,124Mei 49,027 2,692 6,625Jun 46,599 2,534 6,446Jul. 59,907 3,031 7,743Ogos 54,532 2,685 6,932Sept. 50,796 2,642 6,849Okt. 51,255 2,644 6,843Nov. 58,720 2,633 6,814Dis. 59,801 2,635 7,812
30+ 2013 Jan. 50,912 2,895 9,110Feb. 47,670 3,081 7,893Mac 70,010 3,165 8,233Apr. 56,451 3,437 8,851Mei 63,026 3,178 8,345Jun 58,585 3,520 9,516Jul. 63,067 3,164 8,645OgosSept.Okt.Nov.Dis.
JADUAL 1 (SAMB.) : PERANGKAAN UTAMA BAGI INDUSTRI PEMBUATAN YANG TERPILIHTable 1 (Cont'd) : Principal Statistics of Selected Manufacturing Industries
53
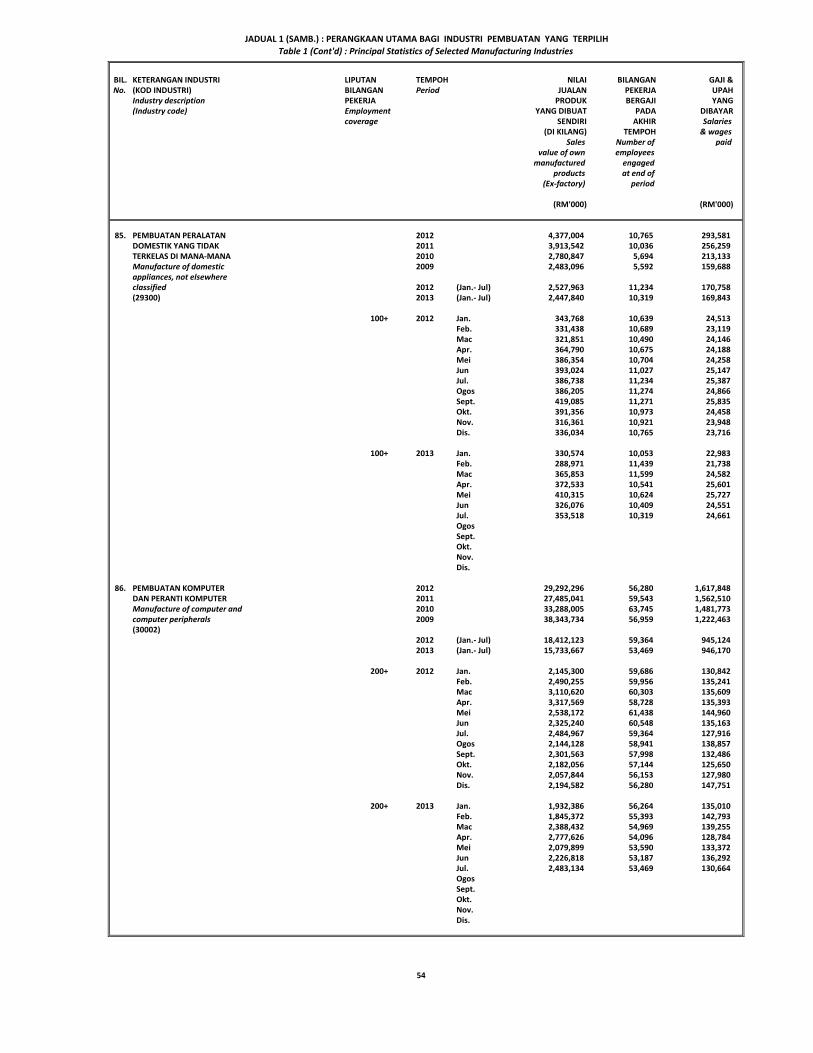
BIL. KETERANGAN INDUSTRI LIPUTAN TEMPOH NILAI BILANGAN GAJI &No. (KOD INDUSTRI) BILANGAN Period JUALAN PEKERJA UPAH
Industry description PEKERJA PRODUK BERGAJI YANG(Industry code) Employment YANG DIBUAT PADA DIBAYAR
coverage SENDIRI AKHIR Salaries(DI KILANG) TEMPOH & wages
Sales Number of paidvalue of own employees
manufactured engagedproducts at end of
(Ex-factory) period
(RM'000) (RM'000)
85. PEMBUATAN PERALATAN 2012 4,377,004 10,765 293,581DOMESTIK YANG TIDAK 2011 3,913,542 10,036 256,259TERKELAS DI MANA-MANA 2010 2,780,847 5,694 213,133Manufacture of domestic 2009 2,483,096 5,592 159,688 appliances, not elsewhereclassified 2012 (Jan.- Jul) 2,527,963 11,234 170,758(29300) 2013 (Jan.- Jul) 2,447,840 10,319 169,843
100+ 2012 Jan. 343,768 10,639 24,513Feb. 331,438 10,689 23,119Mac 321,851 10,490 24,146Apr. 364,790 10,675 24,188Mei 386,354 10,704 24,258Jun 393,024 11,027 25,147Jul. 386,738 11,234 25,387Ogos 386,205 11,274 24,866Sept. 419,085 11,271 25,835Okt. 391,356 10,973 24,458Nov. 316,361 10,921 23,948Dis. 336,034 10,765 23,716
100+ 2013 Jan. 330,574 10,053 22,983Feb. 288,971 11,439 21,738Mac 365,853 11,599 24,582Apr. 372,533 10,541 25,601Mei 410,315 10,624 25,727Jun 326,076 10,409 24,551Jul. 353,518 10,319 24,661OgosSept.Okt.Nov.Dis.
86. PEMBUATAN KOMPUTER 2012 29,292,296 56,280 1,617,848DAN PERANTI KOMPUTER 2011 27,485,041 59,543 1,562,510Manufacture of computer and 2010 33,288,005 63,745 1,481,773computer peripherals 2009 38,343,734 56,959 1,222,463 (30002)
2012 (Jan.- Jul) 18,412,123 59,364 945,1242013 (Jan.- Jul) 15,733,667 53,469 946,170
200+ 2012 Jan. 2,145,300 59,686 130,842Feb. 2,490,255 59,956 135,241Mac 3,110,620 60,303 135,609Apr. 3,317,569 58,728 135,393Mei 2,538,172 61,438 144,960Jun 2,325,240 60,548 135,163Jul. 2,484,967 59,364 127,916Ogos 2,144,128 58,941 138,857Sept. 2,301,563 57,998 132,486Okt. 2,182,056 57,144 125,650Nov. 2,057,844 56,153 127,980Dis. 2,194,582 56,280 147,751
200+ 2013 Jan. 1,932,386 56,264 135,010Feb. 1,845,372 55,393 142,793Mac 2,388,432 54,969 139,255Apr. 2,777,626 54,096 128,784Mei 2,079,899 53,590 133,372Jun 2,226,818 53,187 136,292Jul. 2,483,134 53,469 130,664OgosSept.Okt.Nov.Dis.
JADUAL 1 (SAMB.) : PERANGKAAN UTAMA BAGI INDUSTRI PEMBUATAN YANG TERPILIHTable 1 (Cont'd) : Principal Statistics of Selected Manufacturing Industries
54
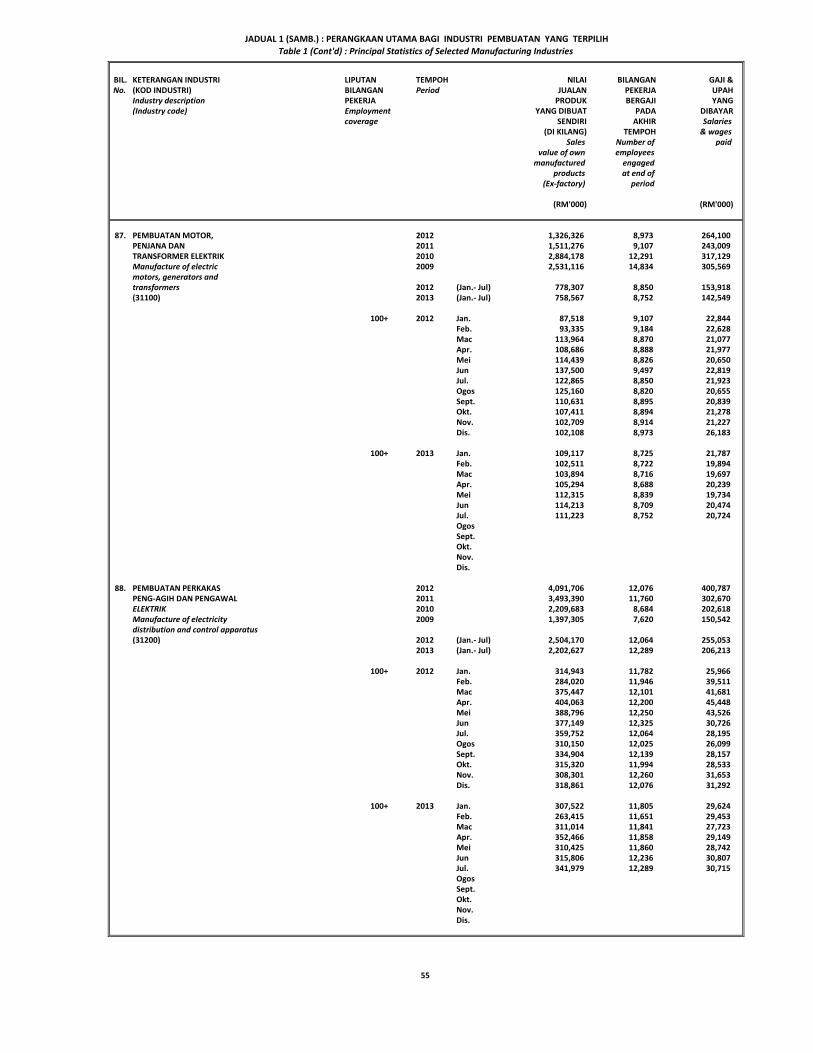
BIL. KETERANGAN INDUSTRI LIPUTAN TEMPOH NILAI BILANGAN GAJI &No. (KOD INDUSTRI) BILANGAN Period JUALAN PEKERJA UPAH
Industry description PEKERJA PRODUK BERGAJI YANG(Industry code) Employment YANG DIBUAT PADA DIBAYAR
coverage SENDIRI AKHIR Salaries(DI KILANG) TEMPOH & wages
Sales Number of paidvalue of own employees
manufactured engagedproducts at end of
(Ex-factory) period
(RM'000) (RM'000)
87. PEMBUATAN MOTOR, 2012 1,326,326 8,973 264,100PENJANA DAN 2011 1,511,276 9,107 243,009TRANSFORMER ELEKTRIK 2010 2,884,178 12,291 317,129Manufacture of electric 2009 2,531,116 14,834 305,569 motors, generators andtransformers 2012 (Jan.- Jul) 778,307 8,850 153,918(31100) 2013 (Jan.- Jul) 758,567 8,752 142,549
100+ 2012 Jan. 87,518 9,107 22,844Feb. 93,335 9,184 22,628Mac 113,964 8,870 21,077Apr. 108,686 8,888 21,977Mei 114,439 8,826 20,650Jun 137,500 9,497 22,819Jul. 122,865 8,850 21,923Ogos 125,160 8,820 20,655Sept. 110,631 8,895 20,839Okt. 107,411 8,894 21,278Nov. 102,709 8,914 21,227Dis. 102,108 8,973 26,183
100+ 2013 Jan. 109,117 8,725 21,787Feb. 102,511 8,722 19,894Mac 103,894 8,716 19,697Apr. 105,294 8,688 20,239Mei 112,315 8,839 19,734Jun 114,213 8,709 20,474Jul. 111,223 8,752 20,724OgosSept.Okt.Nov.Dis.
88. PEMBUATAN PERKAKAS 2012 4,091,706 12,076 400,787PENG-AGIH DAN PENGAWAL 2011 3,493,390 11,760 302,670ELEKTRIK 2010 2,209,683 8,684 202,618Manufacture of electricity 2009 1,397,305 7,620 150,542 distribution and control apparatus(31200) 2012 (Jan.- Jul) 2,504,170 12,064 255,053
2013 (Jan.- Jul) 2,202,627 12,289 206,213
100+ 2012 Jan. 314,943 11,782 25,966Feb. 284,020 11,946 39,511Mac 375,447 12,101 41,681Apr. 404,063 12,200 45,448Mei 388,796 12,250 43,526Jun 377,149 12,325 30,726Jul. 359,752 12,064 28,195Ogos 310,150 12,025 26,099Sept. 334,904 12,139 28,157Okt. 315,320 11,994 28,533Nov. 308,301 12,260 31,653Dis. 318,861 12,076 31,292
100+ 2013 Jan. 307,522 11,805 29,624Feb. 263,415 11,651 29,453Mac 311,014 11,841 27,723Apr. 352,466 11,858 29,149Mei 310,425 11,860 28,742Jun 315,806 12,236 30,807Jul. 341,979 12,289 30,715OgosSept.Okt.Nov.Dis.
JADUAL 1 (SAMB.) : PERANGKAAN UTAMA BAGI INDUSTRI PEMBUATAN YANG TERPILIHTable 1 (Cont'd) : Principal Statistics of Selected Manufacturing Industries
55
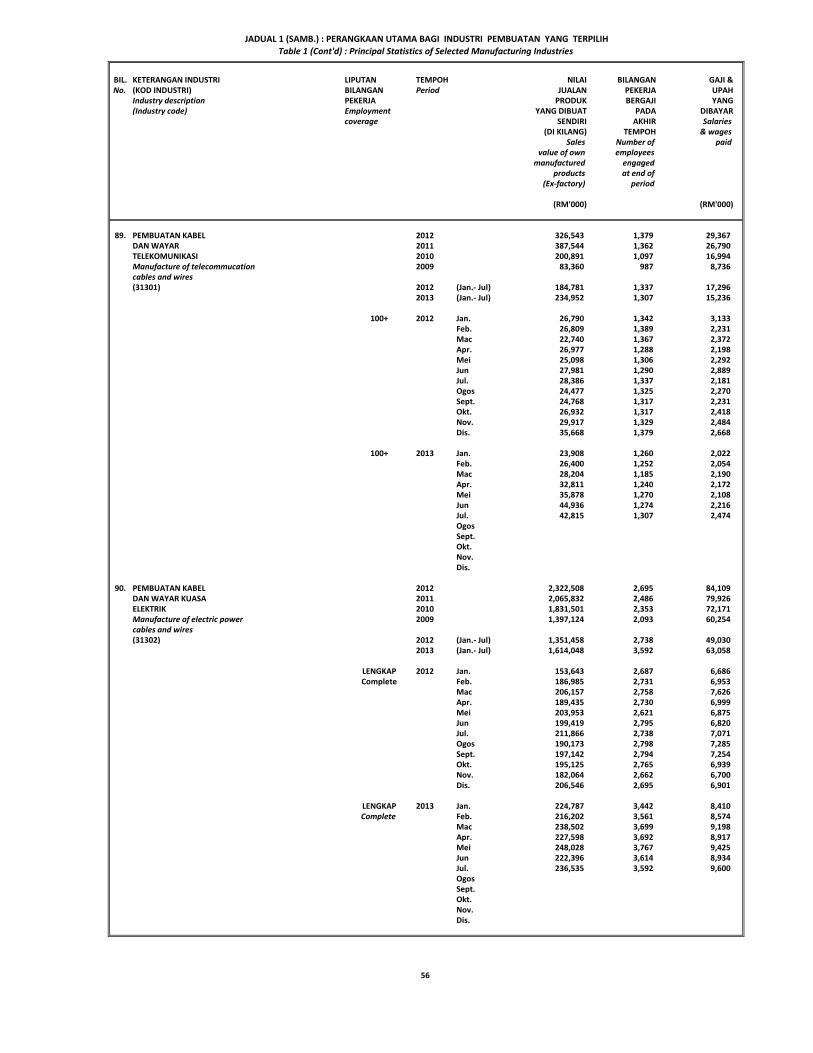
BIL. KETERANGAN INDUSTRI LIPUTAN TEMPOH NILAI BILANGAN GAJI &No. (KOD INDUSTRI) BILANGAN Period JUALAN PEKERJA UPAH
Industry description PEKERJA PRODUK BERGAJI YANG(Industry code) Employment YANG DIBUAT PADA DIBAYAR
coverage SENDIRI AKHIR Salaries(DI KILANG) TEMPOH & wages
Sales Number of paidvalue of own employees
manufactured engagedproducts at end of
(Ex-factory) period
(RM'000) (RM'000)
89. PEMBUATAN KABEL 2012 326,543 1,379 29,367DAN WAYAR 2011 387,544 1,362 26,790TELEKOMUNIKASI 2010 200,891 1,097 16,994Manufacture of telecommucation 2009 83,360 987 8,736 cables and wires(31301) 2012 (Jan.- Jul) 184,781 1,337 17,296
2013 (Jan.- Jul) 234,952 1,307 15,236
100+ 2012 Jan. 26,790 1,342 3,133Feb. 26,809 1,389 2,231Mac 22,740 1,367 2,372Apr. 26,977 1,288 2,198Mei 25,098 1,306 2,292Jun 27,981 1,290 2,889Jul. 28,386 1,337 2,181Ogos 24,477 1,325 2,270Sept. 24,768 1,317 2,231Okt. 26,932 1,317 2,418Nov. 29,917 1,329 2,484Dis. 35,668 1,379 2,668
100+ 2013 Jan. 23,908 1,260 2,022Feb. 26,400 1,252 2,054Mac 28,204 1,185 2,190Apr. 32,811 1,240 2,172Mei 35,878 1,270 2,108Jun 44,936 1,274 2,216Jul. 42,815 1,307 2,474OgosSept.Okt.Nov.Dis.
90. PEMBUATAN KABEL 2012 2,322,508 2,695 84,109DAN WAYAR KUASA 2011 2,065,832 2,486 79,926ELEKTRIK 2010 1,831,501 2,353 72,171Manufacture of electric power 2009 1,397,124 2,093 60,254 cables and wires(31302) 2012 (Jan.- Jul) 1,351,458 2,738 49,030
2013 (Jan.- Jul) 1,614,048 3,592 63,058
LENGKAP 2012 Jan. 153,643 2,687 6,686Complete Feb. 186,985 2,731 6,953
Mac 206,157 2,758 7,626Apr. 189,435 2,730 6,999Mei 203,953 2,621 6,875Jun 199,419 2,795 6,820Jul. 211,866 2,738 7,071Ogos 190,173 2,798 7,285Sept. 197,142 2,794 7,254Okt. 195,125 2,765 6,939Nov. 182,064 2,662 6,700Dis. 206,546 2,695 6,901
LENGKAP 2013 Jan. 224,787 3,442 8,410Complete Feb. 216,202 3,561 8,574
Mac 238,502 3,699 9,198Apr. 227,598 3,692 8,917Mei 248,028 3,767 9,425Jun 222,396 3,614 8,934Jul. 236,535 3,592 9,600OgosSept.Okt.Nov.Dis.
JADUAL 1 (SAMB.) : PERANGKAAN UTAMA BAGI INDUSTRI PEMBUATAN YANG TERPILIHTable 1 (Cont'd) : Principal Statistics of Selected Manufacturing Industries
56
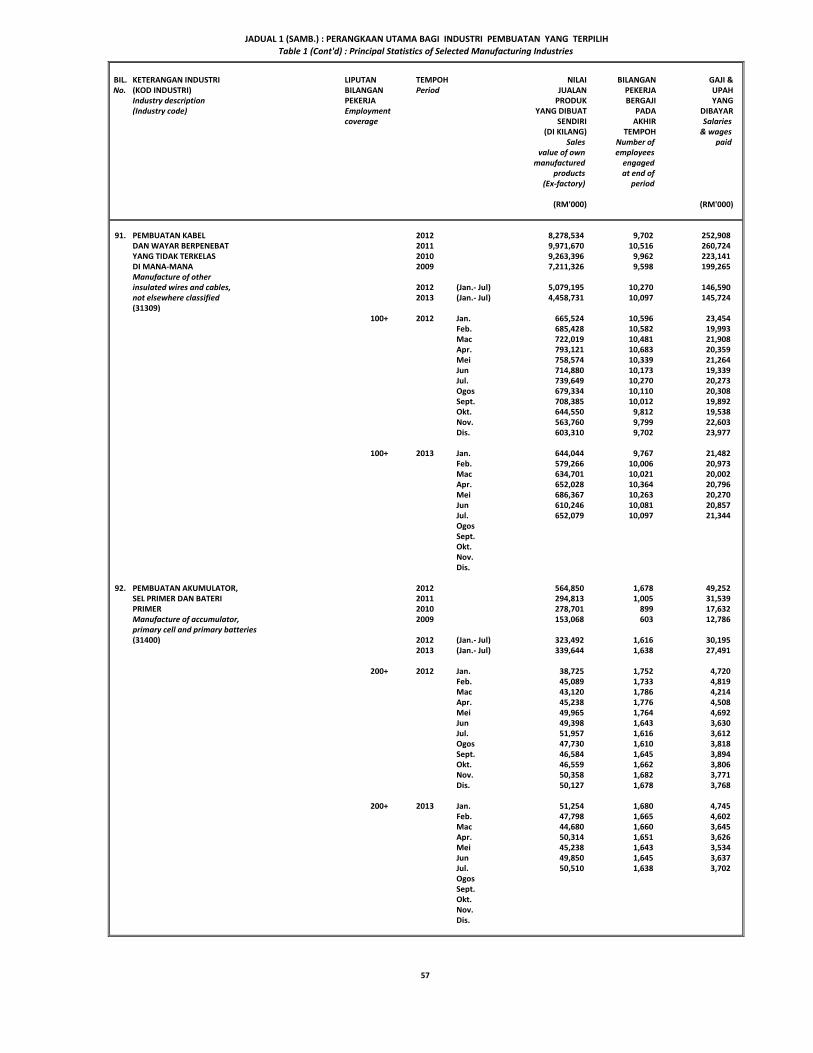
BIL. KETERANGAN INDUSTRI LIPUTAN TEMPOH NILAI BILANGAN GAJI &No. (KOD INDUSTRI) BILANGAN Period JUALAN PEKERJA UPAH
Industry description PEKERJA PRODUK BERGAJI YANG(Industry code) Employment YANG DIBUAT PADA DIBAYAR
coverage SENDIRI AKHIR Salaries(DI KILANG) TEMPOH & wages
Sales Number of paidvalue of own employees
manufactured engagedproducts at end of
(Ex-factory) period
(RM'000) (RM'000)
91. PEMBUATAN KABEL 2012 8,278,534 9,702 252,908DAN WAYAR BERPENEBAT 2011 9,971,670 10,516 260,724YANG TIDAK TERKELAS 2010 9,263,396 9,962 223,141DI MANA-MANA 2009 7,211,326 9,598 199,265 Manufacture of otherinsulated wires and cables, 2012 (Jan.- Jul) 5,079,195 10,270 146,590not elsewhere classified 2013 (Jan.- Jul) 4,458,731 10,097 145,724(31309)
100+ 2012 Jan. 665,524 10,596 23,454Feb. 685,428 10,582 19,993Mac 722,019 10,481 21,908Apr. 793,121 10,683 20,359Mei 758,574 10,339 21,264Jun 714,880 10,173 19,339Jul. 739,649 10,270 20,273Ogos 679,334 10,110 20,308Sept. 708,385 10,012 19,892Okt. 644,550 9,812 19,538Nov. 563,760 9,799 22,603Dis. 603,310 9,702 23,977
100+ 2013 Jan. 644,044 9,767 21,482Feb. 579,266 10,006 20,973Mac 634,701 10,021 20,002Apr. 652,028 10,364 20,796Mei 686,367 10,263 20,270Jun 610,246 10,081 20,857Jul. 652,079 10,097 21,344OgosSept.Okt.Nov.Dis.
92. PEMBUATAN AKUMULATOR, 2012 564,850 1,678 49,252SEL PRIMER DAN BATERI 2011 294,813 1,005 31,539PRIMER 2010 278,701 899 17,632Manufacture of accumulator, 2009 153,068 603 12,786 primary cell and primary batteries(31400) 2012 (Jan.- Jul) 323,492 1,616 30,195
2013 (Jan.- Jul) 339,644 1,638 27,491
200+ 2012 Jan. 38,725 1,752 4,720Feb. 45,089 1,733 4,819Mac 43,120 1,786 4,214Apr. 45,238 1,776 4,508Mei 49,965 1,764 4,692Jun 49,398 1,643 3,630Jul. 51,957 1,616 3,612Ogos 47,730 1,610 3,818Sept. 46,584 1,645 3,894Okt. 46,559 1,662 3,806Nov. 50,358 1,682 3,771Dis. 50,127 1,678 3,768
200+ 2013 Jan. 51,254 1,680 4,745Feb. 47,798 1,665 4,602Mac 44,680 1,660 3,645Apr. 50,314 1,651 3,626Mei 45,238 1,643 3,534Jun 49,850 1,645 3,637Jul. 50,510 1,638 3,702OgosSept.Okt.Nov.Dis.
JADUAL 1 (SAMB.) : PERANGKAAN UTAMA BAGI INDUSTRI PEMBUATAN YANG TERPILIHTable 1 (Cont'd) : Principal Statistics of Selected Manufacturing Industries
57
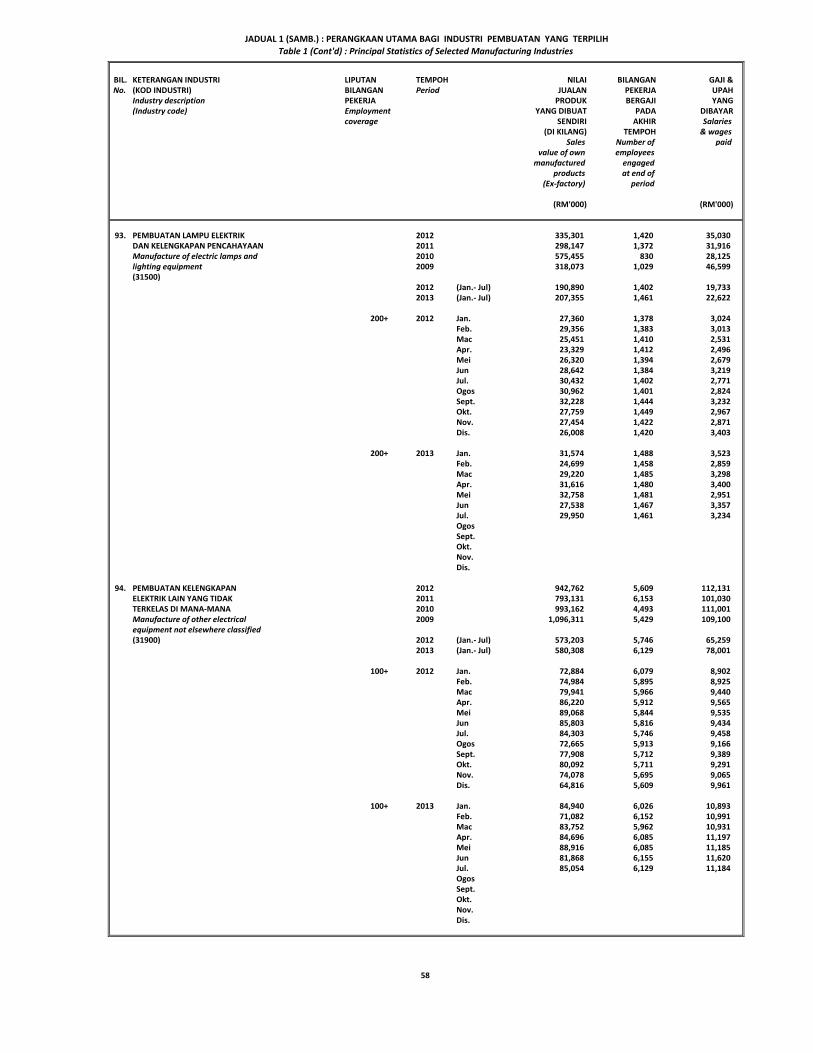
BIL. KETERANGAN INDUSTRI LIPUTAN TEMPOH NILAI BILANGAN GAJI &No. (KOD INDUSTRI) BILANGAN Period JUALAN PEKERJA UPAH
Industry description PEKERJA PRODUK BERGAJI YANG(Industry code) Employment YANG DIBUAT PADA DIBAYAR
coverage SENDIRI AKHIR Salaries(DI KILANG) TEMPOH & wages
Sales Number of paidvalue of own employees
manufactured engagedproducts at end of
(Ex-factory) period
(RM'000) (RM'000)
93. PEMBUATAN LAMPU ELEKTRIK 2012 335,301 1,420 35,030DAN KELENGKAPAN PENCAHAYAAN 2011 298,147 1,372 31,916Manufacture of electric lamps and 2010 575,455 830 28,125lighting equipment 2009 318,073 1,029 46,599 (31500)
2012 (Jan.- Jul) 190,890 1,402 19,7332013 (Jan.- Jul) 207,355 1,461 22,622
200+ 2012 Jan. 27,360 1,378 3,024Feb. 29,356 1,383 3,013Mac 25,451 1,410 2,531Apr. 23,329 1,412 2,496Mei 26,320 1,394 2,679Jun 28,642 1,384 3,219Jul. 30,432 1,402 2,771Ogos 30,962 1,401 2,824Sept. 32,228 1,444 3,232Okt. 27,759 1,449 2,967Nov. 27,454 1,422 2,871Dis. 26,008 1,420 3,403
200+ 2013 Jan. 31,574 1,488 3,523Feb. 24,699 1,458 2,859Mac 29,220 1,485 3,298Apr. 31,616 1,480 3,400Mei 32,758 1,481 2,951Jun 27,538 1,467 3,357Jul. 29,950 1,461 3,234OgosSept.Okt.Nov.Dis.
94. PEMBUATAN KELENGKAPAN 2012 942,762 5,609 112,131ELEKTRIK LAIN YANG TIDAK 2011 793,131 6,153 101,030TERKELAS DI MANA-MANA 2010 993,162 4,493 111,001Manufacture of other electrical 2009 1,096,311 5,429 109,100 equipment not elsewhere classified(31900) 2012 (Jan.- Jul) 573,203 5,746 65,259
2013 (Jan.- Jul) 580,308 6,129 78,001
100+ 2012 Jan. 72,884 6,079 8,902Feb. 74,984 5,895 8,925Mac 79,941 5,966 9,440Apr. 86,220 5,912 9,565Mei 89,068 5,844 9,535Jun 85,803 5,816 9,434Jul. 84,303 5,746 9,458Ogos 72,665 5,913 9,166Sept. 77,908 5,712 9,389Okt. 80,092 5,711 9,291Nov. 74,078 5,695 9,065Dis. 64,816 5,609 9,961
100+ 2013 Jan. 84,940 6,026 10,893Feb. 71,082 6,152 10,991Mac 83,752 5,962 10,931Apr. 84,696 6,085 11,197Mei 88,916 6,085 11,185Jun 81,868 6,155 11,620Jul. 85,054 6,129 11,184OgosSept.Okt.Nov.Dis.
JADUAL 1 (SAMB.) : PERANGKAAN UTAMA BAGI INDUSTRI PEMBUATAN YANG TERPILIHTable 1 (Cont'd) : Principal Statistics of Selected Manufacturing Industries
58
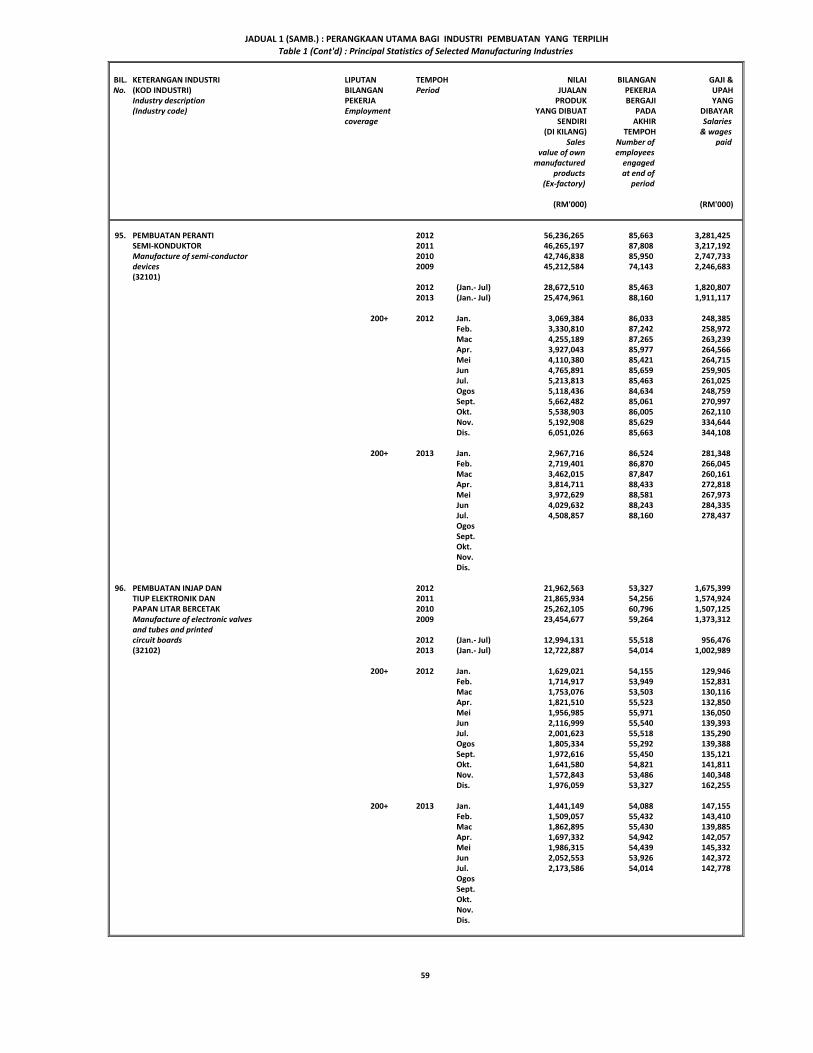
BIL. KETERANGAN INDUSTRI LIPUTAN TEMPOH NILAI BILANGAN GAJI &No. (KOD INDUSTRI) BILANGAN Period JUALAN PEKERJA UPAH
Industry description PEKERJA PRODUK BERGAJI YANG(Industry code) Employment YANG DIBUAT PADA DIBAYAR
coverage SENDIRI AKHIR Salaries(DI KILANG) TEMPOH & wages
Sales Number of paidvalue of own employees
manufactured engagedproducts at end of
(Ex-factory) period
(RM'000) (RM'000)
95. PEMBUATAN PERANTI 2012 56,236,265 85,663 3,281,425SEMI-KONDUKTOR 2011 46,265,197 87,808 3,217,192Manufacture of semi-conductor 2010 42,746,838 85,950 2,747,733devices 2009 45,212,584 74,143 2,246,683 (32101)
2012 (Jan.- Jul) 28,672,510 85,463 1,820,8072013 (Jan.- Jul) 25,474,961 88,160 1,911,117
200+ 2012 Jan. 3,069,384 86,033 248,385Feb. 3,330,810 87,242 258,972Mac 4,255,189 87,265 263,239Apr. 3,927,043 85,977 264,566Mei 4,110,380 85,421 264,715Jun 4,765,891 85,659 259,905Jul. 5,213,813 85,463 261,025Ogos 5,118,436 84,634 248,759Sept. 5,662,482 85,061 270,997Okt. 5,538,903 86,005 262,110Nov. 5,192,908 85,629 334,644Dis. 6,051,026 85,663 344,108
200+ 2013 Jan. 2,967,716 86,524 281,348Feb. 2,719,401 86,870 266,045Mac 3,462,015 87,847 260,161Apr. 3,814,711 88,433 272,818Mei 3,972,629 88,581 267,973Jun 4,029,632 88,243 284,335Jul. 4,508,857 88,160 278,437OgosSept.Okt.Nov.Dis.
96. PEMBUATAN INJAP DAN 2012 21,962,563 53,327 1,675,399TIUP ELEKTRONIK DAN 2011 21,865,934 54,256 1,574,924PAPAN LITAR BERCETAK 2010 25,262,105 60,796 1,507,125Manufacture of electronic valves 2009 23,454,677 59,264 1,373,312 and tubes and printedcircuit boards 2012 (Jan.- Jul) 12,994,131 55,518 956,476(32102) 2013 (Jan.- Jul) 12,722,887 54,014 1,002,989
200+ 2012 Jan. 1,629,021 54,155 129,946Feb. 1,714,917 53,949 152,831Mac 1,753,076 53,503 130,116Apr. 1,821,510 55,523 132,850Mei 1,956,985 55,971 136,050Jun 2,116,999 55,540 139,393Jul. 2,001,623 55,518 135,290Ogos 1,805,334 55,292 139,388Sept. 1,972,616 55,450 135,121Okt. 1,641,580 54,821 141,811Nov. 1,572,843 53,486 140,348Dis. 1,976,059 53,327 162,255
200+ 2013 Jan. 1,441,149 54,088 147,155Feb. 1,509,057 55,432 143,410Mac 1,862,895 55,430 139,885Apr. 1,697,332 54,942 142,057Mei 1,986,315 54,439 145,332Jun 2,052,553 53,926 142,372Jul. 2,173,586 54,014 142,778OgosSept.Okt.Nov.Dis.
JADUAL 1 (SAMB.) : PERANGKAAN UTAMA BAGI INDUSTRI PEMBUATAN YANG TERPILIHTable 1 (Cont'd) : Principal Statistics of Selected Manufacturing Industries
59
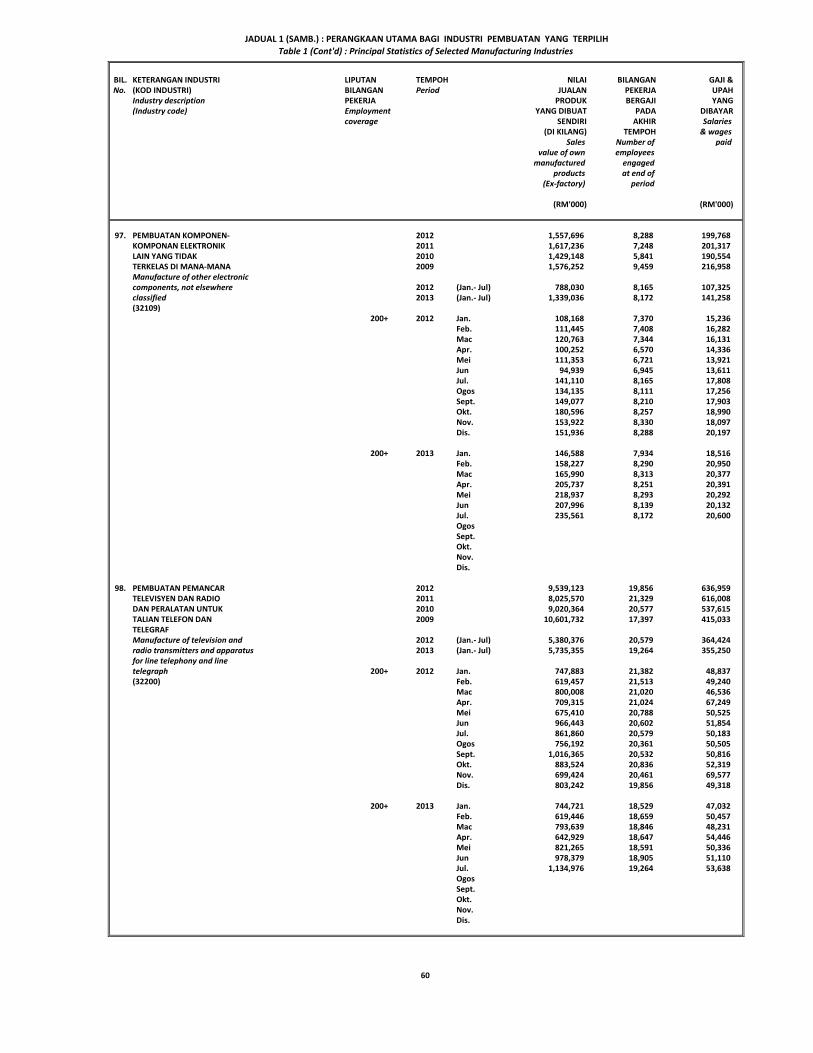
BIL. KETERANGAN INDUSTRI LIPUTAN TEMPOH NILAI BILANGAN GAJI &No. (KOD INDUSTRI) BILANGAN Period JUALAN PEKERJA UPAH
Industry description PEKERJA PRODUK BERGAJI YANG(Industry code) Employment YANG DIBUAT PADA DIBAYAR
coverage SENDIRI AKHIR Salaries(DI KILANG) TEMPOH & wages
Sales Number of paidvalue of own employees
manufactured engagedproducts at end of
(Ex-factory) period
(RM'000) (RM'000)
97. PEMBUATAN KOMPONEN- 2012 1,557,696 8,288 199,768KOMPONAN ELEKTRONIK 2011 1,617,236 7,248 201,317LAIN YANG TIDAK 2010 1,429,148 5,841 190,554TERKELAS DI MANA-MANA 2009 1,576,252 9,459 216,958 Manufacture of other electronic components, not elsewhere 2012 (Jan.- Jul) 788,030 8,165 107,325classified 2013 (Jan.- Jul) 1,339,036 8,172 141,258(32109)
200+ 2012 Jan. 108,168 7,370 15,236Feb. 111,445 7,408 16,282Mac 120,763 7,344 16,131Apr. 100,252 6,570 14,336Mei 111,353 6,721 13,921Jun 94,939 6,945 13,611Jul. 141,110 8,165 17,808Ogos 134,135 8,111 17,256Sept. 149,077 8,210 17,903Okt. 180,596 8,257 18,990Nov. 153,922 8,330 18,097Dis. 151,936 8,288 20,197
200+ 2013 Jan. 146,588 7,934 18,516Feb. 158,227 8,290 20,950Mac 165,990 8,313 20,377Apr. 205,737 8,251 20,391Mei 218,937 8,293 20,292Jun 207,996 8,139 20,132Jul. 235,561 8,172 20,600OgosSept.Okt.Nov.Dis.
98. PEMBUATAN PEMANCAR 2012 9,539,123 19,856 636,959TELEVISYEN DAN RADIO 2011 8,025,570 21,329 616,008DAN PERALATAN UNTUK 2010 9,020,364 20,577 537,615TALIAN TELEFON DAN 2009 10,601,732 17,397 415,033 TELEGRAFManufacture of television and 2012 (Jan.- Jul) 5,380,376 20,579 364,424radio transmitters and apparatus 2013 (Jan.- Jul) 5,735,355 19,264 355,250for line telephony and line telegraph 200+ 2012 Jan. 747,883 21,382 48,837(32200) Feb. 619,457 21,513 49,240
Mac 800,008 21,020 46,536Apr. 709,315 21,024 67,249Mei 675,410 20,788 50,525Jun 966,443 20,602 51,854Jul. 861,860 20,579 50,183Ogos 756,192 20,361 50,505Sept. 1,016,365 20,532 50,816Okt. 883,524 20,836 52,319Nov. 699,424 20,461 69,577Dis. 803,242 19,856 49,318
200+ 2013 Jan. 744,721 18,529 47,032Feb. 619,446 18,659 50,457Mac 793,639 18,846 48,231Apr. 642,929 18,647 54,446Mei 821,265 18,591 50,336Jun 978,379 18,905 51,110Jul. 1,134,976 19,264 53,638OgosSept.Okt.Nov.Dis.
JADUAL 1 (SAMB.) : PERANGKAAN UTAMA BAGI INDUSTRI PEMBUATAN YANG TERPILIHTable 1 (Cont'd) : Principal Statistics of Selected Manufacturing Industries
60
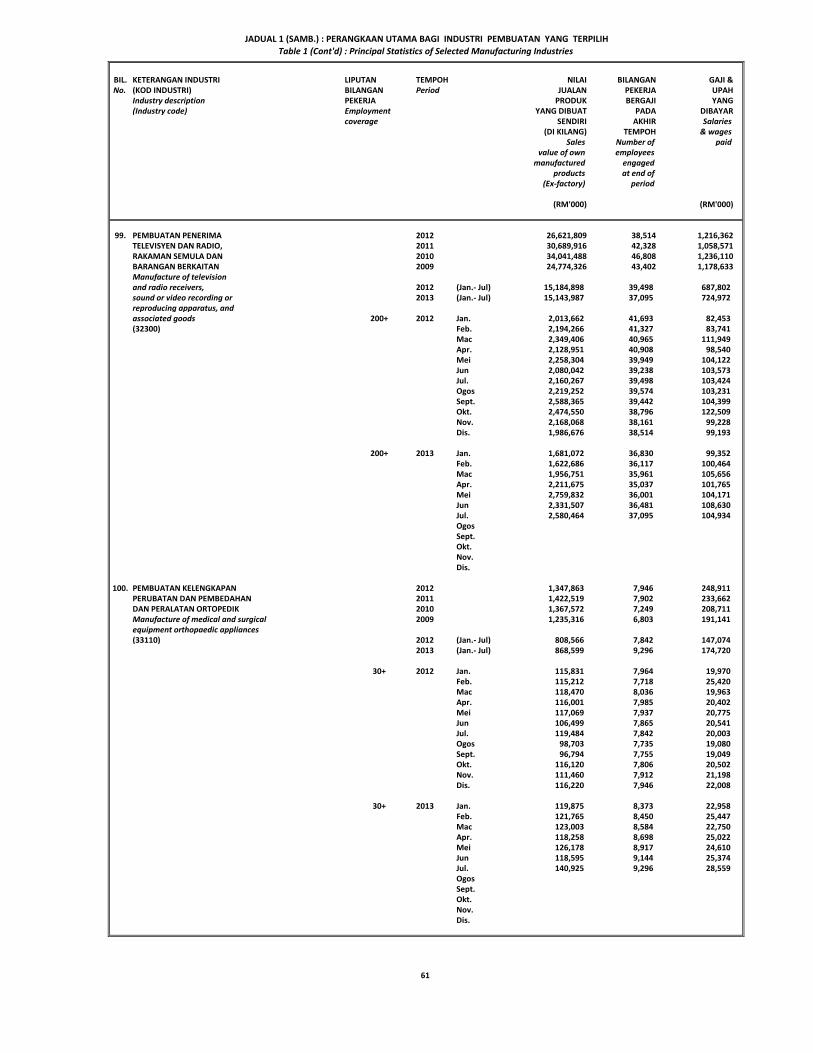
BIL. KETERANGAN INDUSTRI LIPUTAN TEMPOH NILAI BILANGAN GAJI &No. (KOD INDUSTRI) BILANGAN Period JUALAN PEKERJA UPAH
Industry description PEKERJA PRODUK BERGAJI YANG(Industry code) Employment YANG DIBUAT PADA DIBAYAR
coverage SENDIRI AKHIR Salaries(DI KILANG) TEMPOH & wages
Sales Number of paidvalue of own employees
manufactured engagedproducts at end of
(Ex-factory) period
(RM'000) (RM'000)
99. PEMBUATAN PENERIMA 2012 26,621,809 38,514 1,216,362TELEVISYEN DAN RADIO, 2011 30,689,916 42,328 1,058,571RAKAMAN SEMULA DAN 2010 34,041,488 46,808 1,236,110BARANGAN BERKAITAN 2009 24,774,326 43,402 1,178,633Manufacture of televisionand radio receivers, 2012 (Jan.- Jul) 15,184,898 39,498 687,802sound or video recording or 2013 (Jan.- Jul) 15,143,987 37,095 724,972reproducing apparatus, andassociated goods 200+ 2012 Jan. 2,013,662 41,693 82,453(32300) Feb. 2,194,266 41,327 83,741
Mac 2,349,406 40,965 111,949Apr. 2,128,951 40,908 98,540Mei 2,258,304 39,949 104,122Jun 2,080,042 39,238 103,573Jul. 2,160,267 39,498 103,424Ogos 2,219,252 39,574 103,231Sept. 2,588,365 39,442 104,399Okt. 2,474,550 38,796 122,509Nov. 2,168,068 38,161 99,228Dis. 1,986,676 38,514 99,193
200+ 2013 Jan. 1,681,072 36,830 99,352Feb. 1,622,686 36,117 100,464Mac 1,956,751 35,961 105,656Apr. 2,211,675 35,037 101,765Mei 2,759,832 36,001 104,171Jun 2,331,507 36,481 108,630Jul. 2,580,464 37,095 104,934OgosSept.Okt.Nov.Dis.
100. PEMBUATAN KELENGKAPAN 2012 1,347,863 7,946 248,911PERUBATAN DAN PEMBEDAHAN 2011 1,422,519 7,902 233,662DAN PERALATAN ORTOPEDIK 2010 1,367,572 7,249 208,711Manufacture of medical and surgical 2009 1,235,316 6,803 191,141 equipment orthopaedic appliances(33110) 2012 (Jan.- Jul) 808,566 7,842 147,074
2013 (Jan.- Jul) 868,599 9,296 174,720
30+ 2012 Jan. 115,831 7,964 19,970Feb. 115,212 7,718 25,420Mac 118,470 8,036 19,963Apr. 116,001 7,985 20,402Mei 117,069 7,937 20,775Jun 106,499 7,865 20,541Jul. 119,484 7,842 20,003Ogos 98,703 7,735 19,080Sept. 96,794 7,755 19,049Okt. 116,120 7,806 20,502Nov. 111,460 7,912 21,198Dis. 116,220 7,946 22,008
30+ 2013 Jan. 119,875 8,373 22,958Feb. 121,765 8,450 25,447Mac 123,003 8,584 22,750Apr. 118,258 8,698 25,022Mei 126,178 8,917 24,610Jun 118,595 9,144 25,374Jul. 140,925 9,296 28,559OgosSept.Okt.Nov.Dis.
JADUAL 1 (SAMB.) : PERANGKAAN UTAMA BAGI INDUSTRI PEMBUATAN YANG TERPILIHTable 1 (Cont'd) : Principal Statistics of Selected Manufacturing Industries
61
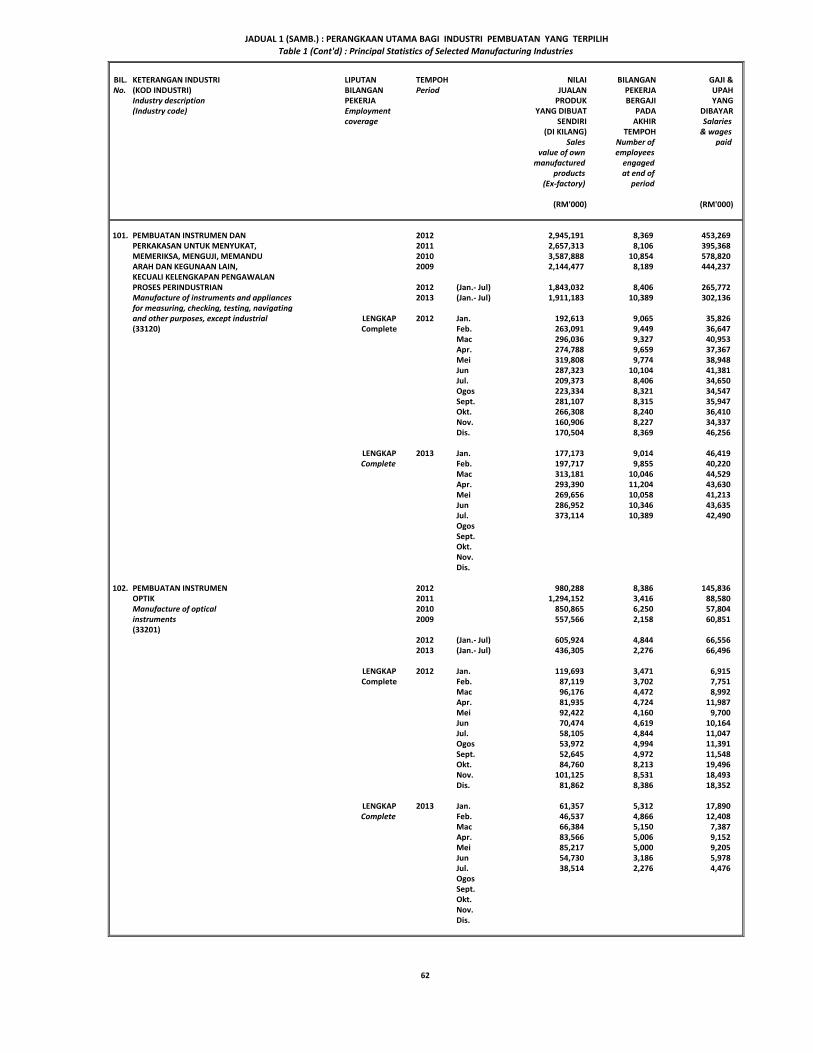
BIL. KETERANGAN INDUSTRI LIPUTAN TEMPOH NILAI BILANGAN GAJI &No. (KOD INDUSTRI) BILANGAN Period JUALAN PEKERJA UPAH
Industry description PEKERJA PRODUK BERGAJI YANG(Industry code) Employment YANG DIBUAT PADA DIBAYAR
coverage SENDIRI AKHIR Salaries(DI KILANG) TEMPOH & wages
Sales Number of paidvalue of own employees
manufactured engagedproducts at end of
(Ex-factory) period
(RM'000) (RM'000)
101. PEMBUATAN INSTRUMEN DAN 2012 2,945,191 8,369 453,269PERKAKASAN UNTUK MENYUKAT, 2011 2,657,313 8,106 395,368MEMERIKSA, MENGUJI, MEMANDU 2010 3,587,888 10,854 578,820ARAH DAN KEGUNAAN LAIN, 2009 2,144,477 8,189 444,237 KECUALI KELENGKAPAN PENGAWALANPROSES PERINDUSTRIAN 2012 (Jan.- Jul) 1,843,032 8,406 265,772Manufacture of instruments and appliances 2013 (Jan.- Jul) 1,911,183 10,389 302,136for measuring, checking, testing, navigatingand other purposes, except industrial LENGKAP 2012 Jan. 192,613 9,065 35,826(33120) Complete Feb. 263,091 9,449 36,647
Mac 296,036 9,327 40,953Apr. 274,788 9,659 37,367Mei 319,808 9,774 38,948Jun 287,323 10,104 41,381Jul. 209,373 8,406 34,650Ogos 223,334 8,321 34,547Sept. 281,107 8,315 35,947Okt. 266,308 8,240 36,410Nov. 160,906 8,227 34,337Dis. 170,504 8,369 46,256
LENGKAP 2013 Jan. 177,173 9,014 46,419Complete Feb. 197,717 9,855 40,220
Mac 313,181 10,046 44,529Apr. 293,390 11,204 43,630Mei 269,656 10,058 41,213Jun 286,952 10,346 43,635Jul. 373,114 10,389 42,490OgosSept.Okt.Nov.Dis.
102. PEMBUATAN INSTRUMEN 2012 980,288 8,386 145,836OPTIK 2011 1,294,152 3,416 88,580Manufacture of optical 2010 850,865 6,250 57,804instruments 2009 557,566 2,158 60,851 (33201)
2012 (Jan.- Jul) 605,924 4,844 66,5562013 (Jan.- Jul) 436,305 2,276 66,496
LENGKAP 2012 Jan. 119,693 3,471 6,915Complete Feb. 87,119 3,702 7,751
Mac 96,176 4,472 8,992Apr. 81,935 4,724 11,987Mei 92,422 4,160 9,700Jun 70,474 4,619 10,164Jul. 58,105 4,844 11,047Ogos 53,972 4,994 11,391Sept. 52,645 4,972 11,548Okt. 84,760 8,213 19,496Nov. 101,125 8,531 18,493Dis. 81,862 8,386 18,352
LENGKAP 2013 Jan. 61,357 5,312 17,890Complete Feb. 46,537 4,866 12,408
Mac 66,384 5,150 7,387Apr. 83,566 5,006 9,152Mei 85,217 5,000 9,205Jun 54,730 3,186 5,978Jul. 38,514 2,276 4,476OgosSept.Okt.Nov.Dis.
JADUAL 1 (SAMB.) : PERANGKAAN UTAMA BAGI INDUSTRI PEMBUATAN YANG TERPILIHTable 1 (Cont'd) : Principal Statistics of Selected Manufacturing Industries
62
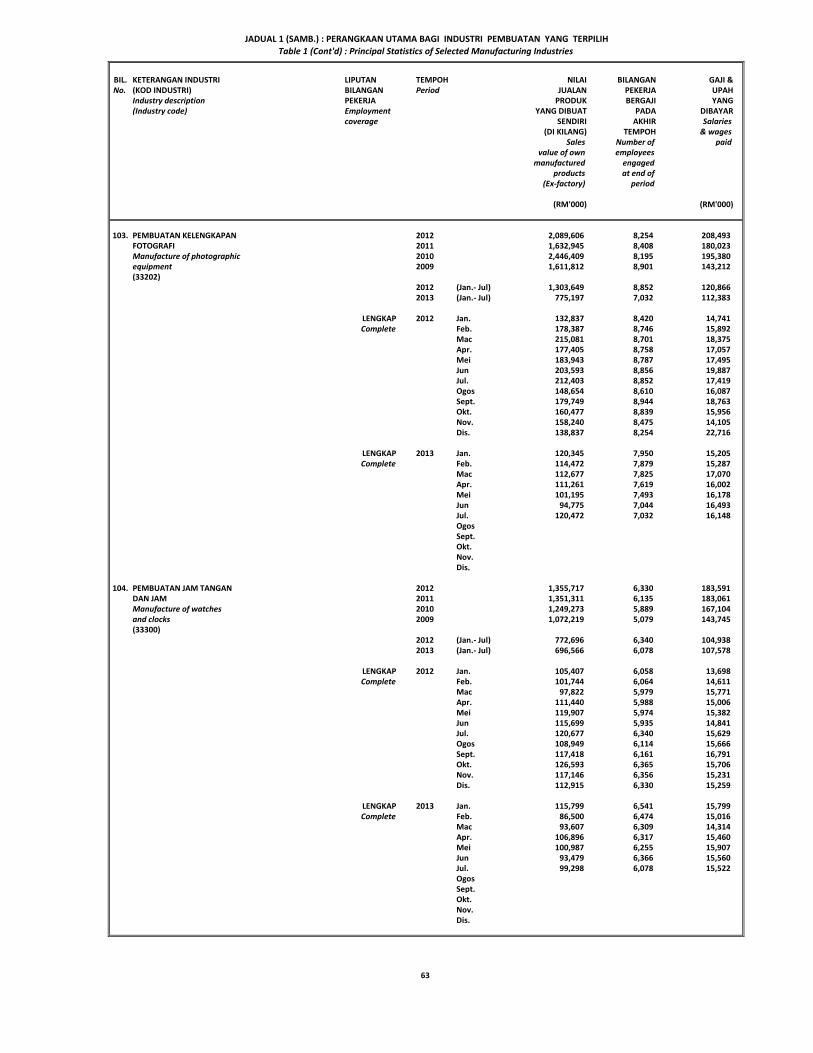
BIL. KETERANGAN INDUSTRI LIPUTAN TEMPOH NILAI BILANGAN GAJI &No. (KOD INDUSTRI) BILANGAN Period JUALAN PEKERJA UPAH
Industry description PEKERJA PRODUK BERGAJI YANG(Industry code) Employment YANG DIBUAT PADA DIBAYAR
coverage SENDIRI AKHIR Salaries(DI KILANG) TEMPOH & wages
Sales Number of paidvalue of own employees
manufactured engagedproducts at end of
(Ex-factory) period
(RM'000) (RM'000)
103. PEMBUATAN KELENGKAPAN 2012 2,089,606 8,254 208,493FOTOGRAFI 2011 1,632,945 8,408 180,023Manufacture of photographic 2010 2,446,409 8,195 195,380equipment 2009 1,611,812 8,901 143,212 (33202)
2012 (Jan.- Jul) 1,303,649 8,852 120,8662013 (Jan.- Jul) 775,197 7,032 112,383
LENGKAP 2012 Jan. 132,837 8,420 14,741Complete Feb. 178,387 8,746 15,892
Mac 215,081 8,701 18,375Apr. 177,405 8,758 17,057Mei 183,943 8,787 17,495Jun 203,593 8,856 19,887Jul. 212,403 8,852 17,419Ogos 148,654 8,610 16,087Sept. 179,749 8,944 18,763Okt. 160,477 8,839 15,956Nov. 158,240 8,475 14,105Dis. 138,837 8,254 22,716
LENGKAP 2013 Jan. 120,345 7,950 15,205Complete Feb. 114,472 7,879 15,287
Mac 112,677 7,825 17,070Apr. 111,261 7,619 16,002Mei 101,195 7,493 16,178Jun 94,775 7,044 16,493Jul. 120,472 7,032 16,148OgosSept.Okt.Nov.Dis.
104. PEMBUATAN JAM TANGAN 2012 1,355,717 6,330 183,591DAN JAM 2011 1,351,311 6,135 183,061Manufacture of watches 2010 1,249,273 5,889 167,104and clocks 2009 1,072,219 5,079 143,745 (33300)
2012 (Jan.- Jul) 772,696 6,340 104,9382013 (Jan.- Jul) 696,566 6,078 107,578
LENGKAP 2012 Jan. 105,407 6,058 13,698Complete Feb. 101,744 6,064 14,611
Mac 97,822 5,979 15,771Apr. 111,440 5,988 15,006Mei 119,907 5,974 15,382Jun 115,699 5,935 14,841Jul. 120,677 6,340 15,629Ogos 108,949 6,114 15,666Sept. 117,418 6,161 16,791Okt. 126,593 6,365 15,706Nov. 117,146 6,356 15,231Dis. 112,915 6,330 15,259
LENGKAP 2013 Jan. 115,799 6,541 15,799Complete Feb. 86,500 6,474 15,016
Mac 93,607 6,309 14,314Apr. 106,896 6,317 15,460Mei 100,987 6,255 15,907Jun 93,479 6,366 15,560Jul. 99,298 6,078 15,522OgosSept.Okt.Nov.Dis.
JADUAL 1 (SAMB.) : PERANGKAAN UTAMA BAGI INDUSTRI PEMBUATAN YANG TERPILIHTable 1 (Cont'd) : Principal Statistics of Selected Manufacturing Industries
63
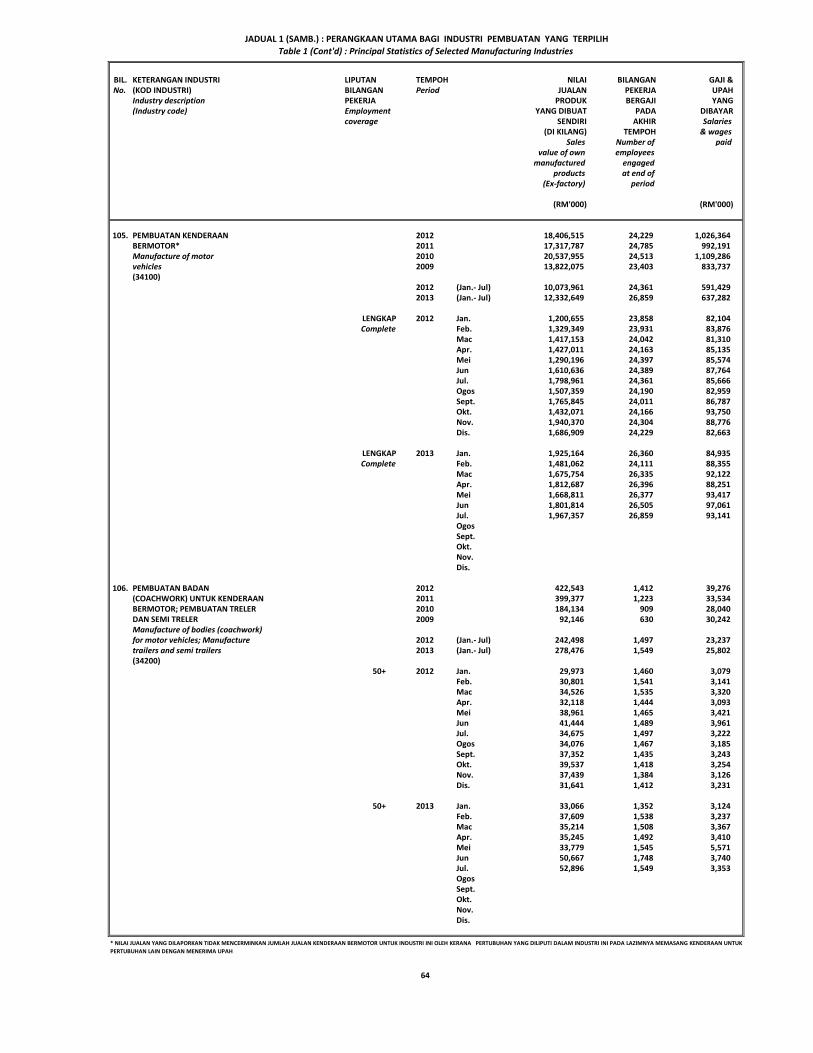
BIL. KETERANGAN INDUSTRI LIPUTAN TEMPOH NILAI BILANGAN GAJI &No. (KOD INDUSTRI) BILANGAN Period JUALAN PEKERJA UPAH
Industry description PEKERJA PRODUK BERGAJI YANG(Industry code) Employment YANG DIBUAT PADA DIBAYAR
coverage SENDIRI AKHIR Salaries(DI KILANG) TEMPOH & wages
Sales Number of paidvalue of own employees
manufactured engagedproducts at end of
(Ex-factory) period
(RM'000) (RM'000)
105. PEMBUATAN KENDERAAN 2012 18,406,515 24,229 1,026,364BERMOTOR* 2011 17,317,787 24,785 992,191Manufacture of motor 2010 20,537,955 24,513 1,109,286vehicles 2009 13,822,075 23,403 833,737 (34100)
2012 (Jan.- Jul) 10,073,961 24,361 591,4292013 (Jan.- Jul) 12,332,649 26,859 637,282
LENGKAP 2012 Jan. 1,200,655 23,858 82,104Complete Feb. 1,329,349 23,931 83,876
Mac 1,417,153 24,042 81,310Apr. 1,427,011 24,163 85,135Mei 1,290,196 24,397 85,574Jun 1,610,636 24,389 87,764Jul. 1,798,961 24,361 85,666Ogos 1,507,359 24,190 82,959Sept. 1,765,845 24,011 86,787Okt. 1,432,071 24,166 93,750Nov. 1,940,370 24,304 88,776Dis. 1,686,909 24,229 82,663
LENGKAP 2013 Jan. 1,925,164 26,360 84,935Complete Feb. 1,481,062 24,111 88,355
Mac 1,675,754 26,335 92,122Apr. 1,812,687 26,396 88,251Mei 1,668,811 26,377 93,417Jun 1,801,814 26,505 97,061Jul. 1,967,357 26,859 93,141OgosSept.Okt.Nov.Dis.
106. PEMBUATAN BADAN 2012 422,543 1,412 39,276(COACHWORK) UNTUK KENDERAAN 2011 399,377 1,223 33,534BERMOTOR; PEMBUATAN TRELER 2010 184,134 909 28,040DAN SEMI TRELER 2009 92,146 630 30,242 Manufacture of bodies (coachwork)for motor vehicles; Manufacture 2012 (Jan.- Jul) 242,498 1,497 23,237trailers and semi trailers 2013 (Jan.- Jul) 278,476 1,549 25,802(34200)
50+ 2012 Jan. 29,973 1,460 3,079Feb. 30,801 1,541 3,141Mac 34,526 1,535 3,320Apr. 32,118 1,444 3,093Mei 38,961 1,465 3,421Jun 41,444 1,489 3,961Jul. 34,675 1,497 3,222Ogos 34,076 1,467 3,185Sept. 37,352 1,435 3,243Okt. 39,537 1,418 3,254Nov. 37,439 1,384 3,126Dis. 31,641 1,412 3,231
50+ 2013 Jan. 33,066 1,352 3,124Feb. 37,609 1,538 3,237Mac 35,214 1,508 3,367Apr. 35,245 1,492 3,410Mei 33,779 1,545 5,571Jun 50,667 1,748 3,740Jul. 52,896 1,549 3,353OgosSept.Okt.Nov.Dis.
JADUAL 1 (SAMB.) : PERANGKAAN UTAMA BAGI INDUSTRI PEMBUATAN YANG TERPILIH
* NILAI JUALAN YANG DILAPORKAN TIDAK MENCERMINKAN JUMLAH JUALAN KENDERAAN BERMOTOR UNTUK INDUSTRI INI OLEH KERANA PERTUBUHAN YANG DILIPUTI DALAM INDUSTRI INI PADA LAZIMNYA MEMASANG KENDERAAN UNTUKPERTUBUHAN LAIN DENGAN MENERIMA UPAH
Table 1 (Cont'd) : Principal Statistics of Selected Manufacturing Industries
64

BIL. KETERANGAN INDUSTRI LIPUTAN TEMPOH NILAI BILANGAN GAJI &No. (KOD INDUSTRI) BILANGAN Period JUALAN PEKERJA UPAH
Industry description PEKERJA PRODUK BERGAJI YANG(Industry code) Employment YANG DIBUAT PADA DIBAYAR
coverage SENDIRI AKHIR Salaries(DI KILANG) TEMPOH & wages
Sales Number of paidvalue of own employees
manufactured engagedproducts at end of
(Ex-factory) period
(RM'000) (RM'000)
107. PEMBUATAN ALAT GANTI 2012 8,307,437 24,001 638,656DAN AKSESORI UNTUK 2011 6,941,930 22,042 566,468KENDERAAN BERMOTOR 2010 6,675,916 22,525 532,167DAN ENJIN 2009 5,730,161 22,921 487,519 Manufacture of parts and accessories for motor vehicles 2012 (Jan.- Jul) 4,659,324 23,100 365,512and their engines 2013 (Jan.- Jul) 5,674,855 26,220 455,039(34300)
100+ 2012 Jan. 581,322 22,407 50,885Feb. 619,480 22,462 52,737Mac 644,243 22,803 52,474Apr. 671,411 22,695 52,347Mei 702,955 23,156 53,304Jun 702,687 23,139 51,297Jul. 737,226 23,100 52,468Ogos 660,730 22,909 52,339Sept. 767,768 23,175 52,034Okt. 801,590 23,812 53,528Nov. 743,657 23,907 53,188Dis. 674,368 24,001 62,055
100+ 2013 Jan. 802,533 28,876 66,738Feb. 780,167 25,394 64,341Mac 810,655 25,736 64,082Apr. 829,367 26,070 63,348Mei 771,907 26,131 64,399Jun 804,090 25,916 64,038Jul. 876,136 26,220 68,093OgosSept.Okt.Nov.Dis.
108. PEMBINAAN DAN PEMBAIKAN 2012 1,616,335 5,638 231,283KAPAL DAN BOT 2011 2,540,040 7,966 330,027Building and repairing of ships 2010 4,755,993 8,835 346,114(35110) 2009 1,995,211 7,199 331,373
2012 (Jan.- Jul) 1,068,191 5,597 141,7252013 (Jan.- Jul) 2,908,531 9,315 257,236
100+ 2012 Jan. 134,775 6,252 21,940Feb. 143,842 6,330 22,878Mac 229,404 6,426 22,601Apr. 72,522 5,683 19,506Mei 82,596 5,752 18,622Jun 193,449 5,698 18,155Jul. 211,603 5,597 18,023Ogos 118,156 5,534 17,633Sept. 127,424 5,479 17,610Okt. 85,007 5,517 17,935Nov. 100,301 5,592 18,030Dis. 117,256 5,638 18,350
100+ 2013 Jan. 440,169 9,283 34,622Feb. 316,406 8,442 32,996Mac 434,818 9,161 35,115Apr. 426,411 9,181 39,770Mei 366,838 9,213 37,729Jun 473,724 9,298 38,388Jul. 450,165 9,315 38,616OgosSept.Okt.Nov.Dis.
JADUAL 1 (SAMB.) : PERANGKAAN UTAMA BAGI INDUSTRI PEMBUATAN YANG TERPILIHTable 1 (Cont'd) : Principal Statistics of Selected Manufacturing Industries
65

BIL. KETERANGAN INDUSTRI LIPUTAN TEMPOH NILAI BILANGAN GAJI &No. (KOD INDUSTRI) BILANGAN Period JUALAN PEKERJA UPAH
Industry description PEKERJA PRODUK BERGAJI YANG(Industry code) Employment YANG DIBUAT PADA DIBAYAR
coverage SENDIRI AKHIR Salaries(DI KILANG) TEMPOH & wages
Sales Number of paidvalue of own employees
manufactured engagedproducts at end of
(Ex-factory) period
(RM'000) (RM'000)
109. PEMBUATAN MOTOSIKAL 2012 3,140,210 6,426 185,507Manufacture of motorcycles 2011 3,080,740 6,565 158,303(35910) 2010 2,826,638 6,193 155,580
2009 2,502,243 5,927 151,955
2012 (Jan.- Jul) 1,891,139 6,690 107,4942013 (Jan.- Jul) 1,754,898 6,081 101,095
200+ 2012 Jan. 233,071 6,707 15,151Feb. 265,508 6,766 14,944Mac 298,678 6,739 17,079Apr. 269,659 6,708 15,906Mei 282,098 6,715 14,986Jun 261,052 6,698 13,593Jul. 281,073 6,690 15,835Ogos 234,089 6,704 16,103Sept. 279,021 6,638 14,652Okt. 262,923 6,471 14,073Nov. 246,777 6,448 15,073Dis. 226,261 6,426 18,112
200+ 2013 Jan. 274,044 6,135 13,414Feb. 186,334 6,138 13,957Mac 214,009 6,155 13,979Apr. 264,122 6,057 13,806Mei 277,268 6,036 14,255Jun 269,230 6,033 17,011Jul. 269,891 6,081 14,673OgosSept.Okt.Nov.Dis.
110. PEMBUATAN BASIKAL 2012 1,759,782 4,184 90,945DAN 'INVALID CARRIAGES' 2011 1,414,310 3,529 79,010Manufacture of bicycle and 2010 1,356,964 3,295 70,516invalid carriages 2009 1,109,727 2,544 55,267 (35920)
2012 (Jan.- Jul) 987,084 4,020 51,7582013 (Jan.- Jul) 964,858 3,955 60,476
100+ 2012 Jan. 138,459 3,559 7,075Feb. 134,817 3,578 7,112Mac 132,677 3,601 7,032Apr. 125,419 3,748 7,703Mei 137,781 3,791 7,430Jun 148,026 3,839 7,470Jul. 169,905 4,020 7,936Ogos 153,044 4,061 7,588Sept. 143,702 4,094 7,881Okt. 145,072 4,174 7,629Nov. 153,849 4,174 7,513Dis. 177,031 4,184 8,576
100+ 2013 Jan. 150,546 4,130 8,386Feb. 108,081 4,083 8,307Mac 133,349 4,044 8,113Apr. 119,855 4,015 8,800Mei 149,262 3,939 8,728Jun 148,706 3,957 9,183Jul. 155,059 3,955 8,959OgosSept.Okt.Nov.Dis.
JADUAL 1 (SAMB.) : PERANGKAAN UTAMA BAGI INDUSTRI PEMBUATAN YANG TERPILIHTable 1 (Cont'd) : Principal Statistics of Selected Manufacturing Industries
66
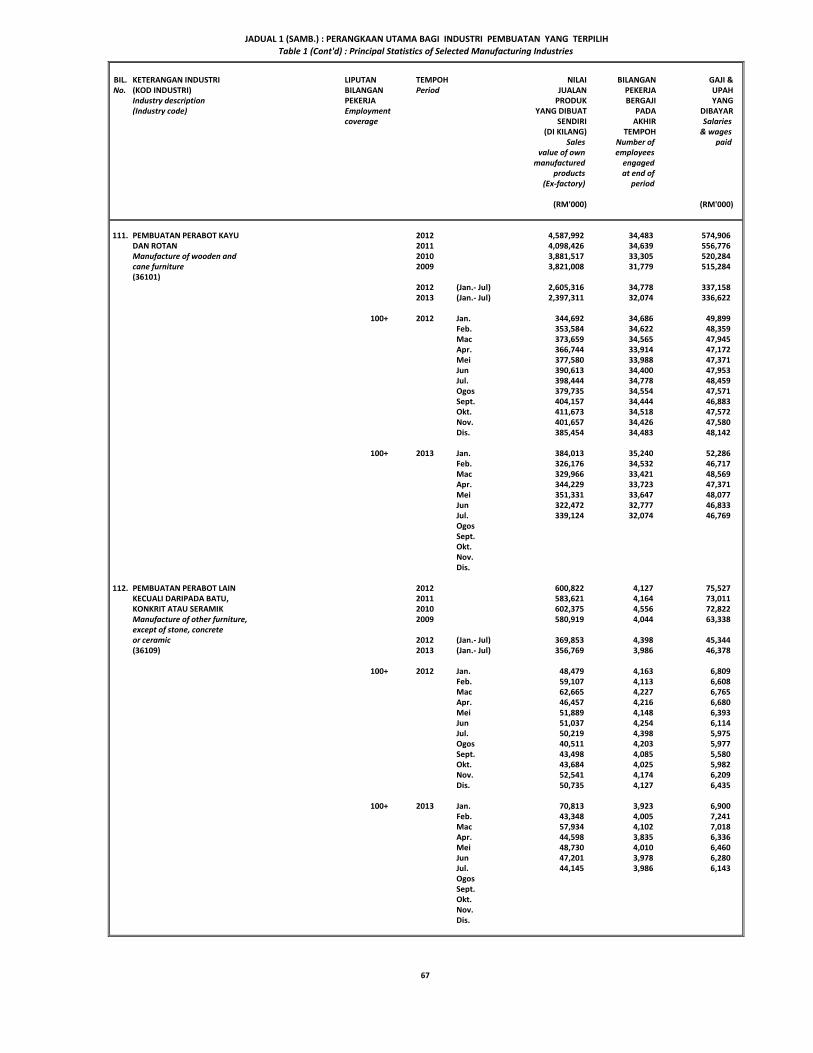
BIL. KETERANGAN INDUSTRI LIPUTAN TEMPOH NILAI BILANGAN GAJI &No. (KOD INDUSTRI) BILANGAN Period JUALAN PEKERJA UPAH
Industry description PEKERJA PRODUK BERGAJI YANG(Industry code) Employment YANG DIBUAT PADA DIBAYAR
coverage SENDIRI AKHIR Salaries(DI KILANG) TEMPOH & wages
Sales Number of paidvalue of own employees
manufactured engagedproducts at end of
(Ex-factory) period
(RM'000) (RM'000)
111. PEMBUATAN PERABOT KAYU 2012 4,587,992 34,483 574,906DAN ROTAN 2011 4,098,426 34,639 556,776Manufacture of wooden and 2010 3,881,517 33,305 520,284cane furniture 2009 3,821,008 31,779 515,284 (36101)
2012 (Jan.- Jul) 2,605,316 34,778 337,1582013 (Jan.- Jul) 2,397,311 32,074 336,622
100+ 2012 Jan. 344,692 34,686 49,899Feb. 353,584 34,622 48,359Mac 373,659 34,565 47,945Apr. 366,744 33,914 47,172Mei 377,580 33,988 47,371Jun 390,613 34,400 47,953Jul. 398,444 34,778 48,459Ogos 379,735 34,554 47,571Sept. 404,157 34,444 46,883Okt. 411,673 34,518 47,572Nov. 401,657 34,426 47,580Dis. 385,454 34,483 48,142
100+ 2013 Jan. 384,013 35,240 52,286Feb. 326,176 34,532 46,717Mac 329,966 33,421 48,569Apr. 344,229 33,723 47,371Mei 351,331 33,647 48,077Jun 322,472 32,777 46,833Jul. 339,124 32,074 46,769OgosSept.Okt.Nov.Dis.
112. PEMBUATAN PERABOT LAIN 2012 600,822 4,127 75,527KECUALI DARIPADA BATU, 2011 583,621 4,164 73,011KONKRIT ATAU SERAMIK 2010 602,375 4,556 72,822Manufacture of other furniture, 2009 580,919 4,044 63,338 except of stone, concreteor ceramic 2012 (Jan.- Jul) 369,853 4,398 45,344(36109) 2013 (Jan.- Jul) 356,769 3,986 46,378
100+ 2012 Jan. 48,479 4,163 6,809Feb. 59,107 4,113 6,608Mac 62,665 4,227 6,765Apr. 46,457 4,216 6,680Mei 51,889 4,148 6,393Jun 51,037 4,254 6,114Jul. 50,219 4,398 5,975Ogos 40,511 4,203 5,977Sept. 43,498 4,085 5,580Okt. 43,684 4,025 5,982Nov. 52,541 4,174 6,209Dis. 50,735 4,127 6,435
100+ 2013 Jan. 70,813 3,923 6,900Feb. 43,348 4,005 7,241Mac 57,934 4,102 7,018Apr. 44,598 3,835 6,336Mei 48,730 4,010 6,460Jun 47,201 3,978 6,280Jul. 44,145 3,986 6,143OgosSept.Okt.Nov.Dis.
JADUAL 1 (SAMB.) : PERANGKAAN UTAMA BAGI INDUSTRI PEMBUATAN YANG TERPILIHTable 1 (Cont'd) : Principal Statistics of Selected Manufacturing Industries
67
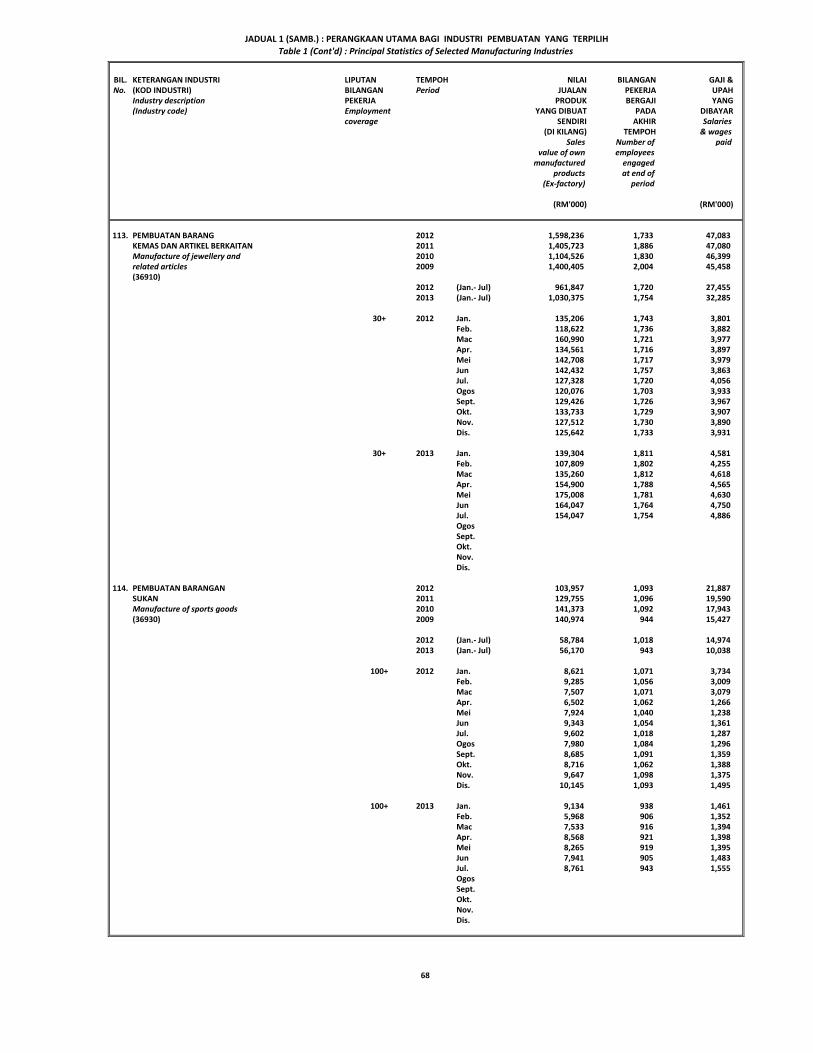
BIL. KETERANGAN INDUSTRI LIPUTAN TEMPOH NILAI BILANGAN GAJI &No. (KOD INDUSTRI) BILANGAN Period JUALAN PEKERJA UPAH
Industry description PEKERJA PRODUK BERGAJI YANG(Industry code) Employment YANG DIBUAT PADA DIBAYAR
coverage SENDIRI AKHIR Salaries(DI KILANG) TEMPOH & wages
Sales Number of paidvalue of own employees
manufactured engagedproducts at end of
(Ex-factory) period
(RM'000) (RM'000)
113. PEMBUATAN BARANG 2012 1,598,236 1,733 47,083KEMAS DAN ARTIKEL BERKAITAN 2011 1,405,723 1,886 47,080Manufacture of jewellery and 2010 1,104,526 1,830 46,399related articles 2009 1,400,405 2,004 45,458 (36910)
2012 (Jan.- Jul) 961,847 1,720 27,4552013 (Jan.- Jul) 1,030,375 1,754 32,285
30+ 2012 Jan. 135,206 1,743 3,801Feb. 118,622 1,736 3,882Mac 160,990 1,721 3,977Apr. 134,561 1,716 3,897Mei 142,708 1,717 3,979Jun 142,432 1,757 3,863Jul. 127,328 1,720 4,056Ogos 120,076 1,703 3,933Sept. 129,426 1,726 3,967Okt. 133,733 1,729 3,907Nov. 127,512 1,730 3,890Dis. 125,642 1,733 3,931
30+ 2013 Jan. 139,304 1,811 4,581Feb. 107,809 1,802 4,255Mac 135,260 1,812 4,618Apr. 154,900 1,788 4,565Mei 175,008 1,781 4,630Jun 164,047 1,764 4,750Jul. 154,047 1,754 4,886OgosSept.Okt.Nov.Dis.
114. PEMBUATAN BARANGAN 2012 103,957 1,093 21,887SUKAN 2011 129,755 1,096 19,590Manufacture of sports goods 2010 141,373 1,092 17,943(36930) 2009 140,974 944 15,427
2012 (Jan.- Jul) 58,784 1,018 14,9742013 (Jan.- Jul) 56,170 943 10,038
100+ 2012 Jan. 8,621 1,071 3,734Feb. 9,285 1,056 3,009Mac 7,507 1,071 3,079Apr. 6,502 1,062 1,266Mei 7,924 1,040 1,238Jun 9,343 1,054 1,361Jul. 9,602 1,018 1,287Ogos 7,980 1,084 1,296Sept. 8,685 1,091 1,359Okt. 8,716 1,062 1,388Nov. 9,647 1,098 1,375Dis. 10,145 1,093 1,495
100+ 2013 Jan. 9,134 938 1,461Feb. 5,968 906 1,352Mac 7,533 916 1,394Apr. 8,568 921 1,398Mei 8,265 919 1,395Jun 7,941 905 1,483Jul. 8,761 943 1,555OgosSept.Okt.Nov.Dis.
JADUAL 1 (SAMB.) : PERANGKAAN UTAMA BAGI INDUSTRI PEMBUATAN YANG TERPILIHTable 1 (Cont'd) : Principal Statistics of Selected Manufacturing Industries
68

BIL. KETERANGAN INDUSTRI LIPUTAN TEMPOH NILAI BILANGAN GAJI &No. (KOD INDUSTRI) BILANGAN Period JUALAN PEKERJA UPAH
Industry description PEKERJA PRODUK BERGAJI YANG(Industry code) Employment YANG DIBUAT PADA DIBAYAR
coverage SENDIRI AKHIR Salaries(DI KILANG) TEMPOH & wages
Sales Number of paidvalue of own employees
manufactured engagedproducts at end of
(Ex-factory) period
(RM'000) (RM'000)
115. PEMBUATAN PERMAINAN DAN 2012 233,009 4,521 72,722BARANG MAINAN 2011 218,525 3,936 73,688Manufacture of games and toys 2010 207,880 4,206 61,918(36940) 2009 199,078 3,432 53,093
2012 (Jan.- Jul) 135,241 3,900 41,3102013 (Jan.- Jul) 159,402 4,514 57,303
LENGKAP 2012 Jan. 17,163 4,070 5,252Complete Feb. 16,667 3,987 4,885
Mac 19,910 3,887 9,544Apr. 19,296 3,898 5,348Mei 20,460 3,890 5,246Jun 21,740 3,865 5,373Jul. 20,005 3,900 5,662Ogos 19,260 4,069 5,334Sept. 19,692 4,101 5,702Okt. 19,066 4,068 5,357Nov. 20,555 4,261 5,955Dis. 19,195 4,521 9,064
LENGKAP 2013 Jan. 20,281 4,659 7,704Complete Feb. 20,092 4,638 7,193
Mac 26,762 4,733 12,954Apr. 22,027 4,617 7,154Mei 24,313 4,593 7,657Jun 23,406 4,490 7,355Jul. 22,521 4,514 7,286OgosSept.Okt.Nov.Dis.
116. PEMBUATAN PEN, PENSIL 2012 833,299 4,023 76,745BEKALAN PEJABAT DAN 2011 963,364 4,619 89,026PELUKIS 2010 878,679 5,987 88,299Manufacture of pens, pencils, 2009 323,349 4,852 65,164 office and artists' supplies(36992) 2012 (Jan.- Jul) 502,227 3,775 43,330
2013 (Jan.- Jul) 549,310 5,287 79,541
50+ 2012 Jan. 64,022 3,716 6,137Feb. 70,306 3,814 5,929Mac 74,487 3,779 6,767Apr. 70,024 3,884 6,042Mei 69,616 3,808 6,238Jun 70,759 3,854 5,801Jul. 83,013 3,775 6,416Ogos 67,678 3,781 6,445Sept. 70,098 3,574 6,184Okt. 68,519 4,396 8,139Nov. 53,023 3,835 6,212Dis. 71,754 4,023 6,435
50+ 2013 Jan. 76,357 5,967 12,365Feb. 70,906 5,037 11,124Mac 85,361 5,489 11,805Apr. 80,186 5,530 11,892Mei 80,524 5,504 10,635Jun 75,564 5,456 10,784Jul. 80,412 5,287 10,936OgosSept.Okt.Nov.Dis.
JADUAL 1 (SAMB.) : PERANGKAAN UTAMA BAGI INDUSTRI PEMBUATAN YANG TERPILIHTable 1 (Cont'd) : Principal Statistics of Selected Manufacturing Industries
69
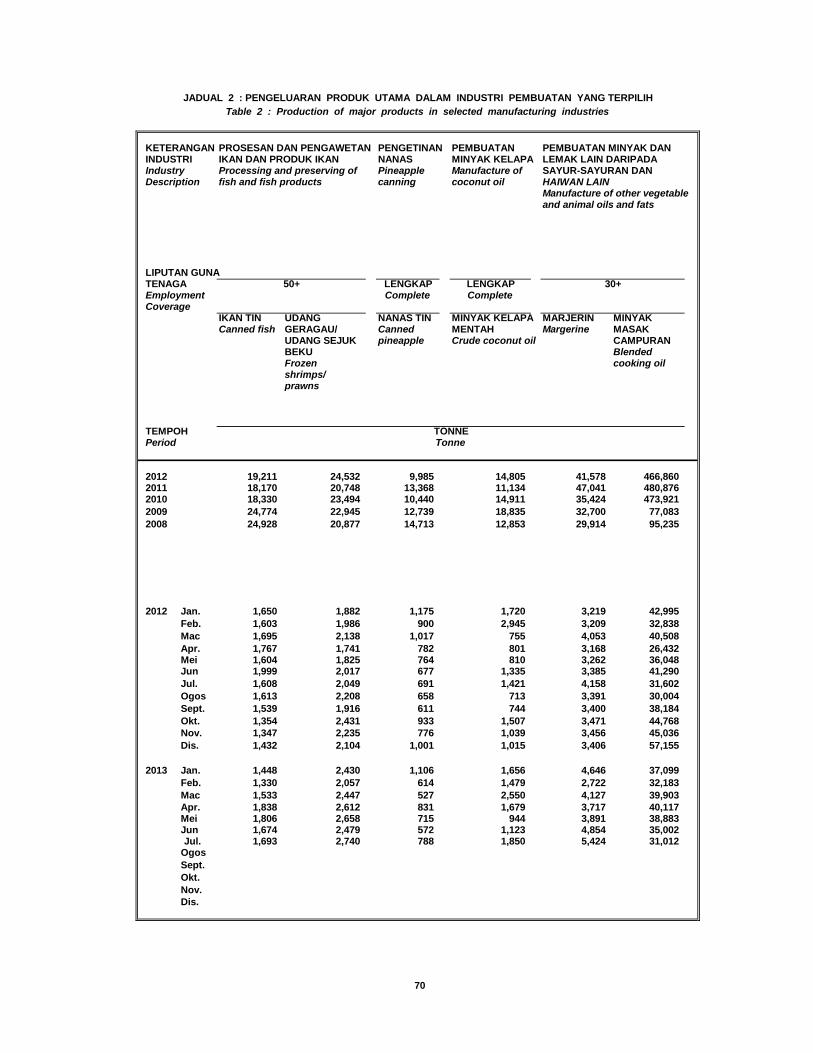
KETERANGAN PROSESAN DAN PENGAWETAN PENGETINAN PEMBUATAN PEMBUATAN MINYAK DAN INDUSTRI IKAN DAN PRODUK IKAN NANAS MINYAK KELAPA LEMAK LAIN DARIPADA Industry Processing and preserving of Pineapple Manufacture of SAYUR-SAYURAN DAN Description fish and fish products canning coconut oil HAIWAN LAIN
Manufacture of other vegetableand animal oils and fats
LIPUTAN GUNATENAGA LENGKAP LENGKAPEmployment Complete CompleteCoverage
IKAN TIN UDANG NANAS TIN MINYAK KELAPA MARJERIN MINYAKCanned fish GERAGAU/ Canned MENTAH Margerine MASAK
UDANG SEJUK pineapple Crude coconut oil CAMPURANBEKU BlendedFrozen cooking oilshrimps/prawns
TEMPOHPeriod
2012 19,211 24,532 9,985 14,805 41,578 466,8602011 18,170 20,748 13,368 11,134 47,041 480,8762010 18,330 23,494 10,440 14,911 35,424 473,9212009 24,774 22,945 12,739 18,835 32,700 77,0832008 24,928 20,877 14,713 12,853 29,914 95,235
2012 Jan. 1,650 1,882 1,175 1,720 3,219 42,995 Feb. 1,603 1,986 900 2,945 3,209 32,838 Mac 1,695 2,138 1,017 755 4,053 40,508 Apr. 1,767 1,741 782 801 3,168 26,432 Mei 1,604 1,825 764 810 3,262 36,048 Jun 1,999 2,017 677 1,335 3,385 41,290 Jul. 1,608 2,049 691 1,421 4,158 31,602 Ogos 1,613 2,208 658 713 3,391 30,004 Sept. 1,539 1,916 611 744 3,400 38,184 Okt. 1,354 2,431 933 1,507 3,471 44,768 Nov. 1,347 2,235 776 1,039 3,456 45,036 Dis. 1,432 2,104 1,001 1,015 3,406 57,155
2013 Jan. 1,448 2,430 1,106 1,656 4,646 37,099 Feb. 1,330 2,057 614 1,479 2,722 32,183 Mac 1,533 2,447 527 2,550 4,127 39,903 Apr. 1,838 2,612 831 1,679 3,717 40,117 Mei 1,806 2,658 715 944 3,891 38,883 Jun 1,674 2,479 572 1,123 4,854 35,002 Jul. 1,693 2,740 788 1,850 5,424 31,012
Ogos Sept. Okt. Nov. Dis.
70
TonneTONNE
50+ 30+
Table 2 : Production of major products in selected manufacturing industriesJADUAL 2 : PENGELUARAN PRODUK UTAMA DALAM INDUSTRI PEMBUATAN YANG TERPILIH
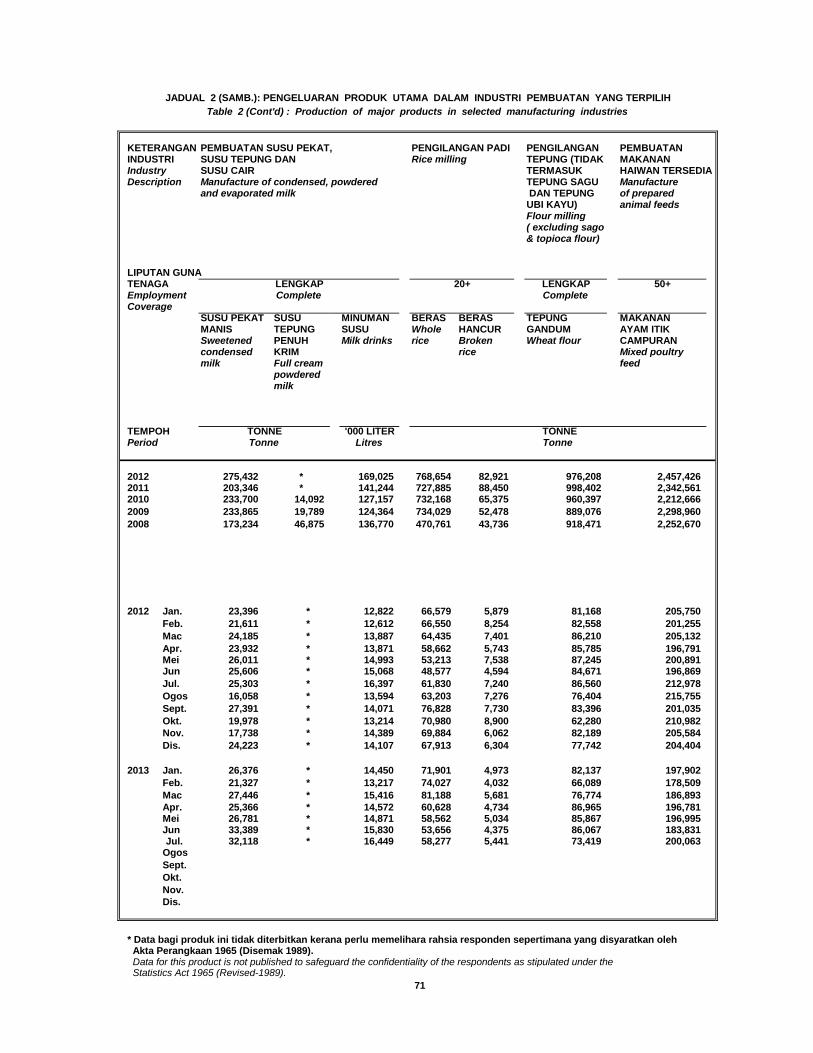
KETERANGAN PEMBUATAN SUSU PEKAT, PENGILANGAN PADI PENGILANGAN PEMBUATANINDUSTRI SUSU TEPUNG DAN Rice milling TEPUNG (TIDAK MAKANANIndustry SUSU CAIR TERMASUK HAIWAN TERSEDIADescription Manufacture of condensed, powdered TEPUNG SAGU Manufacture
and evaporated milk DAN TEPUNG of preparedUBI KAYU) animal feedsFlour milling ( excluding sago& topioca flour)
LIPUTAN GUNATENAGA LENGKAP 50+Employment CompleteCoverage
SUSU PEKAT SUSU MINUMAN BERAS BERAS TEPUNG MAKANANMANIS TEPUNG SUSU Whole HANCUR GANDUM AYAM ITIKSweetened PENUH Milk drinks rice Broken Wheat flour CAMPURANcondensed KRIM rice Mixed poultrymilk Full cream feed
powderedmilk
TEMPOH '000 LITERPeriod Litres
2012 275,432 * 169,025 768,654 82,921 976,208 2,457,4262011 203,346 * 141,244 727,885 88,450 998,402 2,342,5612010 233,700 14,092 127,157 732,168 65,375 960,397 2,212,6662009 233,865 19,789 124,364 734,029 52,478 889,076 2,298,9602008 173,234 46,875 136,770 470,761 43,736 918,471 2,252,670
2012 Jan. 23,396 * 12,822 66,579 5,879 81,168 205,750 Feb. 21,611 * 12,612 66,550 8,254 82,558 201,255 Mac 24,185 * 13,887 64,435 7,401 86,210 205,132 Apr. 23,932 * 13,871 58,662 5,743 85,785 196,791 Mei 26,011 * 14,993 53,213 7,538 87,245 200,891 Jun 25,606 * 15,068 48,577 4,594 84,671 196,869 Jul. 25,303 * 16,397 61,830 7,240 86,560 212,978 Ogos 16,058 * 13,594 63,203 7,276 76,404 215,755 Sept. 27,391 * 14,071 76,828 7,730 83,396 201,035 Okt. 19,978 * 13,214 70,980 8,900 62,280 210,982 Nov. 17,738 * 14,389 69,884 6,062 82,189 205,584 Dis. 24,223 * 14,107 67,913 6,304 77,742 204,404
2013 Jan. 26,376 * 14,450 71,901 4,973 82,137 197,902 Feb. 21,327 * 13,217 74,027 4,032 66,089 178,509 Mac 27,446 * 15,416 81,188 5,681 76,774 186,893 Apr. 25,366 * 14,572 60,628 4,734 86,965 196,781 Mei 26,781 * 14,871 58,562 5,034 85,867 196,995 Jun 33,389 * 15,830 53,656 4,375 86,067 183,831 Jul. 32,118 * 16,449 58,277 5,441 73,419 200,063
Ogos Sept. Okt. Nov. Dis.
* Data bagi produk ini tidak diterbitkan kerana perlu memelihara rahsia responden sepertimana yang disyaratkan oleh
Data for this product is not published to safeguard the confidentiality of the respondents as stipulated under the Statistics Act 1965 (Revised-1989).
71
Akta Perangkaan 1965 (Disemak 1989).
Tonne TonneTONNE TONNE
CompleteLENGKAP 20+
Table 2 (Cont'd) : Production of major products in selected manufacturing industriesJADUAL 2 (SAMB.): PENGELUARAN PRODUK UTAMA DALAM INDUSTRI PEMBUATAN YANG TERPILIH
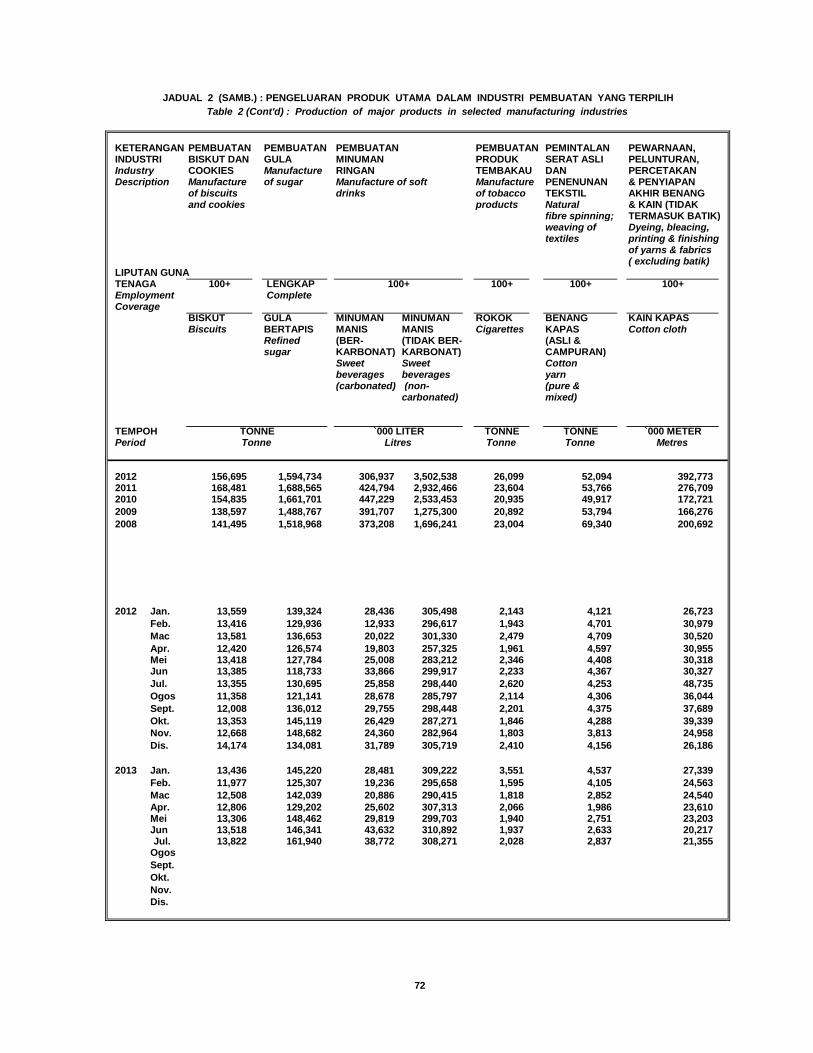
KETERANGAN PEMBUATAN PEMBUATAN PEMBUATAN PEMBUATAN PEMINTALAN PEWARNAAN,INDUSTRI BISKUT DAN GULA MINUMAN PRODUK SERAT ASLI PELUNTURAN,Industry COOKIES Manufacture RINGAN TEMBAKAU DAN PERCETAKANDescription Manufacture of sugar Manufacture of soft Manufacture PENENUNAN & PENYIAPAN
of biscuits drinks of tobacco TEKSTIL AKHIR BENANG and cookies products Natural & KAIN (TIDAK
fibre spinning; TERMASUK BATIK)weaving of Dyeing, bleacing,textiles printing & finishing
of yarns & fabrics( excluding batik)
LIPUTAN GUNATENAGA 100+ LENGKAP 100+ 100+ 100+Employment CompleteCoverage
BISKUT GULA MINUMAN MINUMAN ROKOK BENANG KAIN KAPASBiscuits BERTAPIS MANIS MANIS Cigarettes KAPAS Cotton cloth
Refined (BER- (TIDAK BER- (ASLI &sugar KARBONAT) KARBONAT) CAMPURAN)
Sweet Sweet Cottonbeverages beverages yarn(carbonated) (non- (pure &
carbonated) mixed)
TEMPOH TONNE TONNE `000 METERPeriod Tonne Tonne Metres
2012 156,695 1,594,734 306,937 3,502,538 26,099 52,094 392,7732011 168,481 1,688,565 424,794 2,932,466 23,604 53,766 276,7092010 154,835 1,661,701 447,229 2,533,453 20,935 49,917 172,7212009 138,597 1,488,767 391,707 1,275,300 20,892 53,794 166,2762008 141,495 1,518,968 373,208 1,696,241 23,004 69,340 200,692
2012 Jan. 13,559 139,324 28,436 305,498 2,143 4,121 26,723 Feb. 13,416 129,936 12,933 296,617 1,943 4,701 30,979 Mac 13,581 136,653 20,022 301,330 2,479 4,709 30,520 Apr. 12,420 126,574 19,803 257,325 1,961 4,597 30,955 Mei 13,418 127,784 25,008 283,212 2,346 4,408 30,318 Jun 13,385 118,733 33,866 299,917 2,233 4,367 30,327 Jul. 13,355 130,695 25,858 298,440 2,620 4,253 48,735 Ogos 11,358 121,141 28,678 285,797 2,114 4,306 36,044 Sept. 12,008 136,012 29,755 298,448 2,201 4,375 37,689 Okt. 13,353 145,119 26,429 287,271 1,846 4,288 39,339 Nov. 12,668 148,682 24,360 282,964 1,803 3,813 24,958 Dis. 14,174 134,081 31,789 305,719 2,410 4,156 26,186
2013 Jan. 13,436 145,220 28,481 309,222 3,551 4,537 27,339 Feb. 11,977 125,307 19,236 295,658 1,595 4,105 24,563 Mac 12,508 142,039 20,886 290,415 1,818 2,852 24,540 Apr. 12,806 129,202 25,602 307,313 2,066 1,986 23,610 Mei 13,306 148,462 29,819 299,703 1,940 2,751 23,203 Jun 13,518 146,341 43,632 310,892 1,937 2,633 20,217 Jul. 13,822 161,940 38,772 308,271 2,028 2,837 21,355
Ogos Sept. Okt. Nov. Dis.
72
Tonne LitresTONNE `000 LITER
100+
Table 2 (Cont'd) : Production of major products in selected manufacturing industriesJADUAL 2 (SAMB.) : PENGELUARAN PRODUK UTAMA DALAM INDUSTRI PEMBUATAN YANG TERPILIH
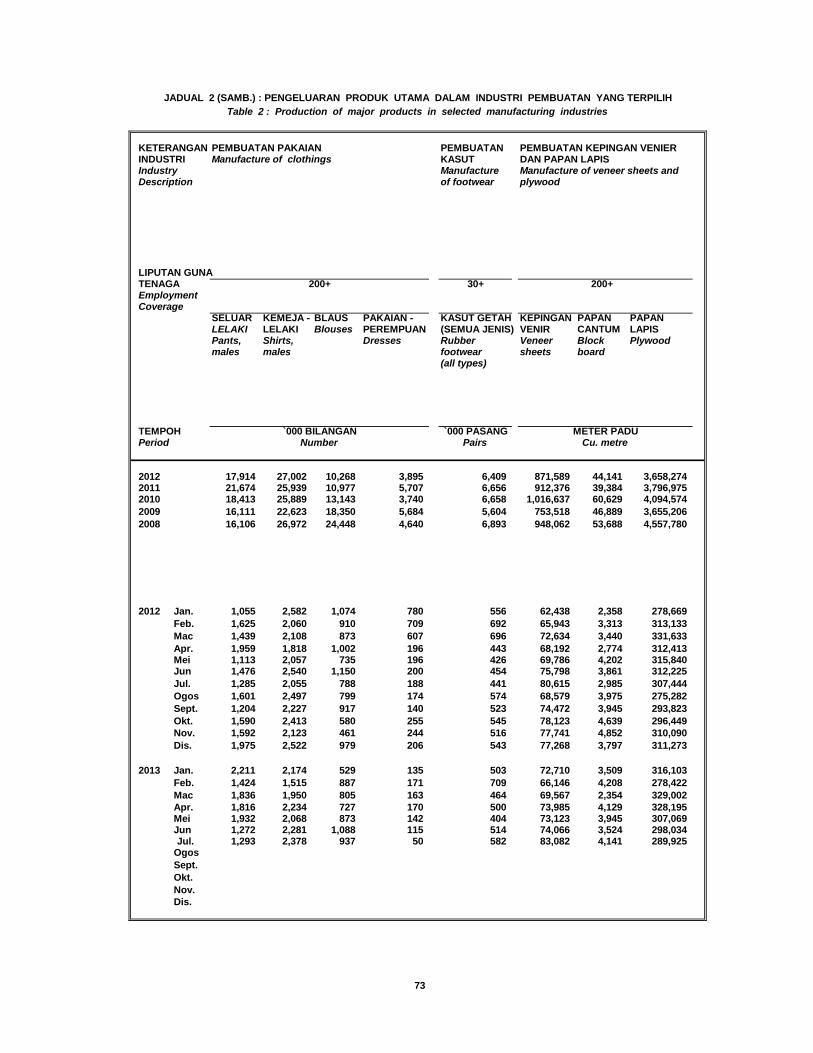
KETERANGAN PEMBUATAN PAKAIAN PEMBUATAN PEMBUATAN KEPINGAN VENIER INDUSTRI Manufacture of clothings KASUT DAN PAPAN LAPISIndustry Manufacture Manufacture of veneer sheets andDescription of footwear plywood
LIPUTAN GUNATENAGA 30+ 200+EmploymentCoverage
SELUAR KEMEJA - BLAUS PAKAIAN - KASUT GETAH KEPINGAN PAPAN PAPANLELAKI LELAKI Blouses PEREMPUAN (SEMUA JENIS) VENIR CANTUM LAPISPants, Shirts, Dresses Rubber Veneer Block Plywoodmales males footwear sheets board
(all types)
TEMPOH `000 PASANGPeriod Pairs
2012 17,914 27,002 10,268 3,895 6,409 871,589 44,141 3,658,2742011 21,674 25,939 10,977 5,707 6,656 912,376 39,384 3,796,9752010 18,413 25,889 13,143 3,740 6,658 1,016,637 60,629 4,094,5742009 16,111 22,623 18,350 5,684 5,604 753,518 46,889 3,655,2062008 16,106 26,972 24,448 4,640 6,893 948,062 53,688 4,557,780
2012 Jan. 1,055 2,582 1,074 780 556 62,438 2,358 278,669 Feb. 1,625 2,060 910 709 692 65,943 3,313 313,133 Mac 1,439 2,108 873 607 696 72,634 3,440 331,633 Apr. 1,959 1,818 1,002 196 443 68,192 2,774 312,413 Mei 1,113 2,057 735 196 426 69,786 4,202 315,840 Jun 1,476 2,540 1,150 200 454 75,798 3,861 312,225 Jul. 1,285 2,055 788 188 441 80,615 2,985 307,444 Ogos 1,601 2,497 799 174 574 68,579 3,975 275,282 Sept. 1,204 2,227 917 140 523 74,472 3,945 293,823 Okt. 1,590 2,413 580 255 545 78,123 4,639 296,449 Nov. 1,592 2,123 461 244 516 77,741 4,852 310,090 Dis. 1,975 2,522 979 206 543 77,268 3,797 311,273
2013 Jan. 2,211 2,174 529 135 503 72,710 3,509 316,103 Feb. 1,424 1,515 887 171 709 66,146 4,208 278,422 Mac 1,836 1,950 805 163 464 69,567 2,354 329,002 Apr. 1,816 2,234 727 170 500 73,985 4,129 328,195 Mei 1,932 2,068 873 142 404 73,123 3,945 307,069 Jun 1,272 2,281 1,088 115 514 74,066 3,524 298,034 Jul. 1,293 2,378 937 50 582 83,082 4,141 289,925
Ogos Sept. Okt. Nov. Dis.
73
Number Cu. metreMETER PADU`000 BILANGAN
200+
Table 2 : Production of major products in selected manufacturing industriesJADUAL 2 (SAMB.) : PENGELUARAN PRODUK UTAMA DALAM INDUSTRI PEMBUATAN YANG TERPILIH
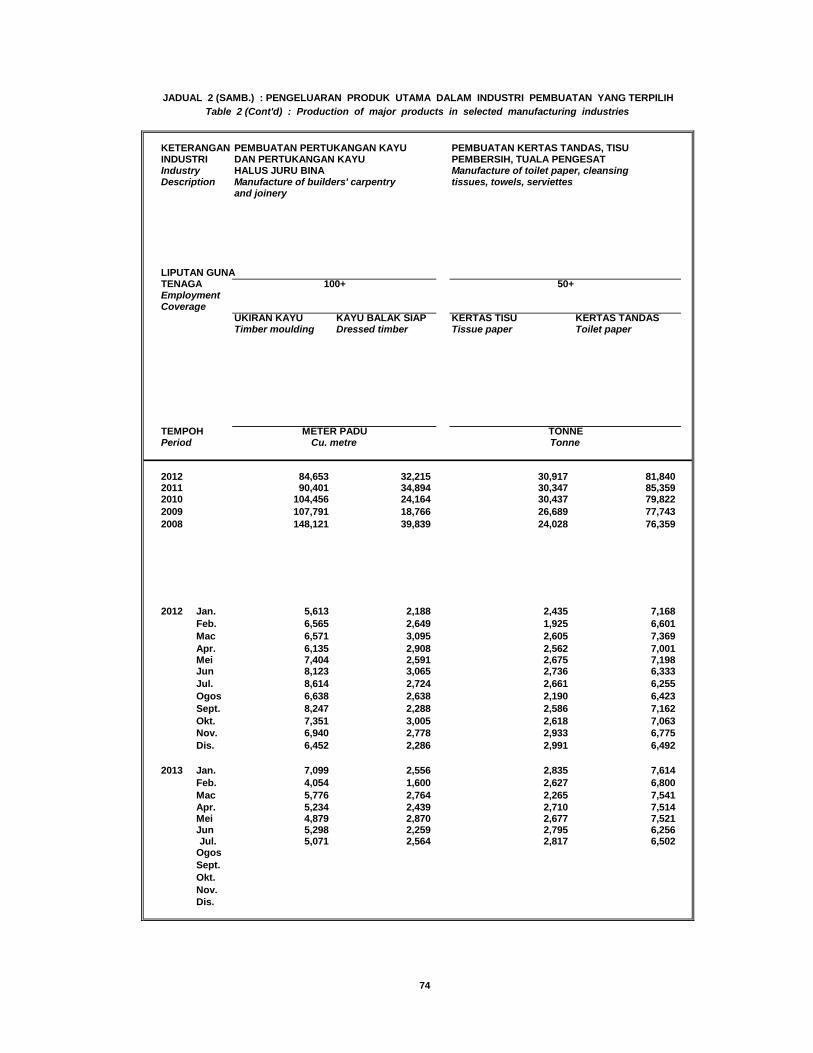
KETERANGAN PEMBUATAN PERTUKANGAN KAYU PEMBUATAN KERTAS TANDAS, TISU INDUSTRI DAN PERTUKANGAN KAYU PEMBERSIH, TUALA PENGESATIndustry HALUS JURU BINA Manufacture of toilet paper, cleansingDescription Manufacture of builders' carpentry tissues, towels, serviettes
and joinery
LIPUTAN GUNATENAGAEmploymentCoverage
UKIRAN KAYU KAYU BALAK SIAP KERTAS TISU KERTAS TANDASTimber moulding Dressed timber Tissue paper Toilet paper
TEMPOHPeriod
2012 84,653 32,215 30,917 81,8402011 90,401 34,894 30,347 85,3592010 104,456 24,164 30,437 79,8222009 107,791 18,766 26,689 77,7432008 148,121 39,839 24,028 76,359
2012 Jan. 5,613 2,188 2,435 7,168 Feb. 6,565 2,649 1,925 6,601 Mac 6,571 3,095 2,605 7,369 Apr. 6,135 2,908 2,562 7,001 Mei 7,404 2,591 2,675 7,198 Jun 8,123 3,065 2,736 6,333 Jul. 8,614 2,724 2,661 6,255 Ogos 6,638 2,638 2,190 6,423 Sept. 8,247 2,288 2,586 7,162 Okt. 7,351 3,005 2,618 7,063 Nov. 6,940 2,778 2,933 6,775 Dis. 6,452 2,286 2,991 6,492
2013 Jan. 7,099 2,556 2,835 7,614 Feb. 4,054 1,600 2,627 6,800 Mac 5,776 2,764 2,265 7,541 Apr. 5,234 2,439 2,710 7,514 Mei 4,879 2,870 2,677 7,521 Jun 5,298 2,259 2,795 6,256 Jul. 5,071 2,564 2,817 6,502
Ogos Sept. Okt. Nov. Dis.
74
TonneCu. metreMETER PADU TONNE
100+ 50+
Table 2 (Cont'd) : Production of major products in selected manufacturing industriesJADUAL 2 (SAMB.) : PENGELUARAN PRODUK UTAMA DALAM INDUSTRI PEMBUATAN YANG TERPILIH
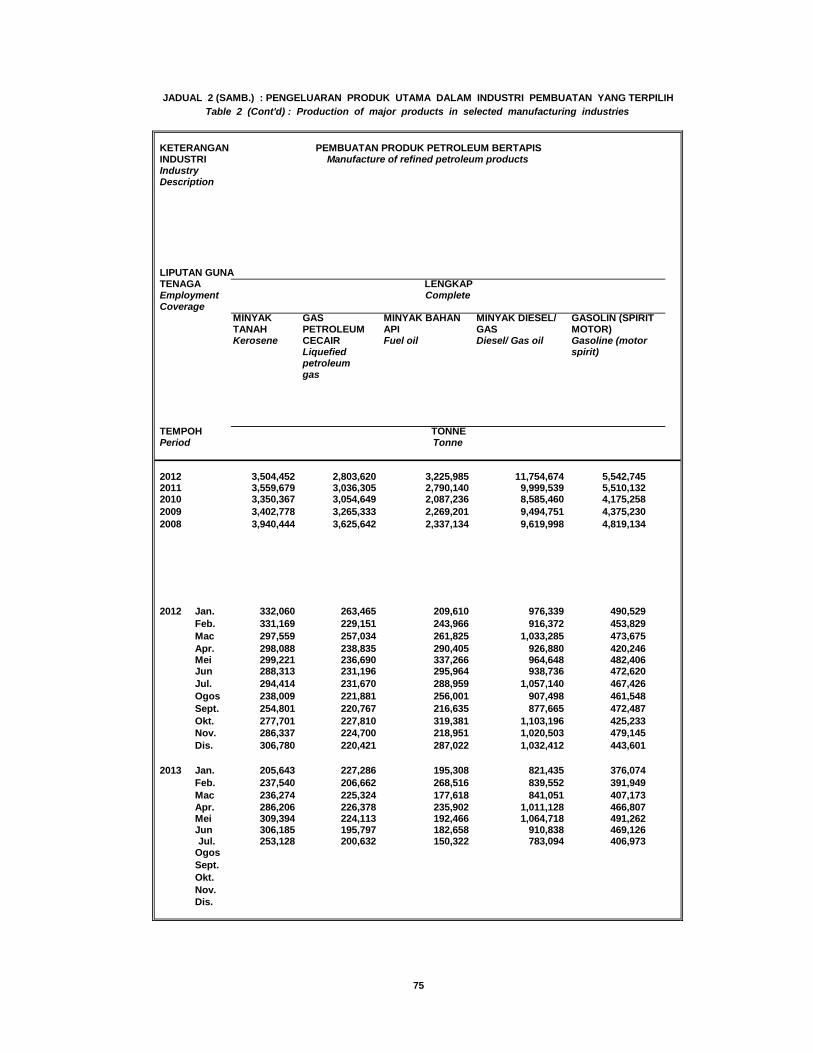
KETERANGAN PEMBUATAN PRODUK PETROLEUM BERTAPISINDUSTRI Manufacture of refined petroleum productsIndustryDescription
LIPUTAN GUNATENAGAEmploymentCoverage
MINYAK GAS MINYAK BAHAN MINYAK DIESEL/ GASOLIN (SPIRITTANAH PETROLEUM API GAS MOTOR)Kerosene CECAIR Fuel oil Diesel/ Gas oil Gasoline (motor
Liquefied spirit)petroleumgas
TEMPOHPeriod
2012 3,504,452 2,803,620 3,225,985 11,754,674 5,542,7452011 3,559,679 3,036,305 2,790,140 9,999,539 5,510,1322010 3,350,367 3,054,649 2,087,236 8,585,460 4,175,2582009 3,402,778 3,265,333 2,269,201 9,494,751 4,375,2302008 3,940,444 3,625,642 2,337,134 9,619,998 4,819,134
2012 Jan. 332,060 263,465 209,610 976,339 490,529 Feb. 331,169 229,151 243,966 916,372 453,829 Mac 297,559 257,034 261,825 1,033,285 473,675 Apr. 298,088 238,835 290,405 926,880 420,246 Mei 299,221 236,690 337,266 964,648 482,406 Jun 288,313 231,196 295,964 938,736 472,620 Jul. 294,414 231,670 288,959 1,057,140 467,426 Ogos 238,009 221,881 256,001 907,498 461,548 Sept. 254,801 220,767 216,635 877,665 472,487 Okt. 277,701 227,810 319,381 1,103,196 425,233 Nov. 286,337 224,700 218,951 1,020,503 479,145 Dis. 306,780 220,421 287,022 1,032,412 443,601
2013 Jan. 205,643 227,286 195,308 821,435 376,074 Feb. 237,540 206,662 268,516 839,552 391,949 Mac 236,274 225,324 177,618 841,051 407,173 Apr. 286,206 226,378 235,902 1,011,128 466,807 Mei 309,394 224,113 192,466 1,064,718 491,262 Jun 306,185 195,797 182,658 910,838 469,126 Jul. 253,128 200,632 150,322 783,094 406,973
Ogos Sept. Okt. Nov. Dis.
75
TonneTONNE
CompleteLENGKAP
Table 2 (Cont'd) : Production of major products in selected manufacturing industriesJADUAL 2 (SAMB.) : PENGELUARAN PRODUK UTAMA DALAM INDUSTRI PEMBUATAN YANG TERPILIH
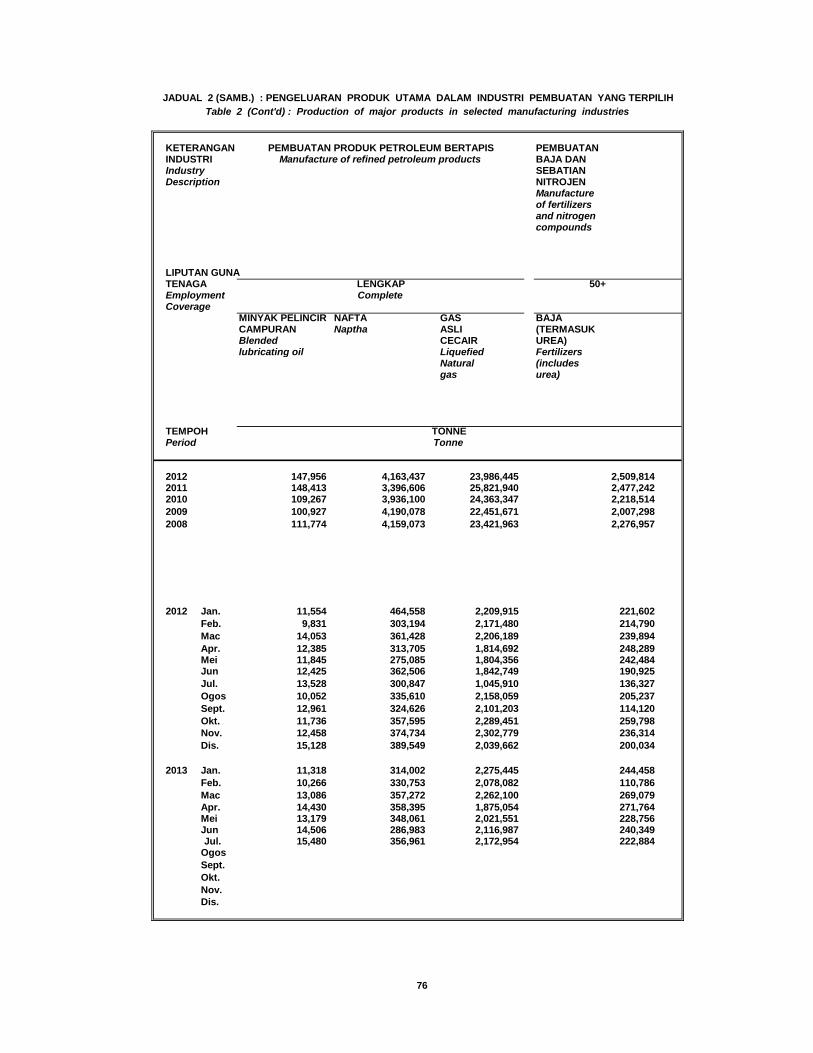
KETERANGAN PEMBUATANINDUSTRI BAJA DANIndustry SEBATIANDescription NITROJEN
Manufactureof fertilizersand nitrogencompounds
LIPUTAN GUNATENAGA 50+EmploymentCoverage
MINYAK PELINCIR NAFTA GAS BAJACAMPURAN Naptha ASLI (TERMASUKBlended CECAIR UREA)lubricating oil Liquefied Fertilizers
Natural (includesgas urea)
TEMPOHPeriod
2012 147,956 4,163,437 23,986,445 2,509,8142011 148,413 3,396,606 25,821,940 2,477,2422010 109,267 3,936,100 24,363,347 2,218,5142009 100,927 4,190,078 22,451,671 2,007,2982008 111,774 4,159,073 23,421,963 2,276,957
2012 Jan. 11,554 464,558 2,209,915 221,602 Feb. 9,831 303,194 2,171,480 214,790 Mac 14,053 361,428 2,206,189 239,894 Apr. 12,385 313,705 1,814,692 248,289 Mei 11,845 275,085 1,804,356 242,484 Jun 12,425 362,506 1,842,749 190,925 Jul. 13,528 300,847 1,045,910 136,327 Ogos 10,052 335,610 2,158,059 205,237 Sept. 12,961 324,626 2,101,203 114,120 Okt. 11,736 357,595 2,289,451 259,798 Nov. 12,458 374,734 2,302,779 236,314 Dis. 15,128 389,549 2,039,662 200,034
2013 Jan. 11,318 314,002 2,275,445 244,458 Feb. 10,266 330,753 2,078,082 110,786 Mac 13,086 357,272 2,262,100 269,079 Apr. 14,430 358,395 1,875,054 271,764 Mei 13,179 348,061 2,021,551 228,756 Jun 14,506 286,983 2,116,987 240,349 Jul. 15,480 356,961 2,172,954 222,884
Ogos Sept. Okt. Nov. Dis.
76
TonneTONNE
CompleteLENGKAP
PEMBUATAN PRODUK PETROLEUM BERTAPISManufacture of refined petroleum products
Table 2 (Cont'd) : Production of major products in selected manufacturing industriesJADUAL 2 (SAMB.) : PENGELUARAN PRODUK UTAMA DALAM INDUSTRI PEMBUATAN YANG TERPILIH
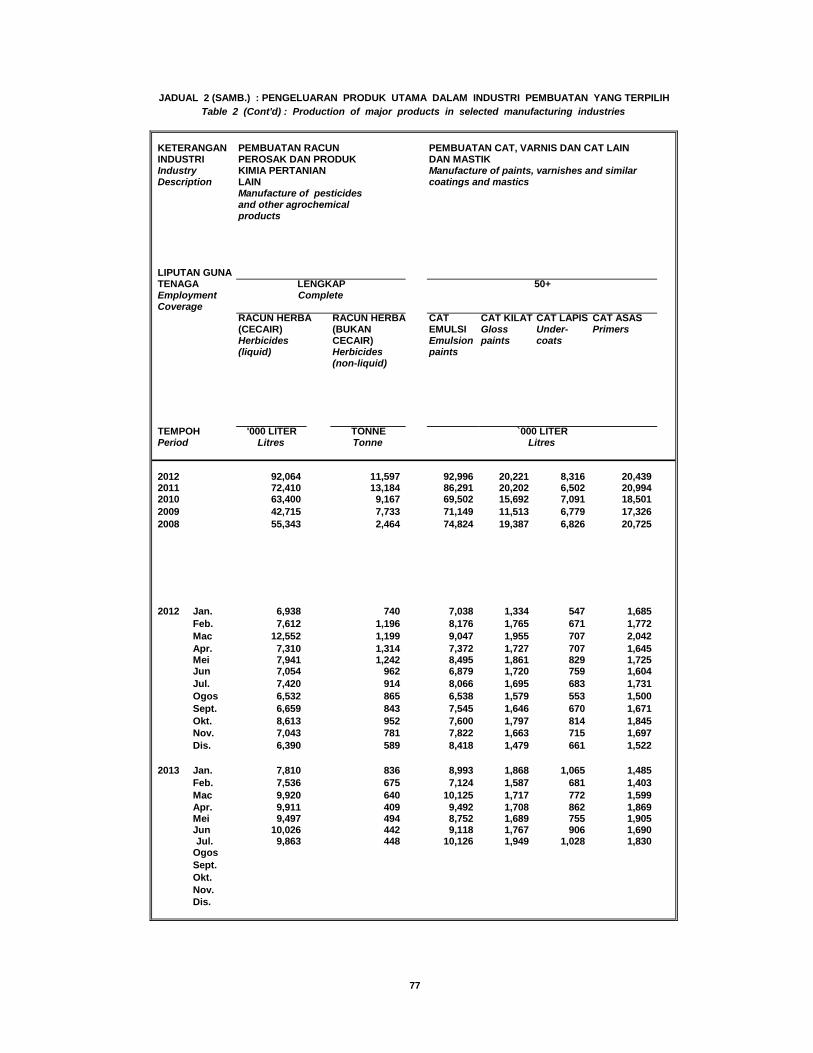
KETERANGAN PEMBUATAN RACUN PEMBUATAN CAT, VARNIS DAN CAT LAIN INDUSTRI PEROSAK DAN PRODUK DAN MASTIKIndustry KIMIA PERTANIAN Manufacture of paints, varnishes and similarDescription LAIN coatings and mastics
Manufacture of pesticidesand other agrochemicalproducts
LIPUTAN GUNATENAGAEmploymentCoverage
RACUN HERBA RACUN HERBA CAT CAT KILAT CAT LAPIS CAT ASAS(CECAIR) (BUKAN EMULSI Gloss Under- PrimersHerbicides CECAIR) Emulsion paints coats(liquid) Herbicides paints
(non-liquid)
TEMPOH '000 LITER TONNEPeriod Litres Tonne
2012 92,064 11,597 92,996 20,221 8,316 20,4392011 72,410 13,184 86,291 20,202 6,502 20,9942010 63,400 9,167 69,502 15,692 7,091 18,5012009 42,715 7,733 71,149 11,513 6,779 17,3262008 55,343 2,464 74,824 19,387 6,826 20,725
2012 Jan. 6,938 740 7,038 1,334 547 1,685 Feb. 7,612 1,196 8,176 1,765 671 1,772 Mac 12,552 1,199 9,047 1,955 707 2,042 Apr. 7,310 1,314 7,372 1,727 707 1,645 Mei 7,941 1,242 8,495 1,861 829 1,725 Jun 7,054 962 6,879 1,720 759 1,604 Jul. 7,420 914 8,066 1,695 683 1,731 Ogos 6,532 865 6,538 1,579 553 1,500 Sept. 6,659 843 7,545 1,646 670 1,671 Okt. 8,613 952 7,600 1,797 814 1,845 Nov. 7,043 781 7,822 1,663 715 1,697 Dis. 6,390 589 8,418 1,479 661 1,522
2013 Jan. 7,810 836 8,993 1,868 1,065 1,485 Feb. 7,536 675 7,124 1,587 681 1,403 Mac 9,920 640 10,125 1,717 772 1,599 Apr. 9,911 409 9,492 1,708 862 1,869 Mei 9,497 494 8,752 1,689 755 1,905 Jun 10,026 442 9,118 1,767 906 1,690 Jul. 9,863 448 10,126 1,949 1,028 1,830
Ogos Sept. Okt. Nov. Dis.
77
Litres`000 LITER
CompleteLENGKAP 50+
Table 2 (Cont'd) : Production of major products in selected manufacturing industriesJADUAL 2 (SAMB.) : PENGELUARAN PRODUK UTAMA DALAM INDUSTRI PEMBUATAN YANG TERPILIH
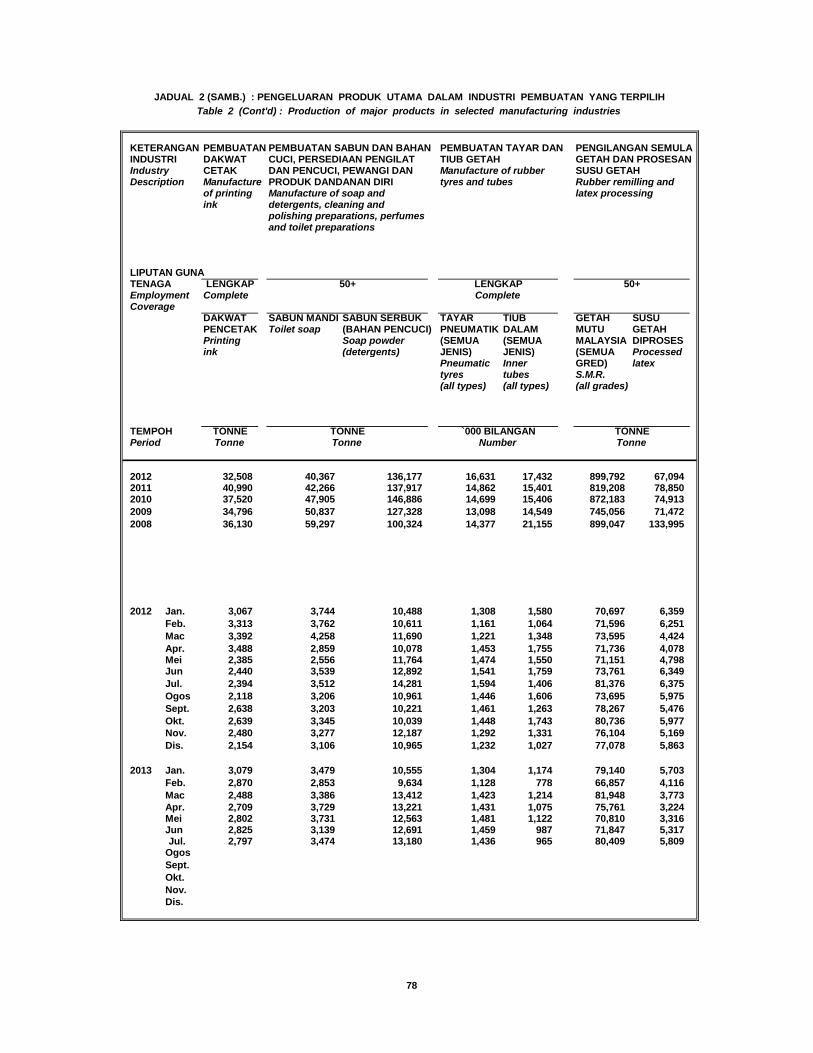
KETERANGAN PEMBUATAN PEMBUATAN SABUN DAN BAHAN PEMBUATAN TAYAR DAN PENGILANGAN SEMULA INDUSTRI DAKWAT CUCI, PERSEDIAAN PENGILAT TIUB GETAH GETAH DAN PROSESANIndustry CETAK DAN PENCUCI, PEWANGI DAN Manufacture of rubber SUSU GETAH Description Manufacture PRODUK DANDANAN DIRI tyres and tubes Rubber remilling and
of printing Manufacture of soap and latex processingink detergents, cleaning and
polishing preparations, perfumesand toilet preparations
LIPUTAN GUNATENAGA LENGKAPEmployment CompleteCoverage
DAKWAT SABUN MANDI SABUN SERBUK TAYAR TIUB GETAH SUSUPENCETAK Toilet soap (BAHAN PENCUCI) PNEUMATIK DALAM MUTU GETAHPrinting Soap powder (SEMUA (SEMUA MALAYSIA DIPROSESink (detergents) JENIS) JENIS) (SEMUA Processed
Pneumatic Inner GRED) latextyres tubes S.M.R.(all types) (all types) (all grades)
TEMPOH TONNEPeriod Tonne
2012 32,508 40,367 136,177 16,631 17,432 899,792 67,0942011 40,990 42,266 137,917 14,862 15,401 819,208 78,8502010 37,520 47,905 146,886 14,699 15,406 872,183 74,9132009 34,796 50,837 127,328 13,098 14,549 745,056 71,4722008 36,130 59,297 100,324 14,377 21,155 899,047 133,995
2012 Jan. 3,067 3,744 10,488 1,308 1,580 70,697 6,359 Feb. 3,313 3,762 10,611 1,161 1,064 71,596 6,251 Mac 3,392 4,258 11,690 1,221 1,348 73,595 4,424 Apr. 3,488 2,859 10,078 1,453 1,755 71,736 4,078 Mei 2,385 2,556 11,764 1,474 1,550 71,151 4,798 Jun 2,440 3,539 12,892 1,541 1,759 73,761 6,349 Jul. 2,394 3,512 14,281 1,594 1,406 81,376 6,375 Ogos 2,118 3,206 10,961 1,446 1,606 73,695 5,975 Sept. 2,638 3,203 10,221 1,461 1,263 78,267 5,476 Okt. 2,639 3,345 10,039 1,448 1,743 80,736 5,977 Nov. 2,480 3,277 12,187 1,292 1,331 76,104 5,169 Dis. 2,154 3,106 10,965 1,232 1,027 77,078 5,863
2013 Jan. 3,079 3,479 10,555 1,304 1,174 79,140 5,703 Feb. 2,870 2,853 9,634 1,128 778 66,857 4,116 Mac 2,488 3,386 13,412 1,423 1,214 81,948 3,773 Apr. 2,709 3,729 13,221 1,431 1,075 75,761 3,224 Mei 2,802 3,731 12,563 1,481 1,122 70,810 3,316 Jun 2,825 3,139 12,691 1,459 987 71,847 5,317 Jul. 2,797 3,474 13,180 1,436 965 80,409 5,809
Ogos Sept. Okt. Nov. Dis.
78
TonneTonne NumberTONNE `000 BILANGAN TONNE
Complete50+ LENGKAP 50+
Table 2 (Cont'd) : Production of major products in selected manufacturing industriesJADUAL 2 (SAMB.) : PENGELUARAN PRODUK UTAMA DALAM INDUSTRI PEMBUATAN YANG TERPILIH
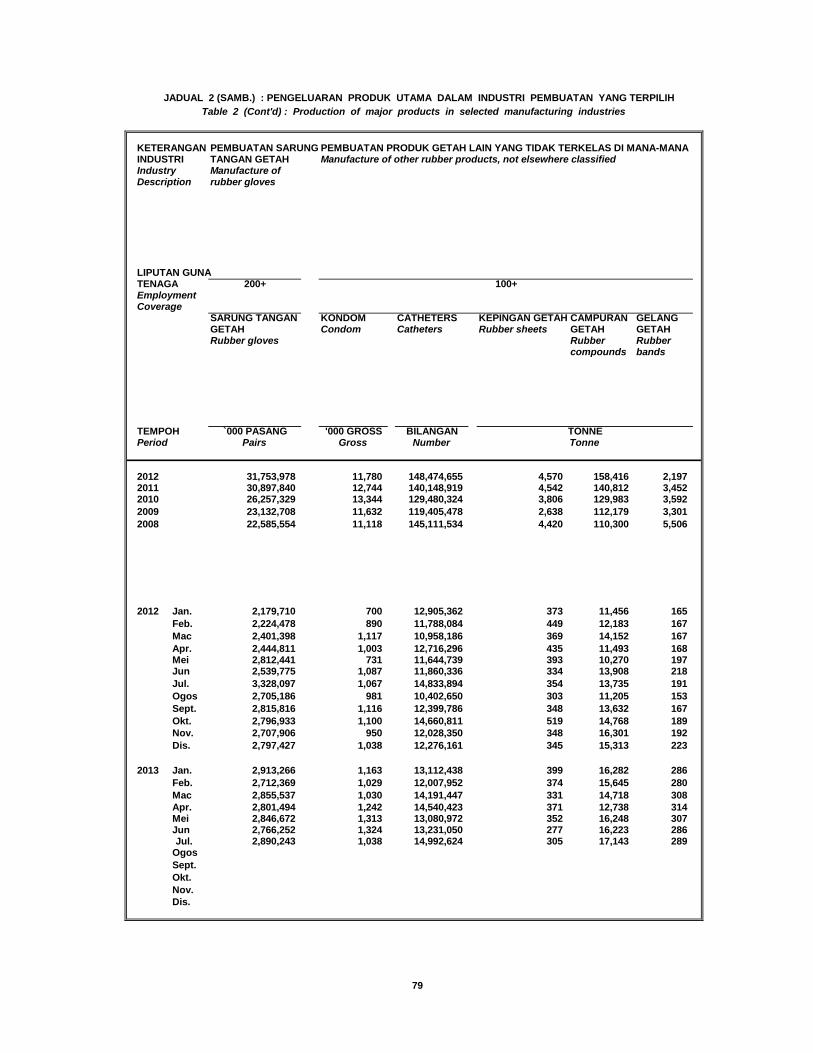
KETERANGAN PEMBUATAN SARUNG PEMBUATAN PRODUK GETAH LAIN YANG TIDAK TERKELAS DI MANA-MANAINDUSTRI TANGAN GETAH Manufacture of other rubber products, not elsewhere classifiedIndustry Manufacture ofDescription rubber gloves
LIPUTAN GUNATENAGA 200+EmploymentCoverage
SARUNG TANGAN KONDOM CATHETERS KEPINGAN GETAH CAMPURAN GELANGGETAH Condom Catheters Rubber sheets GETAH GETAHRubber gloves Rubber Rubber
compounds bands
TEMPOH `000 PASANG '000 GROSS BILANGANPeriod Pairs Gross Number
2012 31,753,978 11,780 148,474,655 4,570 158,416 2,1972011 30,897,840 12,744 140,148,919 4,542 140,812 3,4522010 26,257,329 13,344 129,480,324 3,806 129,983 3,5922009 23,132,708 11,632 119,405,478 2,638 112,179 3,3012008 22,585,554 11,118 145,111,534 4,420 110,300 5,506
2012 Jan. 2,179,710 700 12,905,362 373 11,456 165 Feb. 2,224,478 890 11,788,084 449 12,183 167 Mac 2,401,398 1,117 10,958,186 369 14,152 167 Apr. 2,444,811 1,003 12,716,296 435 11,493 168 Mei 2,812,441 731 11,644,739 393 10,270 197 Jun 2,539,775 1,087 11,860,336 334 13,908 218 Jul. 3,328,097 1,067 14,833,894 354 13,735 191 Ogos 2,705,186 981 10,402,650 303 11,205 153 Sept. 2,815,816 1,116 12,399,786 348 13,632 167 Okt. 2,796,933 1,100 14,660,811 519 14,768 189 Nov. 2,707,906 950 12,028,350 348 16,301 192 Dis. 2,797,427 1,038 12,276,161 345 15,313 223
2013 Jan. 2,913,266 1,163 13,112,438 399 16,282 286 Feb. 2,712,369 1,029 12,007,952 374 15,645 280 Mac 2,855,537 1,030 14,191,447 331 14,718 308 Apr. 2,801,494 1,242 14,540,423 371 12,738 314 Mei 2,846,672 1,313 13,080,972 352 16,248 307 Jun 2,766,252 1,324 13,231,050 277 16,223 286 Jul. 2,890,243 1,038 14,992,624 305 17,143 289
Ogos Sept. Okt. Nov. Dis.
79
TonneTONNE
100+
Table 2 (Cont'd) : Production of major products in selected manufacturing industriesJADUAL 2 (SAMB.) : PENGELUARAN PRODUK UTAMA DALAM INDUSTRI PEMBUATAN YANG TERPILIH
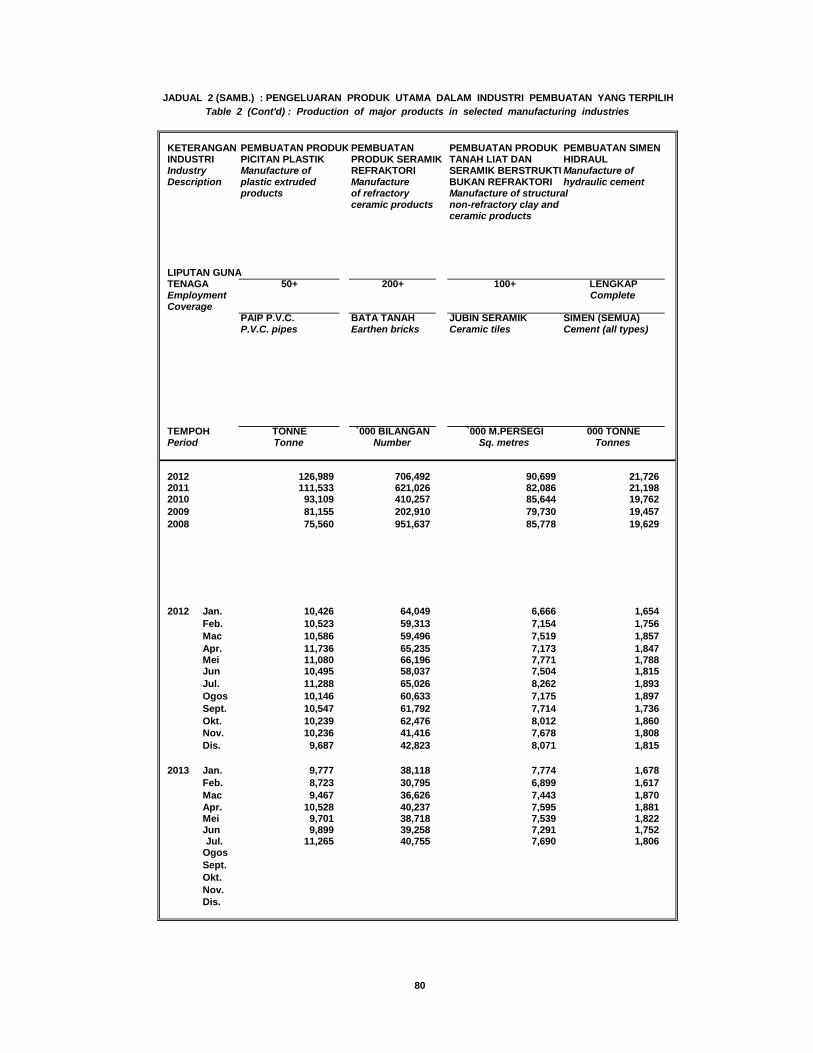
KETERANGAN PEMBUATAN PRODUK PEMBUATAN PEMBUATAN PRODUK PEMBUATAN SIMEN INDUSTRI PICITAN PLASTIK PRODUK SERAMIK TANAH LIAT DAN HIDRAULIndustry Manufacture of REFRAKTORI SERAMIK BERSTRUKTUManufacture of Description plastic extruded Manufacture BUKAN REFRAKTORI hydraulic cement
products of refractory Manufacture of structural ceramic products non-refractory clay and
ceramic products
LIPUTAN GUNATENAGA 50+ 200+ 100+ LENGKAPEmployment CompleteCoverage
PAIP P.V.C. BATA TANAH JUBIN SERAMIK SIMEN (SEMUA)P.V.C. pipes Earthen bricks Ceramic tiles Cement (all types)
TEMPOH TONNE `000 BILANGAN `000 M.PERSEGI 000 TONNEPeriod Tonne Number Sq. metres Tonnes
2012 126,989 706,492 90,699 21,7262011 111,533 621,026 82,086 21,1982010 93,109 410,257 85,644 19,7622009 81,155 202,910 79,730 19,4572008 75,560 951,637 85,778 19,629
2012 Jan. 10,426 64,049 6,666 1,654 Feb. 10,523 59,313 7,154 1,756 Mac 10,586 59,496 7,519 1,857 Apr. 11,736 65,235 7,173 1,847 Mei 11,080 66,196 7,771 1,788 Jun 10,495 58,037 7,504 1,815 Jul. 11,288 65,026 8,262 1,893 Ogos 10,146 60,633 7,175 1,897 Sept. 10,547 61,792 7,714 1,736 Okt. 10,239 62,476 8,012 1,860 Nov. 10,236 41,416 7,678 1,808 Dis. 9,687 42,823 8,071 1,815
2013 Jan. 9,777 38,118 7,774 1,678 Feb. 8,723 30,795 6,899 1,617 Mac 9,467 36,626 7,443 1,870 Apr. 10,528 40,237 7,595 1,881 Mei 9,701 38,718 7,539 1,822 Jun 9,899 39,258 7,291 1,752 Jul. 11,265 40,755 7,690 1,806
Ogos Sept. Okt. Nov. Dis.
80
Table 2 (Cont'd) : Production of major products in selected manufacturing industriesJADUAL 2 (SAMB.) : PENGELUARAN PRODUK UTAMA DALAM INDUSTRI PEMBUATAN YANG TERPILIH
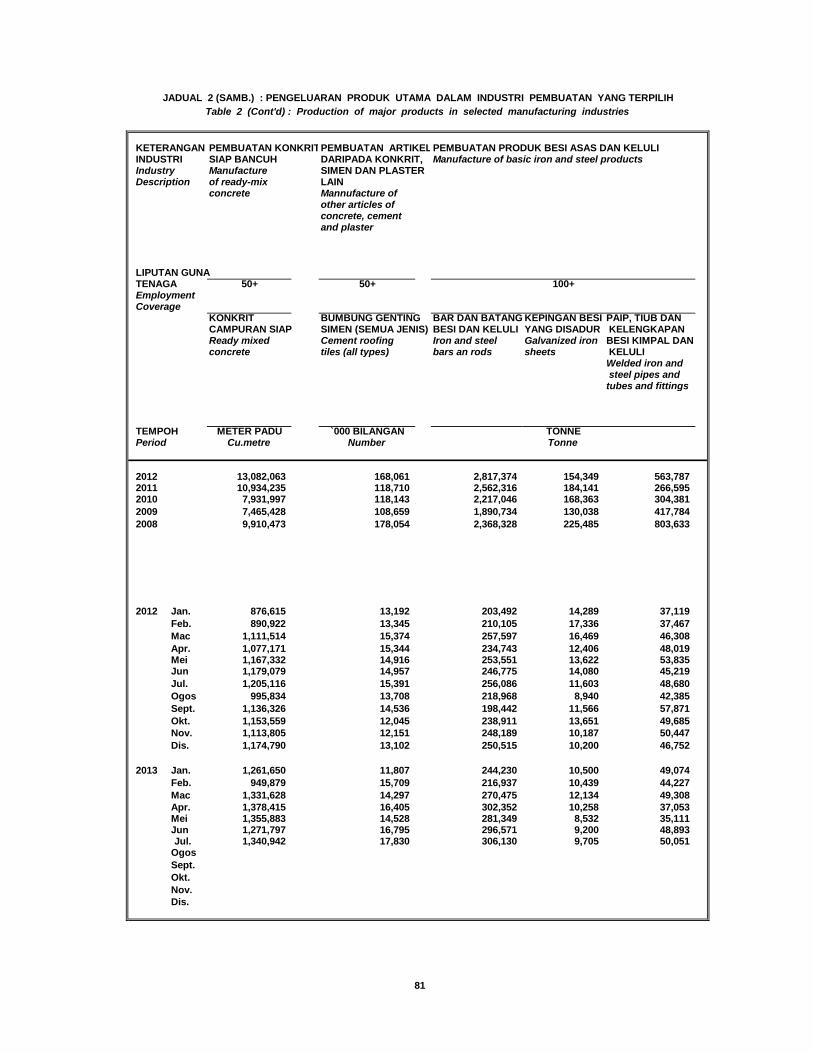
KETERANGAN PEMBUATAN KONKRITPEMBUATAN ARTIKELPEMBUATAN PRODUK BESI ASAS DAN KELULIINDUSTRI SIAP BANCUH DARIPADA KONKRIT, Manufacture of basic iron and steel productsIndustry Manufacture SIMEN DAN PLASTERDescription of ready-mix LAIN
concrete Mannufacture of other articles ofconcrete, cementand plaster
LIPUTAN GUNATENAGA 50+ 50+EmploymentCoverage
KONKRIT BUMBUNG GENTING BAR DAN BATANG KEPINGAN BESI PAIP, TIUB DANCAMPURAN SIAP SIMEN (SEMUA JENIS) BESI DAN KELULI YANG DISADUR KELENGKAPANReady mixed Cement roofing Iron and steel Galvanized iron BESI KIMPAL DANconcrete tiles (all types) bars an rods sheets KELULI
Welded iron and steel pipes andtubes and fittings
TEMPOH METER PADU `000 BILANGANPeriod Cu.metre Number
2012 13,082,063 168,061 2,817,374 154,349 563,7872011 10,934,235 118,710 2,562,316 184,141 266,5952010 7,931,997 118,143 2,217,046 168,363 304,3812009 7,465,428 108,659 1,890,734 130,038 417,7842008 9,910,473 178,054 2,368,328 225,485 803,633
2012 Jan. 876,615 13,192 203,492 14,289 37,119 Feb. 890,922 13,345 210,105 17,336 37,467 Mac 1,111,514 15,374 257,597 16,469 46,308 Apr. 1,077,171 15,344 234,743 12,406 48,019 Mei 1,167,332 14,916 253,551 13,622 53,835 Jun 1,179,079 14,957 246,775 14,080 45,219 Jul. 1,205,116 15,391 256,086 11,603 48,680 Ogos 995,834 13,708 218,968 8,940 42,385 Sept. 1,136,326 14,536 198,442 11,566 57,871 Okt. 1,153,559 12,045 238,911 13,651 49,685 Nov. 1,113,805 12,151 248,189 10,187 50,447 Dis. 1,174,790 13,102 250,515 10,200 46,752
2013 Jan. 1,261,650 11,807 244,230 10,500 49,074 Feb. 949,879 15,709 216,937 10,439 44,227 Mac 1,331,628 14,297 270,475 12,134 49,308 Apr. 1,378,415 16,405 302,352 10,258 37,053 Mei 1,355,883 14,528 281,349 8,532 35,111 Jun 1,271,797 16,795 296,571 9,200 48,893 Jul. 1,340,942 17,830 306,130 9,705 50,051
Ogos Sept. Okt. Nov. Dis.
81
TonneTONNE
100+
Table 2 (Cont'd) : Production of major products in selected manufacturing industriesJADUAL 2 (SAMB.) : PENGELUARAN PRODUK UTAMA DALAM INDUSTRI PEMBUATAN YANG TERPILIH
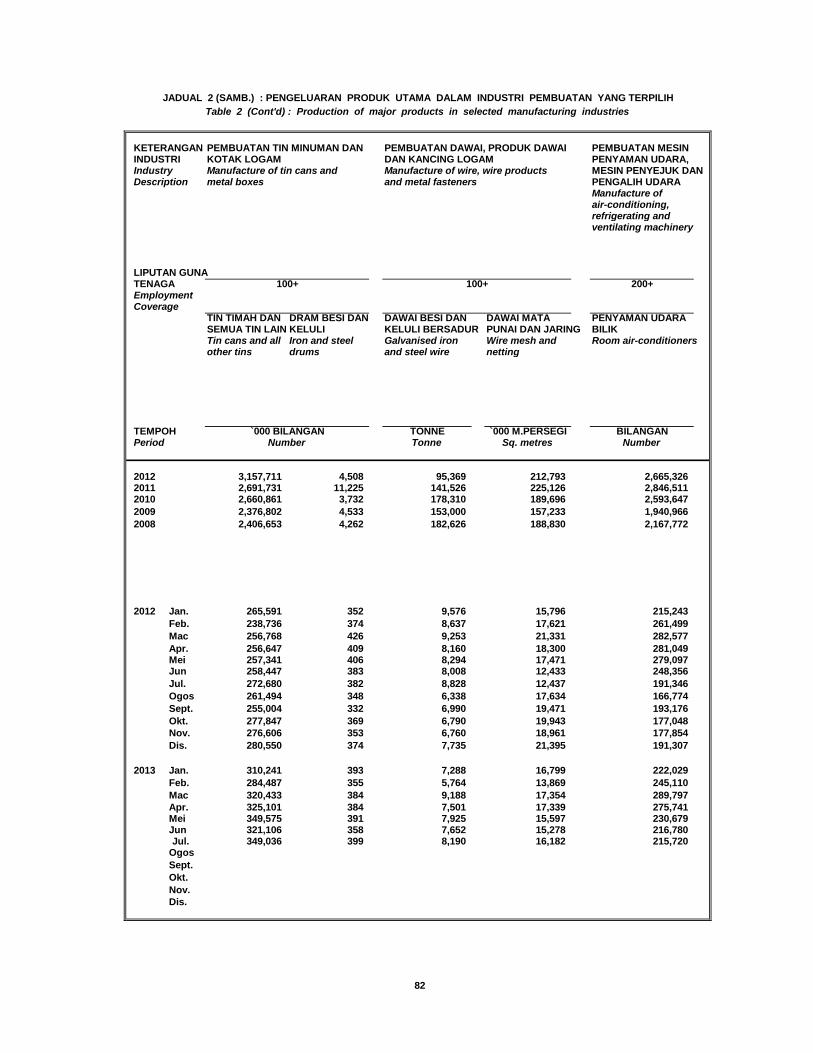
KETERANGAN PEMBUATAN TIN MINUMAN DAN PEMBUATAN DAWAI, PRODUK DAWAI PEMBUATAN MESININDUSTRI KOTAK LOGAM DAN KANCING LOGAM PENYAMAN UDARA,Industry Manufacture of tin cans and Manufacture of wire, wire products MESIN PENYEJUK DAN Description metal boxes and metal fasteners PENGALIH UDARA
Manufacture of air-conditioning,refrigerating and ventilating machinery
LIPUTAN GUNATENAGA 200+EmploymentCoverage
TIN TIMAH DAN DRAM BESI DAN DAWAI BESI DAN DAWAI MATA PENYAMAN UDARASEMUA TIN LAIN KELULI KELULI BERSADUR PUNAI DAN JARING BILIKTin cans and all Iron and steel Galvanised iron Wire mesh and Room air-conditionersother tins drums and steel wire netting
TEMPOH TONNE `000 M.PERSEGI BILANGANPeriod Tonne Sq. metres Number
2012 3,157,711 4,508 95,369 212,793 2,665,3262011 2,691,731 11,225 141,526 225,126 2,846,5112010 2,660,861 3,732 178,310 189,696 2,593,6472009 2,376,802 4,533 153,000 157,233 1,940,9662008 2,406,653 4,262 182,626 188,830 2,167,772
2012 Jan. 265,591 352 9,576 15,796 215,243 Feb. 238,736 374 8,637 17,621 261,499 Mac 256,768 426 9,253 21,331 282,577 Apr. 256,647 409 8,160 18,300 281,049 Mei 257,341 406 8,294 17,471 279,097 Jun 258,447 383 8,008 12,433 248,356 Jul. 272,680 382 8,828 12,437 191,346 Ogos 261,494 348 6,338 17,634 166,774 Sept. 255,004 332 6,990 19,471 193,176 Okt. 277,847 369 6,790 19,943 177,048 Nov. 276,606 353 6,760 18,961 177,854 Dis. 280,550 374 7,735 21,395 191,307
2013 Jan. 310,241 393 7,288 16,799 222,029 Feb. 284,487 355 5,764 13,869 245,110 Mac 320,433 384 9,188 17,354 289,797 Apr. 325,101 384 7,501 17,339 275,741 Mei 349,575 391 7,925 15,597 230,679 Jun 321,106 358 7,652 15,278 216,780 Jul. 349,036 399 8,190 16,182 215,720
Ogos Sept. Okt. Nov. Dis.
82
Number`000 BILANGAN
100+100+
Table 2 (Cont'd) : Production of major products in selected manufacturing industriesJADUAL 2 (SAMB.) : PENGELUARAN PRODUK UTAMA DALAM INDUSTRI PEMBUATAN YANG TERPILIH
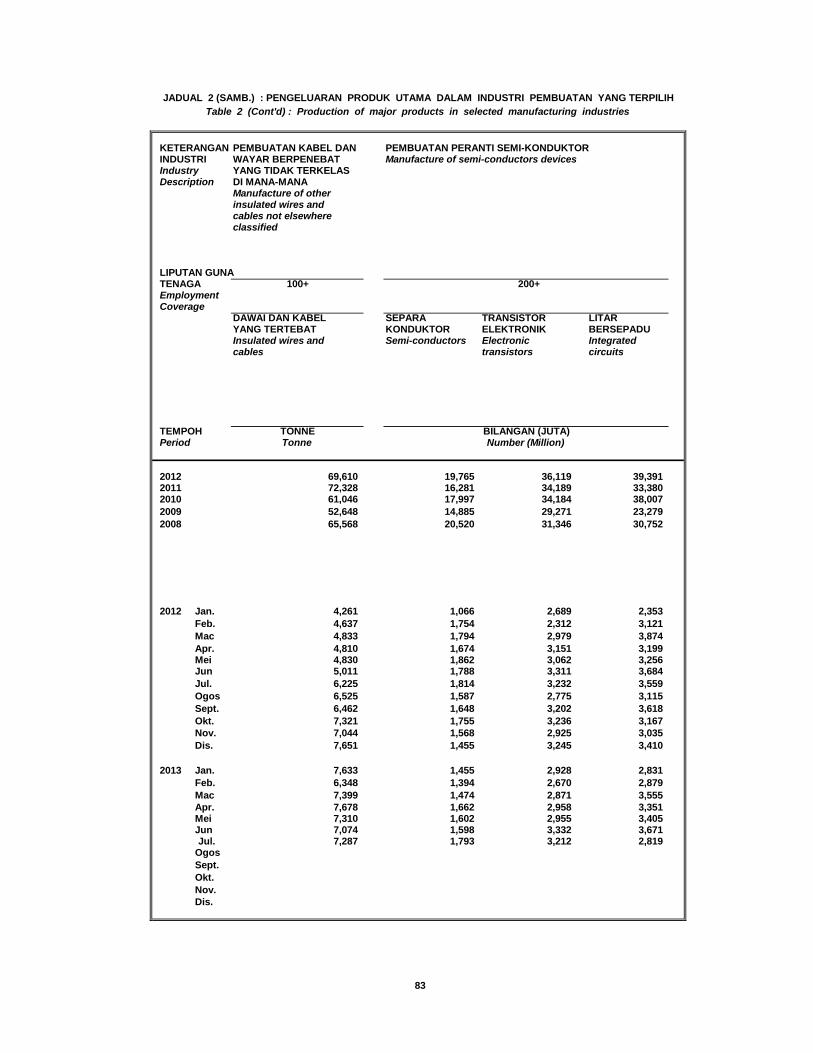
KETERANGAN PEMBUATAN KABEL DAN PEMBUATAN PERANTI SEMI-KONDUKTORINDUSTRI WAYAR BERPENEBAT Manufacture of semi-conductors devicesIndustry YANG TIDAK TERKELASDescription DI MANA-MANA
Manufacture of otherinsulated wires and cables not elsewhereclassified
LIPUTAN GUNATENAGA 100+ 200+EmploymentCoverage
DAWAI DAN KABEL SEPARA TRANSISTOR LITARYANG TERTEBAT KONDUKTOR ELEKTRONIK BERSEPADUInsulated wires and Semi-conductors Electronic Integratedcables transistors circuits
TEMPOH TONNEPeriod Tonne
2012 69,610 19,765 36,119 39,3912011 72,328 16,281 34,189 33,3802010 61,046 17,997 34,184 38,0072009 52,648 14,885 29,271 23,2792008 65,568 20,520 31,346 30,752
2012 Jan. 4,261 1,066 2,689 2,353 Feb. 4,637 1,754 2,312 3,121 Mac 4,833 1,794 2,979 3,874 Apr. 4,810 1,674 3,151 3,199 Mei 4,830 1,862 3,062 3,256 Jun 5,011 1,788 3,311 3,684 Jul. 6,225 1,814 3,232 3,559 Ogos 6,525 1,587 2,775 3,115 Sept. 6,462 1,648 3,202 3,618 Okt. 7,321 1,755 3,236 3,167 Nov. 7,044 1,568 2,925 3,035 Dis. 7,651 1,455 3,245 3,410
2013 Jan. 7,633 1,455 2,928 2,831 Feb. 6,348 1,394 2,670 2,879 Mac 7,399 1,474 2,871 3,555 Apr. 7,678 1,662 2,958 3,351 Mei 7,310 1,602 2,955 3,405 Jun 7,074 1,598 3,332 3,671 Jul. 7,287 1,793 3,212 2,819
Ogos Sept. Okt. Nov. Dis.
83
Number (Million)BILANGAN (JUTA)
JADUAL 2 (SAMB.) : PENGELUARAN PRODUK UTAMA DALAM INDUSTRI PEMBUATAN YANG TERPILIHTable 2 (Cont'd) : Production of major products in selected manufacturing industries
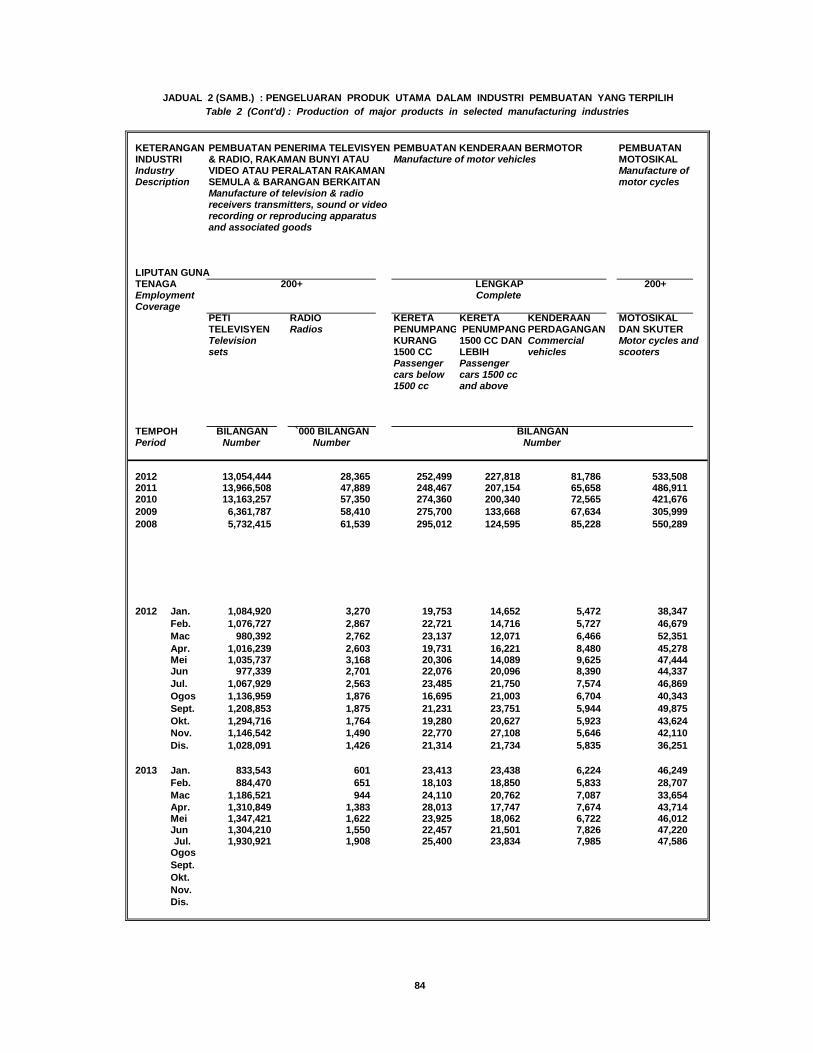
KETERANGAN PEMBUATAN PENERIMA TELEVISYEN PEMBUATAN KENDERAAN BERMOTOR PEMBUATANINDUSTRI & RADIO, RAKAMAN BUNYI ATAU Manufacture of motor vehicles MOTOSIKALIndustry VIDEO ATAU PERALATAN RAKAMAN Manufacture ofDescription SEMULA & BARANGAN BERKAITAN motor cycles
Manufacture of television & radioreceivers transmitters, sound or video recording or reproducing apparatusand associated goods
LIPUTAN GUNATENAGA 200+EmploymentCoverage
PETI RADIO KERETA KERETA KENDERAAN MOTOSIKAL TELEVISYEN Radios PENUMPANG PENUMPANG PERDAGANGAN DAN SKUTERTelevision KURANG 1500 CC DAN Commercial Motor cycles andsets 1500 CC LEBIH vehicles scooters
Passenger Passengercars below cars 1500 cc1500 cc and above
TEMPOH BILANGAN `000 BILANGANPeriod Number Number
2012 13,054,444 28,365 252,499 227,818 81,786 533,5082011 13,966,508 47,889 248,467 207,154 65,658 486,9112010 13,163,257 57,350 274,360 200,340 72,565 421,6762009 6,361,787 58,410 275,700 133,668 67,634 305,9992008 5,732,415 61,539 295,012 124,595 85,228 550,289
2012 Jan. 1,084,920 3,270 19,753 14,652 5,472 38,347 Feb. 1,076,727 2,867 22,721 14,716 5,727 46,679 Mac 980,392 2,762 23,137 12,071 6,466 52,351 Apr. 1,016,239 2,603 19,731 16,221 8,480 45,278 Mei 1,035,737 3,168 20,306 14,089 9,625 47,444 Jun 977,339 2,701 22,076 20,096 8,390 44,337 Jul. 1,067,929 2,563 23,485 21,750 7,574 46,869 Ogos 1,136,959 1,876 16,695 21,003 6,704 40,343 Sept. 1,208,853 1,875 21,231 23,751 5,944 49,875 Okt. 1,294,716 1,764 19,280 20,627 5,923 43,624 Nov. 1,146,542 1,490 22,770 27,108 5,646 42,110 Dis. 1,028,091 1,426 21,314 21,734 5,835 36,251
2013 Jan. 833,543 601 23,413 23,438 6,224 46,249 Feb. 884,470 651 18,103 18,850 5,833 28,707 Mac 1,186,521 944 24,110 20,762 7,087 33,654 Apr. 1,310,849 1,383 28,013 17,747 7,674 43,714 Mei 1,347,421 1,622 23,925 18,062 6,722 46,012 Jun 1,304,210 1,550 22,457 21,501 7,826 47,220 Jul. 1,930,921 1,908 25,400 23,834 7,985 47,586
Ogos Sept. Okt. Nov. Dis.
84
NumberBILANGAN
200+ LENGKAPComplete
JADUAL 2 (SAMB.) : PENGELUARAN PRODUK UTAMA DALAM INDUSTRI PEMBUATAN YANG TERPILIHTable 2 (Cont'd) : Production of major products in selected manufacturing industries
NOTA TEKNIKALTECHNICAL NOTE
85
NOTA TEKNIKAL
1. PENGENALAN
Data yang terdapat dalam penerbitan ini meliputi industri-industri terpilih dalam sektorpembuatan seperti yang dikelaskan di bawah Kategori D dalam klasifikasi Standard PerindustrianMalaysia (MSIC), 2000. Pada keseluruhannya, MSIC adalah selaras dengan ‘InternationalStandard Industrial Classification Of All Economic Activities, Rev. 3, dan telah diubahsuaimengikut keadaan tempatan. Data yang dipungut adalah melalui Penyiasatan PembuatanBulanan.
2. OBJEKTIF
Objektif utama penyiasatan ini ialah untuk memberikan data aliran terkini bagi perangkaanutama di sektor pembuatan, khasnya data nilai jualan, bilangan pekerja bergaji, gaji & upahserta produk utama yang dibuat agar dapat membantu pengguna dalam merangka dasar sertamembuat keputusan.
3. SKOP DAN LIPUTAN
3.1 Data yang dipungut bagi penyiasatan ini meliputi seluruh Malaysia.
3.2 Penyiasatan tersebut meliputi 120 Industri daripada sejumlah 197 Industri. Walaubagaimanapun, hanya data bagi 116 Industri diterbitkan. Data bagi likuor malt danminuman malt (15530), produk plastik diperkukuh fiber tegar (25204) peleburan timah(27201) dan pembuatan mesin pejabat dan perakaunan (30001), tidak diterbitkankerana perlunya memelihara rahsia responden seperti mana yang disyaratkan oleh‘Statistics Act 1965 (Revised-1989)’. Untuk makluman, daripada 120 Industri yangdiliputi, 102 Industri telah digunakan dalam pengiraan Indeks PengeluaranPerindustrian. Sila rujuk kepada penerbitan bertajuk "Indeks Pengeluaran Perindustrian"untuk maklumat lanjut.
3.3 Daripada 116 Industri yang diterbitkan, 20 Industri telah diliputi sepenuhnya (banci)manakala baki 96 Industri, hanya pertubuhan besar yang melebihi saiz bilangan pekerjatertentu diliputi. Sila rujuk kepada Lampiran I untuk keterangan lengkap tentang liputanini. Sebanyak 120 buah industri yang diliputi ini telah menyumbangkan 90.0% nilaitambah banci dan 92.8% nilai output kasar bagi sektor pembuatan pada tahun 2005.
86
4. KONSEP DAN DEFINISI
Konsep dan definisi yang digunakan dalam penerbitan ini adalah seperti yang telah ditakrifkandalam MISC yang selaras dengan ‘International Standard Industrial Classification Of AllEconomic Activities, Rev. 3’.
4.1 PembuatanPembuatan ditakrifkan sebagai "penukaran secara mekanikal atau kimia bagi bahanbukan organik atau organik kepada produk baru sama ada kerja itu dilakukan olehjentera yang digerakkan oleh kuasa atau tangan, sama ada dilakukan di kilang atau dirumah pekerja, dan sama ada produk dijual secara borong atau runcit." Pemasanganbahagian komponen produk dianggap sebagai pembuatan kecuali dalam kes yang manakegiatan itu sesuai dikelaskan di bawah ‘Pembinaan’. Pertubuhan yang kegiatanutamanya ialah kerja pembaikan turut dimasuk dan dikelaskan mengikut jenis produkyang diperbaiki.
4.2 IndustriSebuah ‘industri’ ditakrifkan sebagai satu kumpulan pertubuhan ekonomi yang manasemuanya menjalankan satu jenis kegiatan utama yang sama atau mengeluarkan jenisproduk yang sama. Unit pelapor, iaitu ‘pertubuhan’, diuntukkan kepada industritertentu berdasarkan aktiviti atau produk utamanya. Walau bagaimanapun, mana-manapertubuhan dalam sebarang industri mungkin mengeluarkan produk bagi industri lainsebagai satu kegiatan kecil. Oleh yang demikian, kegiatan bagi mana-mana ‘industri’tidak semestinya terhad hanya kepada jenis kegiatan yang mana industri itu ditakrifkanataupun jenis kegiatannya tidak semestinya terdapat dalam industri tersebut sahaja.Oleh itu, perlulah diambil perhatian bahawa data bagi industri tertentu adalah jumlahdata bagi unit-unit pelapor yang dikelaskan kepada industri tersebut.
4.3 Unit Pelapor - PertubuhanUnit pelapor bagi Penyiasatan Pembuatan Bulanan ialah pertubuhan. Sebuahpertubuhan ditakrif "secara ‘ideal’, sebagai satu unit ekonomi yang bergiat di bawahsatu hak milik atau penguasaan tunggal, iaitu, di bawah satu entiti yang sah. Iamenjalankan satu jenis aktiviti ekonomi atau mempunyai satu jenis aktiviti ekonomiutama di satu tempat/lokasi fizikal, misalnya, sebuah lombong, kilang atau bengkel."Sekiranya sesebuah pertubuhan, dari segi nilai pengeluaran, mempunyai lebih daripadasatu kegiatan penting, maka pertubuhan berkenaan diminta memberikan penyata yangberasingan bagi setiap kegiatannya. Sebaliknya, jika sesebuah pertubuhan itumenjalankan satu kegiatan penting sahaja, maka kegiatan lain yang kurang pentingakan dimasukkan ke dalam kegiatan yang penting itu dan seterusnya pertubuhanberkenaan dikelaskan mengikut industri bagi kegiatan penting tersebut.
87
4.4 Nilai JualanNilai jualan yang dilaporkan merujuk kepada nilai jualan produk sendiri sahaja. Inidimaksudkan kepada jualan produk yang berlaku dalam bulan laporan, sama ada telahdibuat oleh sesebuah pertubuhan pada bulan itu atau bulan-bulan sebelumnya. Nilaijualan hendaklah berdasarkan kepada nilai di kilang dan berkaitan dengan kuantiti yangdijualkan. Penilaian hendaklah berdasarkan kepada harga yang dikenakan kepadapelanggan tolak semua perbelanjaan pengagihan yang dibayar seperti:(a) diskaun atau rebet;(b) bayaran untuk pengangkutan keluar;(c) komisen kepada wakil-wakil penjual; dan(d) bayaran lain seperti cukai eksais yang dibayar atau cukai jualan yang dipungut
oleh kilang bagi pihak kerajaan.
4.5 Bilangan PekerjaData tentang bilangan pekerja meliputi pekerja bergaji sepenuh masa dan pekerjasambilan.(a) Pekerja Sepenuh Masa
Ia ditakrifkan sebagai semua pekerja bergaji yang bekerja sekurang-kurangnya 6jam sehari dan sekurang-kurangnya 20 hari sebulan.
(b) Pekerja SambilanIa ditakrifkan sebagai semua pekerja bergaji yang bekerja kurang dari 6 jamsehari dan/atau kurang dari 20 hari sebulan.
4.6 Gaji & Upah Yang DibayarGaji & upah yang dibayar merujuk kepada pembayaran tunai, termasuk bonus, komisen,bayaran lebih masa, elaun kos sara hidup dan elaun lain yang dibayar kepada semuapekerja bergaji dalam bulan rujukan. Caruman pekerja kepada Kumpulan WangSimpanan Pekerja (KWSP) dan Pertubuhan Keselamatan Sosial (PERKESO) turutdimasukkan, tetapi caruman oleh majikan dikecualikan. Elaun kepada pemilik yangbekerja, rakan niaga yang bekerja dan pekerja keluarga tidak bergaji juga dikecualikan.
5. KEPERLUAN KERAHSIAAN
Penyiasatan ini dijalankan di bawah peruntukan ‘Statistics Act 1965 (Revised- 1989)’. Akta inimensyaratkan bahawa kandungan penyata individu adalah sulit. Selaras dengan peruntukandalam Akta tersebut, hanya angka agregat diterbitkan.
88
6. PINDAANPindaan akan dibuat ke atas angka yang telah diterbitkan berdasarkan kepada data terkini yangdiperoleh.
7. AMSimbol-simbol berikut telah digunakan dalam keseluruhan penerbitan:-t.t.t.l. = tidak terkelas di tempat lainRM = Ringgit Malaysia
8. PENYELARASAN MUSIM
Data siri masa ekonomi Malaysia telah terjejas oleh perayaan-perayaan utama agama sepertiHari Raya Aidilfitri bagi umat Islam, Tahun Baru Cina bagi kaum Cina dan Deepavali bagi kaumIndia. Perayaan utama di negara ini biasanya berkaitan dengan aktiviti agama dan tarikhperayaan tersebut ditentukan oleh kalendar agama masing-masing. Tarikh cuti ini tidak sejajardengan kalendar Gregorian. Oleh itu, tarikh tersebut cenderung untuk bergerak di sepanjangkalendar Gregorian dan memberikan kesan bermusim kepada siri-siri masa ekonomi. Cuti yangtidak tetap ini memberikan impak besar terhadap data siri masa, oleh itu, langkah perlu diambildalam melaksanakan proses pelarasan bermusim bagi mengelakkan kekeliruan dalam pelarasanmusim dan anggaran trend. Tambahan pula, kehadiran kesan percutian tidak tetap bolehmerumitkan penafsiran data.
Pelarasan musim adalah satu proses menghapuskan kesan anggaran variasi bermusim biasadaripada siri asal supaya kesan pengaruh-pengaruh lain pada siri ini mungkin lebih jelas dapatdikenalpasti. Pelarasan musim boleh dilaksanakan dengan pelbagai kaedah dan keputusanmungkin berbeza mengikut prosedur yang diguna pakai. Pendekatan yang digunakan untukpelarasan bermusim di Malaysia adalah Seasonal Adjustment for Malaysia (SEAM). SEAM adalahsatu prosedur untuk membuang kesan cuti bergerak bagi data yang terpilih dalam siri masaekonomi Malaysia dengan memperkenalkan beberapa langkah yang digunakan untuk mengatasihad prosedur pelarasan bermusim yang sedia ada. Untuk menggunakan prosedur SEAM,program X-ARIMA yang boleh didapati dalam Statistical Analysis Software (SAS) telah digunakan.
Data yang digunakan untuk penyelarasan musim merujuk kepada perangkaan pembuatanbulanan Malaysia. Data penyelarasan musim bagi tahun semasa diperolehi denganmembahagikan data asal dengan faktor musim bulan semasa yang dijana untuk tempoh satutahun kehadapan. Data yang diselaraskan ini akan dikemaskini semula apabila siri masa tahunberkenaan lengkap 12 bulan.
89
TECHNICAL NOTES
1. INTRODUCTION
The data contained in this publication cover selected industries in the manufacturing sector asclassified under Category D of the Malaysia Standard Industrial Classification (MSIC), 2000. TheMSIC generally follows the International Standard Industrial Classification Of All EconomicActivities, Rev. 3 with modifications to suit local conditions. The data are collected through theMonthly Manufacturing Survey.
2. OBJECTIVE
The main objective of the survey is to provide data on the latest trends in the principalstatistics of the manufacturing sector, specifically on sales value, number of employees, salaries& wages and the main products manufactured, hence assisting users in policy formulation anddecision making.
3. SCOPE AND COVERAGE
3.1 The data collected in the survey covered the whole of Malaysia.
3.2 The survey covers 120 Industries out of a total of 197 Industries. However, only data for116 Industries are published. Data for the manufacture of malt liquors and malt industry(15530), plastic product rigid fibre reinforced (25204), tin smelting (27201) andmanufacture of office and accounting and machinery (30001), are not published tosafeguard the confidentiality of the respondents as stipulated under the Statistics Act1965 (Revised-1989). For information, of the 120 Industries covered, 102 are used in thecomputation of the Index of Industrial Production. Please refer to the publication entitled"Index of Industrial Production" for further details.
3.3 Of the 116 Industries published, 20 had been fully enumerated (census) while for theremaining 96, only larger establishments with above certain employment cut-offs werecovered. Please refer to Appendix I for details of the coverage. The 120 Industriescovered accounted for 90.0% of the census value added and 92.8% of the value of grossoutput of the manufacturing sector in 2005.
90
4. CONCEPTS AND DEFINITIONS
The concepts and definitions used in this publication are as defined in the MSIC which adhere tothat of the International Standard Industrial Classification Of All Economic Activities, Rev. 3.
4.1 ManufacturingManufacturing is defined as "the mechanical or chemical transformation of inorganic ororganic substances into new products whether the work is performed by power drivenmachines or by hand, whether it is done by the factory or in the worker's home, andwhether the products are sold at wholesale or retail”. Assembly of the component partsof manufactured products is considered as manufacturing except in cases where theactivity is appropriately classified under ‘Construction’. Establishments primarilyengaged in repair work are included and classified according to the type of productrepaired.
4.2 IndustryAn ‘industry’ is defined as a group of economic establishments all of which are primarilyengaged in the same kind of activity or in producing the same kind of product. Thereporting unit, that is, the ‘establishment’, is assigned to a certain industry according toits principal activities or products. Any establishment in any industry, however, mayproduce, as a minor activity, commodities assigned to another industry. As a result, theactivities of any ‘industry’ are not necessarily always confined entirely to the types ofactivity by which the industry is named, nor are these types of activity necessarily onlyfound in that industry. As such, it should be noted that data of a specific industry are thesum totals of data of the reporting units classified to that industry.
4.3 The Reporting Unit - The EstablishmentThe reporting unit for the Monthly Manufacturing Survey is the establishment. Anestablishment is defined "ideally, as an economic unit which engages, under a singleownership or control, that is, under a single legal entity, in one, or predominantly one,kind of economic activity at a single location, for example, a mine, factory or workshop."If the establishment has more than one significant activity, in terms of production value,then the establishment is requested to give separate returns for each activity. However,in the case of an establishment which engages in only one significant activity, then theless significant activity is subsumed under this activity and the establishment isclassified to the industry of the significant activity.
4.4 Sales ValueThe sales value reported refers to the value of sales of own manufactured goods only.This relates to sales of goods made during the reporting month whether produced by the
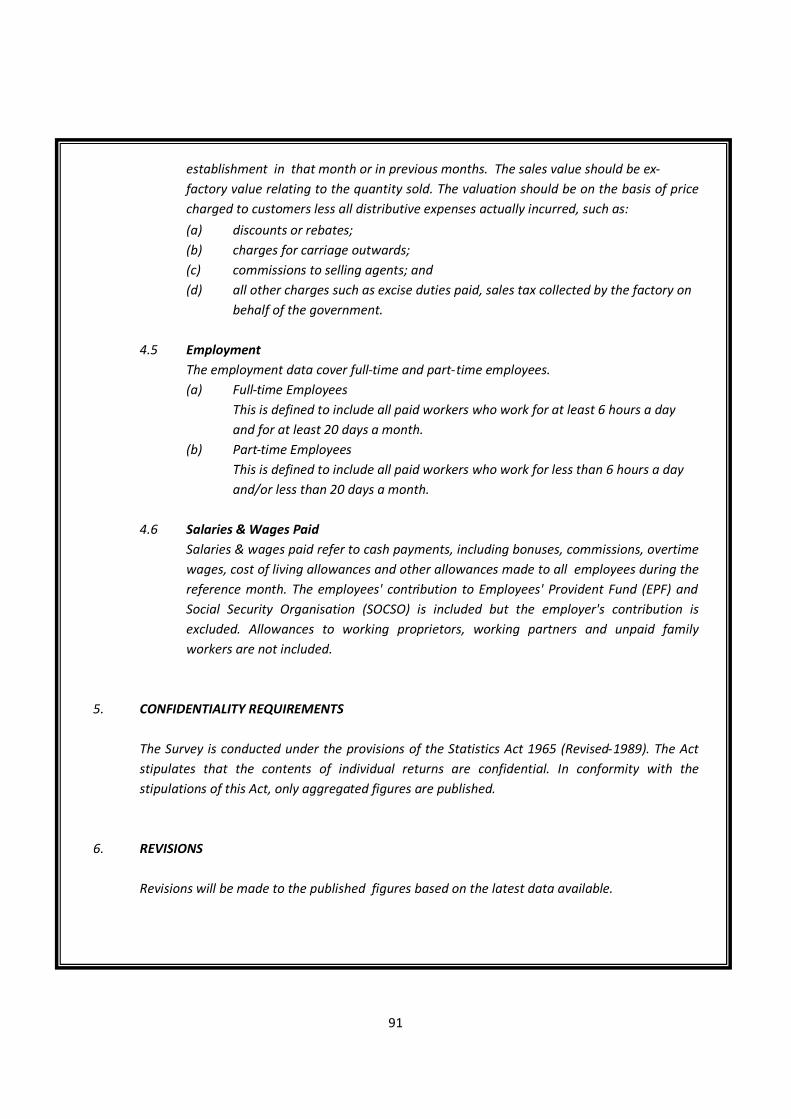
91
establishment in that month or in previous months. The sales value should be ex-factory value relating to the quantity sold. The valuation should be on the basis of pricecharged to customers less all distributive expenses actually incurred, such as:(a) discounts or rebates;(b) charges for carriage outwards;(c) commissions to selling agents; and(d) all other charges such as excise duties paid, sales tax collected by the factory on
behalf of the government.
4.5 EmploymentThe employment data cover full-time and part-time employees.(a) Full-time Employees
This is defined to include all paid workers who work for at least 6 hours a dayand for at least 20 days a month.
(b) Part-time EmployeesThis is defined to include all paid workers who work for less than 6 hours a dayand/or less than 20 days a month.
4.6 Salaries & Wages PaidSalaries & wages paid refer to cash payments, including bonuses, commissions, overtimewages, cost of living allowances and other allowances made to all employees during thereference month. The employees' contribution to Employees' Provident Fund (EPF) andSocial Security Organisation (SOCSO) is included but the employer's contribution isexcluded. Allowances to working proprietors, working partners and unpaid familyworkers are not included.
5. CONFIDENTIALITY REQUIREMENTS
The Survey is conducted under the provisions of the Statistics Act 1965 (Revised-1989). The Actstipulates that the contents of individual returns are confidential. In conformity with thestipulations of this Act, only aggregated figures are published.
6. REVISIONS
Revisions will be made to the published figures based on the latest data available.
92
7. GENERAL
The following symbols have been used throughout the publication:-n.e.c. = not elsewhere classifiedRM = Malaysian Ringgit
8. SEASONAL ADJUSTMENT
Malaysian economic time series data are affected by major religious festivals such as the Eid-ulFitr of the Muslims, the Chinese New Year of the Chinese and the Deepavali of the Indian. Themajor festivals in this country are usually related to the religious activities and such as, the datesare determined by the respective religious calendar. The dates of these holidays are not in linewith the Gregorian calendar. Hence, they tend to move along the Gregorian calendar and strongseasonal influence on many economic time series. Since these non-fixed holidays have largeimpacts on the times series data, they need to be taken into account when performing seasonaladjustment process so as to avoid confusion in seasonally adjusted data and trend estimates.Furthermore, the presence of non-fixed holidays effects may complicate the interpretation of thedata.
Seasonal adjustment is a process of removing the estimated effects of normal seasonal variationfrom the original series so that the effects of other influences on the series may be more clearlyrecognized. Seasonal adjustment can be derived by various methods and the results may varyaccording to the procedure adopted. The approach used for seasonal adjustment is the SeasonalAdjustment for Malaysia (SEAM). SEAM is a procedure to remove moving holiday effect on theselected Malaysian economic time series data by introducing steps that can be used to overcomethe limitations of the existing seasonal adjustment procedure. To apply the SEAM procedure, theX-ARIMA program which is available in Statistical Analysis Software (SAS) is used.
Data used for seasonal adjustment refers to Malaysia’s monthly manufacturing statistics.Seasonal adjusted data for the current year are obtained by dividing original data with theseasonal factor of the current month generated for the period of one year ahead. These seasonaladjusted data will be revised when the completed 12 months data of the time series for theparticular year are obtained.
LAMPIRAN 1APPENDIX 1
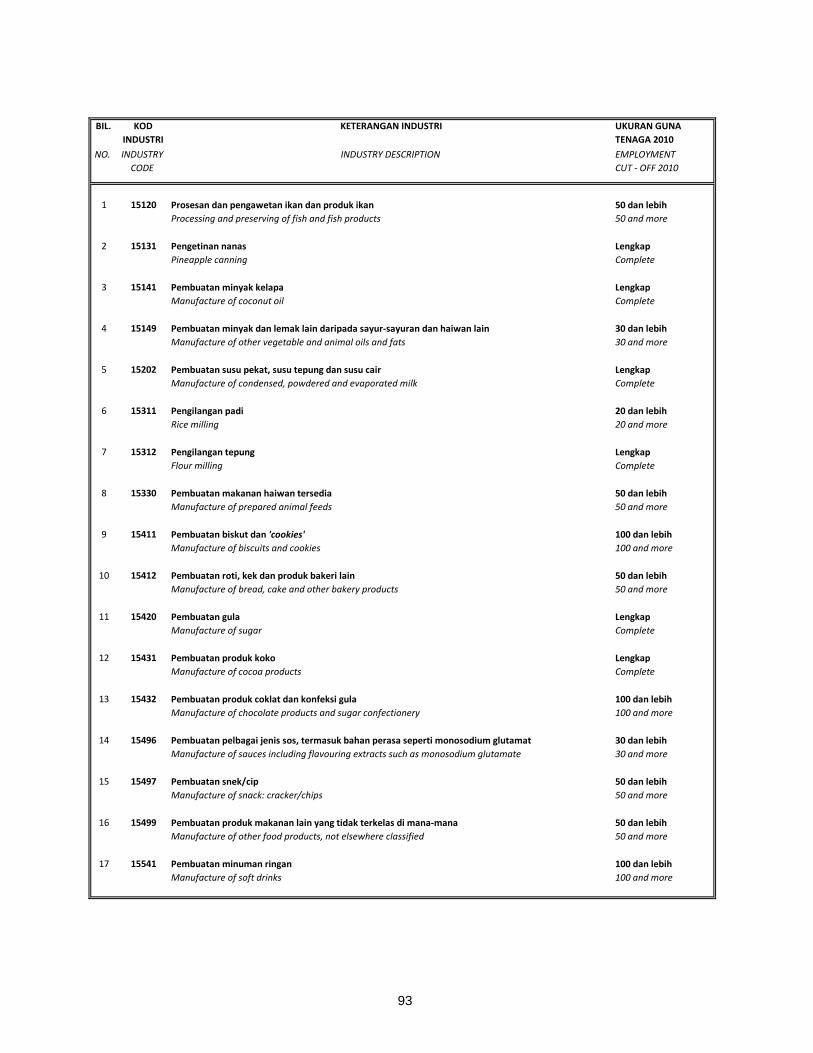
93
BIL. KOD INDUSTRI
KETERANGAN INDUSTRI UKURAN GUNA TENAGA 2010
NO. INDUSTRY CODE
INDUSTRY DESCRIPTION EMPLOYMENT CUT - OFF 2010
1 15120 Prosesan dan pengawetan ikan dan produk ikanProcessing and preserving of fish and fish products
50 dan lebih50 and more
2 15131 Pengetinan nanasPineapple canning
LengkapComplete
3 15141 Pembuatan minyak kelapaManufacture of coconut oil
LengkapComplete
4 15149 Pembuatan minyak dan lemak lain daripada sayur-sayuran dan haiwan lainManufacture of other vegetable and animal oils and fats
30 dan lebih30 and more
5 15202 Pembuatan susu pekat, susu tepung dan susu cairManufacture of condensed, powdered and evaporated milk
LengkapComplete
6 15311 Pengilangan padiRice milling
20 dan lebih20 and more
7 15312 Pengilangan tepungFlour milling
LengkapComplete
8 15330 Pembuatan makanan haiwan tersediaManufacture of prepared animal feeds
50 dan lebih50 and more
9 15411 Pembuatan biskut dan 'cookies'Manufacture of biscuits and cookies
100 dan lebih100 and more
10 15412 Pembuatan roti, kek dan produk bakeri lainManufacture of bread, cake and other bakery products
50 dan lebih50 and more
11 15420 Pembuatan gulaManufacture of sugar
LengkapComplete
12 15431 Pembuatan produk kokoManufacture of cocoa products
LengkapComplete
13 15432 Pembuatan produk coklat dan konfeksi gulaManufacture of chocolate products and sugar confectionery
100 dan lebih100 and more
14 15496 Pembuatan pelbagai jenis sos, termasuk bahan perasa seperti monosodium glutamatManufacture of sauces including flavouring extracts such as monosodium glutamate
30 dan lebih30 and more
15 15497 Pembuatan snek/cipManufacture of snack: cracker/chips
50 dan lebih50 and more
16 15499 Pembuatan produk makanan lain yang tidak terkelas di mana-manaManufacture of other food products, not elsewhere classified
50 dan lebih50 and more
17 15541 Pembuatan minuman ringanManufacture of soft drinks
100 dan lebih100 and more
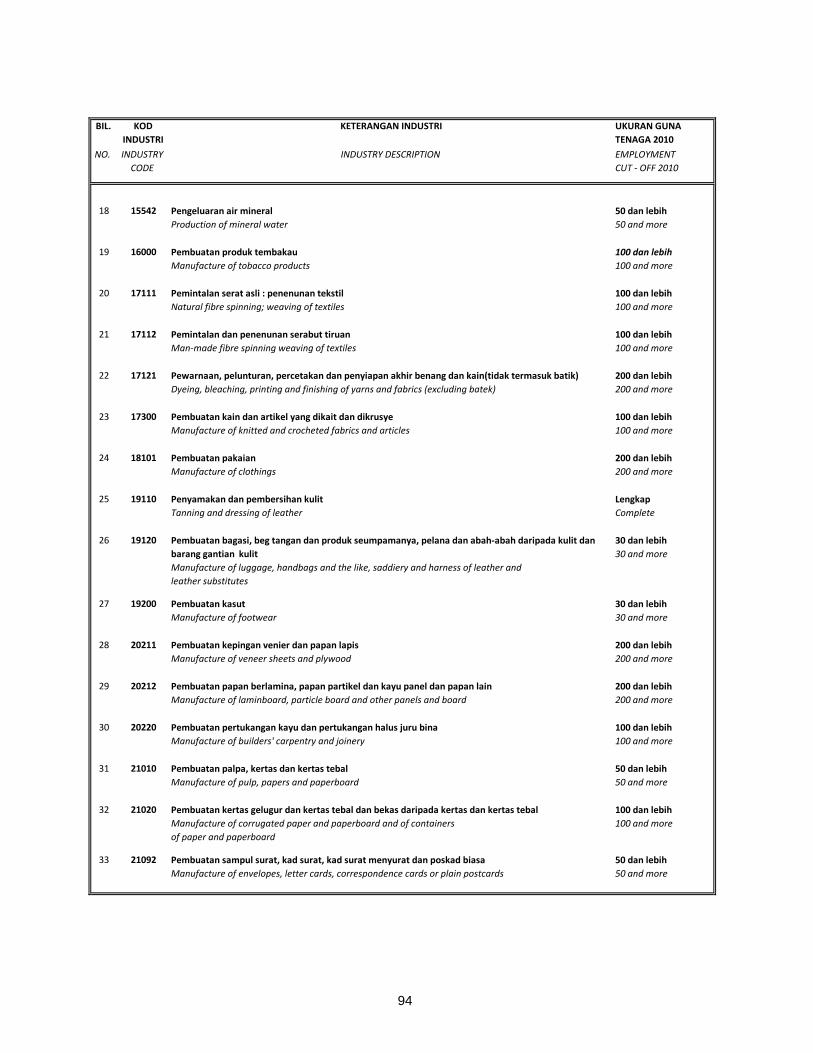
94
BIL. KOD INDUSTRI
KETERANGAN INDUSTRI UKURAN GUNA TENAGA 2010
NO. INDUSTRY CODE
INDUSTRY DESCRIPTION EMPLOYMENT CUT - OFF 2010
18 15542 Pengeluaran air mineralProduction of mineral water
50 dan lebih50 and more
19 16000 Pembuatan produk tembakauManufacture of tobacco products
100 dan lebih100 and more
20 17111 Pemintalan serat asli : penenunan tekstilNatural fibre spinning; weaving of textiles
100 dan lebih100 and more
21 17112 Pemintalan dan penenunan serabut tiruanMan-made fibre spinning weaving of textiles
100 dan lebih100 and more
22 17121 Pewarnaan, pelunturan, percetakan dan penyiapan akhir benang dan kain(tidak termasuk batik)Dyeing, bleaching, printing and finishing of yarns and fabrics (excluding batek)
200 dan lebih200 and more
23 17300 Pembuatan kain dan artikel yang dikait dan dikrusyeManufacture of knitted and crocheted fabrics and articles
100 dan lebih100 and more
24 18101 Pembuatan pakaianManufacture of clothings
200 dan lebih200 and more
25 19110 Penyamakan dan pembersihan kulitTanning and dressing of leather
LengkapComplete
26 19120 Pembuatan bagasi, beg tangan dan produk seumpamanya, pelana dan abah-abah daripada kulit dan barang gantian kulitManufacture of luggage, handbags and the like, saddiery and harness of leather andleather substitutes
30 dan lebih30 and more
27 19200 Pembuatan kasutManufacture of footwear
30 dan lebih30 and more
28 20211 Pembuatan kepingan venier dan papan lapisManufacture of veneer sheets and plywood
200 dan lebih200 and more
29 20212 Pembuatan papan berlamina, papan partikel dan kayu panel dan papan lainManufacture of laminboard, particle board and other panels and board
200 dan lebih200 and more
30 20220 Pembuatan pertukangan kayu dan pertukangan halus juru binaManufacture of builders' carpentry and joinery
100 dan lebih100 and more
31 21010 Pembuatan palpa, kertas dan kertas tebalManufacture of pulp, papers and paperboard
50 dan lebih50 and more
32 21020 Pembuatan kertas gelugur dan kertas tebal dan bekas daripada kertas dan kertas tebalManufacture of corrugated paper and paperboard and of containersof paper and paperboard
100 dan lebih100 and more
33 21092 Pembuatan sampul surat, kad surat, kad surat menyurat dan poskad biasaManufacture of envelopes, letter cards, correspondence cards or plain postcards
50 dan lebih50 and more
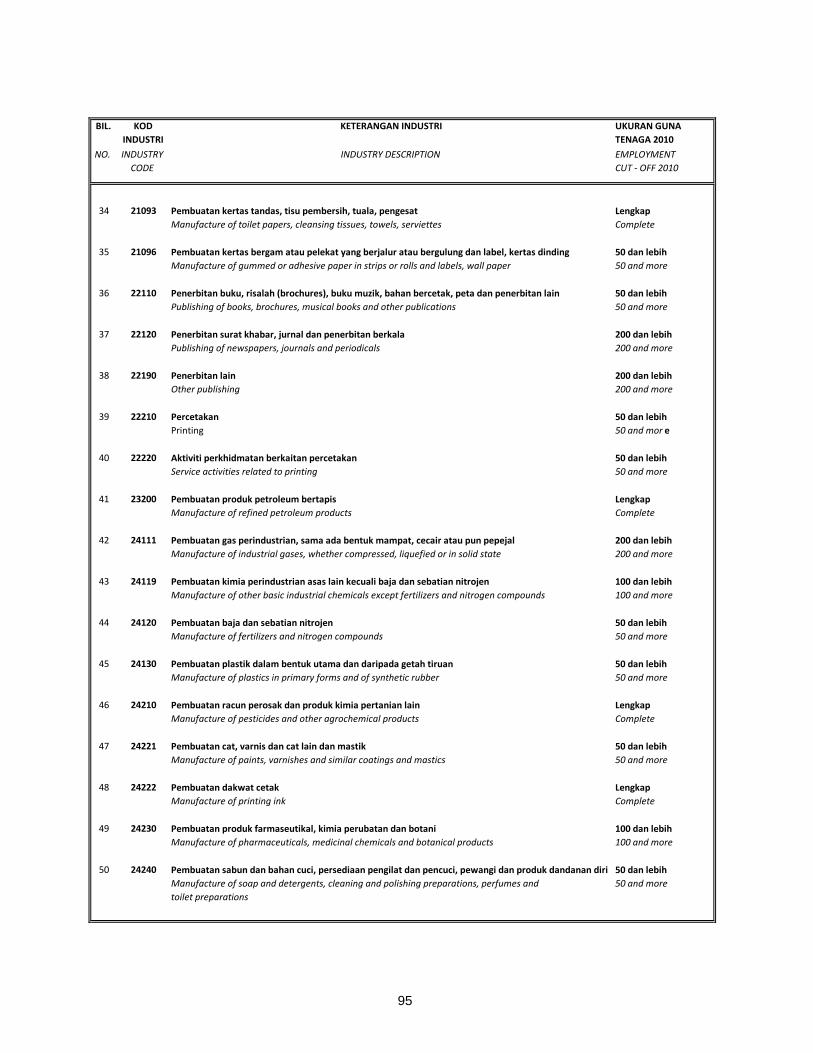
95
BIL. KOD INDUSTRI
KETERANGAN INDUSTRI UKURAN GUNA TENAGA 2010
NO. INDUSTRY CODE
INDUSTRY DESCRIPTION EMPLOYMENT CUT - OFF 2010
34 21093 Pembuatan kertas tandas, tisu pembersih, tuala, pengesatManufacture of toilet papers, cleansing tissues, towels, serviettes
LengkapComplete
35 21096 Pembuatan kertas bergam atau pelekat yang berjalur atau bergulung dan label, kertas dindingManufacture of gummed or adhesive paper in strips or rolls and labels, wall paper
50 dan lebih50 and more
36 22110 Penerbitan buku, risalah (brochures), buku muzik, bahan bercetak, peta dan penerbitan lainPublishing of books, brochures, musical books and other publications
50 dan lebih50 and more
37 22120 Penerbitan surat khabar, jurnal dan penerbitan berkalaPublishing of newspapers, journals and periodicals
200 dan lebih200 and more
38 22190 Penerbitan lainOther publishing
200 dan lebih200 and more
39 22210 PercetakanPrinting
50 dan lebih50 and mor e
40 22220 Aktiviti perkhidmatan berkaitan percetakanService activities related to printing
50 dan lebih50 and more
41 23200 Pembuatan produk petroleum bertapisManufacture of refined petroleum products
LengkapComplete
42 24111 Pembuatan gas perindustrian, sama ada bentuk mampat, cecair atau pun pepejalManufacture of industrial gases, whether compressed, liquefied or in solid state
200 dan lebih200 and more
43 24119 Pembuatan kimia perindustrian asas lain kecuali baja dan sebatian nitrojenManufacture of other basic industrial chemicals except fertilizers and nitrogen compounds
100 dan lebih100 and more
44 24120 Pembuatan baja dan sebatian nitrojenManufacture of fertilizers and nitrogen compounds
50 dan lebih50 and more
45 24130 Pembuatan plastik dalam bentuk utama dan daripada getah tiruanManufacture of plastics in primary forms and of synthetic rubber
50 dan lebih50 and more
46 24210 Pembuatan racun perosak dan produk kimia pertanian lainManufacture of pesticides and other agrochemical products
LengkapComplete
47 24221 Pembuatan cat, varnis dan cat lain dan mastikManufacture of paints, varnishes and similar coatings and mastics
50 dan lebih50 and more
48 24222 Pembuatan dakwat cetakManufacture of printing ink
LengkapComplete
49 24230 Pembuatan produk farmaseutikal, kimia perubatan dan botaniManufacture of pharmaceuticals, medicinal chemicals and botanical products
100 dan lebih100 and more
50 24240 Pembuatan sabun dan bahan cuci, persediaan pengilat dan pencuci, pewangi dan produk dandanan diriManufacture of soap and detergents, cleaning and polishing preparations, perfumes andtoilet preparations
50 dan lebih50 and more
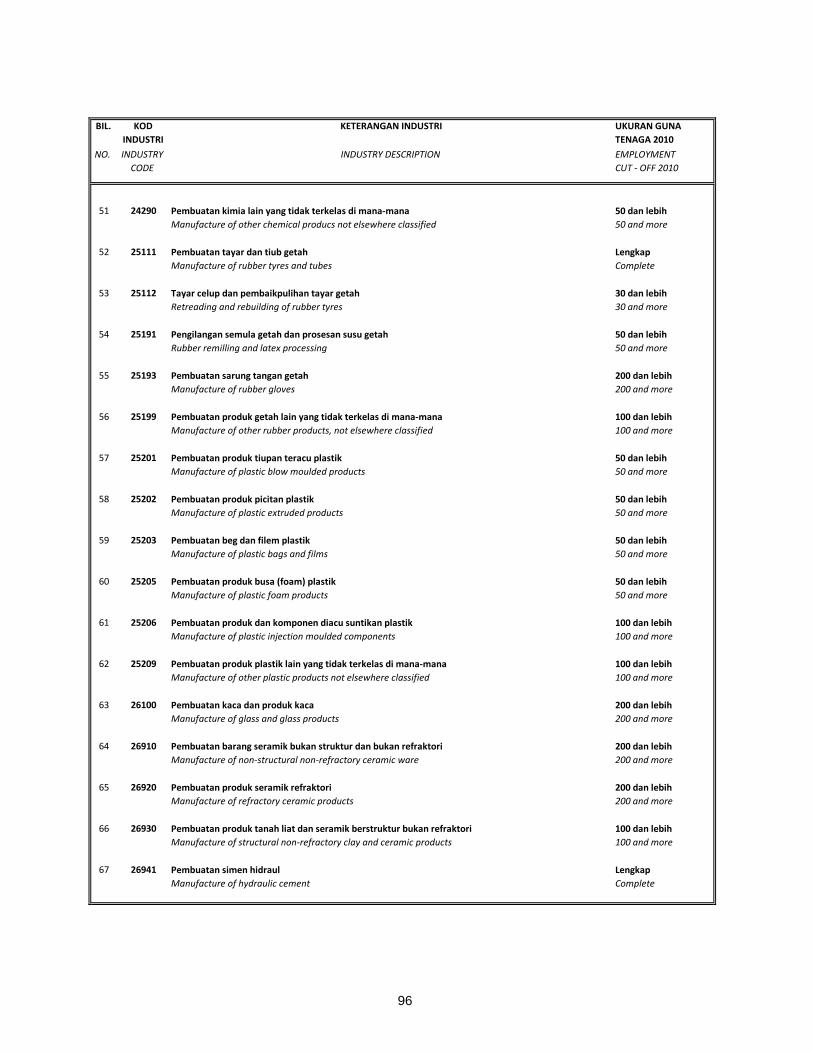
96
BIL. KOD INDUSTRI
KETERANGAN INDUSTRI UKURAN GUNA TENAGA 2010
NO. INDUSTRY CODE
INDUSTRY DESCRIPTION EMPLOYMENT CUT - OFF 2010
51 24290 Pembuatan kimia lain yang tidak terkelas di mana-manaManufacture of other chemical producs not elsewhere classified
50 dan lebih50 and more
52 25111 Pembuatan tayar dan tiub getahManufacture of rubber tyres and tubes
LengkapComplete
53 25112 Tayar celup dan pembaikpulihan tayar getahRetreading and rebuilding of rubber tyres
30 dan lebih30 and more
54 25191 Pengilangan semula getah dan prosesan susu getahRubber remilling and latex processing
50 dan lebih50 and more
55 25193 Pembuatan sarung tangan getahManufacture of rubber gloves
200 dan lebih200 and more
56 25199 Pembuatan produk getah lain yang tidak terkelas di mana-manaManufacture of other rubber products, not elsewhere classified
100 dan lebih100 and more
57 25201 Pembuatan produk tiupan teracu plastikManufacture of plastic blow moulded products
50 dan lebih50 and more
58 25202 Pembuatan produk picitan plastikManufacture of plastic extruded products
50 dan lebih50 and more
59 25203 Pembuatan beg dan filem plastikManufacture of plastic bags and films
50 dan lebih50 and more
60 25205 Pembuatan produk busa (foam) plastikManufacture of plastic foam products
50 dan lebih50 and more
61 25206 Pembuatan produk dan komponen diacu suntikan plastikManufacture of plastic injection moulded components
100 dan lebih100 and more
62 25209 Pembuatan produk plastik lain yang tidak terkelas di mana-manaManufacture of other plastic products not elsewhere classified
100 dan lebih100 and more
63 26100 Pembuatan kaca dan produk kacaManufacture of glass and glass products
200 dan lebih200 and more
64 26910 Pembuatan barang seramik bukan struktur dan bukan refraktoriManufacture of non-structural non-refractory ceramic ware
200 dan lebih200 and more
65 26920 Pembuatan produk seramik refraktoriManufacture of refractory ceramic products
200 dan lebih200 and more
66 26930 Pembuatan produk tanah liat dan seramik berstruktur bukan refraktoriManufacture of structural non-refractory clay and ceramic products
100 dan lebih100 and more
67 26941 Pembuatan simen hidraulManufacture of hydraulic cement
LengkapComplete
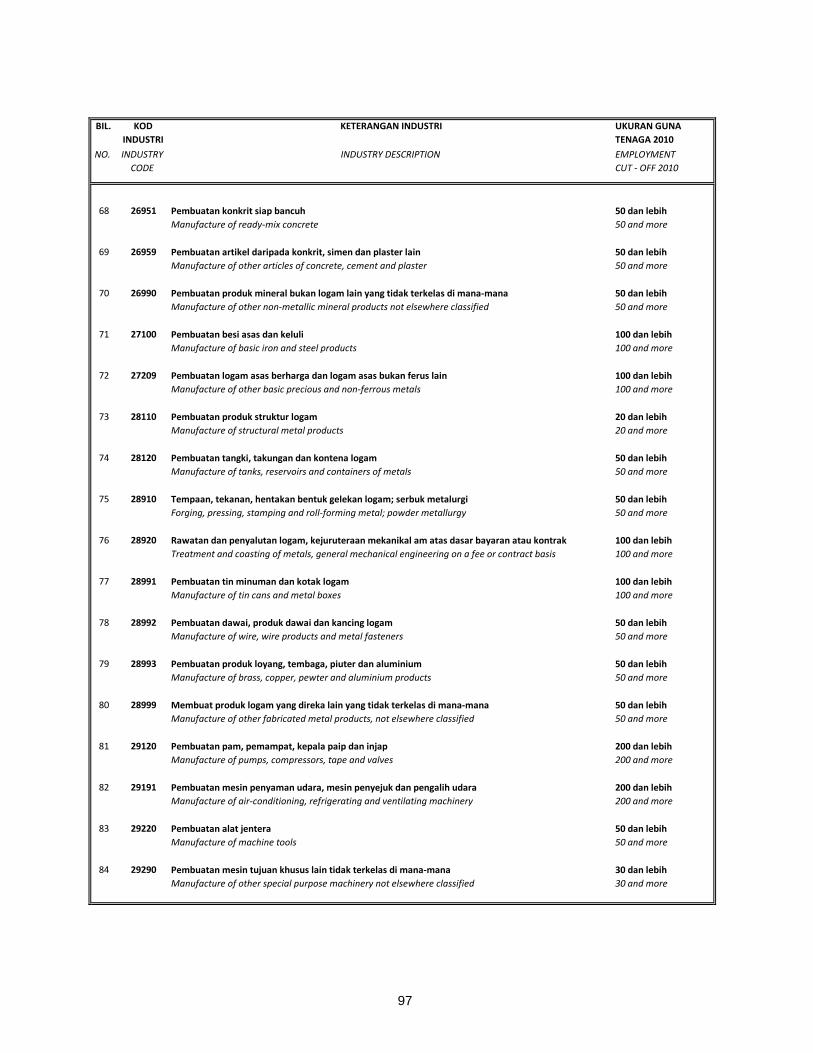
97
BIL. KOD INDUSTRI
KETERANGAN INDUSTRI UKURAN GUNA TENAGA 2010
NO. INDUSTRY CODE
INDUSTRY DESCRIPTION EMPLOYMENT CUT - OFF 2010
68 26951 Pembuatan konkrit siap bancuhManufacture of ready-mix concrete
50 dan lebih50 and more
69 26959 Pembuatan artikel daripada konkrit, simen dan plaster lainManufacture of other articles of concrete, cement and plaster
50 dan lebih50 and more
70 26990 Pembuatan produk mineral bukan logam lain yang tidak terkelas di mana-manaManufacture of other non-metallic mineral products not elsewhere classified
50 dan lebih50 and more
71 27100 Pembuatan besi asas dan keluliManufacture of basic iron and steel products
100 dan lebih100 and more
72 27209 Pembuatan logam asas berharga dan logam asas bukan ferus lainManufacture of other basic precious and non-ferrous metals
100 dan lebih100 and more
73 28110 Pembuatan produk struktur logamManufacture of structural metal products
20 dan lebih20 and more
74 28120 Pembuatan tangki, takungan dan kontena logamManufacture of tanks, reservoirs and containers of metals
50 dan lebih50 and more
75 28910 Tempaan, tekanan, hentakan bentuk gelekan logam; serbuk metalurgiForging, pressing, stamping and roll-forming metal; powder metallurgy
50 dan lebih50 and more
76 28920 Rawatan dan penyalutan logam, kejuruteraan mekanikal am atas dasar bayaran atau kontrakTreatment and coasting of metals, general mechanical engineering on a fee or contract basis
100 dan lebih100 and more
77 28991 Pembuatan tin minuman dan kotak logamManufacture of tin cans and metal boxes
100 dan lebih100 and more
78 28992 Pembuatan dawai, produk dawai dan kancing logamManufacture of wire, wire products and metal fasteners
50 dan lebih50 and more
79 28993 Pembuatan produk loyang, tembaga, piuter dan aluminiumManufacture of brass, copper, pewter and aluminium products
50 dan lebih50 and more
80 28999 Membuat produk logam yang direka lain yang tidak terkelas di mana-manaManufacture of other fabricated metal products, not elsewhere classified
50 dan lebih50 and more
81 29120 Pembuatan pam, pemampat, kepala paip dan injapManufacture of pumps, compressors, tape and valves
200 dan lebih200 and more
82 29191 Pembuatan mesin penyaman udara, mesin penyejuk dan pengalih udaraManufacture of air-conditioning, refrigerating and ventilating machinery
200 dan lebih200 and more
83 29220 Pembuatan alat jenteraManufacture of machine tools
50 dan lebih50 and more
84 29290 Pembuatan mesin tujuan khusus lain tidak terkelas di mana-manaManufacture of other special purpose machinery not elsewhere classified
30 dan lebih30 and more
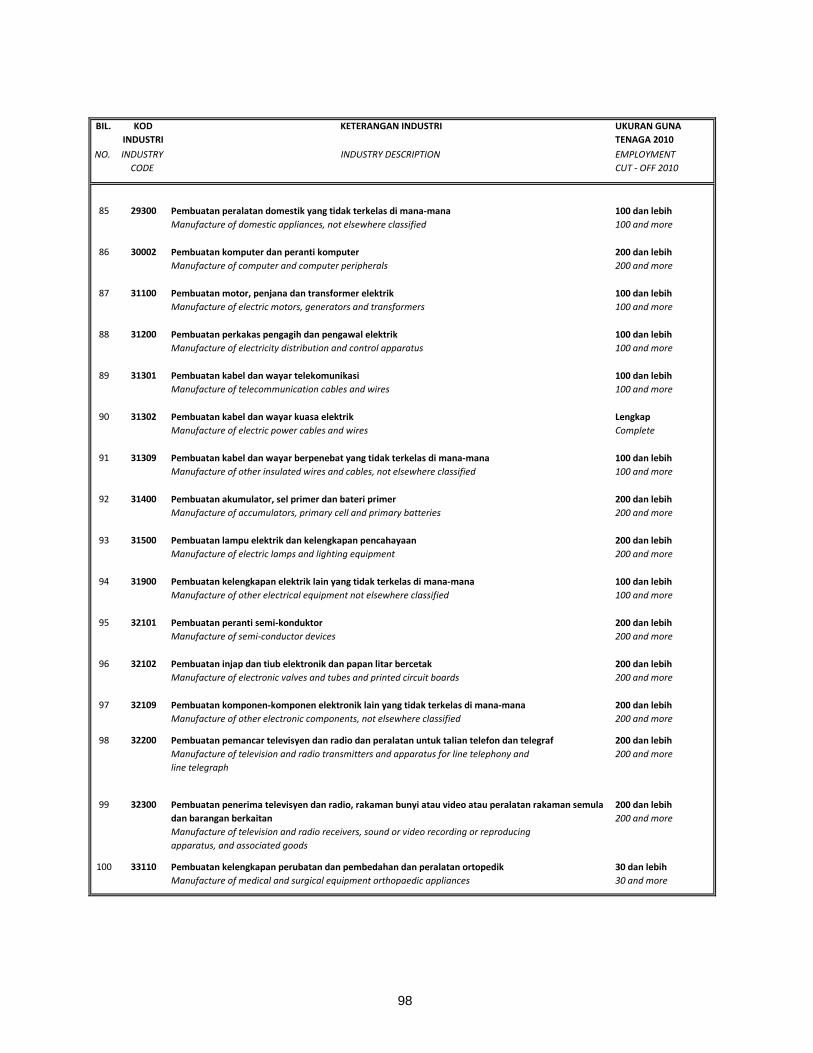
98
BIL. KOD INDUSTRI
KETERANGAN INDUSTRI UKURAN GUNA TENAGA 2010
NO. INDUSTRY CODE
INDUSTRY DESCRIPTION EMPLOYMENT CUT - OFF 2010
85 29300 Pembuatan peralatan domestik yang tidak terkelas di mana-manaManufacture of domestic appliances, not elsewhere classified
100 dan lebih100 and more
86 30002 Pembuatan komputer dan peranti komputerManufacture of computer and computer peripherals
200 dan lebih200 and more
87 31100 Pembuatan motor, penjana dan transformer elektrikManufacture of electric motors, generators and transformers
100 dan lebih100 and more
88 31200 Pembuatan perkakas pengagih dan pengawal elektrikManufacture of electricity distribution and control apparatus
100 dan lebih100 and more
89 31301 Pembuatan kabel dan wayar telekomunikasiManufacture of telecommunication cables and wires
100 dan lebih100 and more
90 31302 Pembuatan kabel dan wayar kuasa elektrikManufacture of electric power cables and wires
LengkapComplete
91 31309 Pembuatan kabel dan wayar berpenebat yang tidak terkelas di mana-manaManufacture of other insulated wires and cables, not elsewhere classified
100 dan lebih100 and more
92 31400 Pembuatan akumulator, sel primer dan bateri primerManufacture of accumulators, primary cell and primary batteries
200 dan lebih200 and more
93 31500 Pembuatan lampu elektrik dan kelengkapan pencahayaanManufacture of electric lamps and lighting equipment
200 dan lebih200 and more
94 31900 Pembuatan kelengkapan elektrik lain yang tidak terkelas di mana-manaManufacture of other electrical equipment not elsewhere classified
100 dan lebih100 and more
95 32101 Pembuatan peranti semi-konduktorManufacture of semi-conductor devices
200 dan lebih200 and more
96 32102 Pembuatan injap dan tiub elektronik dan papan litar bercetakManufacture of electronic valves and tubes and printed circuit boards
200 dan lebih200 and more
97 32109 Pembuatan komponen-komponen elektronik lain yang tidak terkelas di mana-manaManufacture of other electronic components, not elsewhere classified
200 dan lebih200 and more
98 32200 Pembuatan pemancar televisyen dan radio dan peralatan untuk talian telefon dan telegrafManufacture of television and radio transmitters and apparatus for line telephony andline telegraph
200 dan lebih200 and more
99 32300 Pembuatan penerima televisyen dan radio, rakaman bunyi atau video atau peralatan rakaman semula dan barangan berkaitanManufacture of television and radio receivers, sound or video recording or reproducingapparatus, and associated goods
200 dan lebih200 and more
100 33110 Pembuatan kelengkapan perubatan dan pembedahan dan peralatan ortopedikManufacture of medical and surgical equipment orthopaedic appliances
30 dan lebih30 and more
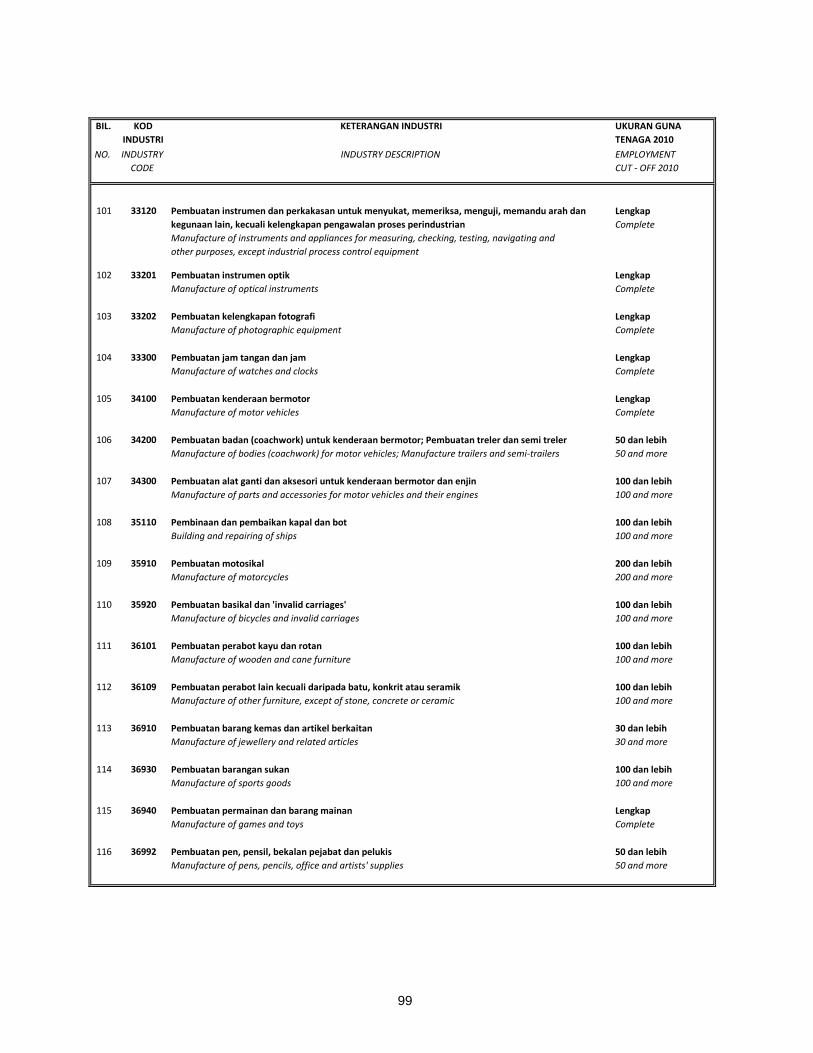
99
BIL. KOD INDUSTRI
KETERANGAN INDUSTRI UKURAN GUNA TENAGA 2010
NO. INDUSTRY CODE
INDUSTRY DESCRIPTION EMPLOYMENT CUT - OFF 2010
101 33120 Pembuatan instrumen dan perkakasan untuk menyukat, memeriksa, menguji, memandu arah dan kegunaan lain, kecuali kelengkapan pengawalan proses perindustrianManufacture of instruments and appliances for measuring, checking, testing, navigating andother purposes, except industrial process control equipment
LengkapComplete
102 33201 Pembuatan instrumen optikManufacture of optical instruments
LengkapComplete
103 33202 Pembuatan kelengkapan fotografiManufacture of photographic equipment
LengkapComplete
104 33300 Pembuatan jam tangan dan jamManufacture of watches and clocks
LengkapComplete
105 34100 Pembuatan kenderaan bermotorManufacture of motor vehicles
LengkapComplete
106 34200 Pembuatan badan (coachwork) untuk kenderaan bermotor; Pembuatan treler dan semi trelerManufacture of bodies (coachwork) for motor vehicles; Manufacture trailers and semi-trailers
50 dan lebih50 and more
107 34300 Pembuatan alat ganti dan aksesori untuk kenderaan bermotor dan enjinManufacture of parts and accessories for motor vehicles and their engines
100 dan lebih100 and more
108 35110 Pembinaan dan pembaikan kapal dan botBuilding and repairing of ships
100 dan lebih100 and more
109 35910 Pembuatan motosikalManufacture of motorcycles
200 dan lebih200 and more
110 35920 Pembuatan basikal dan 'invalid carriages'Manufacture of bicycles and invalid carriages
100 dan lebih100 and more
111 36101 Pembuatan perabot kayu dan rotanManufacture of wooden and cane furniture
100 dan lebih100 and more
112 36109 Pembuatan perabot lain kecuali daripada batu, konkrit atau seramikManufacture of other furniture, except of stone, concrete or ceramic
100 dan lebih100 and more
113 36910 Pembuatan barang kemas dan artikel berkaitanManufacture of jewellery and related articles
30 dan lebih30 and more
114 36930 Pembuatan barangan sukanManufacture of sports goods
100 dan lebih100 and more
115 36940 Pembuatan permainan dan barang mainanManufacture of games and toys
LengkapComplete
116 36992 Pembuatan pen, pensil, bekalan pejabat dan pelukisManufacture of pens, pencils, office and artists' supplies
50 dan lebih50 and more


![HIPOTESIS BUNYI PALATALISASI [nj] DAN BUNYI BELAKANG ...](https://static.fdokumen.site/doc/165x107/5876c5ef1a28abc01d8b4ef3/hipotesis-bunyi-palatalisasi-nj-dan-bunyi-belakang-.jpg)