MITI in the News SDSI Jana Jualan RM110 Juta Weekly Bulletin/MITI... · “Tujuan kita mengadakan...
14
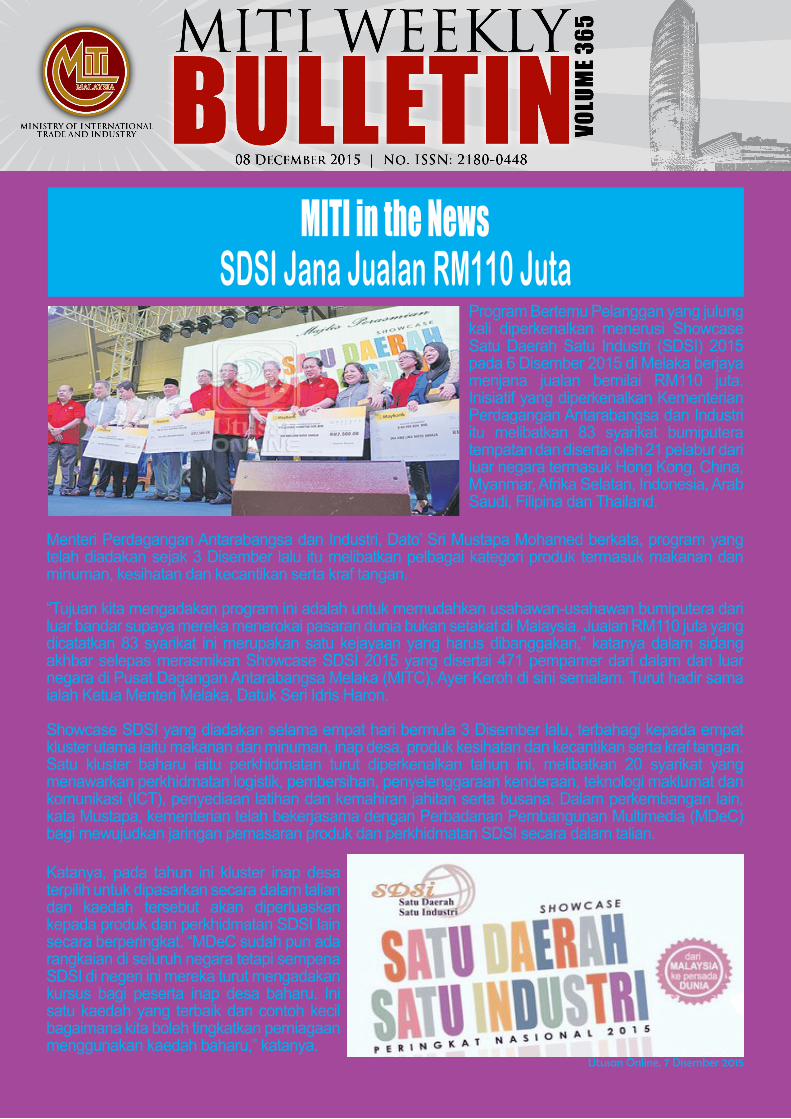
“DRIVING Transformation, POWERING Growth” Utusan Online, 7 Disember 2015 SDSI Jana Jualan RM110 Juta MITI in the News Program Bertemu Pelanggan yang julung kali diperkenalkan menerusi Showcase Satu Daerah Satu Industri (SDSI) 2015 pada 6 Disember 2015 di Melaka berjaya menjana jualan bernilai RM110 juta. Inisiatif yang diperkenalkan Kementerian Perdagangan Antarabangsa dan Industri itu melibatkan 83 syarikat bumiputera tempatan dan disertai oleh 21 pelabur dari luar negara termasuk Hong Kong, China, Myanmar, Afrika Selatan, Indonesia, Arab Saudi, Filipina dan Thailand. Menteri Perdagangan Antarabangsa dan Industri, Dato’ Sri Mustapa Mohamed berkata, program yang telah diadakan sejak 3 Disember lalu itu melibatkan pelbagai kategori produk termasuk makanan dan minuman, kesihatan dan kecantikan serta kraf tangan. “Tujuan kita mengadakan program ini adalah untuk memudahkan usahawan-usahawan bumiputera dari luar bandar supaya mereka menerokai pasaran dunia bukan setakat di Malaysia. Jualan RM110 juta yang dicatatkan 83 syarikat ini merupakan satu kejayaan yang harus dibanggakan,” katanya dalam sidang akhbar selepas merasmikan Showcase SDSI 2015 yang disertai 471 pempamer dari dalam dan luar negara di Pusat Dagangan Antarabangsa Melaka (MITC), Ayer Keroh di sini semalam. Turut hadir sama ialah Ketua Menteri Melaka, Datuk Seri Idris Haron. Showcase SDSI yang diadakan selama empat hari bermula 3 Disember lalu, terbahagi kepada empat kluster utama iaitu makanan dan minuman, inap desa, produk kesihatan dan kecantikan serta kraf tangan. Satu kluster baharu iaitu perkhidmatan turut diperkenalkan tahun ini, melibatkan 20 syarikat yang menawarkan perkhidmatan logistik, pembersihan, penyelenggaraan kenderaan, teknologi maklumat dan komunikasi (ICT), penyediaan latihan dan kemahiran jahitan serta busana. Dalam perkembangan lain, kata Mustapa, kementerian telah bekerjasama dengan Perbadanan Pembangunan Multimedia (MDeC) bagi mewujudkan jaringan pemasaran produk dan perkhidmatan SDSI secara dalam talian. Katanya, pada tahun ini kluster inap desa terpilih untuk dipasarkan secara dalam talian dan kaedah tersebut akan diperluaskan kepada produk dan perkhidmatan SDSI lain secara berperingkat. “MDeC sudah pun ada rangkaian di seluruh negara tetapi sempena SDSI di negeri ini mereka turut mengadakan kursus bagi peserta inap desa baharu. Ini satu kaedah yang terbaik dan contoh kecil bagaimana kita boleh tingkatkan perniagaan menggunakan kaedah baharu,” katanya.
Transcript of MITI in the News SDSI Jana Jualan RM110 Juta Weekly Bulletin/MITI... · “Tujuan kita mengadakan...
“DRIVING Transformation, POWERING Growth”
Utusan Online, 7 Disember 2015
SDSI Jana Jualan RM110 JutaMITI in the News
Program Bertemu Pelanggan yang julung kali diperkenalkan menerusi Showcase Satu Daerah Satu Industri (SDSI) 2015 pada 6 Disember 2015 di Melaka berjaya menjana jualan bernilai RM110 juta. Inisiatif yang diperkenalkan Kementerian Perdagangan Antarabangsa dan Industri itu melibatkan 83 syarikat bumiputera tempatan dan disertai oleh 21 pelabur dari luar negara termasuk Hong Kong, China, Myanmar, Afrika Selatan, Indonesia, Arab Saudi, Filipina dan Thailand.
Menteri Perdagangan Antarabangsa dan Industri, Dato’ Sri Mustapa Mohamed berkata, program yang telah diadakan sejak 3 Disember lalu itu melibatkan pelbagai kategori produk termasuk makanan dan minuman, kesihatan dan kecantikan serta kraf tangan.
“Tujuan kita mengadakan program ini adalah untuk memudahkan usahawan-usahawan bumiputera dari luar bandar supaya mereka menerokai pasaran dunia bukan setakat di Malaysia. Jualan RM110 juta yang dicatatkan 83 syarikat ini merupakan satu kejayaan yang harus dibanggakan,” katanya dalam sidang akhbar selepas merasmikan Showcase SDSI 2015 yang disertai 471 pempamer dari dalam dan luar negara di Pusat Dagangan Antarabangsa Melaka (MITC), Ayer Keroh di sini semalam. Turut hadir sama ialah Ketua Menteri Melaka, Datuk Seri Idris Haron.
Showcase SDSI yang diadakan selama empat hari bermula 3 Disember lalu, terbahagi kepada empat kluster utama iaitu makanan dan minuman, inap desa, produk kesihatan dan kecantikan serta kraf tangan.Satu kluster baharu iaitu per khid matan turut diperkenalkan tahun ini, melibatkan 20 syarikat yang menawarkan perkhidmatan logistik, pembersihan, penyelenggaraan kenderaan, teknologi maklumat dan komunikasi (ICT), penyediaan latihan dan kemahiran jahitan serta busana. Dalam perkembangan lain, kata Mustapa, kementerian telah bekerjasama dengan Perbadanan Pembangunan Multimedia (MDeC) bagi mewujudkan jaringan pemasaran produk dan perkhidmatan SDSI seca ra dalam talian.
Katanya, pada tahun ini kluster inap desa terpilih untuk dipasarkan secara dalam talian dan kaedah tersebut akan diperluaskan kepada produk dan perkhidmatan SDSI lain secara berperingkat. “MDeC sudah pun ada rangkai an di seluruh negara tetapi sempena SDSI di negeri ini mereka turut mengadakan kursus bagi peserta inap desa baharu. Ini satu kaedah yang terbaik dan contoh kecil bagaimana kita boleh tingkatkan perniagaan menggunakan kaedah baharu,” katanya.
MITI Weekly Bulletin / www.miti.gov.my
“DRIVING Transformation, POWERING Growth”
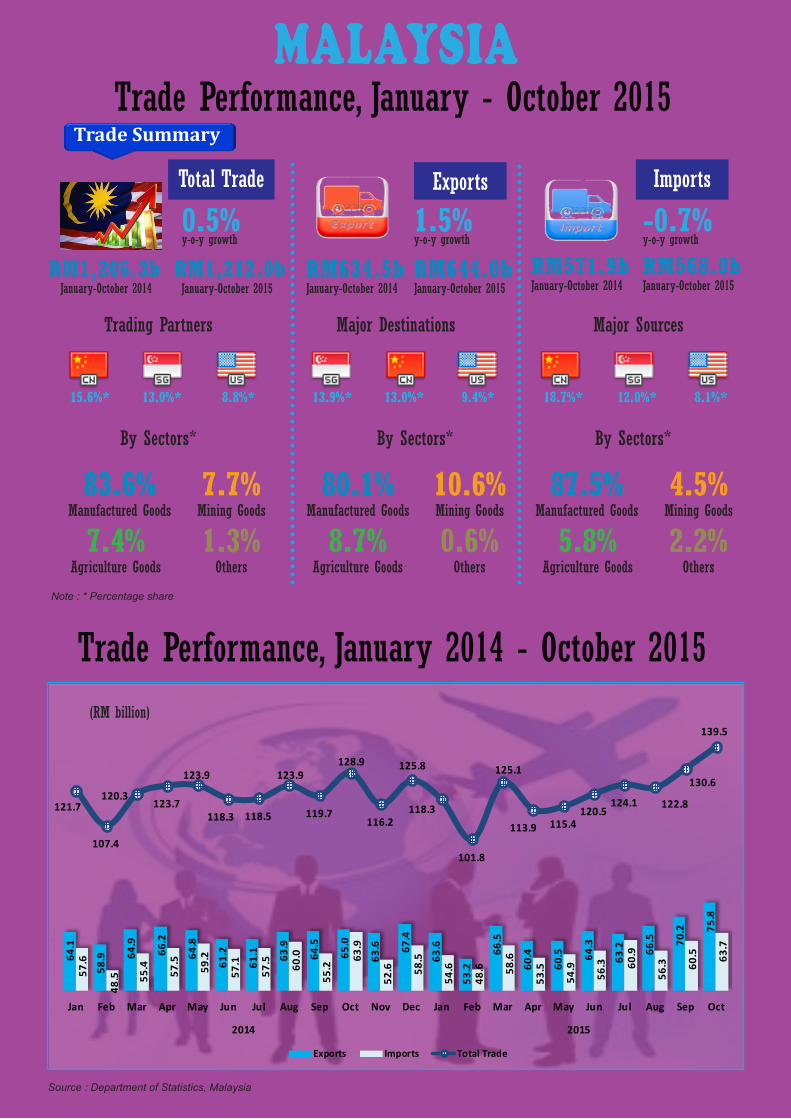
Trade Performance, January - October 2015
Source : Department of Statistics, Malaysia
MALAYSIATrade Summary
Total Trade
RM1,212.0bJanuary-October 2015
RM1,206.3bJanuary-October 2014
0.5%y-o-y growth
Exports
RM644.0bJanuary-October 2015
RM634.5bJanuary-October 2014
1.5%y-o-y growth
Imports
RM568.0bJanuary-October 2015
RM571.9bJanuary-October 2014
-0.7%y-o-y growth
Trade Performance, January 2014 - October 2015
64.1
58.9
64.9
66.2
64.8
61.2
61.1
63.9
64.5
65.0
63.6
67.4
63.6
53.2
66.5
60.4
60.5
64.3
63.2
66.5
70.2
75.8
57.6
48.5
55.4
57.5
59.2
57.1
57.5
60.0
55.2
63.9
52.6
58.5
54.6
48.6
58.6
53.5
54.9
56.3
60.9
56.3
60.5
63.7
121.7
107.4
120.3 123.7
123.9
118.3 118.5
123.9
119.7
128.9
116.2
125.8
118.3
101.8
125.1
113.9 115.4 120.5
124.1 122.8
130.6
139.5
Jan Feb Mar Apr May Jun Jul Aug Sep Oct Nov Dec Jan Feb Mar Apr May Jun Jul Aug Sep Oct
2014 2015
Exports Imports Total Trade
Trading Partners Major Destinations Major Sources
15.6%* 13.0%* 8.8%* 13.9%* 13.0%* 9.4%* 18.7%* 12.0%* 8.1%*
Note : * Percentage share
83.6%Manufactured Goods
7.4%Agriculture Goods
7.7%Mining Goods
1.3%Others
80.1%Manufactured Goods
8.7%Agriculture Goods
10.6%Mining Goods
0.6%Others
87.5%Manufactured Goods
5.8%Agriculture Goods
4.5%Mining Goods
2.2%Others
By Sectors* By Sectors* By Sectors*
(RM billion)
MITI Weekly Bulletin / www.miti.gov.my
“DRIVING Transformation, POWERING Growth”
7.2
9.5
0.6
5.0
11.8
9.0
(0.7)
7.6
1.1
9.1
0.1
4.1
(5.1)
0.3 5.8
(6.9) (7.1)
(1.5)
5.9
(6.1)
9.6
(0.4)
Jan Feb Mar Apr May Jun Jul Aug Sep Oct Nov Dec Jan Feb Mar Apr May Jun Jul Aug Sep Oct
2014 2015
Y-o-Y Growth(%)
Total ImportsValue in RM billion)
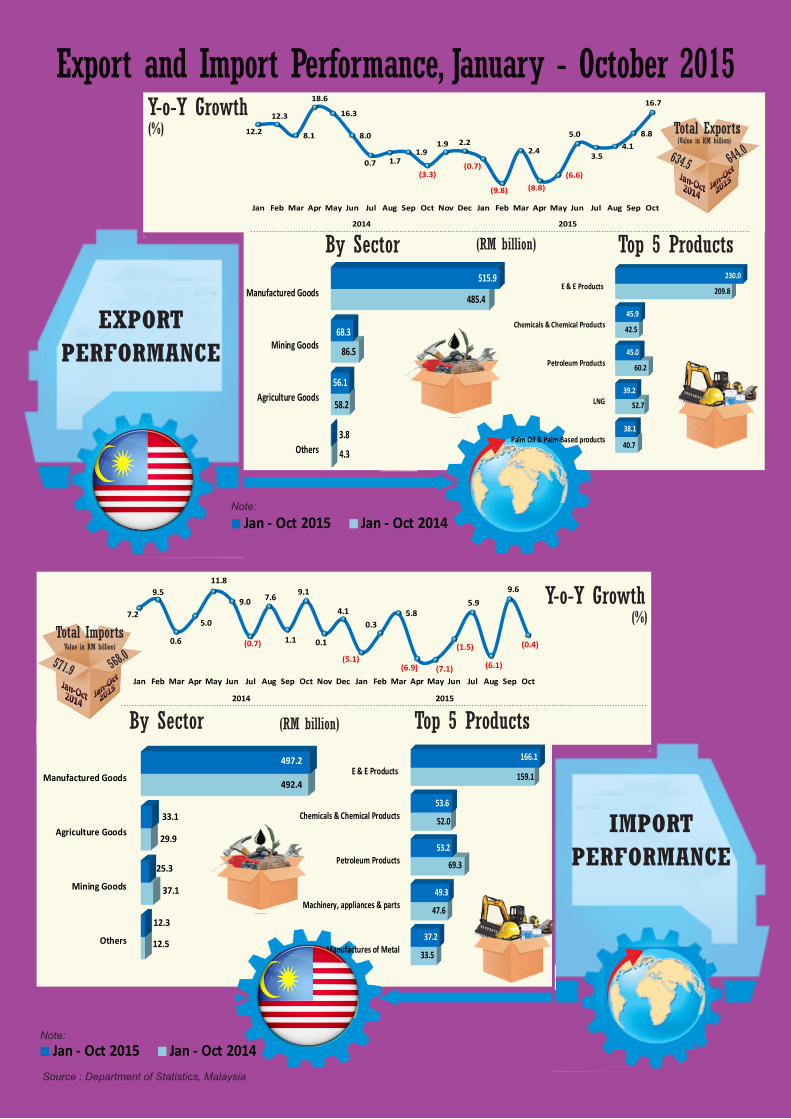
571.9 568.0
Source : Department of Statistics, Malaysia
Export and Import Performance, January - October 2015
EXPORTPERFORMANCE
Manufactured Goods
Mining Goods
Agriculture Goods
Others
515.9
68.3
56.1
3.8
485.4
86.5
58.2
4.3
E & E Products
Chemicals & Chemical Products
Petroleum Products
LNG
Palm Oil & Palm-Based products
230.0
45.9
45.0
39.2
38.1
209.8
42.5
60.2
52.7
40.7
By Sector Top 5 Products(RM billion)
IMPORTPERFORMANCE
Manufactured Goods
Agriculture Goods
Mining Goods
Others
497.2
33.1
25.3
12.3
492.4
29.9
37.1
12.5
E & E Products
Chemicals & Chemical Products
Petroleum Products
Machinery, appliances & parts
Manufactures of Metal
166.1
53.6
53.2
49.3
37.2
159.1
52.0
69.3
47.6
33.5
12.2
12.3
8.1
18.6
16.3
8.0
0.7 1.7 1.9
(3.3)
1.9 2.2
(0.7)
(9.8)
2.4
(8.8)(6.6)
5.0
3.5 4.1
8.8
16.7
Jan Feb Mar Apr May Jun Jul Aug Sep Oct Nov Dec Jan Feb Mar Apr May Jun Jul Aug Sep Oct
2014 2015
Y-o-Y Growth(%) Total Exports
(Value in RM billion)
634.5 644.0
By Sector Top 5 Products(RM billion)
0 50 100 150 200
E & E Products
Chemicals & Chemical Products
Petroleum Products
Machinery, appliances & parts
Manufactures of Metal
166.1
53.6
53.2
49.3
37.2
159.1
52.0
69.3
47.6
33.5
Jan - Oct 2015 Jan - Oct 2014Note:
0 50 100 150 200
E & E Products
Chemicals & Chemical Products
Petroleum Products
Machinery, appliances & parts
Manufactures of Metal
166.1
53.6
53.2
49.3
37.2
159.1
52.0
69.3
47.6
33.5
Jan - Oct 2015 Jan - Oct 2014Note:
MITI Weekly Bulletin / www.miti.gov.my
“DRIVING Transformation, POWERING Growth”
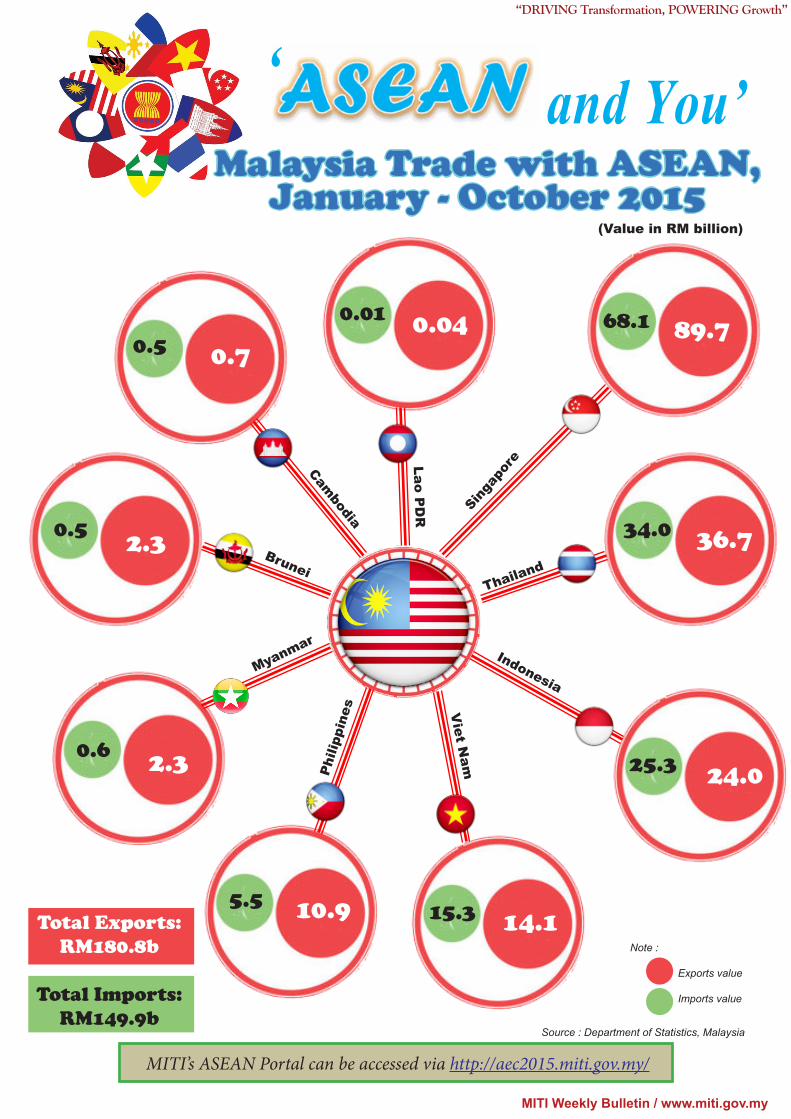
MITI’s ASEAN Portal can be accessed via http://aec2015.miti.gov.my/
and You’‘Malaysia Trade with ASEAN,
January - October 2015
89.7
36.7
24.0
14.110.9
2.3
2.3
0.70.04 68.1
34.0
25.3
15.35.5
0.6
0.5
0.010.5
Source : Department of Statistics, Malaysia
Total Exports: RM180.8b
Total Imports: RM149.9b
Note : Exports value Imports value
(Value in RM billion)
Sing
apor
e
Thailand
Indonesia
Viet N
amPh
ilipp
ines
Myanmar
Brunei
Lao PD
R
Cambodia
MITI Weekly Bulletin / www.miti.gov.my
“DRIVING Transformation, POWERING Growth”
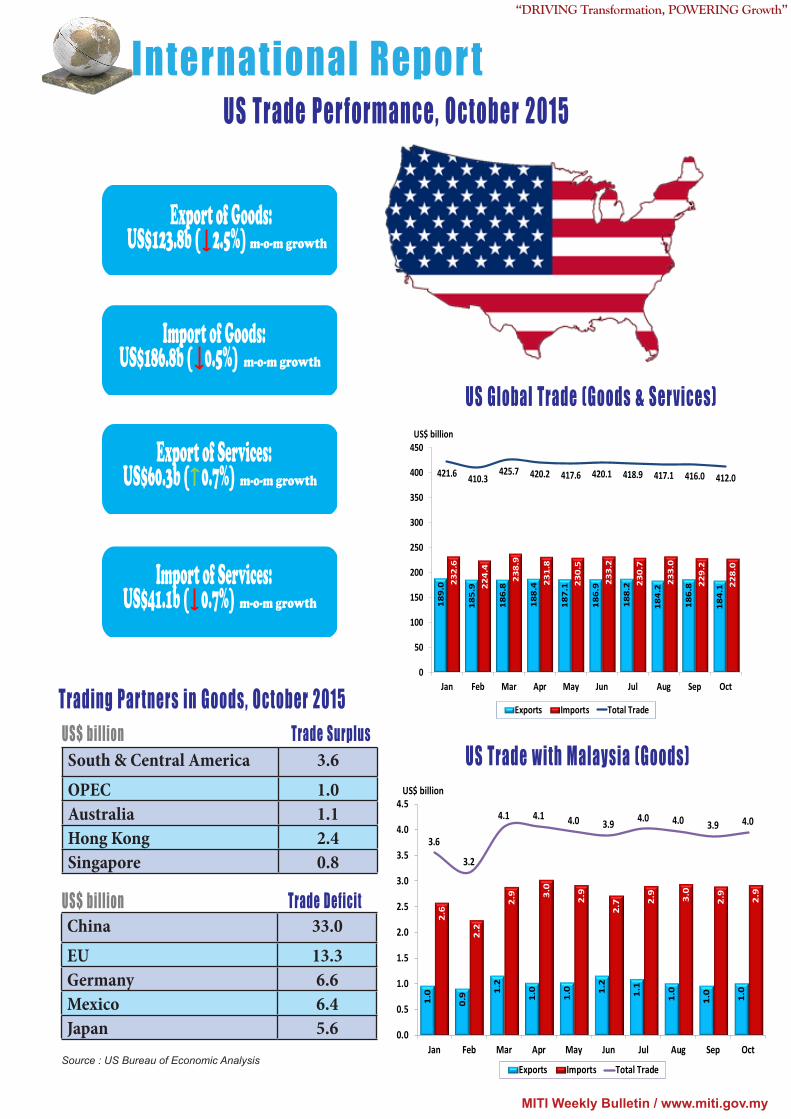
US Trade Per formance, October 2015
Import of Goods: US$186.8b ( 0.5%) m-o-m growth
Export of Goods: US$123.8b ( 2.5%) m-o-m growth
Export of Services: US$60.3b ( 0.7%) m-o-m growth
Import of Services: US$41.1b ( 0.7%) m-o-m growth
Trading Par tners in Goods, October 2015
South & Central America 3.6OPEC 1.0Australia 1.1Hong Kong 2.4Singapore 0.8
Trade SurplusUS$ billion
China 33.0EU 13.3Germany 6.6Mexico 6.4Japan 5.6
Trade Deficit
Source : US Bureau of Economic Analysis
US Global Trade (Goods & Ser vices)18
9.0
185.
9
186.
8
188.
4
187.
1
186.
9
188.
2
184.
2
186.
8
184.
1232.
6
224.
4
238.
9
231.
8
230.
5
233.
2
230.
7
233.
0
229.
2
228.
0
421.6 410.3425.7 420.2 417.6 420.1 418.9 417.1 416.0 412.0
0
50
100
150
200
250
300
350
400
450
Jan Feb Mar Apr May Jun Jul Aug Sep Oct
US$ billion
Exports Imports Total Trade
US Trade with Malaysia (Goods)
1.0
0.9 1.
2
1.0
1.0 1.
2
1.1
1.0
1.0
1.0
2.6
2.2
2.9 3.
0
2.9
2.7 2.
9
3.0
2.9
2.9
3.6
3.2
4.1 4.1 4.0 3.9 4.0 4.0 3.9 4.0
0.0
0.5
1.0
1.5
2.0
2.5
3.0
3.5
4.0
4.5
Jan Feb Mar Apr May Jun Jul Aug Sep Oct
US$ billion
Exports Imports Total Trade
International Repor t
US$ billion
MITI Weekly Bulletin / www.miti.gov.my
“DRIVING Transformation, POWERING Growth”
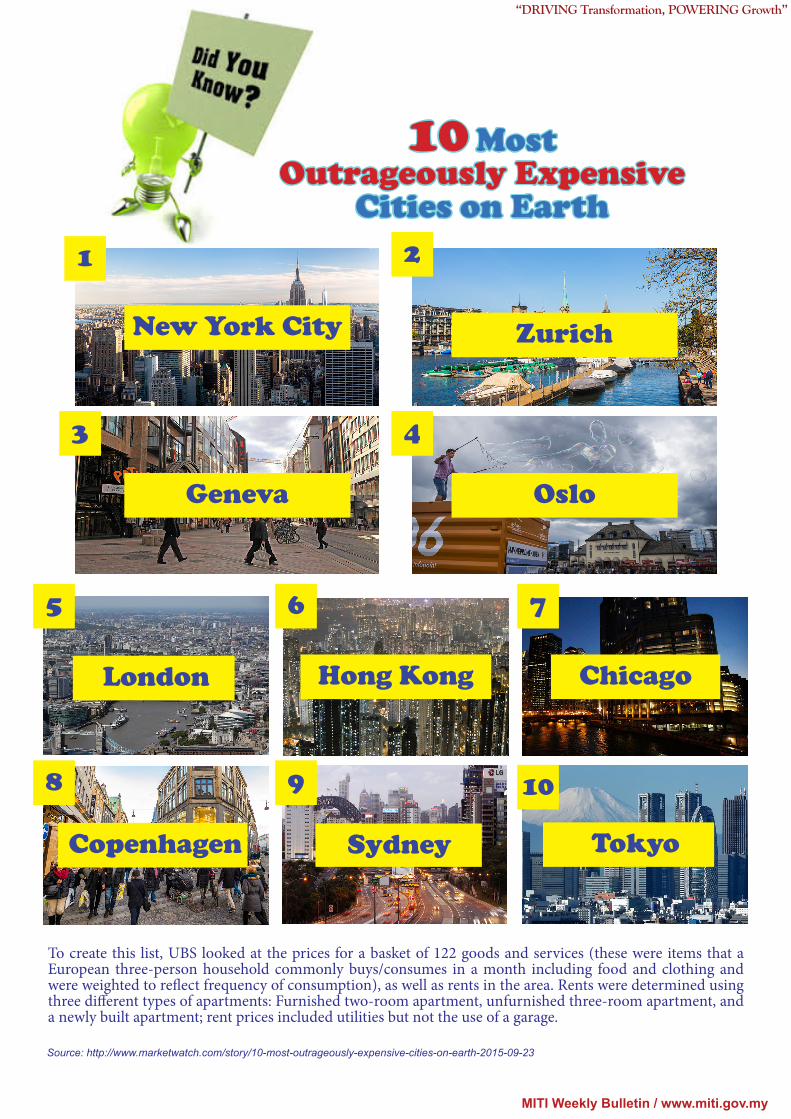
10 Most Outrageously Expensive
Cities on Earth
New York City Zurich
Geneva Oslo
London Hong Kong Chicago
Copenhagen Sydney Tokyo
To create this list, UBS looked at the prices for a basket of 122 goods and services (these were items that a European three-person household commonly buys/consumes in a month including food and clothing and were weighted to reflect frequency of consumption), as well as rents in the area. Rents were determined using three different types of apartments: Furnished two-room apartment, unfurnished three-room apartment, and a newly built apartment; rent prices included utilities but not the use of a garage.
Source: http://www.marketwatch.com/story/10-most-outrageously-expensive-cities-on-earth-2015-09-23
1 2
3 4
5 6 7
8 9 10
MITI Weekly Bulletin / www.miti.gov.my
“DRIVING Transformation, POWERING Growth”
Source: Ministry of International Trade and Industry, Malaysia
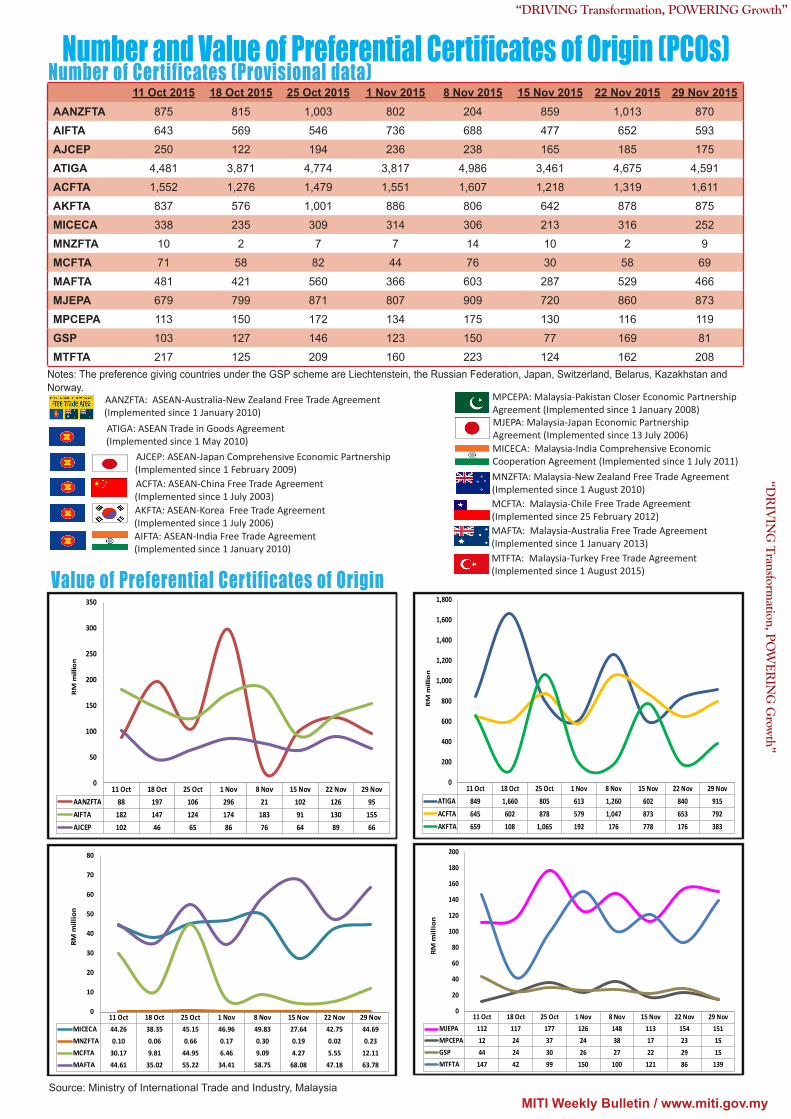
AJCEP: ASEAN-Japan Comprehensive Economic Partnership (Implemented since 1 February 2009) ACFTA: ASEAN-China Free Trade Agreement (Implemented since 1 July 2003) AKFTA: ASEAN-Korea Free Trade Agreement (Implemented since 1 July 2006)
AANZFTA: ASEAN-Australia-New Zealand Free Trade Agreement(Implemented since 1 January 2010)
AIFTA: ASEAN-India Free Trade Agreement (Implemented since 1 January 2010)
ATIGA: ASEAN Trade in Goods Agreement (Implemented since 1 May 2010)
MICECA: Malaysia-India Comprehensive Economic Cooperation Agreement (Implemented since 1 July 2011)MNZFTA: Malaysia-New Zealand Free Trade Agreement (Implemented since 1 August 2010)MCFTA: Malaysia-Chile Free Trade Agreement (Implemented since 25 February 2012)
MTFTA: Malaysia-Turkey Free Trade Agreement (Implemented since 1 August 2015)
MAFTA: Malaysia-Australia Free Trade Agreement (Implemented since 1 January 2013)
MPCEPA: Malaysia-Pakistan Closer Economic Partnership Agreement (Implemented since 1 January 2008)MJEPA: Malaysia-Japan Economic Partnership Agreement (Implemented since 13 July 2006)
11 Oct 18 Oct 25 Oct 1 Nov 8 Nov 15 Nov 22 Nov 29 NovAANZFTA 88 197 106 296 21 102 126 95AIFTA 182 147 124 174 183 91 130 155AJCEP 102 46 65 86 76 64 89 66
0
50
100
150
200
250
300
350
RM
mill
ion
11 Oct 18 Oct 25 Oct 1 Nov 8 Nov 15 Nov 22 Nov 29 NovATIGA 849 1,660 805 613 1,260 602 840 915ACFTA 645 602 878 579 1,047 873 653 792AKFTA 659 108 1,065 192 176 778 176 383
0
200
400
600
800
1,000
1,200
1,400
1,600
1,800
RM
mill
ion
11 Oct 18 Oct 25 Oct 1 Nov 8 Nov 15 Nov 22 Nov 29 NovMICECA 44.26 38.35 45.15 46.96 49.83 27.64 42.75 44.69MNZFTA 0.10 0.06 0.66 0.17 0.30 0.19 0.02 0.23MCFTA 30.17 9.81 44.95 6.46 9.09 4.27 5.55 12.11MAFTA 44.61 35.02 55.22 34.41 58.75 68.08 47.18 63.78
0
10
20
30
40
50
60
70
80
RM m
illio
n
11 Oct 2015 18 Oct 2015 25 Oct 2015 1 Nov 2015 8 Nov 2015 15 Nov 2015 22 Nov 2015 29 Nov 2015AANZFTA 875 815 1,003 802 204 859 1,013 870
AIFTA 643 569 546 736 688 477 652 593
AJCEP 250 122 194 236 238 165 185 175
ATIGA 4,481 3,871 4,774 3,817 4,986 3,461 4,675 4,591
ACFTA 1,552 1,276 1,479 1,551 1,607 1,218 1,319 1,611
AKFTA 837 576 1,001 886 806 642 878 875
MICECA 338 235 309 314 306 213 316 252
MNZFTA 10 2 7 7 14 10 2 9
MCFTA 71 58 82 44 76 30 58 69
MAFTA 481 421 560 366 603 287 529 466
MJEPA 679 799 871 807 909 720 860 873
MPCEPA 113 150 172 134 175 130 116 119
GSP 103 127 146 123 150 77 169 81
MTFTA 217 125 209 160 223 124 162 208
11 Oct 18 Oct 25 Oct 1 Nov 8 Nov 15 Nov 22 Nov 29 NovMJEPA 112 117 177 126 148 113 154 151MPCEPA 12 24 37 24 38 17 23 15GSP 44 24 30 26 27 22 29 15MTFTA 147 42 99 150 100 121 86 139
0
20
40
60
80
100
120
140
160
180
200
RM m
illio
n
Value of Preferential Certificates of Origin
Number and Value of Preferential Certificates of Origin (PCOs)Number of Certificates (Provisional data)
“DR
IVIN
G T
ransformation, P
OW
ERIN
G G
rowth”
Notes: The preference giving countries under the GSP scheme are Liechtenstein, the Russian Federation, Japan, Switzerland, Belarus, Kazakhstan and Norway.
MITI Weekly Bulletin / www.miti.gov.my
“DRIVING Transformation, POWERING Growth”
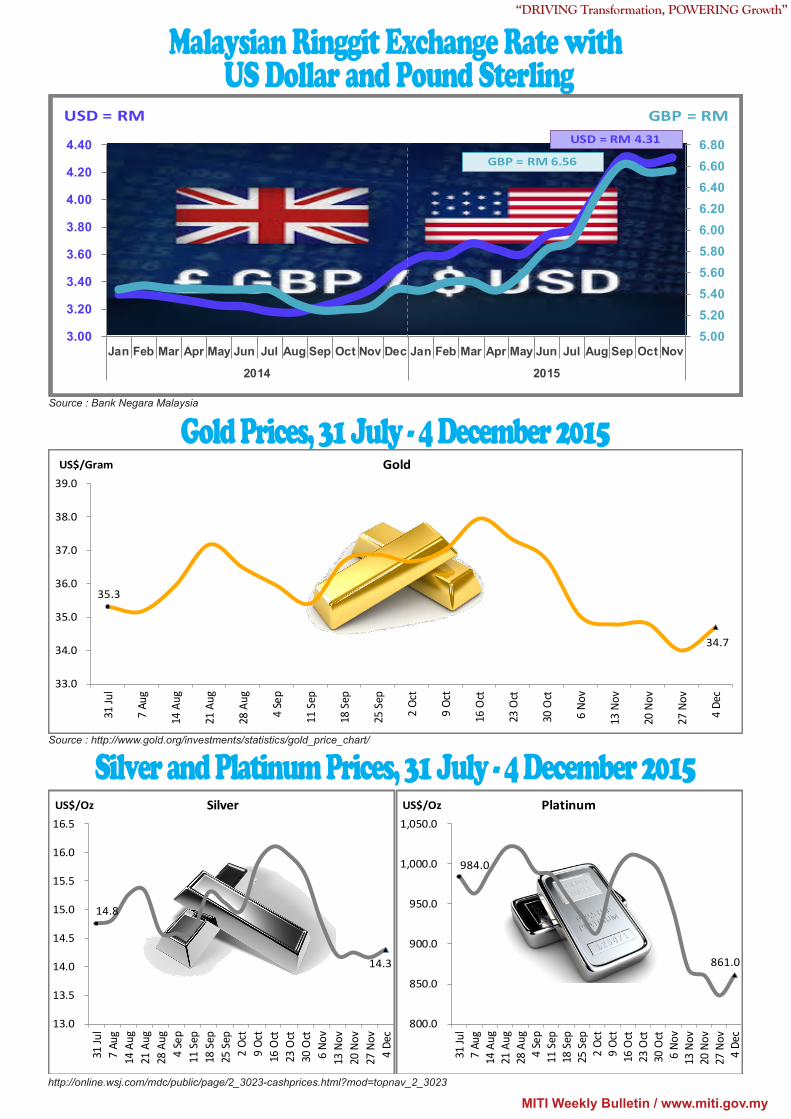
Malaysian Ringgit Exchange Rate with US Dollar and Pound Sterling
Source : Bank Negara Malaysia
5.005.205.405.605.806.006.206.406.606.80
3.00
3.20
3.40
3.60
3.80
4.00
4.20
4.40
Jan Feb Mar Apr May Jun Jul Aug Sep Oct Nov Dec Jan Feb Mar Apr May Jun Jul Aug Sep Oct Nov
2014 2015
USD = RM GBP = RM
GBP = RM 6.56
USD = RM 4.31
14.8
14.3
13.0
13.5
14.0
14.5
15.0
15.5
16.0
16.5
31 Ju
l7
Aug
14 A
ug21
Aug
28 A
ug4
Sep
11 S
ep18
Sep
25 S
ep2
Oct
9 Oc
t16
Oct
23 O
ct30
Oct
6 No
v13
Nov
20 N
ov27
Nov
4 De
c
US$/Oz Silver
984.0
861.0
800.0
850.0
900.0
950.0
1,000.0
1,050.0
31 Ju
l7
Aug
14 A
ug21
Aug
28 A
ug4
Sep
11 S
ep18
Sep
25 S
ep2
Oct
9 Oc
t16
Oct
23 O
ct30
Oct
6 No
v13
Nov
20 N
ov27
Nov
4 De
c
US$/Oz Platinum
Source : http://www.gold.org/investments/statistics/gold_price_chart/
http://online.wsj.com/mdc/public/page/2_3023-cashprices.html?mod=topnav_2_3023
Gold Prices, 31 July - 4 December 2015
Silver and Platinum Prices, 31 July - 4 December 2015
35.3
34.7
33.0
34.0
35.0
36.0
37.0
38.0
39.0
31 Ju
l
7 Au
g
14 A
ug
21 A
ug
28 A
ug
4 Se
p
11 S
ep
18 S
ep
25 S
ep
2 Oc
t
9 Oc
t
16 O
ct
23 O
ct
30 O
ct
6 No
v
13 N
ov
20 N
ov
27 N
ov
4 De
c
US$/Gram Gold
MITI Weekly Bulletin / www.miti.gov.my
“DRIVING Transformation, POWERING Growth”
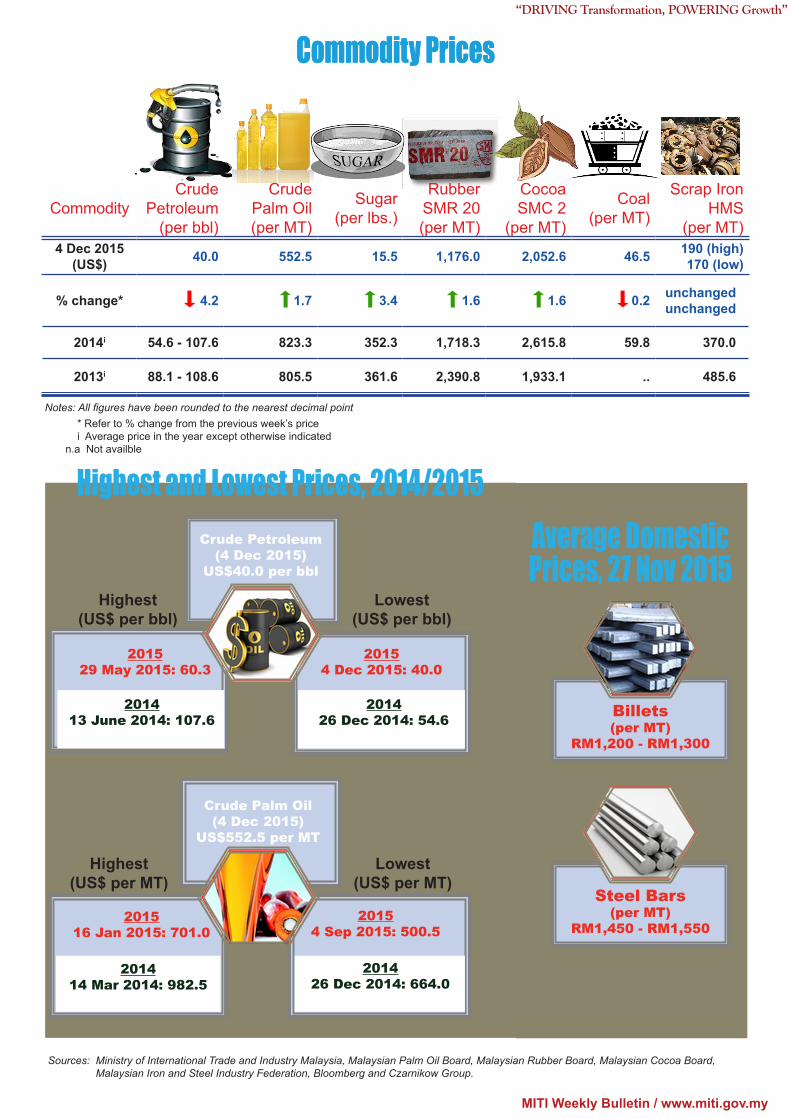
Commodity Prices
Notes: All figures have been rounded to the nearest decimal point * Refer to % change from the previous week’s price i Average price in the year except otherwise indicated n.a Not availble
Sources: Ministry of International Trade and Industry Malaysia, Malaysian Palm Oil Board, Malaysian Rubber Board, Malaysian Cocoa Board, Malaysian Iron and Steel Industry Federation, Bloomberg and Czarnikow Group.
Highest and Lowest Prices, 2014/2015
Lowest (US$ per bbl)
Highest(US$ per bbl)
Crude Petroleum (4 Dec 2015)
US$40.0 per bbl
201413 June 2014: 107.6
201426 Dec 2014: 54.6
201529 May 2015: 60.3
20154 Dec 2015: 40.0
Lowest (US$ per MT)
Highest(US$ per MT)
Crude Palm Oil (4 Dec 2015)
US$552.5 per MT
201414 Mar 2014: 982.5
201426 Dec 2014: 664.0
201516 Jan 2015: 701.0
20154 Sep 2015: 500.5
Steel Bars(per MT)
RM1,450 - RM1,550
Average Domestic Prices, 27 Nov 2015
Billets(per MT)
RM1,200 - RM1,300
CommodityCrude
Petroleum (per bbl)
Crude Palm Oil (per MT)
Sugar (per lbs.)
Rubber SMR 20(per MT)
Cocoa SMC 2
(per MT)
Coal(per MT)
Scrap Iron HMS
(per MT)4 Dec 2015
(US$) 40.0 552.5 15.5 1,176.0 2,052.6 46.5 190 (high)170 (low)
% change* 4.2 1.7 3.4 1.6 1.6 0.2 unchangedunchanged
2014i 54.6 - 107.6 823.3 352.3 1,718.3 2,615.8 59.8 370.0
2013i 88.1 - 108.6 805.5 361.6 2,390.8 1,933.1 .. 485.6
Commodity Prices
MITI Weekly Bulletin / www.miti.gov.my
“DRIVING Transformation, POWERING Growth”
Sources: Ministry of International Trade and Industry Malaysia, Malaysian Palm Oil Board, Malaysian Rubber Board, Malaysian Cocoa Board, Malaysian Pepper Board, Malaysian Iron and Steel Industry Federation, Bloomberg and Czarnikow Group, World Bank.
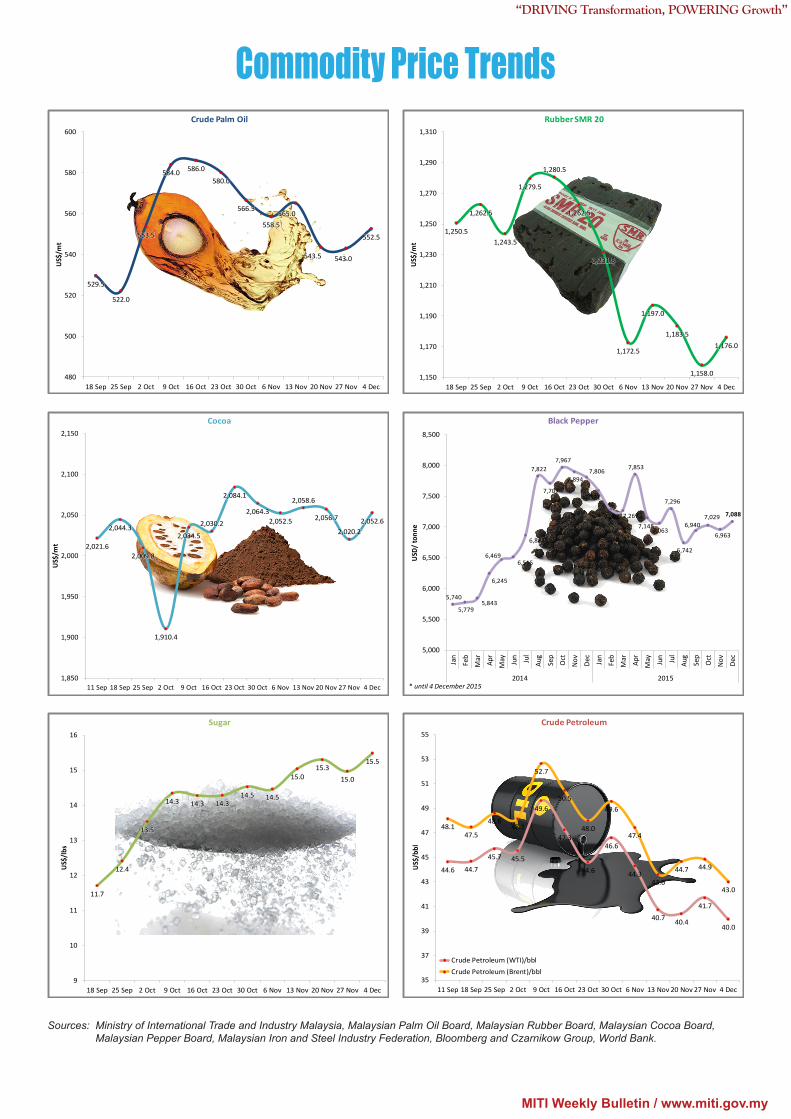
Commodity Price Trends
529.5
522.0
553.5
584.0 586.0
580.0
566.5
558.5565.0
543.5 543.0
552.5
480
500
520
540
560
580
600
18 Sep 25 Sep 2 Oct 9 Oct 16 Oct 23 Oct 30 Oct 6 Nov 13 Nov 20 Nov 27 Nov 4 Dec
US$
/mt
Crude Palm Oil
2,021.6
2,044.3
2,009.8
1,910.4
2,034.5
2,030.2
2,084.1
2,064.32,052.5
2,058.6
2,056.7
2,020.22,052.6
1,850
1,900
1,950
2,000
2,050
2,100
2,150
11 Sep 18 Sep 25 Sep 2 Oct 9 Oct 16 Oct 23 Oct 30 Oct 6 Nov 13 Nov 20 Nov 27 Nov 4 Dec
US$
/mt
Cocoa
11.7
12.4
13.5
14.3 14.3 14.314.5 14.5
15.015.3
15.0
15.5
9
10
11
12
13
14
15
16
18 Sep 25 Sep 2 Oct 9 Oct 16 Oct 23 Oct 30 Oct 6 Nov 13 Nov 20 Nov 27 Nov 4 Dec
US$
/lbs
Sugar
1,250.5
1,262.5
1,243.5
1,279.5
1,280.5
1,262.5
1,231.5
1,172.5
1,197.0
1,183.5
1,158.0
1,176.0
1,150
1,170
1,190
1,210
1,230
1,250
1,270
1,290
1,310
18 Sep 25 Sep 2 Oct 9 Oct 16 Oct 23 Oct 30 Oct 6 Nov 13 Nov 20 Nov 27 Nov 4 Dec
US$
/mt
Rubber SMR 20
5,740
5,779 5,843
6,245
6,469 6,515
6,864
7,822
7,707
7,967
7,894 7,806
7,591
7,286 7,267
7,853
7,148 7,063
7,296
6,742
6,940 7,029
6,963
7,088
5,000
5,500
6,000
6,500
7,000
7,500
8,000
8,500
Jan
Feb
Mar Apr
May Jun Jul
Aug
Sep
Oct
Nov
Dec
Jan
Feb
Mar Apr
May Jun Jul
Aug
Sep
Oct
Nov
Dec
2014 2015
USD
/ to
nne
Black Pepper
* until 4 December 2015
44.6 44.7
45.7 45.5
49.6
47.3
44.6
46.6
44.3
40.7 40.4
41.7
40.0
48.147.5
48.648.1
52.7
50.5
48.0
49.6
47.4
43.6
44.7 44.9
43.0
35
37
39
41
43
45
47
49
51
53
55
11 Sep 18 Sep 25 Sep 2 Oct 9 Oct 16 Oct 23 Oct 30 Oct 6 Nov 13 Nov 20 Nov 27 Nov 4 Dec
US$
/bbl
Crude Petroleum
Crude Petroleum (WTI)/bbl Crude Petroleum (Brent)/bbl
MITI Weekly Bulletin / www.miti.gov.my
“DRIVING Transformation, POWERING Growth”
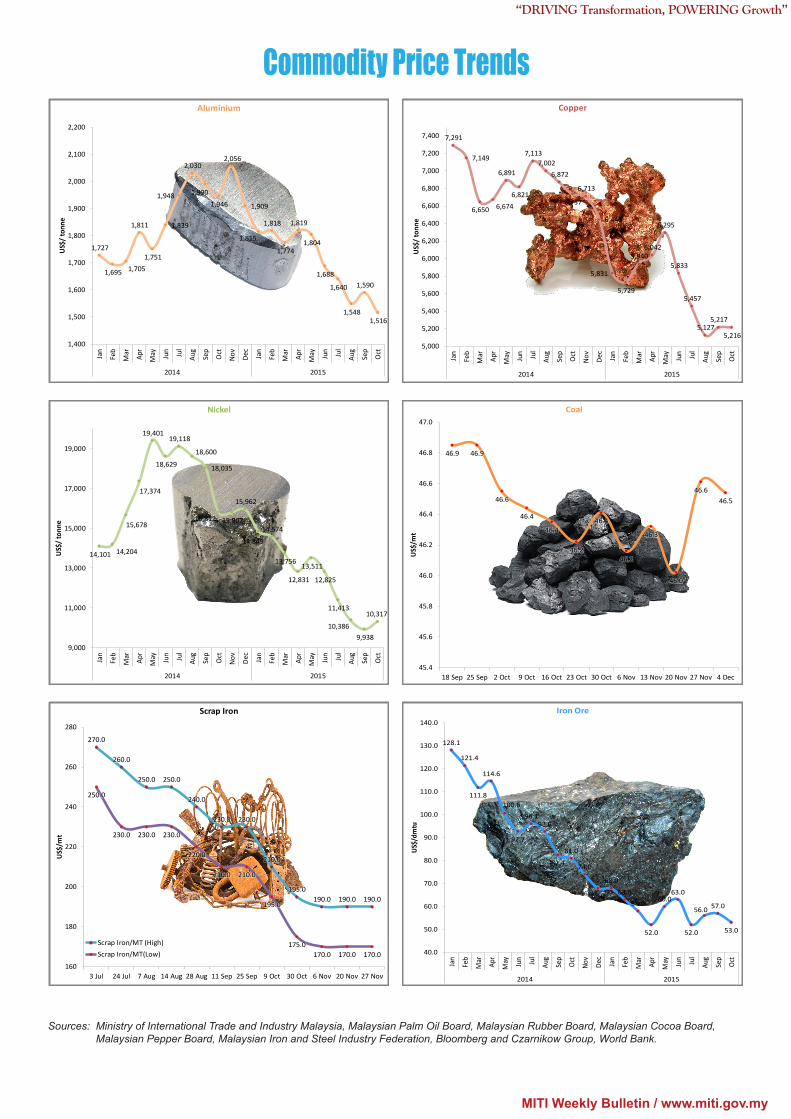
Sources: Ministry of International Trade and Industry Malaysia, Malaysian Palm Oil Board, Malaysian Rubber Board, Malaysian Cocoa Board, Malaysian Pepper Board, Malaysian Iron and Steel Industry Federation, Bloomberg and Czarnikow Group, World Bank.
Commodity Price Trends
1,727
1,695 1,705
1,811
1,751
1,839
1,948
2,030
1,990
1,946
2,056
1,909
1,815
1,818
1,774
1,819
1,804
1,688
1,640
1,548
1,590
1,516
1,400
1,500
1,600
1,700
1,800
1,900
2,000
2,100
2,200
Jan
Feb
Mar Apr
May Jun Jul
Aug
Sep
Oct
Nov
Dec
Jan
Feb
Mar Apr
May Jun Jul
Aug
Sep
Oct
2014 2015
US$
/ to
nne
Aluminium
14,101 14,204
15,678
17,374
19,401
18,629
19,118
18,600
18,035
15,812 15,807
15,962
14,849
14,574
13,756
12,831
13,511
12,825
11,413
10,386 9,938
10,317
9,000
11,000
13,000
15,000
17,000
19,000
Jan
Feb
Mar Apr
May Jun Jul
Aug
Sep
Oct
Nov
Dec
Jan
Feb
Mar Apr
May Jun Jul
Aug
Sep
Oct
2014 2015
US$
/ to
nne
Nickel
270.0
260.0
250.0 250.0
240.0
230.0 230.0
210.0
195.0190.0 190.0 190.0
250.0
230.0 230.0 230.0
220.0
210.0 210.0
195.0
175.0170.0 170.0 170.0
160
180
200
220
240
260
280
3 Jul 24 Jul 7 Aug 14 Aug 28 Aug 11 Sep 25 Sep 9 Oct 30 Oct 6 Nov 20 Nov 27 Nov
US$
/mt
Scrap Iron
Scrap Iron/MT (High) Scrap Iron/MT(Low)
7,291
7,149
6,650 6,674
6,891
6,821
7,113 7,002
6,872
6,737
6,713
6,446
5,831
5,729
5,940 6,042
6,295
5,833
5,457
5,127 5,217
5,216 5,000
5,200
5,400
5,600
5,800
6,000
6,200
6,400
6,600
6,800
7,000
7,200
7,400
Jan
Feb
Mar Apr
May Jun Jul
Aug
Sep
Oct
Nov
Dec
Jan
Feb
Mar Apr
May Jun Jul
Aug
Sep
Oct
2014 2015
US$
/ to
nne
Copper
46.9 46.9
46.6
46.4
46.4
46.2
46.4
46.2
46.3
46.0
46.646.5
45.4
45.6
45.8
46.0
46.2
46.4
46.6
46.8
47.0
18 Sep 25 Sep 2 Oct 9 Oct 16 Oct 23 Oct 30 Oct 6 Nov 13 Nov 20 Nov 27 Nov 4 Dec
US$
/mt
Coal
128.1
121.4
111.8
114.6
100.6
92.7
96.192.6
82.4
81.0
74.0
68.0
68.0
63.0
58.0
52.0
60.063.0
52.0
56.0 57.0
53.0
40.0
50.0
60.0
70.0
80.0
90.0
100.0
110.0
120.0
130.0
140.0
Jan
Feb
Mar Apr
May Jun Jul
Aug
Sep
Oct
Nov
Dec
Jan
Feb
Mar Apr
May Jun Jul
Aug
Sep
Oct
2014 2015
US$/
dmtu
Iron Ore
MITI Weekly Bulletin / www.miti.gov.my
“DRIVING Transformation, POWERING Growth”
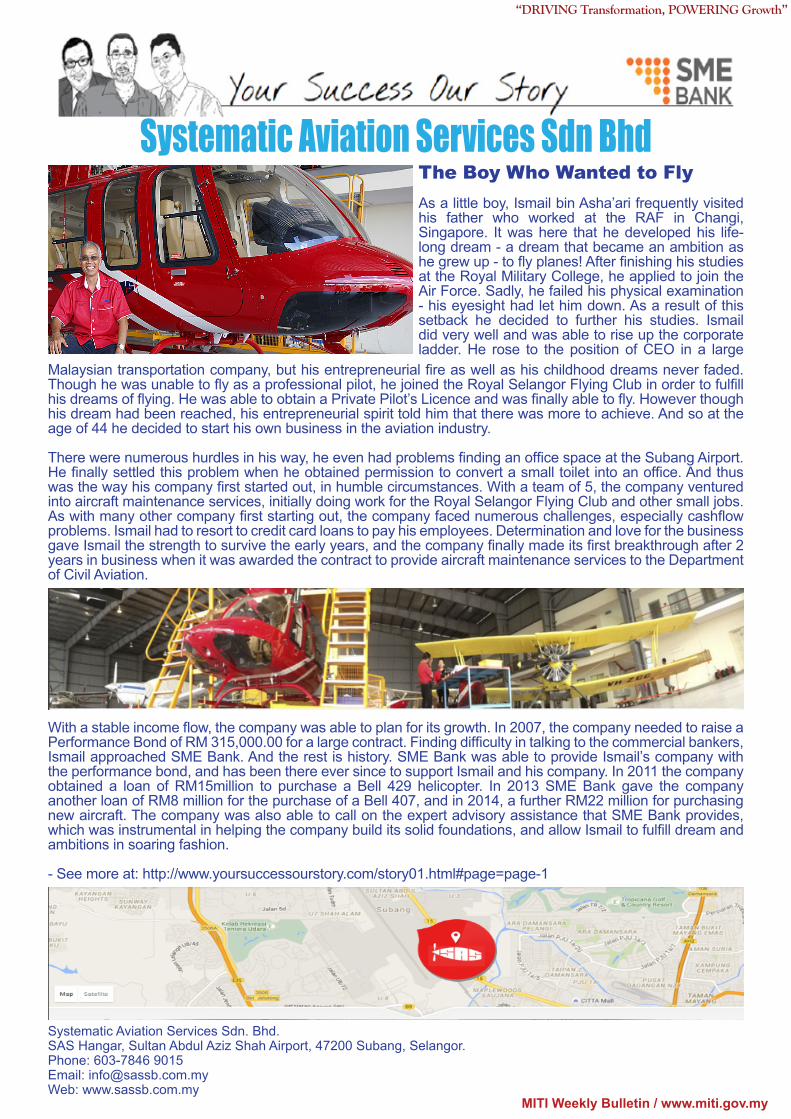
The Boy Who Wanted to FlyAs a little boy, Ismail bin Asha’ari frequently visited his father who worked at the RAF in Changi, Singapore. It was here that he developed his life-long dream - a dream that became an ambition as he grew up - to fly planes! After finishing his studies at the Royal Military College, he applied to join the Air Force. Sadly, he failed his physical examination - his eyesight had let him down. As a result of this setback he decided to further his studies. Ismail did very well and was able to rise up the corporate ladder. He rose to the position of CEO in a large
Systematic Aviation Services Sdn. Bhd.SAS Hangar, Sultan Abdul Aziz Shah Airport, 47200 Subang, Selangor.Phone: 603-7846 9015 Email: [email protected] Web: www.sassb.com.my
Systematic Aviation Services Sdn Bhd
Malaysian transportation company, but his entrepreneurial fire as well as his childhood dreams never faded. Though he was unable to fly as a professional pilot, he joined the Royal Selangor Flying Club in order to fulfill his dreams of flying. He was able to obtain a Private Pilot’s Licence and was finally able to fly. However though his dream had been reached, his entrepreneurial spirit told him that there was more to achieve. And so at the age of 44 he decided to start his own business in the aviation industry.
There were numerous hurdles in his way, he even had problems finding an office space at the Subang Airport. He finally settled this problem when he obtained permission to convert a small toilet into an office. And thus was the way his company first started out, in humble circumstances. With a team of 5, the company ventured into aircraft maintenance services, initially doing work for the Royal Selangor Flying Club and other small jobs. As with many other company first starting out, the company faced numerous challenges, especially cashflow problems. Ismail had to resort to credit card loans to pay his employees. Determination and love for the business gave Ismail the strength to survive the early years, and the company finally made its first breakthrough after 2 years in business when it was awarded the contract to provide aircraft maintenance services to the Department of Civil Aviation.
With a stable income flow, the company was able to plan for its growth. In 2007, the company needed to raise a Performance Bond of RM 315,000.00 for a large contract. Finding difficulty in talking to the commercial bankers, Ismail approached SME Bank. And the rest is history. SME Bank was able to provide Ismail’s company with the performance bond, and has been there ever since to support Ismail and his company. In 2011 the company obtained a loan of RM15million to purchase a Bell 429 helicopter. In 2013 SME Bank gave the company another loan of RM8 million for the purchase of a Bell 407, and in 2014, a further RM22 million for purchasing new aircraft. The company was also able to call on the expert advisory assistance that SME Bank provides, which was instrumental in helping the company build its solid foundations, and allow Ismail to fulfill dream and ambitions in soaring fashion.
- See more at: http://www.yoursuccessourstory.com/story01.html#page=page-1
MITI Weekly Bulletin / www.miti.gov.my
“DRIVING Transformation, POWERING Growth”
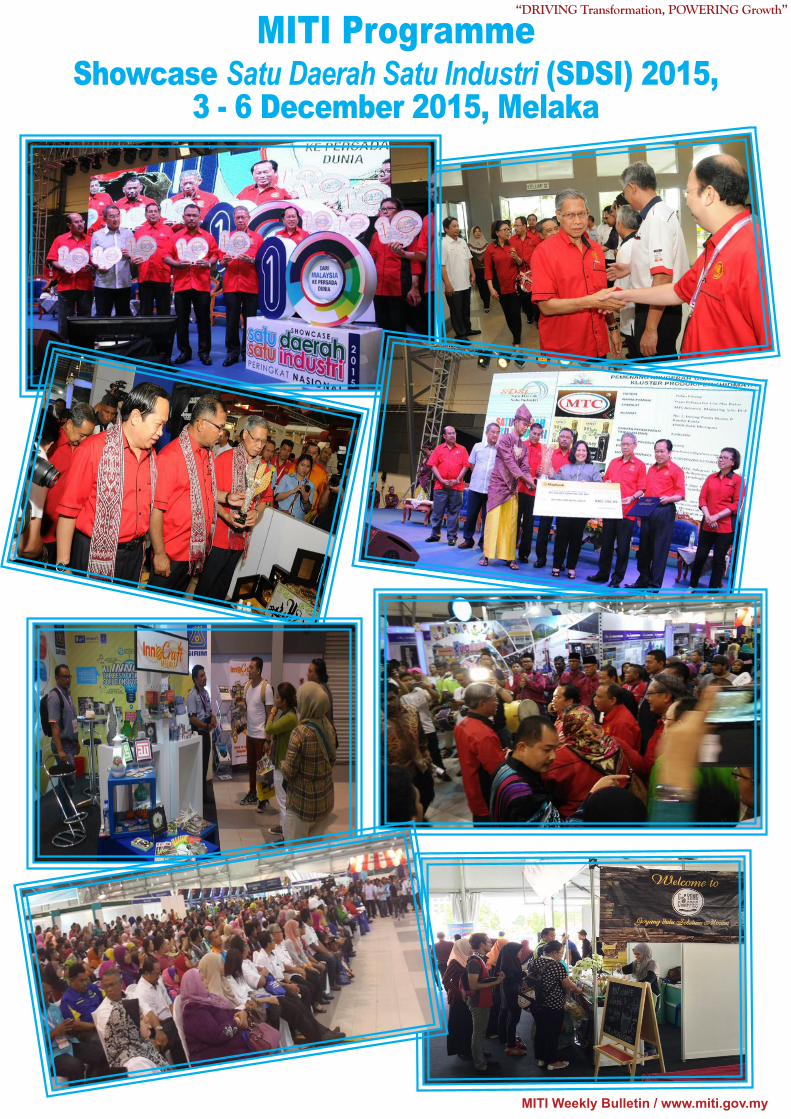
MITI ProgrammeShowcase Satu Daerah Satu Industri (SDSI) 2015,
3 - 6 December 2015, Melaka
MITI Weekly Bulletin / www.miti.gov.my
“DRIVING Transformation, POWERING Growth”
Comments & SuggestionsDear Readers,Kindly click the link below for any comments in this issue. MWB reserves the right to edit and to republish letters as reprints. http://www.miti.gov.my/index.php/forms/form/13
@ YOUR SERVICE
Name : Awang Hafifudin Bolkiah Awang Hasmadi Designation : Principal Assistant DirectorJob Description : Coordinate, strengthen and monitor initiatives /activities related to services sector development and liberalization Division : Services Sector DevelopmentContact No : 603-6200 0550Email : [email protected]
Name : Darshini Subramaniam Designation : Senior Assistant DirectorJob Description : Coordinate & monitor the implementation of policies & strategies related to the Environment, Technology & Innovation, Human Capital & Intellectual Property RightsDivision : Trade and Industry Related Emerging IssuesContact No : 603-6203 5726Email : [email protected]