MODUL EMaS JPNTrg - WordPress.com EMaS JPNTrg MODULE 5 BIOLOGY FORM 4 Chapter 8 : Dynamic Ecosystem...
17
Module 5 : Tutorial EMaS Biology 2007 1 Module Panels: 1. Tn. Haji Meli bin Hussin SM Sains K. Terengganu 2. En. Mohd Nor bin Ismail SMK Tun Telanai, Marang 3. En. Zulkifli bin Awang SMK Ibrahim Fikri, K. Terengganu 4. Pn.Hjh Muslimah Bt Mahmood SM Sains Sultan Mahmud , K. Terengganu 5. Pn. Hjh Rohayah Bt Md Nor SMK Sultan Mansor, K. Terengganu MODUL EMaS JPNTrg MODULE 5 BIOLOGY FORM 4 Chapter 8 : Dynamic Ecosystem Chapter 9 : Endangered Ecosystem
Transcript of MODUL EMaS JPNTrg - WordPress.com EMaS JPNTrg MODULE 5 BIOLOGY FORM 4 Chapter 8 : Dynamic Ecosystem...
Module 5 : Tutorial EMaS Biology 2007
MODUL EMaSJPNTrg
MODULE 5BIOLOGY FORM 4
Chapter 8 : DynamicEcosystem
Chapter 9 : Endangered
1
Module Panels:1. Tn. Haji Meli bin Hussin
SM Sains K. Terengganu2. En. Mohd Nor bin Ismail
SMK Tun Telanai, Marang3. En. Zulkifli bin Awang
SMK Ibrahim Fikri, K. Terengganu4. Pn.Hjh Muslimah Bt Mahmood
SM Sains Sultan Mahmud , K. Terengganu5. Pn. Hjh Rohayah Bt Md Nor
SMK Sultan Mansor, K. Terengganu
Ecosystem
Module 5 : Tutorial EMaS Biology 2007
2
CHAPTEBR 8 : DYNAMIC ECOSYSTEMCHAPTER 9 : ENDARGERED ECOSYSTEM
SECTION AInstruction: Each question is followed by four options A, B, C and D. Choose one correctanswer for each question.
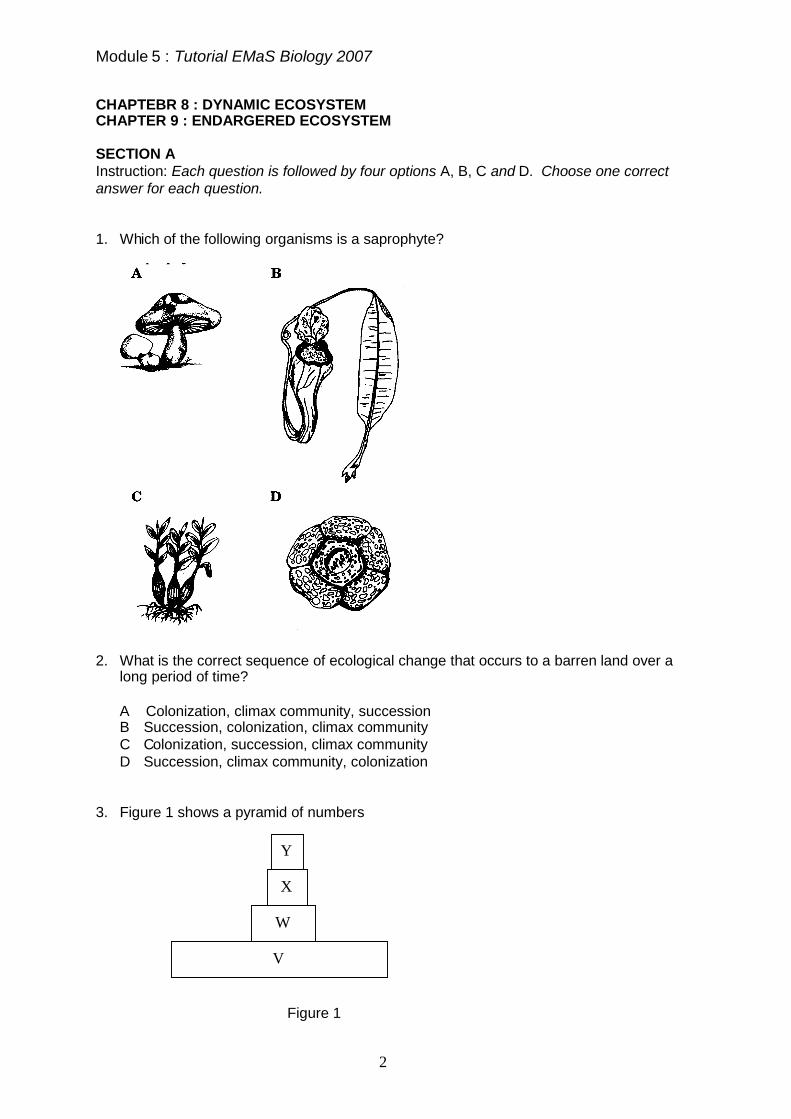
1. Which of the following organisms is a saprophyte?
2. What is the correct sequence of ecological change that occurs to a barren land over along period of time?
A Colonization, climax community, successionB Succession, colonization, climax communityC Colonization, succession, climax communityD Succession, climax community, colonization
3. Figure 1 shows a pyramid of numbers
Figure 1
V
W
X
Y
Module 5 : Tutorial EMaS Biology 2007
3
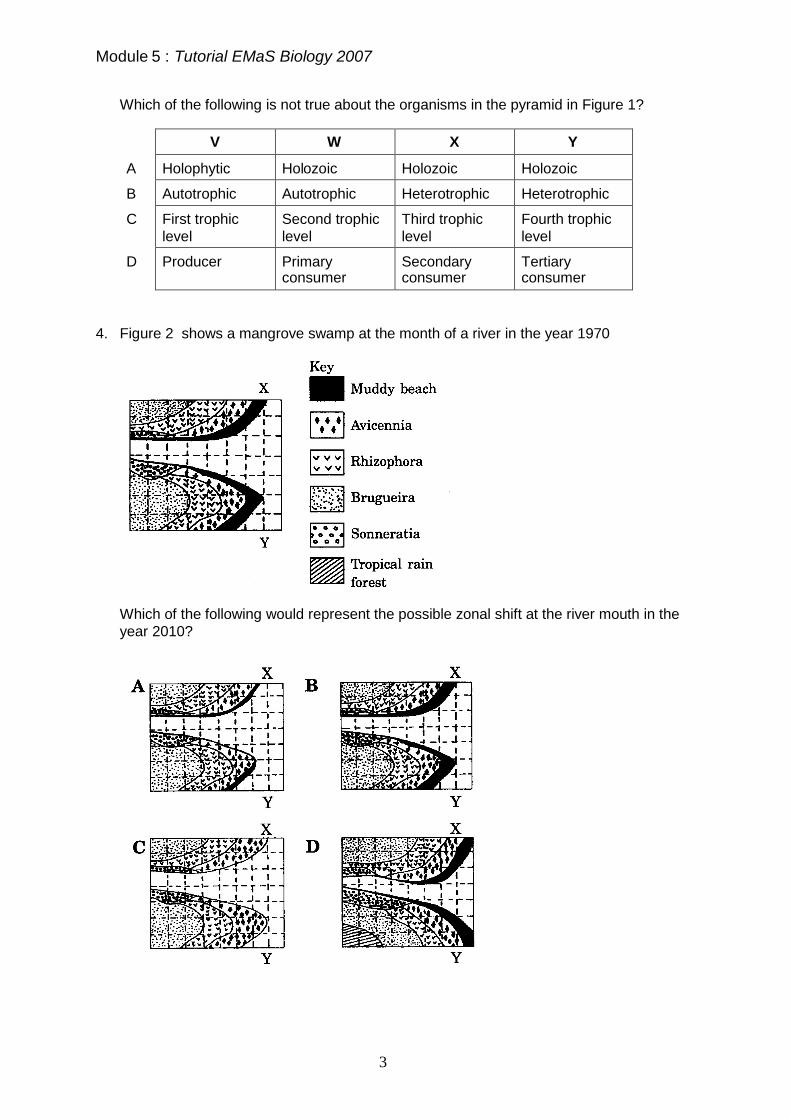
Which of the following is not true about the organisms in the pyramid in Figure 1?
V W X Y
A Holophytic Holozoic Holozoic Holozoic
B Autotrophic Autotrophic Heterotrophic Heterotrophic
C First trophiclevel
Second trophiclevel
Third trophiclevel
Fourth trophiclevel
D Producer Primaryconsumer
Secondaryconsumer
Tertiaryconsumer
4. Figure 2 shows a mangrove swamp at the month of a river in the year 1970
Which of the following would represent the possible zonal shift at the river mouth in theyear 2010?
Module 5 : Tutorial EMaS Biology 2007
4
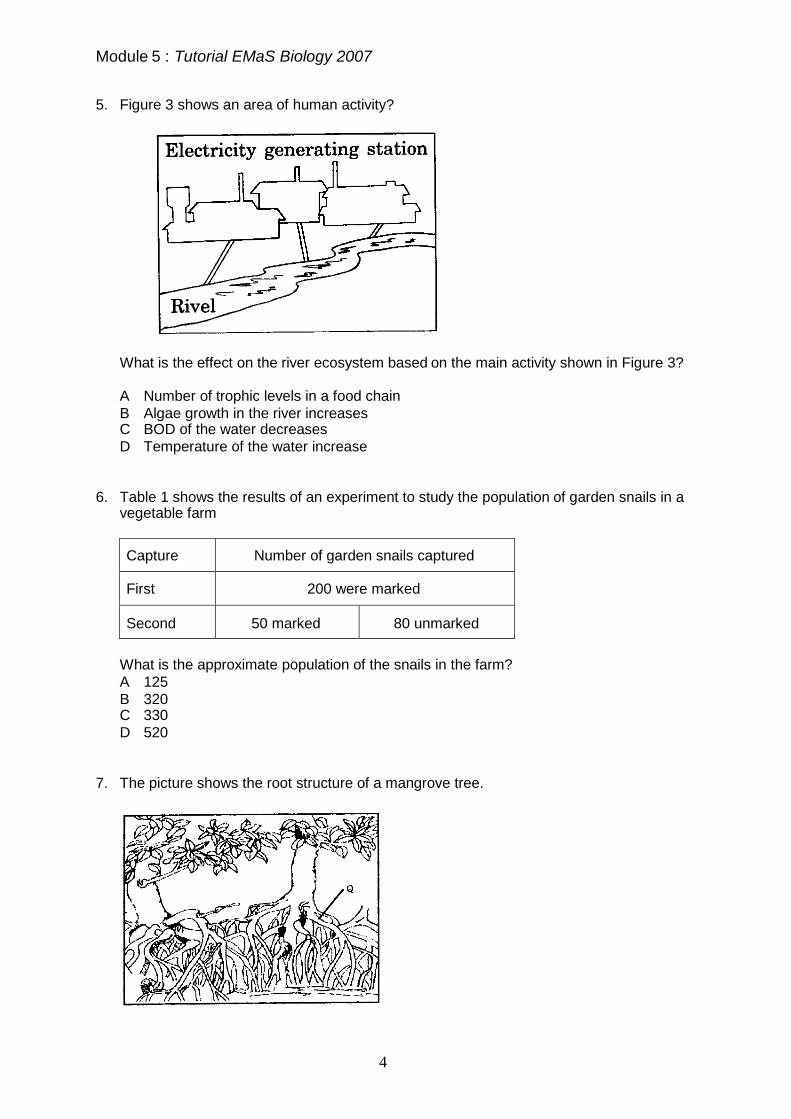
5. Figure 3 shows an area of human activity?
What is the effect on the river ecosystem based on the main activity shown in Figure 3?
A Number of trophic levels in a food chainB Algae growth in the river increasesC BOD of the water decreasesD Temperature of the water increase
6. Table 1 shows the results of an experiment to study the population of garden snails in avegetable farm
Capture Number of garden snails captured
First 200 were marked
Second 50 marked 80 unmarked
What is the approximate population of the snails in the farm?A 125B 320C 330D 520
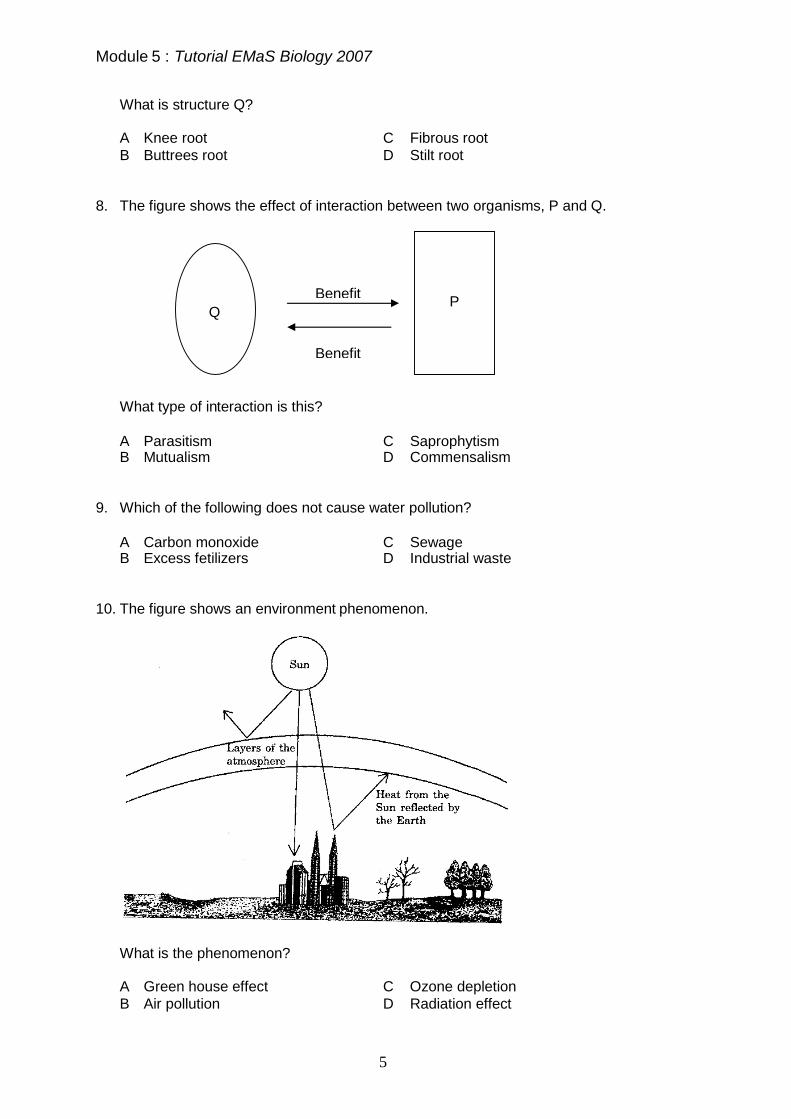
7. The picture shows the root structure of a mangrove tree.
Module 5 : Tutorial EMaS Biology 2007
What is structure Q?
A Knee root C Fibrous rootB Buttrees root D Stilt root
8. The figure shows the effect of interaction between two organisms, P and Q.
What type of interaction is this
A ParasitismB Mutualism
9. Which of the following does n
A Carbon monoxideB Excess fetilizers
10. The figure shows an environm
What is the phenomenon?
A Green house effectB Air pollution
Q
PBenefit5
?
C SaprophytismD Commensalism
ot cause water pollution?
C SewageD Industrial waste
ent phenomenon.
C Ozone depletionD Radiation effect
Benefit
Module 5 : Tutorial EMaS Biology 2007
6
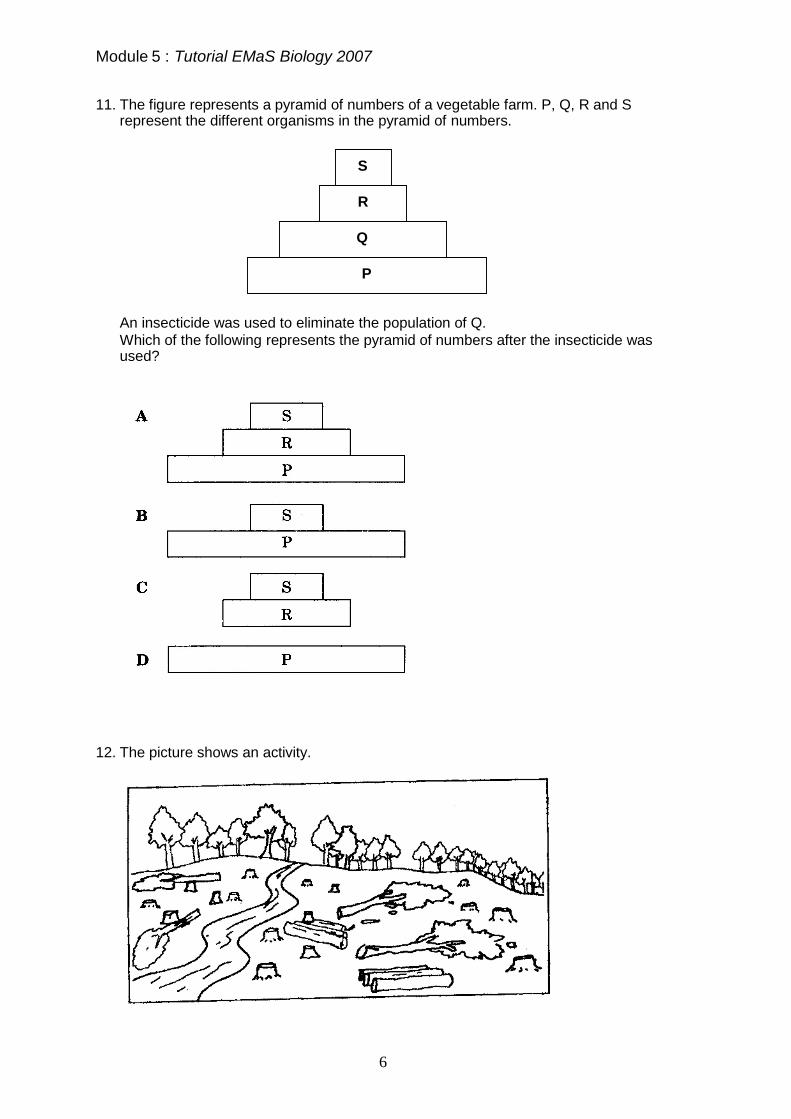
11. The figure represents a pyramid of numbers of a vegetable farm. P, Q, R and Srepresent the different organisms in the pyramid of numbers.
An insecticide was used to eliminate the population of Q.Which of the following represents the pyramid of numbers after the insecticide wasused?
12. The picture shows an activity.
P
Q
R
S
Module 5 : Tutorial EMaS Biology 2007
7
Which of the following are the effects of the activity?
I Flash floodII LandslideIII Global warmingIV Training of the ozone layer
A I, II and III onlyB I, II and IV onlyC II, III and IV onlyD I, II, III and IV
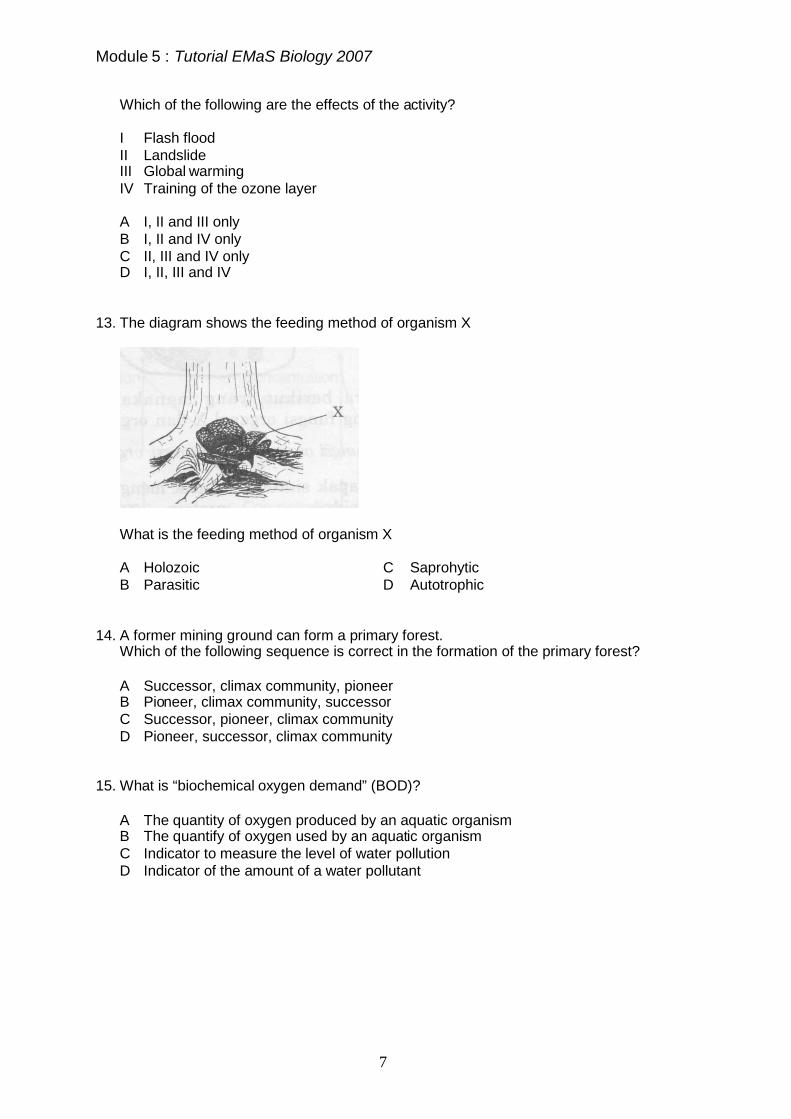
13. The diagram shows the feeding method of organism X
What is the feeding method of organism X
A Holozoic C SaprohyticB Parasitic D Autotrophic
14. A former mining ground can form a primary forest.Which of the following sequence is correct in the formation of the primary forest?
A Successor, climax community, pioneerB Pioneer, climax community, successorC Successor, pioneer, climax communityD Pioneer, successor, climax community
15. What is “biochemical oxygen demand” (BOD)?
A The quantity of oxygen produced by an aquatic organismB The quantify of oxygen used by an aquatic organismC Indicator to measure the level of water pollutionD Indicator of the amount of a water pollutant
Module 5 : Tutorial EMaS Biology 2007
8
16. The following information is about eutrophication.
Which of the following sequences is correct about the eutrophication process?
A S, P, Q, RB P, S, R, QC S, Q, R, PD Q, S, P, R
17. The increase in global temperature due to deforestation causes
I soil erosionII climatic changeIII air pollutionIV rise in sea level
A I and II onlyB II and IV onlyC I, II and IV onlyD II, III and IV only
18. The following information shows steps in reactions during the destruction of the ozonlayer.
Which of the following sequences of steps is correct during ozone destruction?
A P, R, Q, SB Q, P, R, SC R, P, Q, SD R, Q, P, S
P – Algae grow and cover the surface of the lakeQ – The rate of bacteria reproduction increasesR – BOD value increasesS – Organic fertilizer flows into the lake
P – Chlorine atom reacts with ozone to produce chlorine monoxide andoxygen molecules
Q – Free oxygen atom will break the chlorine monoxide bond
R – Ultra violet ray breaks the chlorine chemical bond in CFC to produce freechlorine atom
S – Free chlorine atom repeats the chain reaction
Module 5 : Tutorial EMaS Biology 2007
9
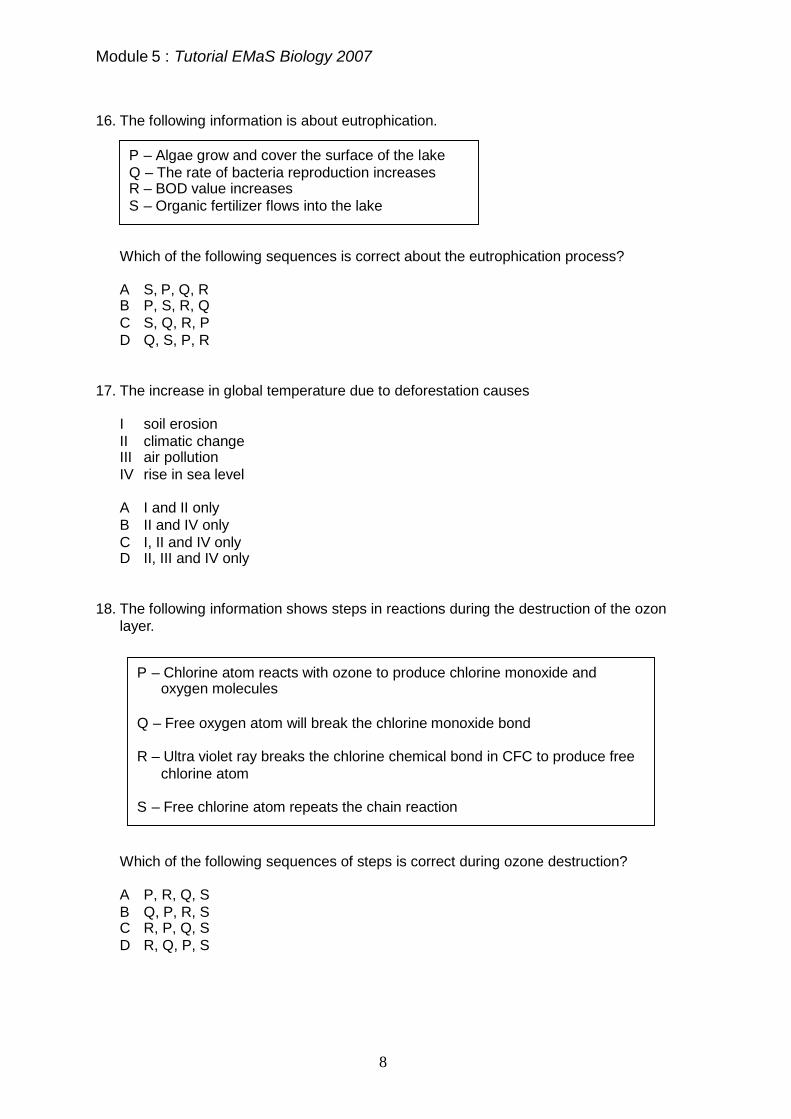
19. Diagram below show a crab with barnacles on its shell
What is the interaction between the crab and the barnacles?
A ParasitismB MutualismC SaprophytismD Commensalism
20. The following information is related to a process occurring in an ecosystem
The process is
A colonisationB competitionC successionD evolution
The pioneer species is replaced by a new species which is moreadapted to the habitat
The process occurs gradually over a long period of time The process ends with a climax community
Module 5 : Tutorial EMaS Biology 2007
10
SECTION B
Answer all questions in this section.
Watersource
Type of faunaBiochemicaloxygen demand(BOD)
Insectnymphs
Insectlarvae
Fish Worm(Tubifexsp)
JKLMN
531
NoneNone
3211
None
42
NoneNoneNone
NoneNoneNonePresentPresent
0-33-1010-1515-30>30
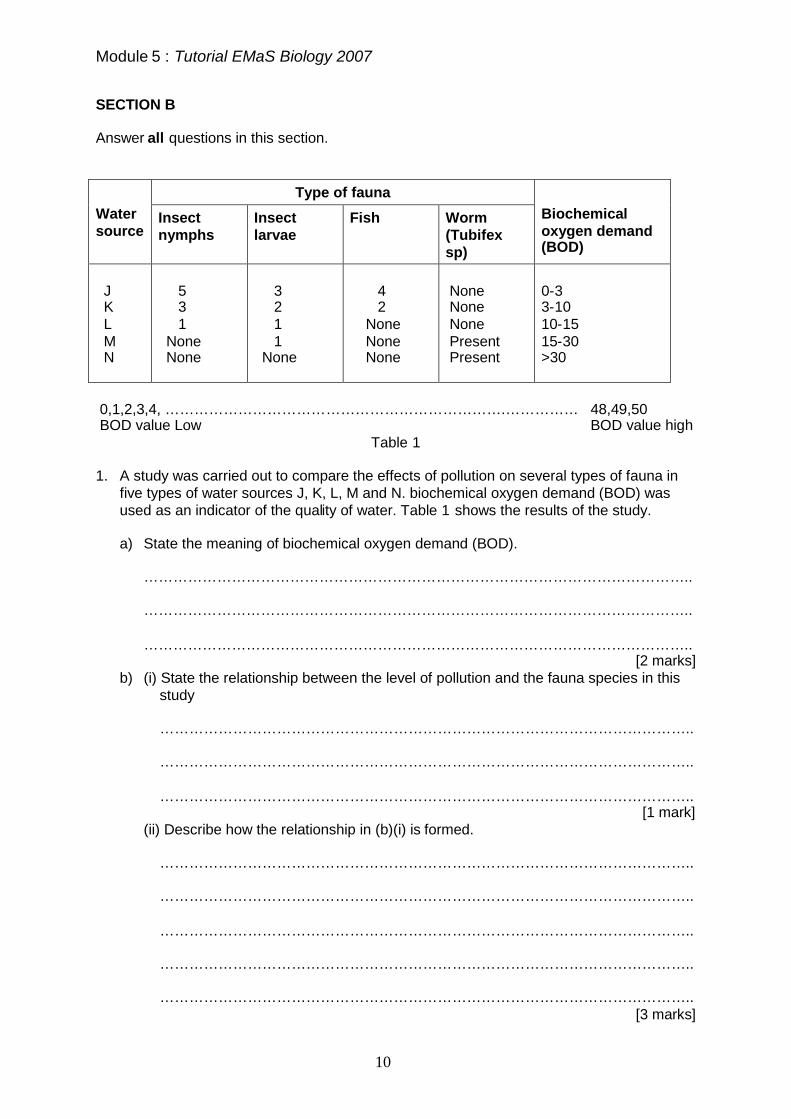
0,1,2,3,4, …………………………………………………………….…………… 48,49,50BOD value Low BOD value high
Table 1
1. A study was carried out to compare the effects of pollution on several types of fauna infive types of water sources J, K, L, M and N. biochemical oxygen demand (BOD) wasused as an indicator of the quality of water. Table 1 shows the results of the study.
a) State the meaning of biochemical oxygen demand (BOD).
…………………………………………………………………………………………………..
…………………………………………………………………………………………………..
…………………………………………………………………………………………………..[2 marks]
b) (i) State the relationship between the level of pollution and the fauna species in thisstudy
………………………………………………………………………………………………..
………………………………………………………………………………………………..
………………………………………………………………………………………………..[1 mark]
(ii) Describe how the relationship in (b)(i) is formed.
………………………………………………………………………………………………..
………………………………………………………………………………………………..
………………………………………………………………………………………………..
………………………………………………………………………………………………..
………………………………………………………………………………………………..[3 marks]
Module 5 : Tutorial EMaS Biology 2007
11
(iii) State one waste substance that cause the high BOD value in N.
……………………………………………………………………………………………….[1 mark]
c) (i) What is the other indicator that can be used to gauge the level of pollution in thefive sources of water in Table 2, if BOD is not used?
………………………………………………………………………………………………..
………………………………………………………………………………………………..[1 mark]
(ii) What conclusion can you make about the worm Tubifex sp. in Table 2?
……………………………………………………………………………………………….
……………………………………………………………………………………………….
……………………………………………………………………………………………….
……………………………………………………………………………………………….[2 marks]
d) Suggest two ways to increase the number of fauna species in N.
…………………………………………………………………………………………………..
…………………………………………………………………………………………………..
…………………………………………………………………………………………………..
…………………………………………………………………………………………………..
…………………………………………………………………………………………………..[2 marks]
Module 5 : Tutorial EMaS Biology 2007
12
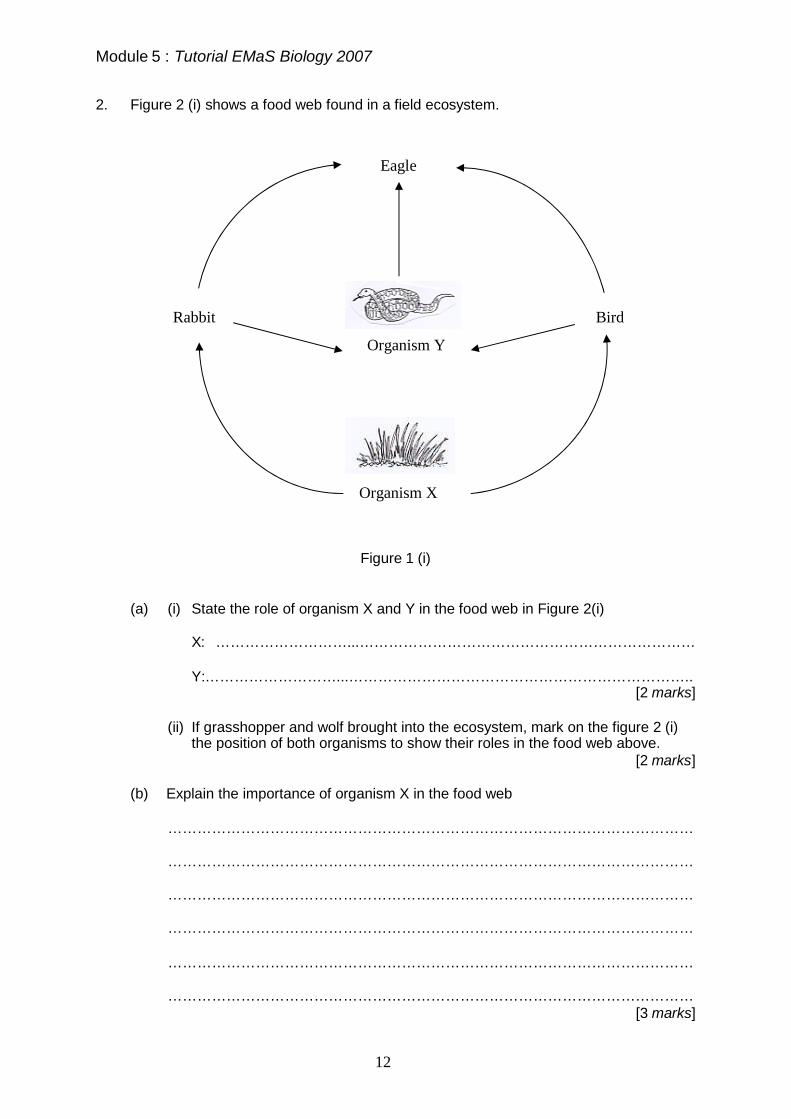
2. Figure 2 (i) shows a food web found in a field ecosystem.
Figure 1 (i)
(a) (i) State the role of organism X and Y in the food web in Figure 2(i)
X: ………………………...……………………………………………………………
Y:………………………...……………………………………………………………..[2 marks]
(ii) If grasshopper and wolf brought into the ecosystem, mark on the figure 2 (i)the position of both organisms to show their roles in the food web above.
[2 marks]
(b) Explain the importance of organism X in the food web
………………………………………………………………………………………………
………………………………………………………………………………………………
………………………………………………………………………………………………
………………………………………………………………………………………………
………………………………………………………………………………………………
………………………………………………………………………………………………[3 marks]
Rabbit
Eagle
Organism Y
Bird
Organism X
Module 5 : Tutorial EMaS Biology 2007
13
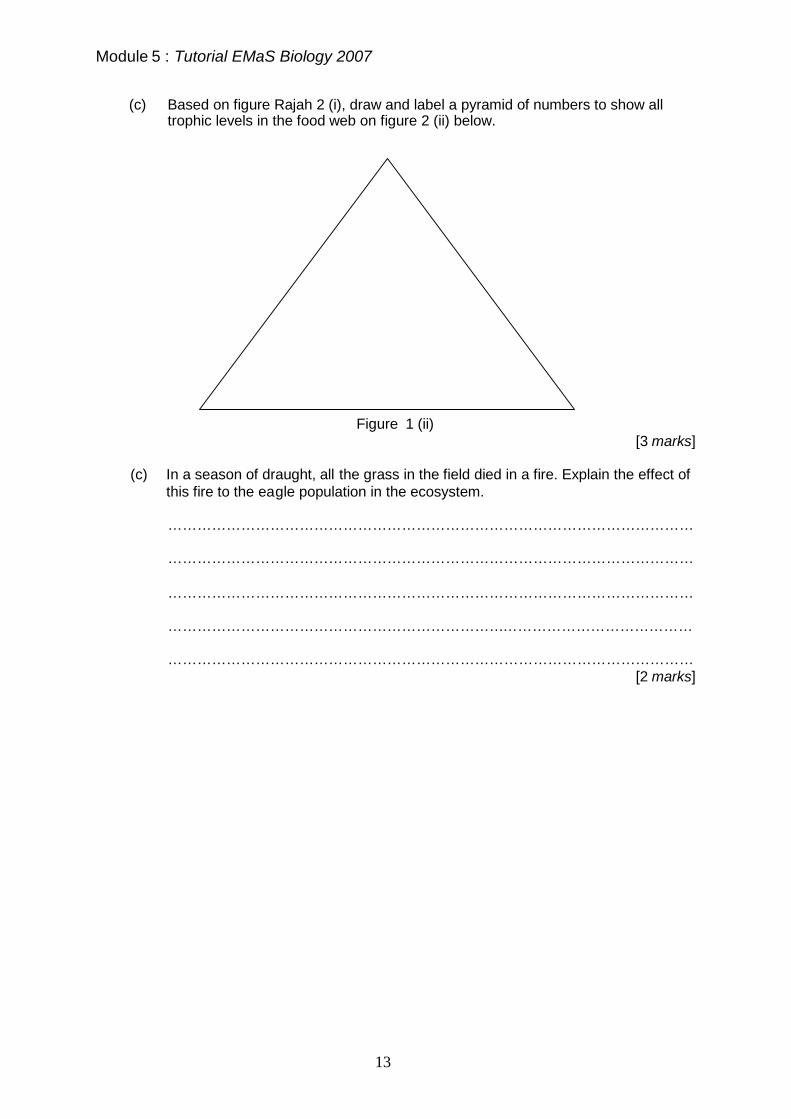
(c) Based on figure Rajah 2 (i), draw and label a pyramid of numbers to show alltrophic levels in the food web on figure 2 (ii) below.
Figure 1 (ii)[3 marks]
(c) In a season of draught, all the grass in the field died in a fire. Explain the effect ofthis fire to the eagle population in the ecosystem.
………………………………………………………………………………………………
………………………………………………………………………………………………
………………………………………………………………………………………………
………………………………………………………………………………………………
………………………………………………………………………………………………[2 marks]
Module 5 : Tutorial EMaS Biology 2007
14
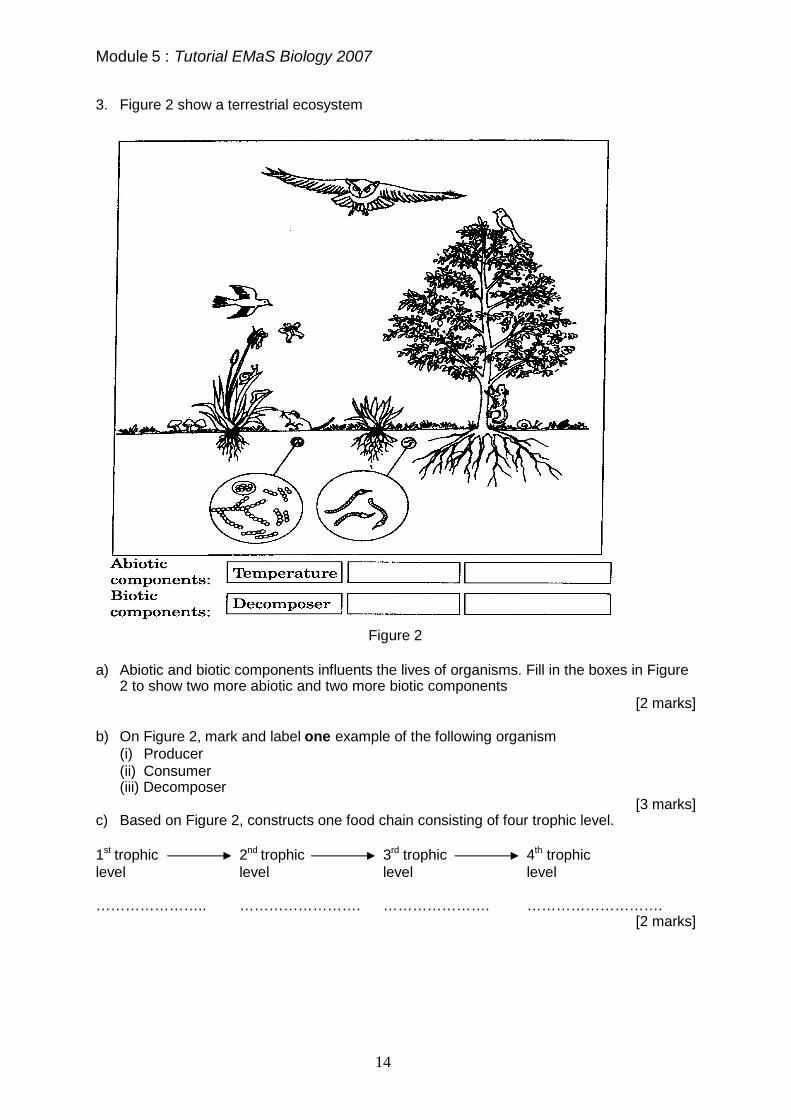
3. Figure 2 show a terrestrial ecosystem
Figure 2
a) Abiotic and biotic components influents the lives of organisms. Fill in the boxes in Figure2 to show two more abiotic and two more biotic components
[2 marks]
b) On Figure 2, mark and label one example of the following organism(i) Producer(ii) Consumer(iii) Decomposer
[3 marks]c) Based on Figure 2, constructs one food chain consisting of four trophic level.
1st trophic 2nd trophic 3rd trophic 4th trophiclevel level level level
………………….. ……………………. …………………. ……………………….[2 marks]
Module 5 : Tutorial EMaS Biology 2007
15
d) An organism in the 3rd trophic level in Figure 2 has decrease in number.
(i) Base on the food chain you have constructed in (c), suggest a way to increase thenumber of this organism again.
…………………………………………………………………………………………………..
…………………………………………………………………………………………………..[1 mark]
(ii) Explain your suggestion in (d)(i).
…………………………………………………………………………………………………..
…………………………………………………………………………………………………..
…………………………………………………………………………………………………..[2 marks]
e) The organism in the trophic level in Figure 2 absorbs 15 000 kJ solar energy. Energyloss at each trophic level is 90%.
Calculate the total every transferred to the organism in the 3rd trophic level.
= …………………………….kJ[2 marks]
Module 5 : Tutorial EMaS Biology 2007
16
SECTION C
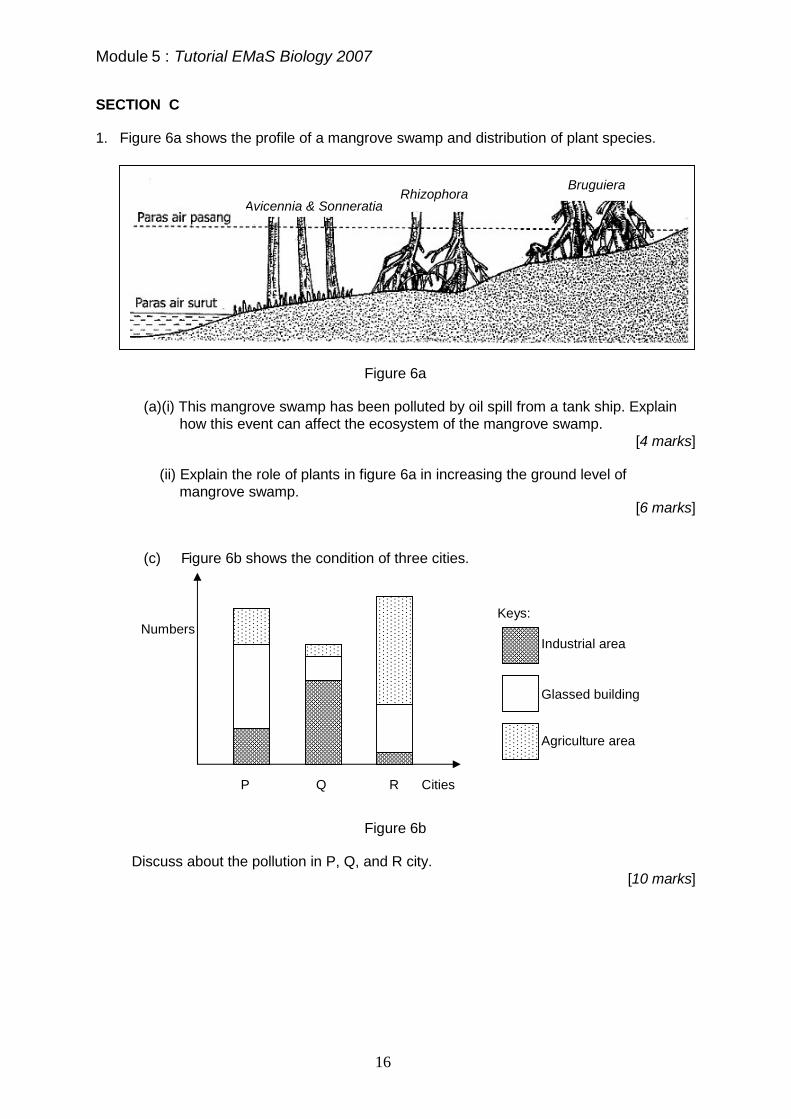
1. Figure 6a shows the profile of a mangrove swamp and distribution of plant species.
Figure 6a
(a)(i) This mangrove swamp has been polluted by oil spill from a tank ship. Explainhow this event can affect the ecosystem of the mangrove swamp.
[4 marks]
(ii) Explain the role of plants in figure 6a in increasing the ground level ofmangrove swamp.
[6 marks]
(c) Figure 6b shows the condition of three cities.
Figure 6b
Discuss about the pollution in P, Q, and R city.[10 marks]
Numbers
P Q R Cities
Keys:
Industrial area
Glassed building
Agriculture area
Avicennia & SonneratiaRhizophora
Bruguiera
Module 5 : Tutorial EMaS Biology 2007
17
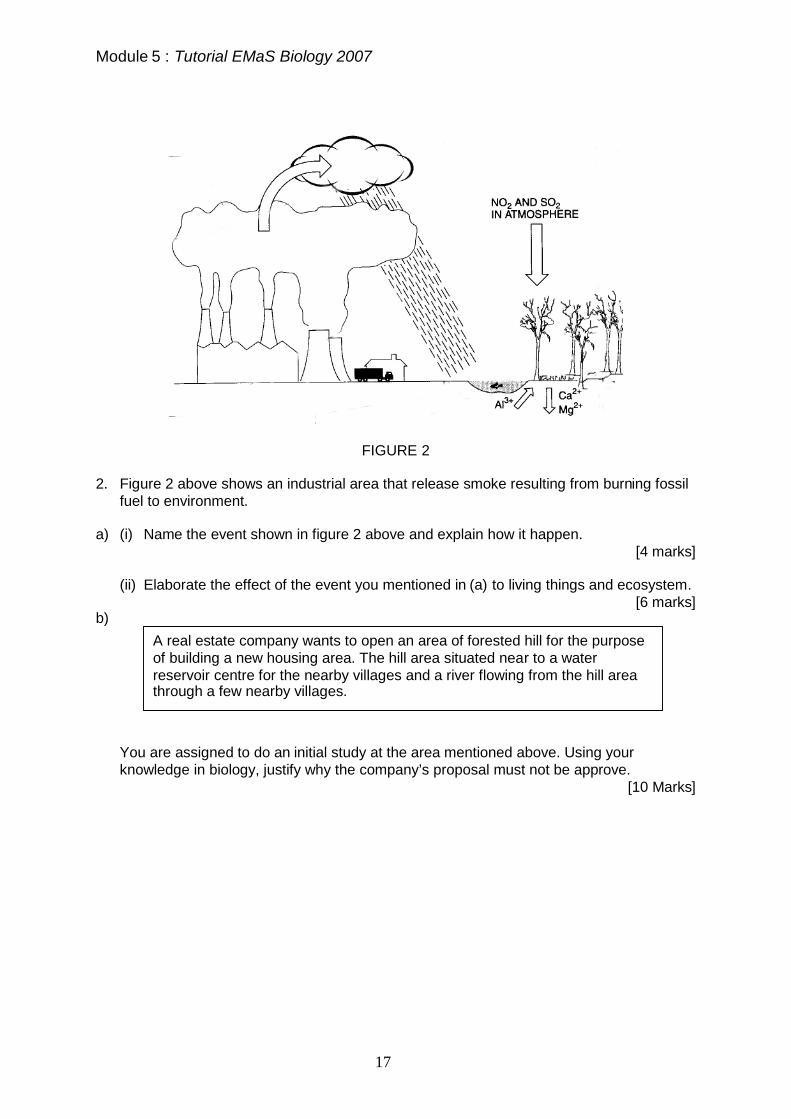
FIGURE 2
2. Figure 2 above shows an industrial area that release smoke resulting from burning fossilfuel to environment.
a) (i) Name the event shown in figure 2 above and explain how it happen.[4 marks]
(ii) Elaborate the effect of the event you mentioned in (a) to living things and ecosystem.[6 marks]
b)
You are assigned to do an initial study at the area mentioned above. Using yourknowledge in biology, justify why the company’s proposal must not be approve.
[10 Marks]
A real estate company wants to open an area of forested hill for the purposeof building a new housing area. The hill area situated near to a waterreservoir centre for the nearby villages and a river flowing from the hill areathrough a few nearby villages.