Muda River
154
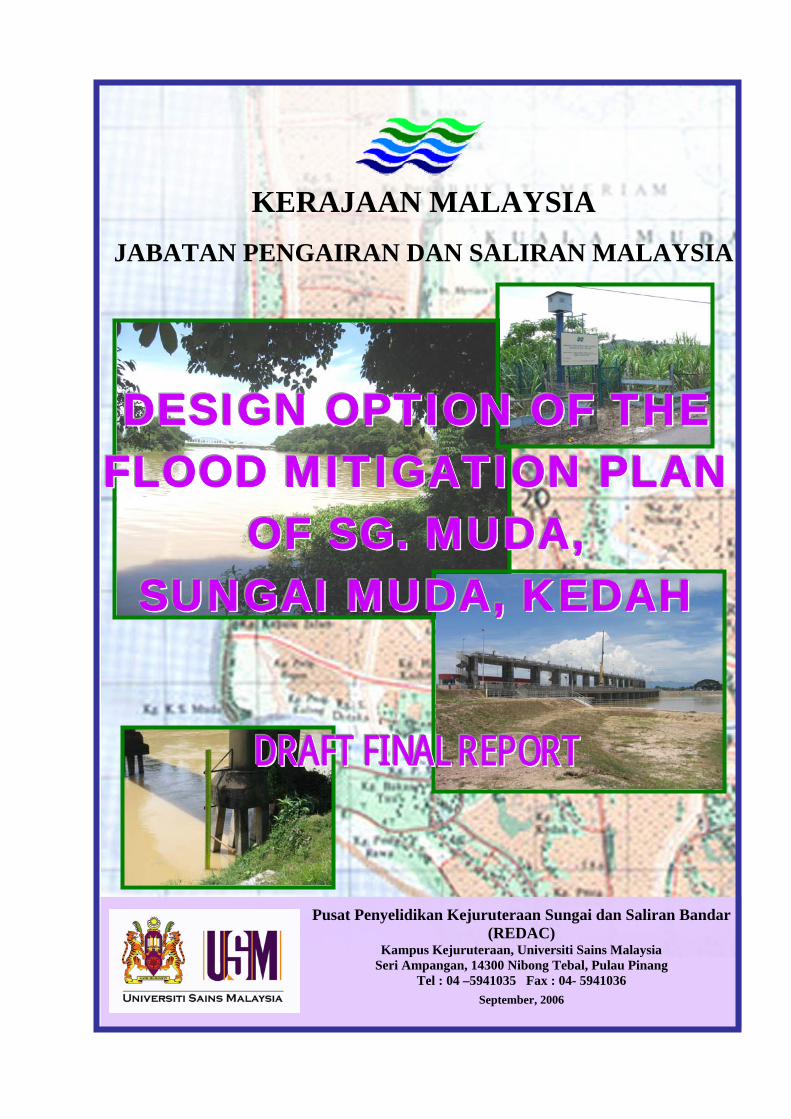
KERAJAAN MALAYSIA JABATAN PENGAIRAN DAN SALIRAN MALAYSIA Pusat Penyelidikan Kejuruteraan Sungai dan Saliran Bandar (REDAC) Kampus Kejuruteraan, Universiti Sains Malaysia Seri Ampangan, 14300 Nibong Tebal, Pulau Pinang Tel : 04 –5941035 Fax : 04- 5941036 September, 2006 D D D R R R A A A F F F T T T F F F I I I N N N A A A L L L R R R E E E P P P O O O R R R T T T D D D E E E S S S I I I G G G N N N O O O P P P T T T I I I O O O N N N O O O F F F T T T H H H E E E F F F L L L O O O O O O D D D M M M I I I T T T I I I G G G A A A T T T I I I O O O N N N P P P L L L A A A N N N O O O F F F S S S G G G . . . M M M U U U D D D A A A , , , S S S U U U N N N G G G A A A I I I M M M U U U D D D A A A , , , K K K E E E D D D A A A H H H
Transcript of Muda River
KERAJAAN MALAYSIA
JABATAN PENGAIRAN DAN SALIRAN MALAYSIA
Pusat Penyelidikan Kejuruteraan Sungai dan Saliran Bandar
(REDAC) Kampus Kejuruteraan, Universiti Sains Malaysia
Seri Ampangan, 14300 Nibong Tebal, Pulau Pinang Tel : 04 –5941035 Fax : 04- 5941036
September, 2006
DDDRRRAAAFFFTTT FFFIIINNNAAALLL RRREEEPPPOOORRRTTT
DDDEEESSSIIIGGGNNN OOOPPPTTTIIIOOONNN OOOFFF TTTHHHEEE FFFLLLOOOOOODDD MMMIIITTTIIIGGGAAATTTIIIOOONNN PPPLLLAAANNN
OOOFFF SSSGGG... MMMUUUDDDAAA,,, SSSUUUNNNGGGAAAIII MMMUUUDDDAAA,,, KKKEEEDDDAAAHHH
KERAJAAN MALAYSIA
JABATAN PENGAIRAN DAN SALIRAN MALAYSIA DESIGN OPTION OF THE FLOOD MITIGATION PLAN
OF SG. MUDA, SUNGAI MUDA, KEDAH
Draft Final Report September, 2006
Prepared by :
Prof. Pierre Y. Julien (Colorado State University, USA)
Prof. Madya Dr. Aminuddin Ab. Ghani
Prof Dr. Nor Azazi Zakaria
Prof. Madya Dr. Rozi Abdullah
Chang Chun Kiat
Rosmaliza Ramli
Joseph Dinor
Asnol Adzhan Abd. Manap
Mohd Fazly Yusof
Pusat Penyelidikan Kejuruteraan Sungai dan Saliran Bandar (REDAC) Kampus Kejuruteraan, Universiti Sains Malaysia Seri Ampangan, 14300 Nibong Tebal, Pulau Pinang, Malaysia.
PENGHARGAAN Pihak Juruperunding ingin mengucapkan setinggi-tinggi penghargaan kepada :
BAHAGIAN TEBATAN BANJIR JABATAN PENGAIRAN DAN SALIRAN MALAYSIA
BAHAGIAN HIDROLOGI DAN SUMBER AIR
JABATAN PENGAIRAN DAN SALIRAN MALAYSIA
JABATAN PENGAIRAN DAN SALIRAN NEGERI KEDAH DARUL AMAN
JABATAN PENGAIRAN DAN SALIRAN
NEGERI PULAU PINANG
JABATAN PENGAIRAN DAN SALIRAN RANCANGAN TEBATAN BANJIR SUNGAI MUDA
USAINS HOLDING SDN. BHD.
UNIVERSITI SAINS MALAYSIA di atas segala kerjasama yang diberikan semasa projek ini dijalankan. Pusat Penyelidikan Kejuruteraan Sungai dan Saliran Bandar (REDAC) Kampus Kejuruteraan, Universiti Sains Malaysia Seri Ampangan, 14300 Nibong Tebal, Pulau Pinang, Malaysia.
DESIGN OPTION OF THE FLOOD MITIGATION PLAN OF SG. MUDA, SUNGAI MUDA, KEDAH
CONTENTS
Page EXECUTIVE SUMMARY v CHAPTER 1 INTRODUCTION 1
1.1 Background 1 1.2 Objectives 1 1.3 Scope of Work 2
CHAPTER 2 SITE VISITS AND RECENT FLOODS 3
2.1 Site Observations 3 2.2 Rainfall Distribution 11 2.3 Flood Frequency Analysis 13
CHAPTER 3 PAST STUDIES OF SG. MUDA 17 3.1 JICA (1995) 17 3.1.1 Objectives of the Study 17 3.1.2 Study Area 18 3.1.3 Climate 18 3.1.4 River Morphology 19 3.1.1.1 River System 19 3.1.1.2 River Channel Profile 19 3.1.1.3 Channel Flow Capacity 20 3.1.1.4 River Water Quality 20 3.1.1.5 River Flow Regime 23 3.1.1.6 Riverbed Material 24 3.1.1.7 River Bed Load 24 3.1.1.8 Fauna and Flora 24 3.1.5 Flood Prone Areas and Types of Flood 26 3.1.5.1 Maximum Flood Recorded 26 3.1.5.2 Probable Rainfall and Probable Flood Runoff Discharge 27 3.1.5.3 Existing Flood Mitigation Facilities 29 3.1.5.4 River Sand Mining 30
i
3.2 Abdullah (2002) 64 3.2.1 Study Reach 64 3.2.2 Hydrological data 64 3.2.3 Field Data Collections 65 3.3 JPZ (2000) 75 3.3.1 Configuration of Flood Mitigation Alternatives 75 3.3.2 Selection of Flood Mitigation Alternative 75 CHAPTER 4 HYDROLOGICAL MODELLING 81
4.1 HEC-HMS Modelling 81
4.1.1 Hydrological Data 81 4.1.2 Rainfall 81 4.1.3 Water Level and Streamflow 81 4.1.4 Calibration and Validation 83 4.1.5 Design Hydrographs 90
4.2 HEC-RAS Modelling 94 4.2.1 Introduction 94 4.2.2 Geometry Data 95 4.2.3 Stage Hydrograph Data 95 4.2.4 Hydrograph 95 4.2.5 Calibration 96 4.2.6 Simulation 103
CHAPTER 5 RIVER MODELLING 105 5.1 River Sediment Data Collection 105 5.2 Flow Discharge and Sediment Load Measurements 109 5.3 Sediment Transport Modelling 114 5.3.1 Geometry Data 114 5.3.2 Tidal Record 115 5.3.3 S-Curve 116 5.3.4 Hydrograph 117 5.3.5 Calibration 117 5.3.6 Simulation 119 CHAPTER 6 PROPOSED DESIGN CRITERIA 125 6.1 Regional Storage 125 6.2 Natural River Design 129 6.2.1 Review of the Rainfall Data 129 6.2.2 Runoff Discharge and Stage Records 130 6.2.3 Changes in Alluvial River Geometry 132 6.2.4 Design Criteria for the Flood Control Remediation Plan 135 6.2.5 Summary of Specific Design of the Proposed Structures 142
ii

CHAPTER 7 CONCLUSIONS AND RECOMMENDATIONS 145 7.1 Conclusions 145 7.2 Recommendations 147 REFERENCES 149
iii
Executive Summary USAINS HOLDING Sdn Bhd through River Engineering and Urban Drainage Research Centre (REDAC) has been appointed by Jabatan Pengairan dan Saliran Malaysia to carry out DESIGN OPTION OF THE FLOOD MITIGATION PLAN OF SG. MUDA, SUNGAI MUDA, KEDAH beginning 1 April 2006 for a period of six months. The Draft Final Report presents seven chapters as follows:
CHAPTER 1 INTRODUCTION CHAPTER 2 SITE VISITS AND RECENT FLOODS CHAPTER 3 PAST STUDIES OF SG. MUDA CHAPTER 4 HYDROLOGICAL MODELLING CHAPTER 5 RIVER MODELLING CHAPTER 6 PROPOSED DESIGN CRITERIA CHAPTER 7 CONCLUSIONS
The Flood Control Remediation Plan (FCRP) of Sg Muda has been reviewed with the perspective to possibly enhance the proposed design. The objectives of this review are to: (1) ensure that design cross-sections and alignment of the main river channel are economic, effective and environmentally sound; (2) propose alternative designs for identified locations to meet the above requirements; and (3) examine the long term river behaviour through model studies to minimise expensive repair works in future resulting from the new alignment. The current bund height proposed by JPZ is based on a 50 year ARI design discharge of 1,815 cumecs plus freeboard. This design is found to be highly conservative and will pass flows with period of return far in excess of 100 years. The main conclusion of this review is that the design of the bund height should be based on the 2003 flood discharge of 1,340 cumecs plus a one meter freeboard. The proposed channel widening in Alternative 2 of the JPZ report also appears not to be necessary. If retained, channel widening should correspond to significant lowering of the bund height. A plan to address the sand and gravel mining issues on Sg Muda is also strongly recommended to ensure: (1) stability of the proposed river bank protection structures; (2) stability of the bridge piers at Ladang Victoria; and (3) operations of irrigation pumping stations. Channel realignment is proposed at two sites to increase flood conveyance and further lower the proposed bund height. In-stream mining should not
v

be allowed between Ladang Victoria and the Muda barrage. Off-stream mining at a minimum distance of 50 m from the river bank should be permitted instead. With a design discharge reduction of 25%, this study shows the potential for very significant cost savings of this FCRP for Sg. Muda. A more detailed analysis of the reduced bund elevation should include the effects of the reduced design flood discharge and the proposed realignment. Channel widening is not recommended, but if retained, the bund heights should be lowered accordingly. The details on the locations and sand mining volumes extractable from off-stream mining activities should be examined.
vi
Chapter 1 Introduction 1.1 Background Urbanization normally brings about an increase in the discharge of a river due to increase in impervious areas. As a result, the sediment transporting capacity of the river also increases causing changes to the river equilibrium. Recurrence of flooding has been linked to the high rate of sedimentation in the river channel. Failures of bank protection structures frequently occur during and after the construction of a flood mitigation project. Causes of the failures are numerous and river bed degradation or erosion resulting in the instability of the structures in a river is the pertinent one. Erosion and sedimentation in rivers involve a dynamic process resulting from the interaction between the flowing water and sediment bed. An understanding of this interaction which causes sediment movement and hence cross-sectional changes is important to control the erosion and sedimentation within allowable limits to ensure the stability of the river channel.
1.2 Objectives Sg. Muda experiences floods almost every year, each differing only in their magnitude. The October 2003 flood saw 45,000 people affected with catastrophic damages. At the upstream end of Sg. Muda is the Muda dam which acts as an extra storage for the Pedu dam. The two dams are part of the MUDA irrigation scheme. With the northern states being a water deficit area, the first flood mitigation option was to increase the storage volume of Muda dam. This idea however, was not well received by Kedah state government. Therefore the next best option is the rapid conveyance of the flood water into the sea. The valley or flood plain is part of the river system. Over the years, large numbers of inhabitants have encroached into the flood plain. To make matters worse many of the dwellings are built close to the river. Sg Muda is also a major source of sand for the northern region. A study by JICA in 1995 showed that total sand being excavated from the river from more than 100 mining locations far exceeded the total yield of sand by the river (in the region of 100 times). As such the river bed had severely degraded throughout its length with many stretches of river banks also badly eroded.
1
The government requires consultancy services to carry out a review study of the on-going Sg. Muda flood mitigation project to achieve the following objectives: (i) Ensure that design cross-sections and alignment of the main river channel
are economic, effective and environmentally sound; (ii) Propose alternative designs for identified locations to meet the above
requirements; (iii) Examine the long term river behaviour through model studies, to minimise
expensive repair works in future resulting from the new alignment. 1.3 Scope of Work The Consultant shall conduct a review of the following: (a) Rainfall data in space and time leading to chosen flood events. (b) Runoff discharge and stage records of the chosen events; (c) Computer simulation of the flood events; (d) Computer simulation of long term river behavior to determine stretches prone to
meandering, hence needing extra protection; (e) Changes in alluvial river geometry in terms of aggradation and degradation as
well as lateral channel migration as a result of the flood events; (f) Design criteria used for the Flood Control Remediation Plan; and (g) Specific design of the proposed structures including levee protection, riverbank
protection works and protection of bridge crossings and other structures.
2
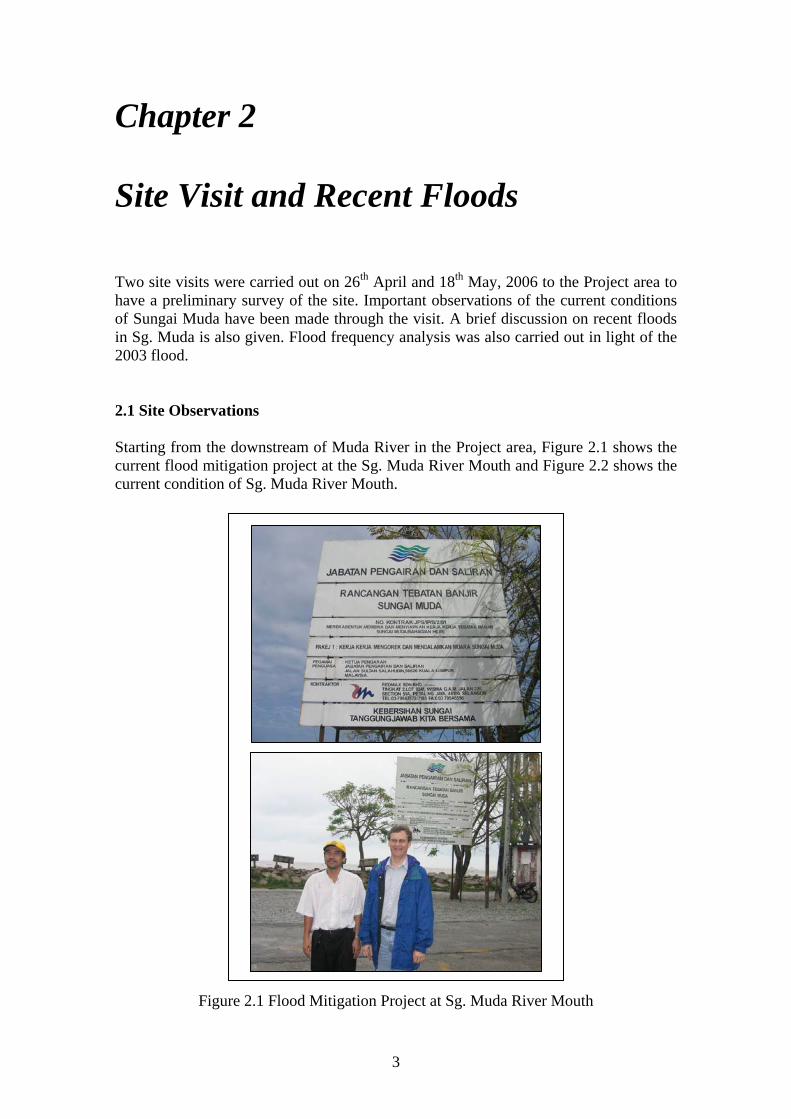
Chapter 2 Site Visit and Recent Floods Two site visits were carried out on 26th April and 18th May, 2006 to the Project area to have a preliminary survey of the site. Important observations of the current conditions of Sungai Muda have been made through the visit. A brief discussion on recent floods in Sg. Muda is also given. Flood frequency analysis was also carried out in light of the 2003 flood. 2.1 Site Observations Starting from the downstream of Muda River in the Project area, Figure 2.1 shows the current flood mitigation project at the Sg. Muda River Mouth and Figure 2.2 shows the current condition of Sg. Muda River Mouth.
Figure 2.1 Flood Mitigation Project at Sg. Muda River Mouth
3
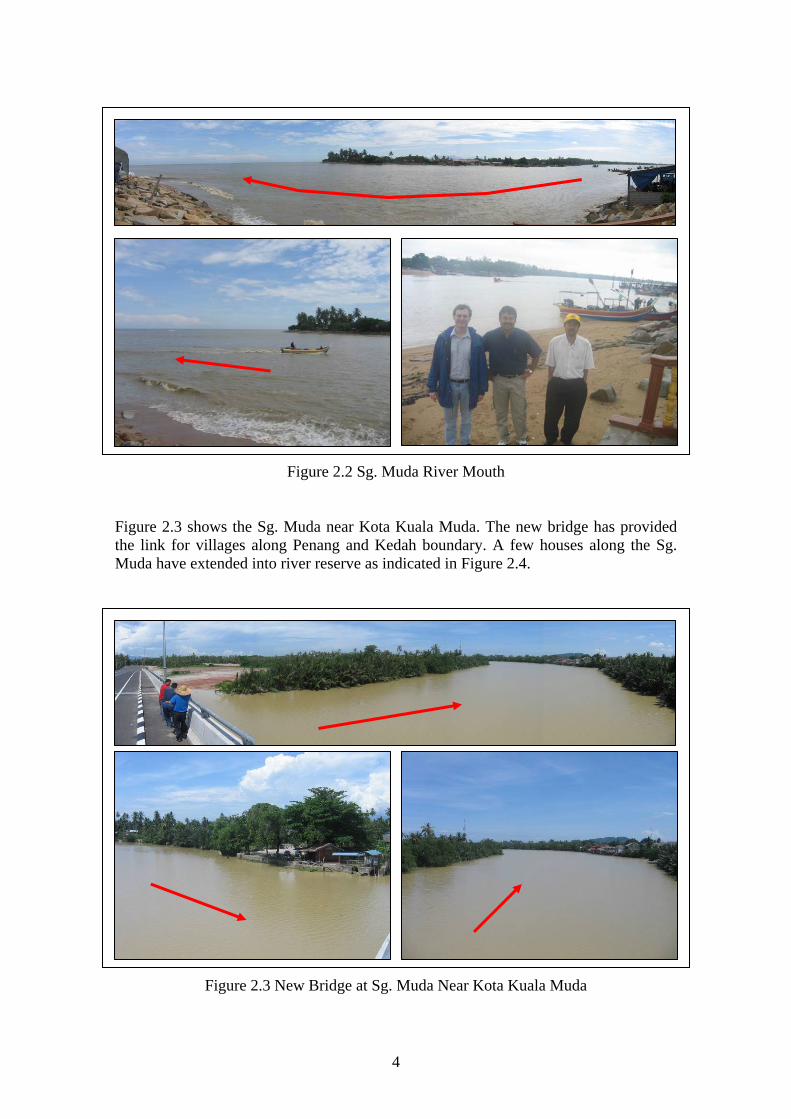
Figure 2.2 Sg. Muda River Mouth
Figure 2.3 shows the Sg. Muda near Kota Kuala Muda. The new bridge has provided the link for villages along Penang and Kedah boundary. A few houses along the Sg. Muda have extended into river reserve as indicated in Figure 2.4.
Figure 2.3 New Bridge at Sg. Muda Near Kota Kuala Muda
4
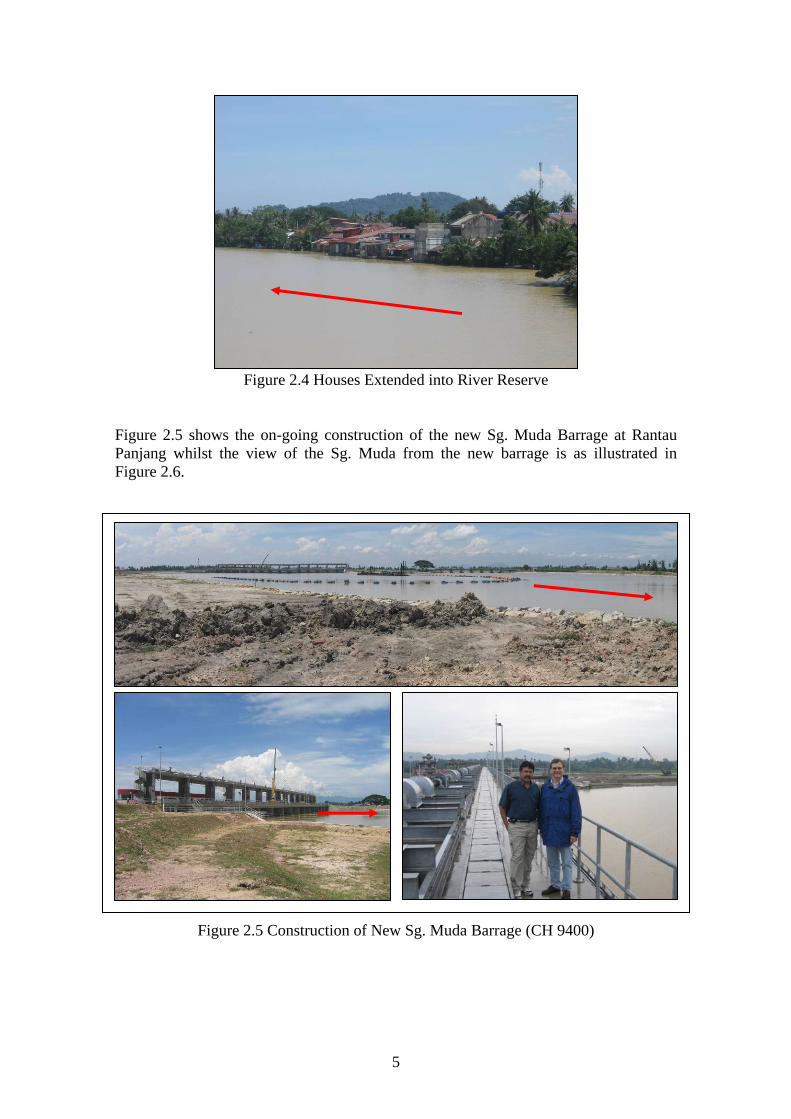
Figure 2.4 Houses Extended into River Reserve Figure 2.5 shows the on-going construction of the new Sg. Muda Barrage at Rantau Panjang whilst the view of the Sg. Muda from the new barrage is as illustrated in Figure 2.6.
Figure 2.5 Construction of New Sg. Muda Barrage (CH 9400)
5
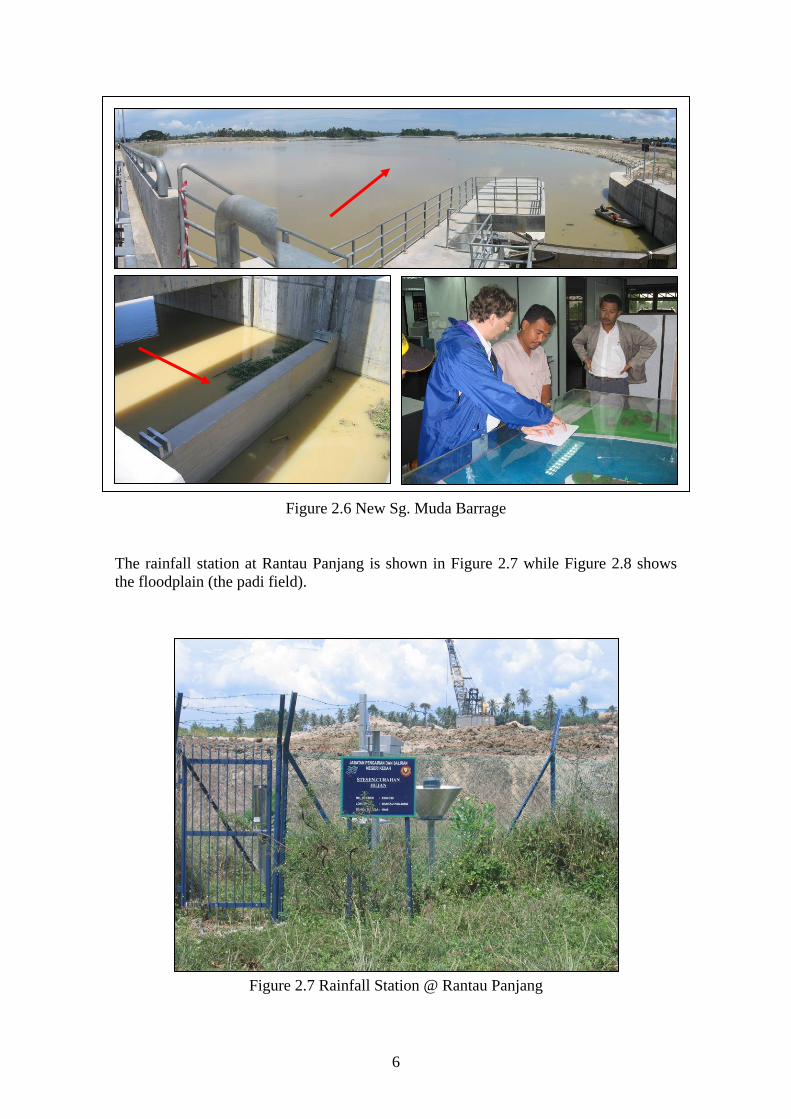
Figure 2.6 New Sg. Muda Barrage The rainfall station at Rantau Panjang is shown in Figure 2.7 while Figure 2.8 shows the floodplain (the padi field).
Figure 2.7 Rainfall Station @ Rantau Panjang
6
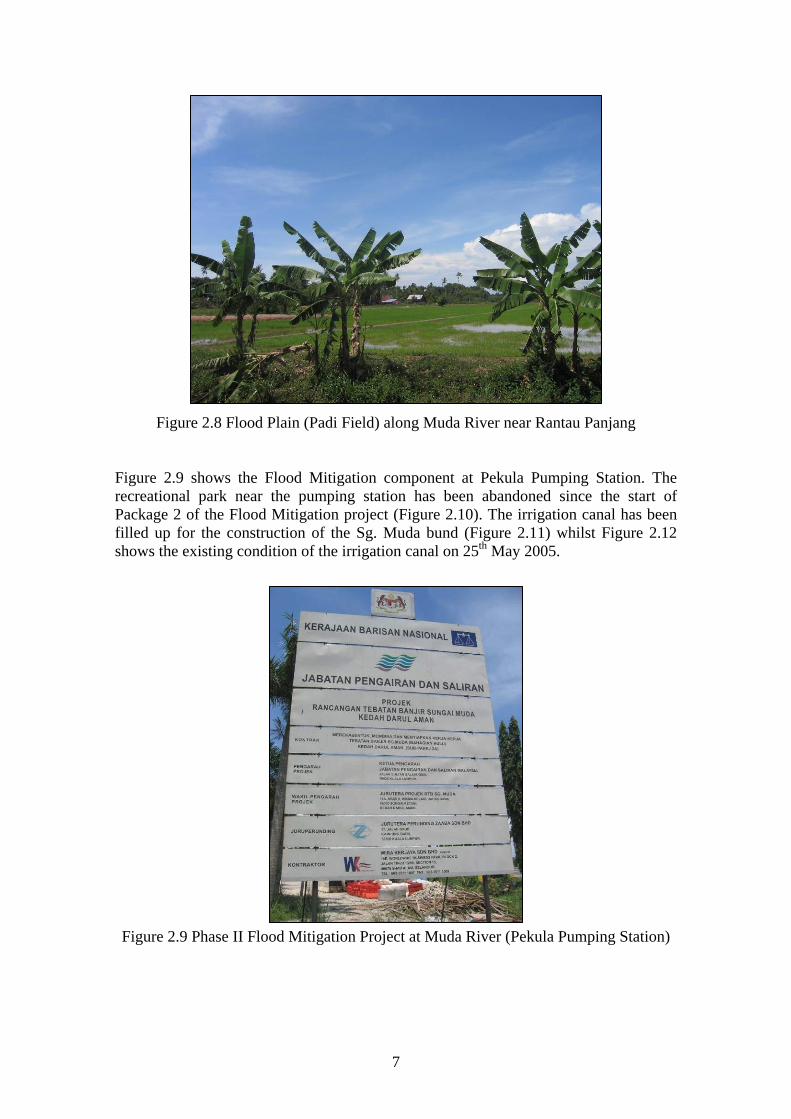
Figure 2.8 Flood Plain (Padi Field) along Muda River near Rantau Panjang Figure 2.9 shows the Flood Mitigation component at Pekula Pumping Station. The recreational park near the pumping station has been abandoned since the start of Package 2 of the Flood Mitigation project (Figure 2.10). The irrigation canal has been filled up for the construction of the Sg. Muda bund (Figure 2.11) whilst Figure 2.12 shows the existing condition of the irrigation canal on 25th May 2005.
Figure 2.9 Phase II Flood Mitigation Project at Muda River (Pekula Pumping Station)
7
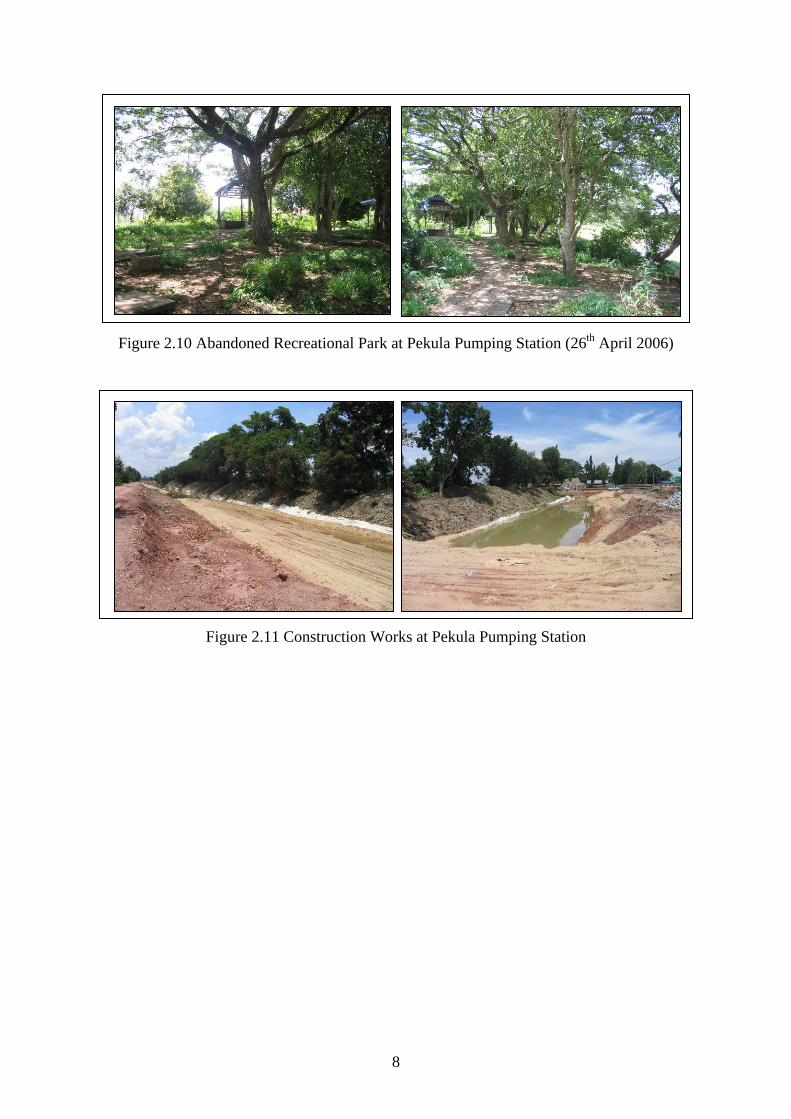
Figure 2.10 Abandoned Recreational Park at Pekula Pumping Station (26th April 2006)
Figure 2.11 Construction Works at Pekula Pumping Station
8
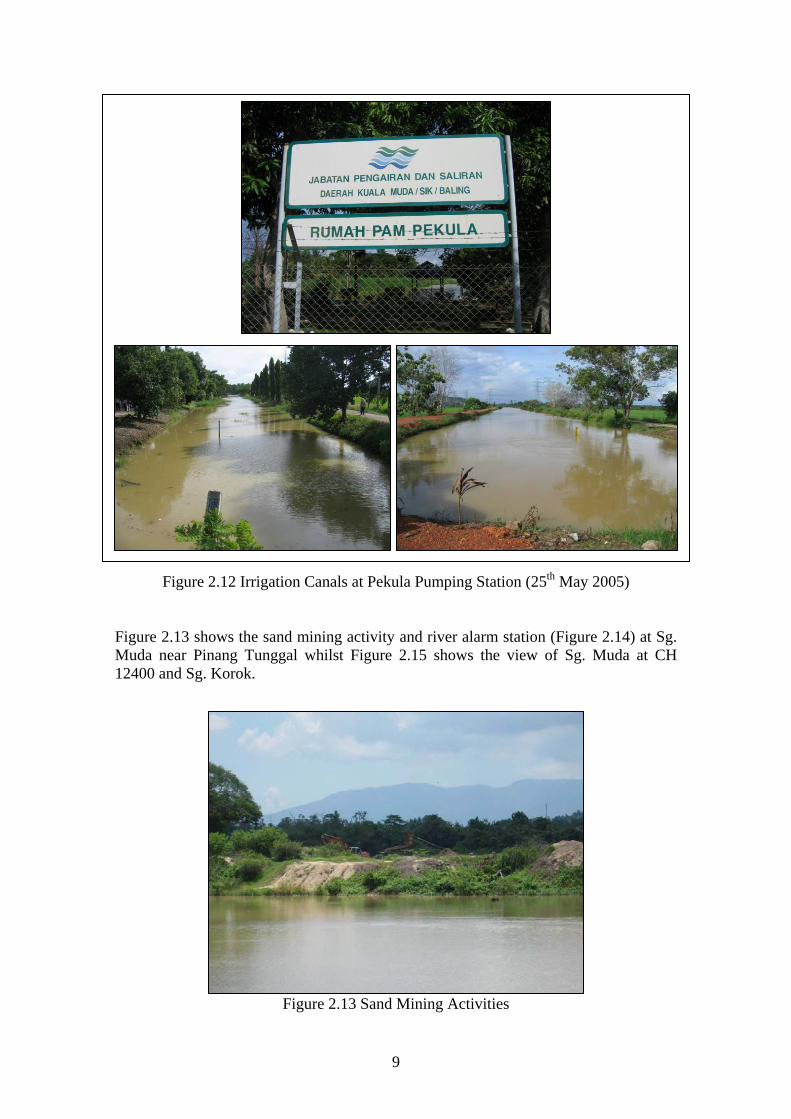
Figure 2.12 Irrigation Canals at Pekula Pumping Station (25th May 2005) Figure 2.13 shows the sand mining activity and river alarm station (Figure 2.14) at Sg. Muda near Pinang Tunggal whilst Figure 2.15 shows the view of Sg. Muda at CH 12400 and Sg. Korok.
Figure 2.13 Sand Mining Activities
9
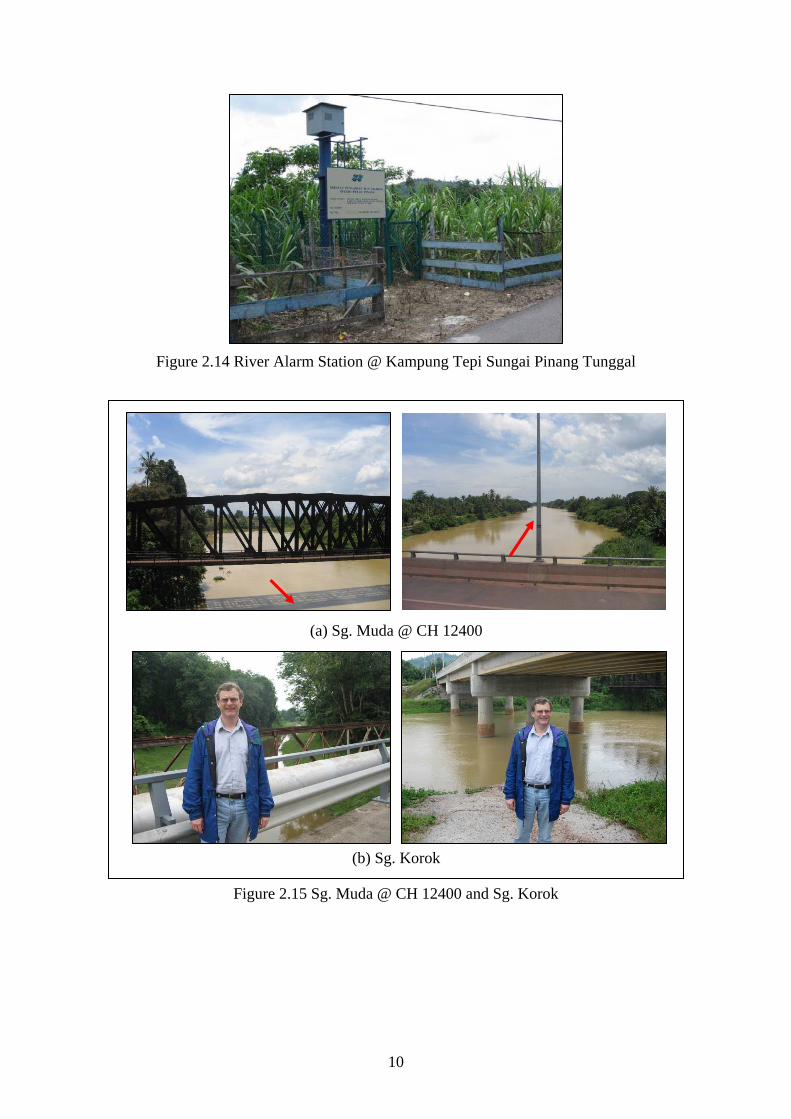
Figure 2.14 River Alarm Station @ Kampung Tepi Sungai Pinang Tunggal
(a) Sg. Muda @ CH 12400
(b) Sg. Korok
Figure 2.15 Sg. Muda @ CH 12400 and Sg. Korok
10
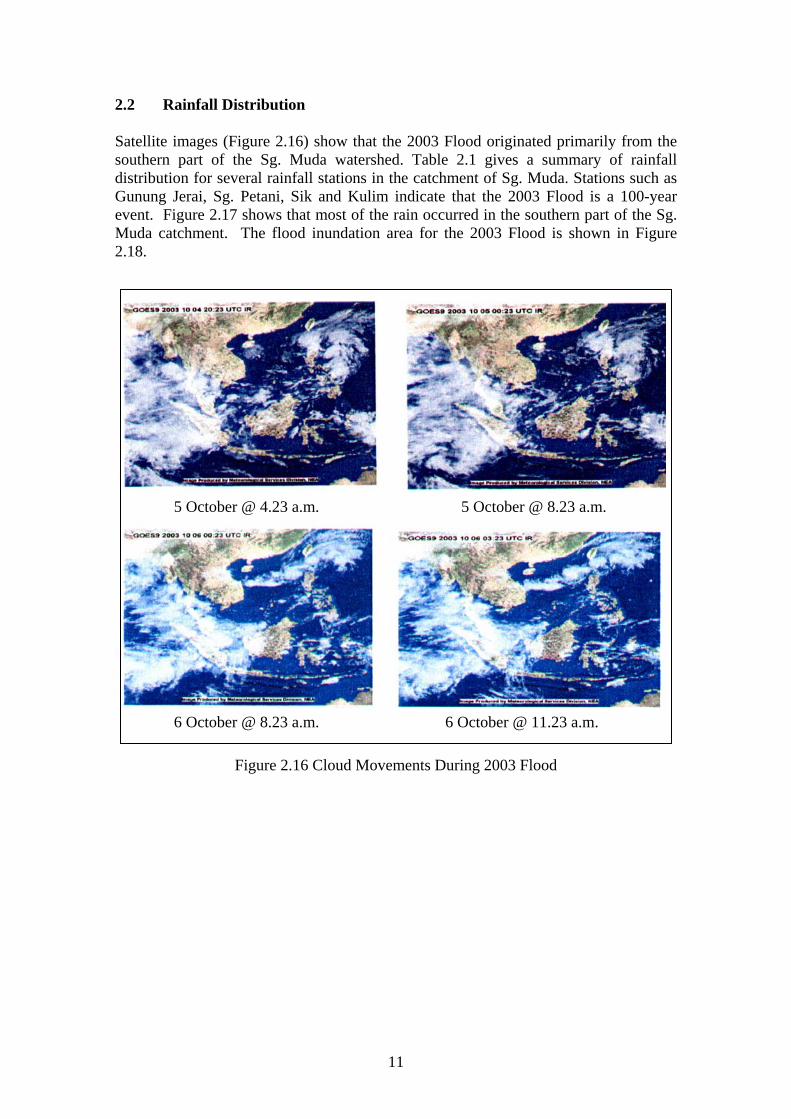
2.2 Rainfall Distribution Satellite images (Figure 2.16) show that the 2003 Flood originated primarily from the southern part of the Sg. Muda watershed. Table 2.1 gives a summary of rainfall distribution for several rainfall stations in the catchment of Sg. Muda. Stations such as Gunung Jerai, Sg. Petani, Sik and Kulim indicate that the 2003 Flood is a 100-year event. Figure 2.17 shows that most of the rain occurred in the southern part of the Sg. Muda catchment. The flood inundation area for the 2003 Flood is shown in Figure 2.18.
5 October @ 4.23 a.m. 5 October @ 8.23 a.m.
6 October @ 8.23 a.m.
6 October @ 11.23 a.m.
Figure 2.16 Cloud Movements During 2003 Flood
11
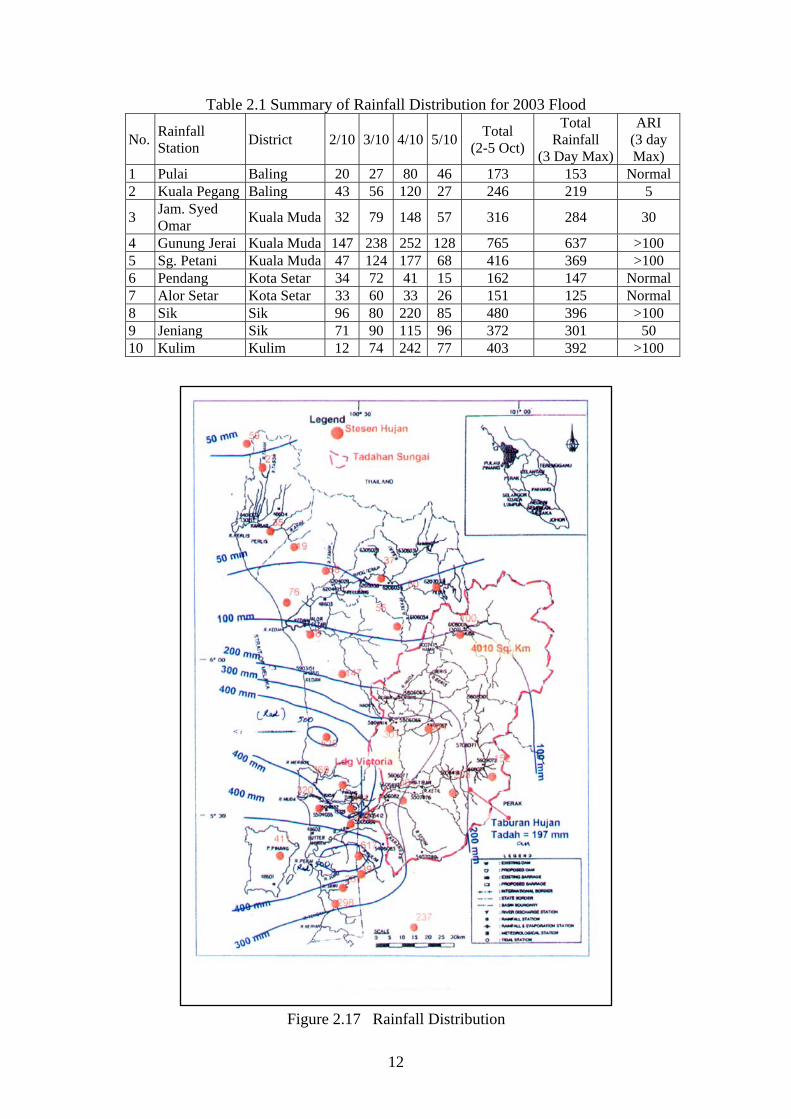
Table 2.1 Summary of Rainfall Distribution for 2003 Flood
No. Rainfall Station District 2/10 3/10 4/10 5/10 Total
(2-5 Oct)
Total Rainfall
(3 Day Max)
ARI (3 day Max)
1 Pulai Baling 20 27 80 46 173 153 Normal 2 Kuala Pegang Baling 43 56 120 27 246 219 5
3 Jam. Syed Omar Kuala Muda 32 79 148 57 316 284 30
4 Gunung Jerai Kuala Muda 147 238 252 128 765 637 >100 5 Sg. Petani Kuala Muda 47 124 177 68 416 369 >100 6 Pendang Kota Setar 34 72 41 15 162 147 Normal 7 Alor Setar Kota Setar 33 60 33 26 151 125 Normal 8 Sik Sik 96 80 220 85 480 396 >100 9 Jeniang Sik 71 90 115 96 372 301 50 10 Kulim Kulim 12 74 242 77 403 392 >100
Figure 2.17 Rainfall Distribution
12
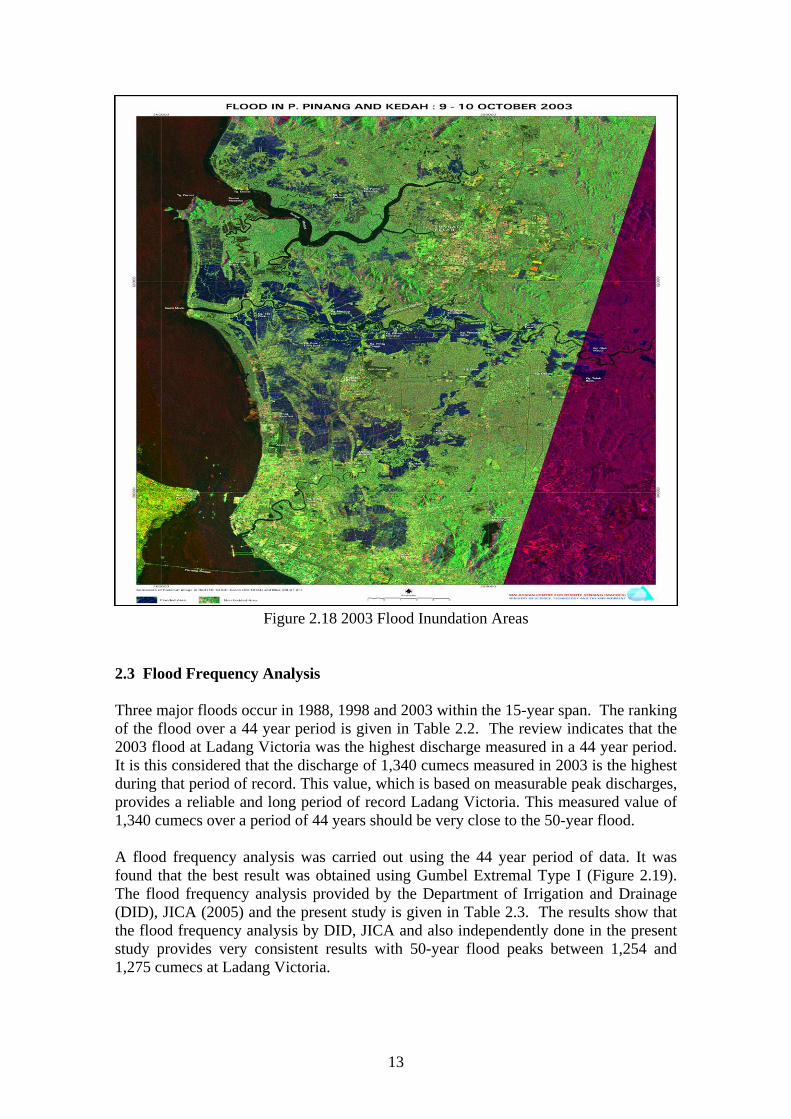
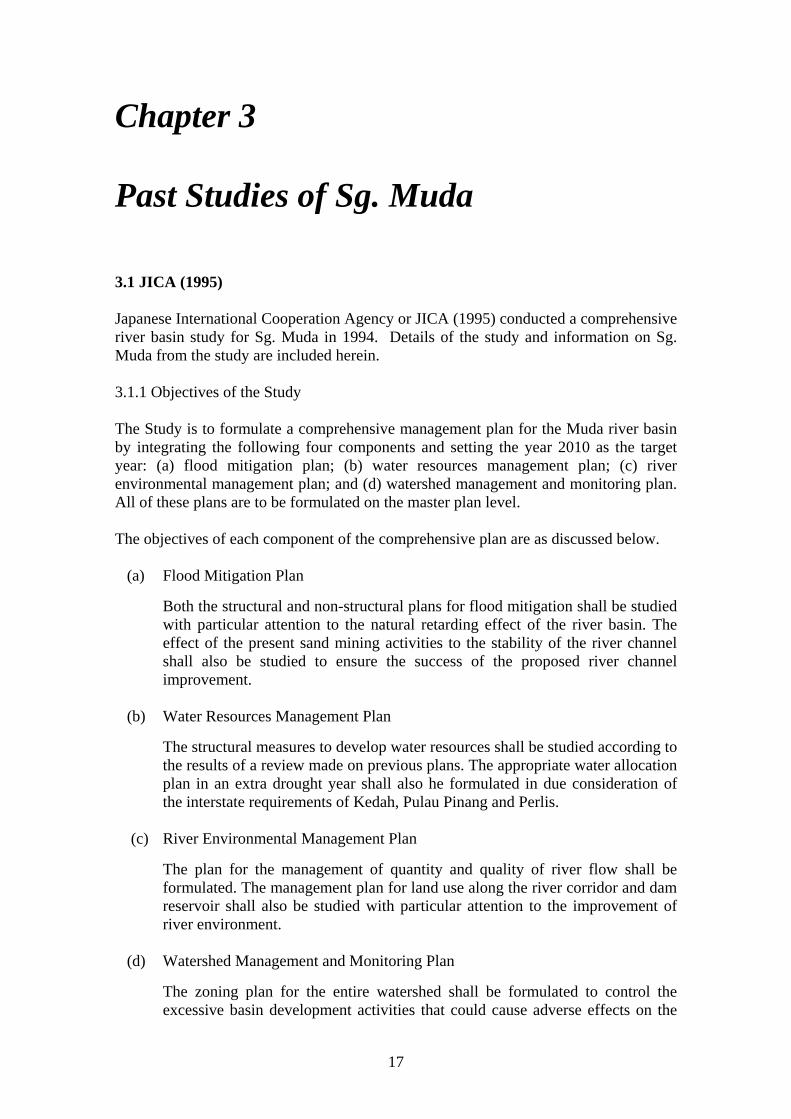
Figure 2.18 2003 Flood Inundation Areas 2.3 Flood Frequency Analysis Three major floods occur in 1988, 1998 and 2003 within the 15-year span. The ranking of the flood over a 44 year period is given in Table 2.2. The review indicates that the 2003 flood at Ladang Victoria was the highest discharge measured in a 44 year period. It is this considered that the discharge of 1,340 cumecs measured in 2003 is the highest during that period of record. This value, which is based on measurable peak discharges, provides a reliable and long period of record Ladang Victoria. This measured value of 1,340 cumecs over a period of 44 years should be very close to the 50-year flood. A flood frequency analysis was carried out using the 44 year period of data. It was found that the best result was obtained using Gumbel Extremal Type I (Figure 2.19). The flood frequency analysis provided by the Department of Irrigation and Drainage (DID), JICA (2005) and the present study is given in Table 2.3. The results show that the flood frequency analysis by DID, JICA and also independently done in the present study provides very consistent results with 50-year flood peaks between 1,254 and 1,275 cumecs at Ladang Victoria.
13
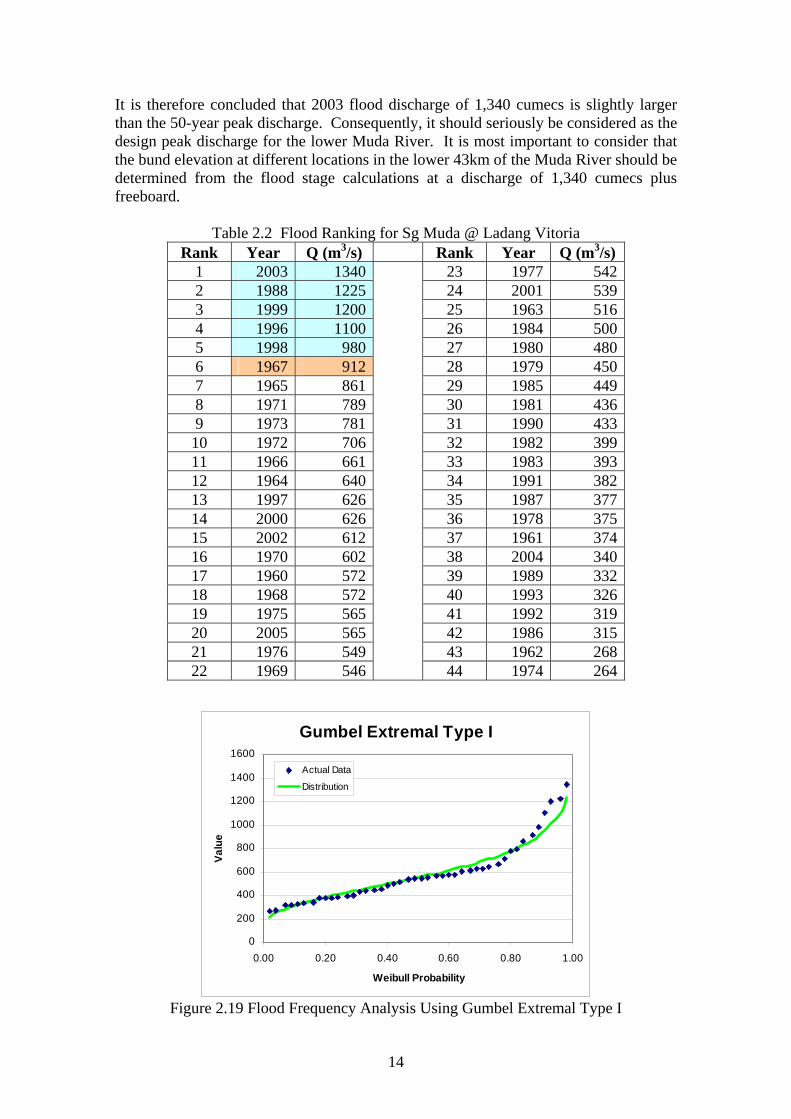
It is therefore concluded that 2003 flood discharge of 1,340 cumecs is slightly larger than the 50-year peak discharge. Consequently, it should seriously be considered as the design peak discharge for the lower Muda River. It is most important to consider that the bund elevation at different locations in the lower 43km of the Muda River should be determined from the flood stage calculations at a discharge of 1,340 cumecs plus freeboard.
Table 2.2 Flood Ranking for Sg Muda @ Ladang Vitoria Rank Year Q (m3/s) Rank Year Q (m3/s)
1 2003 1340 23 1977 542 2 1988 1225 24 2001 539 3 1999 1200 25 1963 516 4 1996 1100 26 1984 500 5 1998 980 27 1980 480 6 1967 912 28 1979 450 7 1965 861 29 1985 449 8 1971 789 30 1981 436 9 1973 781 31 1990 433 10 1972 706 32 1982 399 11 1966 661 33 1983 393 12 1964 640 34 1991 382 13 1997 626 35 1987 377 14 2000 626 36 1978 375 15 2002 612 37 1961 374 16 1970 602 38 2004 340 17 1960 572 39 1989 332 18 1968 572 40 1993 326 19 1975 565 41 1992 319 20 2005 565 42 1986 315 21 1976 549 43 1962 268 22 1969 546
44 1974 264
Gumbel Extremal Type I
0
200
400
600
800
1000
1200
1400
1600
0.00 0.20 0.40 0.60 0.80 1.00
Weibull Probability
Valu
e
Actual Data
Distribution
Figure 2.19 Flood Frequency Analysis Using Gumbel Extremal Type I
14

Table 2.3 Flood Frequency Analyses for Sg. Muda @ Ladang Victoria Discharge (m3/s) Return
Period DID JICA (1995)
PRESENT STUDY Gumbel Extremal Type I
(Discharge Data from 1960 – 2005) 2 517 552 5 760 810 776 10 916 950 926 25 1125 1114 50 1275 1260 1254 100 1423 1340 1393 200 1572 1531
15
17
Chapter 3 Past Studies of Sg. Muda 3.1 JICA (1995) Japanese International Cooperation Agency or JICA (1995) conducted a comprehensive river basin study for Sg. Muda in 1994. Details of the study and information on Sg. Muda from the study are included herein. 3.1.1 Objectives of the Study The Study is to formulate a comprehensive management plan for the Muda river basin by integrating the following four components and setting the year 2010 as the target year: (a) flood mitigation plan; (b) water resources management plan; (c) river environmental management plan; and (d) watershed management and monitoring plan. All of these plans are to be formulated on the master plan level. The objectives of each component of the comprehensive plan are as discussed below.
(a) Flood Mitigation Plan
Both the structural and non-structural plans for flood mitigation shall be studied with particular attention to the natural retarding effect of the river basin. The effect of the present sand mining activities to the stability of the river channel shall also be studied to ensure the success of the proposed river channel improvement.
(b) Water Resources Management Plan
The structural measures to develop water resources shall be studied according to the results of a review made on previous plans. The appropriate water allocation plan in an extra drought year shall also he formulated in due consideration of the interstate requirements of Kedah, Pulau Pinang and Perlis.
(c) River Environmental Management Plan
The plan for the management of quantity and quality of river flow shall be formulated. The management plan for land use along the river corridor and dam reservoir shall also be studied with particular attention to the improvement of river environment.
(d) Watershed Management and Monitoring Plan
The zoning plan for the entire watershed shall be formulated to control the excessive basin development activities that could cause adverse effects on the
18
aforesaid river management plan. The monitoring plan for river activities and basin development activities shall also be formulated to maintain a well-balanced river management. The monitoring plan shall include an institutional set-up to ensure the proposed monitoring and river management works.
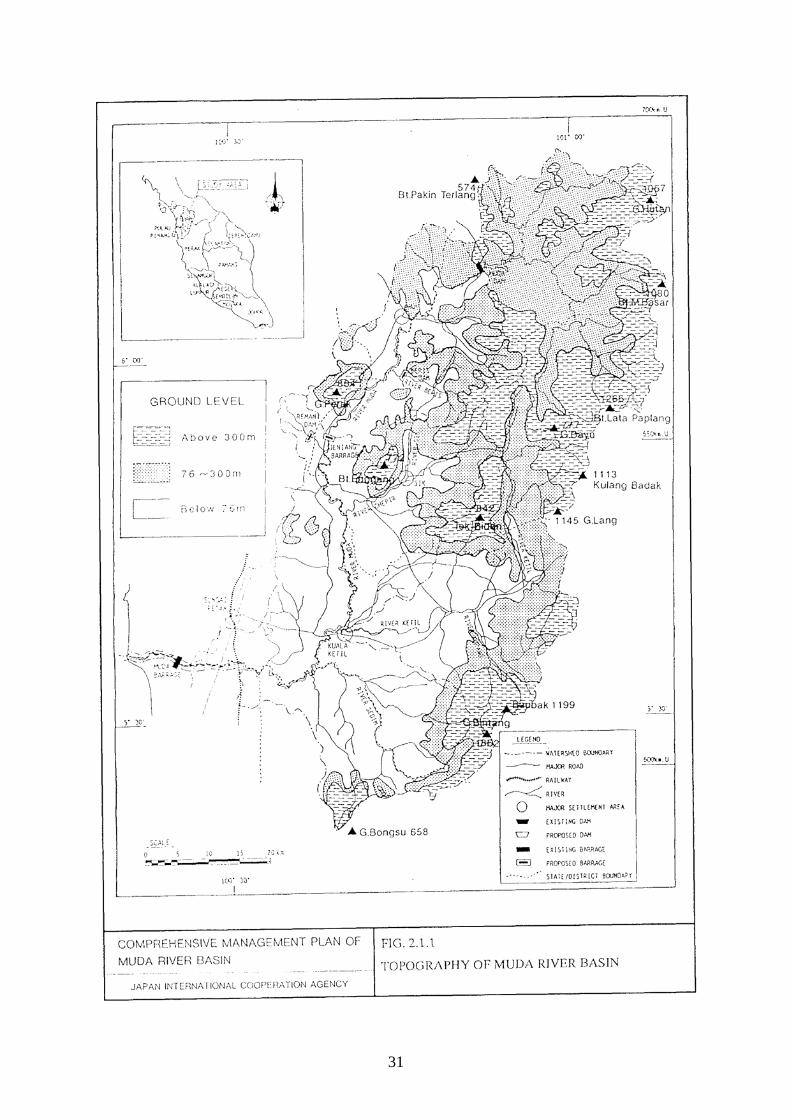
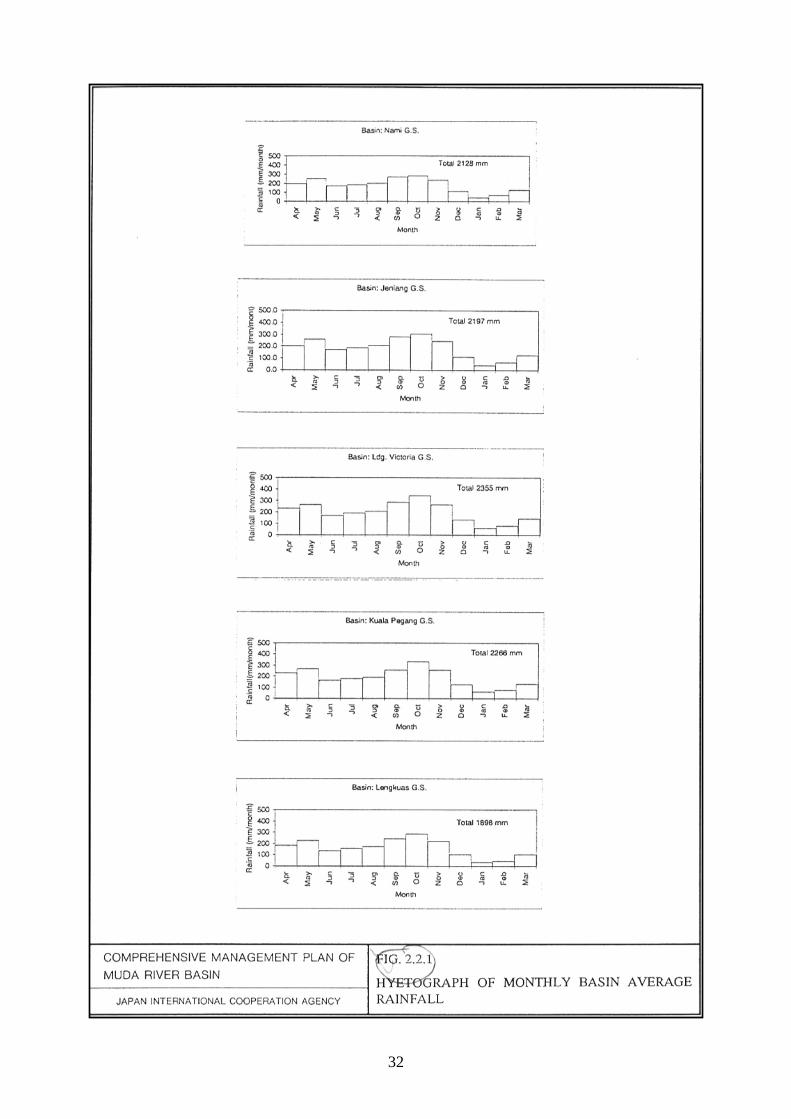
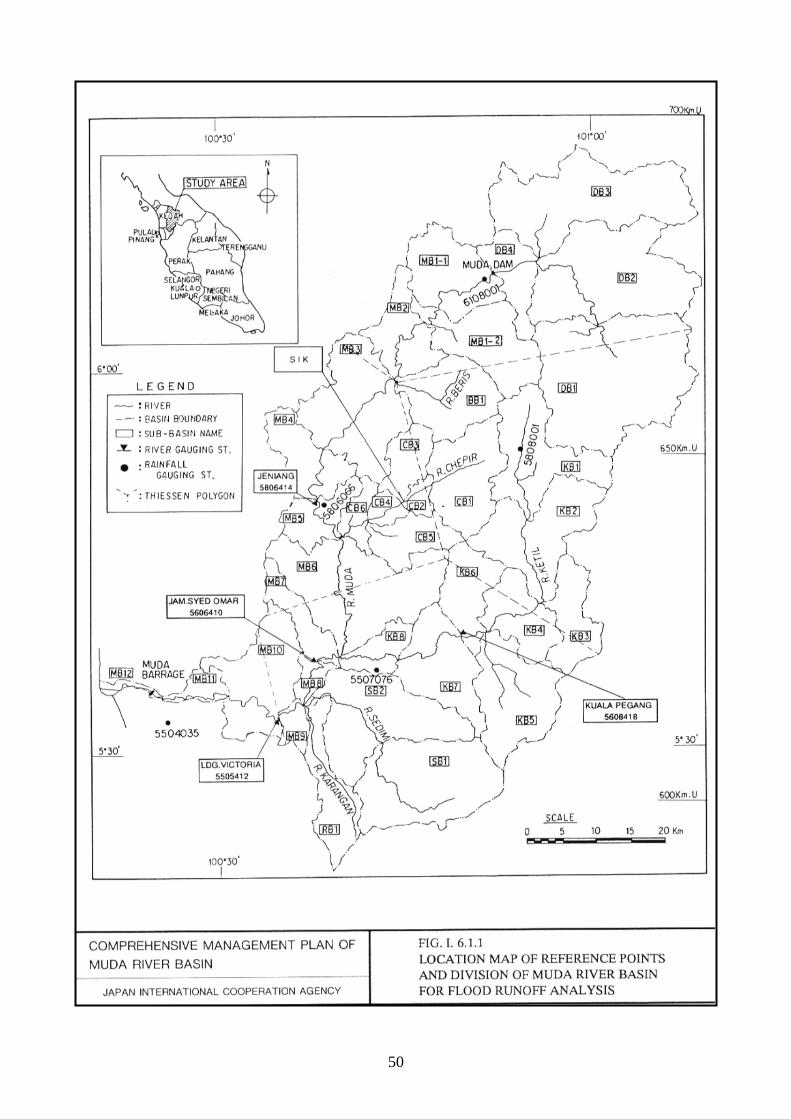
3.1.2 Study Area The study area for all components of the comprehensive plan except the water resources management plan shall be within the limits of the Muda river basin (Figure 3.1). Since the water supply area of the water resources of Sg. Muda extends beyond the Muda river basin and covers the whole states of Kedah and Pulau Pinang as well as a part of the State of Perlis, the water demand projection as well as the water supply and demand simulation shall be made for the whole water supply area of Sg. Muda. The states of Kedah, Pulau Pinang and Perlis are located in the northwestern part of Peninsular Malaysia, occupying a total of 11,252 km , i.e., 9,426 km for the State of Kedah, 1,031 km" for the State of Pulau Pinang, and 795 km" for the State of Perlis. The upper and middle reaches of Sg. Muda belong to the State of Kedah, while the river downstream with a length of about 30 km forms the boundary between the states of Kedah and Pulau Pinang. The Muda river basin has a catchment area of 4,210 km, most of which is located within the State of Kedah. Each of the above three states is administratively divided into several districts, and each district is further divided into parishes called Mukim in Malaysian term. The three states cover 17 districts and 239 mukims, out of which the Muda river basin covers 6 districts and 28 mukims. 3.1.3 Climate The study area has two typical monsoons; namely, the northeast monsoon and southwest monsoon. The northeast monsoon usually occurs from November to February. During this season, the northeast monsoon unloads its moisture contents over the east coast of Peninsular Malaysia. However, the study area located in the west coast receives a little rain during this monsoon due to the sheltering effect of the central mountain range running from north to south in Peninsular Malaysia. The southwest monsoon usually reaches the west coast of Peninsular Malaysia from the Indian Ocean and prevails over Peninsular Malaysia from May to August. The monsoon contains heavy moisture and causes the fairly heavy rainfall in the study area from April to May. In the transition period between the above two monsoons, from September to November, the western wind prevails and causes the heaviest rainfall in the study area in a year. Thus, the study area tends to have two rainy seasons in a year; one is from April to May and another, from September to November (Figure 3.2).
19
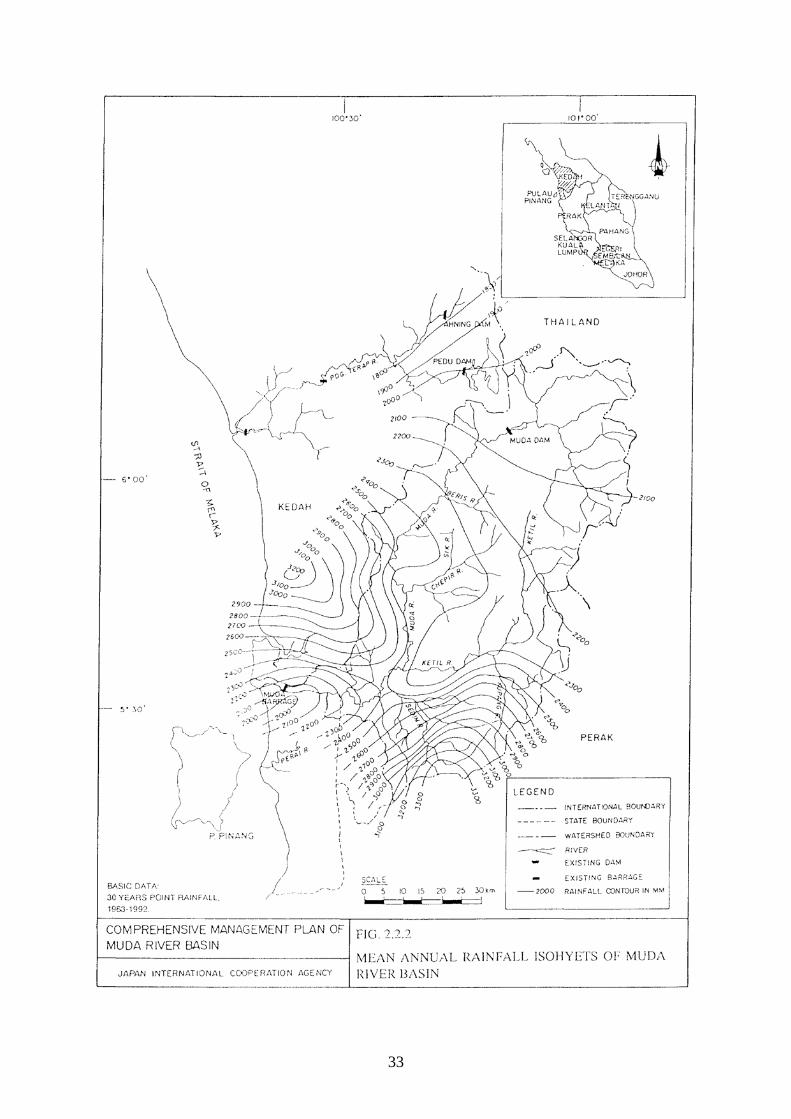
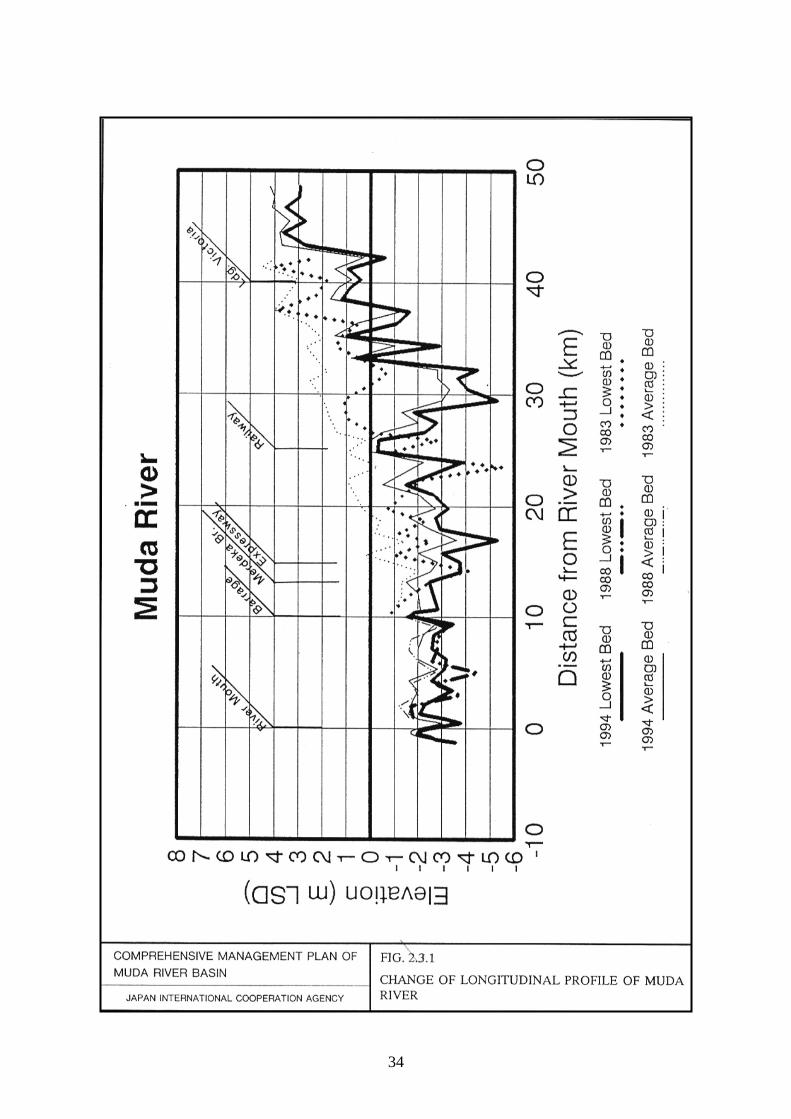
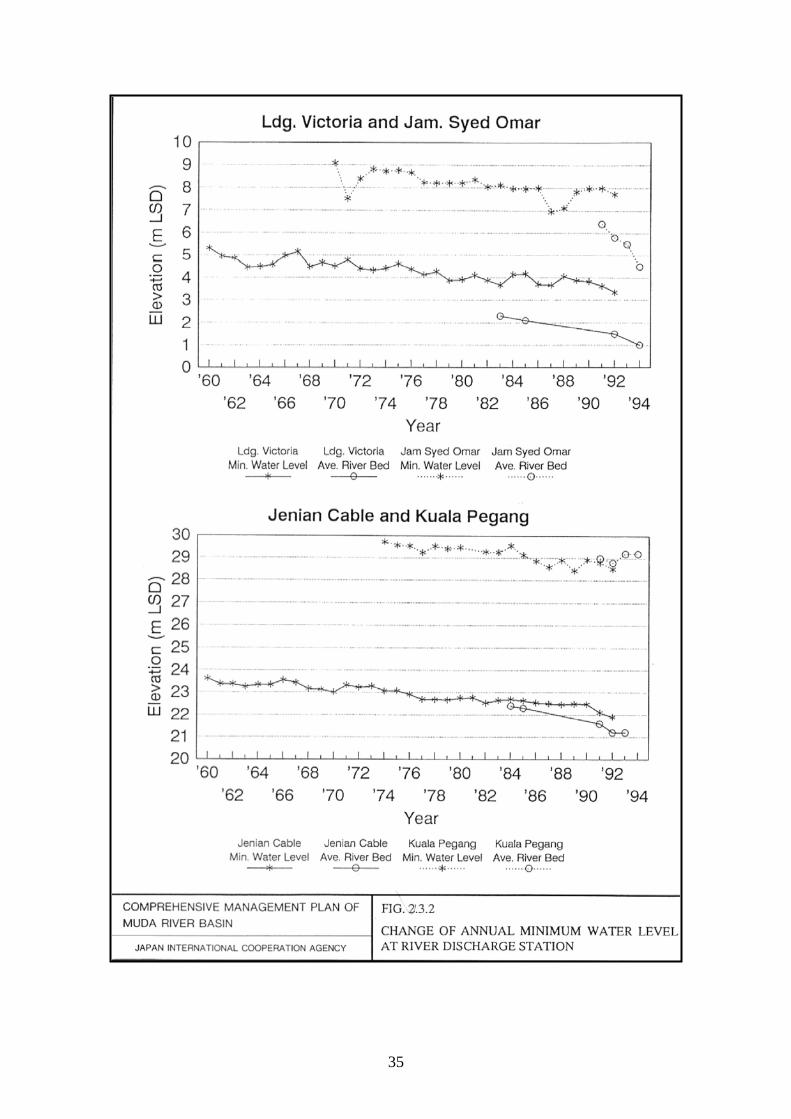
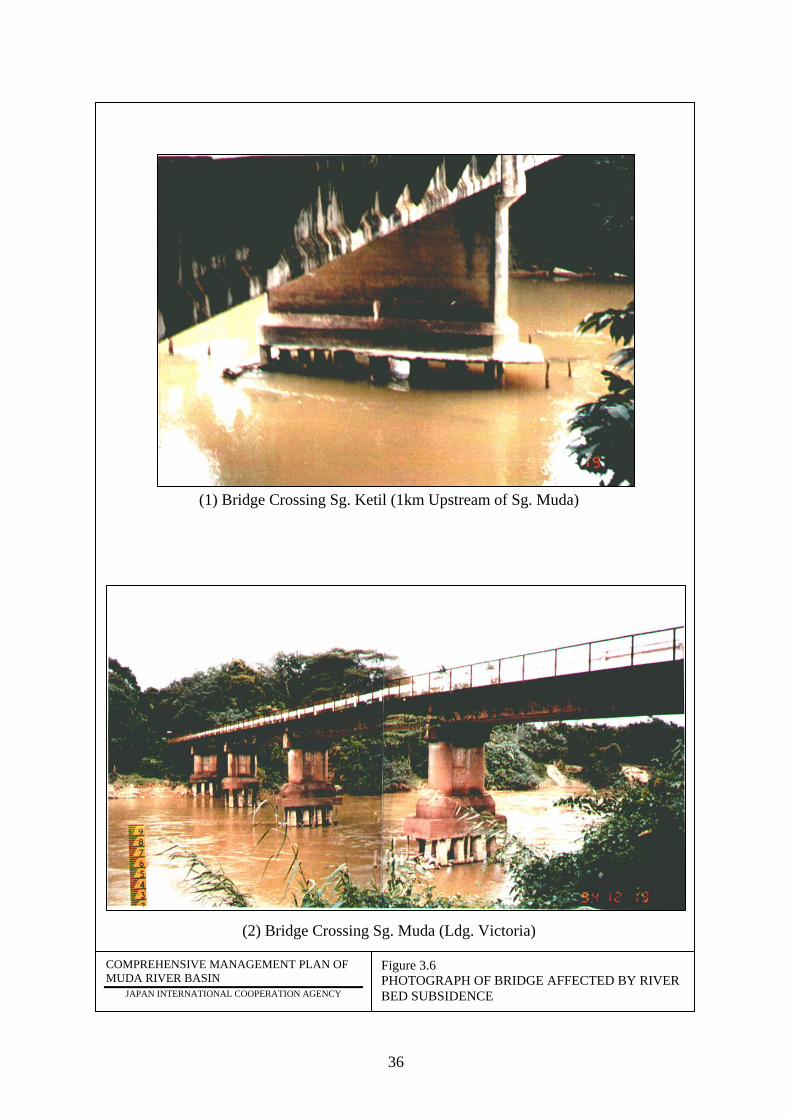
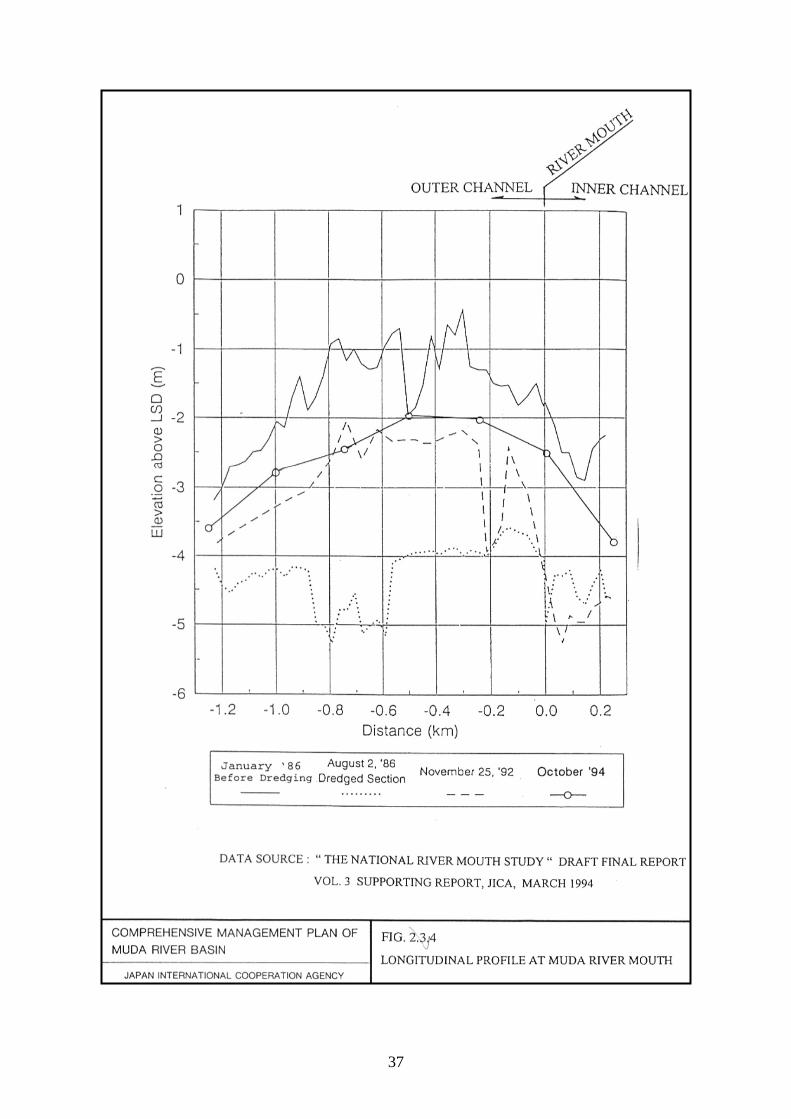
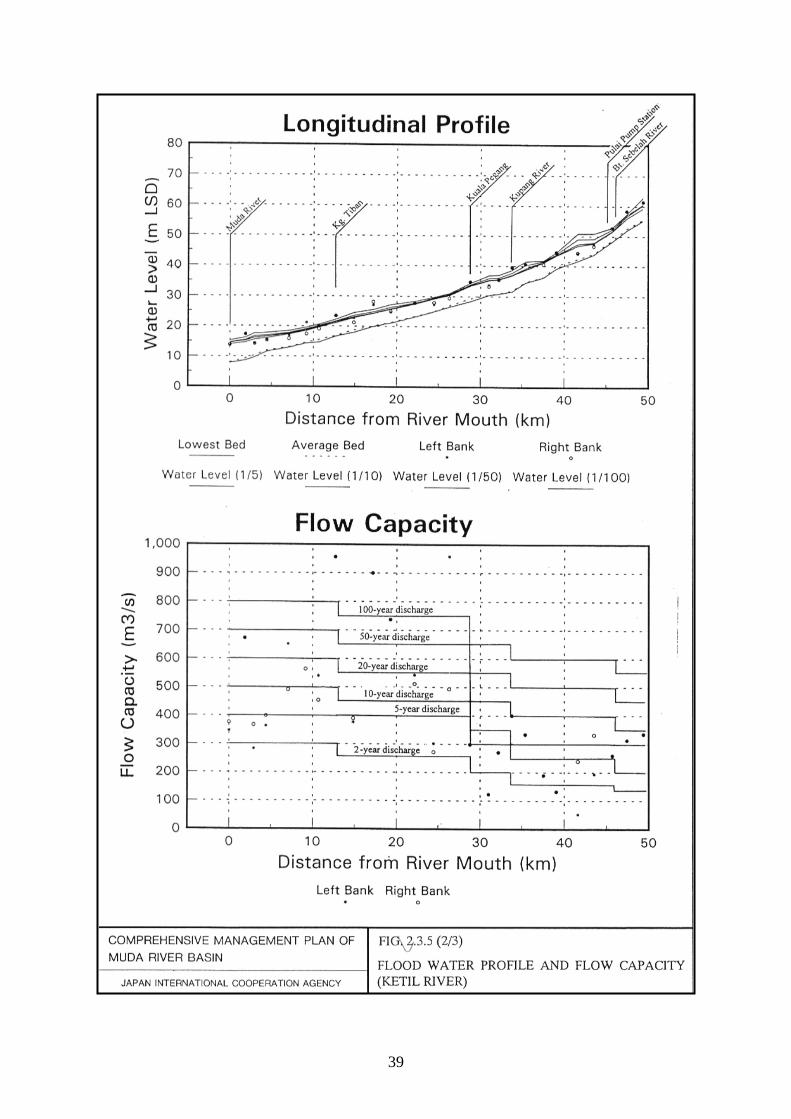
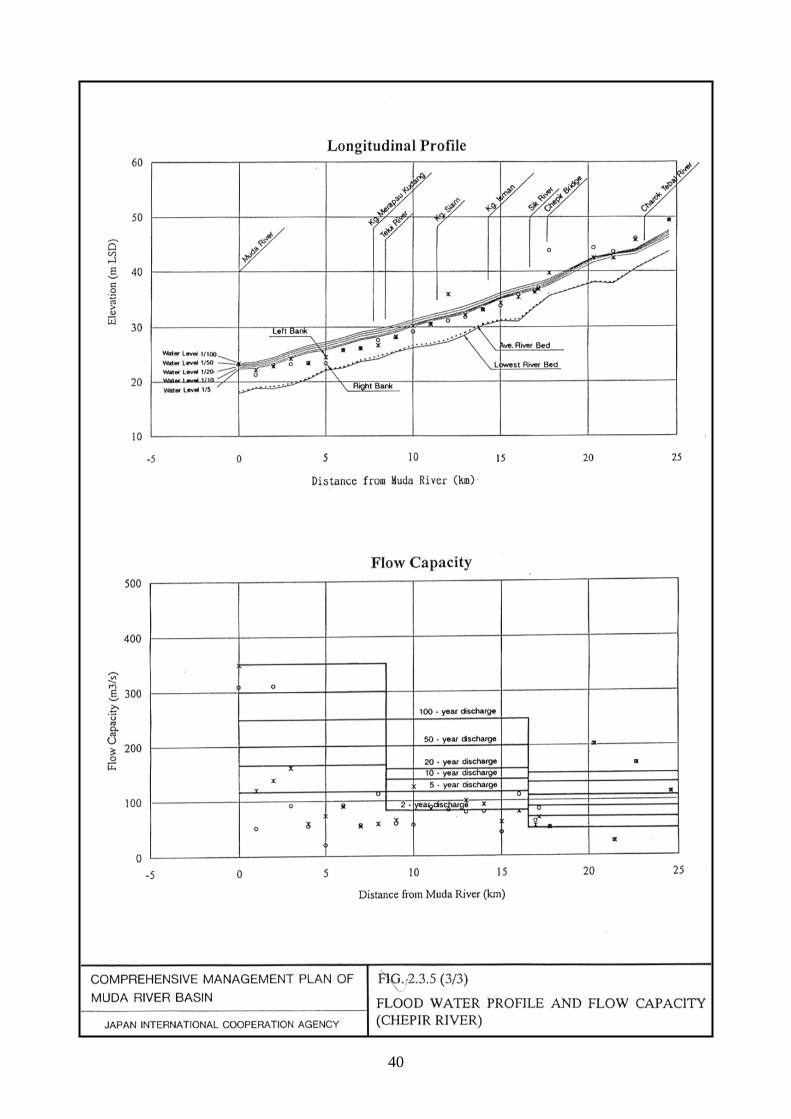
The annual rainfall depth in the Study Area is about 2,000 to 3,000 mm. The heavy annual rainfall is observed around the central mountain of Gunong Jerai and the southern mountainous areas declining northward and to the river mouth (Figure 3.3). The temperature in the study area is around 27"C on average, and its annual variation is less than 2°C. The humidity in the study area varies from the lowest of about 75% in January to the highest of about 88% in October. The annual average sunshine hours is around 7 hours varying from the minimum of less than 6 hours in September to the maximum of more than 8 hours in February. The monthly pan evaporation at Alor Setar is about 135 mm on average containing the lowest of 110 mm in November and the highest of 175 mm in January. 3.1.4 River Morphology 3.1.4.1 River System Sg. Muda with a catchment area of 4,210 km2 originates in the north mountainous area of Kedah State and flows down toward the south. It changes its course towards the west coast after passing the confluence of the main stream and its tributary, Ketil River. The total length of the main stream is about 180 km. There are three major tributaries of the Sg. Muda river system; namely, Sg. Ketil with a catchment area of 868 km2, Sg. Sedim with 626 km2 and Sg. Chepir with 335 km2. Sg. Ketil is the largest tributary including its secondary tributary, Sg. Kupang that has a catchment area of 147 km2. 3.1.4.2 River Channel Profile The main channel of Sg. Muda has a length of about 180 km with a slope of 1/2,300 from the river mouth to Muda Dam. The channel lengths and slopes of the tributaries are 70 km and 1/750 for Sg. Ketil, 30 km and 1/550 for Sg. Sedim, and 25 km and 1/800 for Sg. Chepir. The channel width is 300 m near the river mouth and tends to be narrower upstream. The channel tends to erode due to the sand mining operations, aggravating bank erosion and riverbed degradation. The average riverbed had subsided by 2 to 5 m for the period 1983 to 1994, as proven by the longitudinal profile survey in those years (Figure 3.4) and, in parallel with the subsidence of the riverbed, the water level has also been lowering by 1 to 2 m for the past 20 to 30 years (Figure 3.5). The riverbed subsidence seriously affects river structures such as bridges and water intake facilities. Foundation piles of the bridge at Ldg. Victoria are exposed by 2 to 3 m above the eroded riverbed (Figure 3.6). Moreover, the lowering of water level also causes difficulty in abstracting water from the river at the existing intake points. On the other hand, the river mouth tends to be affected by the accumulation of sediment causing aggravation of the riverbed and development of sand bar. DID dredged 1.2 km of the outer channel in 1986, deepening the channel bed to 4 m below LSD, but it silted up by 2 to 3 m in 76 months after dredging (Figure 3.7). The shallowest point surveyed
20
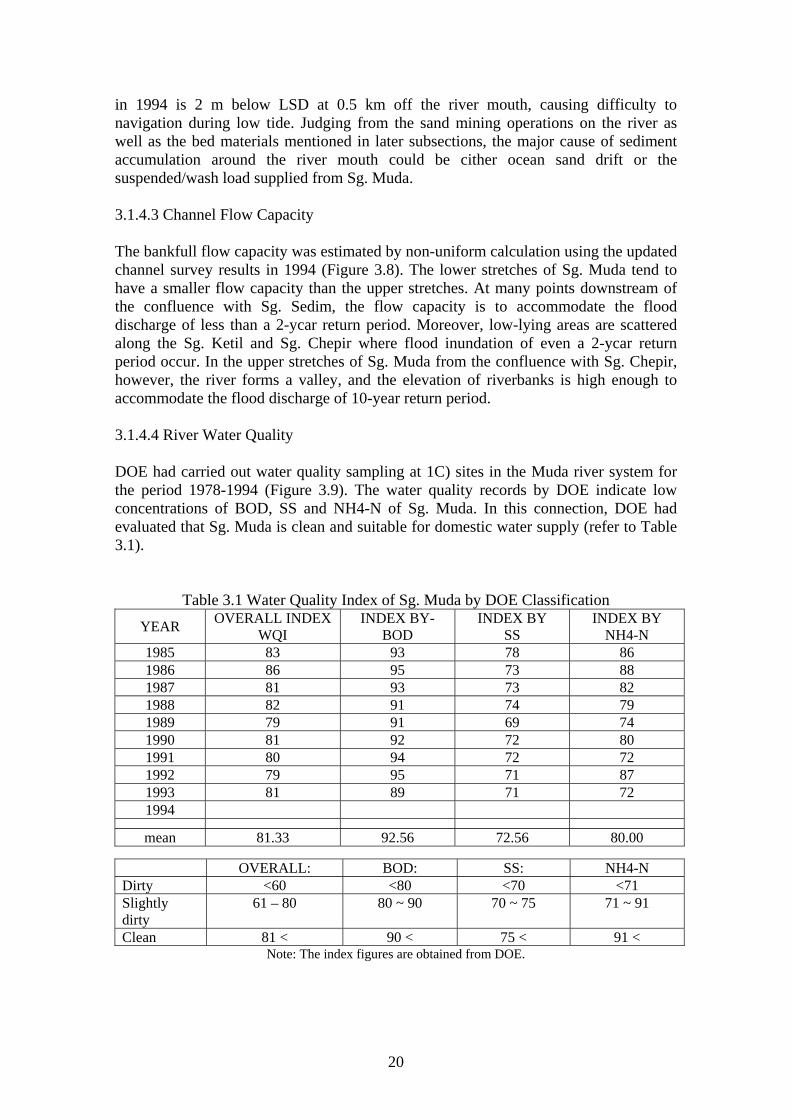
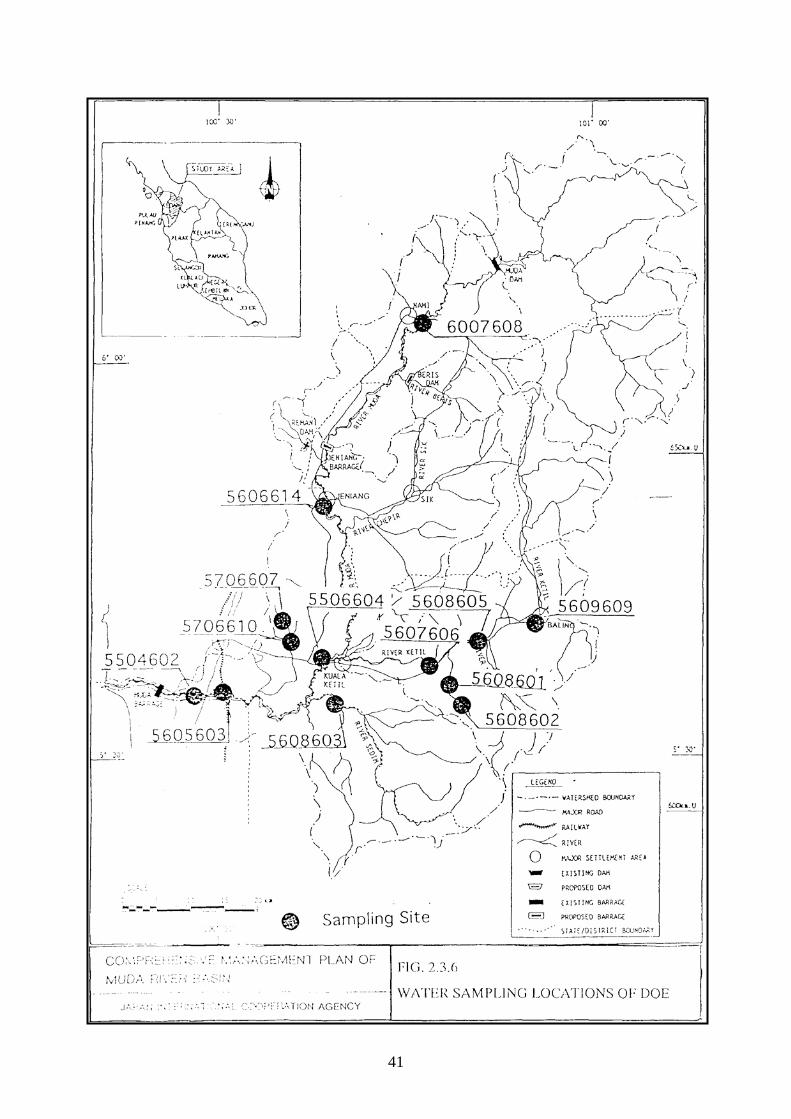
in 1994 is 2 m below LSD at 0.5 km off the river mouth, causing difficulty to navigation during low tide. Judging from the sand mining operations on the river as well as the bed materials mentioned in later subsections, the major cause of sediment accumulation around the river mouth could be cither ocean sand drift or the suspended/wash load supplied from Sg. Muda. 3.1.4.3 Channel Flow Capacity The bankfull flow capacity was estimated by non-uniform calculation using the updated channel survey results in 1994 (Figure 3.8). The lower stretches of Sg. Muda tend to have a smaller flow capacity than the upper stretches. At many points downstream of the confluence with Sg. Sedim, the flow capacity is to accommodate the flood discharge of less than a 2-ycar return period. Moreover, low-lying areas are scattered along the Sg. Ketil and Sg. Chepir where flood inundation of even a 2-ycar return period occur. In the upper stretches of Sg. Muda from the confluence with Sg. Chepir, however, the river forms a valley, and the elevation of riverbanks is high enough to accommodate the flood discharge of 10-year return period. 3.1.4.4 River Water Quality DOE had carried out water quality sampling at 1C) sites in the Muda river system for the period 1978-1994 (Figure 3.9). The water quality records by DOE indicate low concentrations of BOD, SS and NH4-N of Sg. Muda. In this connection, DOE had evaluated that Sg. Muda is clean and suitable for domestic water supply (refer to Table 3.1).
Table 3.1 Water Quality Index of Sg. Muda by DOE Classification
YEAR OVERALL INDEX WQI
INDEX BY- BOD
INDEX BY SS
INDEX BY NH4-N
1985 83 93 78 86 1986 86 95 73 88 1987 81 93 73 82 1988 82 91 74 79 1989 79 91 69 74 1990 81 92 72 80 1991 80 94 72 72 1992 79 95 71 87 1993 81 89 71 72 1994
mean 81.33 92.56 72.56 80.00 OVERALL: BOD: SS: NH4-N Dirty <60 <80 <70 <71 Slightly dirty
61 – 80 80 ~ 90 70 ~ 75 71 ~ 91
Clean 81 < 90 < 75 < 91 < Note: The index figures are obtained from DOE.
21
21
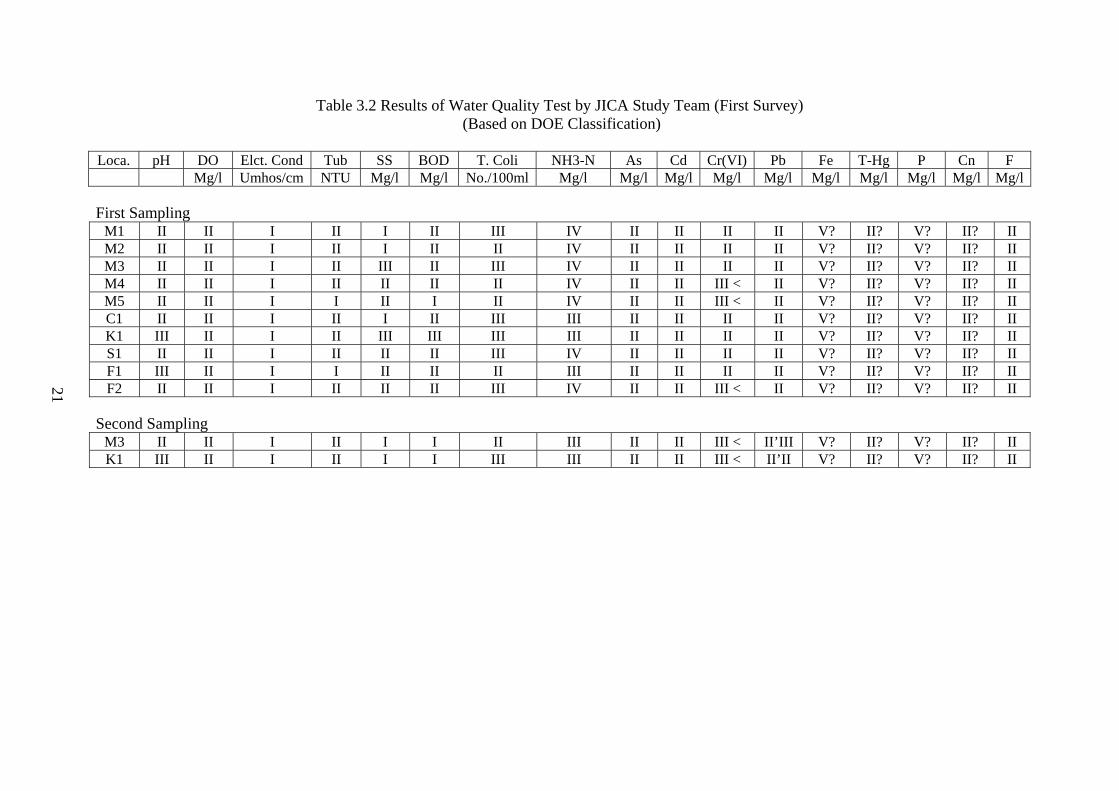
Table 3.2 Results of Water Quality Test by JICA Study Team (First Survey) (Based on DOE Classification)
Loca. pH DO Elct. Cond Tub SS BOD T. Coli NH3-N As Cd Cr(VI) Pb Fe T-Hg P Cn F
Mg/l Umhos/cm NTU Mg/l Mg/l No./100ml Mg/l Mg/l Mg/l Mg/l Mg/l Mg/l Mg/l Mg/l Mg/l Mg/l First Sampling
M1 II II I II I II III IV II II II II V? II? V? II? II M2 II II I II I II II IV II II II II V? II? V? II? II M3 II II I II III II III IV II II II II V? II? V? II? II M4 II II I II II II II IV II II III < II V? II? V? II? II M5 II II I I II I II IV II II III < II V? II? V? II? II C1 II II I II I II III III II II II II V? II? V? II? II K1 III II I II III III III III II II II II V? II? V? II? II S1 II II I II II II III IV II II II II V? II? V? II? II F1 III II I I II II II III II II II II V? II? V? II? II F2 II II I II II II III IV II II III < II V? II? V? II? II
Second Sampling
M3 II II I II I I II III II II III < II’III V? II? V? II? II K1 III II I II I I III III II II III < II’II V? II? V? II? II
22
22
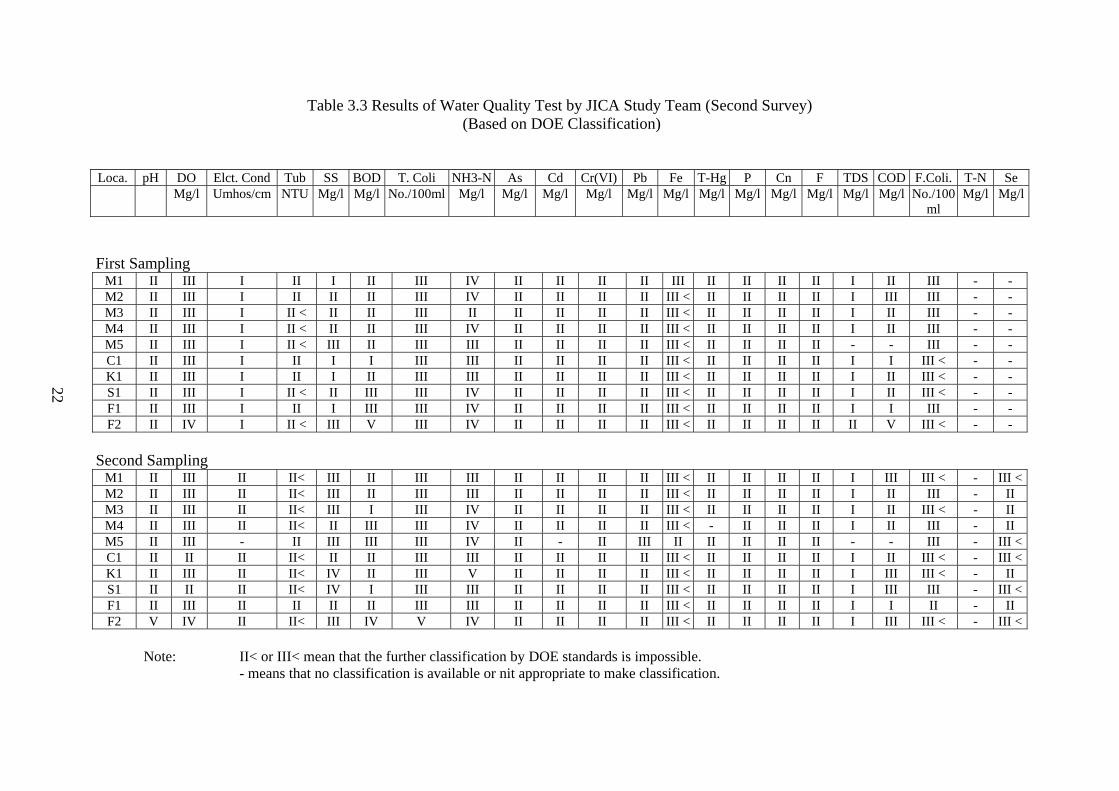
Table 3.3 Results of Water Quality Test by JICA Study Team (Second Survey) (Based on DOE Classification)
Loca. pH DO Elct. Cond Tub SS BOD T. Coli NH3-N As Cd Cr(VI) Pb Fe T-Hg P Cn F TDS COD F.Coli. T-N Se
Mg/l Umhos/cm NTU Mg/l Mg/l No./100ml Mg/l Mg/l Mg/l Mg/l Mg/l Mg/l Mg/l Mg/l Mg/l Mg/l Mg/l Mg/l No./100ml
Mg/l Mg/l
First Sampling
M1 II III I II I II III IV II II II II III II II II II I II III - - M2 II III I II II II III IV II II II II III < II II II II I III III - - M3 II III I II < II II III II II II II II III < II II II II I II III - - M4 II III I II < II II III IV II II II II III < II II II II I II III - - M5 II III I II < III II III III II II II II III < II II II II - - III - - C1 II III I II I I III III II II II II III < II II II II I I III < - - K1 II III I II I II III III II II II II III < II II II II I II III < - - S1 II III I II < II III III IV II II II II III < II II II II I II III < - - F1 II III I II I III III IV II II II II III < II II II II I I III - - F2 II IV I II < III V III IV II II II II III < II II II II II V III < - -
Second Sampling
M1 II III II II< III II III III II II II II III < II II II II I III III < - III < M2 II III II II< III II III III II II II II III < II II II II I II III - II M3 II III II II< III I III IV II II II II III < II II II II I II III < - II M4 II III II II< II III III IV II II II II III < - II II II I II III - II M5 II III - II III III III IV II - II III II II II II II - - III - III < C1 II II II II< II II III III II II II II III < II II II II I II III < - III < K1 II III II II< IV II III V II II II II III < II II II II I III III < - II S1 II II II II< IV I III III II II II II III < II II II II I III III - III < F1 II III II II II II III III II II II II III < II II II II I I II - II F2 V IV II II< III IV V IV II II II II III < II II II II I III III < - III <
Note: II< or III< mean that the further classification by DOE standards is impossible. - means that no classification is available or nit appropriate to make classification.
23
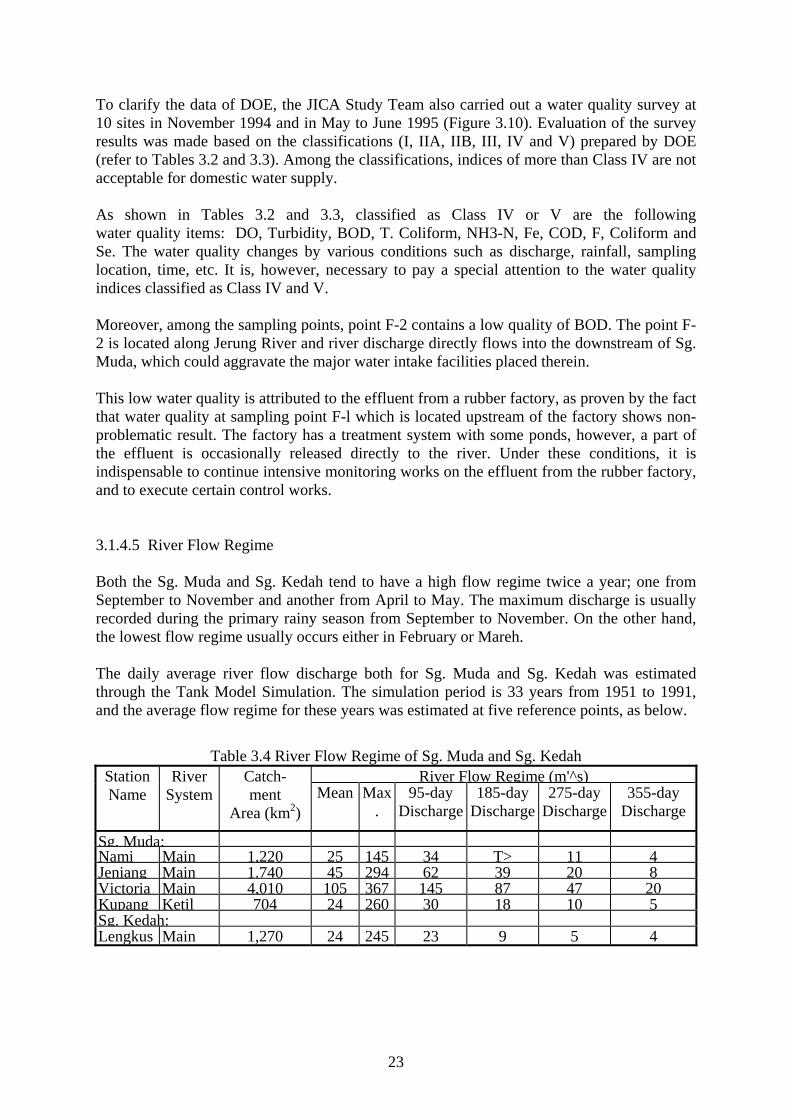
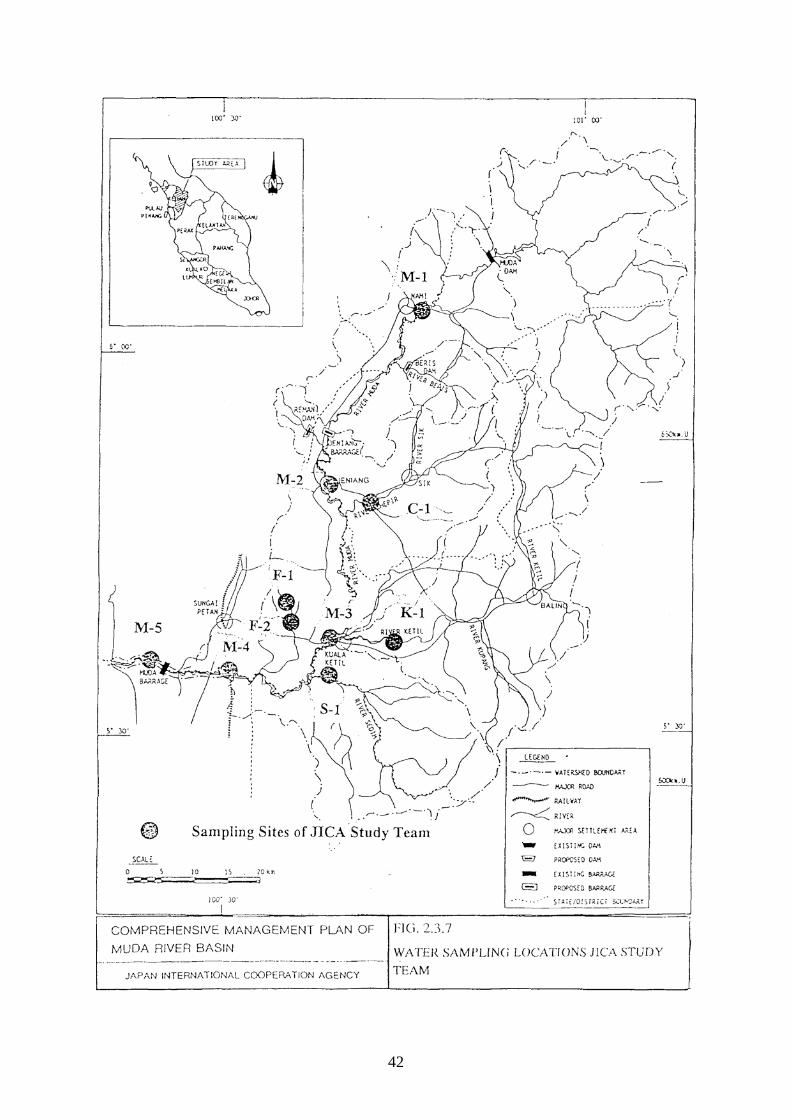
To clarify the data of DOE, the JICA Study Team also carried out a water quality survey at 10 sites in November 1994 and in May to June 1995 (Figure 3.10). Evaluation of the survey results was made based on the classifications (I, IIA, IIB, III, IV and V) prepared by DOE (refer to Tables 3.2 and 3.3). Among the classifications, indices of more than Class IV are not acceptable for domestic water supply. As shown in Tables 3.2 and 3.3, classified as Class IV or V are the following water quality items: DO, Turbidity, BOD, T. Coliform, NH3-N, Fe, COD, F, Coliform and Se. The water quality changes by various conditions such as discharge, rainfall, sampling location, time, etc. It is, however, necessary to pay a special attention to the water quality indices classified as Class IV and V. Moreover, among the sampling points, point F-2 contains a low quality of BOD. The point F-2 is located along Jerung River and river discharge directly flows into the downstream of Sg. Muda, which could aggravate the major water intake facilities placed therein. This low water quality is attributed to the effluent from a rubber factory, as proven by the fact that water quality at sampling point F-l which is located upstream of the factory shows non-problematic result. The factory has a treatment system with some ponds, however, a part of the effluent is occasionally released directly to the river. Under these conditions, it is indispensable to continue intensive monitoring works on the effluent from the rubber factory, and to execute certain control works. 3.1.4.5 River Flow Regime Both the Sg. Muda and Sg. Kedah tend to have a high flow regime twice a year; one from September to November and another from April to May. The maximum discharge is usually recorded during the primary rainy season from September to November. On the other hand, the lowest flow regime usually occurs either in February or Mareh. The daily average river flow discharge both for Sg. Muda and Sg. Kedah was estimated through the Tank Model Simulation. The simulation period is 33 years from 1951 to 1991, and the average flow regime for these years was estimated at five reference points, as below.
Table 3.4 River Flow Regime of Sg. Muda and Sg. Kedah River Flow Regime (m'^s) Station
Name
River System
Catch- ment
Area (km2) Mean
Max
. 95-day
Discharge185-day
Discharge275-day
Discharge 355-day
Discharge
Sg. Muda:Nami Main 1,220 25 145 34 T> 11 4Jeniang Main 1.740 45 294 62 39 20 8Victoria Main 4,010 105 367 145 87 47 20Kupang Ketil 704 24 260 30 18 10 5Sg. Kedah: Lengkus Main 1,270 24 245 23 9 5 4
24
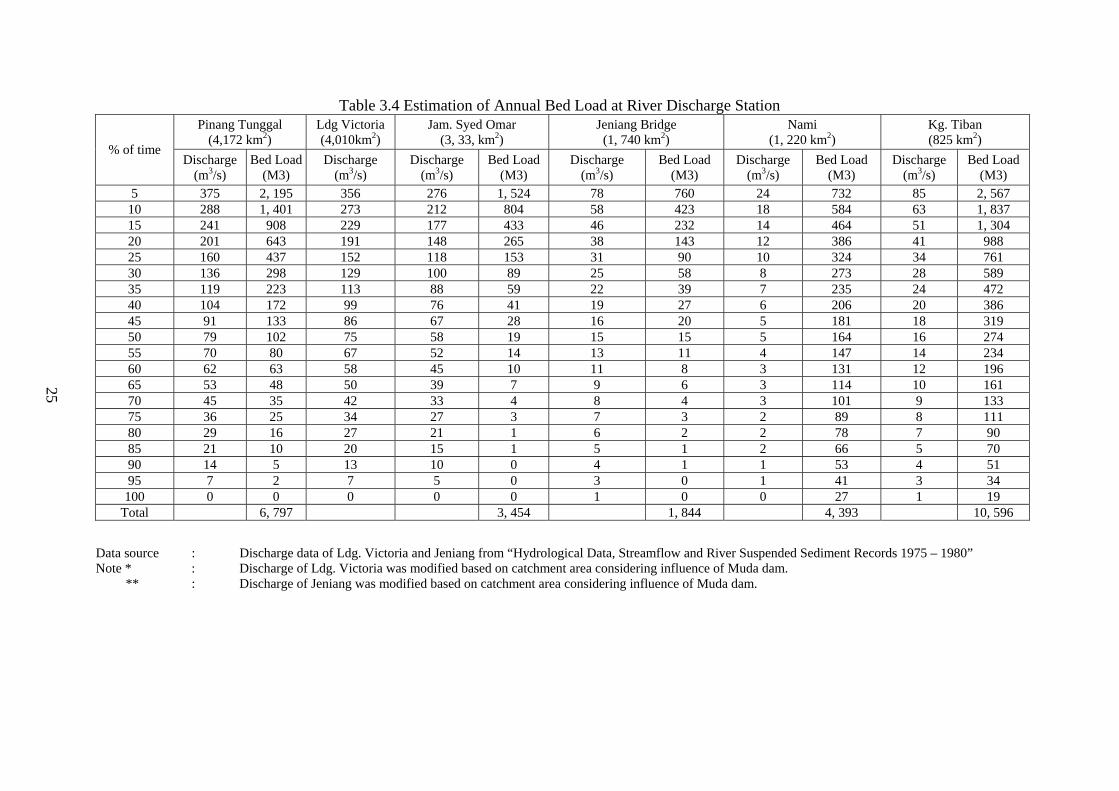
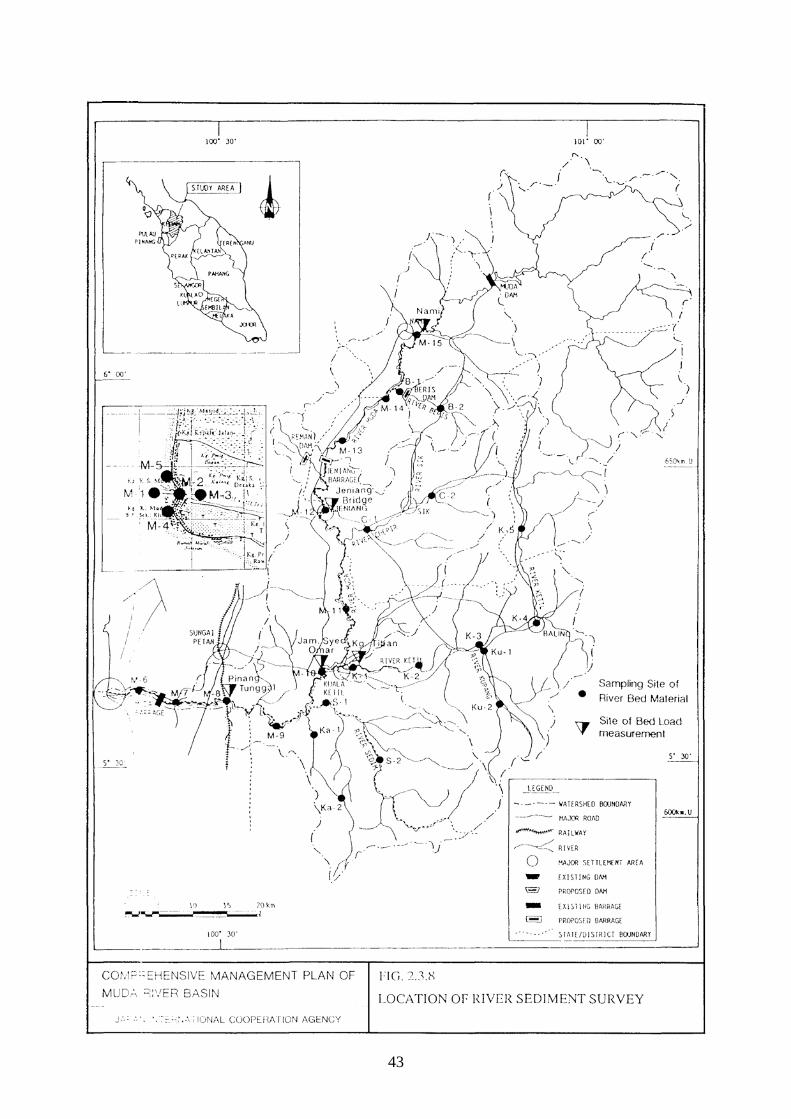
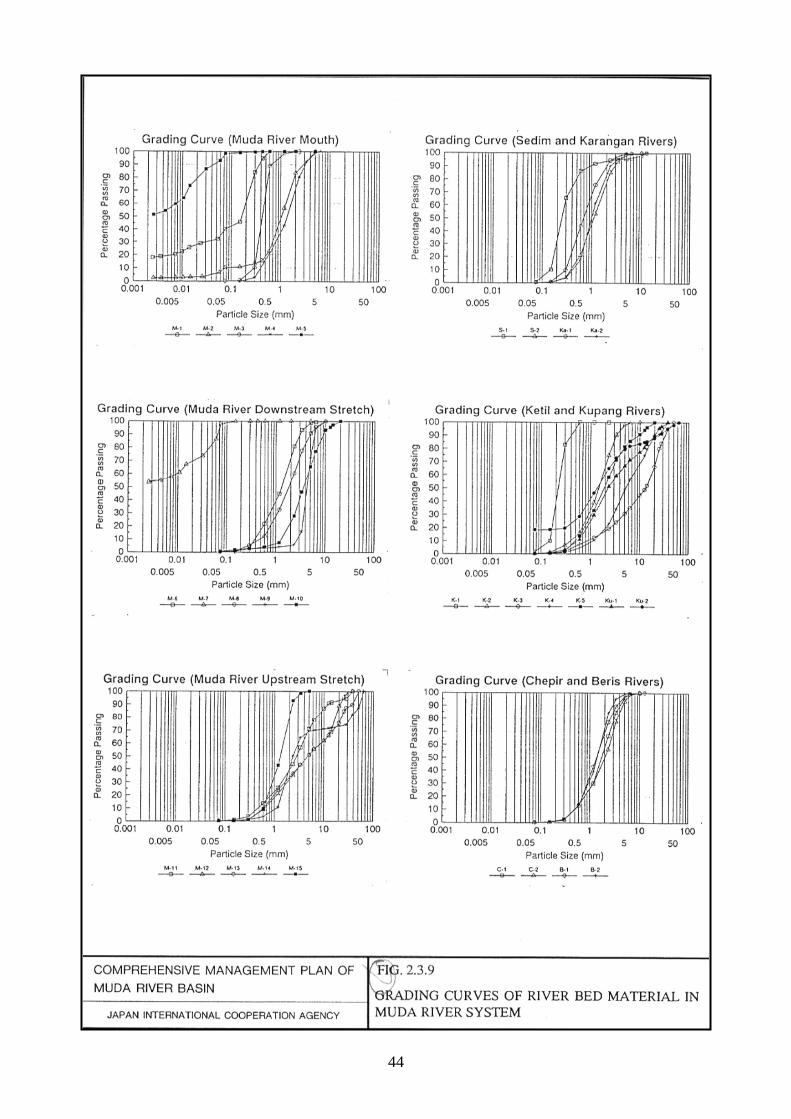
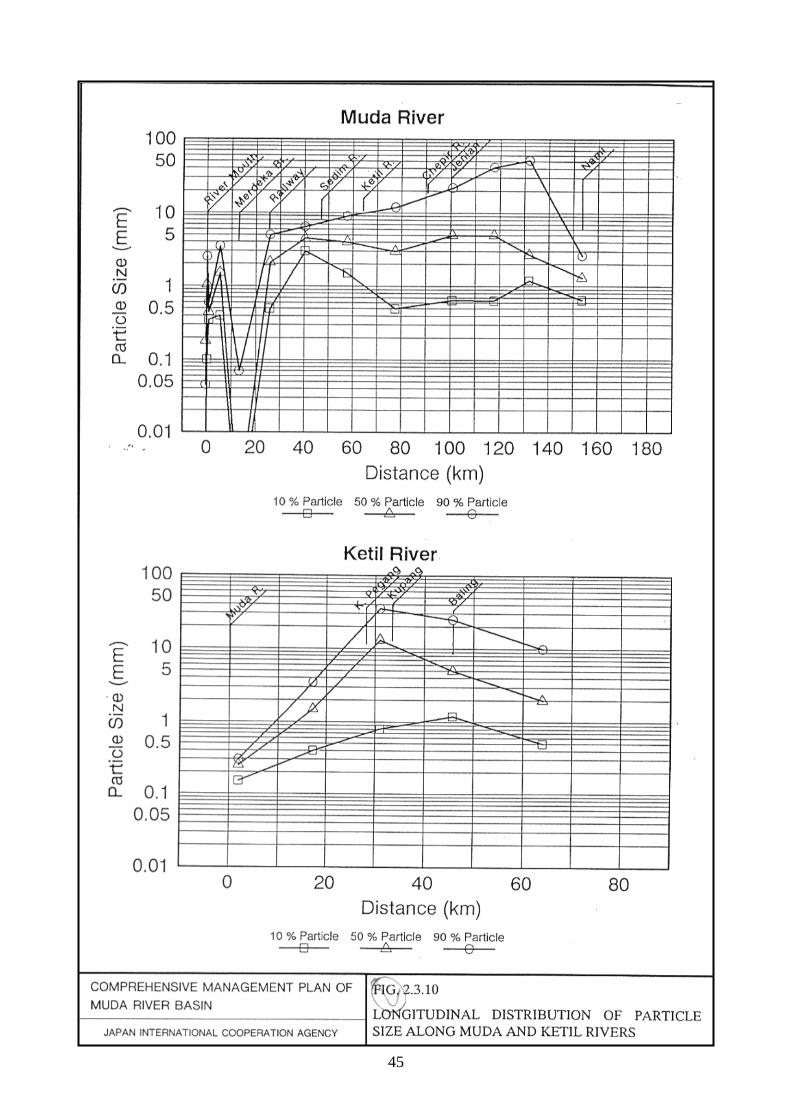
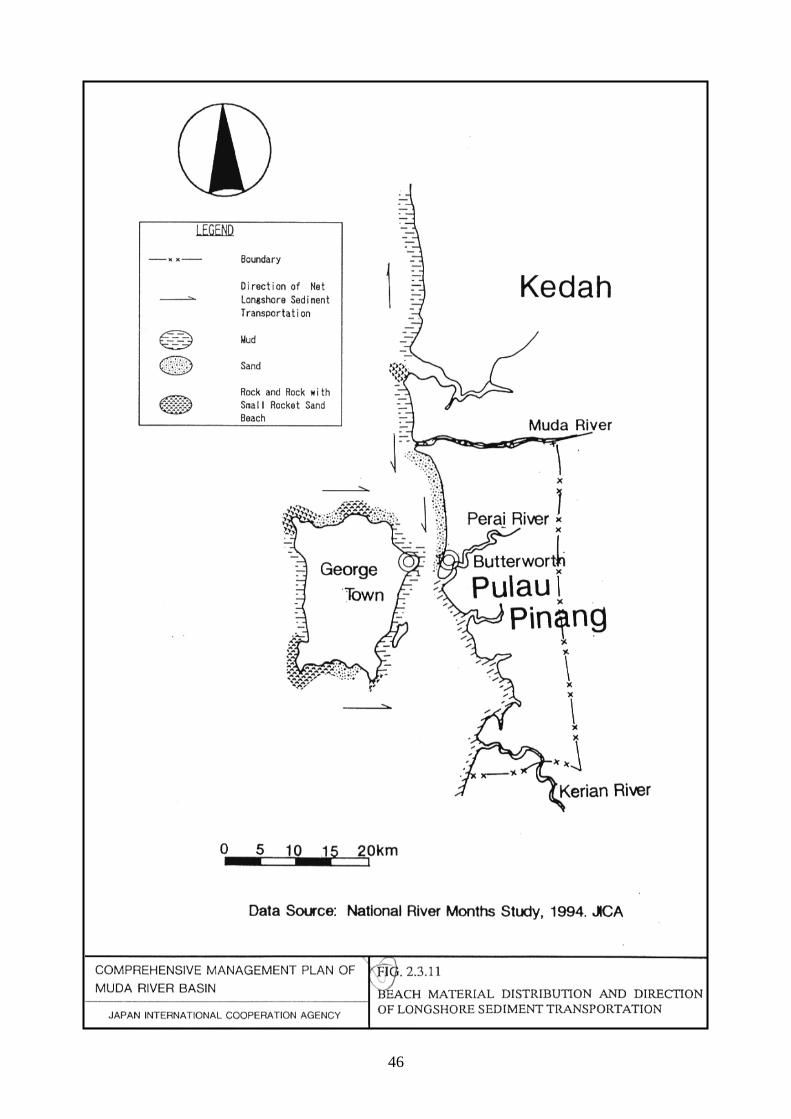
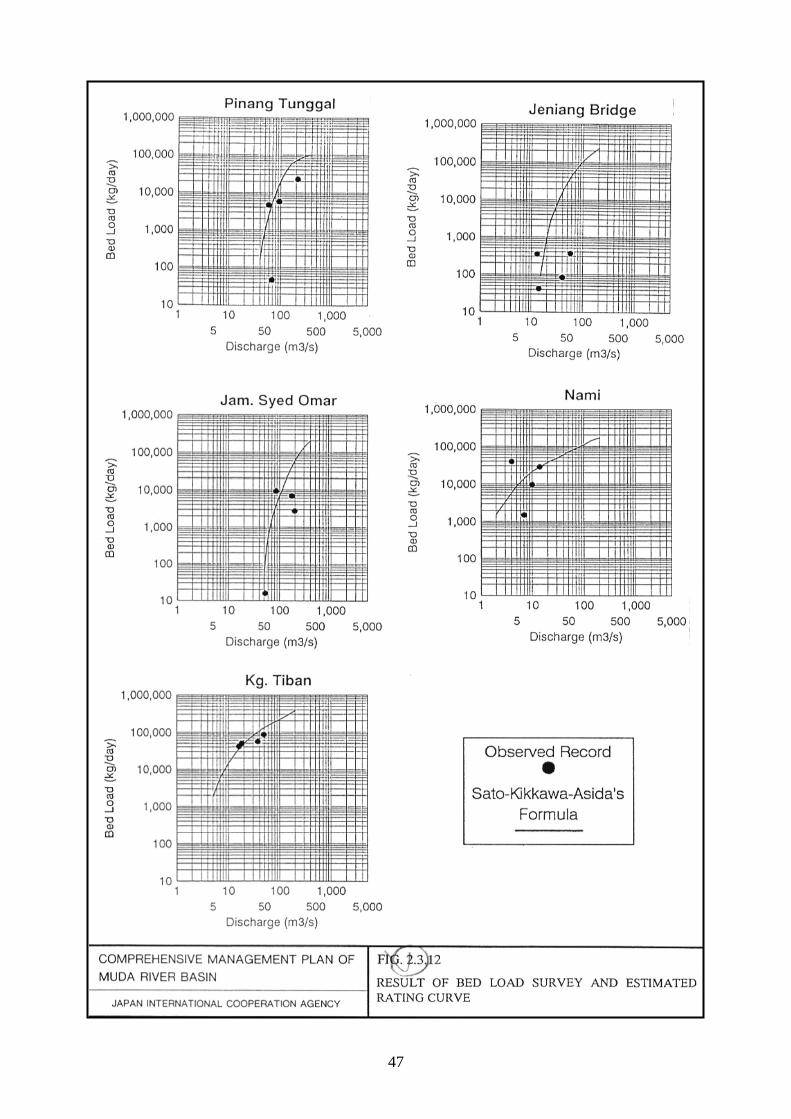
3.1.4.6 Riverbed Material A riverbed material survey was made to know the particle size distribution and specific gravity of riverbed materials at thirty (30) sampling sites. The locations of sampling sites are as shown in Figure 3.11, and the results of laboratory tests on the samples are as shown in Figure 3.12 and 3.13. Ft was clarified from the results of the laboratory tests that sand (0.074 to 4.76 mm) and gravel (4.76 to 76.2 mm) are dominant on the main stream and tributaries, and the riverbed materials sampled upstream tend to be coarser. The riverbed materials sampled at the north side of the river mouth are very fine and muddy, while those at the south side are coarse and sandy. Moreover, a sand bar has formed from north to south of the river mouth, as shown in Figure 3.14. These noteworthy facts show that there is a dominant southward ocean current around the mouth of Sg. Muda carrying sandy materials from the north to the south. 3.1.4.7 River Bed Load Sediment in the river channel is divided into bed load, suspended load and wash load. Among them, bed load is the most influential in the change of sandy riverbed like the Sg. Muda. In this connection, the bed load sampling test was carried out at 5 locations (refer to Figure 3.11). Rating curves between the observed bed load and flow discharge were developed for each sampling point from the results of the sampling test, as shown in Figure 3.15. Furthermore, based on the daily discharge records and the bed load rating curves, it was estimated that the annual bed load of Sg. Muda is about 10,000 m (refer to Table 3.4). 3.1.4.8 Fauna and Flora Sg. Muda had been well known as a habitat of freshwater turtles. However, the number of turtles has remarkably decreased since the sand mining was intensively made. It would now be a kind of endangered species. The artificial breeding of freshwater turtles has been carried out on Penang Island since 1980 and the young turtles have been released to Sg. Muda as well as the rivers in Penang Island. In addition to the freshwater turtles, the following species of fish live in Sg. Muda:
River Crab, Climhing Perch, Freshwater Catfish, Swamp Eel, Fcathcrback, Gourami, Snakehead and Goby.
Forest areas cover a large part of the Muda river basin and most of them are delineated as forest reserve by FDHPM. In the forest reserve area, the dominant species identified through the survey for Boris Dam Project are Kedondong, Kelat, Kerwing, Periang and Nyatoh. Natural vegetation along Sg. Muda is, however, quite limited except the upstream area of Muda Dam. The dominant vegetation along the river is the planted agricultural trees such as rubber tree, oil palm tree, fruit/garden trees, and nippa palm.
25
25
Table 3.4 Estimation of Annual Bed Load at River Discharge Station Pinang Tunggal
(4,172 km2) Ldg Victoria (4,010km2)
Jam. Syed Omar (3, 33, km2)
Jeniang Bridge (1, 740 km2)
Nami (1, 220 km2)
Kg. Tiban (825 km2)
% of time Discharge
(m3/s) Bed Load
(M3) Discharge
(m3/s) Discharge
(m3/s) Bed Load
(M3) Discharge
(m3/s) Bed Load
(M3) Discharge
(m3/s) Bed Load
(M3) Discharge
(m3/s) Bed Load
(M3) 5 375 2, 195 356 276 1, 524 78 760 24 732 85 2, 567
10 288 1, 401 273 212 804 58 423 18 584 63 1, 837 15 241 908 229 177 433 46 232 14 464 51 1, 304 20 201 643 191 148 265 38 143 12 386 41 988 25 160 437 152 118 153 31 90 10 324 34 761 30 136 298 129 100 89 25 58 8 273 28 589 35 119 223 113 88 59 22 39 7 235 24 472 40 104 172 99 76 41 19 27 6 206 20 386 45 91 133 86 67 28 16 20 5 181 18 319 50 79 102 75 58 19 15 15 5 164 16 274 55 70 80 67 52 14 13 11 4 147 14 234 60 62 63 58 45 10 11 8 3 131 12 196 65 53 48 50 39 7 9 6 3 114 10 161 70 45 35 42 33 4 8 4 3 101 9 133 75 36 25 34 27 3 7 3 2 89 8 111 80 29 16 27 21 1 6 2 2 78 7 90 85 21 10 20 15 1 5 1 2 66 5 70 90 14 5 13 10 0 4 1 1 53 4 51 95 7 2 7 5 0 3 0 1 41 3 34 100 0 0 0 0 0 1 0 0 27 1 19
Total 6, 797 3, 454 1, 844 4, 393 10, 596
Data source : Discharge data of Ldg. Victoria and Jeniang from “Hydrological Data, Streamflow and River Suspended Sediment Records 1975 – 1980” Note * : Discharge of Ldg. Victoria was modified based on catchment area considering influence of Muda dam. ** : Discharge of Jeniang was modified based on catchment area considering influence of Muda dam.
26
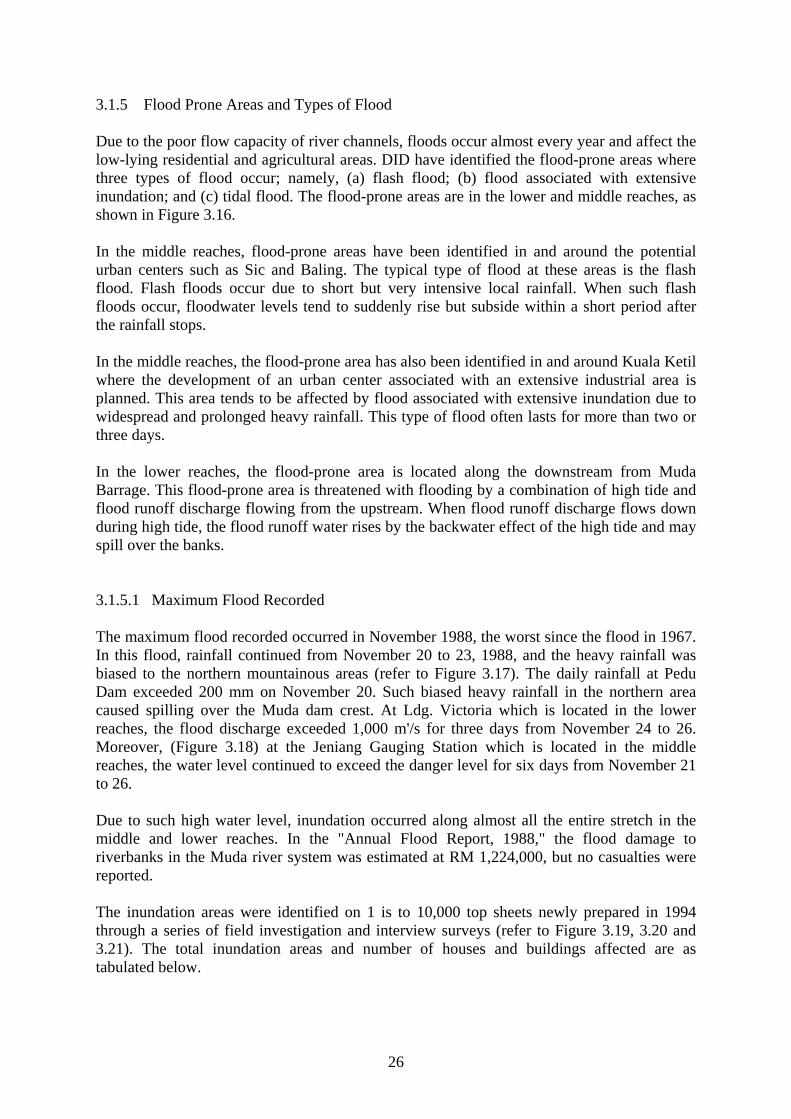
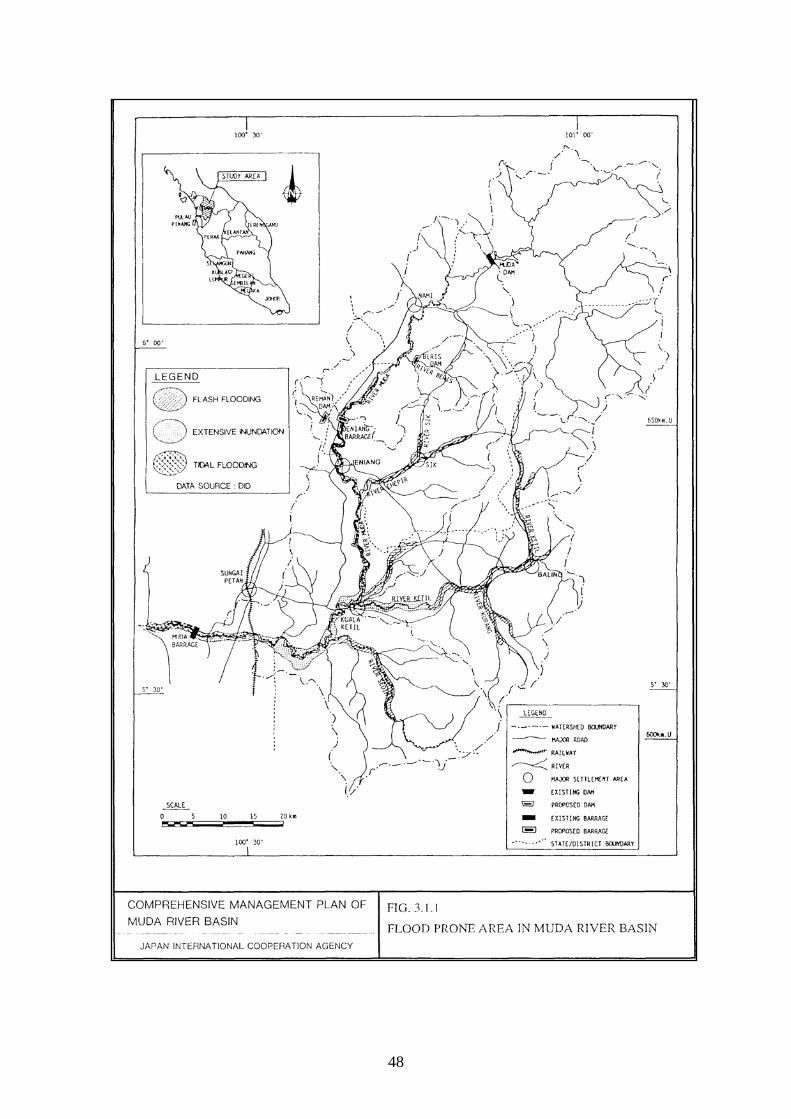
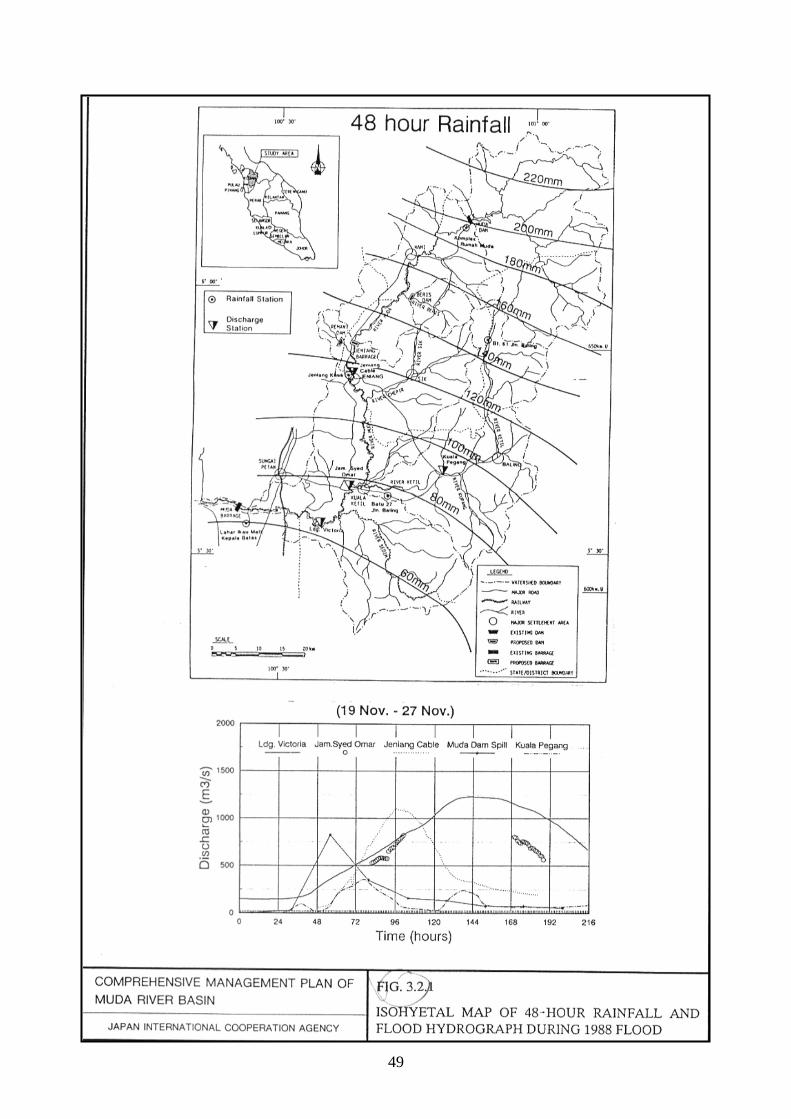
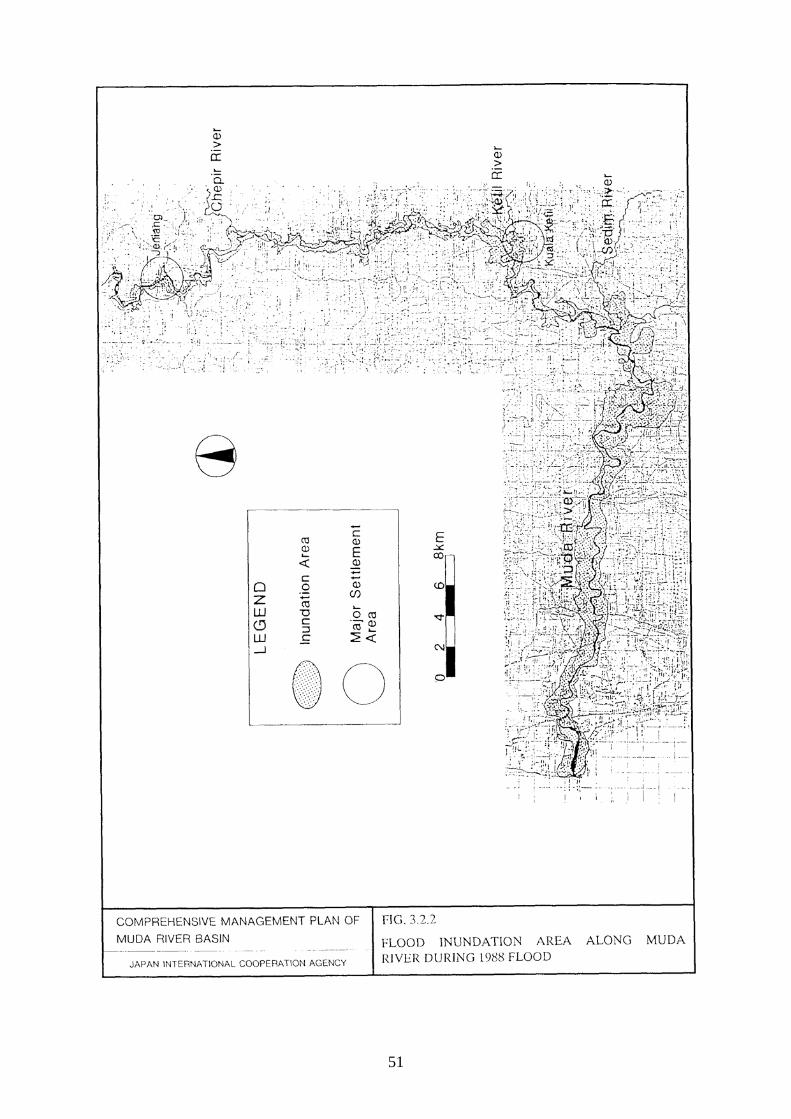
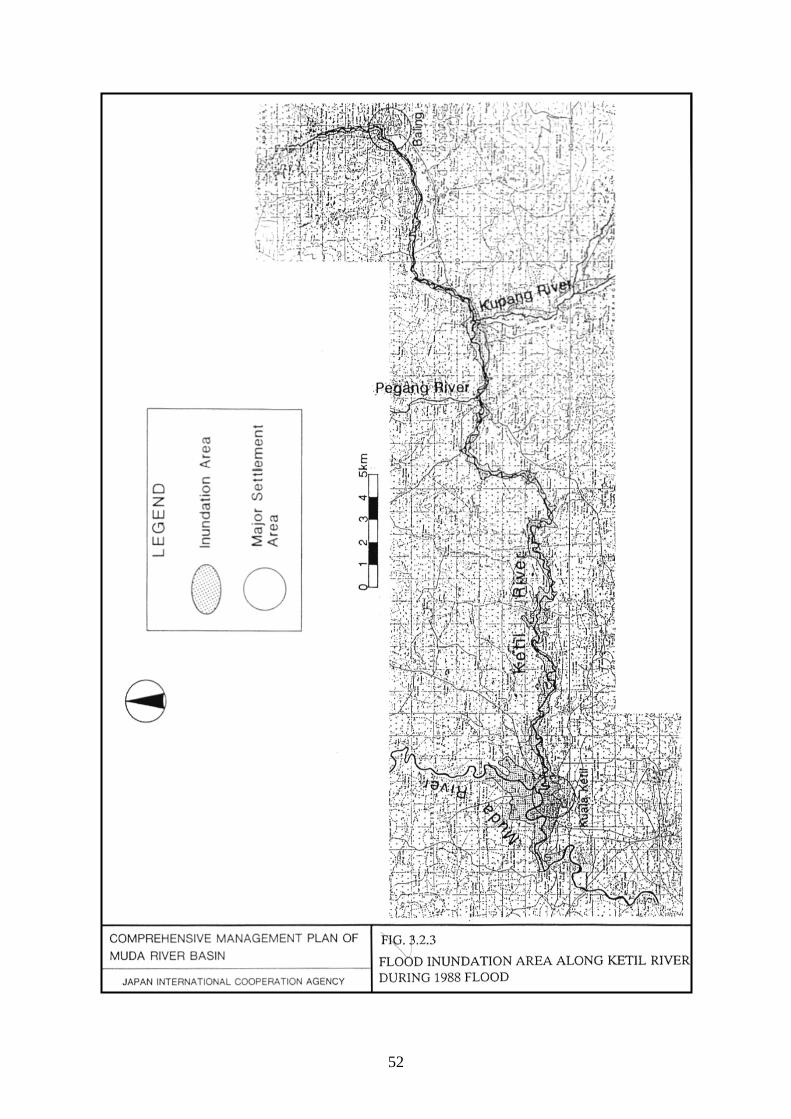
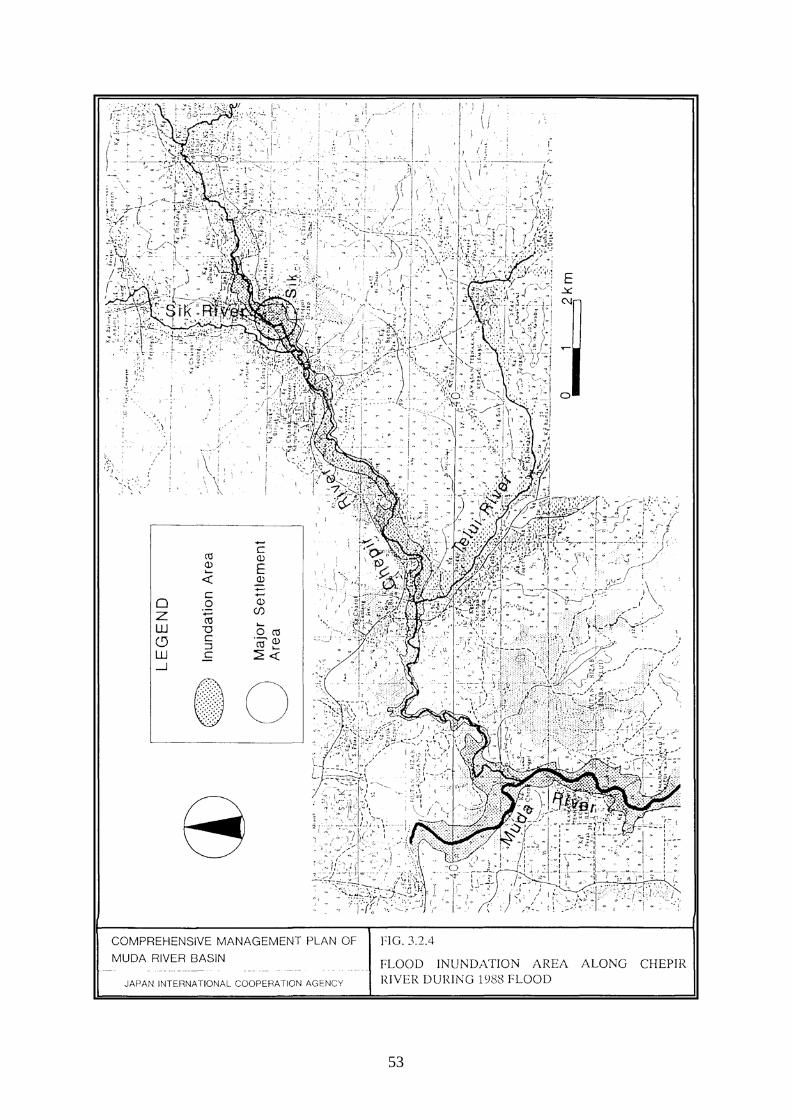
3.1.5 Flood Prone Areas and Types of Flood Due to the poor flow capacity of river channels, floods occur almost every year and affect the low-lying residential and agricultural areas. DID have identified the flood-prone areas where three types of flood occur; namely, (a) flash flood; (b) flood associated with extensive inundation; and (c) tidal flood. The flood-prone areas are in the lower and middle reaches, as shown in Figure 3.16. In the middle reaches, flood-prone areas have been identified in and around the potential urban centers such as Sic and Baling. The typical type of flood at these areas is the flash flood. Flash floods occur due to short but very intensive local rainfall. When such flash floods occur, floodwater levels tend to suddenly rise but subside within a short period after the rainfall stops. In the middle reaches, the flood-prone area has also been identified in and around Kuala Ketil where the development of an urban center associated with an extensive industrial area is planned. This area tends to be affected by flood associated with extensive inundation due to widespread and prolonged heavy rainfall. This type of flood often lasts for more than two or three days. In the lower reaches, the flood-prone area is located along the downstream from Muda Barrage. This flood-prone area is threatened with flooding by a combination of high tide and flood runoff discharge flowing from the upstream. When flood runoff discharge flows down during high tide, the flood runoff water rises by the backwater effect of the high tide and may spill over the banks. 3.1.5.1 Maximum Flood Recorded The maximum flood recorded occurred in November 1988, the worst since the flood in 1967. In this flood, rainfall continued from November 20 to 23, 1988, and the heavy rainfall was biased to the northern mountainous areas (refer to Figure 3.17). The daily rainfall at Pedu Dam exceeded 200 mm on November 20. Such biased heavy rainfall in the northern area caused spilling over the Muda dam crest. At Ldg. Victoria which is located in the lower reaches, the flood discharge exceeded 1,000 m'/s for three days from November 24 to 26. Moreover, (Figure 3.18) at the Jeniang Gauging Station which is located in the middle reaches, the water level continued to exceed the danger level for six days from November 21 to 26. Due to such high water level, inundation occurred along almost all the entire stretch in the middle and lower reaches. In the "Annual Flood Report, 1988," the flood damage to riverbanks in the Muda river system was estimated at RM 1,224,000, but no casualties were reported. The inundation areas were identified on 1 is to 10,000 top sheets newly prepared in 1994 through a series of field investigation and interview surveys (refer to Figure 3.19, 3.20 and 3.21). The total inundation areas and number of houses and buildings affected are as tabulated below.
27
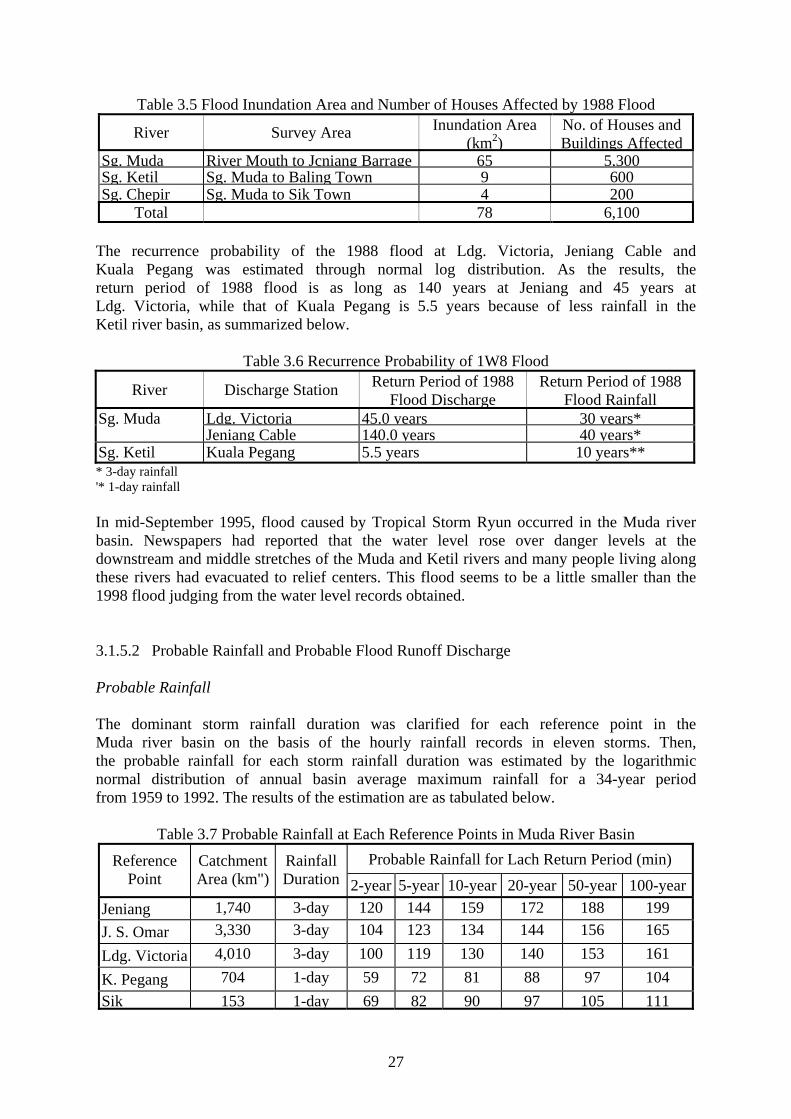
Table 3.5 Flood Inundation Area and Number of Houses Affected by 1988 Flood
River Survey Area Inundation Area (km2)
No. of Houses andBuildings Affected
Sg. Muda River Mouth to Jcniang Barrage 65 5,300 Sg. Ketil Sg. Muda to Baling Town 9 600 Sg. Chepir Sg. Muda to Sik Town 4 200
Total 78 6,100 The recurrence probability of the 1988 flood at Ldg. Victoria, Jeniang Cable and Kuala Pegang was estimated through normal log distribution. As the results, the return period of 1988 flood is as long as 140 years at Jeniang and 45 years at Ldg. Victoria, while that of Kuala Pegang is 5.5 years because of less rainfall in the Ketil river basin, as summarized below.
Table 3.6 Recurrence Probability of 1W8 Flood
River Discharge Station Return Period of 1988 Flood Discharge
Return Period of 1988Flood Rainfall
Ldg. Victoria 45.0 years 30 years* Sg. Muda Jeniang Cable 140.0 years 40 years*
Sg. Ketil Kuala Pegang 5.5 years 10 years** * 3-day rainfall '* 1-day rainfall In mid-September 1995, flood caused by Tropical Storm Ryun occurred in the Muda river basin. Newspapers had reported that the water level rose over danger levels at the downstream and middle stretches of the Muda and Ketil rivers and many people living along these rivers had evacuated to relief centers. This flood seems to be a little smaller than the 1998 flood judging from the water level records obtained. 3.1.5.2 Probable Rainfall and Probable Flood Runoff Discharge Probable Rainfall The dominant storm rainfall duration was clarified for each reference point in the Muda river basin on the basis of the hourly rainfall records in eleven storms. Then, the probable rainfall for each storm rainfall duration was estimated by the logarithmic normal distribution of annual basin average maximum rainfall for a 34-year period from 1959 to 1992. The results of the estimation are as tabulated below.
Table 3.7 Probable Rainfall at Each Reference Points in Muda River Basin Probable Rainfall for Lach Return Period (min) Reference
Point Catchment Area (km")
RainfallDuration 2-year 5-year 10-year 20-year 50-year 100-year
Jeniang 1,740 3-day 120 144 159 172 188 199 J. S. Omar 3,330 3-day 104 123 134 144 156 165 Ldg. Victoria 4,010 3-day 100 119 130 140 153 161 K. Pegang 704 1-day 59 72 81 88 97 104 Sik 153 1-day 69 82 90 97 105 111
28
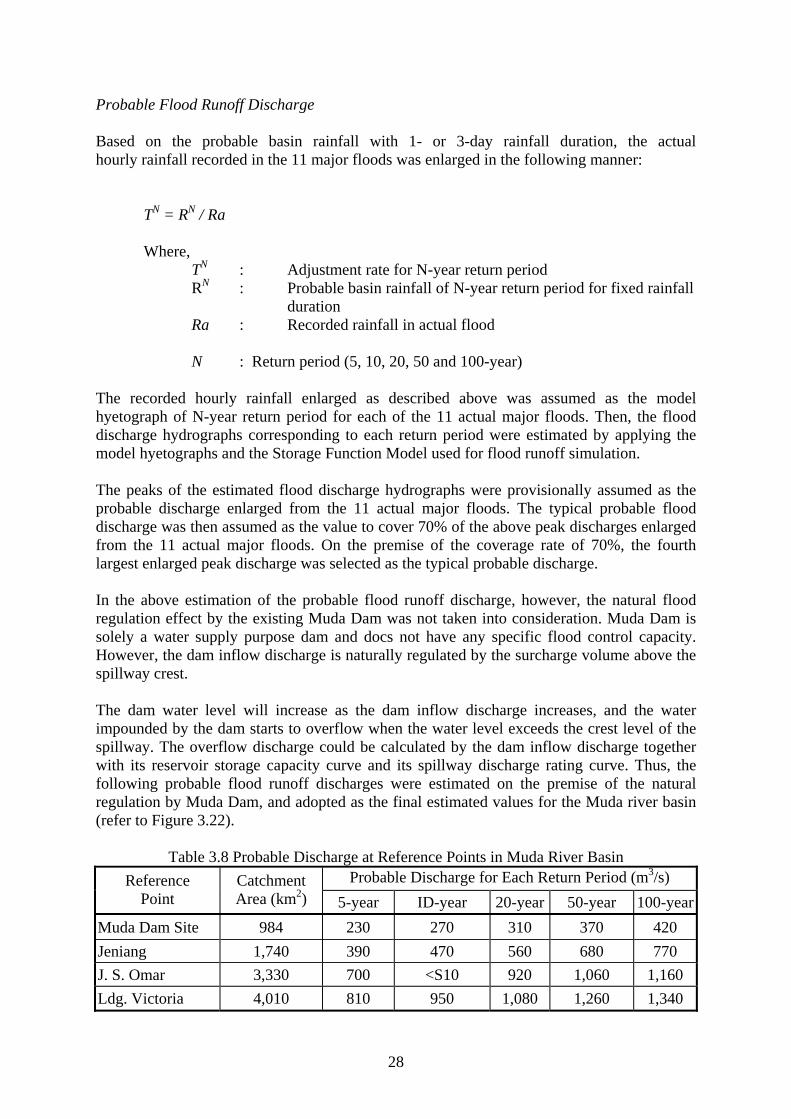
Probable Flood Runoff Discharge Based on the probable basin rainfall with 1- or 3-day rainfall duration, the actual hourly rainfall recorded in the 11 major floods was enlarged in the following manner:
TN = RN / Ra Where, TN : Adjustment rate for N-year return period
RN : Probable basin rainfall of N-year return period for fixed rainfall duration
Ra : Recorded rainfall in actual flood
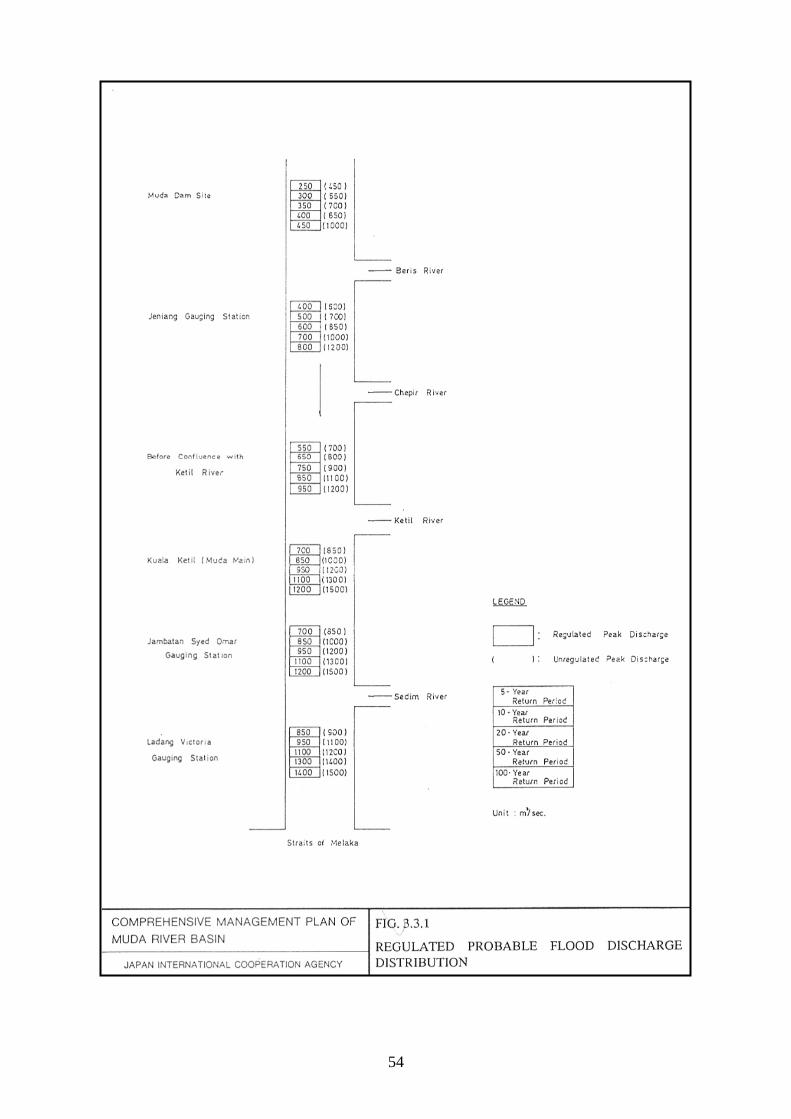
N : Return period (5, 10, 20, 50 and 100-year) The recorded hourly rainfall enlarged as described above was assumed as the model hyetograph of N-year return period for each of the 11 actual major floods. Then, the flood discharge hydrographs corresponding to each return period were estimated by applying the model hyetographs and the Storage Function Model used for flood runoff simulation. The peaks of the estimated flood discharge hydrographs were provisionally assumed as the probable discharge enlarged from the 11 actual major floods. The typical probable flood discharge was then assumed as the value to cover 70% of the above peak discharges enlarged from the 11 actual major floods. On the premise of the coverage rate of 70%, the fourth largest enlarged peak discharge was selected as the typical probable discharge. In the above estimation of the probable flood runoff discharge, however, the natural flood regulation effect by the existing Muda Dam was not taken into consideration. Muda Dam is solely a water supply purpose dam and docs not have any specific flood control capacity. However, the dam inflow discharge is naturally regulated by the surcharge volume above the spillway crest. The dam water level will increase as the dam inflow discharge increases, and the water impounded by the dam starts to overflow when the water level exceeds the crest level of the spillway. The overflow discharge could be calculated by the dam inflow discharge together with its reservoir storage capacity curve and its spillway discharge rating curve. Thus, the following probable flood runoff discharges were estimated on the premise of the natural regulation by Muda Dam, and adopted as the final estimated values for the Muda river basin (refer to Figure 3.22).
Table 3.8 Probable Discharge at Reference Points in Muda River Basin Probable Discharge for Each Return Period (m3/s) Reference
Point Catchment Area (km2) 5-year ID-year 20-year 50-year 100-year
Muda Dam Site 984 230 270 310 370 420 Jeniang 1,740 390 470 560 680 770 J. S. Omar 3,330 700 <S10 920 1,060 1,160 Ldg. Victoria 4,010 810 950 1,080 1,260 1,340
29
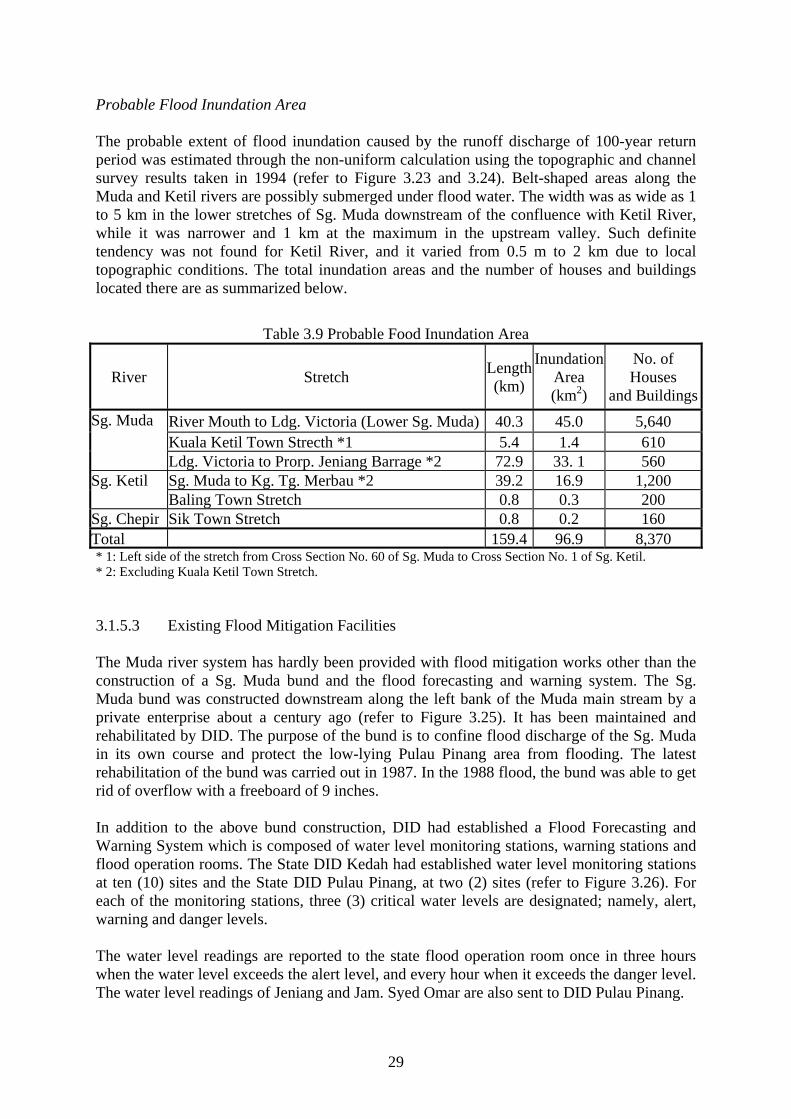
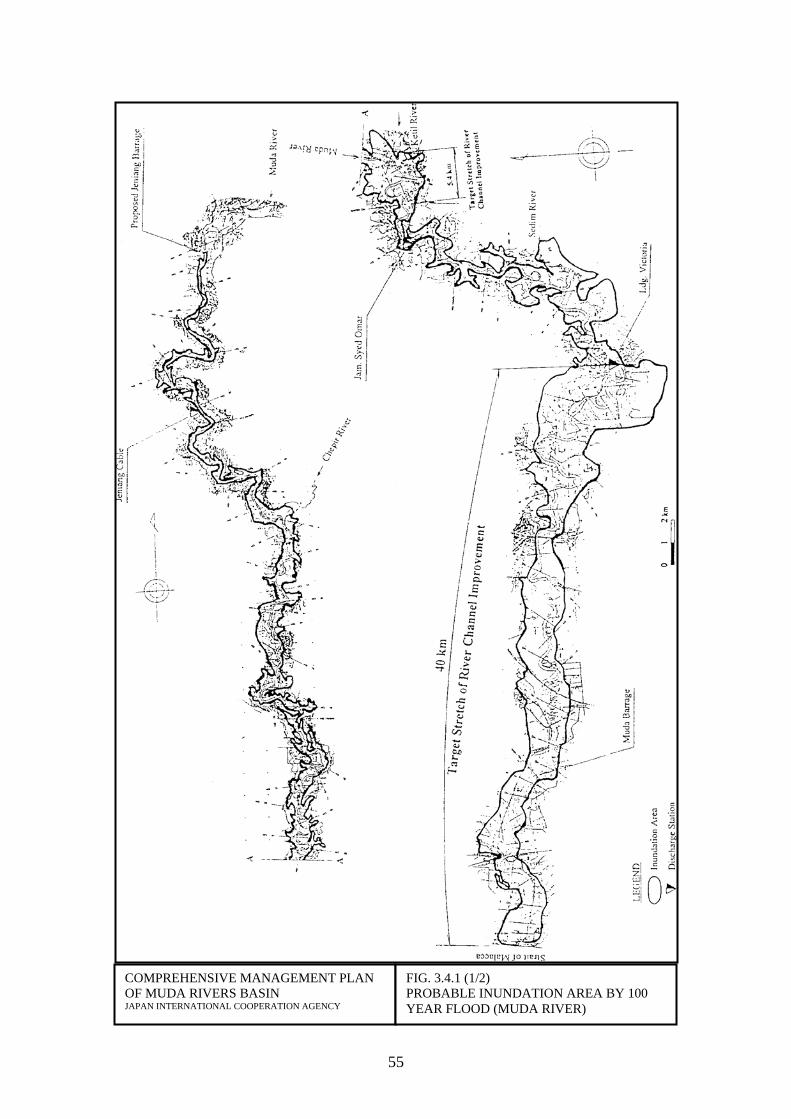
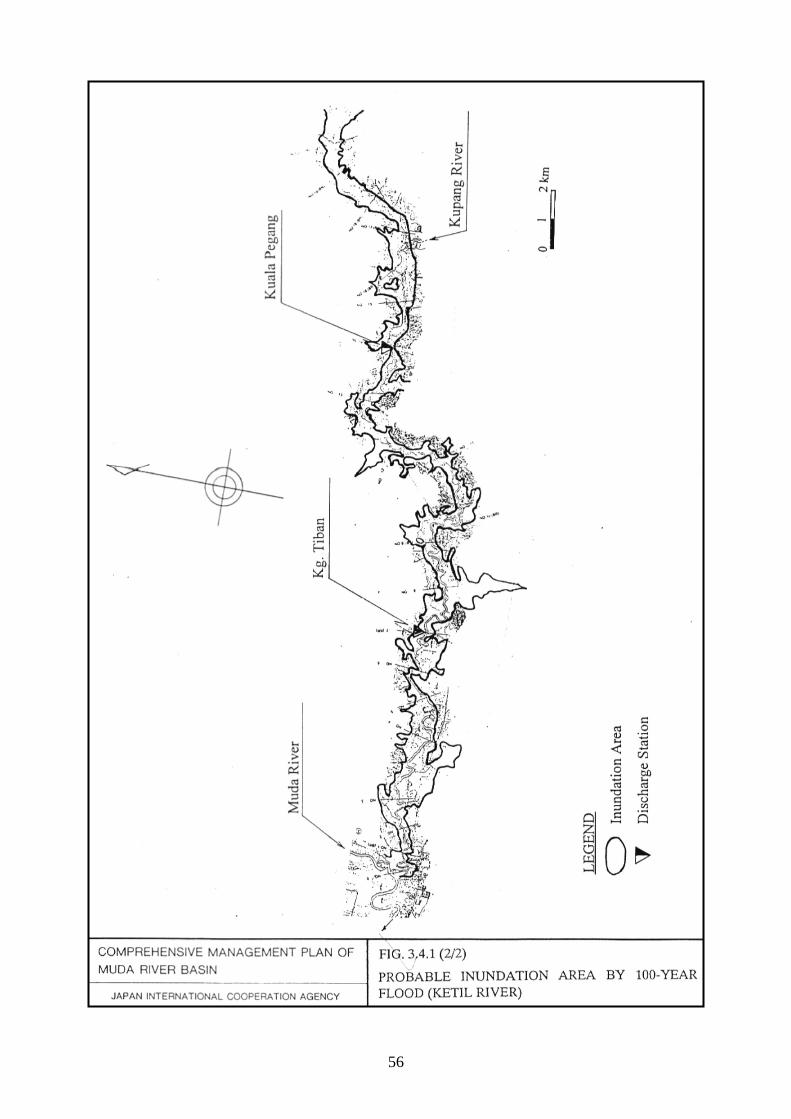
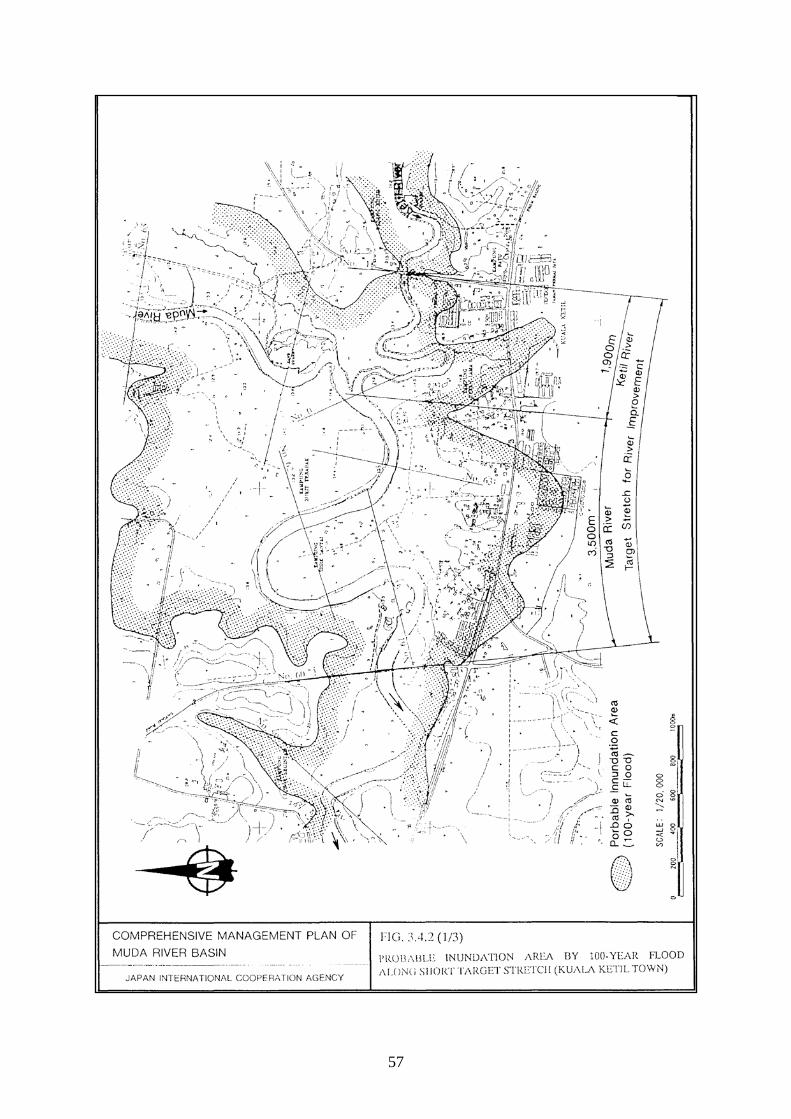
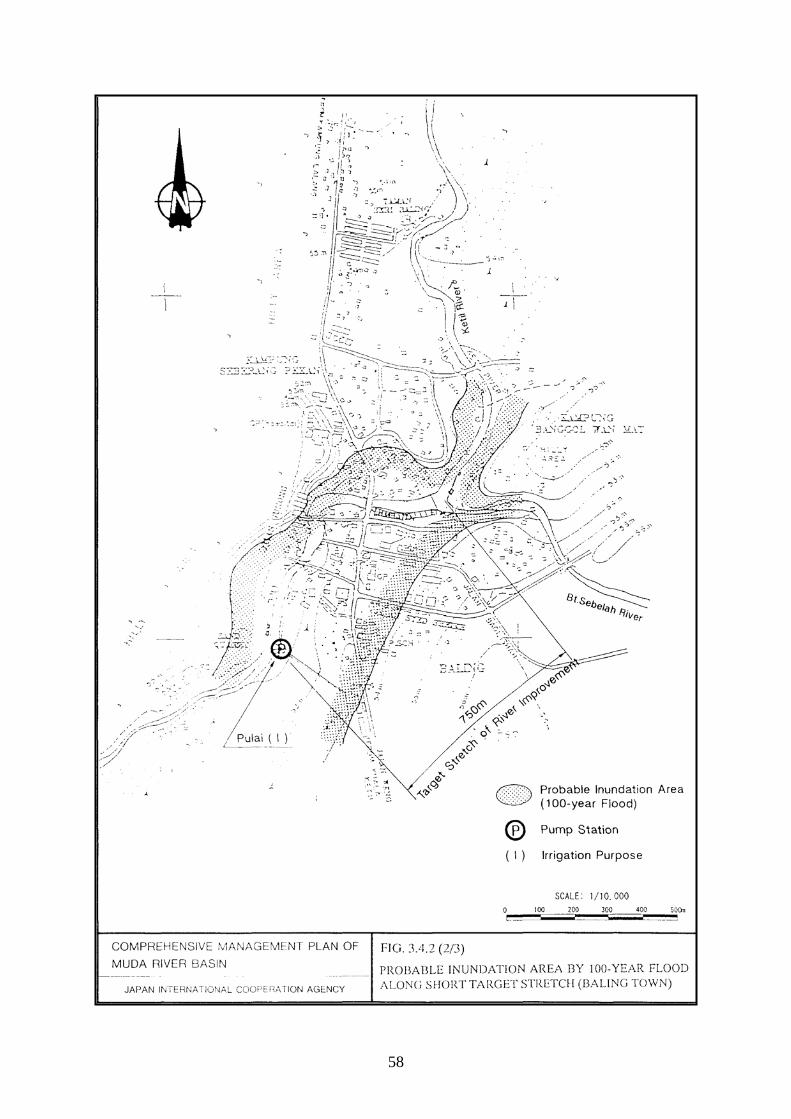
Probable Flood Inundation Area The probable extent of flood inundation caused by the runoff discharge of 100-year return period was estimated through the non-uniform calculation using the topographic and channel survey results taken in 1994 (refer to Figure 3.23 and 3.24). Belt-shaped areas along the Muda and Ketil rivers are possibly submerged under flood water. The width was as wide as 1 to 5 km in the lower stretches of Sg. Muda downstream of the confluence with Ketil River, while it was narrower and 1 km at the maximum in the upstream valley. Such definite tendency was not found for Ketil River, and it varied from 0.5 m to 2 km due to local topographic conditions. The total inundation areas and the number of houses and buildings located there are as summarized below.
Table 3.9 Probable Food Inundation Area
River Stretch Length(km)
Inundation Area (km2)
No. of Houses
and BuildingsRiver Mouth to Ldg. Victoria (Lower Sg. Muda) 40.3 45.0 5,640 Kuala Ketil Town Strecth *1 5.4 1.4 610
Sg. Muda
Ldg. Victoria to Prorp. Jeniang Barrage *2 72.9 33. 1 560Sg. Muda to Kg. Tg. Merbau *2 39.2 16.9 1,200Sg. Ketil
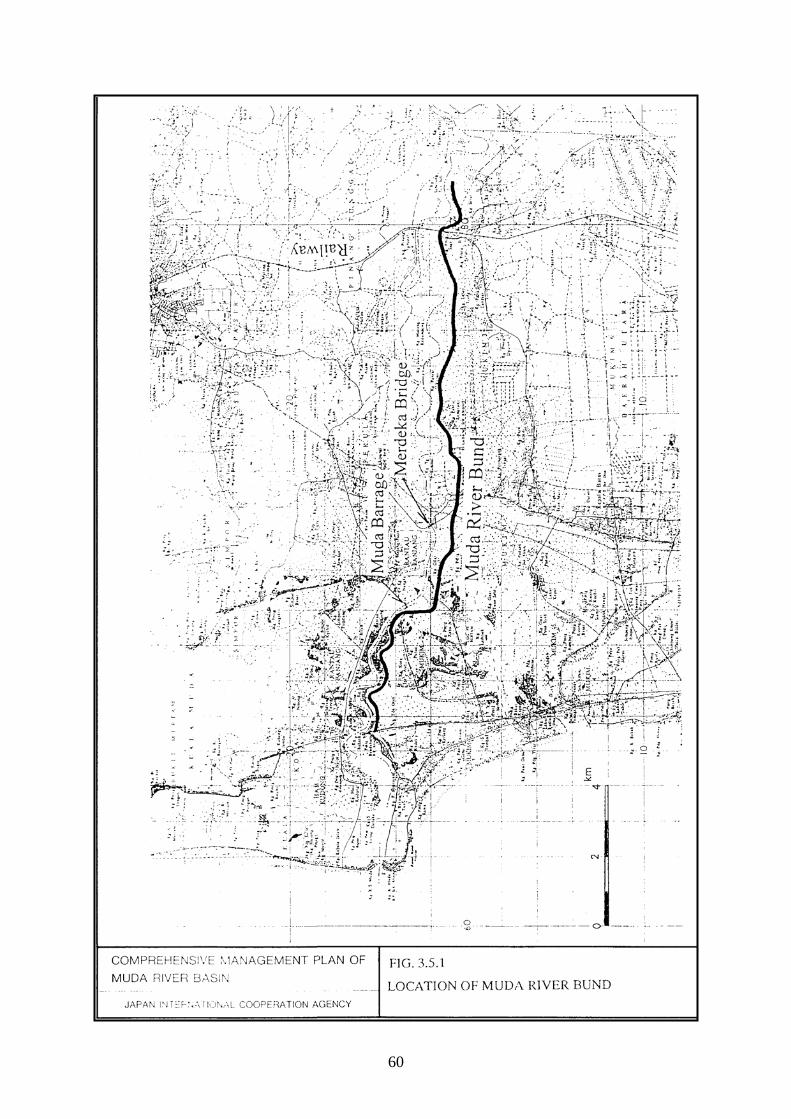
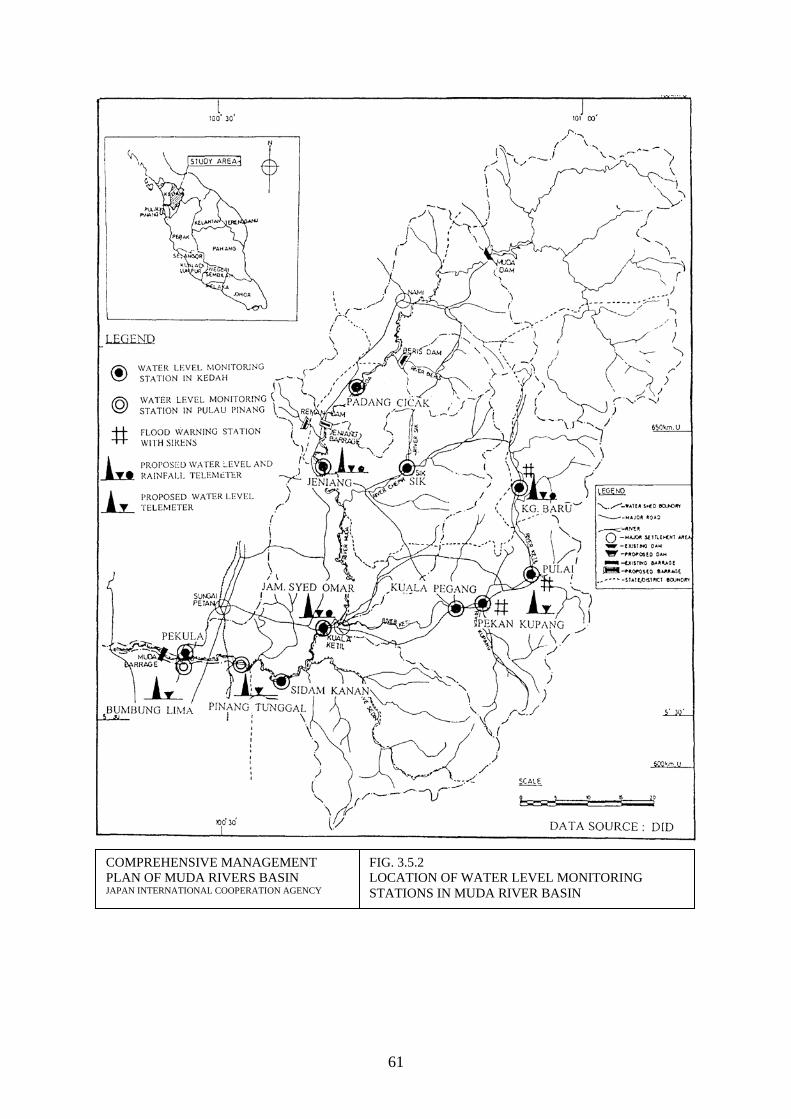
Baling Town Stretch 0.8 0.3 200Sg. Chepir Sik Town Stretch 0.8 0.2 160Total 159.4 96.9 8,370* 1: Left side of the stretch from Cross Section No. 60 of Sg. Muda to Cross Section No. 1 of Sg. Ketil. * 2: Excluding Kuala Ketil Town Stretch. 3.1.5.3 Existing Flood Mitigation Facilities The Muda river system has hardly been provided with flood mitigation works other than the construction of a Sg. Muda bund and the flood forecasting and warning system. The Sg. Muda bund was constructed downstream along the left bank of the Muda main stream by a private enterprise about a century ago (refer to Figure 3.25). It has been maintained and rehabilitated by DID. The purpose of the bund is to confine flood discharge of the Sg. Muda in its own course and protect the low-lying Pulau Pinang area from flooding. The latest rehabilitation of the bund was carried out in 1987. In the 1988 flood, the bund was able to get rid of overflow with a freeboard of 9 inches. In addition to the above bund construction, DID had established a Flood Forecasting and Warning System which is composed of water level monitoring stations, warning stations and flood operation rooms. The State DID Kedah had established water level monitoring stations at ten (10) sites and the State DID Pulau Pinang, at two (2) sites (refer to Figure 3.26). For each of the monitoring stations, three (3) critical water levels are designated; namely, alert, warning and danger levels. The water level readings are reported to the state flood operation room once in three hours when the water level exceeds the alert level, and every hour when it exceeds the danger level. The water level readings of Jeniang and Jam. Syed Omar are also sent to DID Pulau Pinang.
30
Among the monitoring stations, six (6) stations are scheduled to be equipped with a telemeter data transmission system. These stations are Jeniang, Jam. Syed Omar, Pinang Tunggal and Bumbung Lima along Sg. Muda, and Kg. Baru and Rumah Pam Pulai along Sg. Ketil. The warning stations with sirens are located in the upstream areas which are subject to flash floods. The sirens are automatically activated when the river stage reaches the warning level; thus, giving immediate warning to the surrounding population. The flood operation rooms are set up annually at DID state and district offices from the 1st of August to the 15th of January to forecast the flood conditions and issue the necessary instructions. The rooms are provided with communication equipment such as VHF set, telephones and facsimile machines to receive or send information such as rainfall, water level, warnings, flood damage and evacuation.
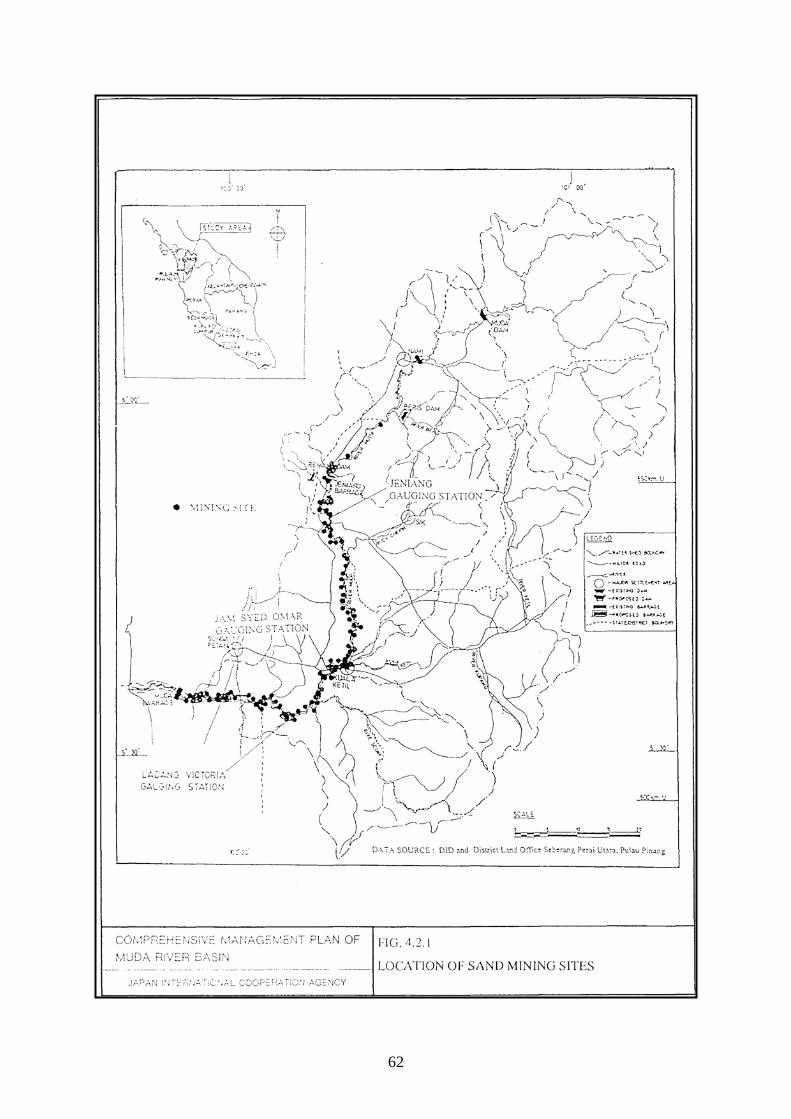
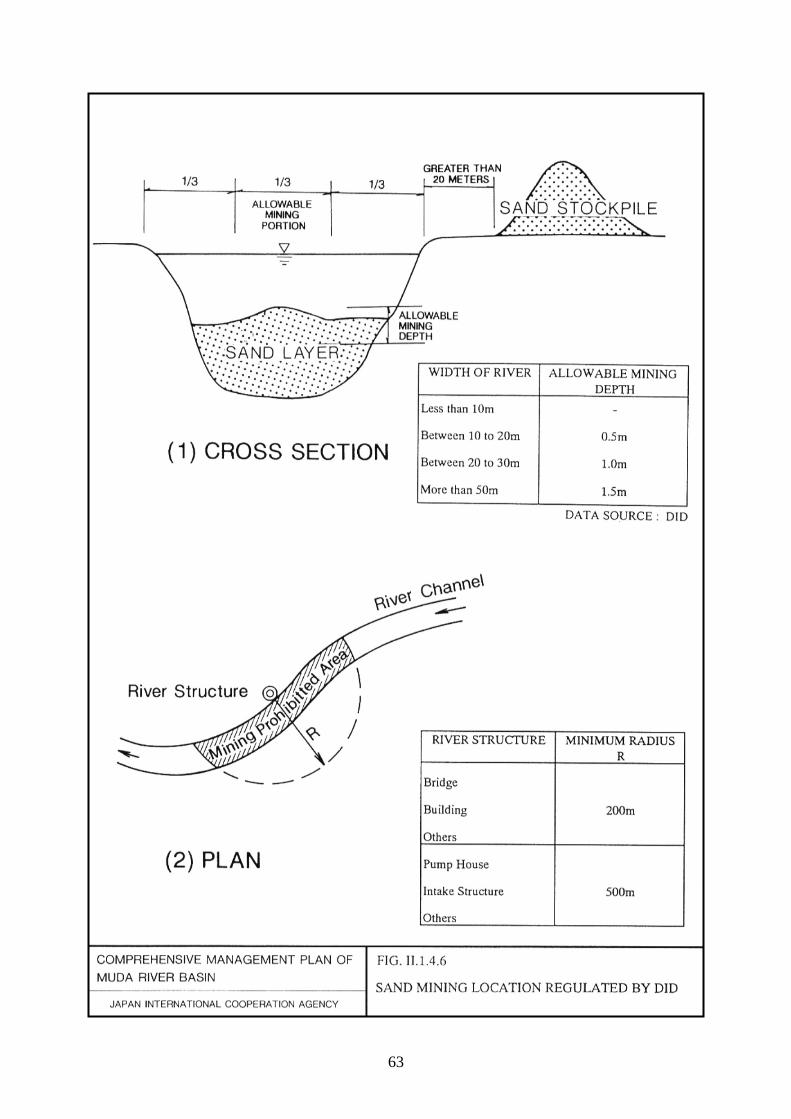
3.1.6 River Sand Mining As of September 1993, there were 95 permit holders for mining operations on the Sg. Muda channel in the State of Kedah. As for the State of Pulau Pinang, a total of 9 mining sites have been designated. These mining sites are concentrated between Muda Barrage and the proposed Jeniang Barrage, as shown in Figure 3.27. The annual sand mining volumes recorded for the recent three years were about 500,000 m3 in 1991, 900,000 m3 in 1992 and 1.200.000 m3 in 1993. According to the officials concerned, however, the mining volume in 1990 reached the peak and was much more than those in recent three years due to use as construction material for the North-South Expressway. These mining volumes are much greater than the annual bed load of about 10,000 m and, therefore, have caused serious subsidence of the riverbed. The present mining activities have also affected the surrounding river environment due to the following unfavorable conditions:
a) Abandonment of mining equipment in river channels and riverbanks;
b) Pipes and ropes crossing the river course, which hamper navigation;
c) Illegal construction of access road to the river channel which reduce the river channel width; and
d) Absence of proper drainage from sand stockpiles.
DID has provided a guideline for and mining operation in Malaysia as shown in Figure 3.28.
31
32
33
34
35
36
(1) Bridge Crossing Sg. Ketil (1km Upstream of Sg. Muda)
(2) Bridge Crossing Sg. Muda (Ldg. Victoria)
COMPREHENSIVE MANAGEMENT PLAN OF MUDA RIVER BASIN
JAPAN INTERNATIONAL COOPERATION AGENCY
Figure 3.6 PHOTOGRAPH OF BRIDGE AFFECTED BY RIVER BED SUBSIDENCE
37

38
39
40
41
42
43
44
45
46
47
48
49
50
51
52
53
54
55
COMPREHENSIVE MANAGEMENT PLAN OF MUDA RIVERS BASIN JAPAN INTERNATIONAL COOPERATION AGENCY
FIG. 3.4.1 (1/2) PROBABLE INUNDATION AREA BY 100 YEAR FLOOD (MUDA RIVER)
56
57
58
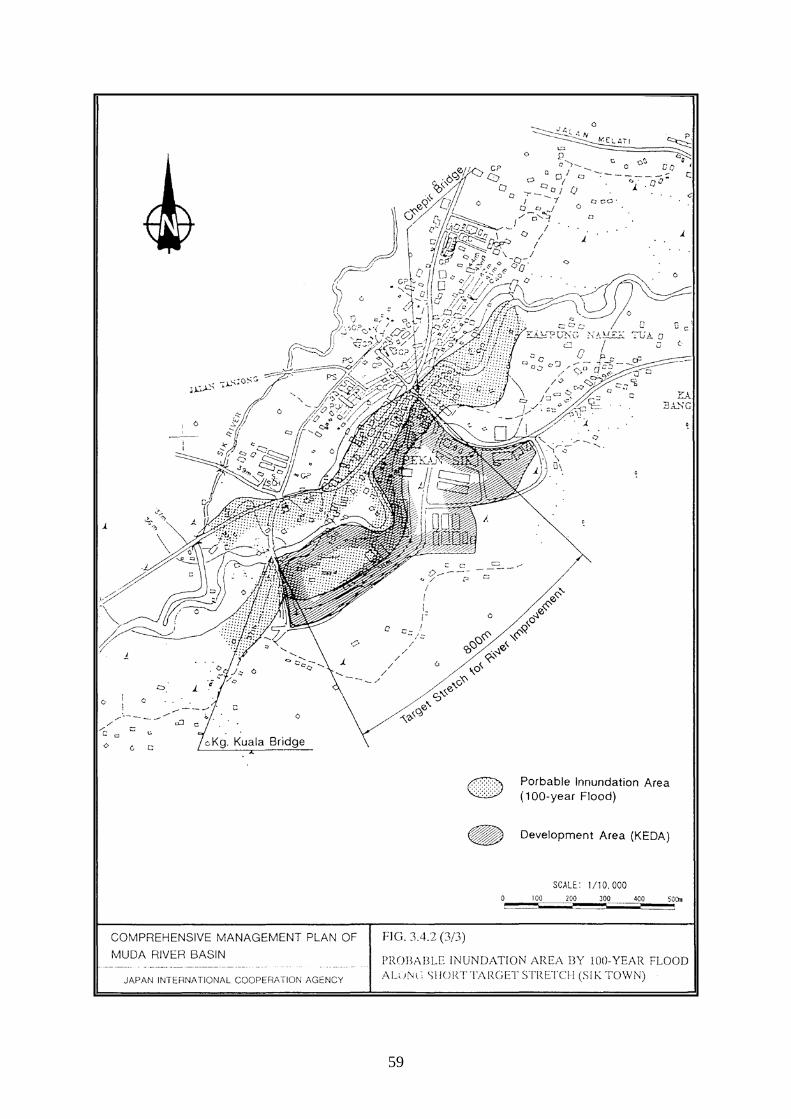
59
60
61
COMPREHENSIVE MANAGEMENT PLAN OF MUDA RIVERS BASIN JAPAN INTERNATIONAL COOPERATION AGENCY
FIG. 3.5.2 LOCATION OF WATER LEVEL MONITORING STATIONS IN MUDA RIVER BASIN
62
63
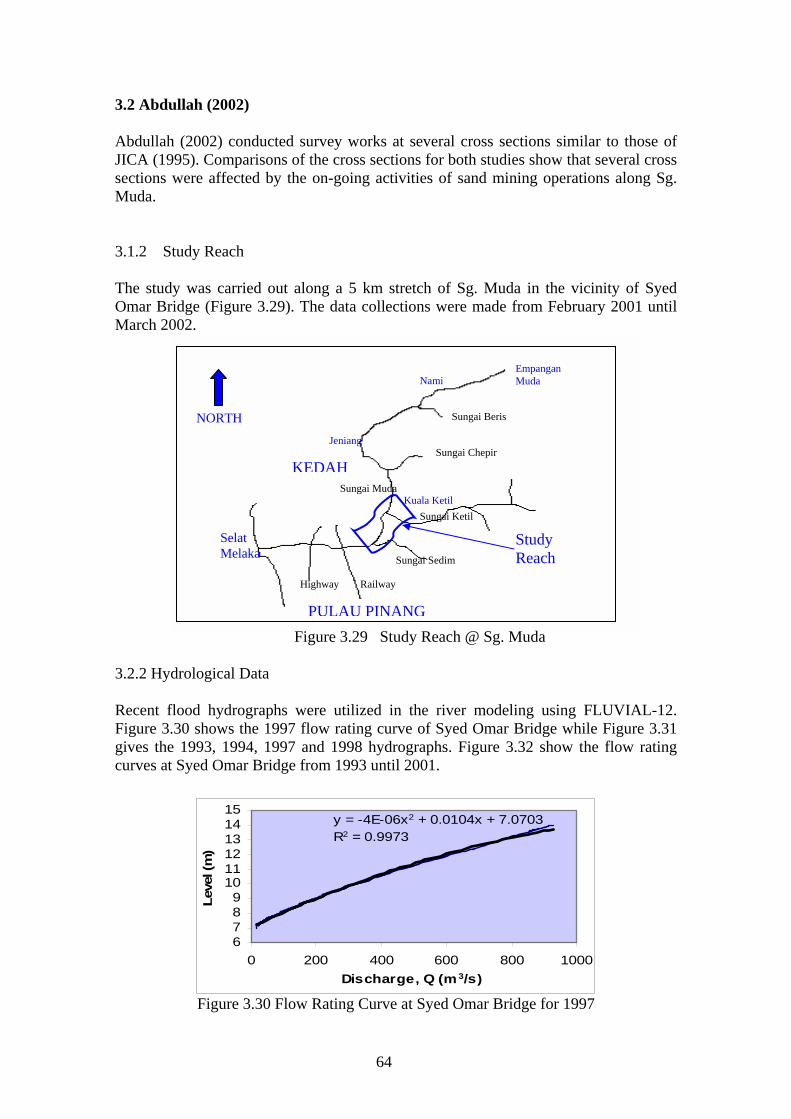
3.2 Abdullah (2002)
Abdullah (2002) conducted survey works at several cross sections similar to those of JICA (1995). Comparisons of the cross sections for both studies show that several cross sections were affected by the on-going activities of sand mining operations along Sg. Muda.
3.1.2 Study Reach The study was carried out along a 5 km stretch of Sg. Muda in the vicinity of Syed Omar Bridge (Figure 3.29). The data collections were made from February 2001 until March 2002.
Sungai Sedim
KEDAH
PULAU PINANG
Highway Railway
Selat Melaka
Sungai Chepir
Sungai Beris
Sungai Muda Kuala Ketil
Jeniang
Nami Empangan Muda
Sungai Ketil
NORTH
Study Reach
Figure 3.29 Study Reach @ Sg. Muda
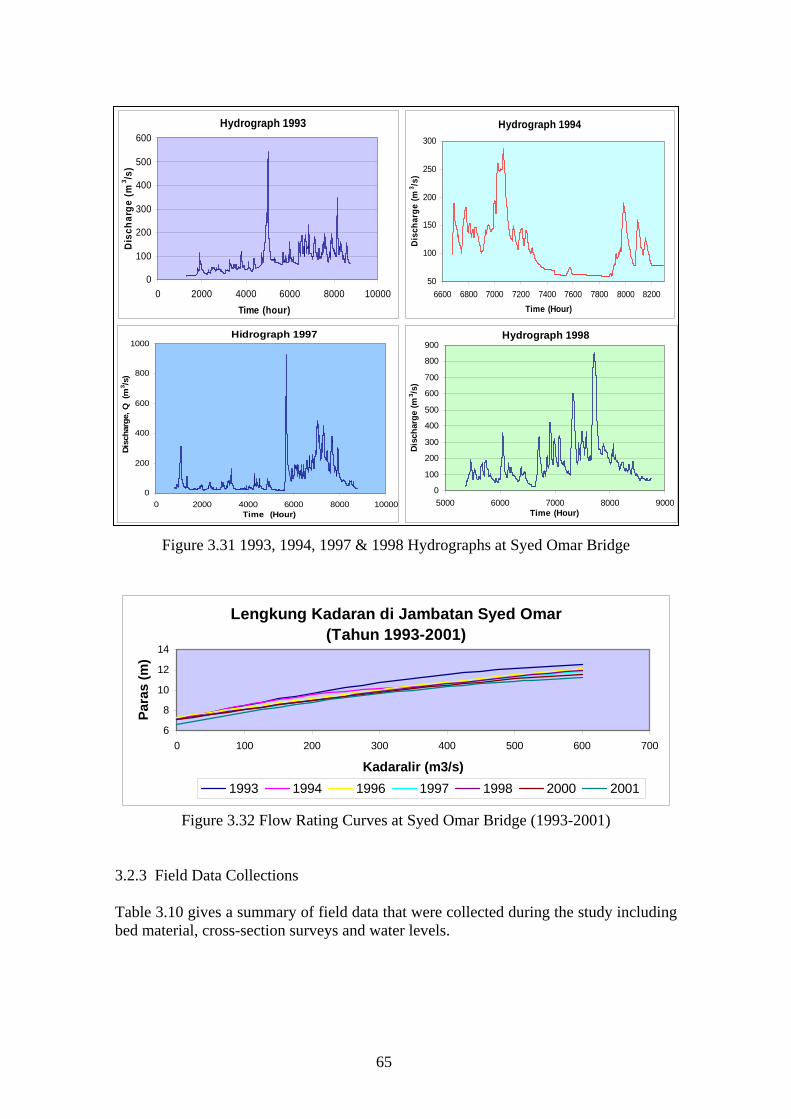
3.2.2 Hydrological Data Recent flood hydrographs were utilized in the river modeling using FLUVIAL-12. Figure 3.30 shows the 1997 flow rating curve of Syed Omar Bridge while Figure 3.31 gives the 1993, 1994, 1997 and 1998 hydrographs. Figure 3.32 show the flow rating curves at Syed Omar Bridge from 1993 until 2001.
y = -4E-06x2 + 0.0104x + 7.0703R2 = 0.9973
6789
101112131415
0 200 400 600 800 1000Discharge, Q (m 3/s)
Leve
l (m
)
Figure 3.30 Flow Rating Curve at Syed Omar Bridge for 1997
64
Hydrograph 1993
0
100
200
300
400
500
600
0 2000 4000 6000 8000 10000Time (hour)
Dis
char
ge (m
3 /s)
Hydrograph 1994
50
100
150
200
250
300
6600 6800 7000 7200 7400 7600 7800 8000 8200Time (Hour)
Disc
harg
e (m
3 /s)
Hydrograph 1998
0
100
200
300
400
500
600
700
800
900
5000 6000 7000 8000 9000Time (Hour)
Disc
harg
e (m
3 /s)
Hidrograph 1997
0
200
400
600
800
1000
0 2000 4000 6000 8000 1000
Lengkung Kadaran di Jambatan Syed Omar(Tahun 1993-2001)
6
8
10
12
14
0 100 200 300 400 500 600 700
Kadaralir (m3/s)
Para
s (m
)
1993 1994 1996 1997 1998 2000 2001
0Time (Hour)
Dis
char
ge, Q
(m
3 /s)
Figure 3.31 1993, 1994, 1997 & 1998 Hydrographs at Syed Omar Bridge
Figure 3.32 Flow Rating Curves at Syed Omar Bridge (1993-2001)
3.2.3 Field Data Collections Table 3.10 gives a summary of field data that were collected during the study including bed material, cross-section surveys and water levels.
65
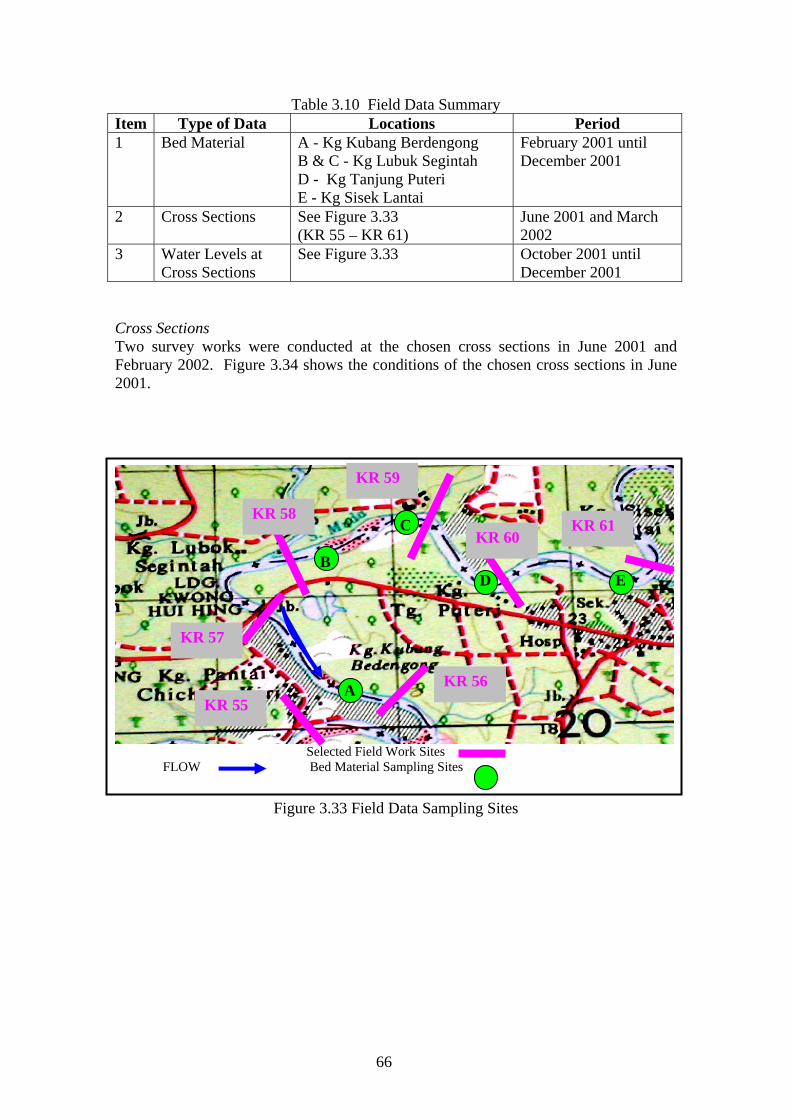
Table 3.10 Field Data Summary Item Type of Data Locations Period 1 Bed Material A - Kg Kubang Berdengong
B & C - Kg Lubuk Segintah D - Kg Tanjung Puteri E - Kg Sisek Lantai
February 2001 until December 2001
2 Cross Sections See Figure 3.33 (KR 55 – KR 61)
June 2001 and March 2002
3 Water Levels at Cross Sections
See Figure 3.33 October 2001 until December 2001
Cross Sections Two survey works were conducted at the chosen cross sections in June 2001 and February 2002. Figure 3.34 shows the conditions of the chosen cross sections in June 2001.
Selected Field Work Sites
FLOW Bed Material Sampling Sites
Figure 3.33 Field Data Sampling Sites
KR 56
KR 61 KR 60
KR 59
KR 58
KR 57
KR 55
C B D E
A
66
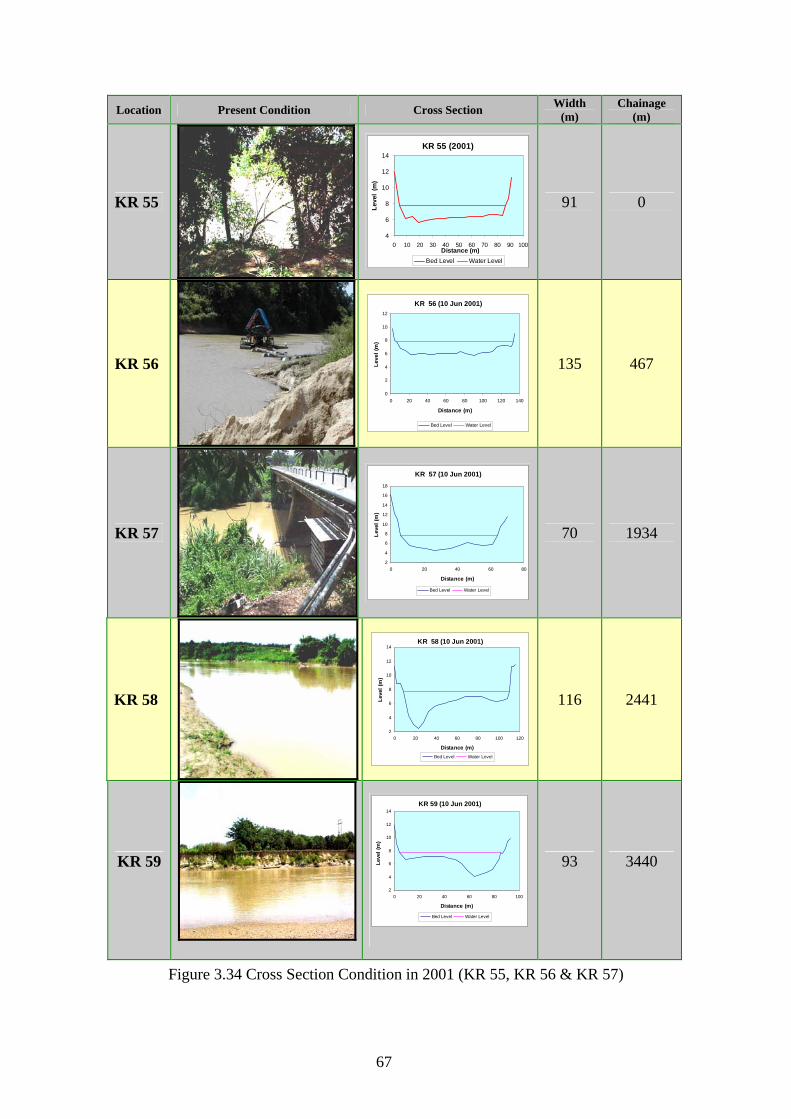
Location Present Condition Cross Section Width (m)
Chainage (m)
KR 55
KR 55 (2001)
4
6
8
10
12
14
0 10 20 30 40 50 60 70 80 90 100Distance (m)
Leve
l (m
)
Bed Level Water Level
91 0
KR 56
KR 56 (10 Jun 2001)
0
2
4
6
8
10
12
0 20 40 60 80 100 120 140
Distance (m)
Leve
l (m
)
Bed Level Water Level
135 467
KR 57
KR 57 (10 Jun 2001)
2
4
6
8
10
12
14
16
18
0 20 40 60
Distance (m)
Leve
l (m
)
80
Bed Level Water Level
70 1934
KR 58
KR 58 (10 Jun 2001)
2
4
6
8
10
12
14
0 20 40 60 80 100 120
Distance (m)
Leve
l (m
)
Bed Level Water Level
116 2441
KR 59
KR 59 (10 Jun 2001)
2
4
6
8
10
12
14
0 20 40 60 80 100
Distance (m)
Leve
l (m
)
Bed Level Water Level
93 3440
Figure 3.34 Cross Section Condition in 2001 (KR 55, KR 56 & KR 57)
67
DASAR TERENDAH (KR 55 HINGGA KR 61) BAGI TAHUN 1994, 2001 & 2002
-5
0
5
10
0 1000 2000 3000 4000 5000ARAK (m) J
PAR
AS
(m)
thalweg 16/10/1994 thalweg 10/6/2001 thalweg 2/3/2002
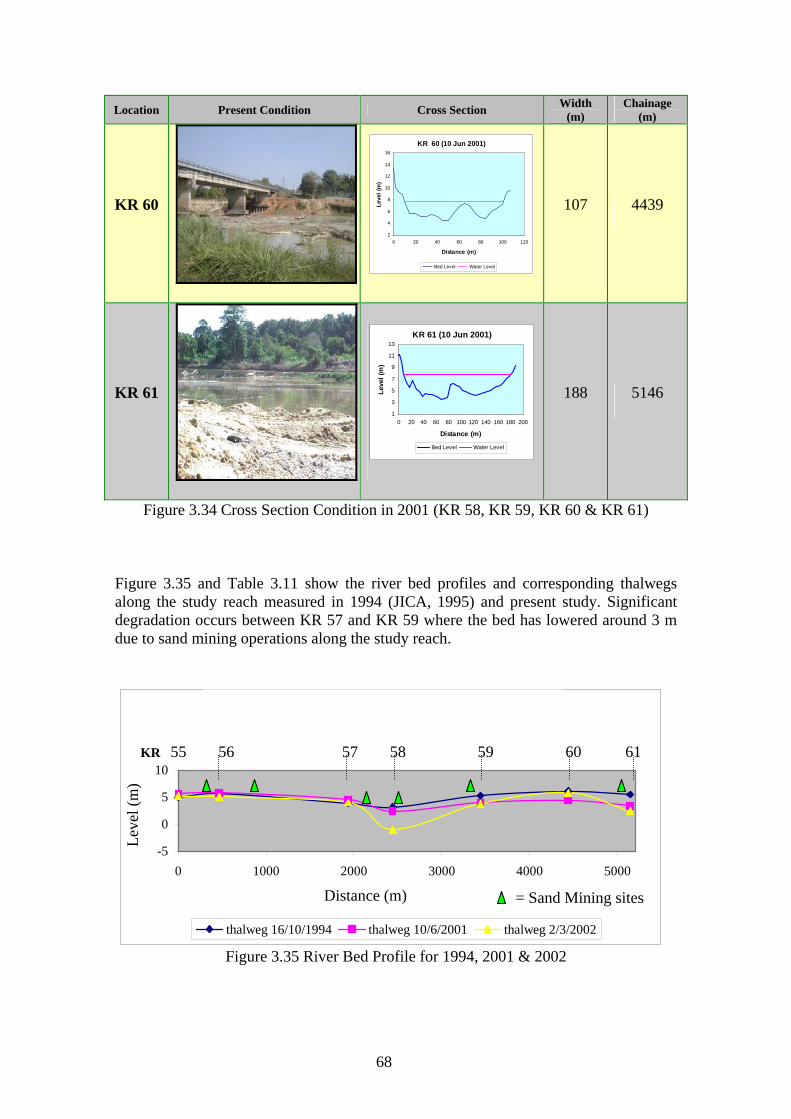
Location Present Condition Cross Section Width (m)
Chainage (m)
KR 60
KR 60 (10 Jun 2001)
2
4
6
8
10
12
14
16
0 20 40 60 80 100 120
Distance (m)
Leve
l (m
)
Bed Level Water Level
107 4439
KR 61
KR 61 (10 Jun 2001)
1
3
5
7
9
11
13
0 20 40 60 80 100 120 140 160 180 200
Distance (m)
Leve
l (m
)
Bed Level Water Level
188 5146
Figure 3.34 Cross Section Condition in 2001 (KR 58, KR 59, KR 60 & KR 61)
Figure 3.35 and Table 3.11 show the river bed profiles and corresponding thalwegs along the study reach measured in 1994 (JICA, 1995) and present study. Significant degradation occurs between KR 57 and KR 59 where the bed has lowered around 3 m due to sand mining operations along the study reach.
KR 55 56 57 58 59 60 61
= Sand Mining sites Distance (m)
Leve
l (m
)
Figure 3.35 River Bed Profile for 1994, 2001 & 2002
68
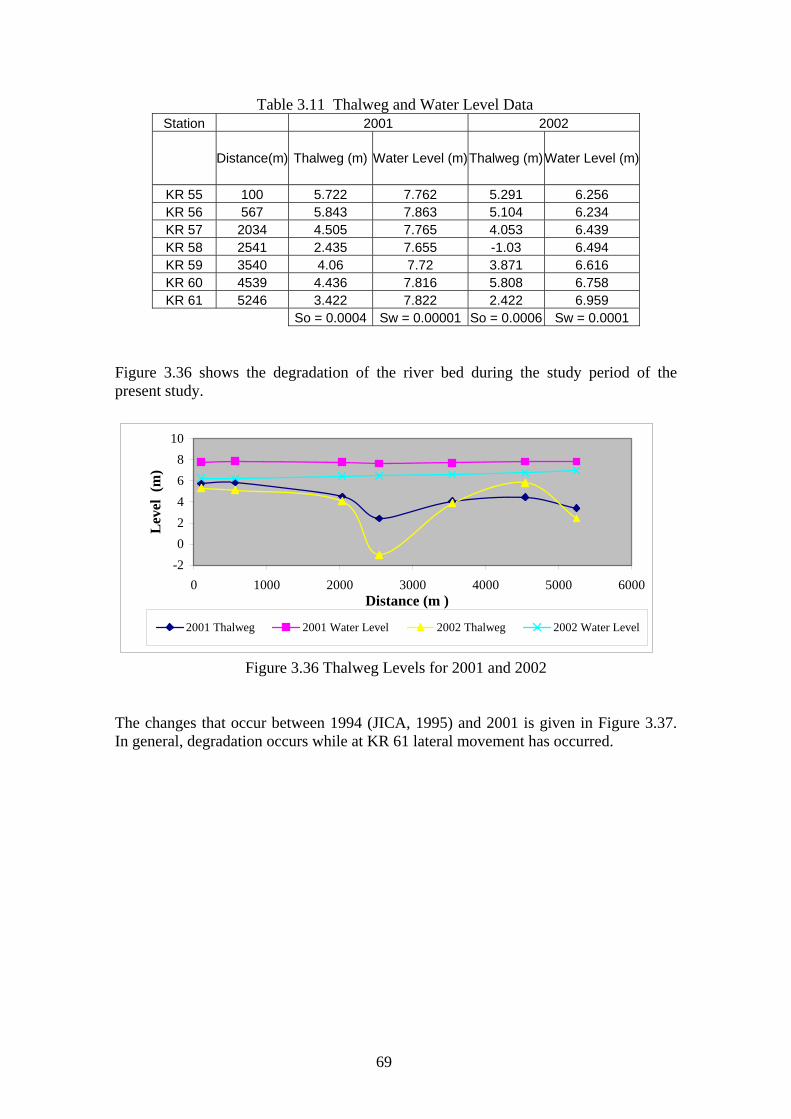
Table 3.11 Thalweg and Water Level Data Station 2001 2002
Distance(m) Thalweg (m) Water Level (m)Thalweg (m)Water Level (m)
KR 55 100 5.722 7.762 5.291 6.256 KR 56 567 5.843 7.863 5.104 6.234 KR 57 2034 4.505 7.765 4.053 6.439 KR 58 2541 2.435 7.655 -1.03 6.494 KR 59 3540 4.06 7.72 3.871 6.616 KR 60 4539 4.436 7.816 5.808 6.758 KR 61 5246 3.422 7.822 2.422 6.959
So = 0.0004 Sw = 0.00001 So = 0.0006 Sw = 0.0001 Figure 3.36 shows the degradation of the river bed during the study period of the present study.
-202468
10
0 1000 2000 3000 4000 5000 6000Distance (m )
Lev
el (
m)
2001 Thalweg 2001 Water Level 2002 Thalweg 2002 Water Level
Figure 3.36 Thalweg Levels for 2001 and 2002
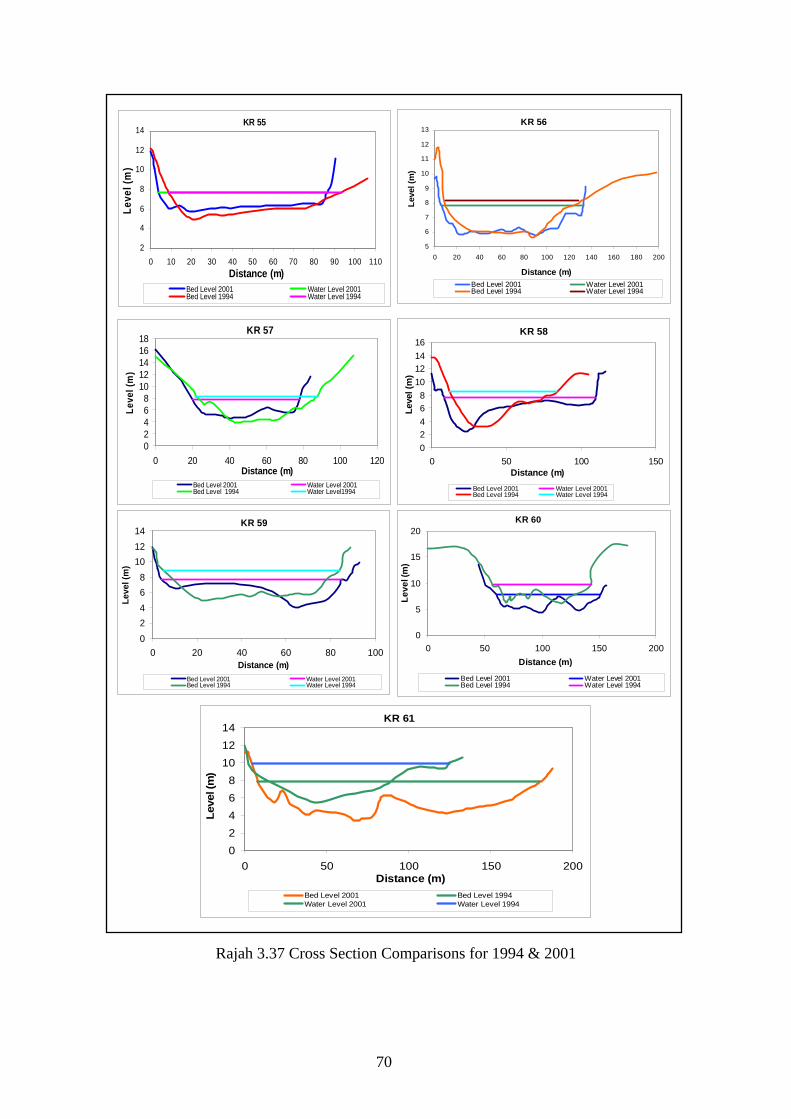
The changes that occur between 1994 (JICA, 1995) and 2001 is given in Figure 3.37. In general, degradation occurs while at KR 61 lateral movement has occurred.
69
KR 58
02468
10121416
0 50 100 150Distance (m)
Leve
l (m
)
Bed Level 2001 Water Level 2001Bed Level 1994 Water Level 1994
KR 57
02468
1012141618
0 20 40 60 80 100 120Distance (m)
Leve
l (m
)
Bed Level 2001 Water Level 2001Bed Level 1994 Water Level1994
KR 55
2
4
6
8
10
12
14
0 10 20 30 40 50 60 70 80 90 100 110Distance (m)
Leve
l (m
)
Bed Level 2001 Water Level 2001Bed Level 1994 Water Level 1994
KR 56
5
6
7
8
9
10
11
12
13
0 20 40 60 80 100 120 140 160 180 200
Distance (m)
Leve
l (m
)
Bed Level 2001 Water Level 2001Bed Level 1994 Water Level 1994
KR 59
02468
101214
0 20 40 60 80 100Distance (m)
Leve
l (m
)
Bed Level 2001 Water Level 2001Bed Level 1994 Water Level 1994
KR 60
0
5
10
15
20
0 50 100 150 200Distance (m)
Leve
l (m
)
Bed Level 2001 Water Level 2001Bed Level 1994 Water Level 1994
KR 61
02468
101214
0 50 100 150 200Distance (m)
Leve
l (m
)
Bed Level 2001 Bed Level 1994Water Level 2001 Water Level 1994
Rajah 3.37 Cross Section Comparisons for 1994 & 2001
70
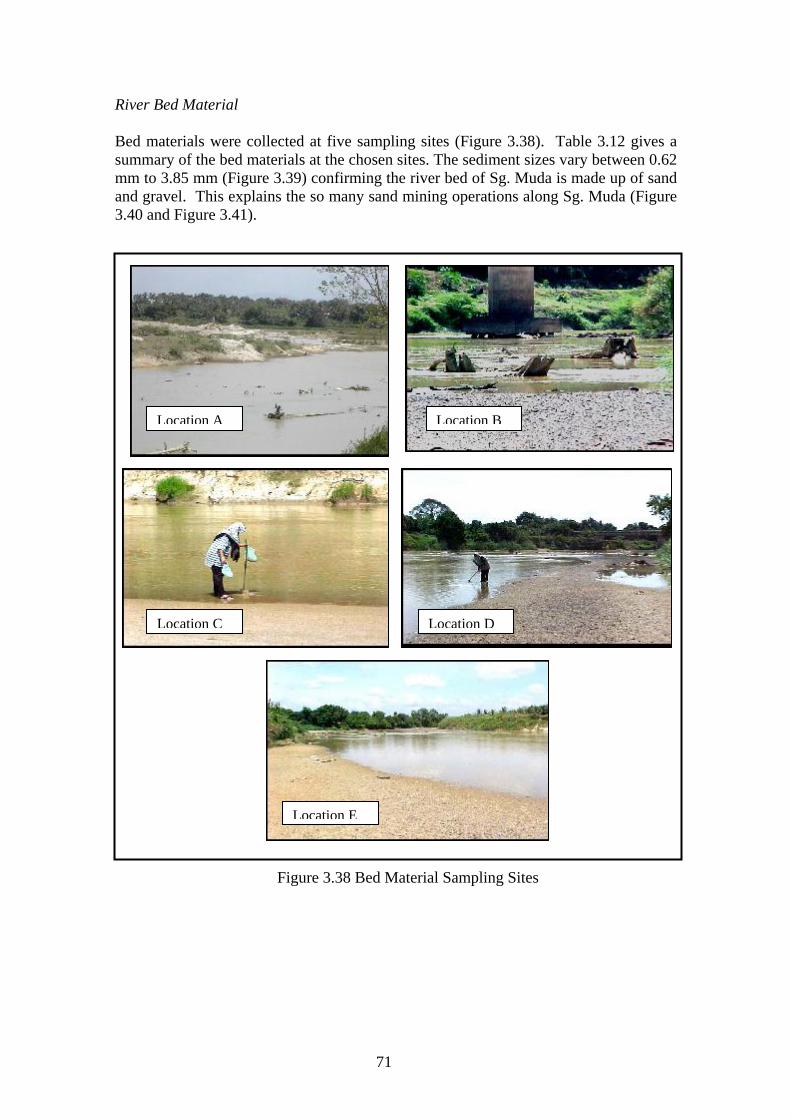
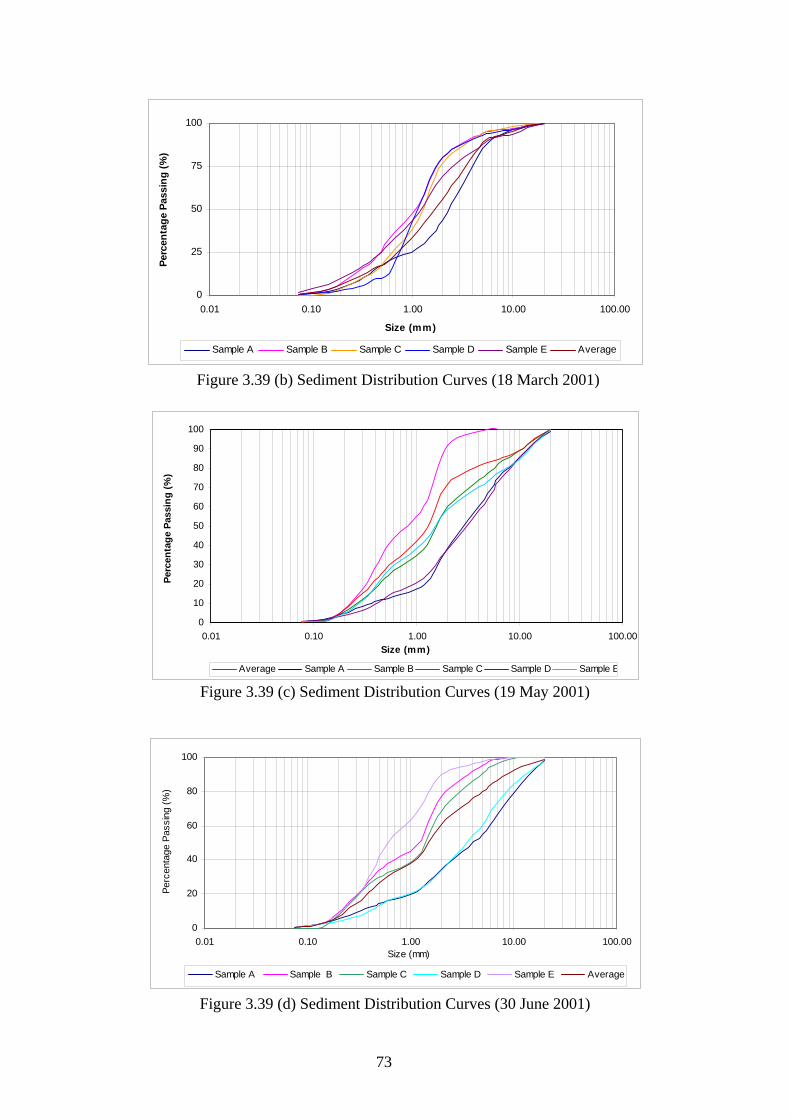
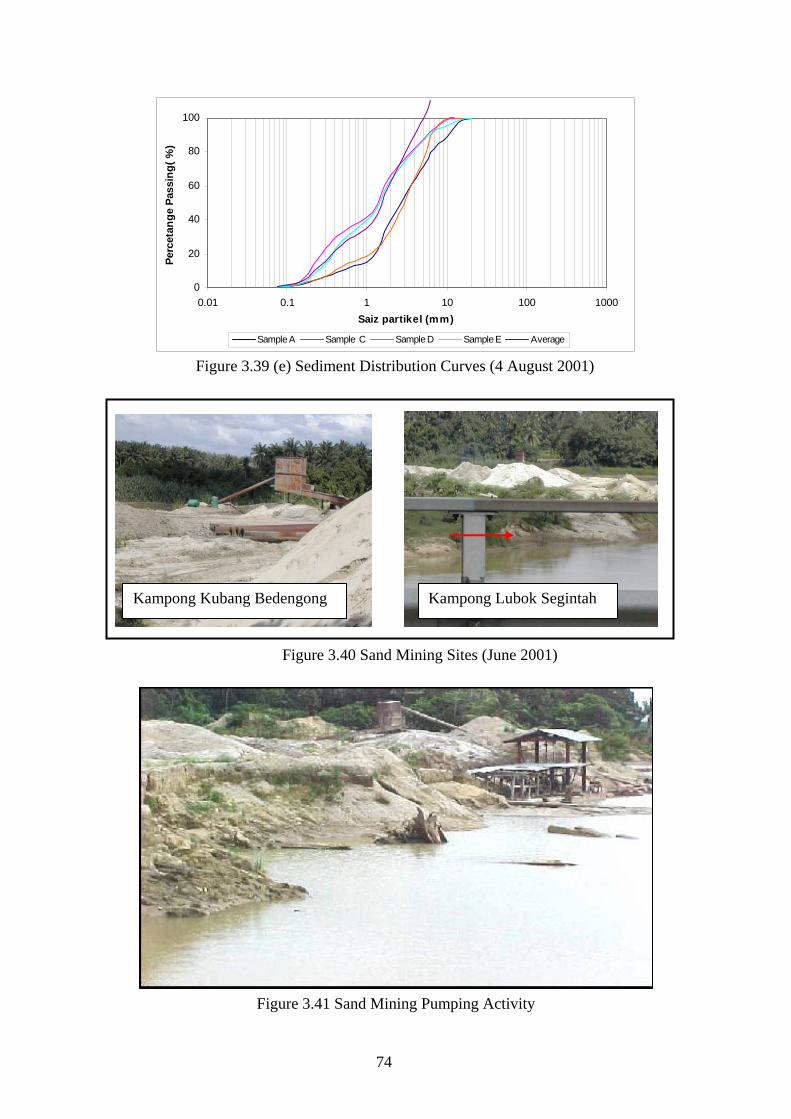
River Bed Material
Bed materials were collected at five sampling sites (Figure 3.38). Table 3.12 gives a summary of the bed materials at the chosen sites. The sediment sizes vary between 0.62 mm to 3.85 mm (Figure 3.39) confirming the river bed of Sg. Muda is made up of sand and gravel. This explains the so many sand mining operations along Sg. Muda (Figure 3.40 and Figure 3.41).
Location A Location B
Location C Location D
Location E
Figure 3.38 Bed Material Sampling Sites
71
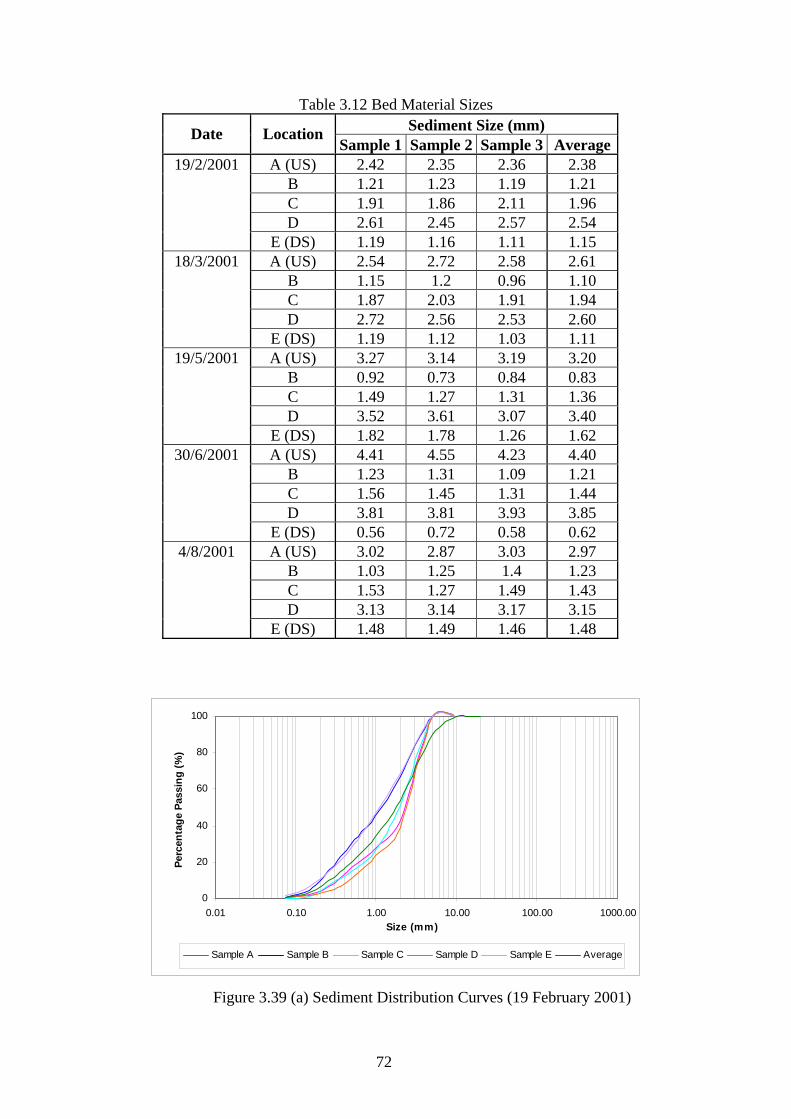
Table 3.12 Bed Material Sizes Sediment Size (mm) Date Location
Sample 1 Sample 2 Sample 3 Average 19/2/2001 A (US) 2.42 2.35 2.36 2.38
B 1.21 1.23 1.19 1.21 C 1.91 1.86 2.11 1.96 D 2.61 2.45 2.57 2.54 E (DS) 1.19 1.16 1.11 1.15
18/3/2001 A (US) 2.54 2.72 2.58 2.61 B 1.15 1.2 0.96 1.10 C 1.87 2.03 1.91 1.94 D 2.72 2.56 2.53 2.60 E (DS) 1.19 1.12 1.03 1.11
19/5/2001 A (US) 3.27 3.14 3.19 3.20 B 0.92 0.73 0.84 0.83 C 1.49 1.27 1.31 1.36 D 3.52 3.61 3.07 3.40 E (DS) 1.82 1.78 1.26 1.62
30/6/2001 A (US) 4.41 4.55 4.23 4.40 B 1.23 1.31 1.09 1.21 C 1.56 1.45 1.31 1.44 D 3.81 3.81 3.93 3.85 E (DS) 0.56 0.72 0.58 0.62
4/8/2001 A (US) 3.02 2.87 3.03 2.97 B 1.03 1.25 1.4 1.23 C 1.53 1.27 1.49 1.43 D 3.13 3.14 3.17 3.15 E (DS) 1.48 1.49 1.46 1.48
0
20
40
60
80
100
0.01 0.10 1.00 10.00 100.00 1000.00Size (mm)
Perc
enta
ge P
assi
ng (%
)
Sample A Sample B Sample C Sample D Sample E Average
Figure 3.39 (a) Sediment Distribution Curves (19 February 2001)
72
0
25
50
75
100
0.01 0.10 1.00 10.00 100.00
Size (mm)
Perc
enta
ge P
assi
ng (%
)
Sample A Sample B Sample C Sample D Sample E Average
0
10
20
30
40
50
60
70
80
90
100
0.01 0.10 1.00 10.00 100.00Size (mm)
Perc
enta
ge P
assi
ng (%
)
Average Sample A Sample B Sample C Sample D Sample E
Figure 3.39 (b) Sediment Distribution Curves (18 March 2001)
Figure 3.39 (c) Sediment Distribution Curves (19 May 2001)
0
20
40
60
80
100
0.01 0.10 1ize
.00 10.00 100.00S (mm)
Perc
enta
ge P
assi
ng (%
)
Sample A Sample B Sample C Sample D Sample E Average
Figure 3.39 (d) Sediment Distribution Curves (30 June 2001)
73
0
20
40
60
80
100
0.01 0.1 1 10 100 1000Saiz partikel (mm)
Perc
etan
ge P
assi
ng( %
)
Sample A Sample C Sample D Sample E Average
Figure 3.39 (e) Sediment Distribution Curves (4 August 2001)
Kampong Lubok Segintah Kampong Kubang Bedengong
Figure 3.40 Sand Mining Sites (June 2001)
Figure 3.41 Sand Mining Pumping Activity
74
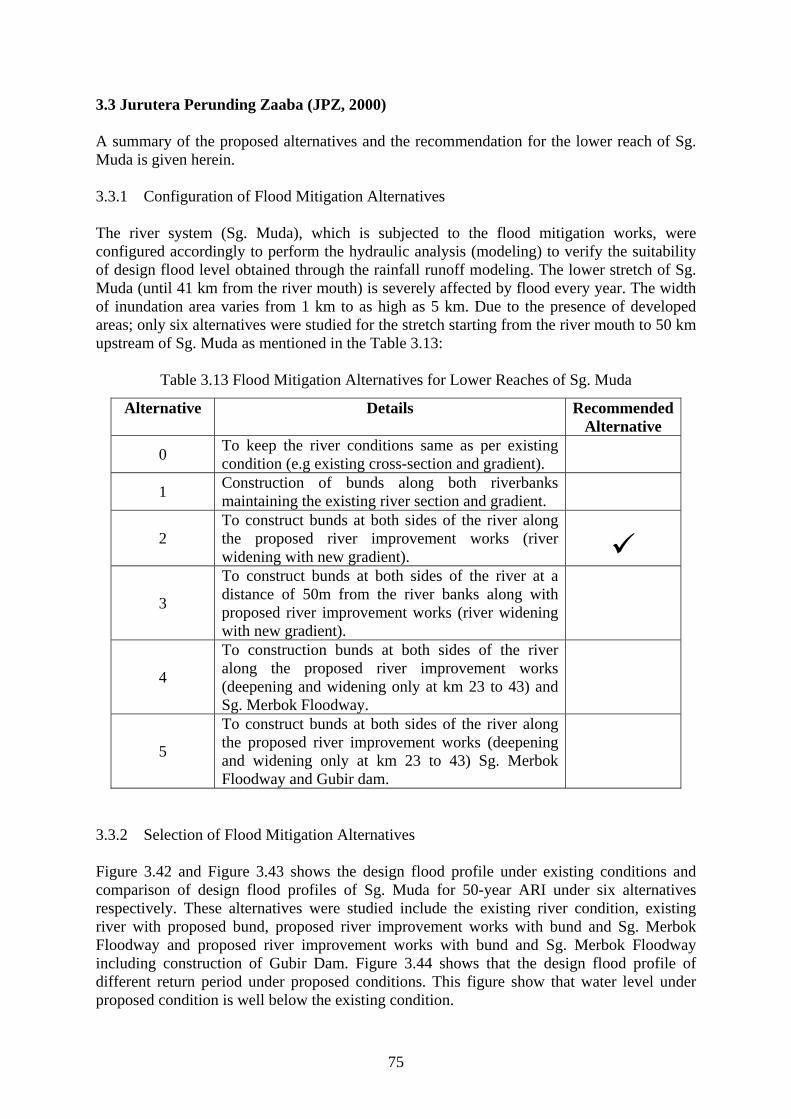
3.3 Jurutera Perunding Zaaba (JPZ, 2000) A summary of the proposed alternatives and the recommendation for the lower reach of Sg. Muda is given herein. 3.3.1 Configuration of Flood Mitigation Alternatives The river system (Sg. Muda), which is subjected to the flood mitigation works, were configured accordingly to perform the hydraulic analysis (modeling) to verify the suitability of design flood level obtained through the rainfall runoff modeling. The lower stretch of Sg. Muda (until 41 km from the river mouth) is severely affected by flood every year. The width of inundation area varies from 1 km to as high as 5 km. Due to the presence of developed areas; only six alternatives were studied for the stretch starting from the river mouth to 50 km upstream of Sg. Muda as mentioned in the Table 3.13:
Table 3.13 Flood Mitigation Alternatives for Lower Reaches of Sg. Muda
Alternative Details Recommended Alternative
0 To keep the river conditions same as per existing condition (e.g existing cross-section and gradient).
1 Construction of bunds along both riverbanks maintaining the existing river section and gradient.
2 To construct bunds at both sides of the river along the proposed river improvement works (river widening with new gradient).
3
To construct bunds at both sides of the river at a distance of 50m from the river banks along with proposed river improvement works (river widening with new gradient).
4
To construction bunds at both sides of the river along the proposed river improvement works (deepening and widening only at km 23 to 43) and Sg. Merbok Floodway.
5
To construct bunds at both sides of the river along the proposed river improvement works (deepening and widening only at km 23 to 43) Sg. Merbok Floodway and Gubir dam.
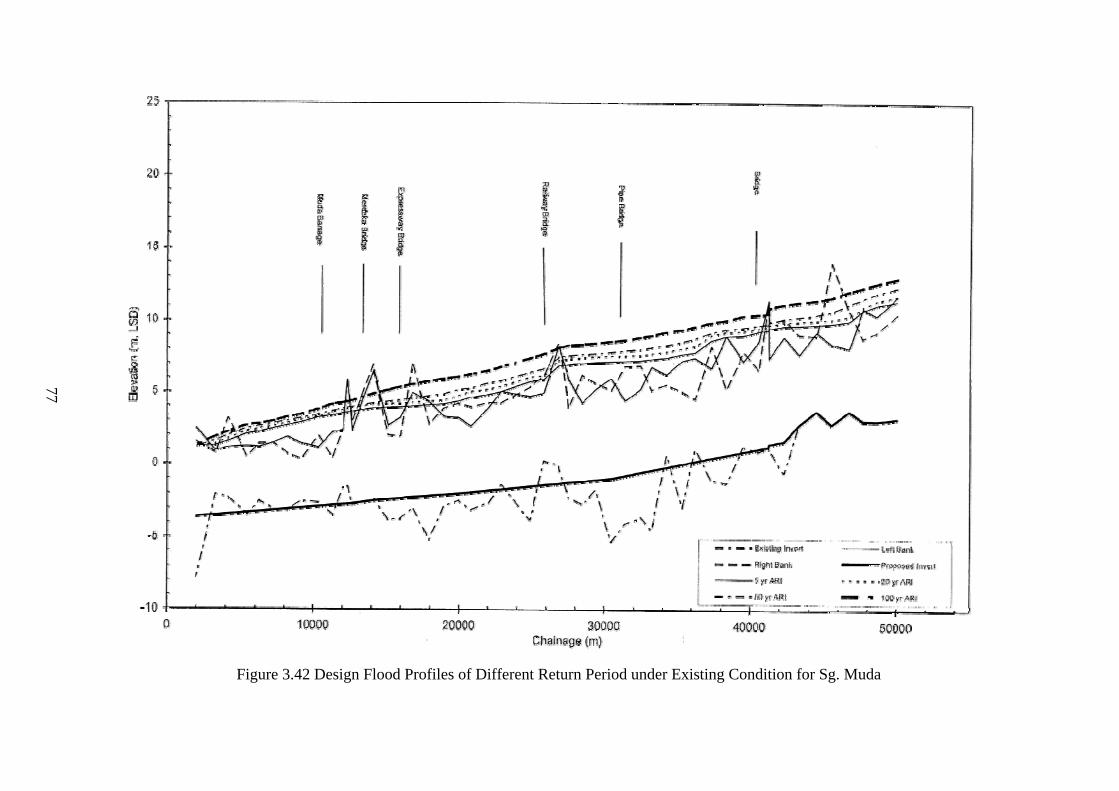
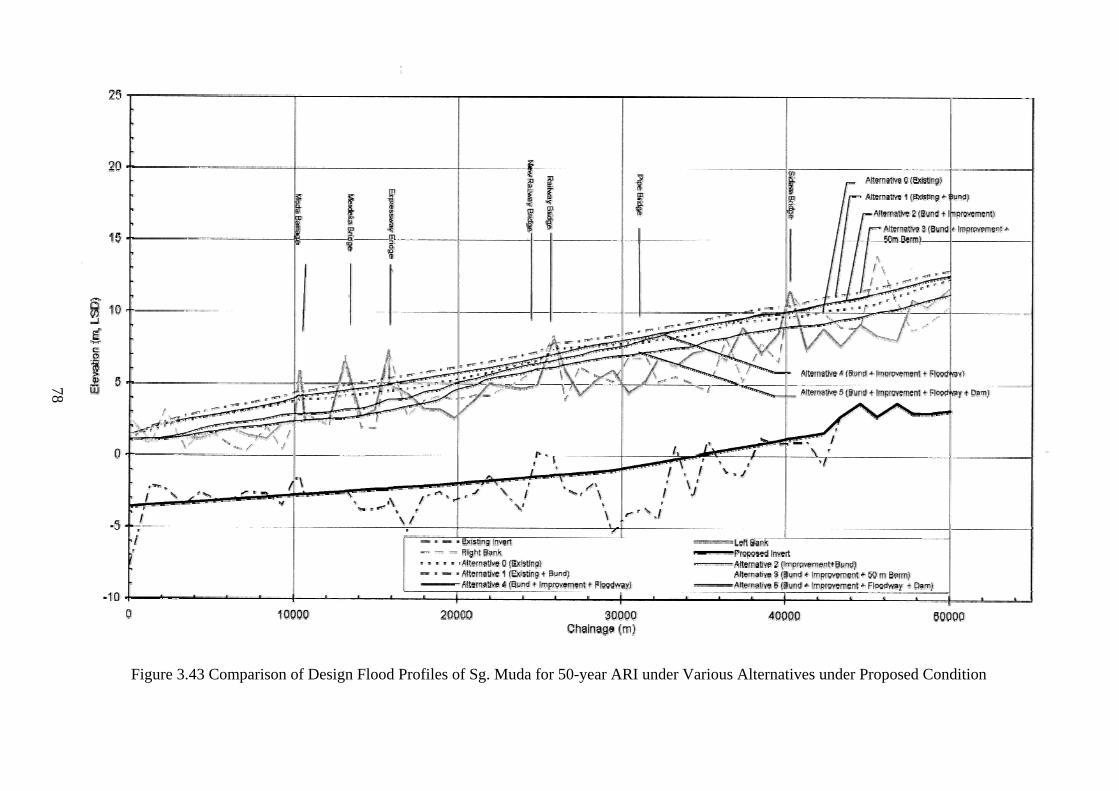
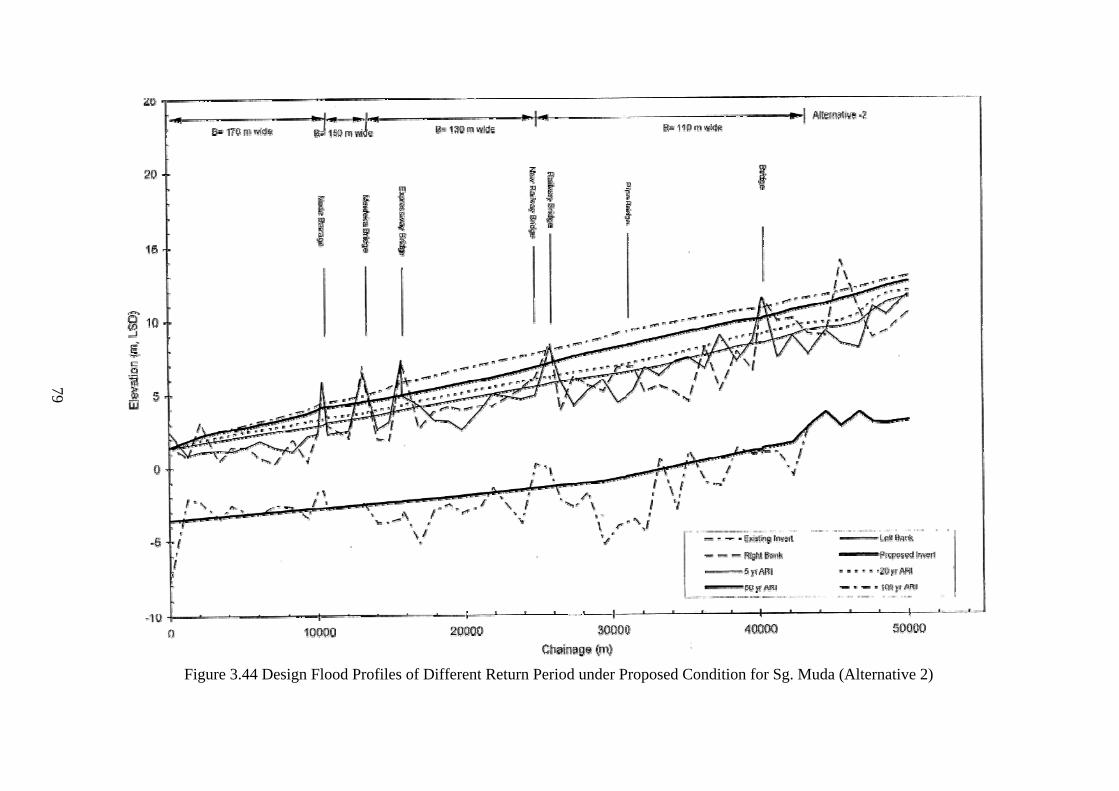
3.3.2 Selection of Flood Mitigation Alternatives Figure 3.42 and Figure 3.43 shows the design flood profile under existing conditions and comparison of design flood profiles of Sg. Muda for 50-year ARI under six alternatives respectively. These alternatives were studied include the existing river condition, existing river with proposed bund, proposed river improvement works with bund and Sg. Merbok Floodway and proposed river improvement works with bund and Sg. Merbok Floodway including construction of Gubir Dam. Figure 3.44 shows that the design flood profile of different return period under proposed conditions. This figure show that water level under proposed condition is well below the existing condition.
75
76
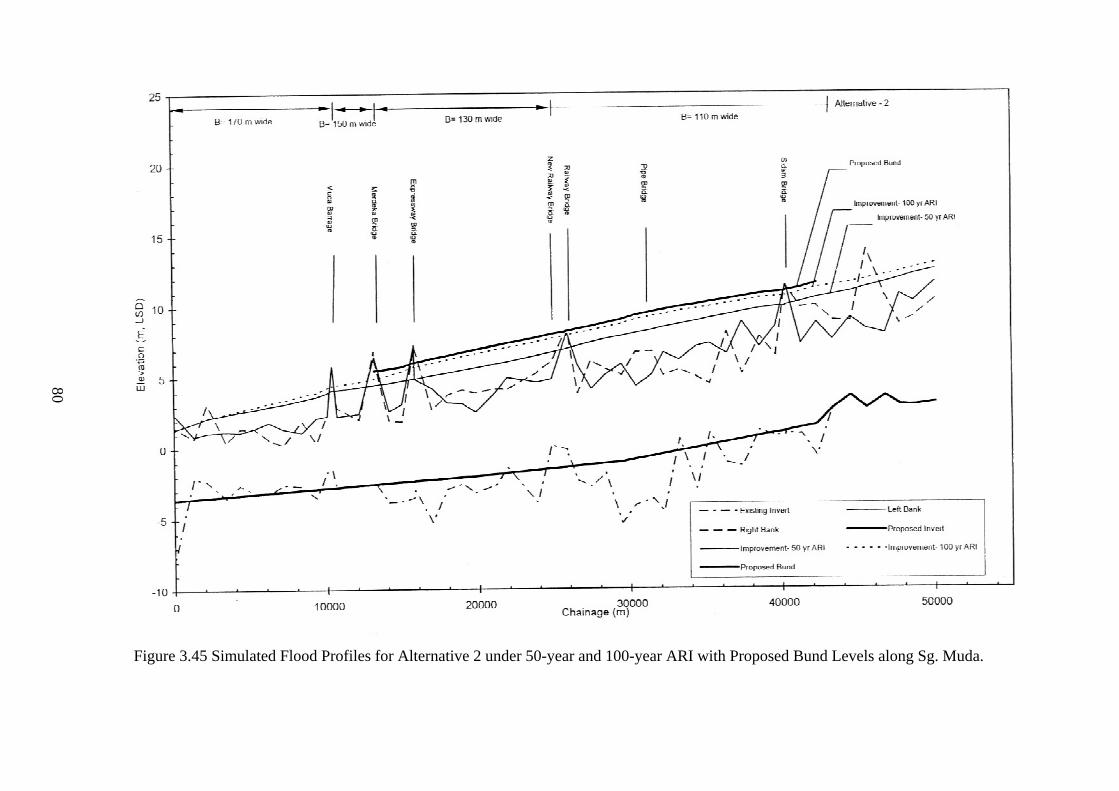
From the six alternatives mentioned above, Alternative 2 was recommended by the consultant to implement for the flood mitigation purpose at Sg. Muda floodplains after consideration the risk, safety and consequences of any possible breach of the bunds during floods. The others alternatives were not selected because of several factors. Construction of bund and maintaining the existing river conditions as mentioned in Alternative 1 will require high bund height where it increases the threat to the people living outside the bund. While Alternative 3 is the modified JICA proposed alternative, which considers uniform alignment of bund along the river at a distance of 50 m from both of the riverbanks. Figure 3.43 shows that the alternative 3 resulted in flood level higher than the Alternative 2, even though the proposed river cross sections are same for both alternatives. Alternative 4 and 5 will involves the higher cost in spite of the construction of the dam for Alternative 5 will create the water resources enhancement for the basin. Figure 3.45 shows the simulated flood profiles for alternative 2 under 50-year and 100-year ARI with proposed bund levels along Sg. Muda. Although this alternative shall require some extra areas but it will result in optimum cost for construction of bund and minimum resettlement issues. The selection of the Alternative 2 that can solve the flood problem in Sg. Muda, several factors will be consider such as flood profiles, site conditions, sensitive issues and the selecting of optimum size of the proposed river sections.
77
Figure 3.42 Design Flood Profiles of Different Return Period under Existing Condition for Sg. Muda
77
78
Figure 3.43 Comparison of Design Flood Profiles of Sg. Muda for 50-year ARI under Various Alternatives under Proposed Condition
78
79
Figure 3.44 Design Flood Profiles of Different Return Period under Proposed Condition for Sg. Muda (Alternative 2)
79
80
Figure 3.45 Simulated Flood Profiles for Alternative 2 under 50-year and 100-year ARI with Proposed Bund Levels along Sg. Muda.
80
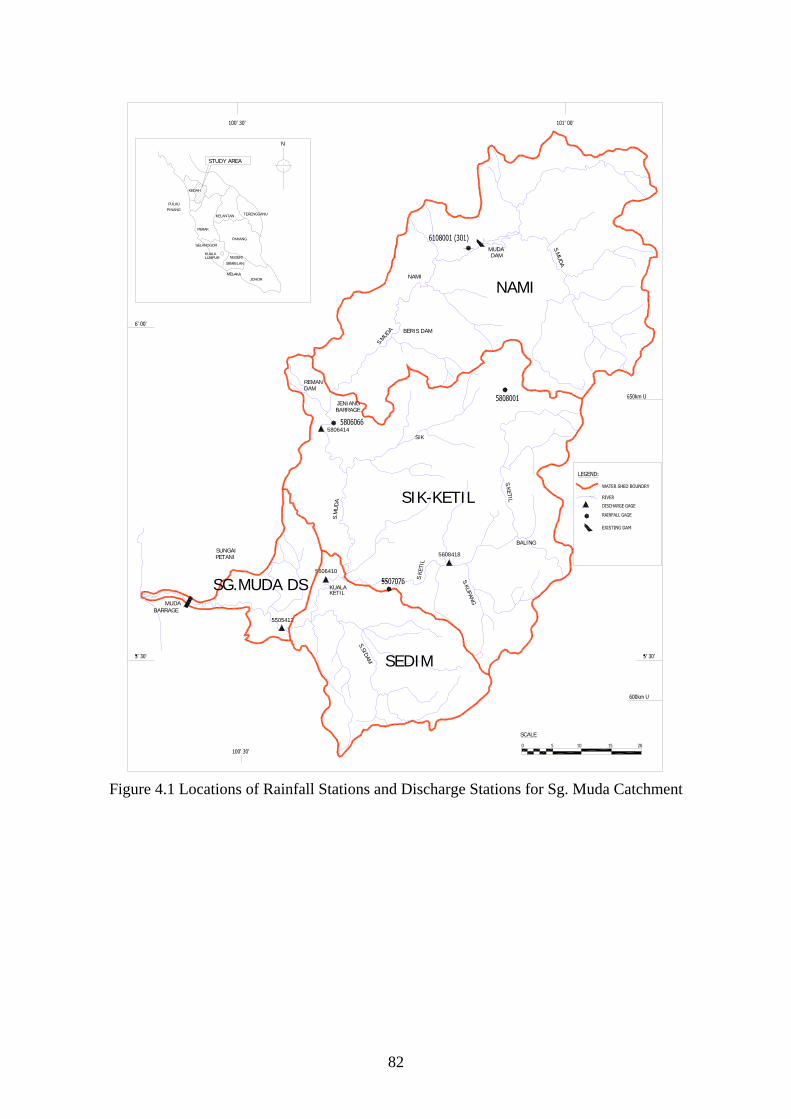
Chapter 4 Hydrological Modelling 4.1 HEC-HMS Modelling For the hydrologic modeling for the Sungai Muda catchment, the HEC-HMS model is used as a tool. The Sungai Muda catchment has been divided into four (4) subcatchments, that is, Nami catchment, Sik-Ketil catchment, Sedim catchment, and Sungai Muda downstream catchment. There are four (4) automatic rainfall stations, and two (2) discharge stations with observed discharge data. Figure 4.1 shows the subcatchment areas of Sungai Muda catchment. 4.1.1 Hydrological Data All hydrological data and previous reports such as the Annual Flood Reports used in this study were provided by the Department of Irrigation and Drainage. 4.1.2 Rainfall Four (4) automatic rainfall stations located inside the catchment area have been selected for this study. Other rainfall stations within catchment area are observed manually. These rainfall data were collected for the modeling works of Sg Muda catchment using HEC-HMS model. The inventory and locations of these rainfall stations are shown in the Table 4.1 and Figure 4.1 respectively.
Table 4.1 Inventory of Automatic Rainfall Stations No. Station Number Station Name State 1. 6108001 Komplek Rumah Muda Kedah 2. 5806066 Jeniang Klinik Kedah 3. 5808001 Batu 61 Jln. Baling Kedah 4. 5507076 Batu 27 Jln. Baling Kedah
4.1.3 Water Level and Streamflow A total of six (6) streamflow gauging stations have been identified which are located in the study area. The stations are Jambatan Syed Omar, Nami, Lengkuas, Jeniang, Ladang Victoria and Kuala Pegang. The locations of these stations are shown in Figure 4.1. However, only two (2) streamflow gauging stations at Jambatan Syed Omar (5806066) and Ladang Victoria (5505412) were selected for this study.
81
5806414
BARRAGEJENIANG
5606410
5505412
BARRAGEMUDA
PETANISUNGAI
KETILKUALA
REMANDAM
N
LUMPURKUALA
KEDAH
PINANG
SEMBILAN
PULAU
PERAK
SELANOGOR
NEGERI
MELAKAJOHOR
PAHANG
TERENGGANUKELANTAN
STUDY AREA
5608418
BALING
SCALE
SIK
NAMI
BERIS DAM
DAMMUDA
S.MUD
A
S.MUD
A
S.KETIL
S.KUPANG
S.KE
TIL
S.SIDAM
S.M
UD
A
NAMI
SIK-KETIL
SEDIM
SG.MUDA DS
Figure 4.1 Locations of Rainfall Stations and Discharge Stations for Sg. Muda Catchment
82
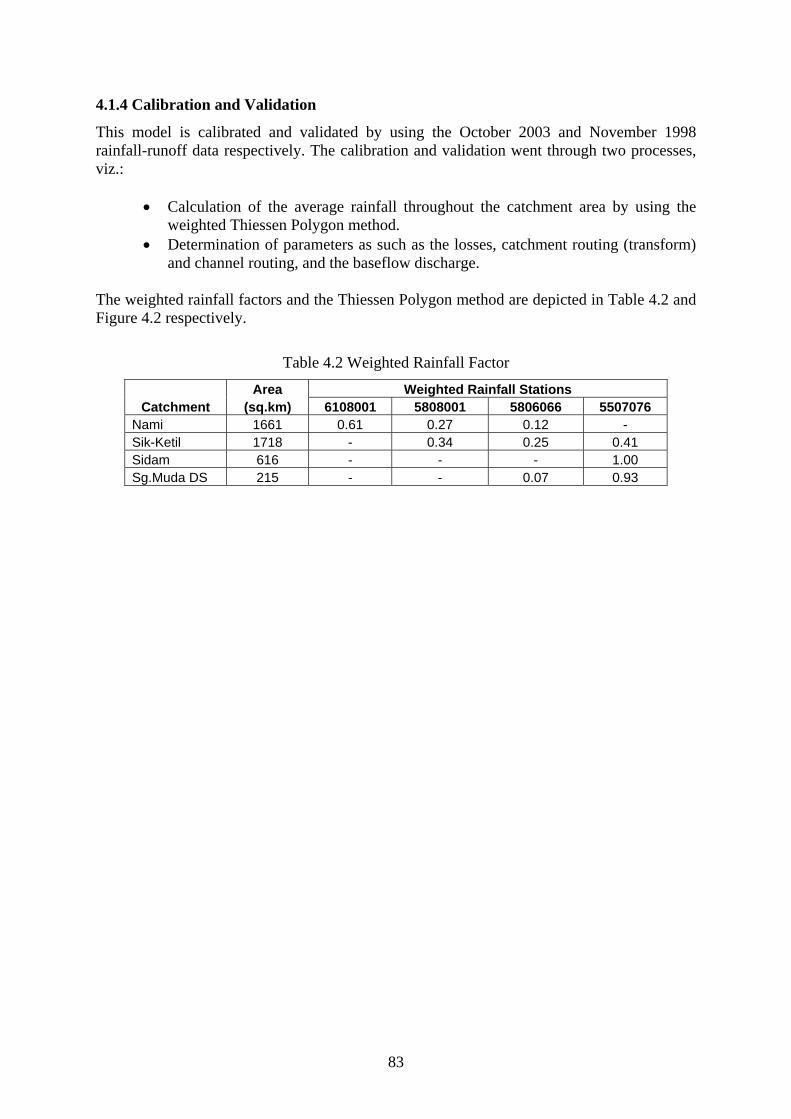
4.1.4 Calibration and Validation
This model is calibrated and validated by using the October 2003 and November 1998 rainfall-runoff data respectively. The calibration and validation went through two processes, viz.:
• Calculation of the average rainfall throughout the catchment area by using the weighted Thiessen Polygon method.
• Determination of parameters as such as the losses, catchment routing (transform) and channel routing, and the baseflow discharge.
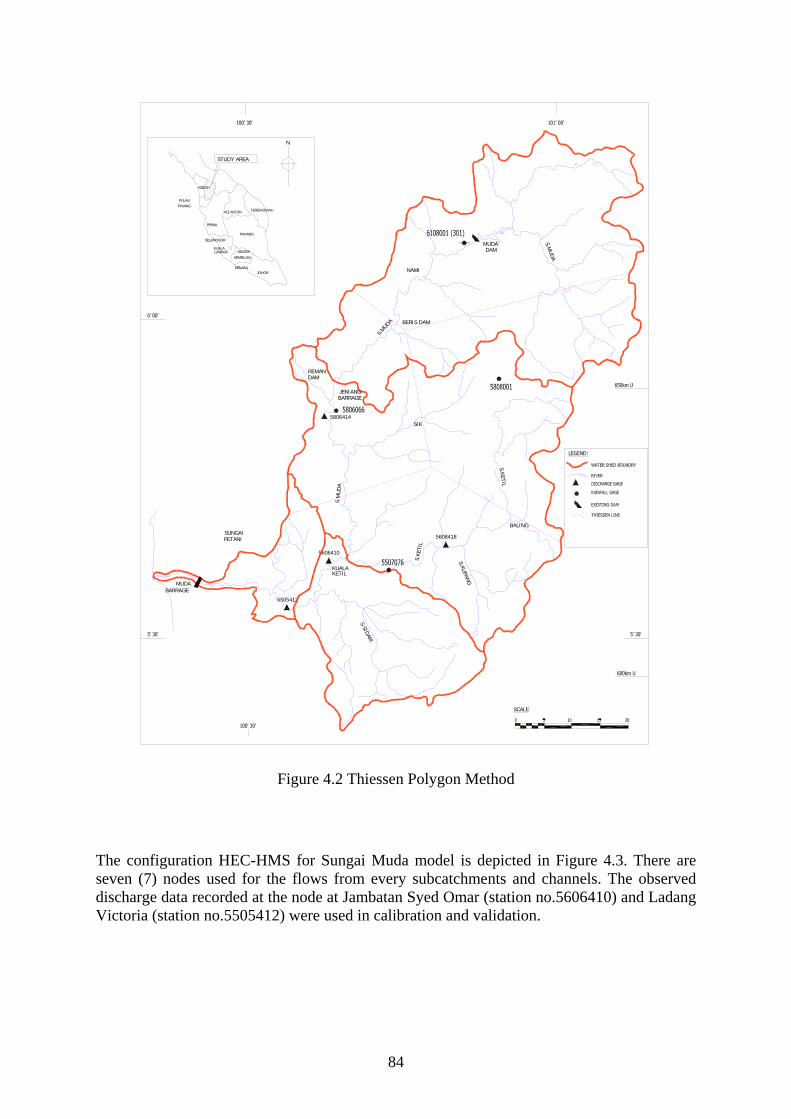
The weighted rainfall factors and the Thiessen Polygon method are depicted in Table 4.2 and Figure 4.2 respectively.
Table 4.2 Weighted Rainfall Factor Area Weighted Rainfall Stations
Catchment (sq.km) 6108001 5808001 5806066 5507076 Nami 1661 0.61 0.27 0.12 - Sik-Ketil 1718 - 0.34 0.25 0.41 Sidam 616 - - - 1.00 Sg.Muda DS 215 - - 0.07 0.93
83
5806414
BARRAGEJENIANG
5606410
5505412
BARRAGEMUDA
PETANISUNGAI
KETILKUALA
REMANDAM
N
LUMPURKUALA
KEDAH
PINANG
SEMBILAN
PULAU
PERAK
SELANOGOR
NEGERI
MELAKAJOHOR
PAHANG
TERENGGANUKELANTAN
STUDY AREA
5608418
BALING
SCALE
SIK
NAMI
BERIS DAM
DAMMUDA
S.MUD
A
S.MUD
A
S.KETIL
S.KUPANG
S.KE
TIL
S.SIDAM
S.M
UD
A
Figure 4.2 Thiessen Polygon Method
The configuration HEC-HMS for Sungai Muda model is depicted in Figure 4.3. There are seven (7) nodes used for the flows from every subcatchments and channels. The observed discharge data recorded at the node at Jambatan Syed Omar (station no.5606410) and Ladang Victoria (station no.5505412) were used in calibration and validation.
84
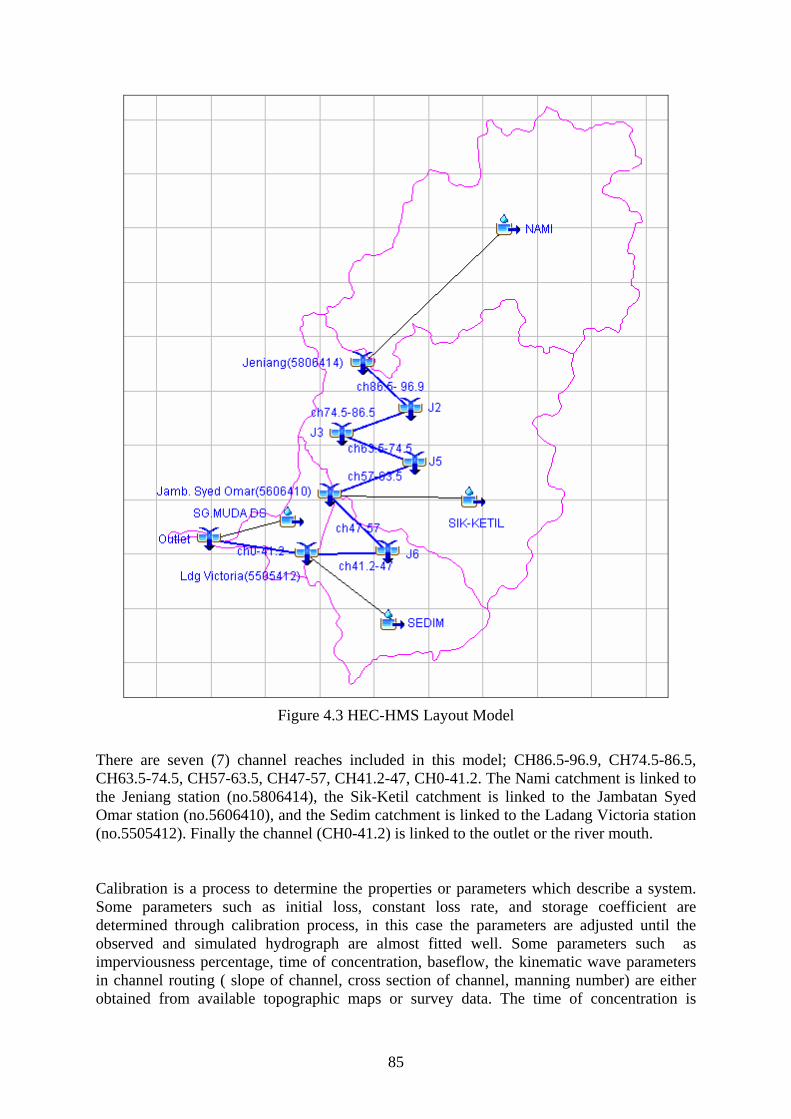
Figure 4.3 HEC-HMS Layout Model
There are seven (7) channel reaches included in this model; CH86.5-96.9, CH74.5-86.5, CH63.5-74.5, CH57-63.5, CH47-57, CH41.2-47, CH0-41.2. The Nami catchment is linked to the Jeniang station (no.5806414), the Sik-Ketil catchment is linked to the Jambatan Syed Omar station (no.5606410), and the Sedim catchment is linked to the Ladang Victoria station (no.5505412). Finally the channel (CH0-41.2) is linked to the outlet or the river mouth. Calibration is a process to determine the properties or parameters which describe a system. Some parameters such as initial loss, constant loss rate, and storage coefficient are determined through calibration process, in this case the parameters are adjusted until the observed and simulated hydrograph are almost fitted well. Some parameters such as imperviousness percentage, time of concentration, baseflow, the kinematic wave parameters in channel routing ( slope of channel, cross section of channel, manning number) are either obtained from available topographic maps or survey data. The time of concentration is
85
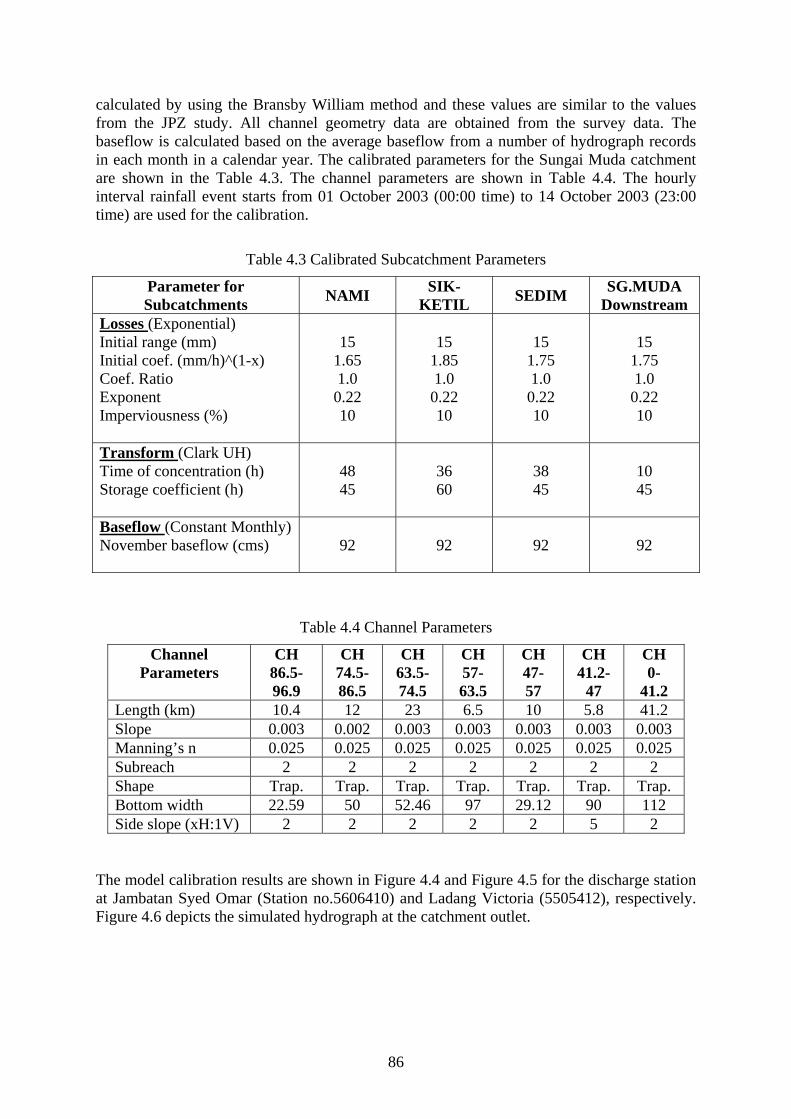
calculated by using the Bransby William method and these values are similar to the values from the JPZ study. All channel geometry data are obtained from the survey data. The baseflow is calculated based on the average baseflow from a number of hydrograph records in each month in a calendar year. The calibrated parameters for the Sungai Muda catchment are shown in the Table 4.3. The channel parameters are shown in Table 4.4. The hourly interval rainfall event starts from 01 October 2003 (00:00 time) to 14 October 2003 (23:00 time) are used for the calibration.
Table 4.3 Calibrated Subcatchment Parameters
Parameter for Subcatchments NAMI SIK-
KETIL SEDIM SG.MUDA Downstream
Losses (Exponential) Initial range (mm) Initial coef. (mm/h)^(1-x) Coef. Ratio Exponent Imperviousness (%)
15
1.65 1.0 0.22 10
15
1.85 1.0 0.22 10
15
1.75 1.0 0.22 10
15
1.75 1.0 0.22 10
Transform (Clark UH) Time of concentration (h) Storage coefficient (h)
48 45
36 60
38 45
10 45
Baseflow (Constant Monthly) November baseflow (cms)
92
92
92
92
Table 4.4 Channel Parameters
Channel Parameters
CH 86.5-96.9
CH 74.5- 86.5
CH 63.5- 74.5
CH 57- 63.5
CH 47- 57
CH 41.2-
47
CH 0-
41.2 Length (km) 10.4 12 23 6.5 10 5.8 41.2 Slope 0.003 0.002 0.003 0.003 0.003 0.003 0.003 Manning’s n 0.025 0.025 0.025 0.025 0.025 0.025 0.025 Subreach 2 2 2 2 2 2 2 Shape Trap. Trap. Trap. Trap. Trap. Trap. Trap. Bottom width 22.59 50 52.46 97 29.12 90 112 Side slope (xH:1V) 2 2 2 2 2 5 2
The model calibration results are shown in Figure 4.4 and Figure 4.5 for the discharge station at Jambatan Syed Omar (Station no.5606410) and Ladang Victoria (5505412), respectively. Figure 4.6 depicts the simulated hydrograph at the catchment outlet.
86
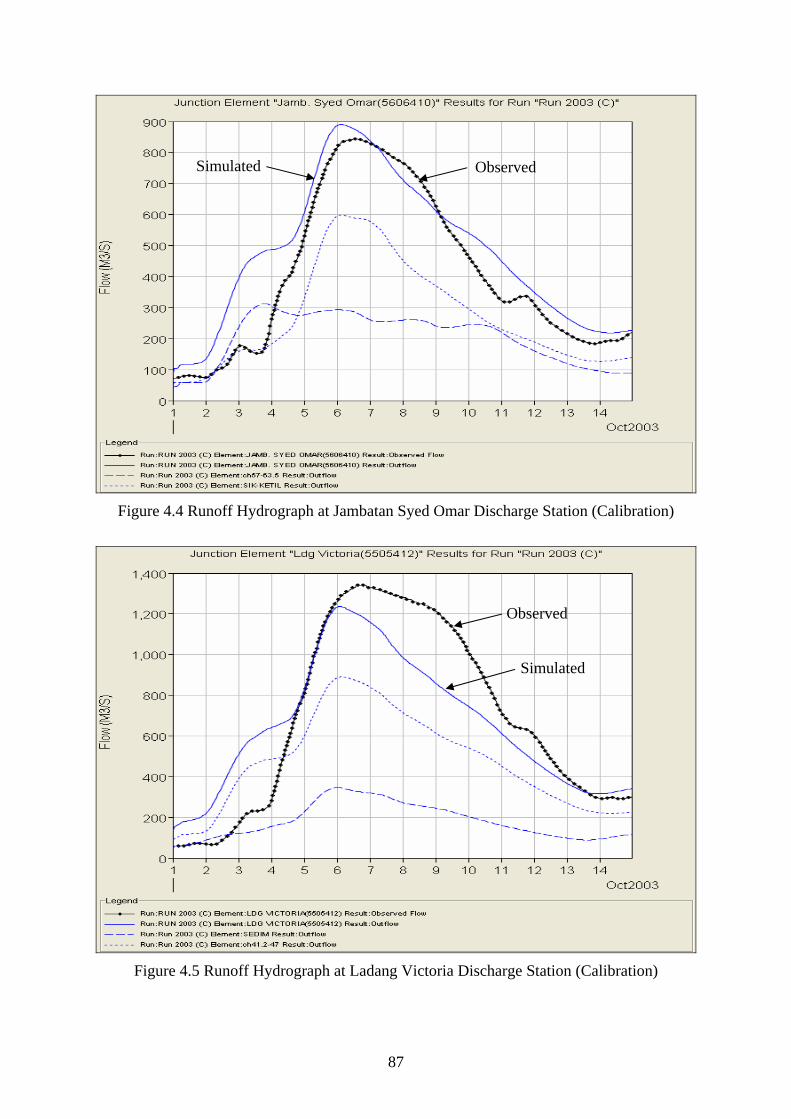
Simulated Observed
Figure 4.4 Runoff Hydrograph at Jambatan Syed Omar Discharge Station (Calibration)
Observed
Simulated
Figure 4.5 Runoff Hydrograph at Ladang Victoria Discharge Station (Calibration)
87
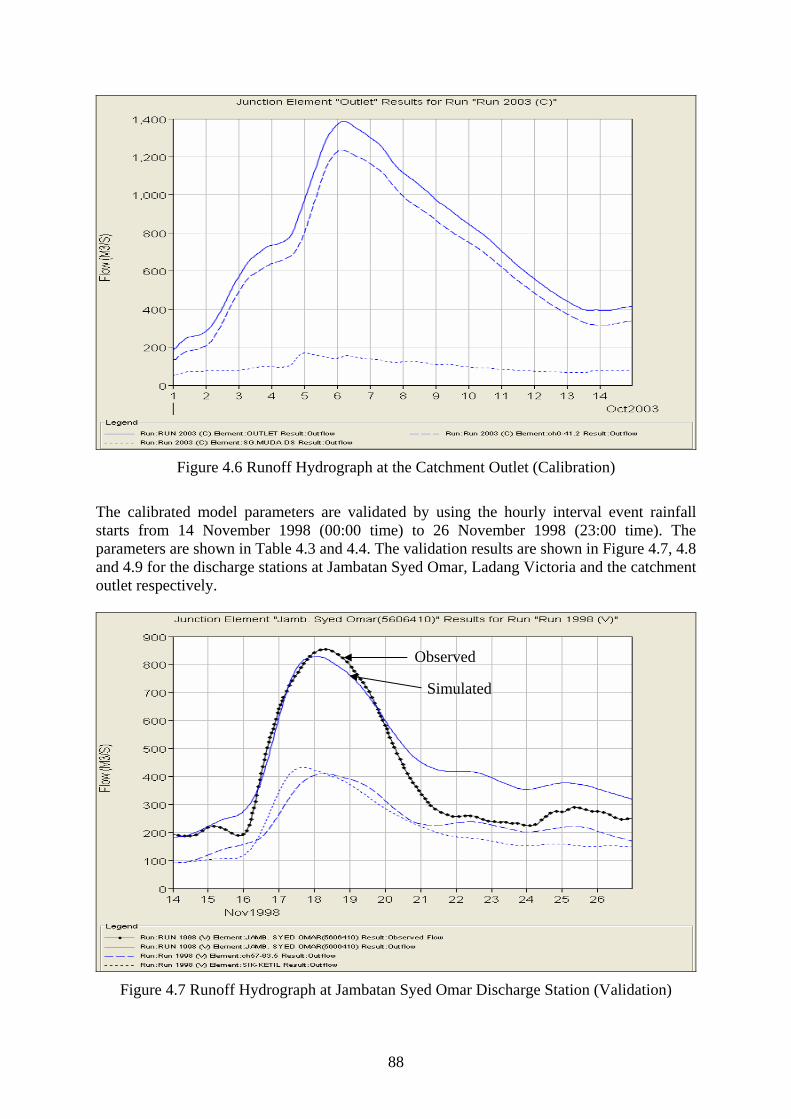
Figure 4.6 Runoff Hydrograph at the Catchment Outlet (Calibration)
The calibrated model parameters are validated by using the hourly interval event rainfall starts from 14 November 1998 (00:00 time) to 26 November 1998 (23:00 time). The parameters are shown in Table 4.3 and 4.4. The validation results are shown in Figure 4.7, 4.8 and 4.9 for the discharge stations at Jambatan Syed Omar, Ladang Victoria and the catchment outlet respectively.
Observed
Simulated
Figure 4.7 Runoff Hydrograph at Jambatan Syed Omar Discharge Station (Validation)
88
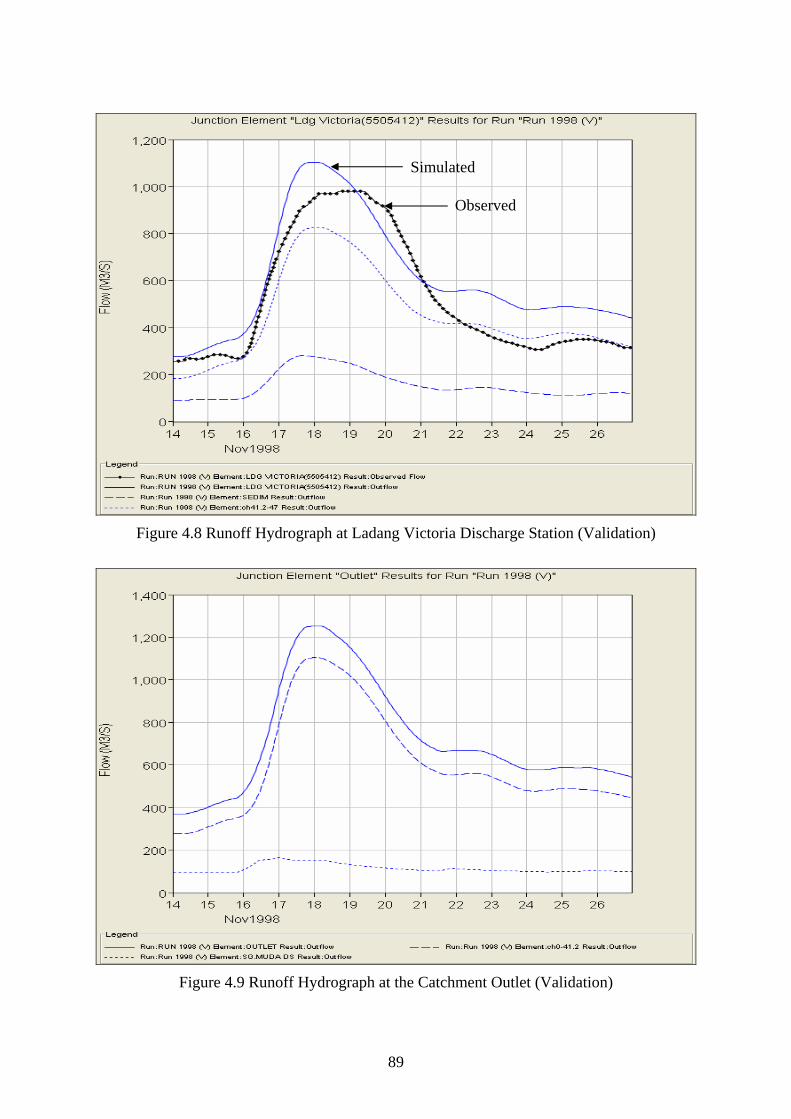
Simulated
Observed
Figure 4.8 Runoff Hydrograph at Ladang Victoria Discharge Station (Validation)
Figure 4.9 Runoff Hydrograph at the Catchment Outlet (Validation)
89
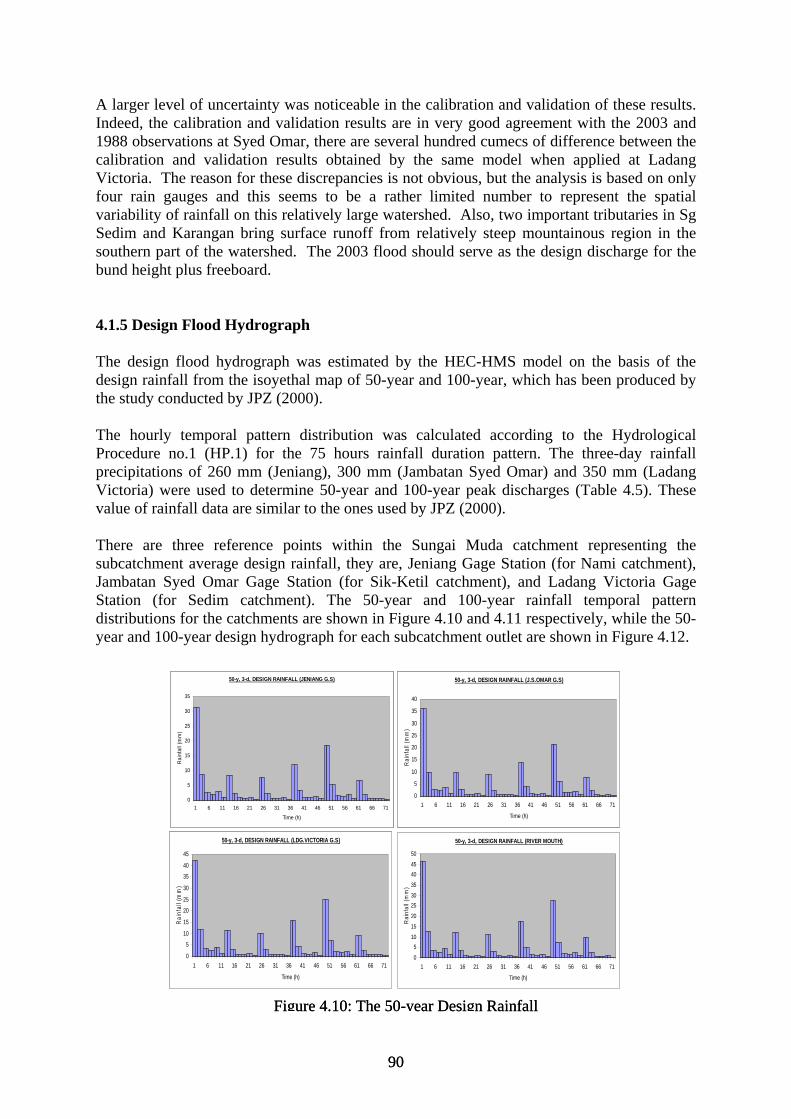
A larger level of uncertainty was noticeable in the calibration and validation of these results. Indeed, the calibration and validation results are in very good agreement with the 2003 and 1988 observations at Syed Omar, there are several hundred cumecs of difference between the calibration and validation results obtained by the same model when applied at Ladang Victoria. The reason for these discrepancies is not obvious, but the analysis is based on only four rain gauges and this seems to be a rather limited number to represent the spatial variability of rainfall on this relatively large watershed. Also, two important tributaries in Sg Sedim and Karangan bring surface runoff from relatively steep mountainous region in the southern part of the watershed. The 2003 flood should serve as the design discharge for the bund height plus freeboard. 4.1.5 Design Flood Hydrograph The design flood hydrograph was estimated by the HEC-HMS model on the basis of the design rainfall from the isoyethal map of 50-year and 100-year, which has been produced by the study conducted by JPZ (2000). The hourly temporal pattern distribution was calculated according to the Hydrological Procedure no.1 (HP.1) for the 75 hours rainfall duration pattern. The three-day rainfall precipitations of 260 mm (Jeniang), 300 mm (Jambatan Syed Omar) and 350 mm (Ladang Victoria) were used to determine 50-year and 100-year peak discharges (Table 4.5). These value of rainfall data are similar to the ones used by JPZ (2000). There are three reference points within the Sungai Muda catchment representing the subcatchment average design rainfall, they are, Jeniang Gage Station (for Nami catchment), Jambatan Syed Omar Gage Station (for Sik-Ketil catchment), and Ladang Victoria Gage Station (for Sedim catchment). The 50-year and 100-year rainfall temporal pattern distributions for the catchments are shown in Figure 4.10 and 4.11 respectively, while the 50-year and 100-year design hydrograph for each subcatchment outlet are shown in Figure 4.12.
Figure 4.10: The 50-year Design Rainfall
50-y, 3-d, DESIGN RAINFALL (JENIANG G.S)
0
5
10
15
20
25
30
35
1 6 11 16 21 26 31 36 41 46 51 56 61 66 71
Time (h)
Rai
nfal
l (m
m)
50-y, 3-d, DESIGN RAINFALL (J.S.OMAR G.S)
0
5
10
15
20
25
30
35
40
1 6 11 16 21 26 31 36 41 46 51 56 61 66 71
Time (h)
Rai
nfal
l (m
m)
50-y, 3-d, DESIGN RAINFALL (LDG.VICTORIA G.S)
0
5
10
15
20
25
30
35
40
45
1 6 11 16 21 26 31 36 41 46 51 56 61 66 71
Time (h)
Rai
nfal
l (m
m)
90
Figure 4.10: The 50-year Design Rainfall
50-y, 3-d, DESIGN RAINFALL (JENIANG G.S)
0
5
10
15
20
25
30
35
1 6 11 16 21 26 31 36 41 46 51 56 61 66 71
Time (h)
Rai
nfal
l (m
m)
50-y, 3-d, DESIGN RAINFALL (J.S.OMAR G.S)
0
5
10
15
20
25
30
35
40
1 6 11 16 21 26 31 36 41 46 51 56 61 66 71
Time (h)
Rai
nfal
l (m
m)
50-y, 3-d, DESIGN RAINFALL (LDG.VICTORIA G.S)
0
5
10
15
20
25
30
35
40
45
1 6 11 16 21 26 31 36 41 46 51 56 61 66 71
Time (h)
Rai
nfal
l (m
m)
50-y, 3-d, DESIGN RAINFALL (RIVER MOUTH)
0
510
15
20
2530
35
4045
50
1 6 11 16 21 26 31 36 41 46 51 56 61 66 71
Time (h)
Rai
nfal
l (m
m)
90
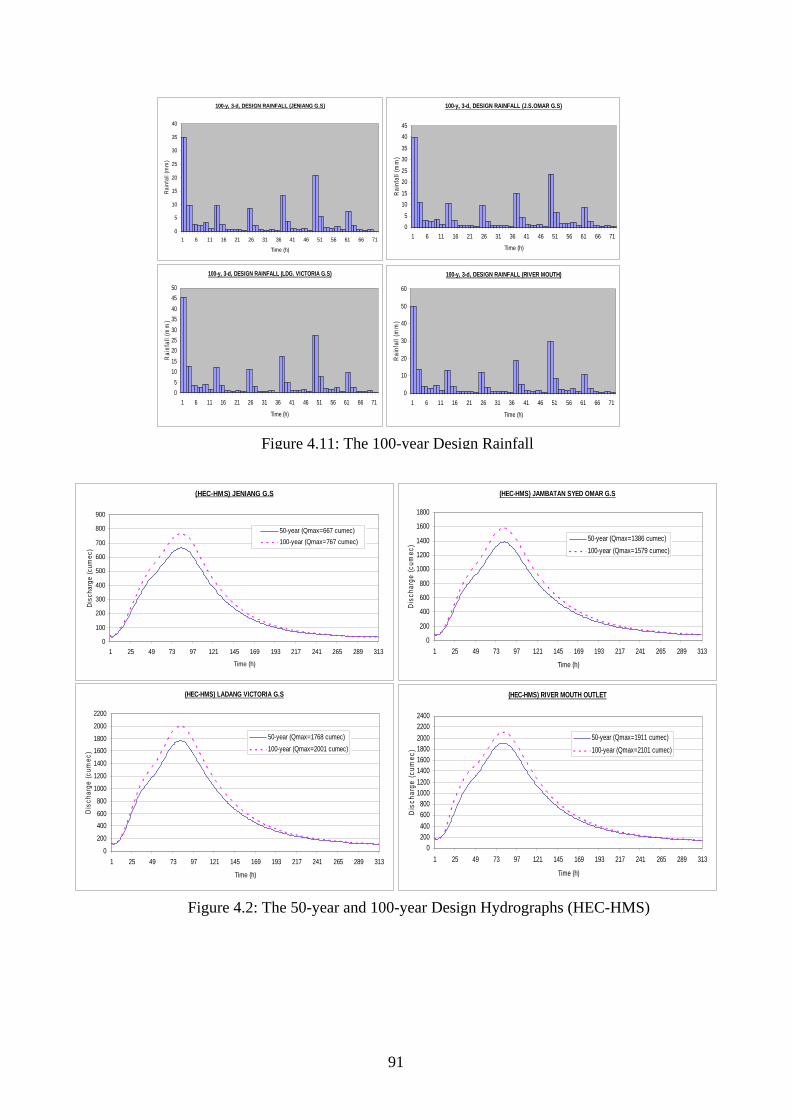
91
Figure 4.11: The 100-year Design Rainfall
100-y, 3-d, DESIGN RAINFALL (JENIANG G.S)
0
5
10
15
20
25
30
35
40
1 6 11 16 21 26 31 36 41 46 51 56 61 66 71
Time (h)
Rai
nfal
l (m
m)
100-y, 3-d, DESIGN RAINFALL (J.S.OMAR G.S)
0
5
10
15
20
25
30
35
40
45
1 6 11 16 21 26 31 36 41 46 51 56 61 66 71
Time (h)
Rai
nfal
l (m
m)
100-y, 3-d, DESIGN RAINFALL (LDG. VICTORIA G.S)
05
101520253035404550
1 6 11 16 21 26 31 36 41 46 51 56 61 66 71
Time (h)
Rai
nfal
l (m
m)
100-y, 3-d, DESIGN RAINFALL (RIVER MOUTH)
0
10
20
30
40
50
60
1 6 11 16 21 26 31 36 41 46 51 56 61 66 71
Time (h)
Rai
nfal
l (m
m)
(HEC-HMS) JENIANG G.S
0
0
0
0
0
0
0
0
0
0
1 25 49 73 97 121 145 169 193 217 241 265 289 313
Time (h)
10
20
30
40
50
60
70
80
90
Dis
char
ge (c
umec
)
50-year (Qmax=667 cumec)100-year (Qmax=767 cumec)
(HEC-HMS) JAMBATAN SYED OMAR G.S
0
200
400
600
800
1000
1200
1400
1600
1800
1 25
Dis
char
ge (c
umec
)
49 73 97 121 145 169 193 217 241 265 289 313
Time (h)
50-year (Qmax=1386 cumec)100-year (Qmax=1579 cumec)
(HEC-HMS) LADANG VICTORIA G.S
0
200
400600
800
1 25 49 73 97 121 145 169 193 217 241 265 289 313
Time (h)
1000
1200
1400
16001800
2000
2200
Dis
char
ge (c
umec
)
50-year (Qmax=1768 cumec)100-year (Qmax=2001 cumec)
(HEC-HMS) RIVER MOUTH OUTLET
0200400600800
10001200140016001800200022002400
1 25
Dis
char
ge (c
umec
)
49 73 97 121 145 169 193 217 241 265 289 313
Time (h)
50-year (Qmax=1911 cumec)100-year (Qmax=2101 cumec)
Figure 4.2: The 50-year and 100-year Design Hydrographs (HEC HMS)
Figure 4.2: The 50-year and 100-year Design Hydrographs (HEC-HMS)
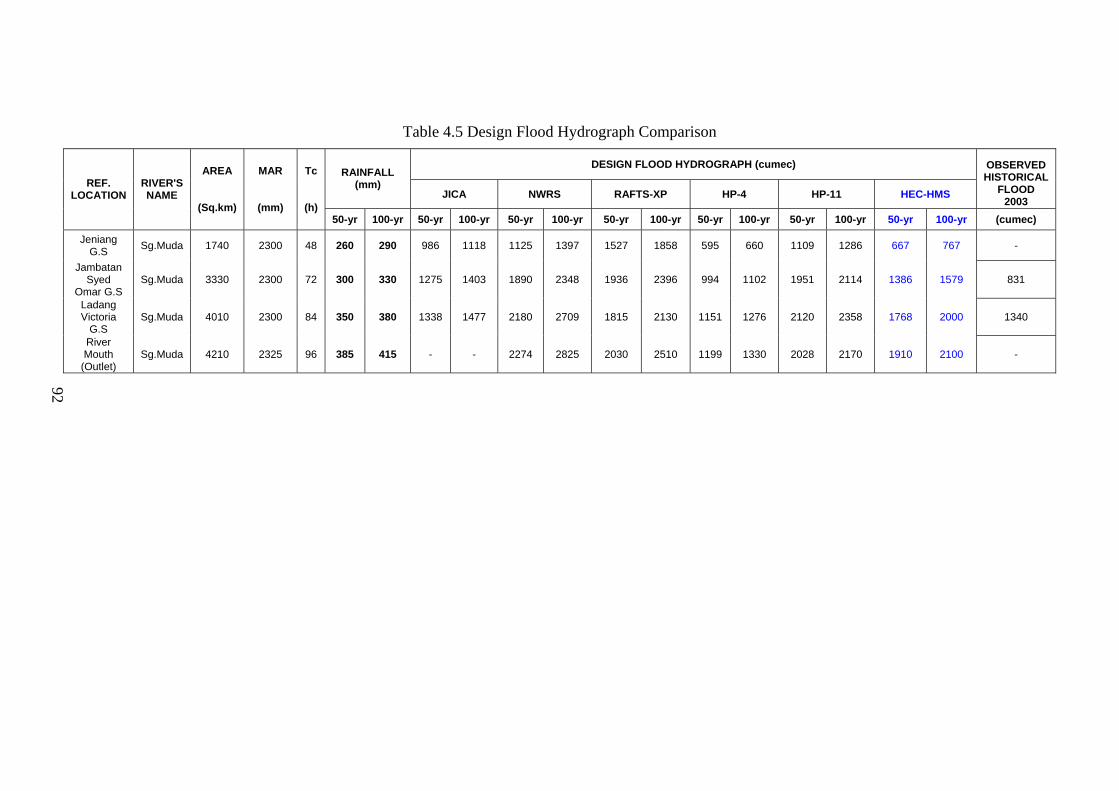
92
DESIGN FLOOD HYDROGRAPH (cumec) RAINFALL
(mm) JICA NWRS RAFTS-XP HP-4 HP-11 HEC-HMS
OBSERVED HISTORICAL
FLOOD 2003
REF. LOCATION
RIVER'S NAME
AREA
(Sq.km)
MAR
(mm)
Tc
(h) 50-yr 100-yr 50-yr 100-yr 50-yr 100-yr 50-yr 100-yr 50-yr 100-yr 50-yr 100-yr 50-yr 100-yr (cumec)
Jeniang G.S Sg.Muda 1740 2300 48 260 290 986 1118 1125 1397 1527 1858 595 660 1109 1286 667 767 -
Jambatan Syed
Omar G.S Sg.Muda 3330 2300 72 300 330 1275 1403 1890 2348 1936 2396 994 1102 1951 2114 1386 1579 831
Ladang Victoria
G.S Sg.Muda 4010 2300 84 350 380 1338 1477 2180 2709 1815 2130 1151 1276 2120 2358 1768 2000 1340
River Mouth
(Outlet) Sg.Muda 4210 2325 96 385 415 - - 2274 2825 2030 2510 1199 1330 2028 2170 1910 2100 -
Table 4.5 Design Flood Hydrograph Comparison
92
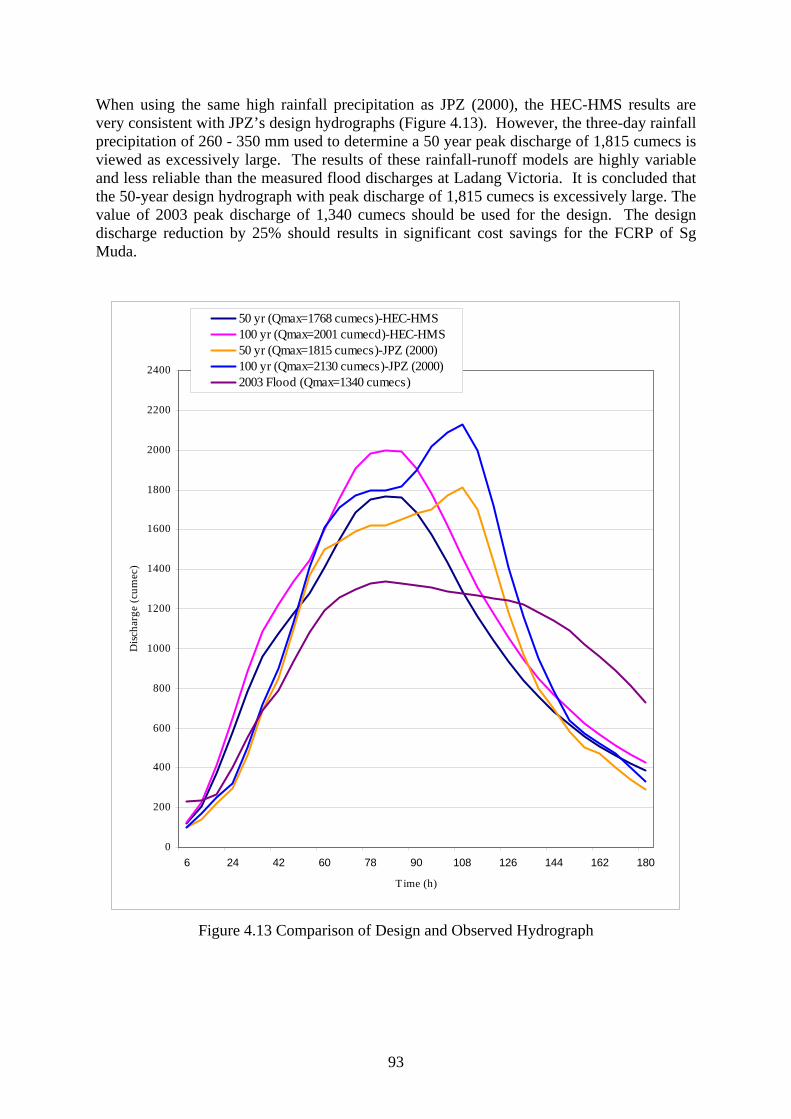
When using the same high rainfall precipitation as JPZ (2000), the HEC-HMS results are very consistent with JPZ’s design hydrographs (Figure 4.13). However, the three-day rainfall precipitation of 260 - 350 mm used to determine a 50 year peak discharge of 1,815 cumecs is viewed as excessively large. The results of these rainfall-runoff models are highly variable and less reliable than the measured flood discharges at Ladang Victoria. It is concluded that the 50-year design hydrograph with peak discharge of 1,815 cumecs is excessively large. The value of 2003 peak discharge of 1,340 cumecs should be used for the design. The design discharge reduction by 25% should results in significant cost savings for the FCRP of Sg Muda.
0
200
400
600
800
1000
1200
1400
1600
1800
2000
2200
2400
6 24 42 60 78 90 108 126 144 162 180
Time (h)
Disc
harg
e (c
umec
)
50 yr (Qmax=1768 cumecs)-HEC-HMS100 yr (Qmax=2001 cumecd)-HEC-HMS50 yr (Qmax=1815 cumecs)-JPZ (2000)100 yr (Qmax=2130 cumecs)-JPZ (2000)2003 Flood (Qmax=1340 cumecs)
Figure 4.13 Comparison of Design and Observed Hydrograph
93
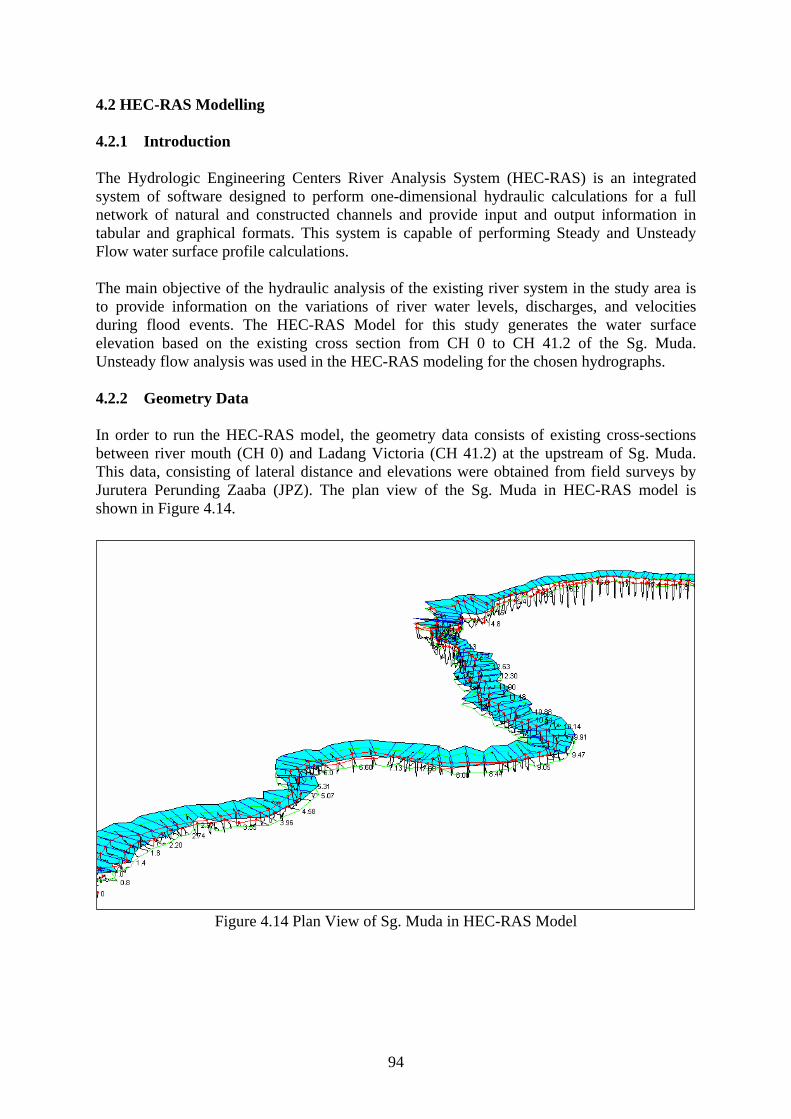
4.2 HEC-RAS Modelling 4.2.1 Introduction The Hydrologic Engineering Centers River Analysis System (HEC-RAS) is an integrated system of software designed to perform one-dimensional hydraulic calculations for a full network of natural and constructed channels and provide input and output information in tabular and graphical formats. This system is capable of performing Steady and Unsteady Flow water surface profile calculations. The main objective of the hydraulic analysis of the existing river system in the study area is to provide information on the variations of river water levels, discharges, and velocities during flood events. The HEC-RAS Model for this study generates the water surface elevation based on the existing cross section from CH 0 to CH 41.2 of the Sg. Muda. Unsteady flow analysis was used in the HEC-RAS modeling for the chosen hydrographs. 4.2.2 Geometry Data In order to run the HEC-RAS model, the geometry data consists of existing cross-sections between river mouth (CH 0) and Ladang Victoria (CH 41.2) at the upstream of Sg. Muda. This data, consisting of lateral distance and elevations were obtained from field surveys by Jurutera Perunding Zaaba (JPZ). The plan view of the Sg. Muda in HEC-RAS model is shown in Figure 4.14.
Figure 4.14 Plan View of Sg. Muda in HEC-RAS Model
94
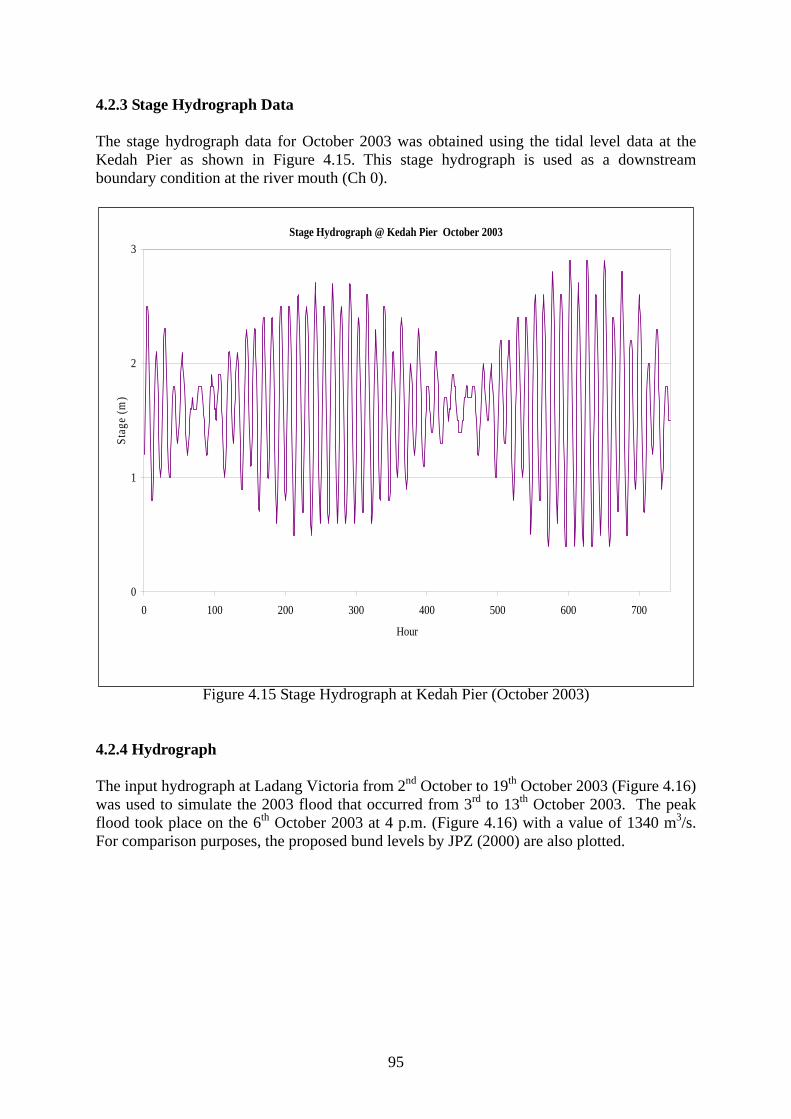
4.2.3 Stage Hydrograph Data The stage hydrograph data for October 2003 was obtained using the tidal level data at the Kedah Pier as shown in Figure 4.15. This stage hydrograph is used as a downstream boundary condition at the river mouth (Ch 0).
Stage Hydrograph @ Kedah Pier October 2003
0
1
2
3
0 100 200 300 400 500 600 700
Hour
Stag
e (m
)
Figure 4.15 Stage Hydrograph at Kedah Pier (October 2003)
4.2.4 Hydrograph The input hydrograph at Ladang Victoria from 2nd October to 19th October 2003 (Figure 4.16) was used to simulate the 2003 flood that occurred from 3rd to 13th October 2003. The peak flood took place on the 6th October 2003 at 4 p.m. (Figure 4.16) with a value of 1340 m3/s. For comparison purposes, the proposed bund levels by JPZ (2000) are also plotted.
95
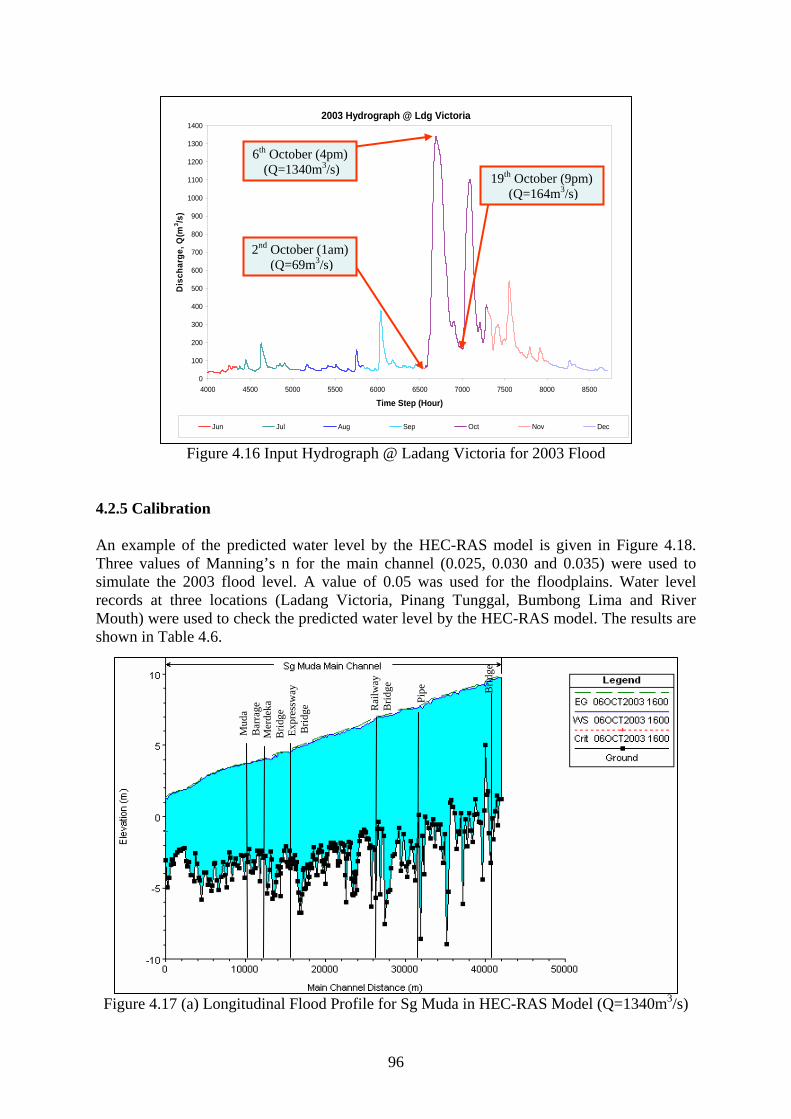
2003 Hydrograph @ Ldg Victoria
1400
96
0
100
200
300
400
500
600
700
800
900
1000
1100
1200
1300
4000 4500 5000 5500 6000 6500 7000 7500 8000 8500
Time tep (Hour)
Dis
char
ge, Q
(m3 /s
)
S
Jun Jul Aug Sep Oct Nov Dec
6th October (4pm)
(Q=1340m3/s) 19th October (9pm)
(Q=164m3/s)
2nd October (1am) (Q=69m3/s)
Figure 4.16 Input Hydrograph @ Ladang Victoria for 2003 Flood
4.2.5 Calibration An example of the predicted water level by the HEC-RAS model is given in Figure 4.18. Three values of Manning’s n for the main channel (0.025, 0.030 and 0.035) were used to simulate the 2003 flood level. A value of 0.05 was used for the floodplains. Water level records at three locations (Ladang Victoria, Pinang Tunggal, Bumbong Lima and River Mouth) were used to check the predicted water level by the HEC-RAS model. The results are shown in Table 4.6.
Brid
ge
Rai
lway
B
ridge
Pipe
Mud
a B
arra
ge
Mer
deka
B
ridge
Ex
pr B
res
sway
id
ge
Figure 4.17 (a) Longitudinal Flood Profile for Sg Muda in HEC-RAS Model (Q=1340m3/s)
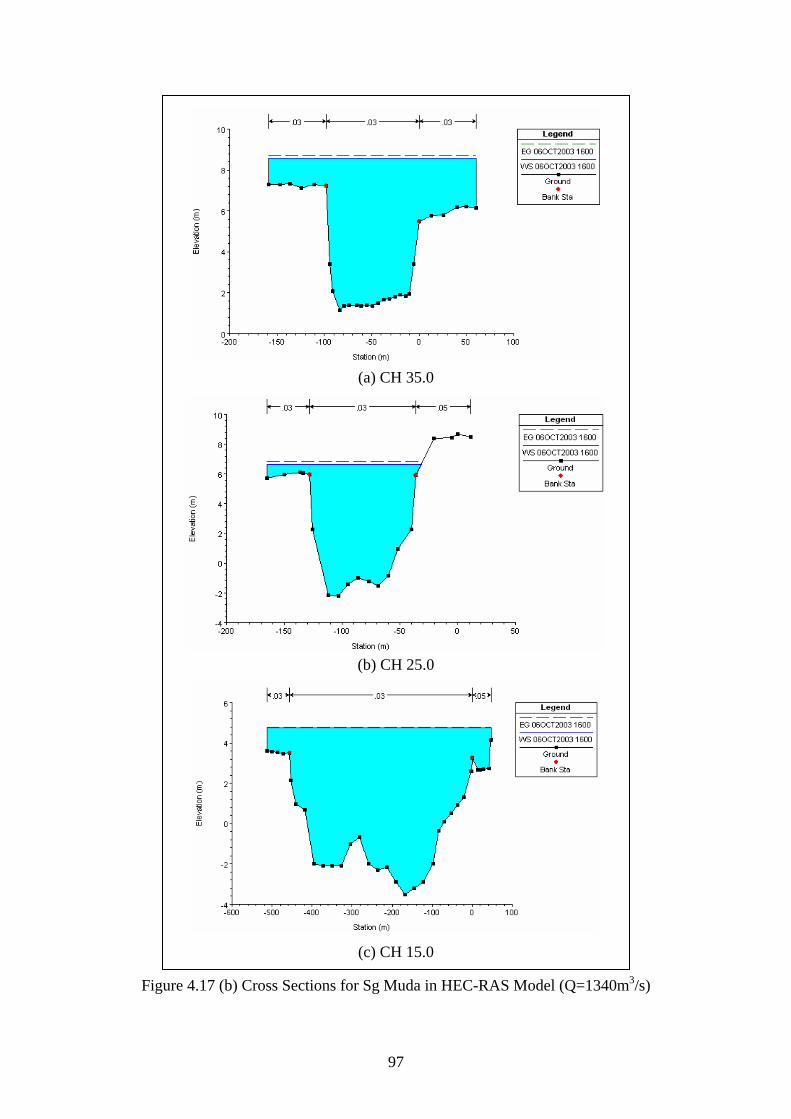
(a) CH 35.0
(b) CH 25.0
(c) CH 15.0
Figure 4.17 (b) Cross Sections for Sg Muda in HEC-RAS Model (Q=1340m3/s)
97
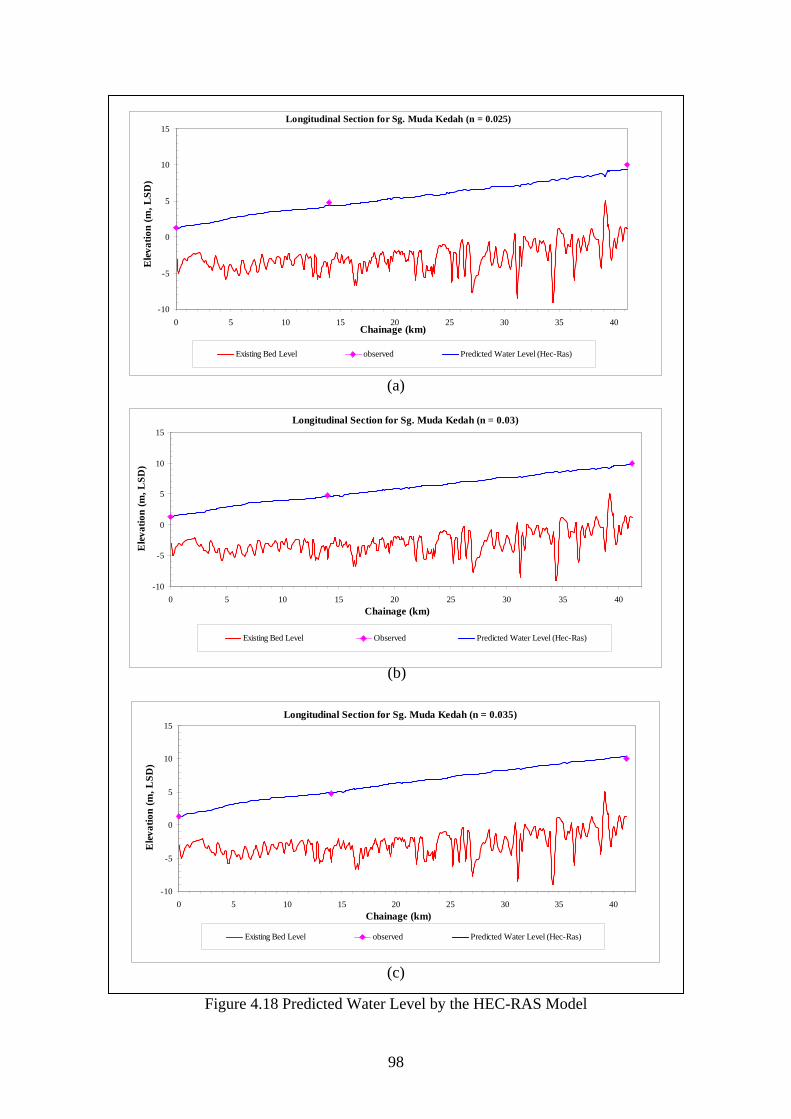
(a)
(b)
(c)
-10
-5
0
5
10
15
0 5 10 15 2
98
0ge
25 30 35 40Chaina (km)
Ele
vatio
n (m
, LSD
)
Existing Bed Level observed Predicted Water Level (Hec-Ras)
Longitudinal Section for Muda Kedah (n = 0.025)Sg.
-10
-5
0
5
10
15
0 5 10 15 25 30 35 40Chain e (km)
Ele
vatio
n (m
, LSD
)
20ag
Existing Bed Level observed Predicted Water Level (Hec-Ras)
Longitudinal Section for Sg. Muda Kedah (n = 0.035)
-10
-5
0
5
10
15
0 5 10 15 20 25 30 35 40Chainage (km)
Ele
vatio
n (m
, LSD
)
Existing Bed Level Observed Predicted Water Level (Hec-Ras)
Longitudinal Section fo g. Muda Kedah (n = 0.03)r S
Figure 4.18 Predicted Water Level by the HEC-RAS Model

99
Table 4.7 and Table 4.8 give water level comparisons at two locations along Sg. Muda (Ladang Victoria and Bumbong Lima) at the peak water levels as they occurred during the 2003 flood. The results show that with Manning’s n of 0.030, the predicted water levels by HEC-RAS model are the nearest to the observed values. Similar results are obtained for the duration of the flood as shown in Figure 4.19 and Figure 4.20. Therefore the Manning’s n value of 0.030 will be used for further analysis in the present study.
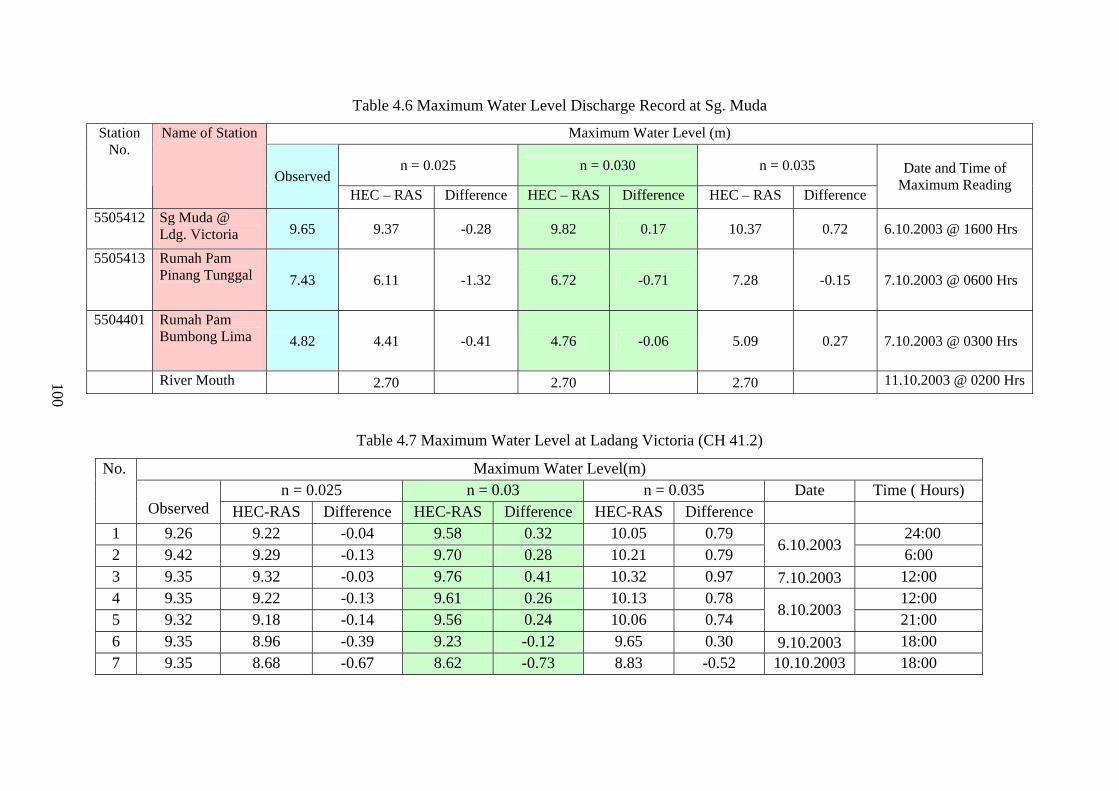
Table 4.6 Maximum Water Level Discharge Record at Sg. Muda
Maximum Water Level (m)
n = 0.025 n = 0.030 n = 0.035
Station No.
Name of Station
Observed HEC – RAS Difference HEC – RAS Difference HEC – RAS Difference
Date and Time of Maximum Reading
5505412 Sg Muda @ Ldg. Victoria 9.65 9.37 -0.28 9.82 0.17 10.37 0.72 6.10.2003 @ 1600 Hrs
5505413 Rumah Pam Pinang Tunggal 7.43 6.11 -1.32 6.72 -0.71 7.28 -0.15 7.10.2003 @ 0600 Hrs
5504401 Rumah Pam Bumbong Lima 4.82 4.41 -0.41 4.76 -0.06 5.09 0.27 7.10.2003 @ 0300 Hrs
River Mouth 2.70 2.70 2.70 11.10.2003 @ 0200 Hrs 100
Table 4.7 Maximum Water Level at Ladang Victoria (CH 41.2)
Maximum Water Level(m) n = 0.025 n = 0.03 n = 0.035 Date Time ( Hours)
No.
Observed HEC-RAS Difference HEC-RAS Difference HEC-RAS Difference 1 9.26 9.22 -0.04 9.58 0.32 10.05 0.79 24:00 2 9.42 9.29 -0.13 9.70 0.28 10.21 0.79 6.10.2003 6:00 3 9.35 9.32 -0.03 9.76 0.41 10.32 0.97 7.10.2003 12:00 4 9.35 9.22 -0.13 9.61 0.26 10.13 0.78 12:00 5 9.32 9.18 -0.14 9.56 0.24 10.06 0.74 8.10.2003 21:00 6 9.35 8.96 -0.39 9.23 -0.12 9.65 0.30 9.10.2003 18:00 7 9.35 8.68 -0.67 8.62 -0.73 8.83 -0.52 10.10.2003 18:00
99
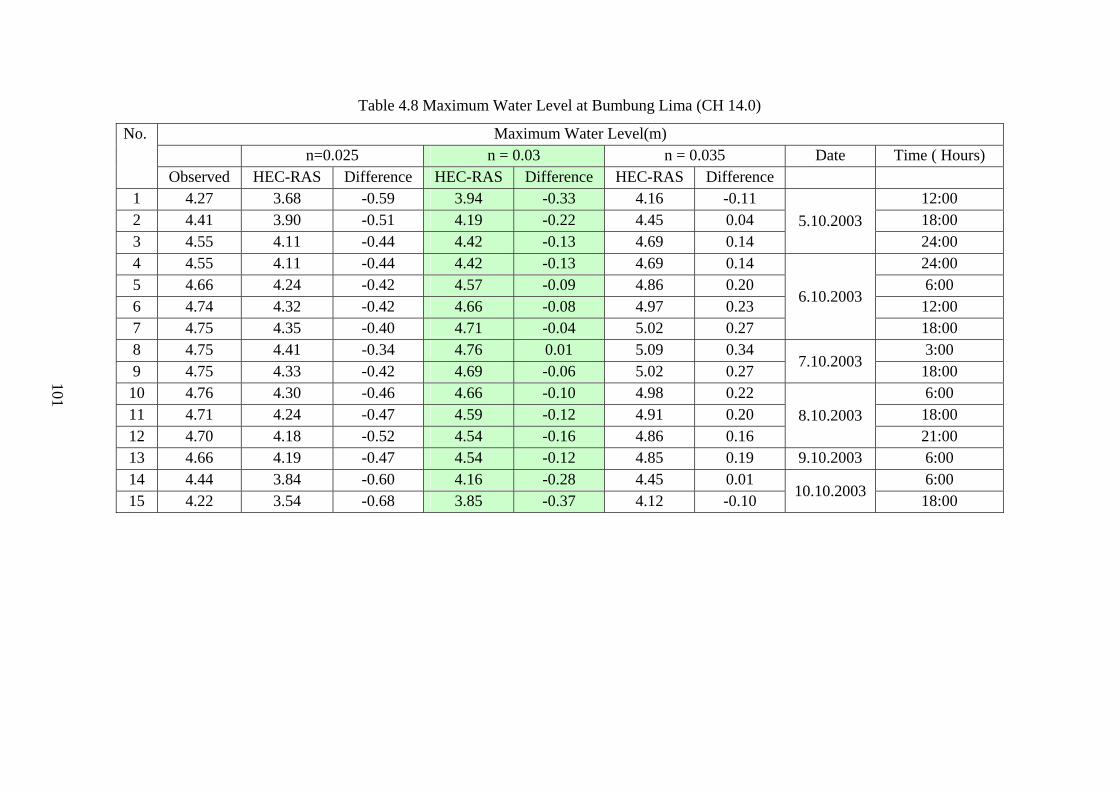
Maximum Water Level(m) n=0.025 n = 0.03 n = 0.035 Date Time ( Hours)
No.
Observed HEC-RAS Difference HEC-RAS Difference HEC-RAS Difference 1 4.27 3.68 -0.59 3.94 -0.33 4.16 -0.11 12:00 2 4.41 3.90 -0.51 4.19 -0.22 4.45 0.04 18:00 3 4.55 4.11 -0.44 4.42 -0.13 4.69 0.14
5.10.2003 24:00
4 4.55 4.11 -0.44 4.42 -0.13 4.69 0.14 24:00 5 4.66 4.24 -0.42 4.57 -0.09 4.86 0.20 6:00 6 4.74 4.32 -0.42 4.66 -0.08 4.97 0.23 12:00 7 4.75 4.35 -0.40 4.71 -0.04 5.02 0.27
6.10.2003
18:00 8 4.75 4.41 -0.34 4.76 0.01 5.09 0.34 3:00 9 4.75 4.33 -0.42 4.69 -0.06 5.02 0.27 7.10.2003 18:00 10 4.76 4.30 -0.46 4.66 -0.10 4.98 0.22 6:00 11 4.71 4.24 -0.47 4.59 -0.12 4.91 0.20 18:00 12 4.70 4.18 -0.52 4.54 -0.16 4.86 0.16
8.10.2003 21:00
13 4.66 4.19 -0.47 4.54 -0.12 4.85 0.19 9.10.2003 6:00 14 4.44 3.84 -0.60 4.16 -0.28 4.45 0.01 6:00 15 4.22 3.54 -0.68 3.85 -0.37 4.12 -0.10 10.10.2003 18:00
Table 4.8 Maximum Water Level at Bumbung Lima (CH 14.0)
100
101
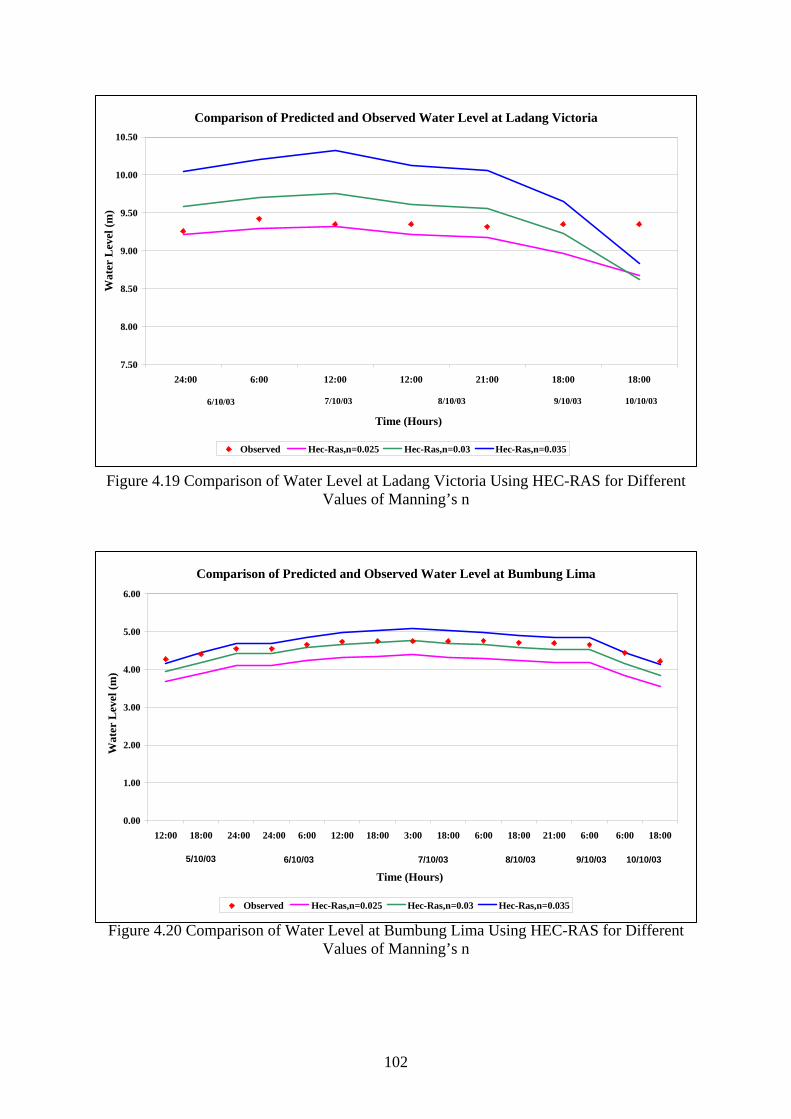
Comparison of Predicted and Observed Water Level at Bumbung Lima
0.00
1.00
2.00
3.00
4.00
5.00
6.00
12:00 18:00 24:00 24:00 6:00 12:00 18:00 3:00 18:00 6:00 18:00 21:00 6:00 6:00 18:00
Time (Hours)
Wat
er L
evel
(m)
Observed Hec-Ras,n=0.025 Hec-Ras,n=0.03 Hec-Ras,n=0.035
5/10/03 7/10/036/10/03 10/10/039/10/038/10/03
Comparison of Predicted and Observed Water Level at Ladang Victoria
7.50
8.00
8.50
9.00
9.50
10.00
10.50
24:00 6:00 12:00 12:00 21:00 18:00 18:00
Tim )
Wat
er L
evel
(m)
e (Hours
Observed Hec-Ras,n=0.025 Hec-Ras,n=0.03 Hec-Ras,n=0.035
7/10/036/10/03 10/10/039/10/038/10/03
Figure 4.19 Comparison of Water Level at Ladang Victoria Using HEC-RAS for Different
Values of Manning’s n
Figure 4.20 Comparison of Water Level at Bumbung Lima Using HEC-RAS for Different Values of Manning’s n
102
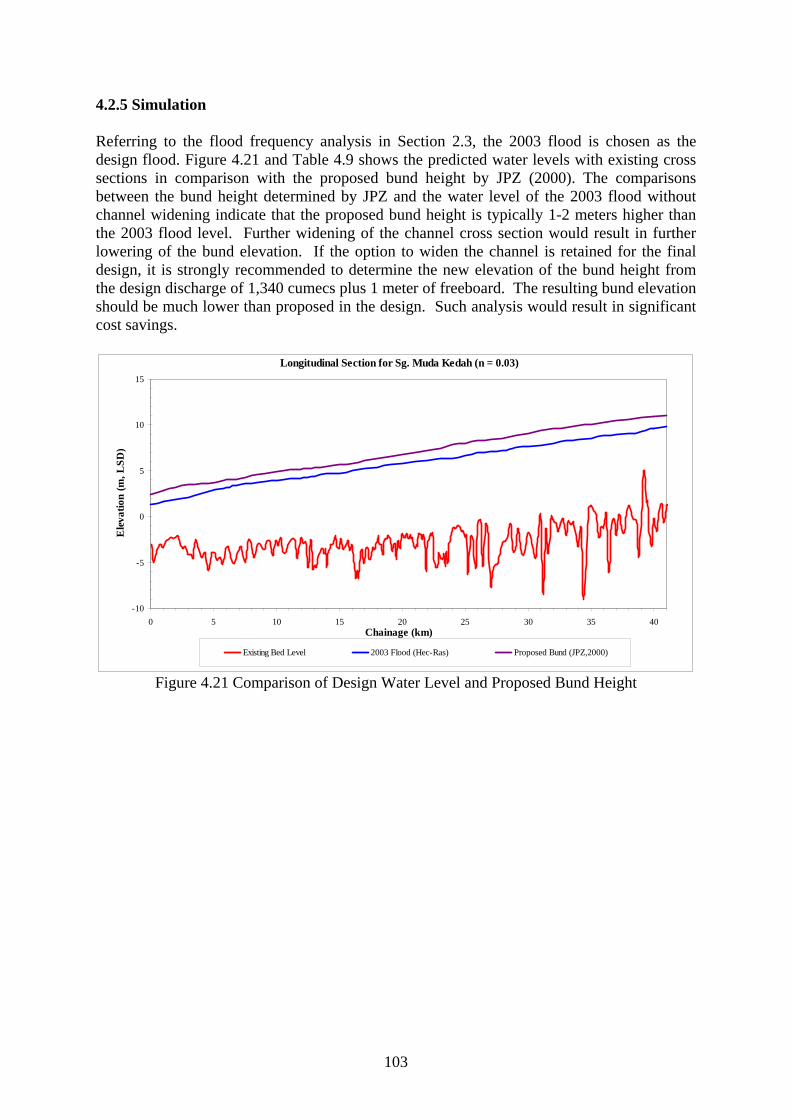
4.2.5 Simulation Referring to the flood frequency analysis in Section 2.3, the 2003 flood is chosen as the design flood. Figure 4.21 and Table 4.9 shows the predicted water levels with existing cross sections in comparison with the proposed bund height by JPZ (2000). The comparisons between the bund height determined by JPZ and the water level of the 2003 flood without channel widening indicate that the proposed bund height is typically 1-2 meters higher than the 2003 flood level. Further widening of the channel cross section would result in further lowering of the bund elevation. If the option to widen the channel is retained for the final design, it is strongly recommended to determine the new elevation of the bund height from the design discharge of 1,340 cumecs plus 1 meter of freeboard. The resulting bund elevation should be much lower than proposed in the design. Such analysis would result in significant cost savings.
-10
-5
0
5
10
15
0 5 10 15
103
20age (
25 30 35 40Chain km)
Ele
vatio
n (m
, LSD
)
Existing Bed Level 2003 F od (Hec-Ras)lo Proposed Bund (JPZ,2000)
Longitudinal Section for Sg. Muda Kedah (n = 0.03)
Figure 4.21 Comparison of Design Water Level and Proposed Bund Height
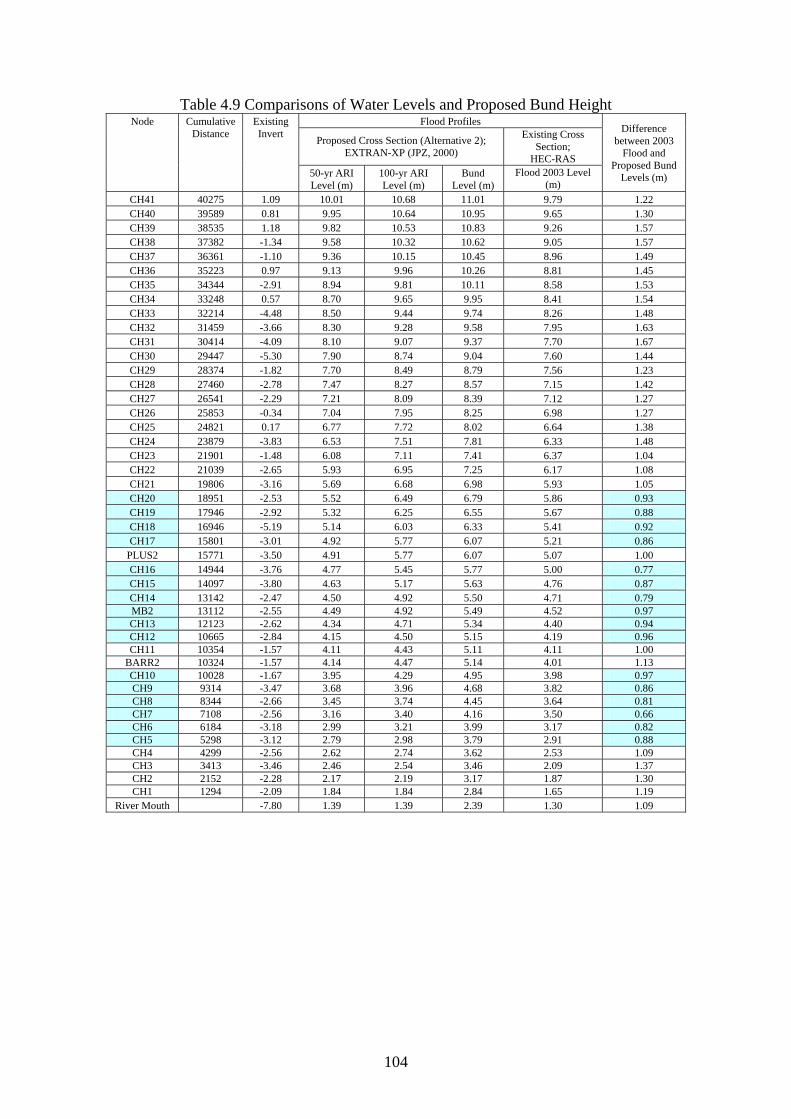
Table 4.9 Comparisons of Water Levels and Proposed Bund Height Flood Profiles
Proposed Cross Section (Alternative 2); EXTRAN-XP (JPZ, 2000)
Existing Cross Section;
HEC-RAS
Node CumulativeDistance
Existing Invert
50-yr ARI Level (m)
100-yr ARI Level (m)
Bund Level (m)
Flood 2003 Level (m)
Difference between 2003
Flood and Proposed Bund
Levels (m)
CH41 40275 1.09 10.01 10.68 11.01 9.79 1.22 CH40 39589 0.81 9.95 10.64 10.95 9.65 1.30 CH39 38535 1.18 9.82 10.53 10.83 9.26 1.57 CH38 37382 -1.34 9.58 10.32 10.62 9.05 1.57 CH37 36361 -1.10 9.36 10.15 10.45 8.96 1.49 CH36 35223 0.97 9.13 9.96 10.26 8.81 1.45 CH35 34344 -2.91 8.94 9.81 10.11 8.58 1.53 CH34 33248 0.57 8.70 9.65 9.95 8.41 1.54 CH33 32214 -4.48 8.50 9.44 9.74 8.26 1.48 CH32 31459 -3.66 8.30 9.28 9.58 7.95 1.63 CH31 30414 -4.09 8.10 9.07 9.37 7.70 1.67 CH30 29447 -5.30 7.90 8.74 9.04 7.60 1.44 CH29 28374 -1.82 7.70 8.49 8.79 7.56 1.23 CH28 27460 -2.78 7.47 8.27 8.57 7.15 1.42 CH27 26541 -2.29 7.21 8.09 8.39 7.12 1.27 CH26 25853 -0.34 7.04 7.95 8.25 6.98 1.27 CH25 24821 0.17 6.77 7.72 8.02 6.64 1.38 CH24 23879 -3.83 6.53 7.51 7.81 6.33 1.48 CH23 21901 -1.48 6.08 7.11 7.41 6.37 1.04 CH22 21039 -2.65 5.93 6.95 7.25 6.17 1.08 CH21 19806 -3.16 5.69 6.68 6.98 5.93 1.05 CH20 18951 -2.53 5.52 6.49 6.79 5.86 0.93 CH19 17946 -2.92 5.32 6.25 6.55 5.67 0.88 CH18 16946 -5.19 5.14 6.03 6.33 5.41 0.92 CH17 15801 -3.01 4.92 5.77 6.07 5.21 0.86
PLUS2 15771 -3.50 4.91 5.77 6.07 5.07 1.00 CH16 14944 -3.76 4.77 5.45 5.77 5.00 0.77 CH15 14097 -3.80 4.63 5.17 5.63 4.76 0.87 CH14 13142 -2.47 4.50 4.92 5.50 4.71 0.79 MB2 13112 -2.55 4.49 4.92 5.49 4.52 0.97 CH13 12123 -2.62 4.34 4.71 5.34 4.40 0.94 CH12 10665 -2.84 4.15 4.50 5.15 4.19 0.96 CH11 10354 -1.57 4.11 4.43 5.11 4.11 1.00
BARR2 10324 -1.57 4.14 4.47 5.14 4.01 1.13 CH10 10028 -1.67 3.95 4.29 4.95 3.98 0.97 CH9 9314 -3.47 3.68 3.96 4.68 3.82 0.86 CH8 8344 -2.66 3.45 3.74 4.45 3.64 0.81 CH7 7108 -2.56 3.16 3.40 4.16 3.50 0.66 CH6 6184 -3.18 2.99 3.21 3.99 3.17 0.82 CH5 5298 -3.12 2.79 2.98 3.79 2.91 0.88 CH4 4299 -2.56 2.62 2.74 3.62 2.53 1.09 CH3 3413 -3.46 2.46 2.54 3.46 2.09 1.37 CH2 2152 -2.28 2.17 2.19 3.17 1.87 1.30 CH1 1294 -2.09 1.84 1.84 2.84 1.65 1.19
River Mouth -7.80 1.39 1.39 2.39 1.30 1.09
104
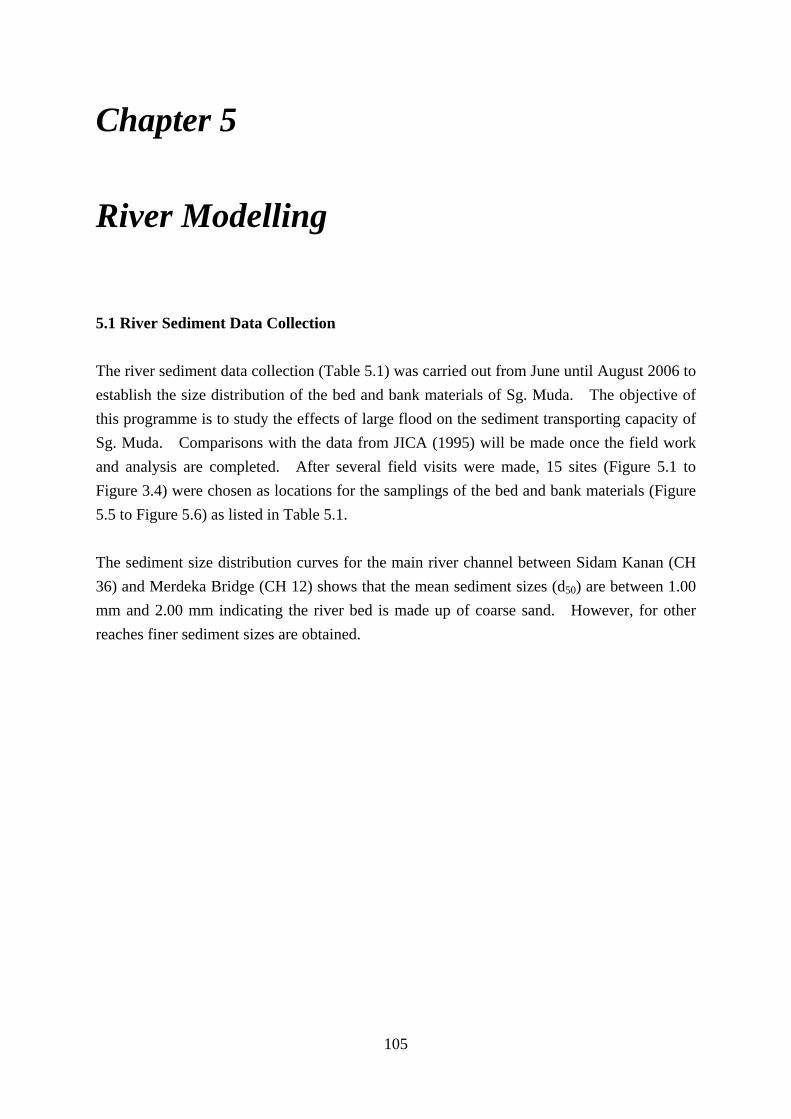
Chapter 5 River Modelling
5.1 River Sediment Data Collection The river sediment data collection (Table 5.1) was carried out from June until August 2006 to establish the size distribution of the bed and bank materials of Sg. Muda. The objective of this programme is to study the effects of large flood on the sediment transporting capacity of Sg. Muda. Comparisons with the data from JICA (1995) will be made once the field work and analysis are completed. After several field visits were made, 15 sites (Figure 5.1 to Figure 3.4) were chosen as locations for the samplings of the bed and bank materials (Figure 5.5 to Figure 5.6) as listed in Table 5.1. The sediment size distribution curves for the main river channel between Sidam Kanan (CH 36) and Merdeka Bridge (CH 12) shows that the mean sediment sizes (d50) are between 1.00 mm and 2.00 mm indicating the river bed is made up of coarse sand. However, for other reaches finer sediment sizes are obtained.
105
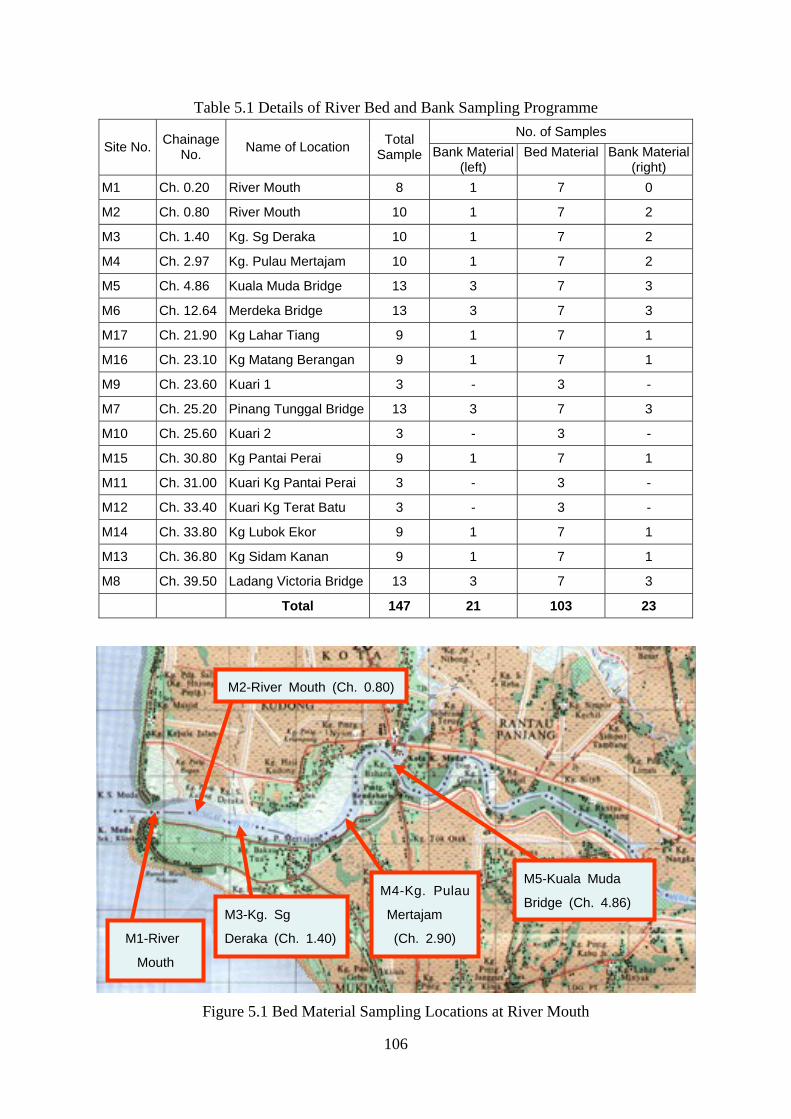
Table 5.1 Details of River Bed and Bank Sampling Programme No. of Samples
Site No. Chainage No. Name of Location Total
Sample Bank Material(left)
Bed Material
Bank Material(right)
M1 Ch. 0.20 River Mouth 8 1 7 0
M2 Ch. 0.80 River Mouth 10 1 7 2
M3 Ch. 1.40 Kg. Sg Deraka 10 1 7 2
M4 Ch. 2.97 Kg. Pulau Mertajam 10 1 7 2
M5 Ch. 4.86 Kuala Muda Bridge 13 3 7 3
M6 Ch. 12.64 Merdeka Bridge 13 3 7 3
M17 Ch. 21.90 Kg Lahar Tiang 9 1 7 1
M16 Ch. 23.10 Kg Matang Berangan 9 1 7 1
M9 Ch. 23.60 Kuari 1 3 - 3 -
M7 Ch. 25.20 Pinang Tunggal Bridge 13 3 7 3
M10 Ch. 25.60 Kuari 2 3 - 3 -
M15 Ch. 30.80 Kg Pantai Perai 9 1 7 1
M11 Ch. 31.00 Kuari Kg Pantai Perai 3 - 3 -
M12 Ch. 33.40 Kuari Kg Terat Batu 3 - 3 -
M14 Ch. 33.80 Kg Lubok Ekor 9 1 7 1
M13 Ch. 36.80 Kg Sidam Kanan 9 1 7 1
M8 Ch. 39.50 Ladang Victoria Bridge 13 3 7 3
Total 147 21 103 23
M1-River
Mouth
M2-River Mouth (Ch. 0.80)
M3-Kg. Sg
Deraka (Ch. 1.40)
M4-Kg. Pulau
Mertajam
(Ch. 2.90)
M5-Kuala Muda
Bridge (Ch. 4.86)
Figure 5.1 Bed Material Sampling Locations at River Mouth
106
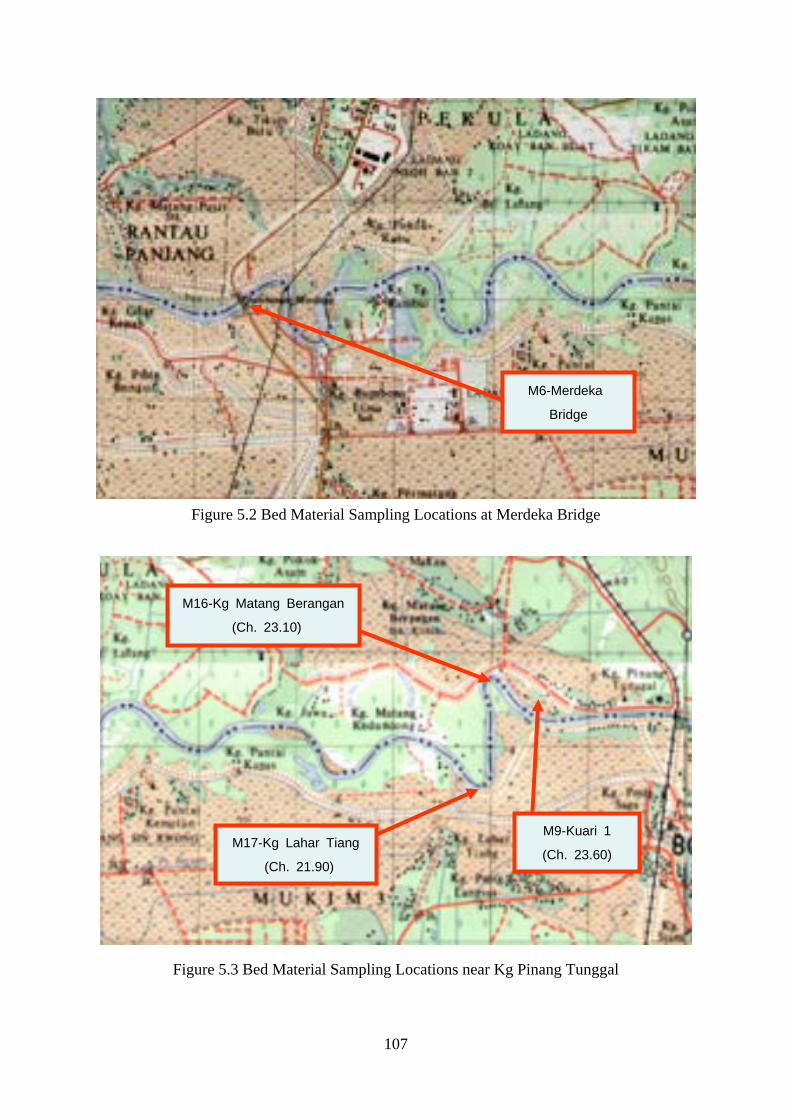
M6-Merdeka
Bridge
Figure 5.2 Bed Material Sampling Locations at Merdeka Bridge
M16-Kg Matang Berangan
(Ch. 23.10) M9-Kuari 1
(Ch. 23.60) M17-Kg Lahar Tiang
(Ch. 21.90)
Figure 5.3 Bed Material Sampling Locations near Kg Pinang Tunggal
107
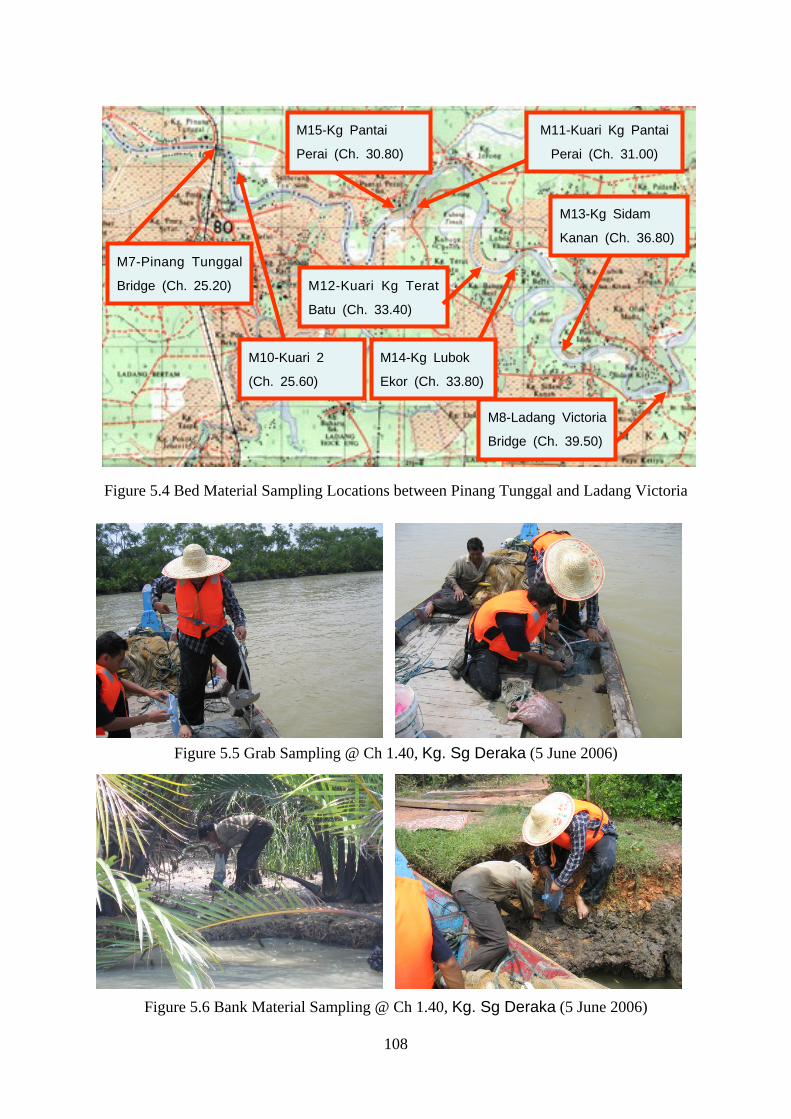
M7-Pinang Tunggal
Bridge (Ch. 25.20)
M15-Kg Pantai
Perai (Ch. 30.80)
M8-Ladang Victoria
Bridge (Ch. 39.50)
M10-Kuari 2
(Ch. 25.60)
M11-Kuari Kg Pantai
Perai (Ch. 31.00)
M12-Kuari Kg Terat
Batu (Ch. 33.40)
M13-Kg Sidam
Kanan (Ch. 36.80)
M14-Kg Lubok
Ekor (Ch. 33.80)
Figure 5.4 Bed Material Sampling Locations between Pinang Tunggal and Ladang Victoria
Figure 5.5 Grab Sampling @ Ch 1.40, Kg. Sg Deraka (5 June 2006)
Figure 5.6 Bank Material Sampling @ Ch 1.40, Kg. Sg Deraka (5 June 2006)
108
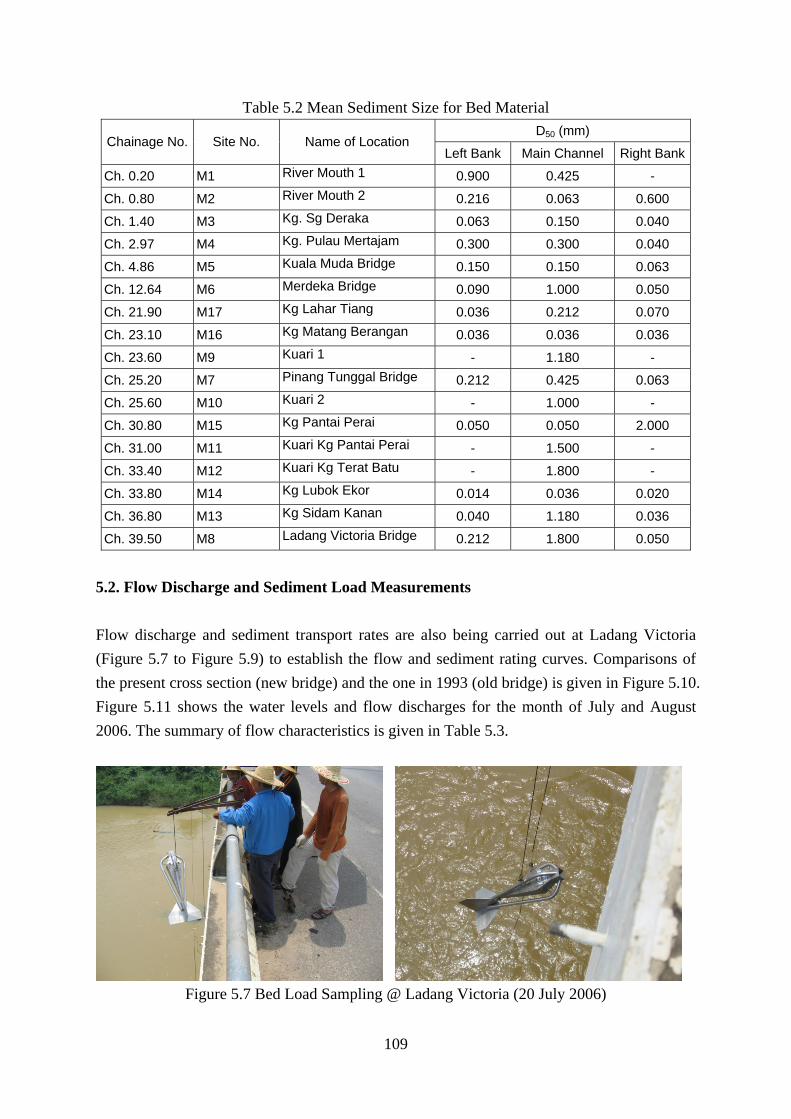
Table 5.2 Mean Sediment Size for Bed Material D50 (mm)
Chainage No. Site No. Name of Location Left Bank Main Channel Right Bank
Ch. 0.20 M1 River Mouth 1 0.900 0.425 -
Ch. 0.80 M2 River Mouth 2 0.216 0.063 0.600
Ch. 1.40 M3 Kg. Sg Deraka 0.063 0.150 0.040
Ch. 2.97 M4 Kg. Pulau Mertajam 0.300 0.300 0.040
Ch. 4.86 M5 Kuala Muda Bridge 0.150 0.150 0.063
Ch. 12.64 M6 Merdeka Bridge 0.090 1.000 0.050
Ch. 21.90 M17 Kg Lahar Tiang 0.036 0.212 0.070
Ch. 23.10 M16 Kg Matang Berangan 0.036 0.036 0.036
Ch. 23.60 M9 Kuari 1 - 1.180 -
Ch. 25.20 M7 Pinang Tunggal Bridge 0.212 0.425 0.063
Ch. 25.60 M10 Kuari 2 - 1.000 -
Ch. 30.80 M15 Kg Pantai Perai 0.050 0.050 2.000
Ch. 31.00 M11 Kuari Kg Pantai Perai - 1.500 -
Ch. 33.40 M12 Kuari Kg Terat Batu - 1.800 -
Ch. 33.80 M14 Kg Lubok Ekor 0.014 0.036 0.020
Ch. 36.80 M13 Kg Sidam Kanan 0.040 1.180 0.036
Ch. 39.50 M8 Ladang Victoria Bridge 0.212 1.800 0.050
5.2. Flow Discharge and Sediment Load Measurements Flow discharge and sediment transport rates are also being carried out at Ladang Victoria (Figure 5.7 to Figure 5.9) to establish the flow and sediment rating curves. Comparisons of the present cross section (new bridge) and the one in 1993 (old bridge) is given in Figure 5.10. Figure 5.11 shows the water levels and flow discharges for the month of July and August 2006. The summary of flow characteristics is given in Table 5.3.
Figure 5.7 Bed Load Sampling @ Ladang Victoria (20 July 2006)
109
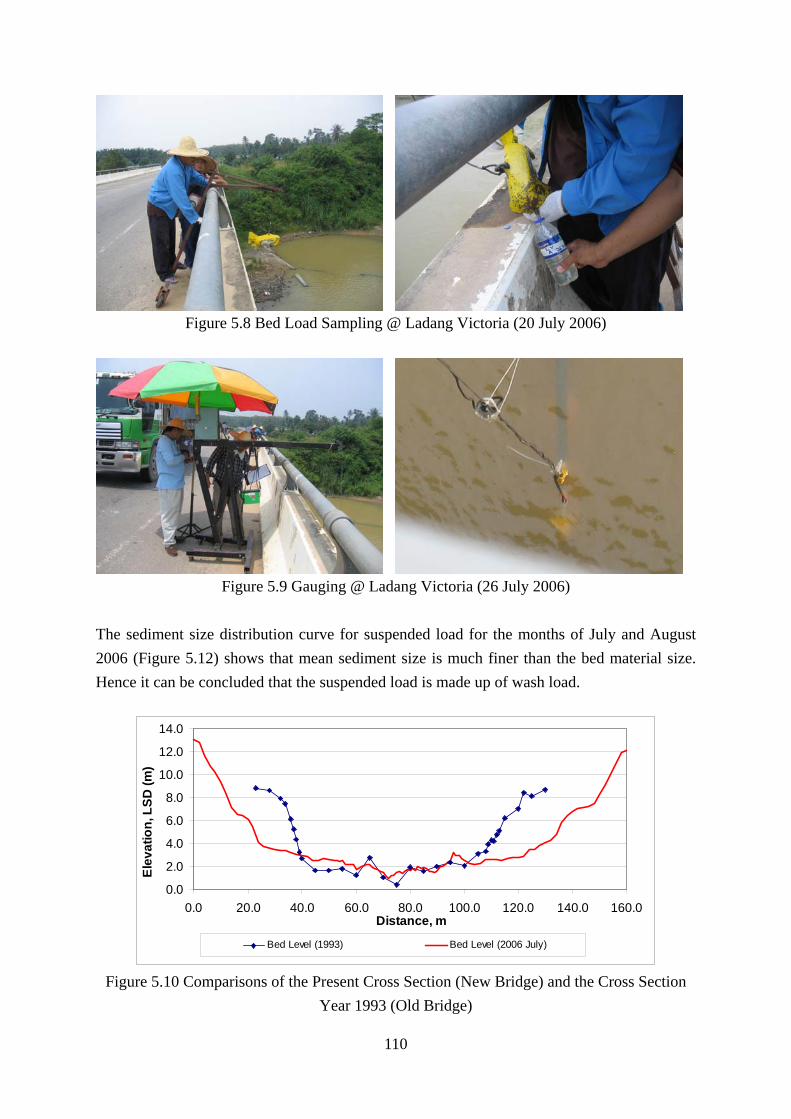
Figure 5.8 Bed Load Sampling @ Ladang Victoria (20 July 2006)
Figure 5.9 Gauging @ Ladang Victoria (26 July 2006) The sediment size distribution curve for suspended load for the months of July and August 2006 (Figure 5.12) shows that mean sediment size is much finer than the bed material size. Hence it can be concluded that the suspended load is made up of wash load.
0.0
2.0
4.0
6.0
8.0
10.0
12.0
14.0
0.0 20.0 40.0 60.0 80.0 100.0 120.0 140.0 160.0Distance, m
Elev
atio
n, L
SD (m
)
Bed Level (1993) Bed Level (2006 July)
Figure 5.10 Comparisons of the Present Cross Section (New Bridge) and the Cross Section
Year 1993 (Old Bridge)
110
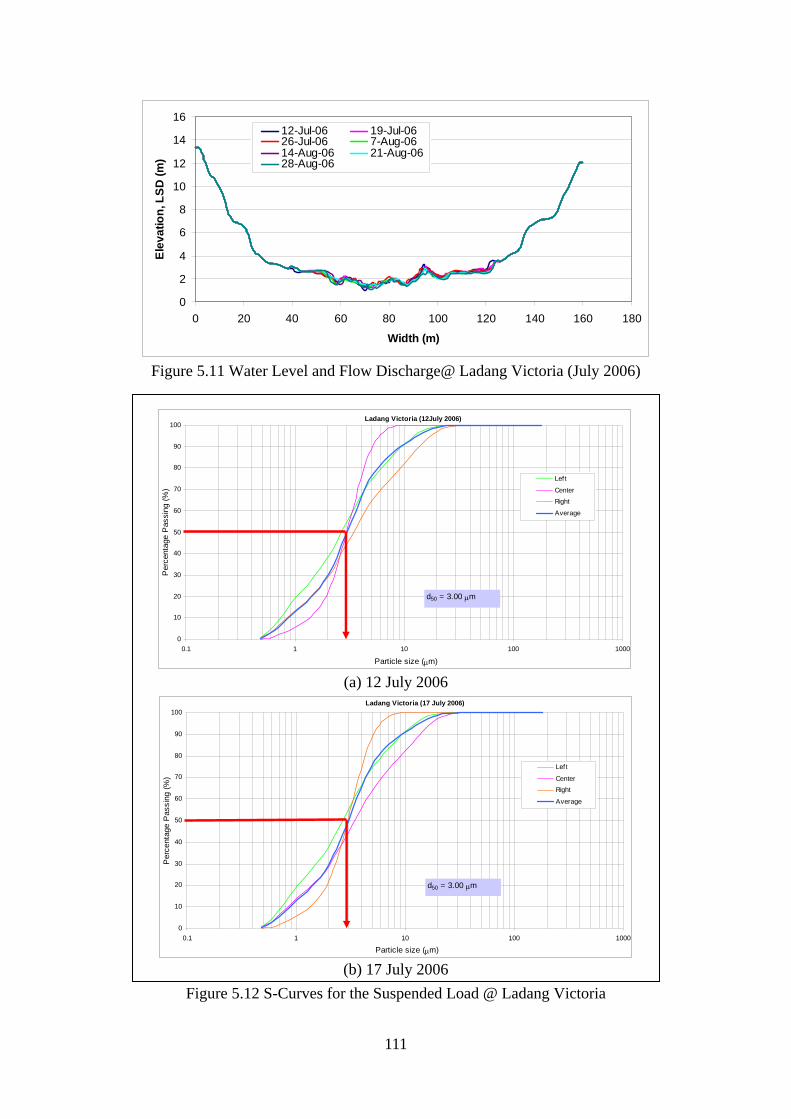
0
2
4
6
8
10
12
14
16
0 20 40 60 80 100 120 140 160 180
Width (m)
Elev
atio
n, L
SD (m
)
Ladang Victoria (12July 2006)
0
10
20
30
40
50
60
70
80
90
100
0.1 1 10 100 1000
Particle size (μm)
Per
cent
age
Pas
sing
(%)
Left
CenterRight
Average
d50 = 3.00 μm
Ladang Victoria (17 July 2006)
0
10
20
30
40
50
60
70
80
90
100
0.1 1 10 100 1000
Particle size (μm)
Per
cent
age
Pas
sing
(%)
Left
CenterRight
Average
d50 = 3.00 μm
12-Jul-06 19-Jul-0626-Jul-06 7-Aug-0614-Aug-06 21-Aug-0628-Aug-06
Figure 5.11 Water Level and Flow Discharge@ Ladang Victoria (July 2006)
(a) 12 July 2006
(b) 17 July 2006 Figure 5.12 S-Curves for the Suspended Load @ Ladang Victoria
111
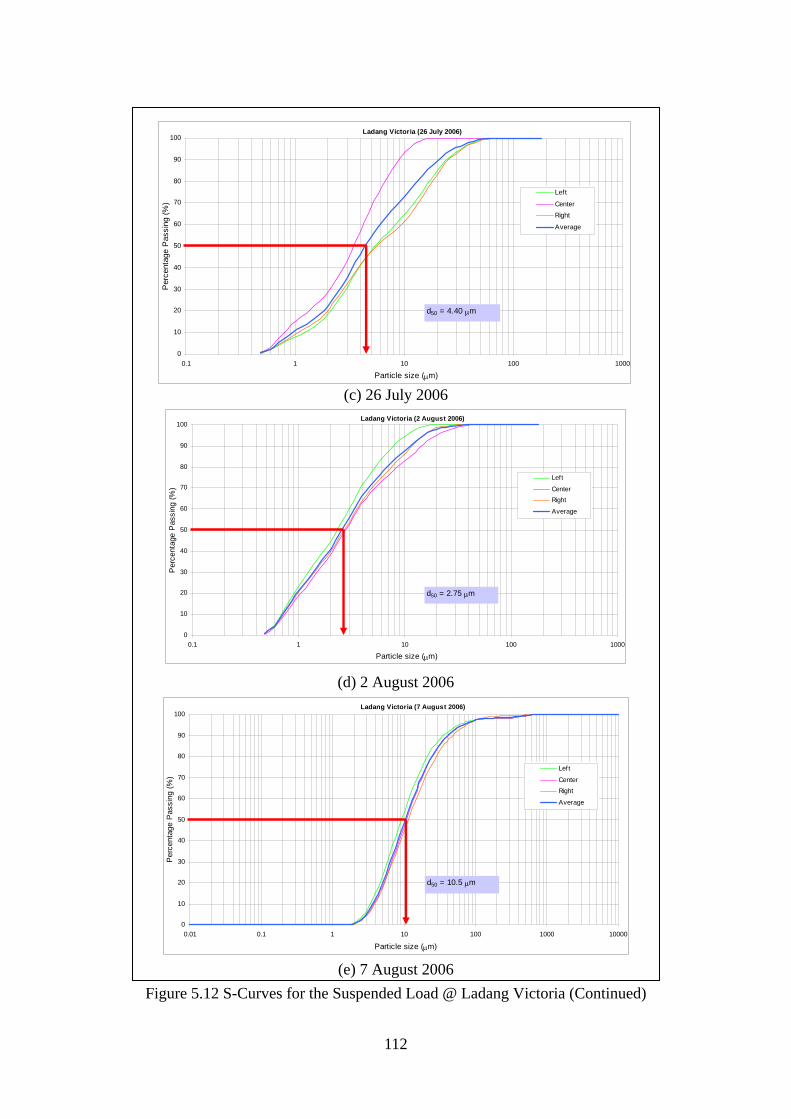
112
Ladang Victoria (26 July 2006)
0
10
20
30
40
50
60
70
80
90
100
0.1 1 10 100 1000
Particle size (μm)
Per
cent
age
Pas
sing
(%)
Left
CenterRight
Average
d50 = 4.40 μm
Ladang Victoria (2 August 2006)
0
10
20
30
40
50
60
70
80
90
100
0.1 1 10 100 1000
Particle size (μm)
Per
cent
age
Pas
sing
(%)
Left
CenterRight
Average
d50 = 2.75 μm
Ladang Victoria (7 August 2006)
0
10
20
30
40
50
60
70
80
90
100
0.01 0.1 1 10 100 1000 10000
Particle size (μm)
Per
cent
age
Pas
sing
(%)
Left
CenterRight
Average
d50 = 10.5 μm
(c) 26 July 2006
(d) 2 August 2006
(e) 7 August 2006 Figure 5.12 S-Curves for the Suspended Load @ Ladang Victoria (Continued)
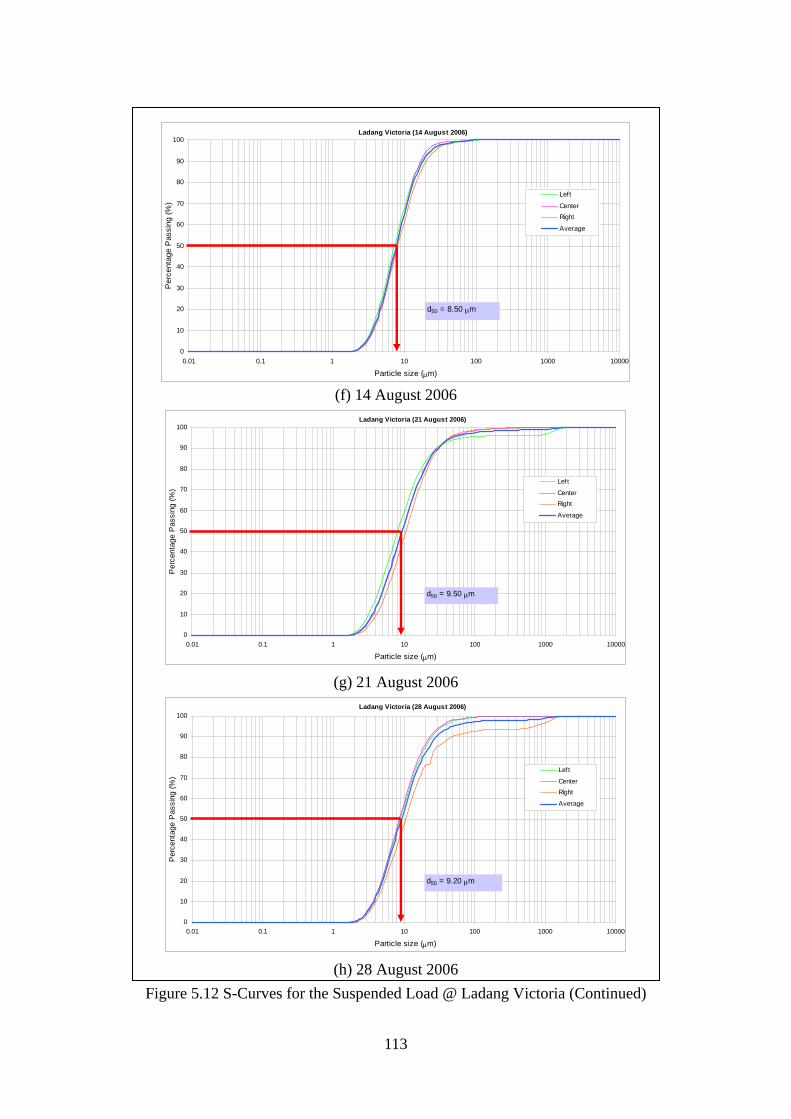
113
Ladang Victoria (14 August 2006)
0
10
20
30
40
50
60
70
80
90
100
0.01 0.1 1 10 100 1000 10000
Particle size (μm)
Per
cent
age
Pas
sing
(%)
Left
CenterRight
Average
d50 = 8.50 μm
Ladang Victoria (21 August 2006)
0
10
20
30
40
50
60
70
80
90
100
0.01 0.1 1 10 100 1000 10000
Particle size (μm)
Per
cent
age
Pas
sing
(%)
Lef t
CenterRight
Average
d50 = 9.50 μm
Ladang Victoria (28 August 2006)
0
10
20
30
40
50
60
70
80
90
100
0.01 0.1 1 10 100 1000 10000
Particle size (μm)
Per
cent
age
Pas
sing
(%)
Left
CenterRight
Average
d50 = 9.20 μm
(f) 14 August 2006
(g) 21 August 2006
(h) 28 August 2006 Figure 5.12 S-Curves for the Suspended Load @ Ladang Victoria (Continued)
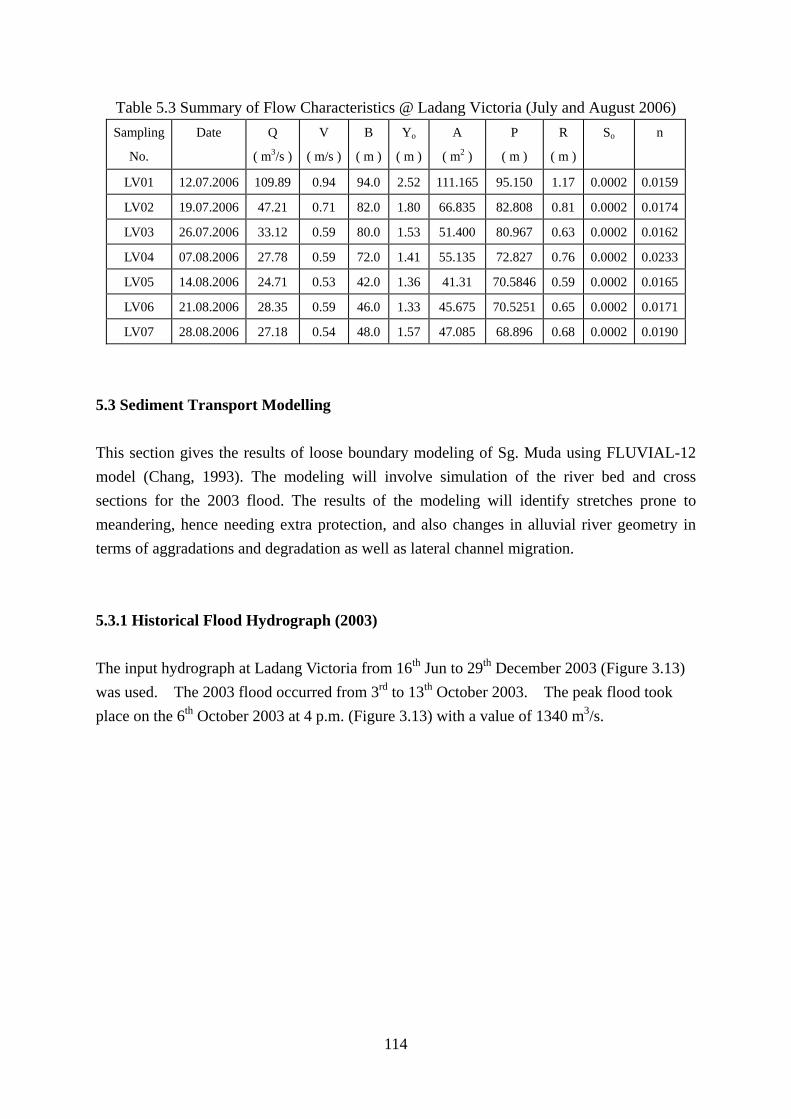
Table 5.3 Summary of Flow Characteristics @ Ladang Victoria (July and August 2006) Sampling
No.
Date Q
( m3/s )
V
( m/s )
B
( m )
Yo
( m )
A
( m2 )
P
( m )
R
( m )
So n
LV01 12.07.2006 109.89 0.94 94.0 2.52 111.165 95.150 1.17 0.0002 0.0159
LV02 19.07.2006 47.21 0.71 82.0 1.80 66.835 82.808 0.81 0.0002 0.0174
LV03 26.07.2006 33.12 0.59 80.0 1.53 51.400 80.967 0.63 0.0002 0.0162
LV04 07.08.2006 27.78 0.59 72.0 1.41 55.135 72.827 0.76 0.0002 0.0233
LV05 14.08.2006 24.71 0.53 42.0 1.36 41.31 70.5846 0.59 0.0002 0.0165
LV06 21.08.2006 28.35 0.59 46.0 1.33 45.675 70.5251 0.65 0.0002 0.0171
LV07 28.08.2006 27.18 0.54 48.0 1.57 47.085 68.896 0.68 0.0002 0.0190
5.3 Sediment Transport Modelling This section gives the results of loose boundary modeling of Sg. Muda using FLUVIAL-12 model (Chang, 1993). The modeling will involve simulation of the river bed and cross sections for the 2003 flood. The results of the modeling will identify stretches prone to meandering, hence needing extra protection, and also changes in alluvial river geometry in terms of aggradations and degradation as well as lateral channel migration. 5.3.1 Historical Flood Hydrograph (2003) The input hydrograph at Ladang Victoria from 16th Jun to 29th December 2003 (Figure 3.13) was used. The 2003 flood occurred from 3rd to 13th October 2003. The peak flood took place on the 6th October 2003 at 4 p.m. (Figure 3.13) with a value of 1340 m3/s.
114
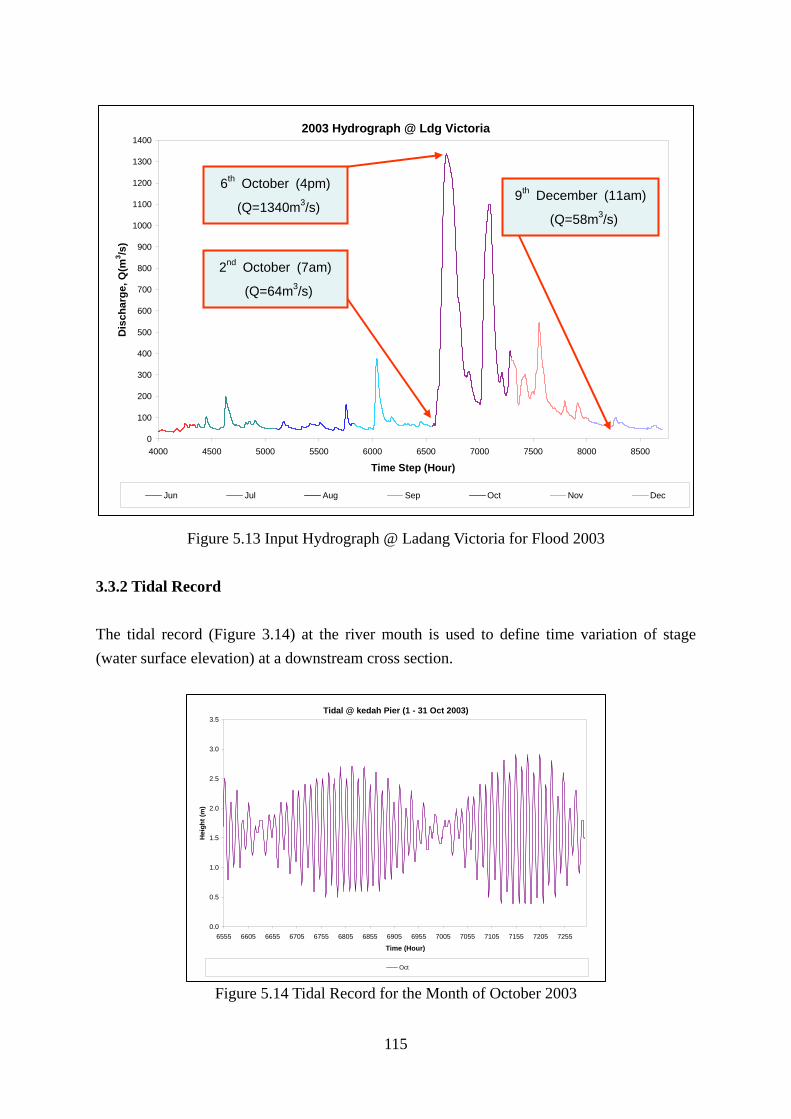
2003 Hydrograph @ Ldg Victoria1400
0
100
200
300
400
500
600
700
800
900
1000
1100
1200
1300
4000 4500 5000 5500 6000 6500 7000 7500 8000 8500
Time tep (Hour)
Dis
char
ge, Q
(m3 /s
)
S
Jun Jul Aug Sep Oct Nov Dec
6th October (4pm)
(Q=1340m3/s) 9th December (11am)
(Q=58m3/s)
2nd October (7am) (Q=64m3/s)
Figure 5.13 Input Hydrograph @ Ladang Victoria for Flood 2003 3.3.2 Tidal Record The tidal record (Figure 3.14) at the river mouth is used to define time variation of stage (water surface elevation) at a downstream cross section.
Tidal @ kedah Pier (1 - 31 Oct 2003)
0.0
0.5
1.0
1.5
2.0
2.5
3.0
3.5
6555 6605 6655 6705 6755 6805 6855 6905 6955 7005 7055 7105 7155 7205 7255
Time (Hour)
Hei
ght (
m)
Oct
Figure 5.14 Tidal Record for the Month of October 2003
115
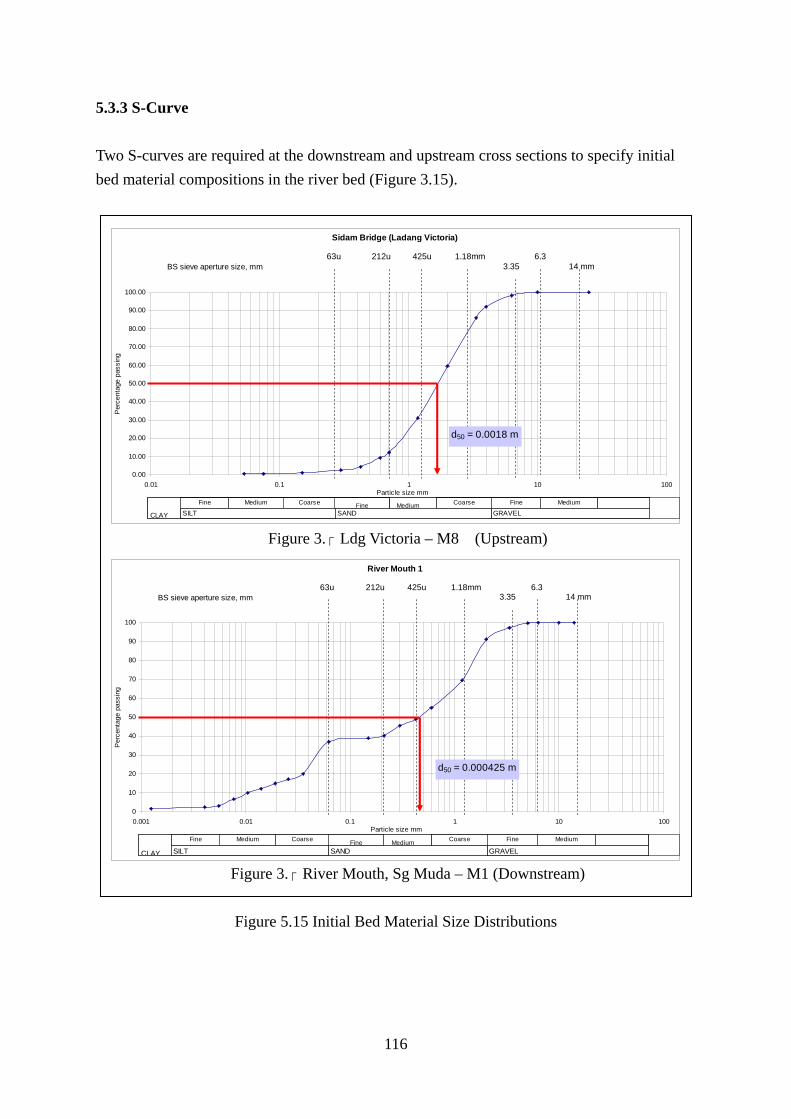
5.3.3 S-Curve Two S-curves are required at the downstream and upstream cross sections to specify initial bed material compositions in the river bed (Figure 3.15).
Sidam Bridge (Ladang Victoria)
0.00
10.00
20.00
30.00
40.00
50.00
60.00
70.00
80.00
90.00
100.00
0.01 0.1 1 10 100Particle size mm
Per
cent
age
pass
ing
Medium Fine CoarseMedium MediumFine Coarse Fine Coarse Fine
CLAY SILT GRAVELSAND
63u 212u 425u 1.18mm3.35
6.314 mmBS sieve aperture size, mm
d50 = 0.0018 m
River Mouth 1
0
10
20
30
40
50
60
70
80
90
100
0.001 0.01 0.1 1 10 100Particle size mm
Per
cent
age
pass
ing
Medium Fine CoarseiumMed MediumFine Coarse Fine Coarse Fine
CLAY SILT GRAVELSAND
63u 212u 425u 1.18mm3.35
6.314 mmBS sieve aperture size, mm
d50 = 0.000425 m
�Figure 3. Ldg Victoria – M8 (Upstream)
�Figure 3. River Mouth, Sg Muda – M1 (Downstream)
Figure 5.15 Initial Bed Material Size Distributions
116
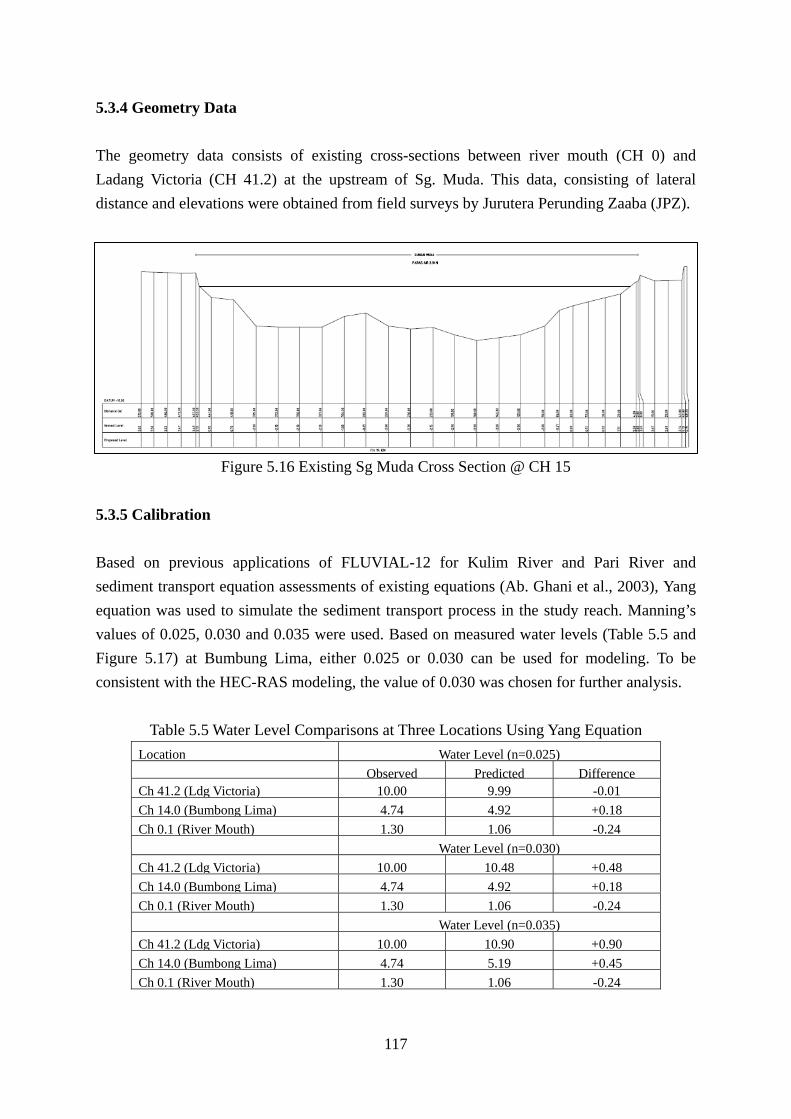
5.3.4 Geometry Data The geometry data consists of existing cross-sections between river mouth (CH 0) and Ladang Victoria (CH 41.2) at the upstream of Sg. Muda. This data, consisting of lateral distance and elevations were obtained from field surveys by Jurutera Perunding Zaaba (JPZ).
Figure 5.16 Existing Sg Muda Cross Section @ CH 15
5.3.5 Calibration Based on previous applications of FLUVIAL-12 for Kulim River and Pari River and sediment transport equation assessments of existing equations (Ab. Ghani et al., 2003), Yang equation was used to simulate the sediment transport process in the study reach. Manning’s values of 0.025, 0.030 and 0.035 were used. Based on measured water levels (Table 5.5 and Figure 5.17) at Bumbung Lima, either 0.025 or 0.030 can be used for modeling. To be consistent with the HEC-RAS modeling, the value of 0.030 was chosen for further analysis.
Table 5.5 Water Level Comparisons at Three Locations Using Yang Equation Location Water Level (n=0.025) Observed Predicted Difference Ch 41.2 (Ldg Victoria) 10.00 9.99 -0.01 Ch 14.0 (Bumbong Lima) 4.74 4.92 +0.18 Ch 0.1 (River Mouth) 1.30 1.06 -0.24 Water Level (n=0.030) Ch 41.2 (Ldg Victoria) 10.00 10.48 +0.48 Ch 14.0 (Bumbong Lima) 4.74 4.92 +0.18 Ch 0.1 (River Mouth) 1.30 1.06 -0.24 Water Level (n=0.035) Ch 41.2 (Ldg Victoria) 10.00 10.90 +0.90 Ch 14.0 (Bumbong Lima) 4.74 5.19 +0.45 Ch 0.1 (River Mouth) 1.30 1.06 -0.24
117
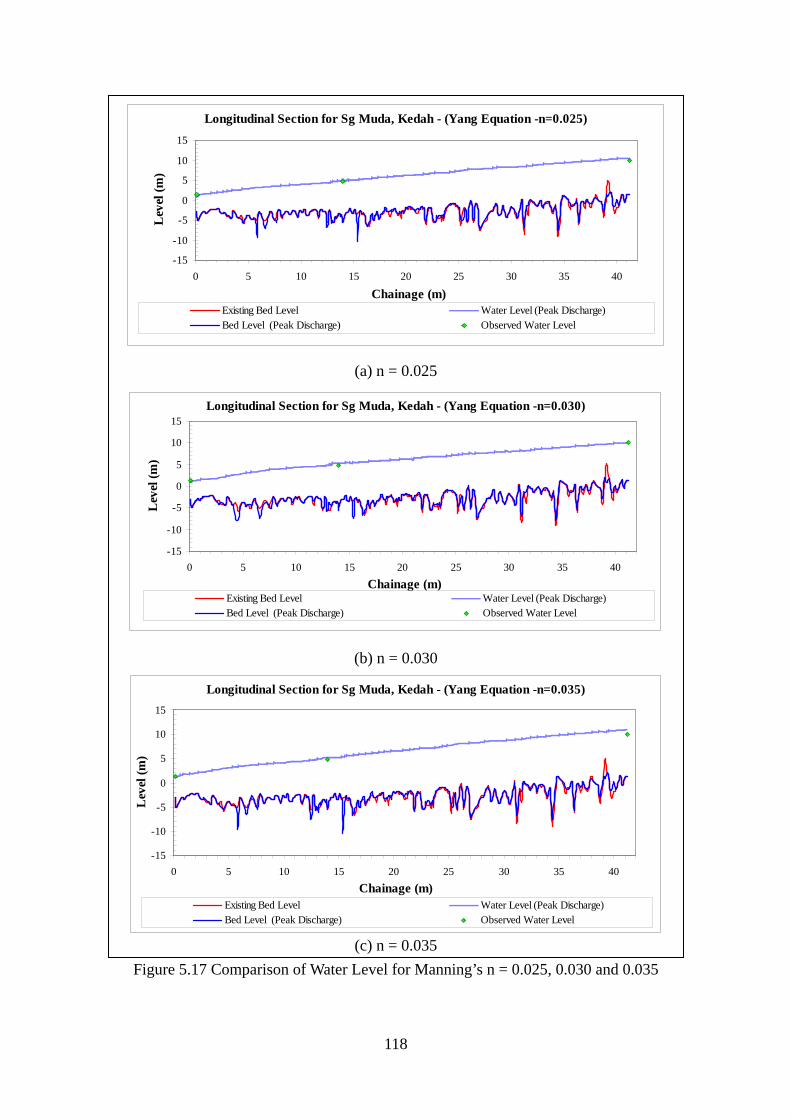
Longitudinal Section for Sg Muda, Kedah - (Yang Equation -n=0.025)
-15
-10
-5
0
5
10
15
0 5 10 15 20 25 30 35 40
Chainage (m)
Lev
el (m
)
Existing Bed Level Water Level (Peak Discharge)Bed Level (Peak Discharge) Observed Water Level
Longitudinal Section for Sg Muda, Kedah - (Yang Equation -n=0.035)
-15
-10
-5
0
5
10
15
0 5 10 15 20 25 30 35 40Chainage (m)
Lev
el (m
)
Existing Bed Level Water Level (Peak Discharge)Bed Level (Peak Discharge) Observed Water Level
Longitudinal Section for Sg Muda, Kedah - (Yang Equation -n=0.030)
-15
-10
-5
0
5
10
15
0 5 10 15 25 30 35 40Chainage (m)
Lev
el (m
)
20
Existing Bed Level Water Level (Peak Discharge)Bed Level (Peak Discharge) Observed Water Level
(a) n = 0.025
(b) n = 0.030
(c) n = 0.035 Figure 5.17 Comparison of Water Level for Manning’s n = 0.025, 0.030 and 0.035
118
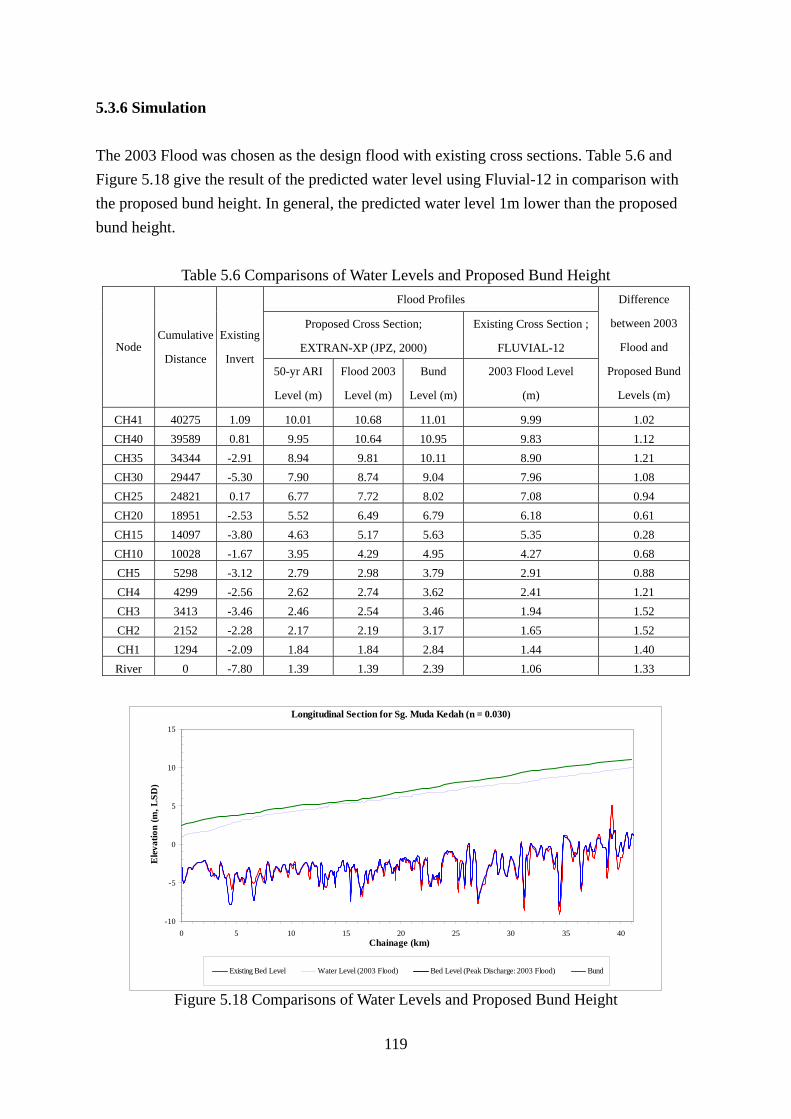
5.3.6 Simulation The 2003 Flood was chosen as the design flood with existing cross sections. Table 5.6 and Figure 5.18 give the result of the predicted water level using Fluvial-12 in comparison with the proposed bund height. In general, the predicted water level 1m lower than the proposed bund height.
Table 5.6 Comparisons of Water Levels and Proposed Bund Height Flood Profiles
Proposed Cross Section;
EXTRAN-XP (JPZ, 2000)
Existing Cross Section ;
FLUVIAL-12 Node Cumulative
Distance
Existing
Invert 50-yr ARI
Level (m)
Flood 2003
Level (m)
Bund
Level (m)
2003 Flood Level
(m)
Difference
between 2003
Flood and
Proposed Bund
Levels (m)
CH41 40275 1.09 10.01 10.68 11.01 9.99 1.02CH40 39589 0.81 9.95 10.64 10.95 9.83 1.12CH35 34344 -2.91 8.94 9.81 10.11 8.90 1.21CH30 29447 -5.30 7.90 8.74 9.04 7.96 1.08CH25 24821 0.17 6.77 7.72 8.02 7.08 0.94CH20 18951 -2.53 5.52 6.49 6.79 6.18 0.61CH15 14097 -3.80 4.63 5.17 5.63 5.35 0.28CH10 10028 -1.67 3.95 4.29 4.95 4.27 0.68CH5 5298 -3.12 2.79 2.98 3.79 2.91 0.88CH4 4299 -2.56 2.62 2.74 3.62 2.41 1.21CH3 3413 -3.46 2.46 2.54 3.46 1.94 1.52CH2 2152 -2.28 2.17 2.19 3.17 1.65 1.52CH1 1294 -2.09 1.84 1.84 2.84 1.44 1.40River 0 -7.80 1.39 1.39 2.39 1.06 1.33
-10
-5
0
5
10
15
0 5 10 15 20 25 30 35 40Chainage (km)
Ele
vatio
n (m
, LSD
)
Existing Bed Level Water Level (2003 Flood) Bed Level (Peak Discharge: 2003 Flood) Bund
Longitudinal Section for Sg. Muda Kedah (n = 0.030)
Figure 5.18 Comparisons of Water Levels and Proposed Bund Height
119
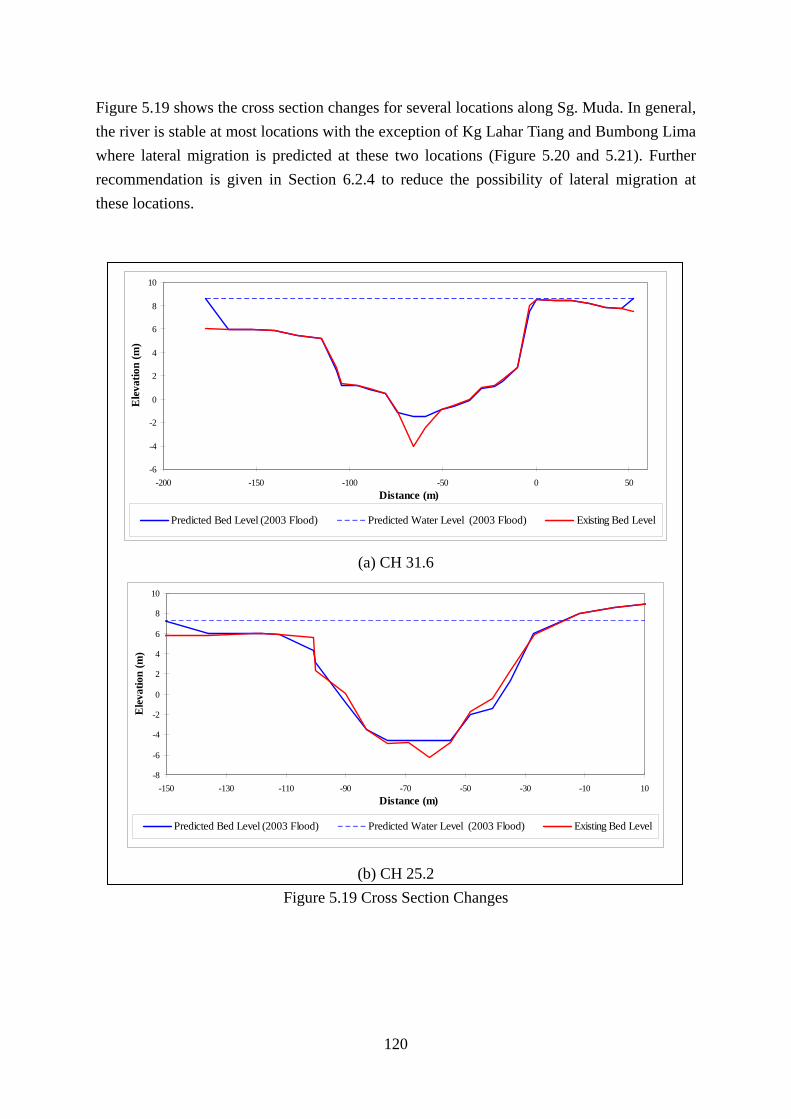
Figure 5.19 shows the cross section changes for several locations along Sg. Muda. In general, the river is stable at most locations with the exception of Kg Lahar Tiang and Bumbong Lima where lateral migration is predicted at these two locations (Figure 5.20 and 5.21). Further recommendation is given in Section 6.2.4 to reduce the possibility of lateral migration at these locations.
-6
-4
-2
0
2
4
6
8
10
-200 -150 -100 -50 0 50Distance (m)
Ele
vatio
n (m
)
Predicted Bed Level (2003 Flood) Predicted Water Level (2003 Flood) Existing Bed Level
-8
-6
-4
-2
0
2
4
6
8
10
-150 -130 -110 -90 -70 -50 -30 -10 10Distance (m)
Ele
vatio
n (m
)
Predicted Bed Level (2003 Flood) Predicted Water Level (2003 Flood) Existing Bed Level
(a) CH 31.6
(b) CH 25.2 Figure 5.19 Cross Section Changes
120
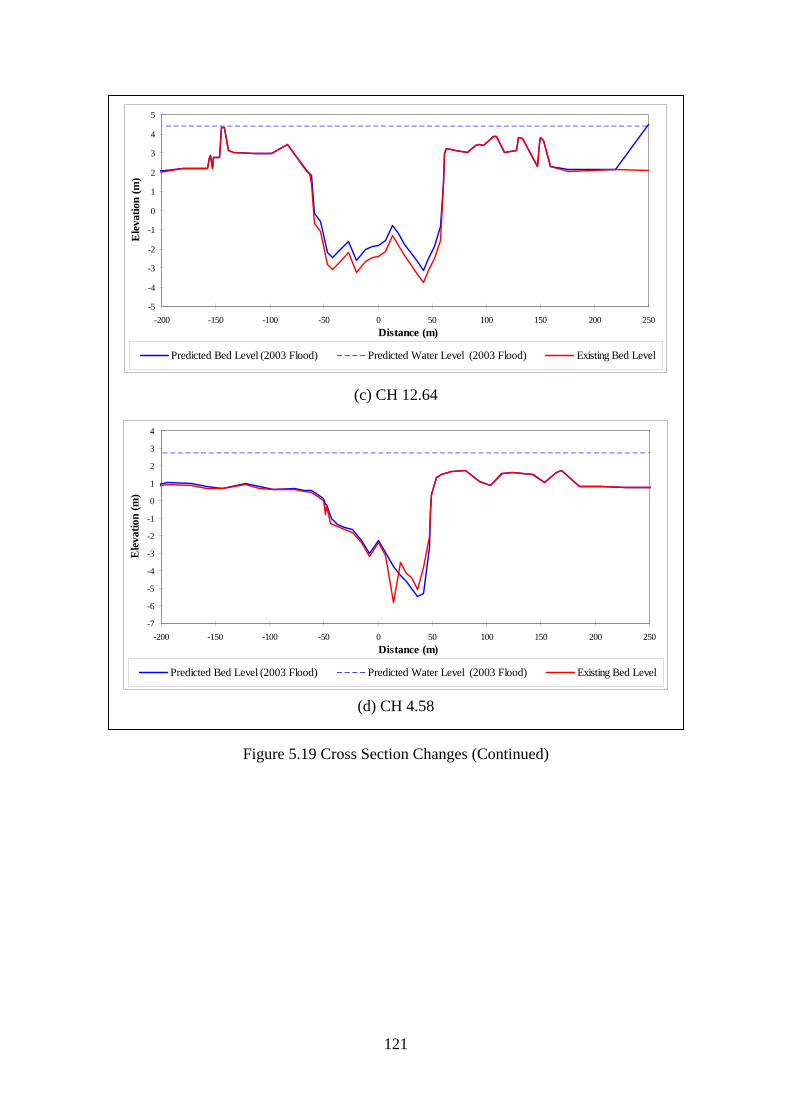
-5
-4
-3
-2
-1
0
1
2
3
4
5
-200 -150 -100 -50 0 50 100 150 200 250Distance (m)
Ele
vatio
n (m
)
Predicted Bed Level (2003 Flood) Predicted Water Level (2003 Flood) Existing Bed Level
-7
-6
-5
-4
-3
-2
-1
0
1
2
3
4
-200 -150 -100 -50 0 50 100 150 200 250Distance (m)
Ele
vatio
n (m
)
Predicted Bed Level (2003 Flood) Predicted Water Level (2003 Flood) Existing Bed Level
(c) CH 12.64
(d) CH 4.58
Figure 5.19 Cross Section Changes (Continued)
121
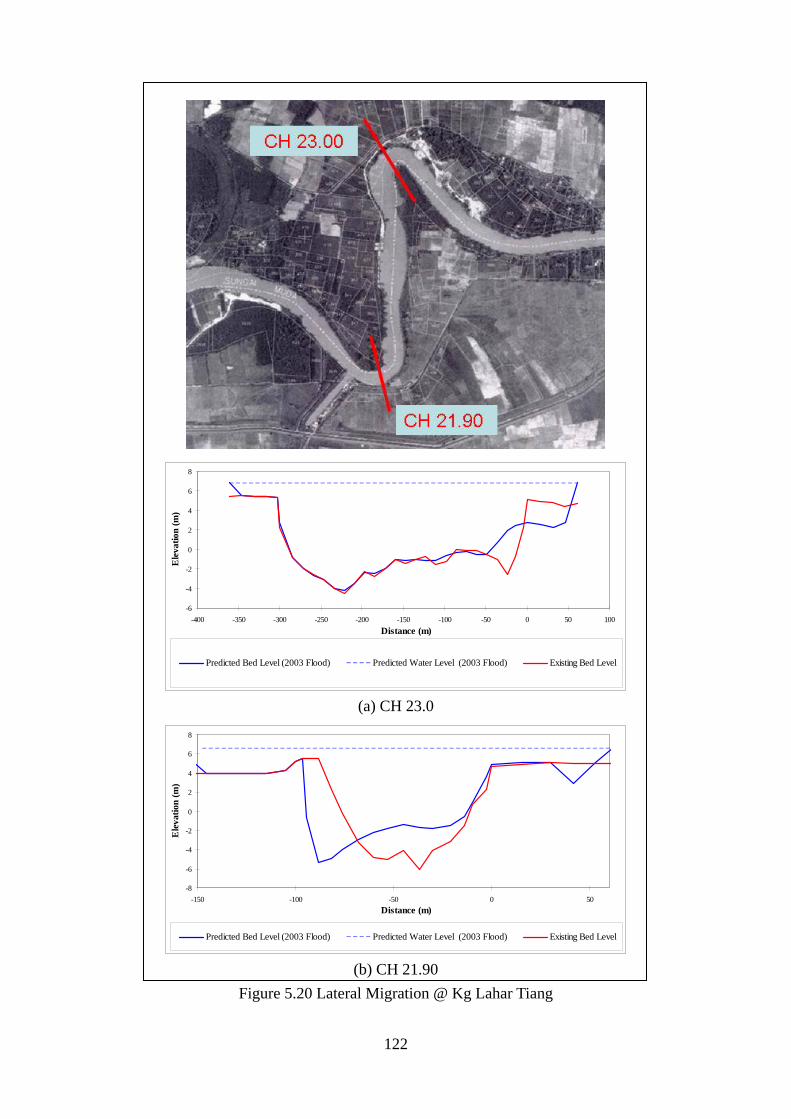
-6
-4
-2
0
2
4
6
8
-400 -350 -300 -250 -200 -150 -100 -50 0 50 100Distance (m)
Ele
vatio
n (m
)
Predicted Bed Level (2003 Flood) Predicted Water Level (2003 Flood) Existing Bed Level
-8
-6
-4
-2
0
2
4
6
8
-150 -100 -50 0 50Distance (m)
Ele
vatio
n (m
)
Predicted Bed Level (2003 Flood) Predicted Water Level (2003 Flood) Existing Bed Level
(a) CH 23.0
(b) CH 21.90 Figure 5.20 Lateral Migration @ Kg Lahar Tiang
122
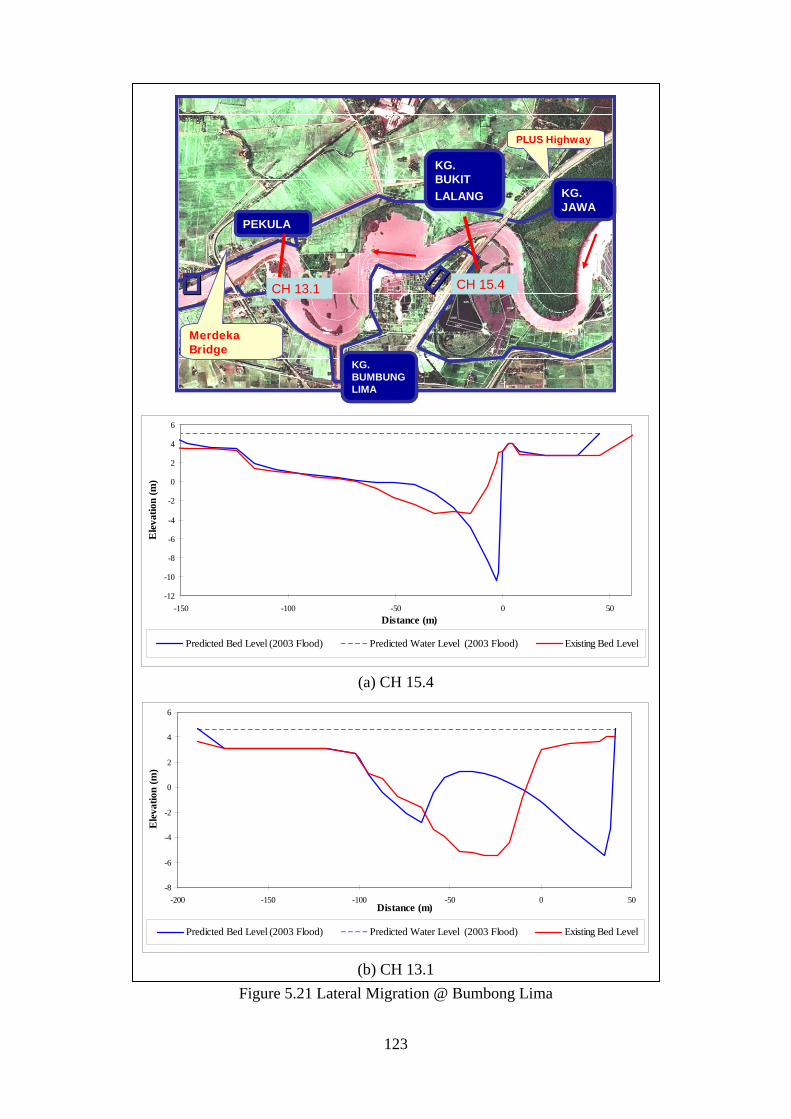
KG. BUMBUNG LIMA
PEKULA
KG. JAWA
KG. BUKITLALANG
MerdekaBridge
PLUS Highway
CH 13.1 CH 15.4
KG. BUMBUNG LIMA
PEKULA
KG. JAWA
KG. BUKITLALANG
MerdekaBridge
PLUS Highway
KG. BUMBUNG LIMA
PEKULA
KG. JAWA
KG. BUKITLALANG
MerdekaBridge
PLUS Highway
CH 13.1 CH 15.4
-12
-10
-8
-6
-4
-2
0
2
4
6
-150 -100 -50 0 50Distance (m)
Ele
vatio
n (m
)
Predicted Bed Level (2003 Flood) Predicted Water Level (2003 Flood) Existing Bed Level
-8
-6
-4
-2
0
2
4
6
-200 -150 -100 -50 0 50Distance (m)
Ele
vatio
n (m
)
Predicted Bed Level (2003 Flood) Predicted Water Level (2003 Flood) Existing Bed Level
(a) CH 15.4
(b) CH 13.1 Figure 5.21 Lateral Migration @ Bumbong Lima
123
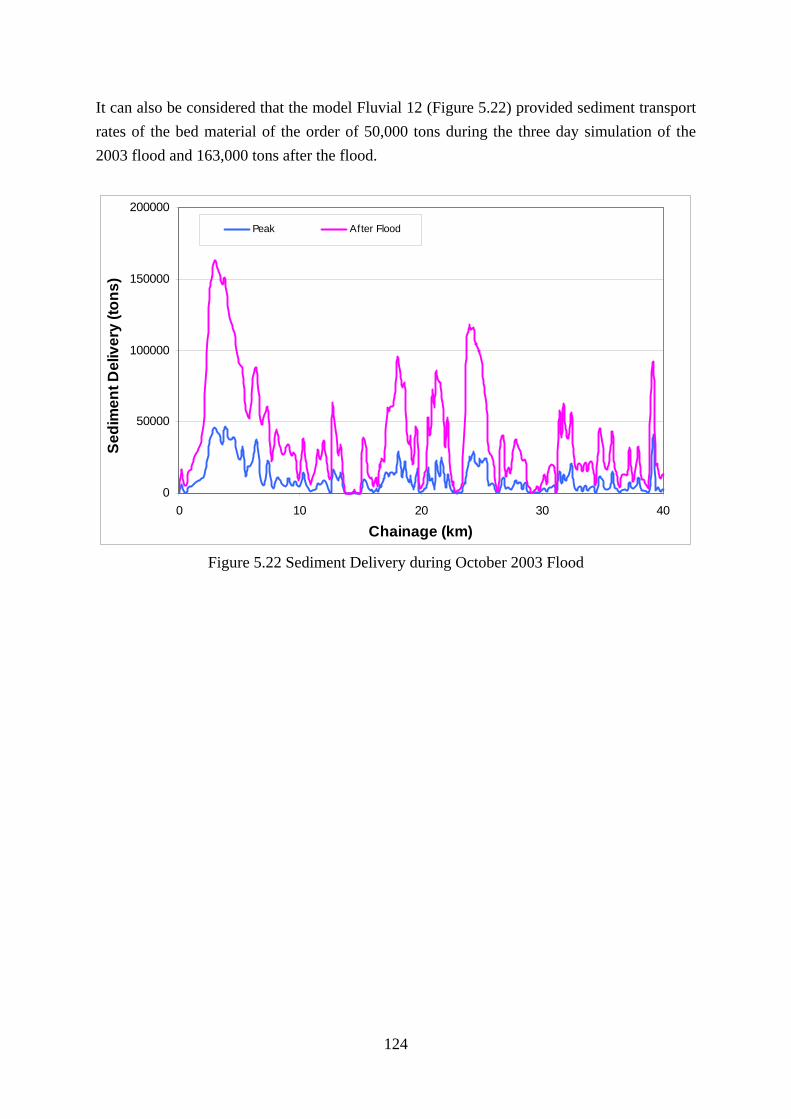
It can also be considered that the model Fluvial 12 (Figure 5.22) provided sediment transport rates of the bed material of the order of 50,000 tons during the three day simulation of the 2003 flood and 163,000 tons after the flood.
0
50000
100000
150000
200000
0 10 20 30
Chainage (km)
Sedi
men
t Del
iver
y (to
ns)
40
Peak After Flood
Figure 5.22 Sediment Delivery during October 2003 Flood
124
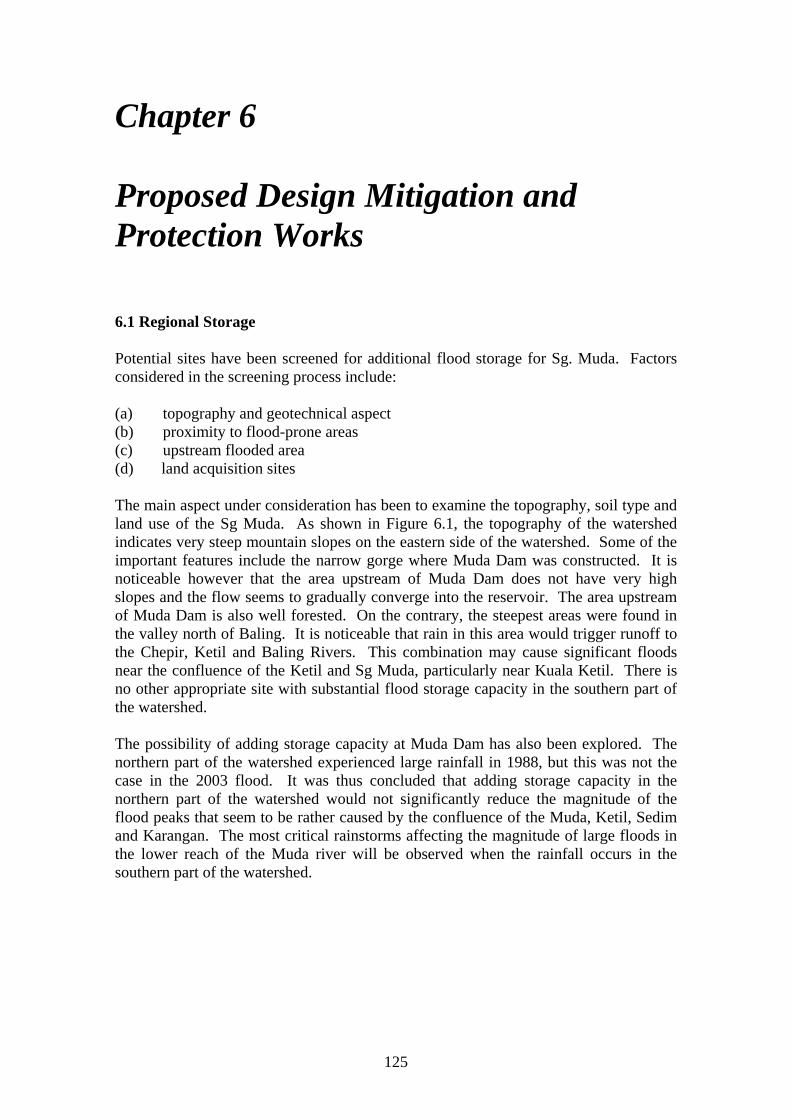
Chapter 6 Proposed Design Mitigation and Protection Works 6.1 Regional Storage Potential sites have been screened for additional flood storage for Sg. Muda. Factors considered in the screening process include: (a) topography and geotechnical aspect (b) proximity to flood-prone areas (c) upstream flooded area (d) land acquisition sites The main aspect under consideration has been to examine the topography, soil type and land use of the Sg Muda. As shown in Figure 6.1, the topography of the watershed indicates very steep mountain slopes on the eastern side of the watershed. Some of the important features include the narrow gorge where Muda Dam was constructed. It is noticeable however that the area upstream of Muda Dam does not have very high slopes and the flow seems to gradually converge into the reservoir. The area upstream of Muda Dam is also well forested. On the contrary, the steepest areas were found in the valley north of Baling. It is noticeable that rain in this area would trigger runoff to the Chepir, Ketil and Baling Rivers. This combination may cause significant floods near the confluence of the Ketil and Sg Muda, particularly near Kuala Ketil. There is no other appropriate site with substantial flood storage capacity in the southern part of the watershed. The possibility of adding storage capacity at Muda Dam has also been explored. The northern part of the watershed experienced large rainfall in 1988, but this was not the case in the 2003 flood. It was thus concluded that adding storage capacity in the northern part of the watershed would not significantly reduce the magnitude of the flood peaks that seem to be rather caused by the confluence of the Muda, Ketil, Sedim and Karangan. The most critical rainstorms affecting the magnitude of large floods in the lower reach of the Muda river will be observed when the rainfall occurs in the southern part of the watershed.
125
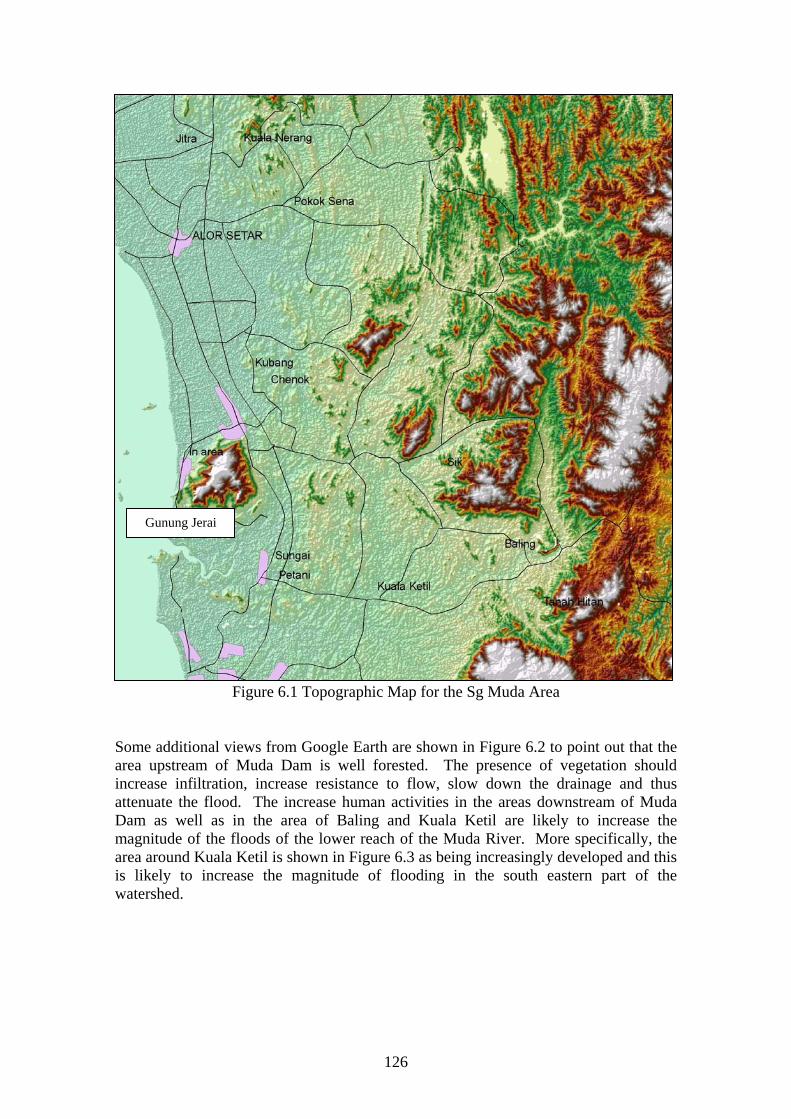
Gunung Jerai
Figure 6.1 Topographic Map for the Sg Muda Area Some additional views from Google Earth are shown in Figure 6.2 to point out that the area upstream of Muda Dam is well forested. The presence of vegetation should increase infiltration, increase resistance to flow, slow down the drainage and thus attenuate the flood. The increase human activities in the areas downstream of Muda Dam as well as in the area of Baling and Kuala Ketil are likely to increase the magnitude of the floods of the lower reach of the Muda River. More specifically, the area around Kuala Ketil is shown in Figure 6.3 as being increasingly developed and this is likely to increase the magnitude of flooding in the south eastern part of the watershed.
126
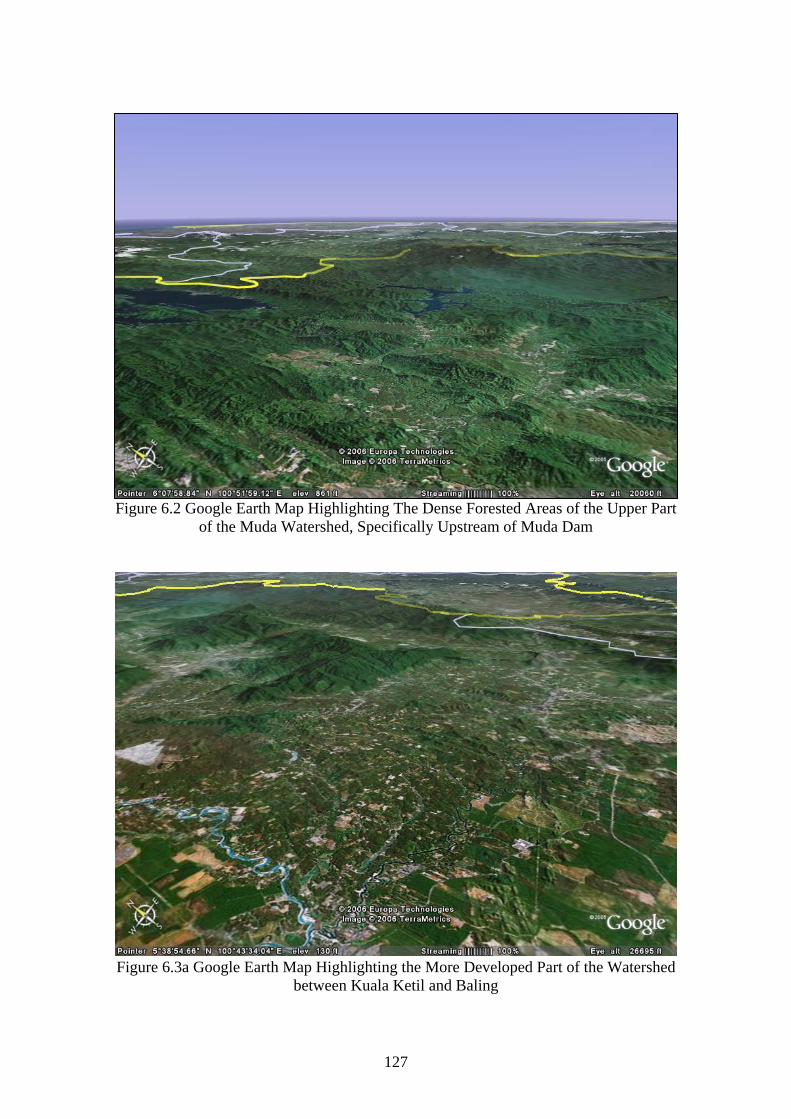
Figure 6.2 Google Earth Map Highlighting The Dense Forested Areas of the Upper Part of the Muda Watershed, Specifically Upstream of Muda Dam
Figure 6.3a Google Earth Map Highlighting the More Developed Part of the Watershed between Kuala Ketil and Baling
127
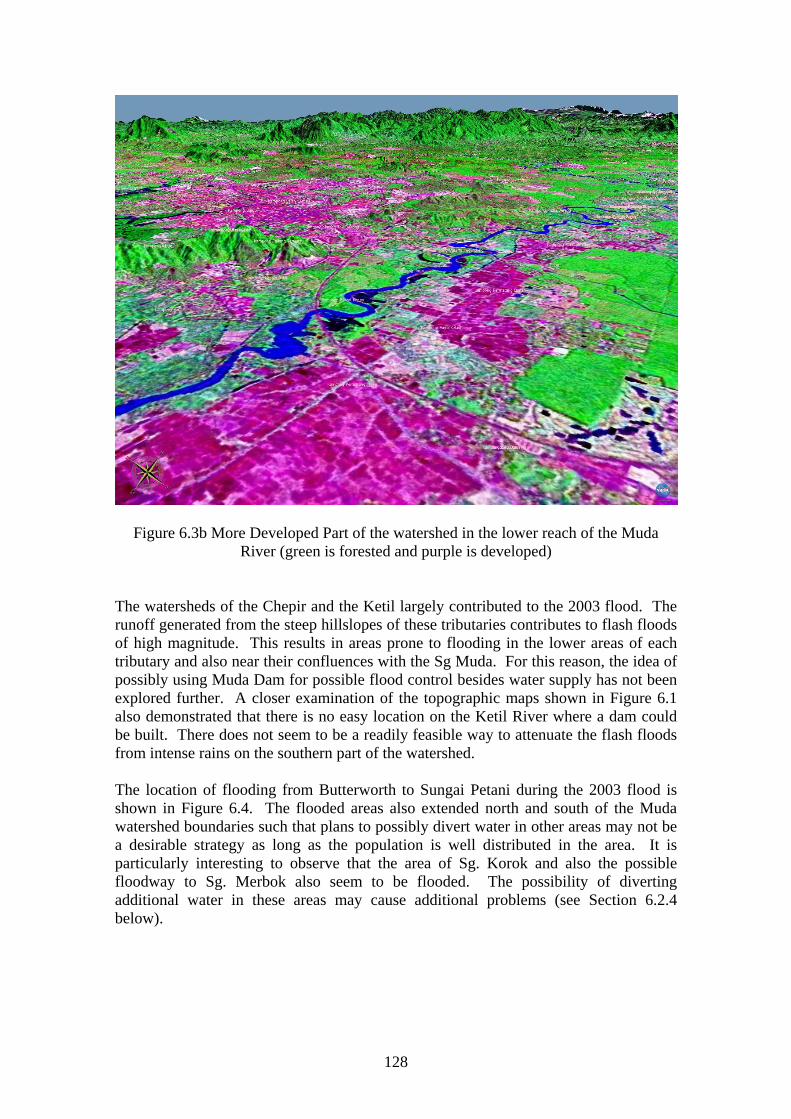
Figure 6.3b More Developed Part of the watershed in the lower reach of the Muda River (green is forested and purple is developed)
The watersheds of the Chepir and the Ketil largely contributed to the 2003 flood. The runoff generated from the steep hillslopes of these tributaries contributes to flash floods of high magnitude. This results in areas prone to flooding in the lower areas of each tributary and also near their confluences with the Sg Muda. For this reason, the idea of possibly using Muda Dam for possible flood control besides water supply has not been explored further. A closer examination of the topographic maps shown in Figure 6.1 also demonstrated that there is no easy location on the Ketil River where a dam could be built. There does not seem to be a readily feasible way to attenuate the flash floods from intense rains on the southern part of the watershed. The location of flooding from Butterworth to Sungai Petani during the 2003 flood is shown in Figure 6.4. The flooded areas also extended north and south of the Muda watershed boundaries such that plans to possibly divert water in other areas may not be a desirable strategy as long as the population is well distributed in the area. It is particularly interesting to observe that the area of Sg. Korok and also the possible floodway to Sg. Merbok also seem to be flooded. The possibility of diverting additional water in these areas may cause additional problems (see Section 6.2.4 below).
128
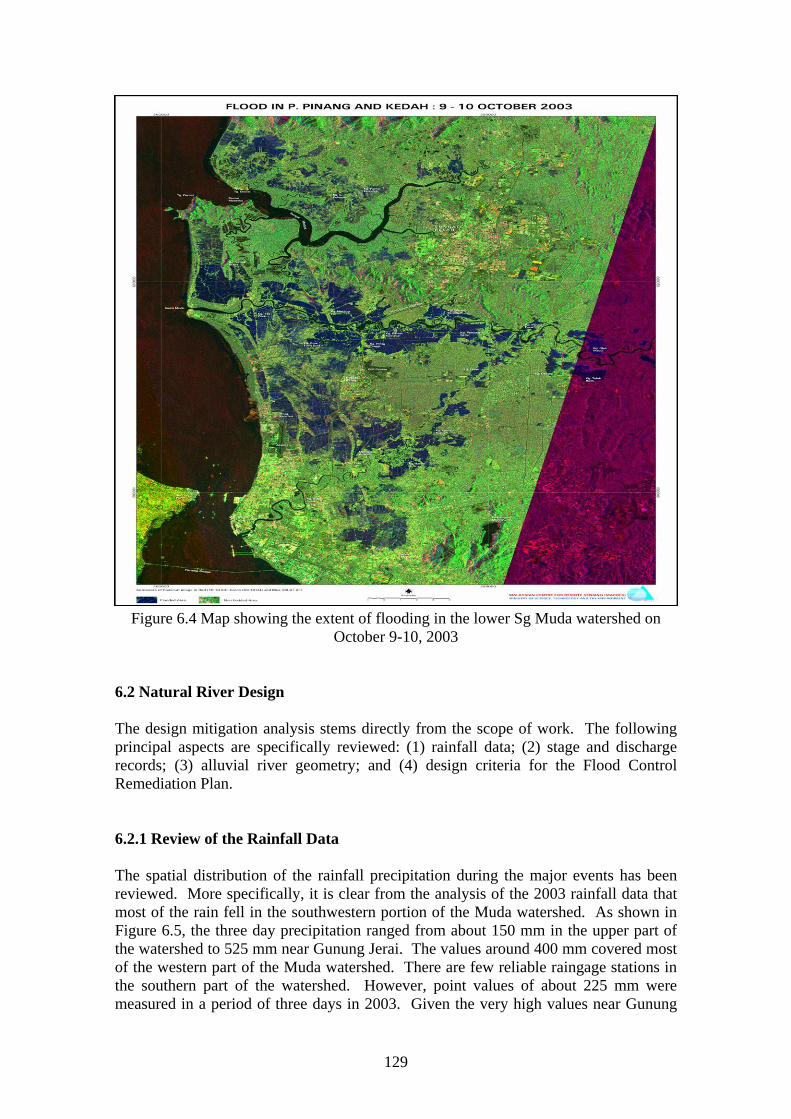
Figure 6.4 Map showing the extent of flooding in the lower Sg Muda watershed on October 9-10, 2003
6.2 Natural River Design The design mitigation analysis stems directly from the scope of work. The following principal aspects are specifically reviewed: (1) rainfall data; (2) stage and discharge records; (3) alluvial river geometry; and (4) design criteria for the Flood Control Remediation Plan. 6.2.1 Review of the Rainfall Data The spatial distribution of the rainfall precipitation during the major events has been reviewed. More specifically, it is clear from the analysis of the 2003 rainfall data that most of the rain fell in the southwestern portion of the Muda watershed. As shown in Figure 6.5, the three day precipitation ranged from about 150 mm in the upper part of the watershed to 525 mm near Gunung Jerai. The values around 400 mm covered most of the western part of the Muda watershed. There are few reliable raingage stations in the southern part of the watershed. However, point values of about 225 mm were measured in a period of three days in 2003. Given the very high values near Gunung
129
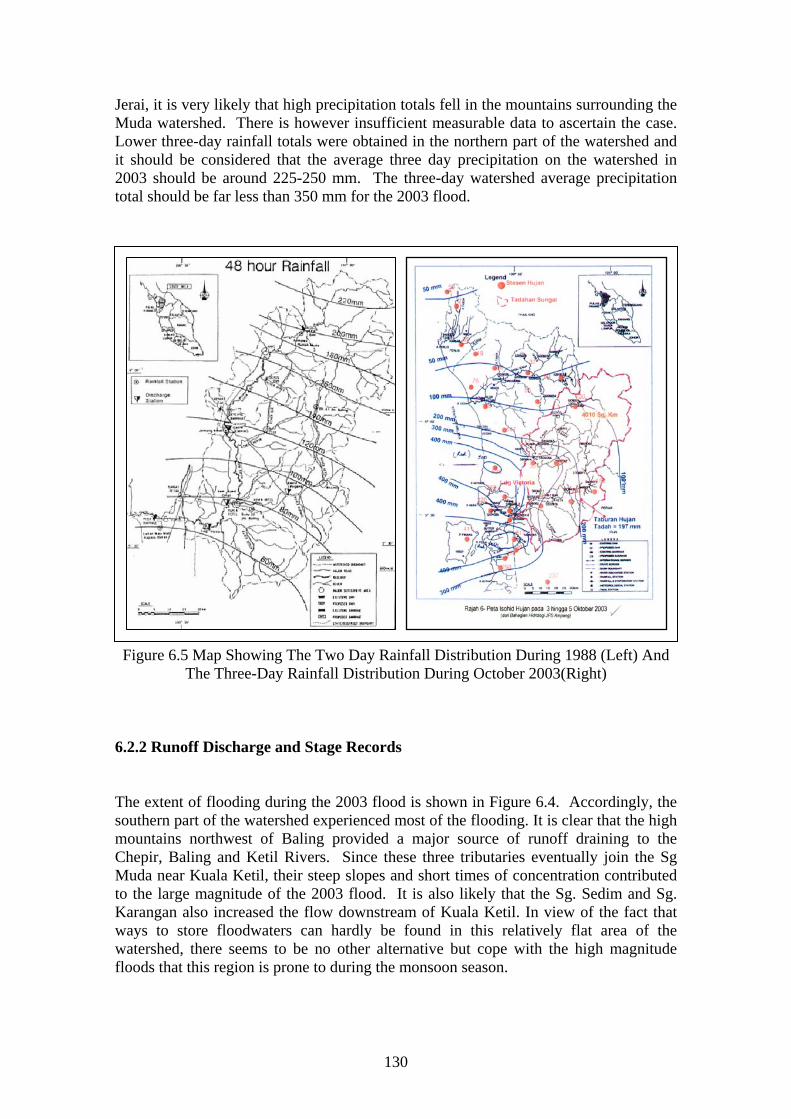
Jerai, it is very likely that high precipitation totals fell in the mountains surrounding the Muda watershed. There is however insufficient measurable data to ascertain the case. Lower three-day rainfall totals were obtained in the northern part of the watershed and it should be considered that the average three day precipitation on the watershed in 2003 should be around 225-250 mm. The three-day watershed average precipitation total should be far less than 350 mm for the 2003 flood. Figure 6.5 Map Showing The Two Day Rainfall Distribution During 1988 (Left) And
The Three-Day Rainfall Distribution During October 2003(Right) 6.2.2 Runoff Discharge and Stage Records The extent of flooding during the 2003 flood is shown in Figure 6.4. Accordingly, the southern part of the watershed experienced most of the flooding. It is clear that the high mountains northwest of Baling provided a major source of runoff draining to the Chepir, Baling and Ketil Rivers. Since these three tributaries eventually join the Sg Muda near Kuala Ketil, their steep slopes and short times of concentration contributed to the large magnitude of the 2003 flood. It is also likely that the Sg. Sedim and Sg. Karangan also increased the flow downstream of Kuala Ketil. In view of the fact that ways to store floodwaters can hardly be found in this relatively flat area of the watershed, there seems to be no other alternative but cope with the high magnitude floods that this region is prone to during the monsoon season.
130
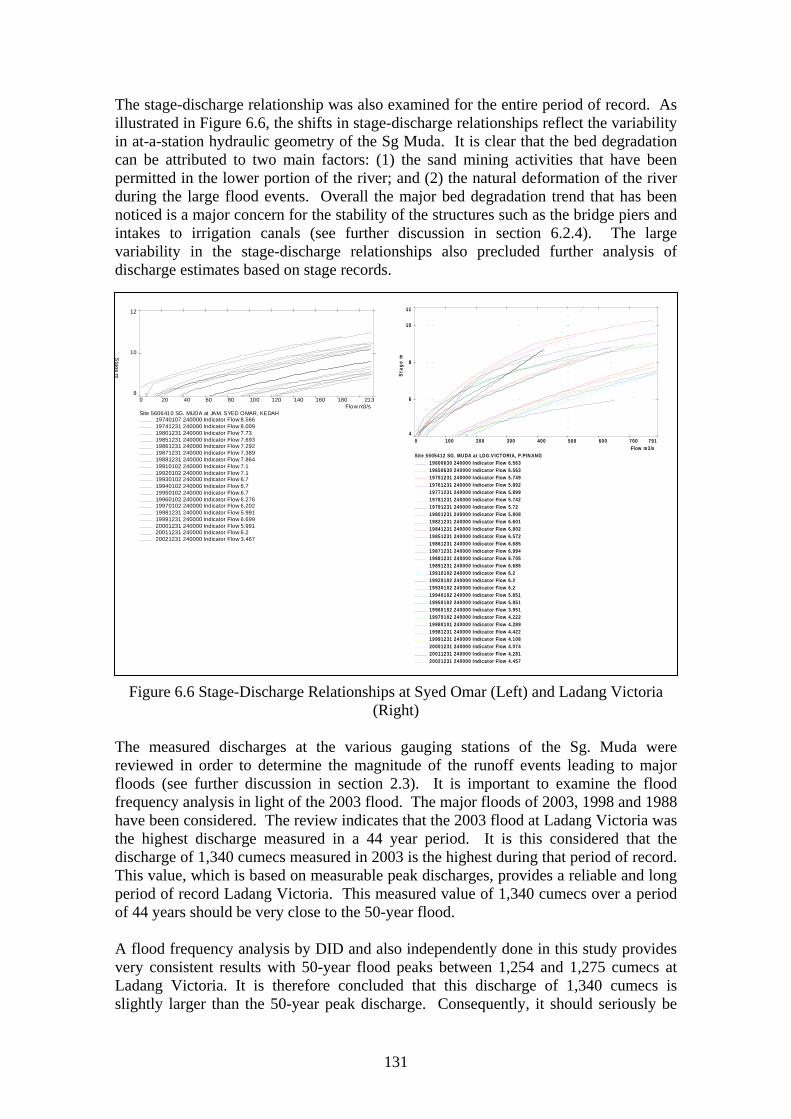
The stage-discharge relationship was also examined for the entire period of record. As illustrated in Figure 6.6, the shifts in stage-discharge relationships reflect the variability in at-a-station hydraulic geometry of the Sg Muda. It is clear that the bed degradation can be attributed to two main factors: (1) the sand mining activities that have been permitted in the lower portion of the river; and (2) the natural deformation of the river during the large flood events. Overall the major bed degradation trend that has been noticed is a major concern for the stability of the structures such as the bridge piers and intakes to irrigation canals (see further discussion in section 6.2.4). The large variability in the stage-discharge relationships also precluded further analysis of discharge estimates based on stage records.
131
4
6
8
10
11
Sta
ge m
0 100 200 300 400 500 600 700 791Flow m3/s
Site 5505412 SG. MUDA at LDG.VICTORIA, P.PINANG19600630 240000 Indicator Flow 6.56319650630 240000 Indicator Flow 6.56319751231 240000 Indicator Flow 5.74919761231 240000 Indicator Flow 5.89219771231 240000 Indicator Flow 5.89919781231 240000 Indicator Flow 5.74219791231 240000 Indicator Flow 5.7219801231 240000 Indicator Flow 5.80819821231 240000 Indicator Flow 6.60119841231 240000 Indicator Flow 6.80219851231 240000 Indicator Flow 6.57219861231 240000 Indicator Flow 6.68519871231 240000 Indicator Flow 6.99419881231 240000 Indicator Flow 6.70519891231 240000 Indicator Flow 6.68619910102 240000 Indicator Flow 6.219920102 240000 Indicator Flow 6.219930102 240000 Indicator Flow 6.219940102 240000 Indicator Flow 5.85119950102 240000 Indicator Flow 5.85119960102 240000 Indicator Flow 3.95119970102 240000 Indicator Flow 4.22219980101 240000 Indicator Flow 4.28919981231 240000 Indicator Flow 4.42219991231 240000 Indicator Flow 4.10820001231 240000 Indicator Flow 4.07420011231 240000 Indicator Flow 4.28120021231 240000 Indicator Flow 4.457
8
10
12
Stage m
0 20 40 60 80 100 120 140 160 180 213Flow m3/s
Site 5606410 SG. MUDA at JAM. SYED OMAR, KEDAH19740107 240000 Indicator Flow 8.56619741231 240000 Indicator Flow 8.00919801231 240000 Indicator Flow 7.7319851231 240000 Indicator Flow 7.69319861231 240000 Indicator Flow 7.29219871231 240000 Indicator Flow 7.38919881231 240000 Indicator Flow 7.86419910102 240000 Indicator Flow 7.119920102 240000 Indicator Flow 7.119930102 240000 Indicator Flow 6.719940102 240000 Indicator Flow 6.719950102 240000 Indicator Flow 6.719960102 240000 Indicator Flow 6.27619970102 240000 Indicator Flow 6.20219981231 240000 Indicator Flow 5.99119991231 240000 Indicator Flow 6.69920001231 240000 Indicator Flow 5.99120011231 240000 Indicator Flow 6.220021231 240000 Indicator Flow 3.467
Figure 6.6 Stage-Discharge Relationships at Syed Omar (Left) and Ladang Victoria
(Right) The measured discharges at the various gauging stations of the Sg. Muda were reviewed in order to determine the magnitude of the runoff events leading to major floods (see further discussion in section 2.3). It is important to examine the flood frequency analysis in light of the 2003 flood. The major floods of 2003, 1998 and 1988 have been considered. The review indicates that the 2003 flood at Ladang Victoria was the highest discharge measured in a 44 year period. It is this considered that the discharge of 1,340 cumecs measured in 2003 is the highest during that period of record. This value, which is based on measurable peak discharges, provides a reliable and long period of record Ladang Victoria. This measured value of 1,340 cumecs over a period of 44 years should be very close to the 50-year flood. A flood frequency analysis by DID and also independently done in this study provides very consistent results with 50-year flood peaks between 1,254 and 1,275 cumecs at Ladang Victoria. It is therefore concluded that this discharge of 1,340 cumecs is slightly larger than the 50-year peak discharge. Consequently, it should seriously be
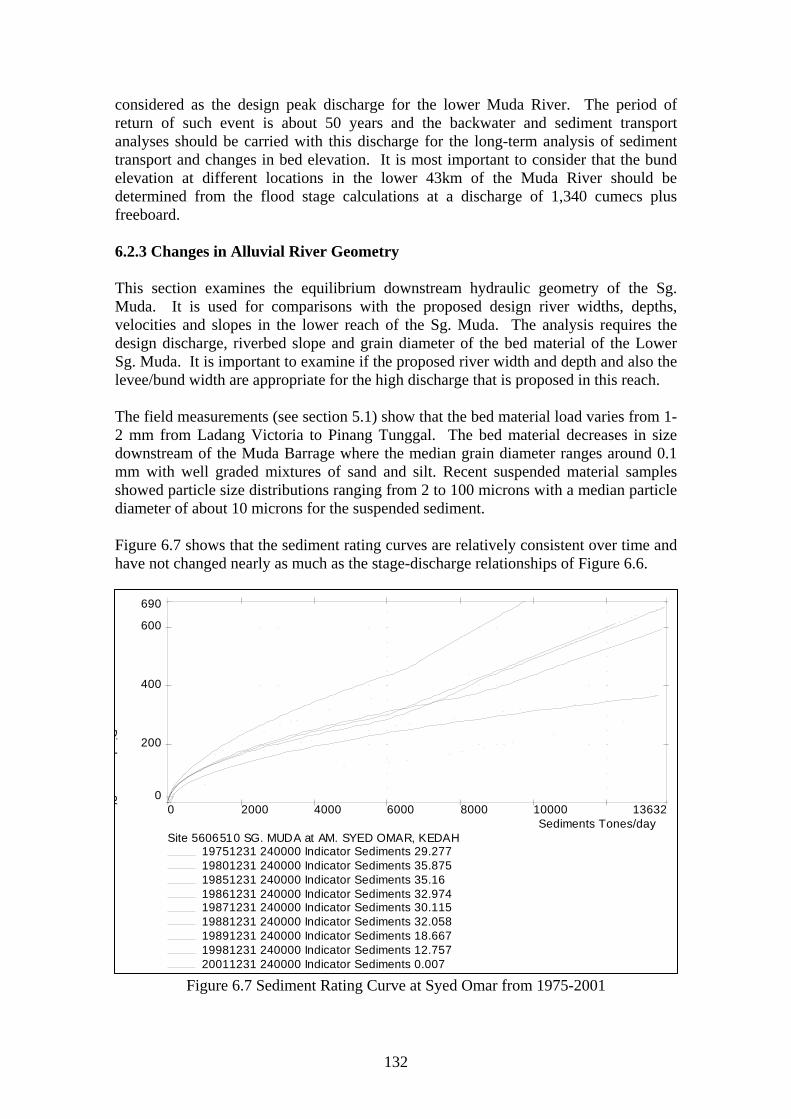
considered as the design peak discharge for the lower Muda River. The period of return of such event is about 50 years and the backwater and sediment transport analyses should be carried with this discharge for the long-term analysis of sediment transport and changes in bed elevation. It is most important to consider that the bund elevation at different locations in the lower 43km of the Muda River should be determined from the flood stage calculations at a discharge of 1,340 cumecs plus freeboard. 6.2.3 Changes in Alluvial River Geometry This section examines the equilibrium downstream hydraulic geometry of the Sg. Muda. It is used for comparisons with the proposed design river widths, depths, velocities and slopes in the lower reach of the Sg. Muda. The analysis requires the design discharge, riverbed slope and grain diameter of the bed material of the Lower Sg. Muda. It is important to examine if the proposed river width and depth and also the levee/bund width are appropriate for the high discharge that is proposed in this reach. The field measurements (see section 5.1) show that the bed material load varies from 1-2 mm from Ladang Victoria to Pinang Tunggal. The bed material decreases in size downstream of the Muda Barrage where the median grain diameter ranges around 0.1 mm with well graded mixtures of sand and silt. Recent suspended material samples showed particle size distributions ranging from 2 to 100 microns with a median particle diameter of about 10 microns for the suspended sediment. Figure 6.7 shows that the sediment rating curves are relatively consistent over time and have not changed nearly as much as the stage-discharge relationships of Figure 6.6.
0
200
400
600
690
Di
h3/
0 2000 4000 6000 8000 10000 13632Sediments Tones/day
Site 5606510 SG. MUDA at AM. SYED OMAR, KEDAH19751231 240000 Indicator Sediments 29.27719801231 240000 Indicator Sediments 35.87519851231 240000 Indicator Sediments 35.1619861231 240000 Indicator Sediments 32.97419871231 240000 Indicator Sediments 30.11519881231 240000 Indicator Sediments 32.05819891231 240000 Indicator Sediments 18.66719981231 240000 Indicator Sediments 12.75720011231 240000 Indicator Sediments 0.007
Figure 6.7 Sediment Rating Curve at Syed Omar from 1975-2001
132
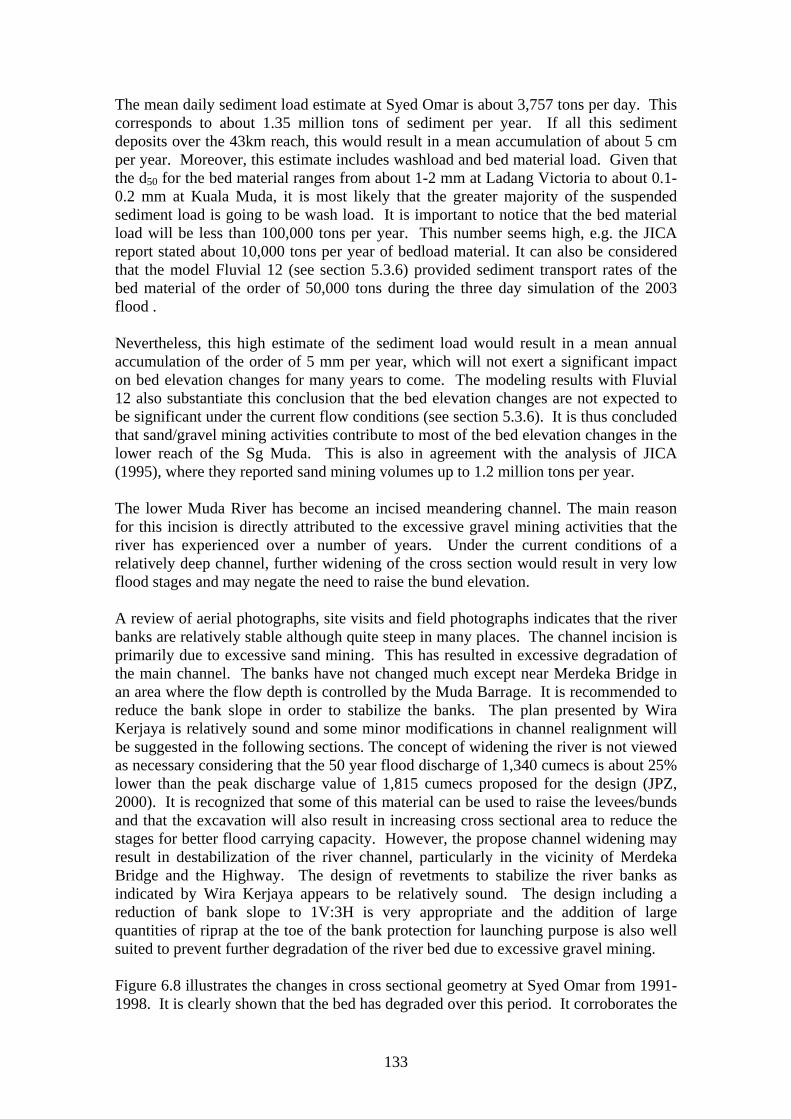
The mean daily sediment load estimate at Syed Omar is about 3,757 tons per day. This corresponds to about 1.35 million tons of sediment per year. If all this sediment deposits over the 43km reach, this would result in a mean accumulation of about 5 cm per year. Moreover, this estimate includes washload and bed material load. Given that the d50 for the bed material ranges from about 1-2 mm at Ladang Victoria to about 0.1-0.2 mm at Kuala Muda, it is most likely that the greater majority of the suspended sediment load is going to be wash load. It is important to notice that the bed material load will be less than 100,000 tons per year. This number seems high, e.g. the JICA report stated about 10,000 tons per year of bedload material. It can also be considered that the model Fluvial 12 (see section 5.3.6) provided sediment transport rates of the bed material of the order of 50,000 tons during the three day simulation of the 2003 flood . Nevertheless, this high estimate of the sediment load would result in a mean annual accumulation of the order of 5 mm per year, which will not exert a significant impact on bed elevation changes for many years to come. The modeling results with Fluvial 12 also substantiate this conclusion that the bed elevation changes are not expected to be significant under the current flow conditions (see section 5.3.6). It is thus concluded that sand/gravel mining activities contribute to most of the bed elevation changes in the lower reach of the Sg Muda. This is also in agreement with the analysis of JICA (1995), where they reported sand mining volumes up to 1.2 million tons per year. The lower Muda River has become an incised meandering channel. The main reason for this incision is directly attributed to the excessive gravel mining activities that the river has experienced over a number of years. Under the current conditions of a relatively deep channel, further widening of the cross section would result in very low flood stages and may negate the need to raise the bund elevation. A review of aerial photographs, site visits and field photographs indicates that the river banks are relatively stable although quite steep in many places. The channel incision is primarily due to excessive sand mining. This has resulted in excessive degradation of the main channel. The banks have not changed much except near Merdeka Bridge in an area where the flow depth is controlled by the Muda Barrage. It is recommended to reduce the bank slope in order to stabilize the banks. The plan presented by Wira Kerjaya is relatively sound and some minor modifications in channel realignment will be suggested in the following sections. The concept of widening the river is not viewed as necessary considering that the 50 year flood discharge of 1,340 cumecs is about 25% lower than the peak discharge value of 1,815 cumecs proposed for the design (JPZ, 2000). It is recognized that some of this material can be used to raise the levees/bunds and that the excavation will also result in increasing cross sectional area to reduce the stages for better flood carrying capacity. However, the propose channel widening may result in destabilization of the river channel, particularly in the vicinity of Merdeka Bridge and the Highway. The design of revetments to stabilize the river banks as indicated by Wira Kerjaya appears to be relatively sound. The design including a reduction of bank slope to 1V:3H is very appropriate and the addition of large quantities of riprap at the toe of the bank protection for launching purpose is also well suited to prevent further degradation of the river bed due to excessive gravel mining. Figure 6.8 illustrates the changes in cross sectional geometry at Syed Omar from 1991-1998. It is clearly shown that the bed has degraded over this period. It corroborates the
133
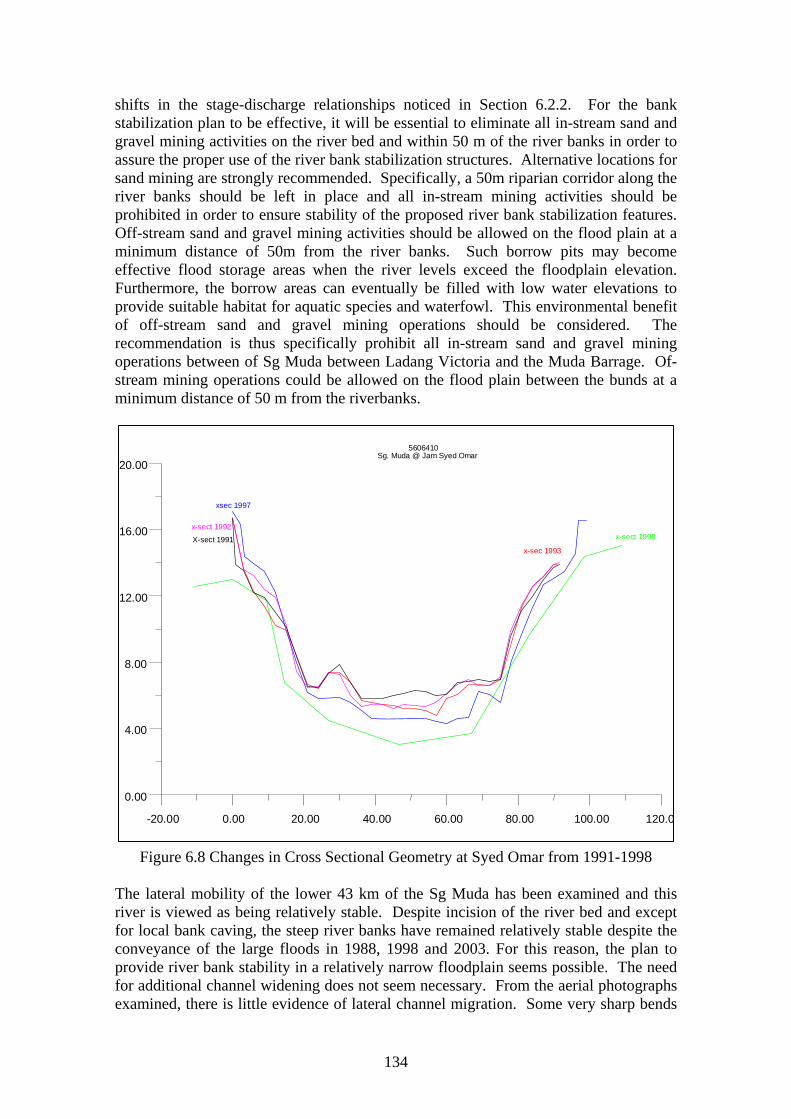
shifts in the stage-discharge relationships noticed in Section 6.2.2. For the bank stabilization plan to be effective, it will be essential to eliminate all in-stream sand and gravel mining activities on the river bed and within 50 m of the river banks in order to assure the proper use of the river bank stabilization structures. Alternative locations for sand mining are strongly recommended. Specifically, a 50m riparian corridor along the river banks should be left in place and all in-stream mining activities should be prohibited in order to ensure stability of the proposed river bank stabilization features. Off-stream sand and gravel mining activities should be allowed on the flood plain at a minimum distance of 50m from the river banks. Such borrow pits may become effective flood storage areas when the river levels exceed the floodplain elevation. Furthermore, the borrow areas can eventually be filled with low water elevations to provide suitable habitat for aquatic species and waterfowl. This environmental benefit of off-stream sand and gravel mining operations should be considered. The recommendation is thus specifically prohibit all in-stream sand and gravel mining operations between of Sg Muda between Ladang Victoria and the Muda Barrage. Of-stream mining operations could be allowed on the flood plain between the bunds at a minimum distance of 50 m from the riverbanks.
-20.00 0.00 20.00 40.00 60.00 80.00 100.00 120.0
0.00
4.00
8.00
12.00
16.00
20.00
xsec 1997
x-sect 1998
x-sec 1993
x-sect 1992
X-sect 1991
5606410Sg. Muda @ Jam Syed Omar
Figure 6.8 Changes in Cross Sectional Geometry at Syed Omar from 1991-1998 The lateral mobility of the lower 43 km of the Sg Muda has been examined and this river is viewed as being relatively stable. Despite incision of the river bed and except for local bank caving, the steep river banks have remained relatively stable despite the conveyance of the large floods in 1988, 1998 and 2003. For this reason, the plan to provide river bank stability in a relatively narrow floodplain seems possible. The need for additional channel widening does not seem necessary. From the aerial photographs examined, there is little evidence of lateral channel migration. Some very sharp bends
134
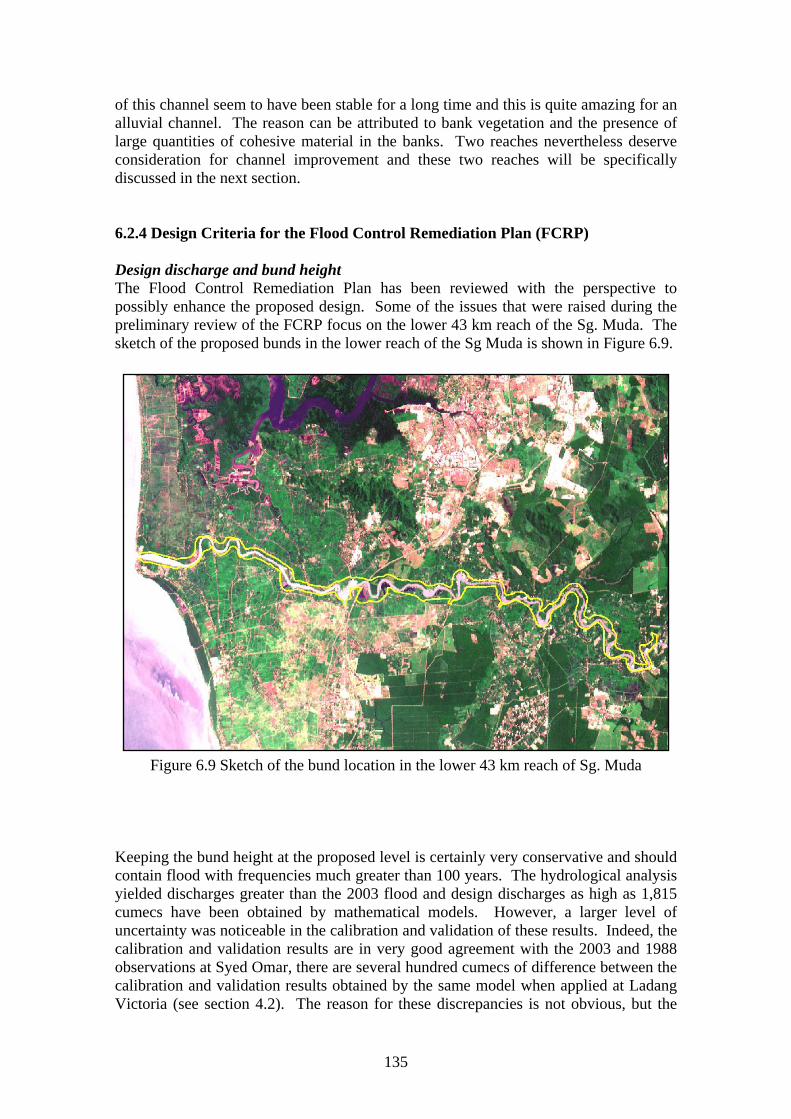
of this channel seem to have been stable for a long time and this is quite amazing for an alluvial channel. The reason can be attributed to bank vegetation and the presence of large quantities of cohesive material in the banks. Two reaches nevertheless deserve consideration for channel improvement and these two reaches will be specifically discussed in the next section. 6.2.4 Design Criteria for the Flood Control Remediation Plan (FCRP) Design discharge and bund height The Flood Control Remediation Plan has been reviewed with the perspective to possibly enhance the proposed design. Some of the issues that were raised during the preliminary review of the FCRP focus on the lower 43 km reach of the Sg. Muda. The sketch of the proposed bunds in the lower reach of the Sg Muda is shown in Figure 6.9.
Figure 6.9 Sketch of the bund location in the lower 43 km reach of Sg. Muda
Keeping the bund height at the proposed level is certainly very conservative and should contain flood with frequencies much greater than 100 years. The hydrological analysis yielded discharges greater than the 2003 flood and design discharges as high as 1,815 cumecs have been obtained by mathematical models. However, a larger level of uncertainty was noticeable in the calibration and validation of these results. Indeed, the calibration and validation results are in very good agreement with the 2003 and 1988 observations at Syed Omar, there are several hundred cumecs of difference between the calibration and validation results obtained by the same model when applied at Ladang Victoria (see section 4.2). The reason for these discrepancies is not obvious, but the
135
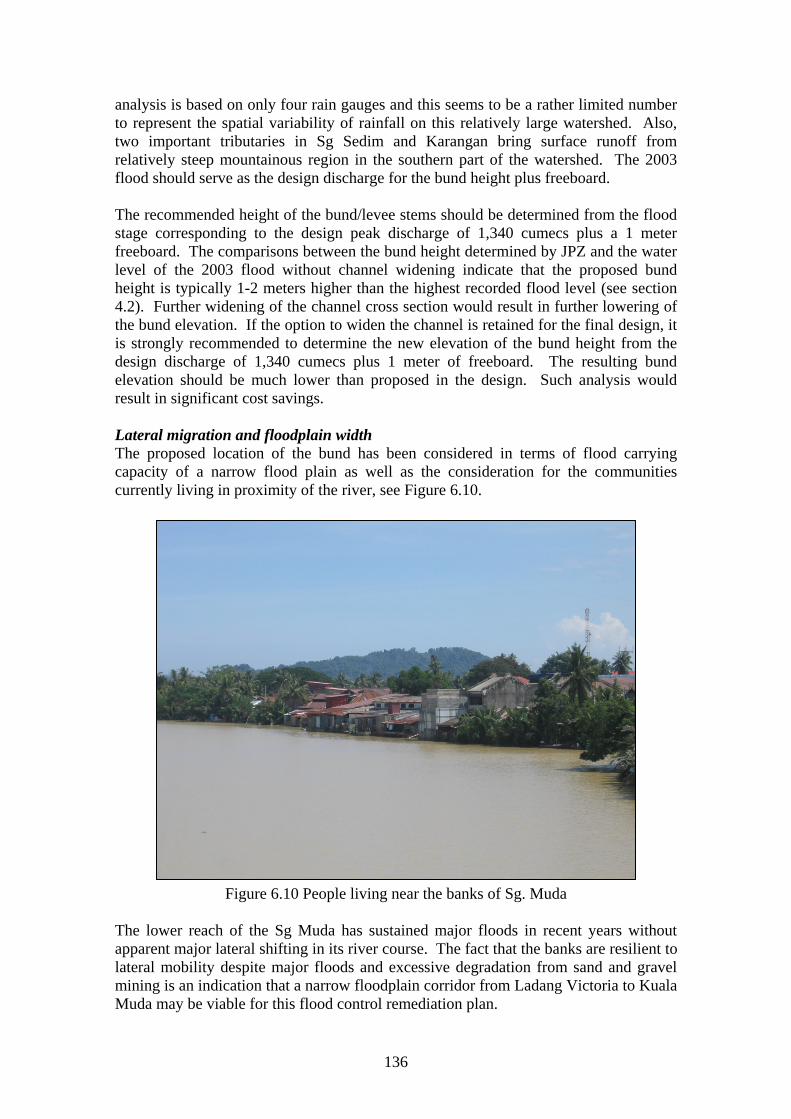
analysis is based on only four rain gauges and this seems to be a rather limited number to represent the spatial variability of rainfall on this relatively large watershed. Also, two important tributaries in Sg Sedim and Karangan bring surface runoff from relatively steep mountainous region in the southern part of the watershed. The 2003 flood should serve as the design discharge for the bund height plus freeboard. The recommended height of the bund/levee stems should be determined from the flood stage corresponding to the design peak discharge of 1,340 cumecs plus a 1 meter freeboard. The comparisons between the bund height determined by JPZ and the water level of the 2003 flood without channel widening indicate that the proposed bund height is typically 1-2 meters higher than the highest recorded flood level (see section 4.2). Further widening of the channel cross section would result in further lowering of the bund elevation. If the option to widen the channel is retained for the final design, it is strongly recommended to determine the new elevation of the bund height from the design discharge of 1,340 cumecs plus 1 meter of freeboard. The resulting bund elevation should be much lower than proposed in the design. Such analysis would result in significant cost savings. Lateral migration and floodplain width The proposed location of the bund has been considered in terms of flood carrying capacity of a narrow flood plain as well as the consideration for the communities currently living in proximity of the river, see Figure 6.10.
Figure 6.10 People living near the banks of Sg. Muda
The lower reach of the Sg Muda has sustained major floods in recent years without apparent major lateral shifting in its river course. The fact that the banks are resilient to lateral mobility despite major floods and excessive degradation from sand and gravel mining is an indication that a narrow floodplain corridor from Ladang Victoria to Kuala Muda may be viable for this flood control remediation plan.
136
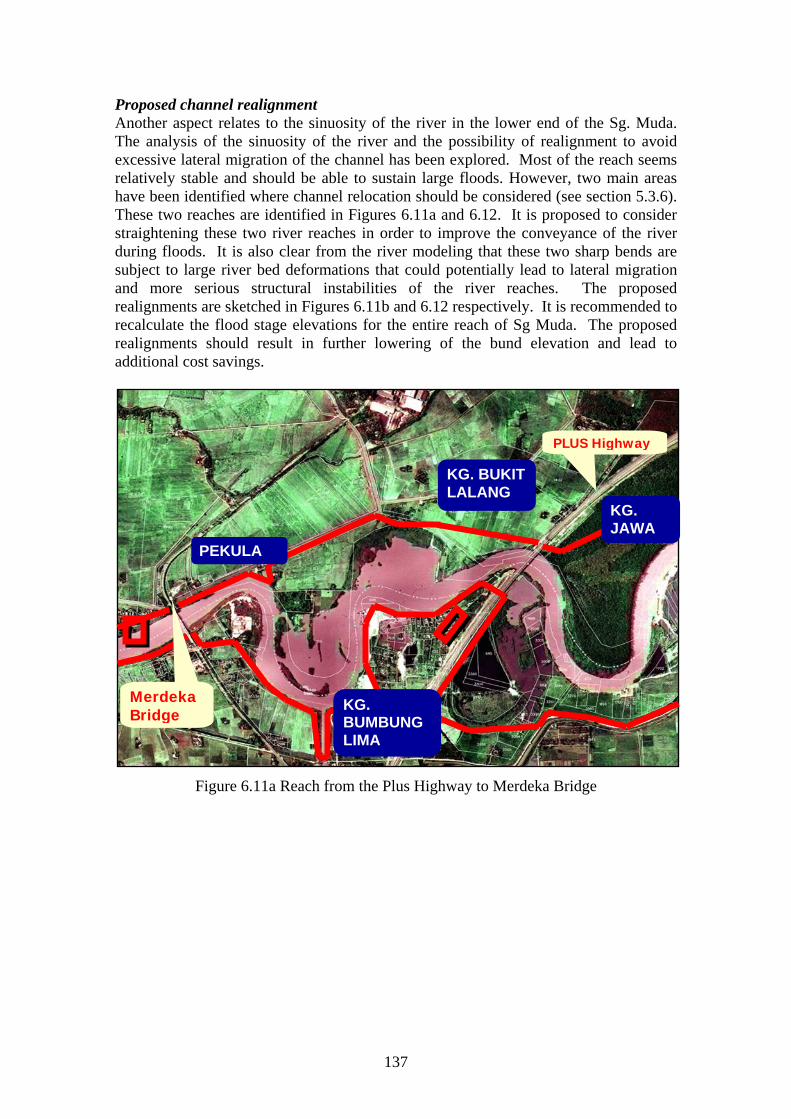
Proposed channel realignment Another aspect relates to the sinuosity of the river in the lower end of the Sg. Muda. The analysis of the sinuosity of the river and the possibility of realignment to avoid excessive lateral migration of the channel has been explored. Most of the reach seems relatively stable and should be able to sustain large floods. However, two main areas have been identified where channel relocation should be considered (see section 5.3.6). These two reaches are identified in Figures 6.11a and 6.12. It is proposed to consider straightening these two river reaches in order to improve the conveyance of the river during floods. It is also clear from the river modeling that these two sharp bends are subject to large river bed deformations that could potentially lead to lateral migration and more serious structural instabilities of the river reaches. The proposed realignments are sketched in Figures 6.11b and 6.12 respectively. It is recommended to recalculate the flood stage elevations for the entire reach of Sg Muda. The proposed realignments should result in further lowering of the bund elevation and lead to additional cost savings.
KG. BUMBUNG LIMA
PEKULA
KG. JAWA
KG. BUKIT LALANG
Merdeka Bridge
PLUS Highway
Figure 6.11a Reach from the Plus Highway to Merdeka Bridge
137
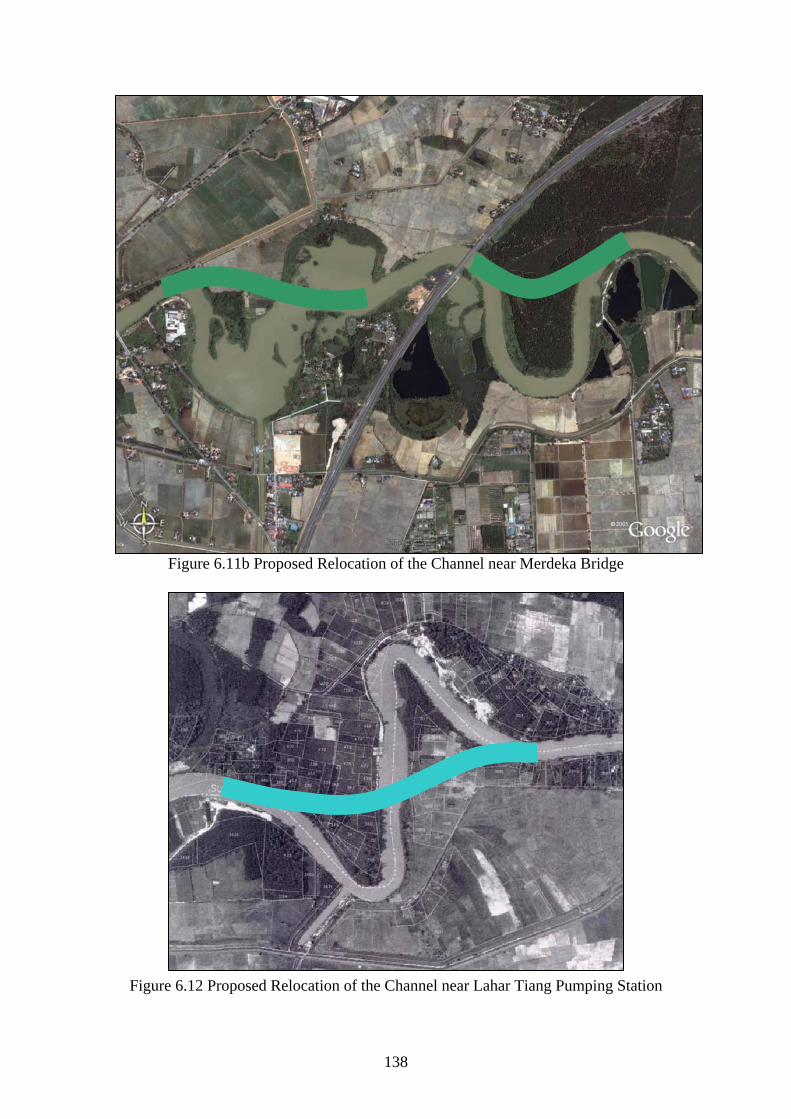
Figure 6.11b Proposed Relocation of the Channel near Merdeka Bridge
Figure 6.12 Proposed Relocation of the Channel near Lahar Tiang Pumping Station
138
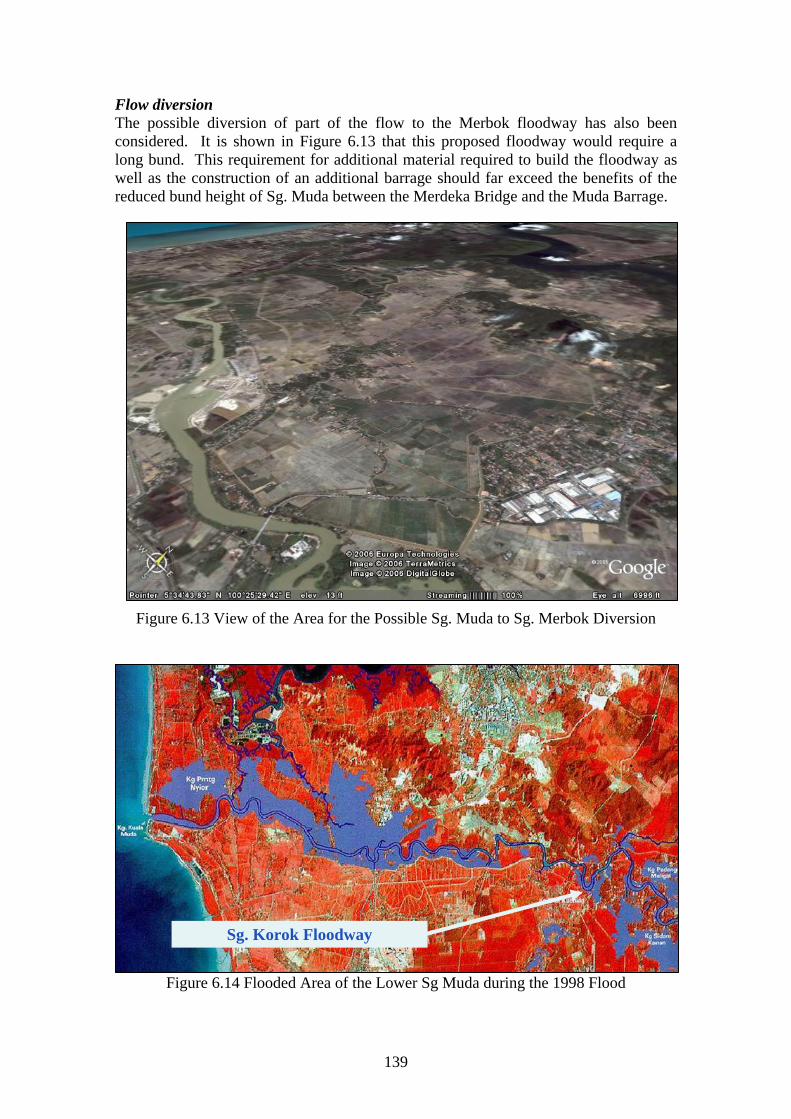
Flow diversion The possible diversion of part of the flow to the Merbok floodway has also been considered. It is shown in Figure 6.13 that this proposed floodway would require a long bund. This requirement for additional material required to build the floodway as well as the construction of an additional barrage should far exceed the benefits of the reduced bund height of Sg. Muda between the Merdeka Bridge and the Muda Barrage.
Figure 6.13 View of the Area for the Possible Sg. Muda to Sg. Merbok Diversion
Figure 6.14 Flooded Area of the Lower Sg Muda during the 1998 Flood
Sg. Korok Floodway
139
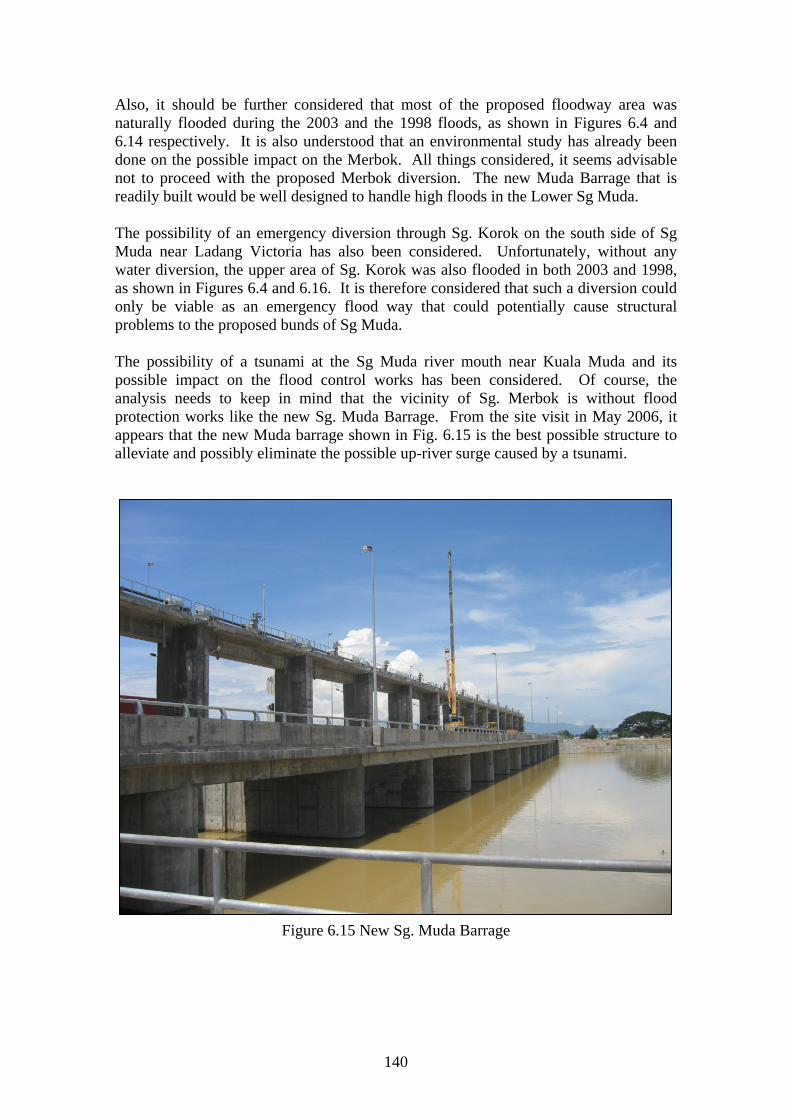
Also, it should be further considered that most of the proposed floodway area was naturally flooded during the 2003 and the 1998 floods, as shown in Figures 6.4 and 6.14 respectively. It is also understood that an environmental study has already been done on the possible impact on the Merbok. All things considered, it seems advisable not to proceed with the proposed Merbok diversion. The new Muda Barrage that is readily built would be well designed to handle high floods in the Lower Sg Muda. The possibility of an emergency diversion through Sg. Korok on the south side of Sg Muda near Ladang Victoria has also been considered. Unfortunately, without any water diversion, the upper area of Sg. Korok was also flooded in both 2003 and 1998, as shown in Figures 6.4 and 6.16. It is therefore considered that such a diversion could only be viable as an emergency flood way that could potentially cause structural problems to the proposed bunds of Sg Muda. The possibility of a tsunami at the Sg Muda river mouth near Kuala Muda and its possible impact on the flood control works has been considered. Of course, the analysis needs to keep in mind that the vicinity of Sg. Merbok is without flood protection works like the new Sg. Muda Barrage. From the site visit in May 2006, it appears that the new Muda barrage shown in Fig. 6.15 is the best possible structure to alleviate and possibly eliminate the possible up-river surge caused by a tsunami.
Figure 6.15 New Sg. Muda Barrage
140
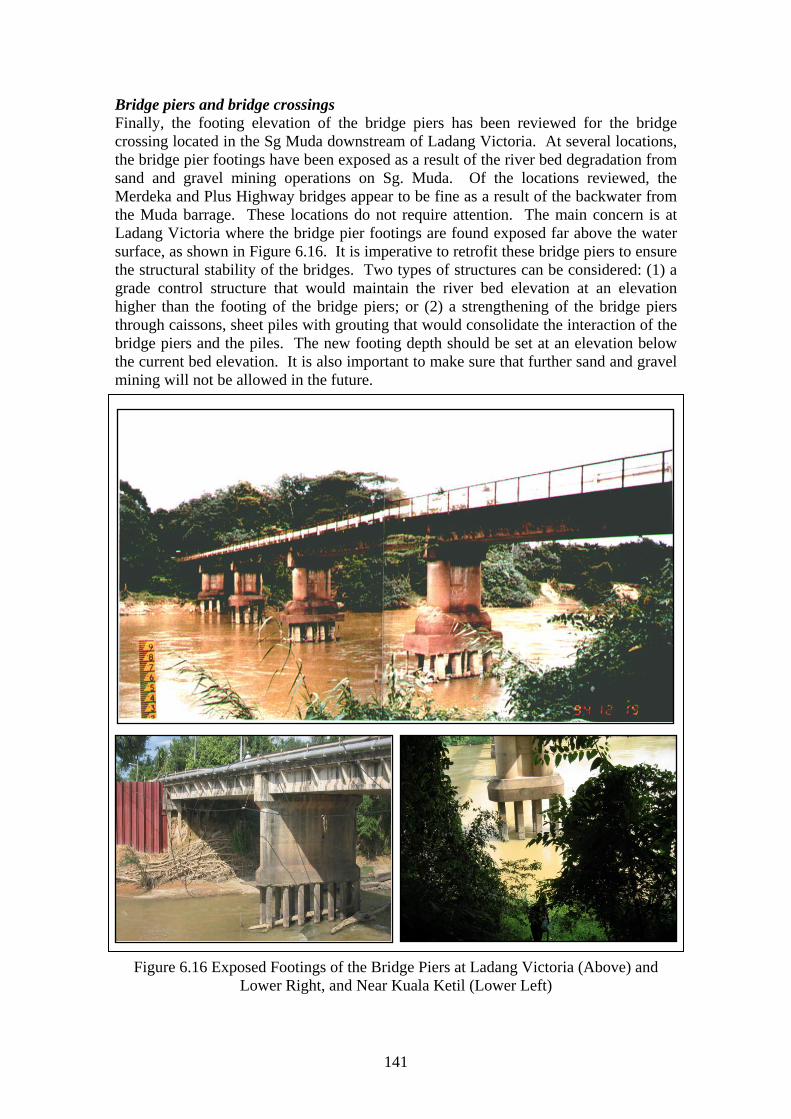
Bridge piers and bridge crossings Finally, the footing elevation of the bridge piers has been reviewed for the bridge crossing located in the Sg Muda downstream of Ladang Victoria. At several locations, the bridge pier footings have been exposed as a result of the river bed degradation from sand and gravel mining operations on Sg. Muda. Of the locations reviewed, the Merdeka and Plus Highway bridges appear to be fine as a result of the backwater from the Muda barrage. These locations do not require attention. The main concern is at Ladang Victoria where the bridge pier footings are found exposed far above the water surface, as shown in Figure 6.16. It is imperative to retrofit these bridge piers to ensure the structural stability of the bridges. Two types of structures can be considered: (1) a grade control structure that would maintain the river bed elevation at an elevation higher than the footing of the bridge piers; or (2) a strengthening of the bridge piers through caissons, sheet piles with grouting that would consolidate the interaction of the bridge piers and the piles. The new footing depth should be set at an elevation below the current bed elevation. It is also important to make sure that further sand and gravel mining will not be allowed in the future.
Figure 6.16 Exposed Footings of the Bridge Piers at Ladang Victoria (Above) and Lower Right, and Near Kuala Ketil (Lower Left)
141
It is also very important that although this analysis focuses on the lower reach of the Sg Muda, headcutting and nick points are expected to develop and migrate upstream. For instance, it has been noticed that the bridge at CH-25 of Sg. Ketil has also experienced similar problems. This systematic degradation caused by sand and gravel mining endangers the stability of the bridges upstream and hence cause a threat to all vehicles crossing bridges on the Sg Muda and its upstream tributaries. Although this conclusion does not directly relate to the Flood Control Remediation Plan, it is certainly one of the most important findings of this study. 6.2.5 Summary of Specific Design of the Proposed Structures The specific design of several parts of the Flood Control Remediation Plan has been reviewed. More specifically, some of the specific recommendations for design consideration include:
• The size, location and height of the bunds should be based on the flood elevation from the 2003 flood at a discharge of 1,340 cumecs plus a freeboard of one meter. Without any widening of the channel cross sections, the bund elevation proposed by JPZ is already about 1-2 m higher than the 2003 flood elevation (see section 4.2.6). The proposed bund height by JPZ appears to be highly conservative and will pass flows with period of return much in excess of 100 years. The bund elevation should be reconsidered and may result in significant cost savings.
• It is recommended not to widen the channel cross sections. The design flood discharge of 1,340 cumecs should be contained well within the lower bund heights. This results in cost savings for the proposed FCRP. Should some channel widening be retained in the final plan, it is further recommended to recalculate the new flood elevations. Channel widening will result in lower flood stages and lower bund elevations, thus resulting in significant cost savings.
• The specific design of the bank stabilization structures, particularly in sharp
bends, is viewed as problematic. Two sites have been identified as shown in Figures 6.11 and 6.12 should be considered for channel straightening. This measure would result in lower resistance to flow, increased conveyance, reduced backwater effects and ultimately lower bund heights.
• Pumping stations for irrigation canals have been required on the Sg Muda as a
result of the continuing degradation of the river. The degradation can be clearly attributed to the excessive sand and gravel mining of the Sg Muda. For the bank stabilization structures of the FCRP to be effective, it will be essential not to allow any in-stream sand and gravel mining activities in the future. It is proposed to allow off-stream sand and gravel mining activities at a minimum distance of 50 m from the river banks.
• The floodways to Sg. Merbok is not recommended because it would bring
additional water to areas that were readily flooded in 1998 and 2003. The Merbok river diversion would also require long bunds and an additional barrage, which cost will not be economically justified.
142
• The potential diversion to Sg. Korok can only be justified as an emergency
measure to prevent rupture of the proposed bunds designed in this FCRP. This diversions may alleviate the problem of flood mitigation on the Muda, but at the same time may exacerbate the flooding problems elsewhere.
• In view of excessive sand and gravel mining of the Sg Muda, the bridge pier
footings at Ladang Victoria need serious and immediate attention. The excessive scour and river bed degradation near Ladang Victoria can cause major structural instabilities and the potential risk of collapse of some of these bridges needs to be prevented. The retrofitting of the footings of the bridge piers is urgent and essential. Similar problems are propagating upstream as a result of headcutting and riverbed degradation from sand and gravel mining. It is recommended to eliminate in-stream sand and gravel mining activities. Off-stream sand mining should be encouraged.
In conclusion, if the design of the bund height can be based on the 2003 flood discharge plus a one meter freeboard, the bund/levee height can be significantly lower than currently specified. The proposed widening of the cross-section also appears not to be necessary. Any channel widening should be carefully examined as it will result in reduced bund heights. These should result in significant savings for the overall cost for the Flood Control Remediation Plan. A plan to address the sand and gravel mining issues on this river is also strongly recommended in order to maintain the stability of the proposed river bank protection structures as well as the bridge piers. In-stream mining should not be allowed between Ladang Victoria and Muda barrage. Off-stream mining should be permitted instead.
143
Chapter 7 Conclusions and Recommendations 7.1 Conclusions The Flood Control Remediation Plan (FCRP) has been reviewed with the perspective to possibly enhance the proposed design. The objectives of this review are: (1) ensure that design cross-sections and alignment of the main river channel are economic, effective and environmentally sound; (2) propose alternative designs for identified locations to meet the above requirements; and (3) examine the long term river behaviour through model studies to minimise expensive repair works in future resulting from the new alignment. The scope of work of this report includes a review of:
(a) rainfall data in space and time leading to chosen flood events. (b) runoff discharge and stage records of the chosen events; (c) computer simulation of the flood events; (d) computer simulation of long term river behaviour to determine stretches prone
to meandering, hence needing extra protection; (e) changes in alluvial river geometry in terms of aggradation and degradation as
well as lateral channel migration as a result of the flood events; (f) design criteria used for the Flood Control Remediation Plan; (g) specific design of the proposed structures including levee protection, riverbank
protection works and protection of bridge crossings and other structures. In an itemized fashion, the main conclusions of this review are specifically:
(a) There is significant uncertainty in the determination of the three-day rainfall rates in 2003. The watershed average rainfall precipitation is difficult to ascertain from only four raingages. However, the three-day watershed average rainfall precipitation is found to be less than 300mm.
(b) The analysis of a 44 year measured discharge record at Ladang Victoria leads to
a well defined 50-year flood peak discharge around 1,270 cumecs. Similar results are obtained from independent flood frequency analyses. This value is the most reliable estimate of the 50 year flood peak discharge. The 2003 flood with a peak discharge of 1,340 cumecs is recommended for the design of the FCRP. Comparatively, river stage records are highly variable as a result of excessive sand and gravel mining operations on Sg. Muda. Stage records should not be used to estimate flood discharges.
145
(c) Computer simulations of the flood events with the model HEC-HMS showed very good results for the calibration and validation of the discharge hydrographs at Syed Omar in 2003 and 1998 respectively. However, there is a significant variability (error of at least 100 cumecs) in both the calibrated and validated results at Ladang Victoria. This appears to be due to the limited number of raingages in the southern part of the watershed where precipitation showed spatial variability. When using the same high rainfall precipitation as JPZ, the HEC-HMS results are very consistent with their design hydrographs. However, as discussed above in (a), the three-day rainfall precipitation of 350 mm used to determine a 50 year peak discharge of 1,815 cumecs is viewed as excessively large. The results of these rainfall-runoff models are highly variable and less reliable than the measured flood discharges at Ladang Victoria. It is concluded that the 50-year design hydrograph with peak discharge of 1,815 cumecs is excessively large. The value of peak discharge of 1,340 cumecs should be used for the design. The design discharge reduction by 25% should results in significant cost savings for the FCRP of Sg Muda.
(d) The model Fluvial 12 has been used for the lateral and vertical elevation
changes during the 2003 flood event. Most cross sections are very stable and the vertical elevation changes are small due to the low sediment transport rates of the bed material. The sand and gravel mining operations are far exceeding the natural sediment transport rates of the river. These operations can cause serious problems to the stability of the proposed structures of the FCRP. It is concluded that in-stream sand and gravel mining operations should not be allowed.
(e) The model Fluvial 12 also highlighted potential lateral migration changes near
the sharp bends upstream of Merdeka Bridge and near Lahar Tiang. It is concluded that channel realignment near Merdeka Bridge and Lahar Tiang would minimize potential lateral migration problems of Sg Muda. These realignments should also result in better flood conveyance, reduced roughness and backwater and lower bund elevation.
(f) The proposed bund height under Alternative 2 of JPZ appears to be highly
conservative and will pass flows with period of return much in excess of 100 years. The proposed design criterion for the FCRP is to add a one meter freeboard to the flood stage calculated for the current channel cross sections, without widening, using the 2003 flood peak of 1,340 cumecs. The results obtained from the model HEC-RAS result in lowering the proposed bunds by 30cm to 1m over the 43 km reach of Sg. Muda.
(g) It is recommended not to widen the channel cross sections. Channel widening
will result in lower flood stages and lower bund elevations, thus resulting in additional cost savings. These cross section were not available to us, but further analysis should be carried out if channel widening is retained as an option. In view of excessive sand and gravel mining of the Sg Muda, the bridge pier footings at Ladang Victoria need serious and immediate attention. Pumping stations for irrigation canals have also been required on the Sg Muda as a result of the continuing degradation of the river. The degradation can be clearly attributed to the excessive sand and gravel mining of the Sg Muda. For the
146
bank stabilization structures of the FCRP to be effective, it will be essential not to allow any in-stream sand and gravel mining activities in the future. It is proposed to allow off-stream sand and gravel mining activities at a minimum distance of 50 m from the river banks. The floodways to Sg. Merbok is not recommended because it would bring additional water to areas that were readily flooded in 1998 and 2003. The Merbok river diversion would also require long bunds and an additional barrage, which cost will not be economically justified. The potential diversion to Sg. Korok can only be justified as an emergency measure to prevent rupture of the proposed bunds designed in this FCRP. This diversions may alleviate the problem of flood mitigation on the Muda, but at the same time may exacerbate the flooding problems in the upper watershed of Sg Perai.
7.2 Recommendations The Flood Control Remediation Plan (FCRP) has been reviewed with the perspective to possibly enhance the proposed design. The conclusions of this report demonstrate the potential for significant cost saving features as well as structural stability measures. The specific recommendations for the FCRP include the following:
(a) It is proposed to reduce the design discharge from 1,815 cumecs to the proposed discharge of 1,340 cumecs from the 2003 flood. This design discharge reduction of about 25% should yield significant cost reduction of the total cost of the FCRP. It is recommended not to widen the channel. However, any widening of the channel cross sections would result in further lowering the bund elevation thus further reducing the cost of the FCRP. It is recommended to run the HEC-RAS model with the proposed widened cross sections for comparison with the current results (these cross section were not available for this study). More specifically, the effects of the excessive channel widening downstream of the Muda barrage should be considered in terms of bund height and also possible sediment accumulation near the mouth of Sg. Muda.
(b) The suggested channel realignment is expected to result in reduced
roughness, reduced backwater effects and thus lower bund elevations. It is recommended to run the HEC-RAS model with consideration of the proposed realignments. The results of these two measures should result in a lower cost of the FCRP.
(c) It is strongly recommended to prohibit all in-stream sand and gravel mining
activities between Ladang Victoria and the Muda Barrage. Off-stream mining activities should instead be allowed at a minimum distance of 50 m from the channel. We recommend a more detailed analysis of the locations and volumes of sand and gravel that can be extracted under this proposal.
(d) It is recommended to recalculate the bund height and provide a more
detailed estimate of the cost saving features discussed in (a), (b), and (c).
147
REFERENCES Chang, H.H. (1988). Fluvial Processes in River Engineering. John Wiley & Sons, USA. Chang, H.H. (1993). FLUVIAL-12 : Mathematical Model For Erodible Channel, San Deigo, California. Department of Irrigation and Drainage Malaysia. (2000). Urban Stormwater Management Manual for Malaysia or MSMA. Japan International Cooperation Argency. (1995). Comprehensive Management Plan Of Muda River Basin, Final Report. Jurutera Perunding Zaaba or JPZ (2000). Sg Muda Flood Mitigation Project.
149