
Munich Personal RePEc Archive - uni-muenchen.de Personal RePEc Archive ... Countries Ginanjar...
20
Munich Personal RePEc Archive How do Macroeconomic Changes Impact Islamic and Conventional Equity Prices? Evidence from Developed and Emerging Countries Ginanjar Dewandaru and Syed Aun Rizvi and Kabir Sarkar and Obiyathulla Bacha and Mansur Masih INCEIF, Malaysia, University of Nottingham, Malaysian Campus, Taylor’s University, Malaysia, INCEIF, Malaysia, INCEIF, Malaysia 24 May 2014 Online at https://mpra.ub.uni-muenchen.de/59587/ MPRA Paper No. 59587, posted 31 October 2014 12:38 UTC
Transcript of Munich Personal RePEc Archive - uni-muenchen.de Personal RePEc Archive ... Countries Ginanjar...
MPRAMunich Personal RePEc Archive
How do Macroeconomic Changes ImpactIslamic and Conventional Equity Prices?Evidence from Developed and EmergingCountries
Ginanjar Dewandaru and Syed Aun Rizvi and Kabir Sarkar
and Obiyathulla Bacha and Mansur Masih
INCEIF, Malaysia, University of Nottingham, Malaysian Campus,Taylor’s University, Malaysia, INCEIF, Malaysia, INCEIF, Malaysia
24 May 2014
Online at https://mpra.ub.uni-muenchen.de/59587/MPRA Paper No. 59587, posted 31 October 2014 12:38 UTC
1
How do Macroeconomic Changes Impact Islamic and
Conventional Equity Prices? Evidence from Developed and
Emerging Countries
Ginanjar Dewandaru1, Syed Aun R. Rizvi
2, Kabir Sarkar
3, Obiyathulla I.
Bacha4 and Mansur Masih
5
ABSTRACT
In theory, the price of equity is determined by the dividend yields and growth
potentials of the firms. There exists established empirical proof of the impact of
macroeconomic changes to the equity markets. With the advent of Islamic equities,
and the recent surge of interest in them have raised the question of whether the same
theoretical framework and relationship be considered for Shariah compliant equities
or not. This study explores the impact of macroeconomic changes on Islamic and
conventional indices for a large set of 37 countries, classifying them according to
developed and emerging countries. The study finds a higher impact of Industrial
production on the Islamic equities, while the interest rate and money supply have a
lesser impact as compared to the impact on conventional counterparts. This lends
support to the argument that Shariah screening methodology provides a set of Islamic
equities which are more founded on the real sector of the economy. In addition the
adjustment process during the crisis is faster for the Islamic equities in both regions.
These results provide initial empirical proof for further research on the impact of
specific economic variables on the changes in Islamic equity prices.
Key Words: Islamic finance, Stock Market, Equity, Emerging Countries
JEL Classification Codes: C22, C58, E44, G15
1 Ginanjar Dewandaru is a research assistant and teaching assistant at INCEIF. Currently, he is pursuing a PhD in Islamic
Finance at INCEIF, Lorong Universiti A, 59100 Kuala Lumpur, Malaysia. Phone: +60142657731 Email:
[email protected] 2 Corresponding Author - Syed Aun R. Rizvi is an Assistant Professor, University of Nottingham, Malaysian Campus.
Phone: +60136145752 Email: [email protected] 3 Kabir Sarkar is a Senior Lecturer at Taylor’s University- Lakeside Campus, Malaysia. Phone: +60173842282 Email:
[email protected] 4 Professor of Finance, INCEIF, Lorong Universiti A, 59100 Kuala Lumpur, Malaysia. Phone: +60193858425 Email:
[email protected] 5Professor of Finance and Econometrics, INCEIF, Lorong Universiti A, 59100 Kuala Lumpur, Malaysia. Phone:
+60173841464 Email: [email protected]
2
1. Introduction
Literature in finance has explored the pricing of equities for decades. According to
established works of theory the price is determined by the dividend yields and growth
potentials of the firms. While the latter is dependent on internal factors of the firm, it is also
heavily dependent on the economic health and prospects of the business environment. A well-
functioning stock market is widely considered as an indicator of the future potential of the
economy. Based on this premise the price of a firm in the stock market should reflect the
future potential which is indicated by the discounted dividend payouts. A standard pricing
equation in finance literature is the Dividend Discount Model proposed in Gordon (1959)
theoretically underpinned in "The Theory of Investment Value" by John Burr Williams in
1938.
Revisiting the valuation of securities, the dividend payout forms the numerator of the
equation while the denominator is the discount rate. The discount rate is affected by the
interest rate and inflation in the economy alongwith the policy measures the regulators take
into account. This brings us to our key study area; since the pricing of equity is impacted by
macroeconomic variables, do they impact in similar manner to conventional and Islamic
equities.
Several studies have focused on inquiring the validity of macroeconomic
fundamentals on equity prices. Fama (1990), Barro (1990), and Schwert (1990) among
others, found strong short-run correlations between the two variables for the United States
(US) and amongst these variables and other financial variables. Significant number of studies
have also been undertaken for several major international stock markets (e.g., Cheung and
Ng, 1998; Chung et al., 1998), documenting the same positive linkage between stock returns
and real (aggregate) economic activity.
A plethora of literature exists raising questions on the validity of macroeconomic
fundamentals as the predictors of equity prices and returns. Carlson and Sargent (1997) and
Shiller (2005) argue that in US most of the rise in equity prices during the second part of the
1990s cannot be attributed to fundamental values such as projected earnings growth or
dividends but to exogenous shocks and/or irrational market behavior. Along the same lines
Lee (1995, 1998) and Chung and Lee (1998) report that fundamental variables like discount
rates, earnings, dividends and industrial production did not explain price movements. More
recent evidences of violation of the inter-linkage between stock returns and real economic
activities are chronicled in the studies by Binswanger (2000, 2001, 2004) and Laopodis
(2006), who found no consistent economic behavior and argue that stock prices may be
affected owing to stock markets bubbles and irrational behavior in the markets. Moreover, a
series of recent financial crises including 2008 global financial crisis again challenged the
nexus between macroeconomic fundamentals and equity prices. Equity markets in majority of
the developed and some developing countriesexperienced a sharp downturn believed to have
been triggered by excessive speculation and amplified by the higher level of economic
integration during the recent financial crisis.
Quite a few studies have been undertaken to understand the conflicting findings in
recent literature on equity prices/returns and macroeconomic fundamentals; however there
are very few studies observing this relationship in the context of Islamic equity markets. The
current trend of Islamic finance’s move towards the global markets, especially expansion
from a merely banking-based industry into a wider spectrum of financial market-based
instruments, has made Islamic capital markets, the fastest growing sector in the Islamic
finance industry. Such an important question as to whether Shariah-compliant (i.e. Islamic
law compliant) equities have similar risk-return profile relative to those of conventional
counterparts remains unclear. This is solely due to the role of Shariah (Islamic) rules, which
3
have distinguished between halal (lawful) and haram (unlawful), resulting in the unique
characteristics of Islamic equities Derigs & Marzban, (2008). The qualitative Shariah
screening excludes firms with any non-compliant activity (i.e. liquor, gambling, interest-
based financial institutions, etc.) while the quantitative Shariah screening strictly imposes the
zero interest-based leverage. Since only a small number of today’s listed firms fit into this
requirement, thus some certain degree of tolerance is required6. As a result, the filtering
criteria will take out the large non-compliant firms from the pool of investable equities,
leaving the remaining Shari’ah compliant firms available to become smaller and portray more
volatile returns (Hussein &Omran, 2005). In other words, the lower leverage, smaller size of
firms, and under-diversification of the market, will be the main distinctive features that
potentially lead Islamic stocks to behave differently compared to the conventional
counterparts.
To the best of our knowledge, the existing literature lacks is any rigorous empirical
study focused on comparing the Islamic vis-à-vis conventional equity indices with regard to
the impact of key macroeconomic variables on the stock price. Therefore, this study sets out
to perform a comparative analysis by examining the relationship between major
macroeconomic fundamentals (industrial production, money supply and consumer price
index) and equity prices (both Islamic and conventional). The main contribution of the study
is to observe this inter-linkage by using a large number of countries in order to obtain a wide
coverage. We use a panel data of 37 countries, both developed and emerging countries, with
monthly observations from January 2008 till December 2011. Since it is only MSCI which
have Islamic equity indices that comprise a large number of countries, hence the relatively
short numbers of years are used taking into account the limited availability of the length of
observations for these indices. Moreover, the study investigates the influence of changes in
macroeconomic fundamentals on (i) Shariah compliant equities and (ii) mainstream equities
in (i) developed, (ii) emerging, and (iii) whole countries. As to the methodology, we apply
Panel unit root, cointegration, while the estimation will use the dynamic heterogeneous panel
techniques that allows coefficients to vary across different individual groups.
The paper is organized as follows. Section 2 presents some literature reviews
associated with the macroeconomic impacts as well as the issue of Islamic equity markets.
Section 3 presents the data and methodology. Section 4, presents and discusses the empirical
results, while Section 5 provides conclusions and policy implications.
2. Literature review
2.1. The impact of macroeconomic variables
The seminal work of Fama (1990) investigated the extent to which changes in future
cash flows and discount rates explain variations in stock returns in the US market. Other
significant studies on the same issue for several international markets was undertaken by
Barro (1990), Schwert (1990), Cheung and Ng (1998) and Chung et al (1998). Recently,
Jangkoo et al (2011) developed a conditional version of the consumption capital asset pricing
model (CCAPM) using the conditioning variable from the cointegrated macroeconomic
variables such as dividend yield, term spread, default spread, and short-term interest rate. The
study used quarterly data starting from 1963:Q3 to 2005:Q4. Findings of the study suggest
6(i) a company’s debt financing is not more than 33 percent of its capital, (ii) interest-related income of a
company is not more than 10 percent of its total income, (iii) the composition of account receivables and liquid
assets (cash at banks and marketable securities) compared to total assets is minimum at 51 percent while a few
cite 33 percent as an acceptable ratio.
4
that conditioning variable has a strong power to predict market excess returns in the presence
of competing predictive variables.
If the stock is efficiently priced, both cash flows of a firm and the discount rate will
theoretically be dependent on the macroeconomic fundamentals over time. Therefore,
empirically testing linkages between equity prices and macroeconomic fundamentals is one
of the major areas of interest in finance literature. Many studies have investigated the impact
of key macroeconomic variables on stock prices. Laopodis (2006) investigated the dynamic
linkages among stock prices, interest rates, inflation, and economic activity for the United
States since the 1970s. Analysis of this study indicates absence of dynamic nexus between
real economic activity and stock prices across different monetary regimes during the last
thirty years. In another study, Pesaran and Timmermann (1995) investigated the robustness of
the evidence on predictability of US stock returns and addressed the issue of whether this
predictability could have been historically exploited by investors to earn profits in excess of a
buy-and-hold strategy in the market index. The research used monthly data (of stock price,
annualized dividends and earnings, 1-month T-bill rate, Inflation rate, change in industrial
production, excess return on stocks) from 1954:M1 to 1992:M12 and found that the
predictive power of various economic factors over stock returns changes through time and
tends to vary with the volatility of returns.
Recalling the importance of economic integration, the impact of cross-country
macroeconomic variables on stock price in respective country has been observed in literature.
Verma and Ozuna (2005) examined the responsiveness of Latin American Stock markets to
movements to changes in cross-country macroeconomic variables. The study used monthly
data of stock price, money supply, consumer price index, interest rates and exchange rates of
four Latin American countries such as Mexico, Argentina, Brazil and Chile. They found the
presence of Mexican stock market’s influence on Latin American stock markets and found
little evidence that Latin American stock markets are responsive to these changes. Yang et al
(2009) studied the time-varying stock–bond correlation over macroeconomic conditions (the
business cycle, the inflation environment and monetary policy stance) by applying a class of
bivariate AR(1)–GARCH (1,1) models for conditional correlations between stock and bond
premiums. Results of the study came up with different patterns of time variation in stock–
bond correlations over the business cycle between US and UK. The study, furthermore,
argued that higher stock–bond correlations tend to follow higher short rates and (to a lesser
extent) higher inflation rates.
Some studies have been undertaken specifically for key developed countries. By using
monthly data from 1990:01 to 2009:12, Nikiforos (2011) studied the dynamic linkages
between equity price and major macroeconomic indicators of France, Germany, Italy, UK,
and the US. Applying rolling cointegration and VAR approaches, the study revealed different
ways of responsiveness of stock prices to changes in macroeconomic fundamentals. Results
of the study suggested that stock markets move more independently in the long run
particularly in the post-euro period. For instance, equity prices were not much stimulated by
industrial production or interest rates. Furthermore, the study found that European consumers
are more concerned about the general economic conditions and personal financial situations
rather than inflationary pressures in both pre- and post-Euro sub-periods.
While analyzing the impact of macroeconomic news on stock returns, Briz and John
(2011) have investigated how stock returns are responsive to newspaper stories about the
releases of new macroeconomic information in the economy. Results of the study indicated
that newspaper interpretation of the GDP news does affect stock returns. As to the impact of
consumer price index, Suk-Joong et al (2004) investigated the impact of scheduled
government announcements of six different macroeconomic variables (nominal foreign
international trade balance, gross domestic product, unemployment rate, retail sales growth,
5
consumer price index and producer price index) on the risk and return of three major US
financial markets (stock, bond and foreign exchange markets). Using GARCH modeling,
results of the study suggested that these markets do not respond in any meaningful way to the
act of releasing information by the government rather the ‘news’ content of these
announcements cause the market to react. News related to the internal economy was found to
be important for the bond market and stock market is more influenced by the consumer and
producer price information release. Nikkihen and Sahlstrom (2004) studied the impact of the
scheduled Federal Open Market Committee (FOMC) meetings and the scheduled
macroeconomic news releases on stock market uncertainty by employing regression and
GARCH approaches. The study used monthly reports of employment, CPI and PPI, and
FOMC meeting days on the US market covering the period from January 1996 to December
2000. Results suggested that the employment report has the largest impact on stock price
uncertainty, whereas, investors regard the information content of the PPI and CPI together as
significant.
2.2. Empirical studies in Islamic equity indices
There have been a number of empirical studies that compare Islamic assets to their
conventional counterparts. Al-Zoubi & Maghyereh (2007), applying Risk Matrices, Student-t
APARCH and skewed Student-t APARCH, show that the DJIM (Dow Jones Islamic Market
index) is less risky than its respective benchmark. Another study focuses on bubble formation
by applying duration dependence tests of survival analysis, and find none of the evidence of
speculative bubbles for weekly and monthly returns of AMANX, AMAGX and DJIMI
(Hassan & Tag El-Din, 2005).
Apart from asset pricing model, Hakim & Rashidian (2002) use CAPM and find that
the DJIMI performs well as compared to the Dow Jones World Index (DJW), but
underperforms the Dow Jones Sustainability World Index (DJS). By capturing the effects of
industry, size, economic conditions, and performance measures, some studies also show that
Islamic indices outperform during bull period while underperform during bear period, with
the reasons of investing in growth and small-cap firms (Hussein 2004, 2005; Girard &
Hassan, 2005).
Other studies have focused on mutual funds’ performance, and find that Islamic funds
perform averagely similar to other conventional counterparts, and even are subject to multiple
regimes (Hassan, Antoniou & Paudyal, 2005; Elfakhani, Hassan & Sidani, 2005; Hassan &
Antoniou, 2006; Abdullah, Hassan, & Mohamad, 2007). Hoepner, Rammal, & Rezec (2011)
find that Islamic funds from Malaysia or GCC neither significantly underperform their
respective benchmarks nor are significantly affected by small-size stocks.
To the best of our knowledge, what is lacking in the existing literature is any rigorous
empirical study focused on comparing the Islamic vis-à-vis conventional equity indices with
regard to the impact of key macroeconomic variables on the stock price. Therefore, our paper
is the first study using a panel data of 37 countries, both developed and emerging countries.
3. Data and methodology
We use monthly data of Islamic and conventional stock indices of 37 countries. The
data is collected from MSCI equity indices. The observations consist of monthly data
extending over four years starting with January 2008 due to the availability of MSCI Islamic
indices that cover all countries of our interest.
On the other hand, the key macroeconomic variables include real production index,
real money supply, consumer price index and short-term interest rate. We take M1 and 3-

6
month interbank middle rate as a proxy for money supply and short-term interest rate. This
allows us to obtain a standard measure across all countries since we cannot get M2 as well as
3-month T-bill rate for some countries. All dataset are collected from Datastream. We
classify the developed and emerging countries according to IMF criteria (see Table 1).
Developed Countries Emerging Countries
1 Australia Argentina
2 Belgium Brazil
3 Canada Chile
4 Denmark China
5 Finland Colombia
6 France Czech
7 Germany Egypt
8 Greece Hungary
9 Ireland India
10 Italy Indonesia
11 Japan Malaysia
12 Netherlands Peru
13 Norway Philippines
14 Singapore Poland
15 Spain Russia
16 Sweden South Africa
17 Taiwan South Korea
18 UK Turkey
19 USA
Table 1: List of Countries in the Sample
3.1. Panel Unit Root tests
Panel unit root tests are performed in order to investigate stationarity of data in panel
format. LL (1993) proposed a panel based ADF test that restricts parameters 𝛾𝑖 by keeping
them identical across cross sectional regions as follows:
, where t = 1…….,T time periods and i = 1……..,N members of the panel. LL tests the
null hypothesis of 𝛾𝑖 = 𝛾 = 0 for all i, against the alternative of 𝛾1 = 𝛾2 …… . . = 𝛾 < 0 for
all i. The shortcoming of this test is that 𝛾 is restricted by being kept identical across regions
under the null and alternative hypothesis.
In order to overcome the shortcomings of the LL test, IPS (1997) relaxed the assumption of
the identical first-order autoregressive coefficients of the LL test and allow 𝛾 to vary across
regions under the alternative hypothesis. IPS test the null hypothesis of 𝛾𝑖 = 0 for all 𝑖, against the alternative of 𝛾𝑖 < 0 for all 𝑖. The IPS test is based on the mean-group approach,
which uses the average 𝑡𝛾𝑖statistics to perform the following 𝑍 statistic:
variance of each 𝑡𝛾𝑖
statistic, and they are generated by simulations and are tabulated
in IPS (1997). The 𝑍 converges to a standard normal distribution. Based on the Monte Carlo
7
experiment results, IPS demonstrates that their test has more favorable finite sample
properties than the LL test.
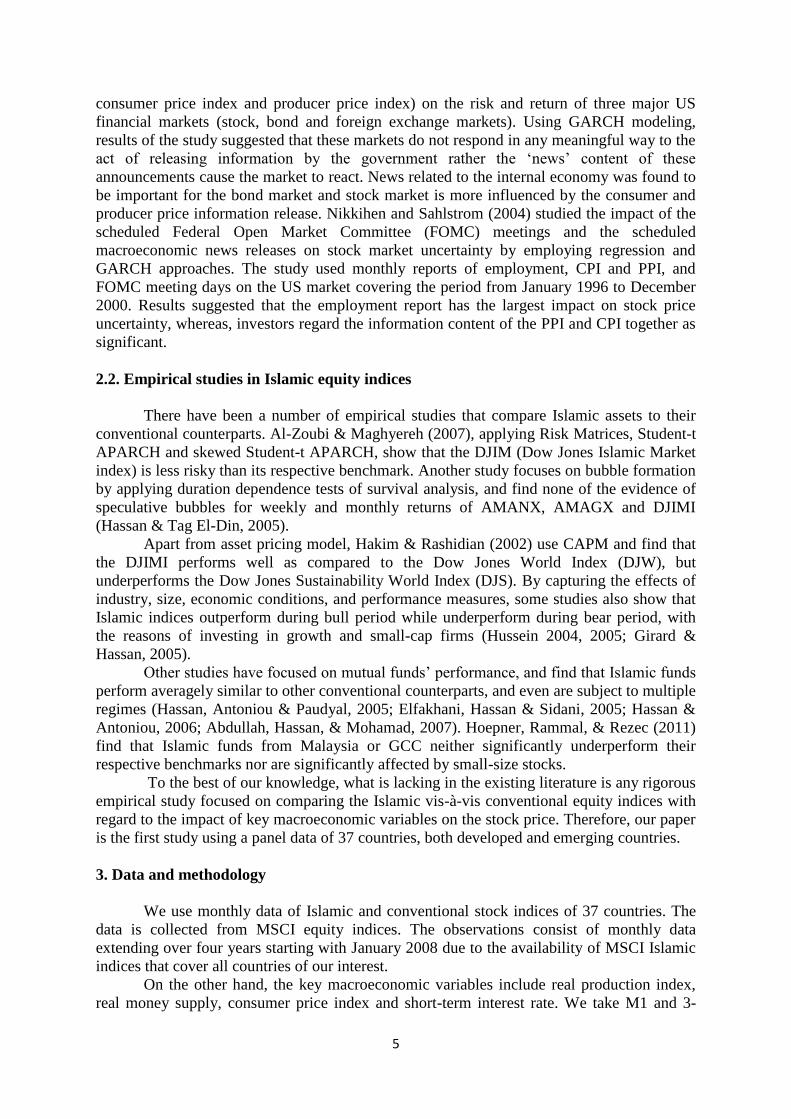
Hadri (2000) argues differently that the null should be reversed to be the stationary
hypothesis in order to have a stronger power test. His Lagrange multiplier (LM) statistic can
be written as below:
, where 𝜎 휀2 is the consistent Newey and West (1987) estimate of the long-run variance
of disturbance terms.
3.2. Panel Cointegration tests
Perdroni (1999) considers the following time series panel regression:
where 𝑦𝑖𝑡 and 𝑋𝑖𝑡 are the observable variables with dimension of 𝑁∗𝑇 × 1 and 𝑁∗𝑇 × 𝑚 , respectively. He develops asymptotic and finite sample properties of testing
statistics to examine the null hypothesis of non-cointegration in the panel. The test allow for
heterogeneity among individual members of the panel, including heterogeneity in both long-
run cointegrating vectors and in the dynamics, since there is no reason to believe that all
parameters are the same across countries.
Pedroni suggested two types of tests. The first type is based on the within dimension
approach, which includes four statistics. They are panel ʋ-statistic, panel 𝜌 statistic, panel PP-
statistic, and panel ADF-statistic. These statistics pool the autoregressive coefficients across
different members for the unit root tests on the estimated residuals. The second test by
Pedroni is based on the between-dimension approach, which includes three statistics. They
are group 𝜌-statistic, group PP-statistic, and group ADF-statistic. These statistics are based on
estimators that simply average the individually estimated coefficients for each member.
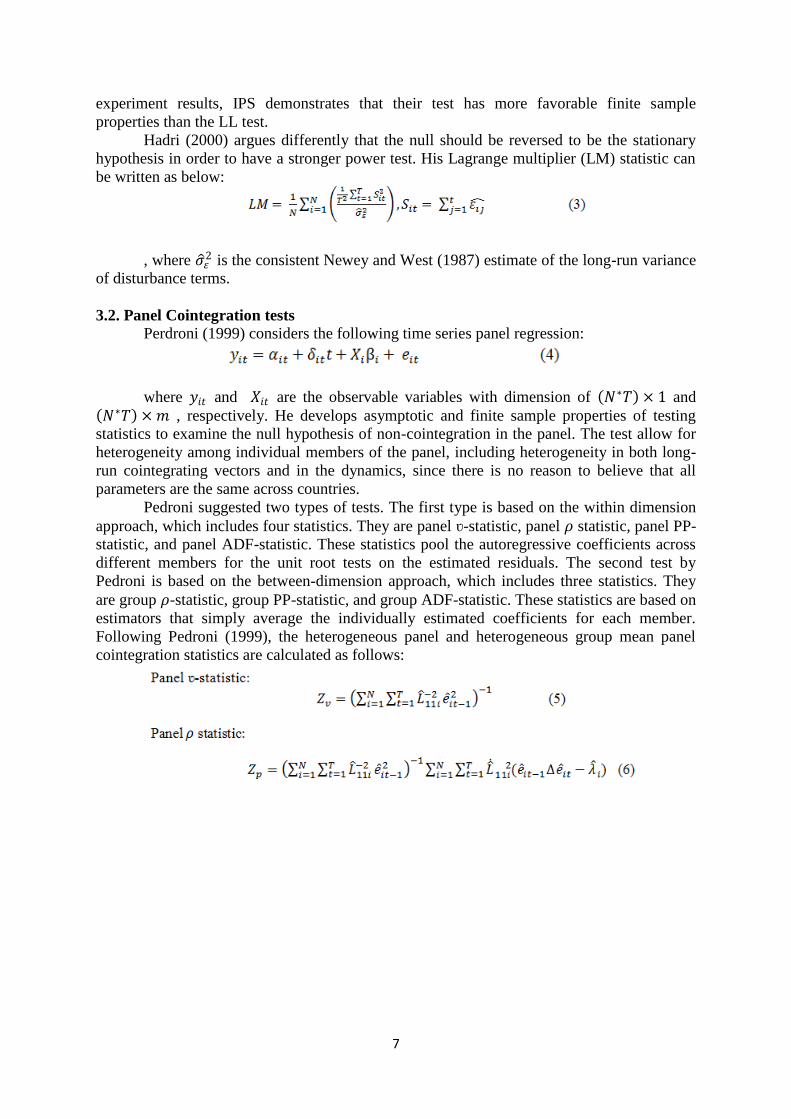
Following Pedroni (1999), the heterogeneous panel and heterogeneous group mean panel
cointegration statistics are calculated as follows:
8
Here, 𝑒 𝑖𝑡 is the estimated residual from equation (4) and 𝐿 11𝑖2 is the estimated long run
covariance matrix for ∆𝑒 𝑖𝑡 . Similarly, 𝜎 𝑖2 and 𝑠 𝑖
2 𝑠 𝑖∗2 are, respectively, the long-run and
contemporaneous variances for individual 𝑖. The other terms are properly defined in Pedroni
(1999) with the appropriate lag length determined by the Newey-West method. All seven
tests are distributed as being standard normal asymptotically. This requires a standardization
based on the moments of the underlying Brownian motion function. The panel v-statistic is a
one-sided test where large positive values reject the null of no Cointegration. The remaining
statistics diverge to negative infinitely, which means that large negative values reject the null.
The critical values are also tabulated by Pedroni (1999).
3.3. The MG and PMG estimators Assume an autoregressive distributive lag (ARDL) (p; q1…. qk) dynamic panel
specification of the form
where the number of groups i = 1; 2; : : : ;N; the number of periods t = 1; 2; : : : ; T;
Xit is a k 1 vector of explanatory variables; 𝛿𝑖𝑡 are the k*1 coefficient vectors; 𝜆𝑖𝑗 are
scalars; and 𝜇𝑖 is the group-specific effect. T must be large enough such that the model can be
fitted for each group separately. Time trends and other fixed regressors may be included.
If the variables in (1) are, for example, I(1) and cointegrated, then the error term is an I(0)
process for all i. A principal feature of cointegrated variables is their responsiveness to any
deviation from long-run equilibrium. This feature implies an error correction model in which
the short-run dynamics of the variables in the system are influenced by the deviation from
equilibrium. Thus it is common to reparameterize (1) into the error correction equation.
9
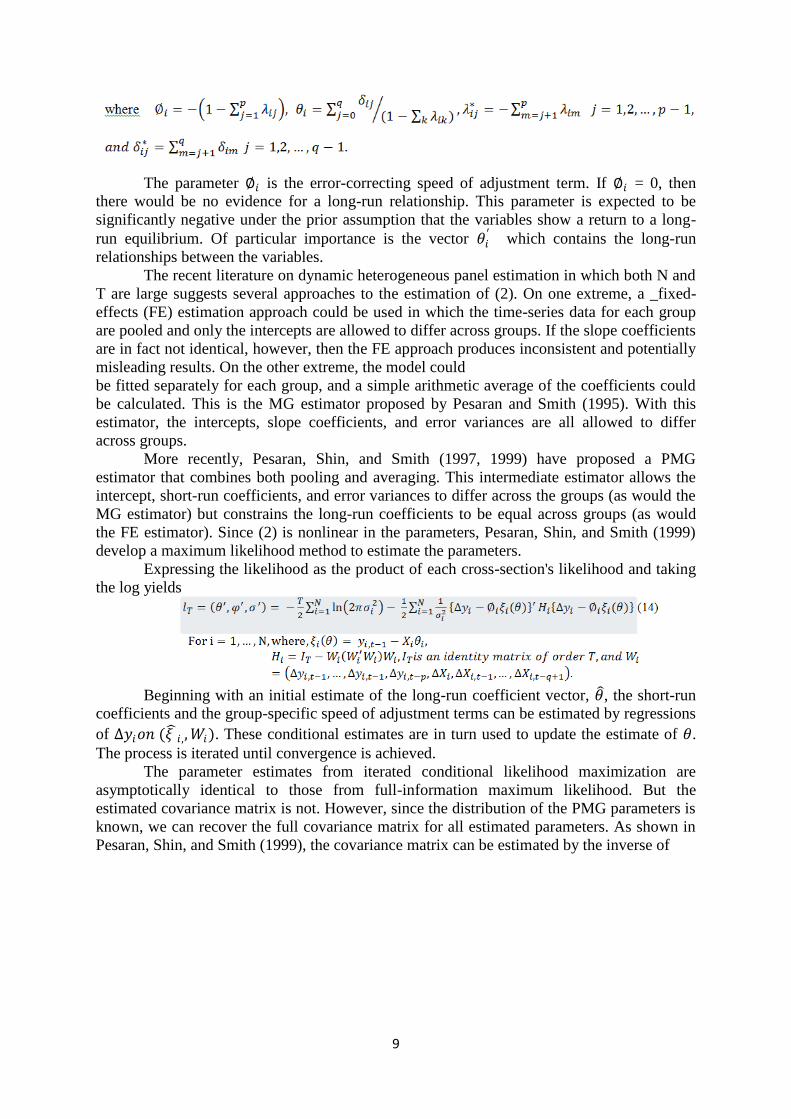
The parameter ∅𝑖 is the error-correcting speed of adjustment term. If ∅𝑖 = 0, then
there would be no evidence for a long-run relationship. This parameter is expected to be
significantly negative under the prior assumption that the variables show a return to a long-
run equilibrium. Of particular importance is the vector 𝜃𝑖′ which contains the long-run
relationships between the variables.
The recent literature on dynamic heterogeneous panel estimation in which both N and
T are large suggests several approaches to the estimation of (2). On one extreme, a _fixed-
effects (FE) estimation approach could be used in which the time-series data for each group
are pooled and only the intercepts are allowed to differ across groups. If the slope coefficients
are in fact not identical, however, then the FE approach produces inconsistent and potentially
misleading results. On the other extreme, the model could
be fitted separately for each group, and a simple arithmetic average of the coefficients could
be calculated. This is the MG estimator proposed by Pesaran and Smith (1995). With this
estimator, the intercepts, slope coefficients, and error variances are all allowed to differ
across groups.
More recently, Pesaran, Shin, and Smith (1997, 1999) have proposed a PMG
estimator that combines both pooling and averaging. This intermediate estimator allows the
intercept, short-run coefficients, and error variances to differ across the groups (as would the
MG estimator) but constrains the long-run coefficients to be equal across groups (as would
the FE estimator). Since (2) is nonlinear in the parameters, Pesaran, Shin, and Smith (1999)
develop a maximum likelihood method to estimate the parameters.
Expressing the likelihood as the product of each cross-section's likelihood and taking
the log yields
Beginning with an initial estimate of the long-run coefficient vector, 𝜃 , the short-run
coefficients and the group-specific speed of adjustment terms can be estimated by regressions
of ∆𝑦𝑖𝑜𝑛 (𝜉 𝑖 ,, 𝑊𝑖). These conditional estimates are in turn used to update the estimate of 𝜃.
The process is iterated until convergence is achieved.
The parameter estimates from iterated conditional likelihood maximization are
asymptotically identical to those from full-information maximum likelihood. But the
estimated covariance matrix is not. However, since the distribution of the PMG parameters is
known, we can recover the full covariance matrix for all estimated parameters. As shown in
Pesaran, Shin, and Smith (1999), the covariance matrix can be estimated by the inverse of

10
The MG parameters are simply the un-weighted means of the individual coefficients.
For example, the MG estimate of the error correction coefficient, 𝜙, is
The mean and variance of other short-run coefficients are similarly estimated.
3.4. The Hausman test
We perform Hausman test to make a choice between the PMG and MG approaches.
Hausman (1978) assumes that there are two estimators 𝛽 0 and 𝛽 1 of the parameter vector 𝛽
and he added two hypothesis testing procedures. We test null hypothesis (H0), where PMG
are consistent and efficient against alternative hypothesis (H1), where PMG are inconsistent
(as the MG are always consistent). Hausman test uses the following test statistic:
The difference between the estimates is significant if the value of the statistic is large.
Accordingly, we reject the null hypothesis that the PMG model is consistent and we use the
MG estimators. In contrast, a small value of the Hausman statistic indicates that the PMG
estimator is more appropriate.
4. Empirical results
Our empirical study performs a comparative analysis in different models of estimation
according to different group of countries. As both pooled mean group and mean group
estimators involve the long-run equilibrium relationship, the variables cannot be consistently
estimated when all the single variables have unit roots or are non-stationary of order one,
unless the variables in the long-run relationship are co-integrated. Hence we need to perform
panel unit roots test for all the variables and test whether co-integrating equilibrium
relationship between variables exist.
We split the samples into six different models. Panel I and II will observe the impact
of macroeconomic determinants on the Islamic and conventional stock indices for all our
sample countries, respectively. While Panel III and IV use the samples of the developed
11
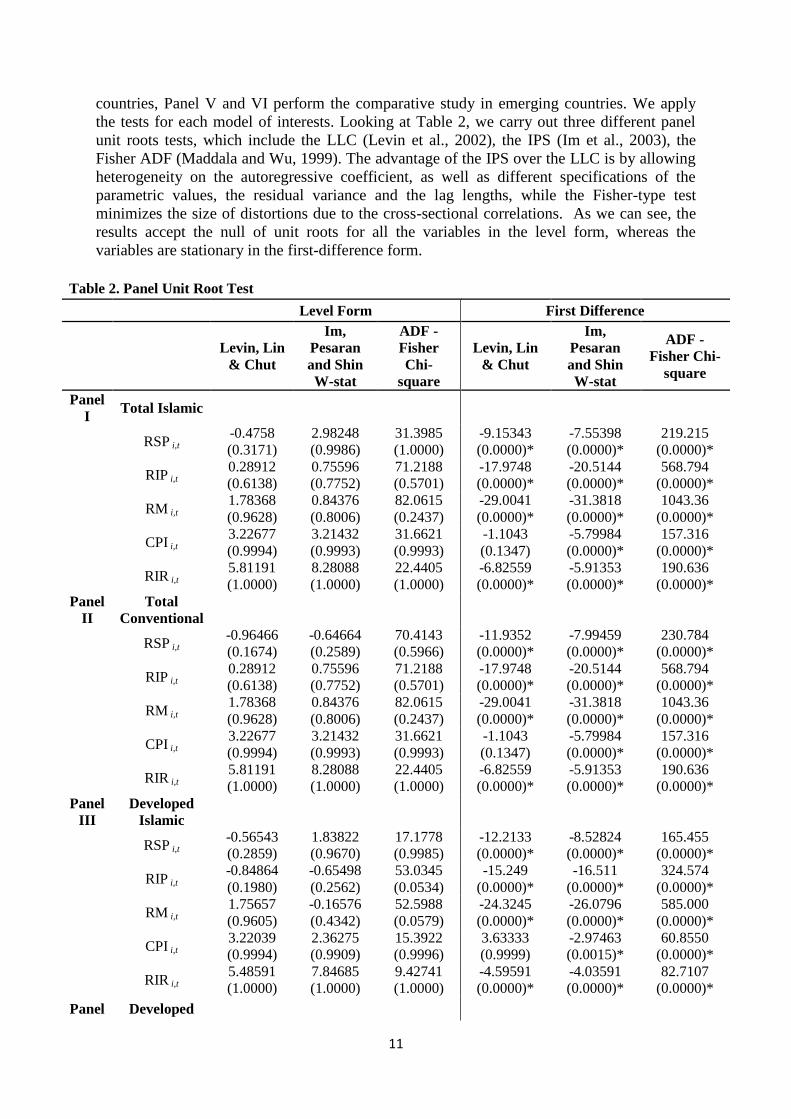
countries, Panel V and VI perform the comparative study in emerging countries. We apply
the tests for each model of interests. Looking at Table 2, we carry out three different panel
unit roots tests, which include the LLC (Levin et al., 2002), the IPS (Im et al., 2003), the
Fisher ADF (Maddala and Wu, 1999). The advantage of the IPS over the LLC is by allowing
heterogeneity on the autoregressive coefficient, as well as different specifications of the
parametric values, the residual variance and the lag lengths, while the Fisher-type test
minimizes the size of distortions due to the cross-sectional correlations. As we can see, the
results accept the null of unit roots for all the variables in the level form, whereas the
variables are stationary in the first-difference form.
Table 2. Panel Unit Root Test
Level Form First Difference
Levin, Lin
& Chut
Im,
Pesaran
and Shin
W-stat
ADF -
Fisher
Chi-
square
Levin, Lin
& Chut
Im,
Pesaran
and Shin
W-stat
ADF -
Fisher Chi-
square
Panel
I Total Islamic
RSP i,t
-0.4758
(0.3171)
2.98248
(0.9986)
31.3985
(1.0000)
-9.15343
(0.0000)*
-7.55398
(0.0000)*
219.215
(0.0000)*
RIP i,t
0.28912
(0.6138)
0.75596
(0.7752)
71.2188
(0.5701)
-17.9748
(0.0000)*
-20.5144
(0.0000)*
568.794
(0.0000)*
RM i,t
1.78368
(0.9628)
0.84376
(0.8006)
82.0615
(0.2437)
-29.0041
(0.0000)*
-31.3818
(0.0000)*
1043.36
(0.0000)*
CPI i,t
3.22677
(0.9994)
3.21432
(0.9993)
31.6621
(0.9993)
-1.1043
(0.1347)
-5.79984
(0.0000)*
157.316
(0.0000)*
RIR i,t
5.81191
(1.0000)
8.28088
(1.0000)
22.4405
(1.0000)
-6.82559
(0.0000)*
-5.91353
(0.0000)*
190.636
(0.0000)*
Panel
II
Total
Conventional
RSP i,t
-0.96466
(0.1674)
-0.64664
(0.2589)
70.4143
(0.5966)
-11.9352
(0.0000)*
-7.99459
(0.0000)*
230.784
(0.0000)*
RIP i,t
0.28912
(0.6138)
0.75596
(0.7752)
71.2188
(0.5701)
-17.9748
(0.0000)*
-20.5144
(0.0000)*
568.794
(0.0000)*
RM i,t
1.78368
(0.9628)
0.84376
(0.8006)
82.0615
(0.2437)
-29.0041
(0.0000)*
-31.3818
(0.0000)*
1043.36
(0.0000)*
CPI i,t
3.22677
(0.9994)
3.21432
(0.9993)
31.6621
(0.9993)
-1.1043
(0.1347)
-5.79984
(0.0000)*
157.316
(0.0000)*
RIR i,t
5.81191
(1.0000)
8.28088
(1.0000)
22.4405
(1.0000)
-6.82559
(0.0000)*
-5.91353
(0.0000)*
190.636
(0.0000)*
Panel
III
Developed
Islamic
RSP i,t
-0.56543
(0.2859)
1.83822
(0.9670)
17.1778
(0.9985)
-12.2133
(0.0000)*
-8.52824
(0.0000)*
165.455
(0.0000)*
RIP i,t
-0.84864
(0.1980)
-0.65498
(0.2562)
53.0345
(0.0534)
-15.249
(0.0000)*
-16.511
(0.0000)*
324.574
(0.0000)*
RM i,t
1.75657
(0.9605)
-0.16576
(0.4342)
52.5988
(0.0579)
-24.3245
(0.0000)*
-26.0796
(0.0000)*
585.000
(0.0000)*
CPI i,t
3.22039
(0.9994)
2.36275
(0.9909)
15.3922
(0.9996)
3.63333
(0.9999)
-2.97463
(0.0015)*
60.8550
(0.0000)*
RIR i,t
5.48591
(1.0000)
7.84685
(1.0000)
9.42741
(1.0000)
-4.59591
(0.0000)*
-4.03591
(0.0000)*
82.7107
(0.0000)*
Panel Developed
12
IV Conventional
RSP i,t
-0.65902
(0.2549)
2.48411
(0.9935)
13.1906
(0.9999)
-4.47741
(0.0000)*
-2.98338
(0.0000)*
86.1954
(0.0000)*
RIP i,t
-0.84864
(0.1980)
-0.65498
(0.2562)
53.0345
(0.0534)
-15.249
(0.0000)*
-16.511
(0.0000)*
324.574
(0.0000)*
RM i,t
1.75657
(0.9605)
-0.16576
(0.4342)
52.5988
(0.0579)
-24.3245
(0.0000)*
-26.0796
(0.0000)*
585.000
(0.0000)*
CPI i,t
3.22039
(0.9994)
2.36275
(0.9909)
15.3922
(0.9996)
3.63333
(0.9999)
-2.97463
(0.0015)*
60.8550
(0.0000)*
RIR i,t
5.48591
(1.0000)
7.84685
(1.0000)
9.42741
(1.0000)
-4.59591
(0.0000)*
-4.03591
(0.0000)*
82.7107
(0.0000)*
Panel
V
Emerging
Islamic
RSP i,t
0.01299
(0.5052)
2.38635
(0.9915)
14.2207
(0.9996)
-3.78594
(0.0001)*
-2.7741
(0.0028)*
65.3281
(0.0020)*
RIP i,t
1.52998
(0.9370)
1.75420
(0.9603)
18.1843
(0.9941)
-10.1281
(0.0000)*
-12.4878
(0.0000)*
244.220
(0.0000)*
RM i,t
0.88196
(0.8111)
1.38046
(0.9163)
29.4627
(0.7712)
-16.4616
(0.0000)*
-18.352
(0.0000)*
458.358
(0.0000)*
CPI i,t
1.42250
(0.9226)
2.18094
(0.9854)
16.2699
(0.9981)
-4.67547
(0.0000)*
-5.25677
(0.0000)*
96.4609
(0.0000)*
RIR i,t
2.31262
(0.9896)
3.81361
(0.9999)
13.0131
(0.9998)
-5.54588
(0.0000)*
-4.32608
(0.0000)*
107.925
(0.0000)*
Panel
VI
Emerging
Conventional
RSP i,t
-0.33468
(0.3689)
2.27054
(0.9884)
14.7304
(0.9994)
-2.89265
(0.0019)*
-2.45545
(0.0070)*
65.63
(0.0018)*
RIP i,t
1.52998
(0.9370)
1.75420
(0.9603)
18.1843
(0.9941)
-10.1281
(0.0000)*
-12.4878
(0.0000)*
244.220
(0.0000)*
RM i,t
0.88196
(0.8111)
1.38046
(0.9163)
29.4627
(0.7712)
-16.4616
(0.0000)*
-18.352
(0.0000)*
458.358
(0.0000)*
CPI i,t
1.42250
(0.9226)
2.18094
(0.9854)
16.2699
(0.9981)
-4.67547
(0.0000)*
-5.25677
(0.0000)*
96.4609
(0.0000)*
RIR i,t
2.31262
(0.9896)
3.81361
(0.9999)
13.0131
(0.9998)
-5.54588
(0.0000)*
-4.32608
(0.0000)*
107.925
(0.0000)*
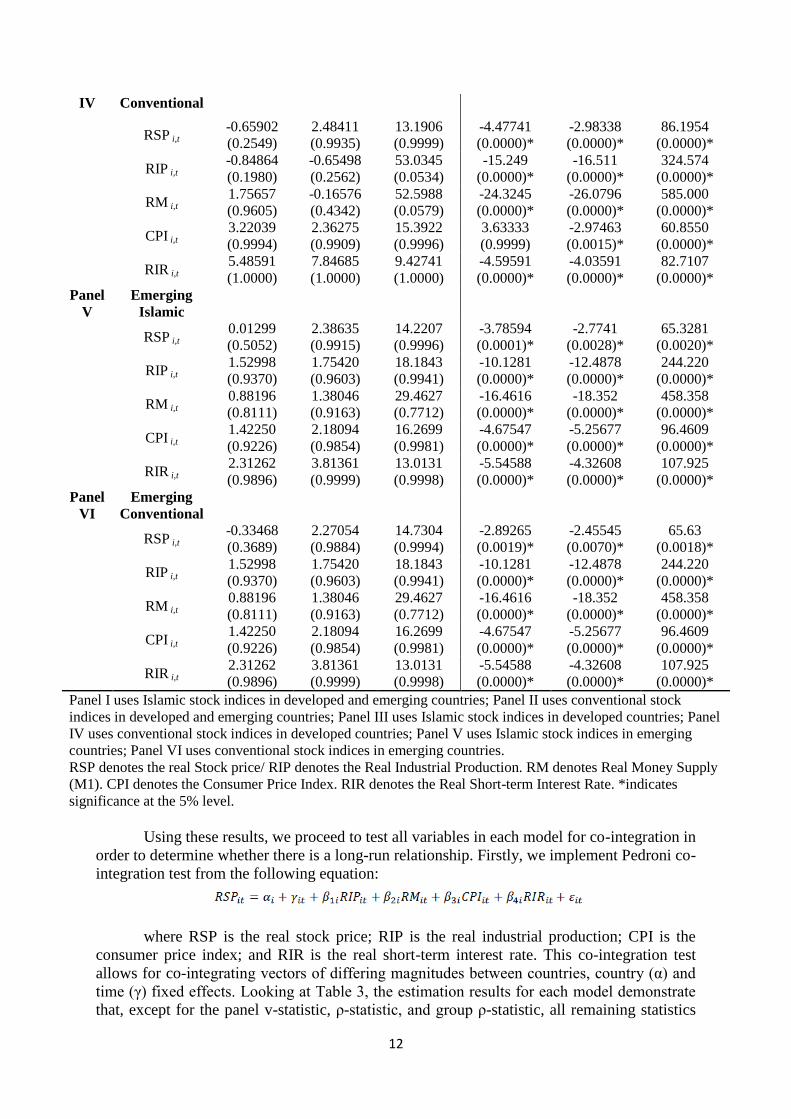
Panel I uses Islamic stock indices in developed and emerging countries; Panel II uses conventional stock
indices in developed and emerging countries; Panel III uses Islamic stock indices in developed countries; Panel
IV uses conventional stock indices in developed countries; Panel V uses Islamic stock indices in emerging
countries; Panel VI uses conventional stock indices in emerging countries.
RSP denotes the real Stock price/ RIP denotes the Real Industrial Production. RM denotes Real Money Supply
(M1). CPI denotes the Consumer Price Index. RIR denotes the Real Short-term Interest Rate. *indicates
significance at the 5% level.
Using these results, we proceed to test all variables in each model for co-integration in
order to determine whether there is a long-run relationship. Firstly, we implement Pedroni co-
integration test from the following equation:
where RSP is the real stock price; RIP is the real industrial production; CPI is the
consumer price index; and RIR is the real short-term interest rate. This co-integration test
allows for co-integrating vectors of differing magnitudes between countries, country (α) and
time (γ) fixed effects. Looking at Table 3, the estimation results for each model demonstrate
that, except for the panel v-statistic, ρ-statistic, and group ρ-statistic, all remaining statistics
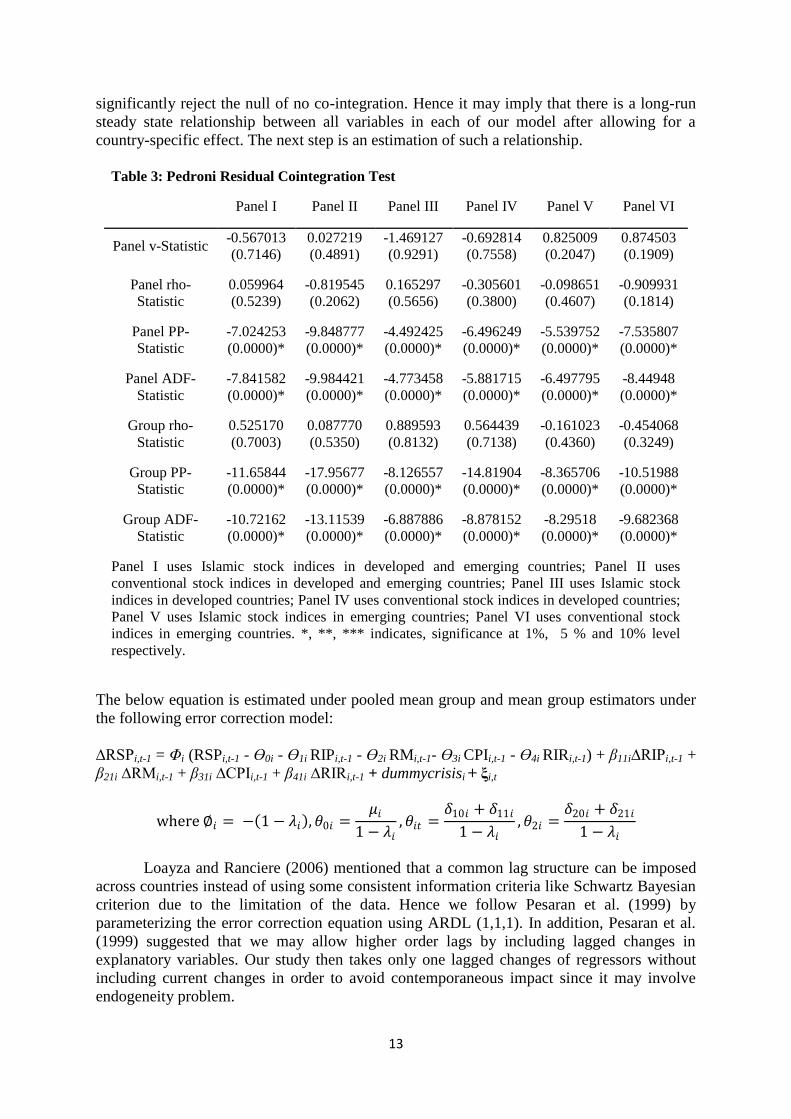
13
significantly reject the null of no co-integration. Hence it may imply that there is a long-run
steady state relationship between all variables in each of our model after allowing for a
country-specific effect. The next step is an estimation of such a relationship.
Table 3: Pedroni Residual Cointegration Test
Panel I Panel II Panel III Panel IV Panel V Panel VI
Panel v-Statistic -0.567013
(0.7146)
0.027219
(0.4891)
-1.469127
(0.9291)
-0.692814
(0.7558)
0.825009
(0.2047)
0.874503
(0.1909)
Panel rho-
Statistic
0.059964
(0.5239)
-0.819545
(0.2062)
0.165297
(0.5656)
-0.305601
(0.3800)
-0.098651
(0.4607)
-0.909931
(0.1814)
Panel PP-
Statistic
-7.024253
(0.0000)*
-9.848777
(0.0000)*
-4.492425
(0.0000)*
-6.496249
(0.0000)*
-5.539752
(0.0000)*
-7.535807
(0.0000)*
Panel ADF-
Statistic
-7.841582
(0.0000)*
-9.984421
(0.0000)*
-4.773458
(0.0000)*
-5.881715
(0.0000)*
-6.497795
(0.0000)*
-8.44948
(0.0000)*
Group rho-
Statistic
0.525170
(0.7003)
0.087770
(0.5350)
0.889593
(0.8132)
0.564439
(0.7138)
-0.161023
(0.4360)
-0.454068
(0.3249)
Group PP-
Statistic
-11.65844
(0.0000)*
-17.95677
(0.0000)*
-8.126557
(0.0000)*
-14.81904
(0.0000)*
-8.365706
(0.0000)*
-10.51988
(0.0000)*
Group ADF-
Statistic
-10.72162
(0.0000)*
-13.11539
(0.0000)*
-6.887886
(0.0000)*
-8.878152
(0.0000)*
-8.29518
(0.0000)*
-9.682368
(0.0000)*
Panel I uses Islamic stock indices in developed and emerging countries; Panel II uses
conventional stock indices in developed and emerging countries; Panel III uses Islamic stock
indices in developed countries; Panel IV uses conventional stock indices in developed countries;
Panel V uses Islamic stock indices in emerging countries; Panel VI uses conventional stock
indices in emerging countries. *, **, *** indicates, significance at 1%, 5 % and 10% level
respectively.
The below equation is estimated under pooled mean group and mean group estimators under
the following error correction model:
∆RSPi,t-1 = Φi (RSPi,t-1 - ϴ0i - ϴ1i RIPi,t-1 - ϴ2i RMi,t-1- ϴ3i CPIi,t-1 - ϴ4i RIRi,t-1) + β11i∆RIPi,t-1 +
β21i ∆RMi,t-1 + β31i ∆CPIi,t-1 + β41i ∆RIRi,t-1 + dummycrisisi + ξi,t
where ∅𝑖 = − 1 − 𝜆𝑖 , 𝜃0𝑖 =𝜇𝑖
1 − 𝜆𝑖, 𝜃𝑖𝑡 =
𝛿10𝑖 + 𝛿11𝑖
1 − 𝜆𝑖, 𝜃2𝑖 =
𝛿20𝑖 + 𝛿21𝑖
1 − 𝜆𝑖
Loayza and Ranciere (2006) mentioned that a common lag structure can be imposed
across countries instead of using some consistent information criteria like Schwartz Bayesian
criterion due to the limitation of the data. Hence we follow Pesaran et al. (1999) by
parameterizing the error correction equation using ARDL (1,1,1). In addition, Pesaran et al.
(1999) suggested that we may allow higher order lags by including lagged changes in
explanatory variables. Our study then takes only one lagged changes of regressors without
including current changes in order to avoid contemporaneous impact since it may involve
endogeneity problem.
14
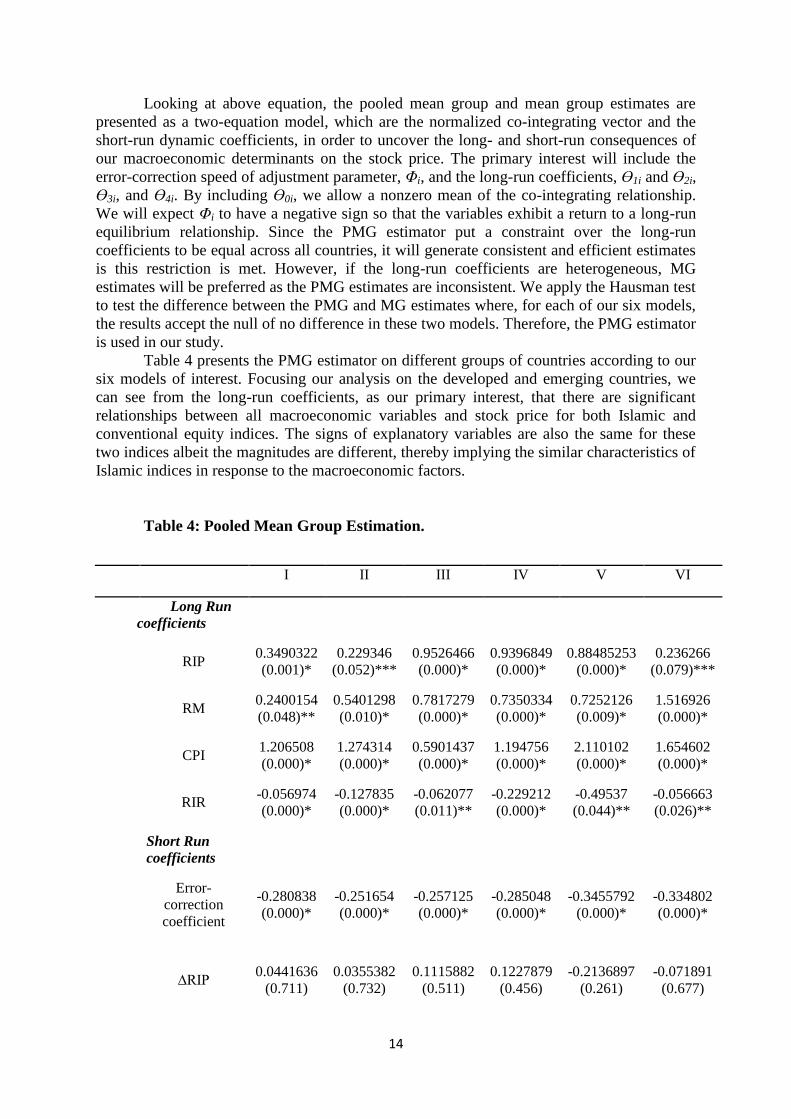
Looking at above equation, the pooled mean group and mean group estimates are
presented as a two-equation model, which are the normalized co-integrating vector and the
short-run dynamic coefficients, in order to uncover the long- and short-run consequences of
our macroeconomic determinants on the stock price. The primary interest will include the
error-correction speed of adjustment parameter, Φi, and the long-run coefficients, ϴ1i and ϴ2i,
ϴ3i, and ϴ4i. By including ϴ0i, we allow a nonzero mean of the co-integrating relationship.
We will expect Φi to have a negative sign so that the variables exhibit a return to a long-run
equilibrium relationship. Since the PMG estimator put a constraint over the long-run
coefficients to be equal across all countries, it will generate consistent and efficient estimates
is this restriction is met. However, if the long-run coefficients are heterogeneous, MG
estimates will be preferred as the PMG estimates are inconsistent. We apply the Hausman test
to test the difference between the PMG and MG estimates where, for each of our six models,
the results accept the null of no difference in these two models. Therefore, the PMG estimator
is used in our study.
Table 4 presents the PMG estimator on different groups of countries according to our
six models of interest. Focusing our analysis on the developed and emerging countries, we
can see from the long-run coefficients, as our primary interest, that there are significant
relationships between all macroeconomic variables and stock price for both Islamic and
conventional equity indices. The signs of explanatory variables are also the same for these
two indices albeit the magnitudes are different, thereby implying the similar characteristics of
Islamic indices in response to the macroeconomic factors.
Table 4: Pooled Mean Group Estimation.
I II III IV V VI
Long Run
coefficients
RIP
0.3490322
(0.001)*
0.229346
(0.052)***
0.9526466
(0.000)*
0.9396849
(0.000)*
0.88485253
(0.000)*
0.236266
(0.079)***
RM
0.2400154
(0.048)**
0.5401298
(0.010)*
0.7817279
(0.000)*
0.7350334
(0.000)*
0.7252126
(0.009)*
1.516926
(0.000)*
CPI
1.206508
(0.000)*
1.274314
(0.000)*
0.5901437
(0.000)*
1.194756
(0.000)*
2.110102
(0.000)*
1.654602
(0.000)*
RIR
-0.056974
(0.000)*
-0.127835
(0.000)*
-0.062077
(0.011)**
-0.229212
(0.000)*
-0.49537
(0.044)**
-0.056663
(0.026)**
Short Run
coefficients
Error-
correction
coefficient
-0.280838
(0.000)*
-0.251654
(0.000)*
-0.257125
(0.000)*
-0.285048
(0.000)*
-0.3455792
(0.000)*
-0.334802
(0.000)*
∆RIP
0.0441636
(0.711)
0.0355382
(0.732)
0.1115882
(0.511)
0.1227879
(0.456)
-0.2136897
(0.261)
-0.071891
(0.677)
15
∆RM
0.0901835
(0.514)
0.1534615
(0.222)
0.1204007
(0.456)
0.1337529
(0.420)
-0.1719584
(0.394)
-0.234000
(0.230)
∆CPI
1.552105
(0.001)*
1.491875
(0.000)*
0.970262
(0.055)***
1.129885
(0.015)**
0.5966971
(0.145)
0.9516804
(0.010)*
∆RIR
0.1591704
(0.014)**
0.1321724
(0.031)**
0.2017334
(0.311)
0.125175
(0.378)
0.0225253
(0.666)
-0.034702
(0.345)
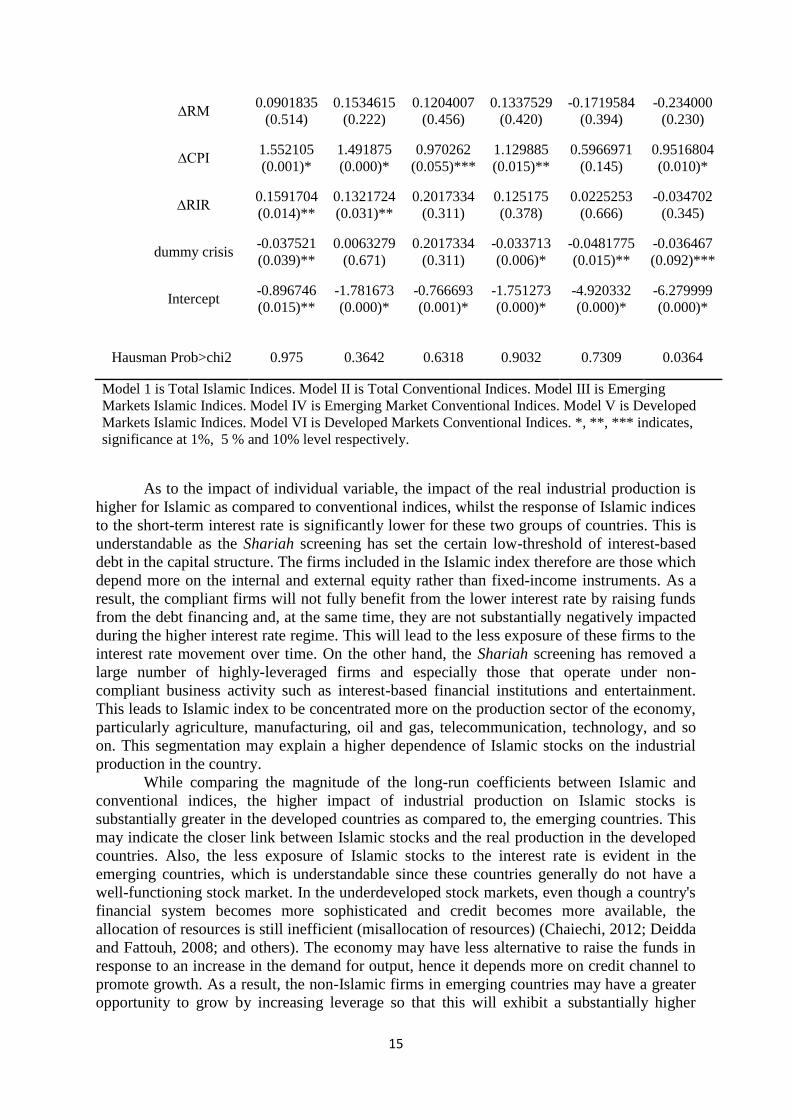
dummy crisis
-0.037521
(0.039)**
0.0063279
(0.671)
0.2017334
(0.311)
-0.033713
(0.006)*
-0.0481775
(0.015)**
-0.036467
(0.092)***
Intercept
-0.896746
(0.015)**
-1.781673
(0.000)*
-0.766693
(0.001)*
-1.751273
(0.000)*
-4.920332
(0.000)*
-6.279999
(0.000)*
Hausman Prob>chi2 0.975 0.3642 0.6318 0.9032 0.7309 0.0364
Model 1 is Total Islamic Indices. Model II is Total Conventional Indices. Model III is Emerging
Markets Islamic Indices. Model IV is Emerging Market Conventional Indices. Model V is Developed
Markets Islamic Indices. Model VI is Developed Markets Conventional Indices. *, **, *** indicates,
significance at 1%, 5 % and 10% level respectively.
As to the impact of individual variable, the impact of the real industrial production is
higher for Islamic as compared to conventional indices, whilst the response of Islamic indices
to the short-term interest rate is significantly lower for these two groups of countries. This is
understandable as the Shariah screening has set the certain low-threshold of interest-based
debt in the capital structure. The firms included in the Islamic index therefore are those which
depend more on the internal and external equity rather than fixed-income instruments. As a
result, the compliant firms will not fully benefit from the lower interest rate by raising funds
from the debt financing and, at the same time, they are not substantially negatively impacted
during the higher interest rate regime. This will lead to the less exposure of these firms to the
interest rate movement over time. On the other hand, the Shariah screening has removed a
large number of highly-leveraged firms and especially those that operate under non-
compliant business activity such as interest-based financial institutions and entertainment.
This leads to Islamic index to be concentrated more on the production sector of the economy,
particularly agriculture, manufacturing, oil and gas, telecommunication, technology, and so
on. This segmentation may explain a higher dependence of Islamic stocks on the industrial
production in the country.
While comparing the magnitude of the long-run coefficients between Islamic and
conventional indices, the higher impact of industrial production on Islamic stocks is
substantially greater in the developed countries as compared to, the emerging countries. This
may indicate the closer link between Islamic stocks and the real production in the developed
countries. Also, the less exposure of Islamic stocks to the interest rate is evident in the
emerging countries, which is understandable since these countries generally do not have a
well-functioning stock market. In the underdeveloped stock markets, even though a country's
financial system becomes more sophisticated and credit becomes more available, the
allocation of resources is still inefficient (misallocation of resources) (Chaiechi, 2012; Deidda
and Fattouh, 2008; and others). The economy may have less alternative to raise the funds in
response to an increase in the demand for output, hence it depends more on credit channel to
promote growth. As a result, the non-Islamic firms in emerging countries may have a greater
opportunity to grow by increasing leverage so that this will exhibit a substantially higher
16
sensitivity to the interest rate movement. On the other hand, while analyzing money supply
and consumer price index, we observe that the impact of the former on Islamic indices is
higher in the emerging countries, whilst the later have higher impact on conventional indices
in the developed countries.
Relating to the impact of the US-born subprime crisis, the dummy crisis demonstrate
the stronger effect of the global crisis on Islamic, as compared to, conventional indices in
both the developed and emerging countries. In the understandiong of the authors this is owing
to the role of Shariah screening that have taken out the large non-compliant firms from the
pool of investable equities, leaving the remaining Shari’ah compliant firms universe to be
smaller and less diversified (Hussein & Omran, 2005). It is true from the theoretical
underpinning that the lower leverage will imply a lower fixed financial commitment out of
uncertain revenues, which consequently decrease the risk of the cash flow to equity (Hamada,
1972; Rubenstein, 1973; Christie, 1982; Mandelker & Rhee, 1984). It means that, during
economic downturn, Shariah-compliant equities with a lower leverage theoretically will have
lower systemic risk. The compliant firms also will be less volatile since leverage effect
suggests that firms with lower debt/equity ratios should have a lesser negative relation
between current returns and stock volatility (Black, 1976; Christie, 1982). Nonetheless, it
seems that the disadvantage of smaller size, and less diversified, of Islamic firms may offset
the advantage of lower leverage. Some prior studies mention that a relatively smaller size of a
firm can lead to a higher systemic risk via size effect (Breen & Lerner, 1973; Kim et al.,
2002; and so on). The size effect also plays an important role, where smaller firms are more
exposed to a greater increase in their volatility, following a percentage fall in their stock price
compared to those of larger firms (Black, 1976; Christie, 1982; Cheung & Ng, 1992).
When we observe the error-correction coefficient, the empirical results show that
Islamic stocks tend to show a faster speed of adjustment to the equilibrium in the emerging
countries. Notwithstanding the larger impact of the crisis on Islamic indices, this evidence
may imply a higher stability of compliant firms during the recovery. This is in the opposite of
what we found in the developed countries, whereby Islamic stocks portray a slightly slower
adjustment as compared to the conventional ones. The plausible reason can be attributed to
the nature of shocks absorption in the developed countries. For some countries, the shocks
have involved the extreme severity of flight-to-quality created by self-fulfilling expectation
along with the massive panicked deleveraging, and been followed by the frozen credit
markets. This has led to a structural problem that substantially affects the real economy,
where policy makers should not rely merely on monetary adjustment and fiscal stimulus to
sustain. It is observed that the industrial production suffered more in the developed countries,
thereby suggesting a greater and longer deviation from the equilibrium. Since this production
variable has a substantial contribution to the Islamic indices within these countries, this
evidence may explain the slower speed of adjustment of Islamic stocks to the long-run
equilibrium relationship.
Finally, a proper analysis should be derived from the samples covering all the
countries since the Hausman test accept the common long-run coefficients across different
groups. We observe that the long-run coefficients are significant for both indices. The higher
impact of the real industrial production, together with the lower impact of interest rate, on
Islamic indices also remain in this model, thereby applying the same underlying reason that
we described earlier. In addition, the impact of money supply is lower for Islamic stocks,
which further suggest that compliant firms may have lower benefit from monetary expansion
recalling the limit of taking higher financial leverage.
While observing the dummy crisis, the impact of the global crisis is only significant
for Islamic indices. The finding may emphasize the major role of the size effect and less
diversification on increasing the systemic risk as well as volatility of Islamic stocks during
17
economic downturn. In addition the lower coefficient of error-correction term for Islamic
indices may signify the relatively stability for these stocks to return to the long-run
macroeconomic equilibrium relationship.
5. Conclusion
This study had set out to analyze and compare the impact of macroeconomic factors
on the Islamic and Conventional equity prices. An insight into the behaviour of the equity
prices would allow for a better understanding of how the Shariah screening for Islamic
securities modify the relationship between the variables.
In line with our expectations, the Islamic indices are more grounded in the real sector
owing to the focus of Islamic finance in the real part of the economy. The industrial
production’s impact is much higher for Islamic indices as compared to conventional indices
while the response of Islamic indices to the short-term interest rate is significantly lower for
these two groups of countries which can be attributed to the Shariah screening methodology
as it sets a certain low-threshold of bearing the interest-based debt. The firms included in the
Islamic index therefore are those which depend more on the internal and external equity
rather than fixed-income instruments.
Also, there is evidence of a less exposure of Islamic stocks to money supply and
consumer price index that can be evidenced in emerging countries. The results of this study
provides some interesting insights and provides strong foundation for the argument that the
Islamic equities are primarily impacted by changes in the real sector of the economy, and not
highly dependent on the money supply and interest rates.
The impact of the recent crisis on Islamic indices is significant as compared to the
conventional counterparts, but at the same time the adjustment to equilibrium is quicker for
Islamic indices. This signifies the relative stability of the Islamic indices in the face of
economic shocks. This study aimed to explore the behaviour of economic variables’ impact
on the Islamic indices in comparison with that on the conventional indices. There is a
difference in which economic variables impact the equity prices of Shariah compliant stocks,
which is an area that requires further research.
References
Al-Zoubi, Maghyereh, 2007. The Relative Risk Performance of Islamic Finance: A New
Guide To Less Risky Investments. International Journal of Theoretical and Applied Finance,
10(2), 235-249
Barro, R.J., 1990. The stock market and investments. Review of Financial Studies 3 (1),
115–131.
Binswanger, M., 2000. Stock market booms and real economic activity: is this time
different? International Review of Economics and Finance 9, 387–415.
Binswanger, M., 2001. Does the stock market still lead real activity? An investigation for
the G-7 countries. Journal of Financial Markets and Portfolio Management 15, 15–29.
Binswanger, M., 2004. How important are fundamentals? Evidence from a structural VAR
model for the stock markets in the US, Japan and Europe. Journal of International Financial
Markets, Institutions and Money 14, 185–201.
Black, F. (1976). The Dividend Puzzle. Journal of Portfolio Management, 2, 5–84.
Breen W.J., Lerner E.M, 1973. Corporate financial strategies and market measures of risk
and return. The Journal of Finance 28(2), 339–351.

18
Carlson, J.B., Sargent, K.H., 1997. The recent ascent of stock prices: can it be explained by
earnings growth or other fundamentals? Federal Reserve Bank of Cleveland Economic
Review 33, 2–12, 2nd quarter.
Cheung, Y.-W., Ng, L.N., 1998. International evidence on the stock market and aggregate
economic activity. Journal of Empirical Finance 5, 281–296.
Christie, A.A. 1982, The Stochastic Behavious of Common Stock-Variances-
Value,Leverage and Interest Rate Effects. Journal of Financial Economics 3, 407-432.
Chung, H., Lee, B.-S., 1998. Fundamental and nonfundamental components in stock prices
of Pacific-Rim countries. Pacific-Basin Journal of Finance 6, 321–346
Chung, Y.-W., He, J., Ng, L.K., 1998. What are the global sources of rational variation in
international equity returns? Journal of International Money and Finance 16, 821–836.
Derigs, U., Marzban, S., 2008. Review and analysis of current Shariah-compliant equity
screening practices. International Journal of Islamic and Middle Eastern Finance and
Management, 1 (4), 285 - 303
Fama, E.K., 1990. Stock returns, expected returns, and real activity. Journal of Finance 45,
1089–1108.
Girad, E.C. and Hassan M.K. 2008. Is There a Cost to Faith-Based Investing: Evidence
from FTSE Islamic Indices. The Journal of Investing, 17(4). 112-121.
Gordon, M.J., 1959, Dividends, Earnings, and Stock Prices. The Review of Economics and
Statistics, 41 (2), 99-105
Hakim, S., and Rashidian, M,, 2002. Risk & Return of Islamic Stock Market Indexes.
Working paper. Available from: http://www.mafhoum.com/press4/136E15.pdf
Rubinstein, M., 1976, "The Valuation of Uncertain Income Streams and the Pricing of
Options," Bell Journal of Economics and Management Science 7, 407-25.
Hassan, M.K. 2002, Risk, Return and Volatility of Faith-Based Investing: The Case of Dow
Jones Islamic Index. Paper in proceedings of the 5th Harvard University Forum on Islamic
Finance, University of Harvard, USA.
Hausman, J. A. 1978. Specification Tests in Econometrics, Econometrica,46(6), 1251-1271.
Hussein, K., & Omran, M. (2005). Ethical investment revisited: Evidence from Dow Jones
Islamic Indexes. Journal of Investing, 14(3), 105–124.
Im, K.S., Pesaran, H., Shin, Y., 1995, Testing for unit roots in heterogenous panels.
Unpublished manuscript.
Jangkoo, K., Kee, H., Chung and Joon-Seok Kim, 2011. Tick size, market structure, and
market quality. Review of Quantitative Finance and Accounting, 36(1), 57-81.
Mandelker, G., S. Rhee; 1984; The Impact of Degrees of Operating and Financial
Leverage on Systematic Risk of Common Stock; Journal of Financial and Quantitative
Analysis; 45-57.
Maddla, G.S., Wu, S., 1999. Comparative study of unit root tests with panel data and a new
simple test. Oxford Bulletin of Economics and Statistics 61, 631–652.
Laopodis, N.T., 2006. Dynamic interactions among the stock market, federal funds rate,
inflation, and economic activity. The Financial Review 41, 513–545.
Laopodis, N.T., 2011. Equity prices and macroeconomic fundamentals: International
evidence, Journal of International Financial Markets, Institutions and Money, 21(2), 247-276.
Lee, B.-S., 1995. Fundamentals and bubbles in asset prices: evidence from the US and
Japanese asset prices. Financial Engineering and Japanese Financial Markets 2, 69–122.
Lee, B.-S., 1998. Permanent, temporary and nonfundamental components of stock prices.
Journal of Financial and Quantitative Analysis 33, 1–32.
Levin, A., Lin, C.-F., Chu, C-S. J. 2002. Unit root tests in panel data:asymptotic and
infinite-sample properties Journal of Econometrics, 108 (2002), 1–24.
19
Loayza, N. V., Ranciere, R., 2006. Financial Development, Financial Fragility, and
Growth. Journal of Money, Credit and Banking. 38(4), 1051-1076.
Nikkinen, J., Sahlström, P. 2004. Scheduled domestic and U.S. macroeconomic news and
stock valuation in Europe. Journal of Multinational Financial Management, 14(3), 201-215.
Ozuna, T., Verma, R. 2005. Are Emerging Equity Markets Responsive to Another
Country’s Macroeconomic Movement?—Evidence from Latin America. Journal of
International Financial Markets, Institutions and Money, 15, 73-87.
Pesaran, M.H., Timmermann, A., 1995. Predictability of Stock Returns: Robustness and
Economic Significance. The Journal of Finance 50 (4), 1201-1228
Pesaran M.H., Shin Y., Smith R.P, 1999. Pooled Mean Group estimation of dynamic
heterogeneous panels. Journal of the American Statistical Association, 94, 621-34.
Rubinstein, M., 1976, The Valuation of Uncertain Income Streams and the Pricing of
Options. Bell Journal of Economics and Management Science 7, 407-25.
Schwert, G.W., 1990. Stock returns and real activity: a century of evidence. Journal of
Finance 45 (4), 1237–1257.
Shiller, R.J., 2005. Irrational Exuberance, 2nd edition. Princeton University Press.
Suk-Joong, K., McKenzie, Michael, D., Faff, R. W. 2004. Macroeconomic news
announcements and the role of expectations: evidence for US bond, stock and foreign
exchange markets. Journal of Multinational Financial Management. 14(3), 217-232.
Yang, J., Zhou, Y., Wang, Z., 2009. The stock-bond correlation and macroeconomic
conditions: One and a half centuries of evidence. Journal of Banking and Finance 33, 670–
680.