The Oil Palm Planters_ Contoh Kontrak Land Clearing Tanpa Bakar
Sabah (Malaysia)
51%
Peninsular (Malaysia)
45%
Sarawak (Malaysia)
2%
Other
3%
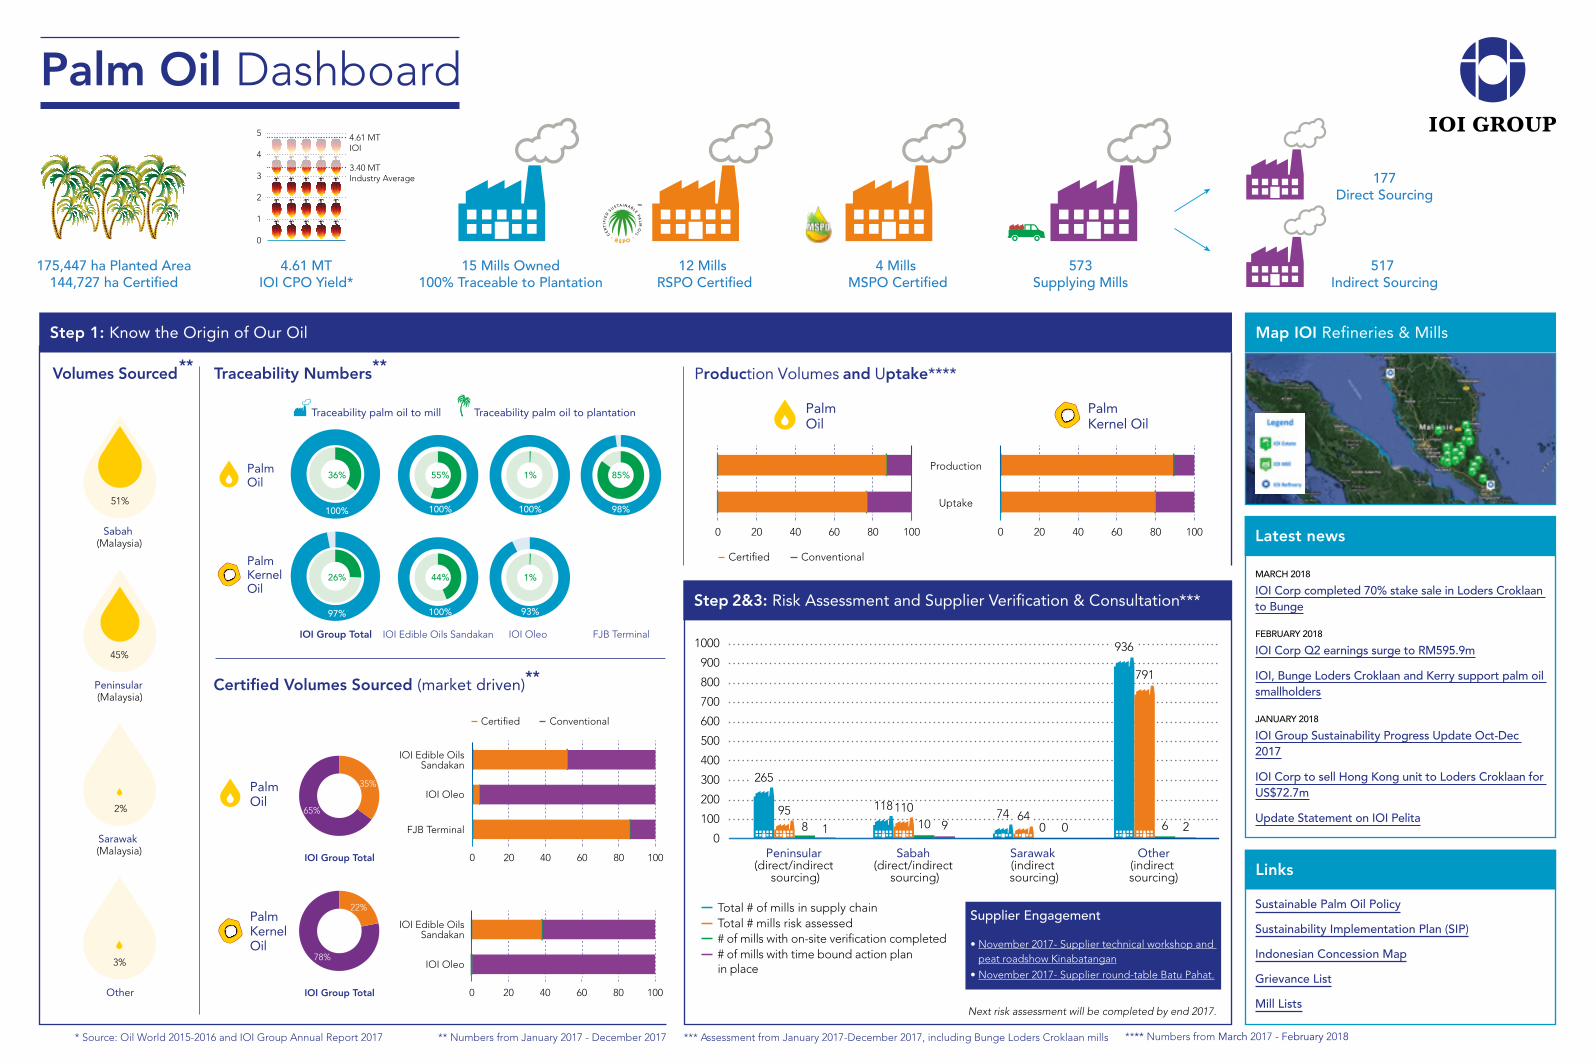
Palm Oil Dashboard
175,447 ha Planted Area144,727 ha Certified
4.61 MTIOI CPO Yield*
15 Mills Owned100% Traceable to Plantation
12 Mills RSPO Certified
4 Mills MSPO Certified
573Supplying Mills
177Direct Sourcing
517 Indirect Sourcing
1
0
2
3
4
5 4.61 MT IOI
3.40 MTIndustry Average
Step 1: Know the Origin of Our Oil
Step 2&3: Risk Assessment and Supplier Verification & Consultation***
Total # of mills in supply chain Total # mills risk assessed# of mills with on-site verification completed# of mills with time bound action plan in place
600
700
800
500
400
300
1000
900
200
100
0Peninsular
(direct/indirect sourcing)
Sabah (direct/indirect
sourcing)
Sarawak (indirect sourcing)
Other(indirect sourcing)
791
6 2
936
640 0
748 1
265
95 11811010 9
Supplier Engagement
• November 2017- Supplier technical workshop andpeat roadshow Kinabatangan
• November 2017- Supplier round-table Batu Pahat.
Map IOI Refineries & Mills
Links
Sustainable Palm Oil Policy
Sustainability Implementation Plan (SIP)
Latest news
Grievance List
Palm Oil
Palm Kernel Oil
IOI Edible Oils Sandakan IOI Oleo FJB TerminalIOI Group Total
100%
36%
100%
55%
100%
1%
93%
1%
98%
85%
Traceability palm oil to mill Traceability palm oil to plantation
26% 44%
97% 100%
Production Volumes and Uptake****
Certified Volumes Sourced (market driven)**
0 20 40 60 80 100
IOI Oleo
FJB Terminal
0 20 40 60 80 100
Certified
IOI Edible OilsSandakan
IOI Edible OilsSandakan
IOI Oleo
Palm Oil
Palm Kernel Oil
IOI Group Total
IOI Group Total
35%
65%
22%
78%
Conventional
Mill Lists
* Source: Oil World 2015-2016 and IOI Group Annual Report 2017 ** Numbers from January 2017 - December 2017
Next risk assessment will be completed by end 2017.
Indonesian Concession Map
Traceability Numbers **
*** Assessment from January 2017-December 2017, including Bunge Loders Croklaan mills
Volumes Sourced **
MARCH 2018
IOI Corp completed 70% stake sale in Loders Croklaan to Bunge
FEBRUARY 2018
IOI Corp Q2 earnings surge to RM595.9m
IOI, Bunge Loders Croklaan and Kerry support palm oil smallholders
JANUARY 2018
IOI Group Sustainability Progress Update Oct-Dec 2017
IOI Corp to sell Hong Kong unit to Loders Croklaan for US$72.7m
Update Statement on IOI Pelita
0 20 40 60 80 100
Certified
Palm Oil
0 20 40 60 80 100
Production
Uptake
Conventional
Palm Kernel Oil
**** Numbers from March 2017 - February 2018