Panthera tigris jacksoni - catsg.org · Empat negeri utama harimau pernah dijumpai ialah di Pahang,...
20
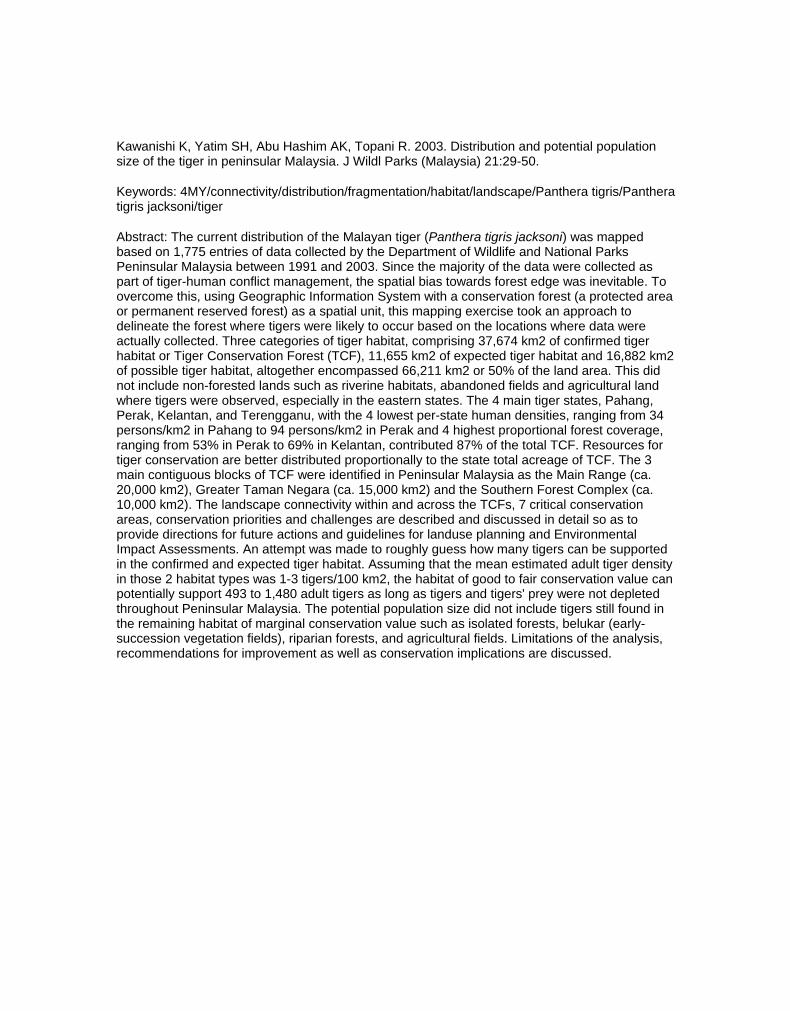
32 Kawanishi K, Yatim SH, Abu Hashim AK, Topani R. 2003. Distribution and potential population size of the tiger in peninsular Malaysia. J Wildl Parks (Malaysia) 21:29-50. Keywords: 4MY/connectivity/distribution/fragmentation/habitat/landscape/Panthera tigris/Panthera tigris jacksoni/tiger Abstract: The current distribution of the Malayan tiger (Panthera tigris jacksoni) was mapped based on 1,775 entries of data collected by the Department of Wildlife and National Parks Peninsular Malaysia between 1991 and 2003. Since the majority of the data were collected as part of tiger-human conflict management, the spatial bias towards forest edge was inevitable. To overcome this, using Geographic Information System with a conservation forest (a protected area or permanent reserved forest) as a spatial unit, this mapping exercise took an approach to delineate the forest where tigers were likely to occur based on the locations where data were actually collected. Three categories of tiger habitat, comprising 37,674 km2 of confirmed tiger habitat or Tiger Conservation Forest (TCF), 11,655 km2 of expected tiger habitat and 16,882 km2 of possible tiger habitat, altogether encompassed 66,211 km2 or 50% of the land area. This did not include non-forested lands such as riverine habitats, abandoned fields and agricultural land where tigers were observed, especially in the eastern states. The 4 main tiger states, Pahang, Perak, Kelantan, and Terengganu, with the 4 lowest per-state human densities, ranging from 34 persons/km2 in Pahang to 94 persons/km2 in Perak and 4 highest proportional forest coverage, ranging from 53% in Perak to 69% in Kelantan, contributed 87% of the total TCF. Resources for tiger conservation are better distributed proportionally to the state total acreage of TCF. The 3 main contiguous blocks of TCF were identified in Peninsular Malaysia as the Main Range (ca. 20,000 km2), Greater Taman Negara (ca. 15,000 km2) and the Southern Forest Complex (ca. 10,000 km2). The landscape connectivity within and across the TCFs, 7 critical conservation areas, conservation priorities and challenges are described and discussed in detail so as to provide directions for future actions and guidelines for landuse planning and Environmental Impact Assessments. An attempt was made to roughly guess how many tigers can be supported in the confirmed and expected tiger habitat. Assuming that the mean estimated adult tiger density in those 2 habitat types was 1-3 tigers/100 km2, the habitat of good to fair conservation value can potentially support 493 to 1,480 adult tigers as long as tigers and tigers' prey were not depleted throughout Peninsular Malaysia. The potential population size did not include tigers still found in the remaining habitat of marginal conservation value such as isolated forests, belukar (early- succession vegetation fields), riparian forests, and agricultural fields. Limitations of the analysis, recommendations for improvement as well as conservation implications are discussed.
Transcript of Panthera tigris jacksoni - catsg.org · Empat negeri utama harimau pernah dijumpai ialah di Pahang,...
32
Kawanishi K, Yatim SH, Abu Hashim AK, Topani R. 2003. Distribution and potential population size of the tiger in peninsular Malaysia. J Wildl Parks (Malaysia) 21:29-50.
Keywords: 4MY/connectivity/distribution/fragmentation/habitat/landscape/Panthera tigris/Panthera tigris jacksoni/tiger
Abstract: The current distribution of the Malayan tiger (Panthera tigris jacksoni) was mapped based on 1,775 entries of data collected by the Department of Wildlife and National Parks Peninsular Malaysia between 1991 and 2003. Since the majority of the data were collected as part of tiger-human conflict management, the spatial bias towards forest edge was inevitable. To overcome this, using Geographic Information System with a conservation forest (a protected area or permanent reserved forest) as a spatial unit, this mapping exercise took an approach to delineate the forest where tigers were likely to occur based on the locations where data were actually collected. Three categories of tiger habitat, comprising 37,674 km2 of confirmed tiger habitat or Tiger Conservation Forest (TCF), 11,655 km2 of expected tiger habitat and 16,882 km2 of possible tiger habitat, altogether encompassed 66,211 km2 or 50% of the land area. This did not include non-forested lands such as riverine habitats, abandoned fields and agricultural land where tigers were observed, especially in the eastern states. The 4 main tiger states, Pahang, Perak, Kelantan, and Terengganu, with the 4 lowest per-state human densities, ranging from 34 persons/km2 in Pahang to 94 persons/km2 in Perak and 4 highest proportional forest coverage, ranging from 53% in Perak to 69% in Kelantan, contributed 87% of the total TCF. Resources for tiger conservation are better distributed proportionally to the state total acreage of TCF. The 3 main contiguous blocks of TCF were identified in Peninsular Malaysia as the Main Range (ca. 20,000 km2), Greater Taman Negara (ca. 15,000 km2) and the Southern Forest Complex (ca. 10,000 km2). The landscape connectivity within and across the TCFs, 7 critical conservation areas, conservation priorities and challenges are described and discussed in detail so as to provide directions for future actions and guidelines for landuse planning and Environmental Impact Assessments. An attempt was made to roughly guess how many tigers can be supported in the confirmed and expected tiger habitat. Assuming that the mean estimated adult tiger density in those 2 habitat types was 1-3 tigers/100 km2, the habitat of good to fair conservation value can potentially support 493 to 1,480 adult tigers as long as tigers and tigers' prey were not depleted throughout Peninsular Malaysia. The potential population size did not include tigers still found in the remaining habitat of marginal conservation value such as isolated forests, belukar (early-succession vegetation fields), riparian forests, and agricultural fields. Limitations of the analysis, recommendations for improvement as well as conservation implications are discussed.
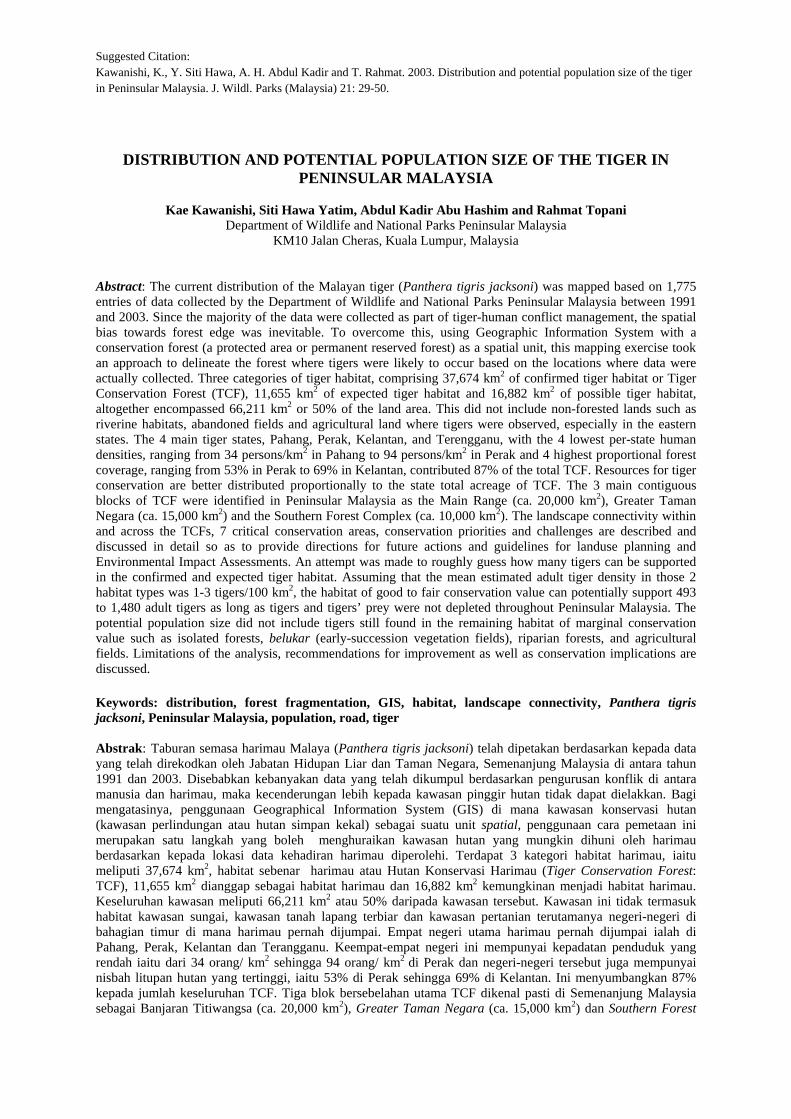
Suggested Citation: Kawanishi, K., Y. Siti Hawa, A. H. Abdul Kadir and T. Rahmat. 2003. Distribution and potential population size of the tiger in Peninsular Malaysia. J. Wildl. Parks (Malaysia) 21: 29-50.
DISTRIBUTION AND POTENTIAL POPULATION SIZE OF THE TIGER IN PENINSULAR MALAYSIA
Kae Kawanishi, Siti Hawa Yatim, Abdul Kadir Abu Hashim and Rahmat Topani
Department of Wildlife and National Parks Peninsular Malaysia KM10 Jalan Cheras, Kuala Lumpur, Malaysia
Abstract: The current distribution of the Malayan tiger (Panthera tigris jacksoni) was mapped based on 1,775 entries of data collected by the Department of Wildlife and National Parks Peninsular Malaysia between 1991 and 2003. Since the majority of the data were collected as part of tiger-human conflict management, the spatial bias towards forest edge was inevitable. To overcome this, using Geographic Information System with a conservation forest (a protected area or permanent reserved forest) as a spatial unit, this mapping exercise took an approach to delineate the forest where tigers were likely to occur based on the locations where data were actually collected. Three categories of tiger habitat, comprising 37,674 km2 of confirmed tiger habitat or Tiger Conservation Forest (TCF), 11,655 km2 of expected tiger habitat and 16,882 km2 of possible tiger habitat, altogether encompassed 66,211 km2 or 50% of the land area. This did not include non-forested lands such as riverine habitats, abandoned fields and agricultural land where tigers were observed, especially in the eastern states. The 4 main tiger states, Pahang, Perak, Kelantan, and Terengganu, with the 4 lowest per-state human densities, ranging from 34 persons/km2 in Pahang to 94 persons/km2 in Perak and 4 highest proportional forest coverage, ranging from 53% in Perak to 69% in Kelantan, contributed 87% of the total TCF. Resources for tiger conservation are better distributed proportionally to the state total acreage of TCF. The 3 main contiguous blocks of TCF were identified in Peninsular Malaysia as the Main Range (ca. 20,000 km2), Greater Taman Negara (ca. 15,000 km2) and the Southern Forest Complex (ca. 10,000 km2). The landscape connectivity within and across the TCFs, 7 critical conservation areas, conservation priorities and challenges are described and discussed in detail so as to provide directions for future actions and guidelines for landuse planning and Environmental Impact Assessments. An attempt was made to roughly guess how many tigers can be supported in the confirmed and expected tiger habitat. Assuming that the mean estimated adult tiger density in those 2 habitat types was 1-3 tigers/100 km2, the habitat of good to fair conservation value can potentially support 493 to 1,480 adult tigers as long as tigers and tigers’ prey were not depleted throughout Peninsular Malaysia. The potential population size did not include tigers still found in the remaining habitat of marginal conservation value such as isolated forests, belukar (early-succession vegetation fields), riparian forests, and agricultural fields. Limitations of the analysis, recommendations for improvement as well as conservation implications are discussed. Keywords: distribution, forest fragmentation, GIS, habitat, landscape connectivity, Panthera tigris jacksoni, Peninsular Malaysia, population, road, tiger Abstrak: Taburan semasa harimau Malaya (Panthera tigris jacksoni) telah dipetakan berdasarkan kepada data yang telah direkodkan oleh Jabatan Hidupan Liar dan Taman Negara, Semenanjung Malaysia di antara tahun 1991 dan 2003. Disebabkan kebanyakan data yang telah dikumpul berdasarkan pengurusan konflik di antara manusia dan harimau, maka kecenderungan lebih kepada kawasan pinggir hutan tidak dapat dielakkan. Bagi mengatasinya, penggunaan Geographical Information System (GIS) di mana kawasan konservasi hutan (kawasan perlindungan atau hutan simpan kekal) sebagai suatu unit spatial, penggunaan cara pemetaan ini merupakan satu langkah yang boleh menghuraikan kawasan hutan yang mungkin dihuni oleh harimau berdasarkan kepada lokasi data kehadiran harimau diperolehi. Terdapat 3 kategori habitat harimau, iaitu meliputi 37,674 km2, habitat sebenar harimau atau Hutan Konservasi Harimau (Tiger Conservation Forest: TCF), 11,655 km2 dianggap sebagai habitat harimau dan 16,882 km2 kemungkinan menjadi habitat harimau. Keseluruhan kawasan meliputi 66,211 km2 atau 50% daripada kawasan tersebut. Kawasan ini tidak termasuk habitat kawasan sungai, kawasan tanah lapang terbiar dan kawasan pertanian terutamanya negeri-negeri di bahagian timur di mana harimau pernah dijumpai. Empat negeri utama harimau pernah dijumpai ialah di Pahang, Perak, Kelantan dan Terangganu. Keempat-empat negeri ini mempunyai kepadatan penduduk yang rendah iaitu dari 34 orang/ km2 sehingga 94 orang/ km2 di Perak dan negeri-negeri tersebut juga mempunyai nisbah litupan hutan yang tertinggi, iaitu 53% di Perak sehingga 69% di Kelantan. Ini menyumbangkan 87% kepada jumlah keseluruhan TCF. Tiga blok bersebelahan utama TCF dikenal pasti di Semenanjung Malaysia sebagai Banjaran Titiwangsa (ca. 20,000 km2), Greater Taman Negara (ca. 15,000 km2) dan Southern Forest

Complex (ca. 10,000 km2). Kesinambungan landskap di dalam dan di sepanjang kawasan TCF, 7 kawasan konservasi kritikal, prioriti konservasi dan cabaran-cabaran dibincangkan secara terperinci untuk menyediakan arahtuju dan tindakan pada masa akan datang. Selain itu, ia juga boleh dijadikan panduan untuk perancangan penggunaan tanah serta digunakan dalam penilaian impak terhadap alam sekitar. Anggaran kasar telah dibuat bagi menentukan berapakah individu harimau yang boleh ditampung dalam habitat sebenar dan habitat andaian. Dengan menganggap bahawa min anggaran kepadatan harimau dewasa dalam dua jenis habitat adalah 1 – 3 ekor harimau/ 100 km2, daripada nilai konservasi yang elok kepada sederhana, berpotensi menampung 493 – 1,480 individu harimau dewasa, dengan anggapan bahawa tidak berlaku pemburuan terhadap harimau dan pemangsa harimau di seluruh kawasan Semenanjung Malaysia. Potensi saiz populasi harimau yang dianggarkan adalah tidak termasuk populasi harimau di habitat lain seperti belukar, hutan tepi sungai dan kawasan pertanian. Halangan analisis, cadangan penambahbaikan serta implikasi konservasi juga telah dibincangkan.
INTRODUCTION Having lost over 95% of its original habitat throughout Asia, the tiger (Panthera tigris) suffered major losses during the 20th century and only an estimated 5,000-7,000 animals currently survive in at least 159 fragmented forests (Dinerstein et al. 1997, Seidensticker et al. 1999). Besides habitat loss, tigers were hunted for trophies or killed as pests and during colonial periods bounties were paid to shoot tigers in many countries, including Malaysia, Singapore, and Indonesia (Boomgaard 2001). The small island populations of tigers in Java, Bali, and Singapore did not survive the onslaught and are now extinct. Even after the tiger was listed in the Convention on International Trade in Endangered Species of Wild Fauna and Flora (CITES) and became a protected species under national legislation in most tiger range countries, poaching for trophies and traditional medicine continues to be one of the main threats to the survival of the species (Dinerstein et al. 1997, Hemley and Mills 1999). An additional threat to tigers in Malaysia is steel wire snares set for other species such as wild boar.
Knowing where tigers remain is fundamental to assess the status of tigers and is the minimum level of knowledge necessary for conservation planning. The presence of tigers can be confirmed without any sophisticated equipment or scientific research. Because reliable estimation of the size of tiger populations requires statistically valid sampling methods, it is not feasible or necessary to scientifically determine tiger populations in an entire country. Numerical assessment of both absolute and relative abundance are more suitably applied to priority areas where conservation resources can be focused (Karanth et al. 2002, 2003). Given the current level of available resources, at the national level, it is more practical to assess the temporal change in the status of tigers spatially such as contraction or expansion in range as well as extirpation of isolated populations. This paper presents information on tiger distribution based on data collected by the Department of Wildlife and National Park (DWNP) in Peninsular Malaysia between 1991 and 2003 and attempts to provide a crude estimate of tiger numbers based on areas known to be occupied by tigers and the general understanding of tiger densities in tropical forests.
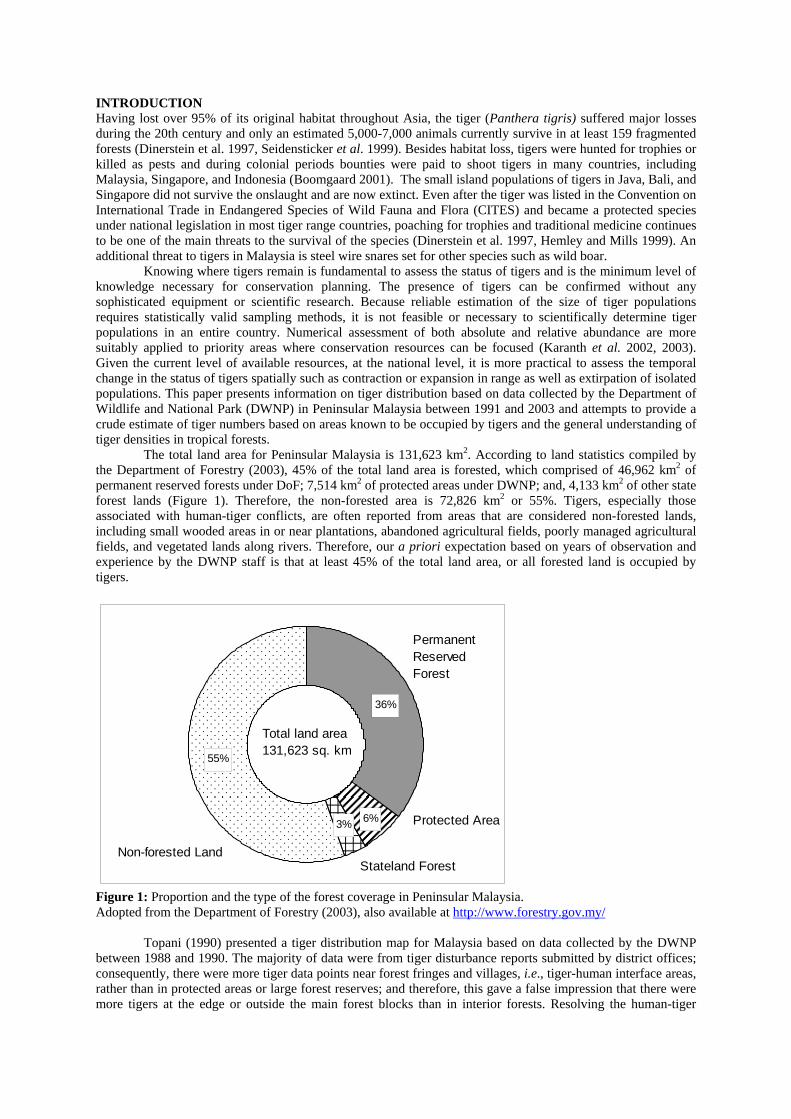
The total land area for Peninsular Malaysia is 131,623 km2. According to land statistics compiled by the Department of Forestry (2003), 45% of the total land area is forested, which comprised of 46,962 km2 of permanent reserved forests under DoF; 7,514 km2 of protected areas under DWNP; and, 4,133 km2 of other state forest lands (Figure 1). Therefore, the non-forested area is 72,826 km2 or 55%. Tigers, especially those associated with human-tiger conflicts, are often reported from areas that are considered non-forested lands, including small wooded areas in or near plantations, abandoned agricultural fields, poorly managed agricultural fields, and vegetated lands along rivers. Therefore, our a priori expectation based on years of observation and experience by the DWNP staff is that at least 45% of the total land area, or all forested land is occupied by tigers.
36%
3%
55%
6%
PermanentReservedForest
Stateland Forest
Protected Area
Non-forested Land
Total land area131,623 sq. km
Figure 1: Proportion and the type of the forest coverage in Peninsular Malaysia. Adopted from the Department of Forestry (2003), also available at http://www.forestry.gov.my/
Topani (1990) presented a tiger distribution map for Malaysia based on data collected by the DWNP between 1988 and 1990. The majority of data were from tiger disturbance reports submitted by district offices; consequently, there were more tiger data points near forest fringes and villages, i.e., tiger-human interface areas, rather than in protected areas or large forest reserves; and therefore, this gave a false impression that there were more tigers at the edge or outside the main forest blocks than in interior forests. Resolving the human-tiger
conflict constitutes a significant portion of the DWNP’s work and the spatially-biased data were therefore an inevitable consequence of the management priority.
Since 1990, more than 30 inventories and surveys were conducted by the DWNP in protected areas and permanent reserved forests (see Table 2 in Abdul Kadir and Hasdi, this volume). Monthly patrols by the Rhino Protection Units provided information on animal distribution from interior forests that are usually not patrolled by wildlife management rangers. These data, in addition to reports from state DWNP from 1991 and 2003 were compiled to update the tiger distribution map. From a management and conservation perspective, a reliable assessment of the trend of changes in populations is more important than biased point estimate of absolute abundance. Nevertheless, managers and policy makers are often asked about the number, and the tiger population in Malaysia is generally reported as 500-600 animals based on work carried out in 1980s (Khan 1987, Topani 1990).
Locke (1954) estimated the tiger population in Malaysia was about 3,000, based on his experience and knowledge of tigers in Terengganu and the rest of the country. He emphasized that “these figures are almost entirely guesswork and are no way dependable.” (Locke 1954, pg 9). In 1957, Peninsular Malaysia had about 74% forest coverage (Myers 1980). If there was an average of 3 tigers per 100 km2, it is possible there were 3,000 tigers in Peninsular Malaysia.
Topani (1990) presented a population estimate of between 482 and 510 animals, based on differences in measurements of the tracks encountered or reported during a 3-year sampling period. Many of those tigers inhabiting interior forests and not causing problems to humans were missed in the population estimate. Even if all the tracks were measured accurately and only the difference attributed to different individual animals was used for counting, the problems associated with incomplete detectability and spatial sampling (Nichols and Karanth 2002, Karanth et al. 2003) were not accounted for. If the track measurements and identification were accurate, given that verifying the validity of these is difficult, the unadjusted population estimate provided by Topani (1990) could be considered as a minimum population in Peninsular Malaysia.
If we know mean densities of tigers in major habitat types, then we can roughly guess how many animals can be supported in various habitats occupied by tigers. Tiger densities vary depending on the available prey biomass (Schaller 1967, Sunquist 1981, Karanth 1995, Karanth, et al. 2004), which varies depending on the availability of the foliage for ungulates or “extent of forest/grassland edge available” (Eisenberg and Seidensticker 1976). We know very little about this relationship in tropical Asia, but compared to that in temperate forest, the variation in habitat productivity for tigers in tropical forests is relatively small due to unseasonality in precipitation and a climax stage of vegetational succession.
A joint research project between the University of Florida and DWNP in Taman Negara provided the first and so far the only statistically valid model-based tiger density estimates from a rainforest in Malaysia (Kawanishi and Sunquist 2004). The estimated densities ( ) of adult tigers ranged from 1.10 ± 0.52 to 1.98 ± 0.54 tigers/100 km2. Because the differences were not significant (X2 = 1.56, df = 2, P = 0.46), the overall mean estimate of 1.66 ± 0.21 tigers/100 km2 (n = 3) was derived for the primary rainforest. This estimate was comparable to tiger density estimates in primary rainforests of Sumatra: 1.56 ± 0.43 tigers/100 km2 in Bukit Barisan Selatan (O’Brien et al. 2003) and 1.65 tigers/100 km2 in Gunung Leuser (Griffiths 1994).
SEX ±
Tiger densities are probably higher in secondary forests near plantations where wild pig and livestock are more abundant, but that information is not available for Peninsular Malaysia. In Sumatra, Santiapillai and Ramono (1987) estimated the density of 1 tiger/100km2 for poor montane forests and 1-3 tigers/100 km2 for more favorable lowland forests.
In the absence of better information, this generalization was applied to known tiger habitats to provide a range of rough, but reasonable guesstimates for the potential size of the adult tiger population in Malaysia. This general density estimate was considered as if one was to repeat the intensive camera-trapping study done in Taman Negara (Kawanishi and Sunquist 2004) in hundreds of other randomly selected study sites throughout Peninsular Malaysia where tigers are known to occur, then the overall mean of the estimated tiger densities would fall somewhere between 1 and 3 adult tigers/100 km2. Limitations of the analysis and recommendations for improvement are discussed. METHODS Data consolidation, coordinate matching and quality control The data sources for the distribution map were as follows: • Tiger data: DWNP inventories, Rhino Protection Unit surveys, monthly reports from the state offices
including information on wildlife disturbance cases and surveys conducted by state DWNP staff, and secondary reports (<1% of the total data) of reliable sources verified by one of the authors between 1991 and 2003.
• Protected area coverage: DWNP/DANCED (1996), also available at www.wildlife.gov.my • Permanent reserved forest coverage: Department of Forestry (2002)
• Forest and other vegetation coverage: Department of Agriculture (Land use map) (1997) • Human population: Department of Statistics (2001) • Political boundary, road and river: Department of Survey and Mapping (1996)
The data consolidation process started in August 2002 and ended in December 2003. The database expanded from the original 551 entries maintained by the DWNP Management Information System (MIS) to 2,058 entries after the data were consolidated from the various sources listed above. Original data took various forms from the standardized D-base file managed by the DWNP MIS to unpublished inventory reports as well as letters from state DWNP rangers describing tiger events. The data were first entered into Microsoft Excel file following the MIS format that included data fields such as: date, time, name of observer, method of observation, number of tiger observed, number of tiger estimated, sex, 6 track measurement parameters, location, district, state, coordinates, elevation, habitat type and remarks. Disturbance (human-tiger conflict related) data were maintained in a separate form since they had additional fields such as type of disturbance, number and kind of livestock killed, and action taken.
After the data entry was completed, obvious duplicates with all identical fields were omitted. Data recorded on the same day by the same person, but at different time were retained. Missing information for district or state was filled, but other missing entries were left blank. Only 30% of the original data had the coordinate information and thus the next step was to find coordinates for specified locations using 1:50,000 topographic maps. Assistants and volunteers were recruited to find these coordinates for the next few months, which improved the proportion of data with coordinates from the 30% to 50%, but in many cases, it was difficult to locate an exact location that the assistants had never heard of out of hundreds of maps. Occasionally, a general site name such as a river or forest reserve was given as a location. In such cases, the approximate geometric center of the site was arbitrarily selected from the map to assign a coordinate to the specific datum. For multiple entries with the same general site name, different points were selected from the map. Although this reduced the precision of the location data, it was deemed sufficient for the nationwide mapping exercise.
GIS (ArcView 3.1, ESRI, Redlands, California) was used for mapping. As part of quality control, data were mapped by district and those that appeared outside the specific district were sent back to the assistants to find correct coordinates. The remaining 50% of the data without coordinates needed assistance from DWNP staff familiar with the areas. The target for data with coordinates was set as 80%. A priority list, comprising locations where humans were attacked or tigers were killed, and locations in area where data were insufficient, was prepared and together with a preliminary distribution map distributed to state tiger units for assistance in June 2004. They found the coordinates for most of the requested data and corrected errors wherever necessary in their respective offices, and together we finished the coordinate matching exercise during the Tiger Workshop held in August 2004. The last batch of data underwent quality control inspections again, and at the end, 86% or 1,775 entries were incorporated into the GIS map. Mapping tiger habitats The likelihood of observing tiger sign is higher outside forests if rangers spend the bulk of their time there. This bias towards forest edge needed to be dealt with. Because the animal recorded at the edge of a forest is likely to be also found inside the forest, the specific location recorded may be a point on the outer boundary of the animal’s home range. Instead of presenting the locations where the data were collected as done in Topani (1990), this mapping exercise took an approach to delineate the forests where tiger are likely to occur.
Potential tiger habitat includes protected areas in the IUCN categories I-IV (IUCN 1994), state land forests, permanent reserve forests throughout Peninsular Malaysia except for those in off-shore islands and non-tiger states. Non-tiger states/federal territories are Perlis, Pulau Pinang, Melaka, Kuala Lumpur, and Putra Jaya. The preliminary mapping suggested that a number of tiger data points were reported from belukar (early-succession vegetation fields) or outside the land area classified as forest for the states of Terengganu, Kelantan, Pahang, and Johor. In the western states of Kedah, Perak, Selangor, and Negri Sembilan, tiger data points were largely confined to the Main Range (Banjaran Titiawangsa). Therefore, the belukar of only the 4 eastern states was included in the potential tiger habitat.
The potential tiger habitat has 3 categories depending on its conservation value to the tiger population, which is based on the protected status and connectivity to other forests as well as to tiger location data as described below.
1. Confirmed tiger habitat, “Tiger Conservation Forest” (TCF) The spatial unit for the mapping of the Tiger Conservation Forest was based on conservation forest, defined here as a protected area (PA) in the IUCN protected area category I-IV (IUCN 1994) or a permanent reserved forest (PRF), together effectively covering 93% of the forest area in Peninsular Malaysia.
TCF consists of conservation forests where tigers were recorded at least once between 1991 and 2003. In disturbance reports (e.g., livestock depredation, sighting reported by villagers then later verified by DWNP
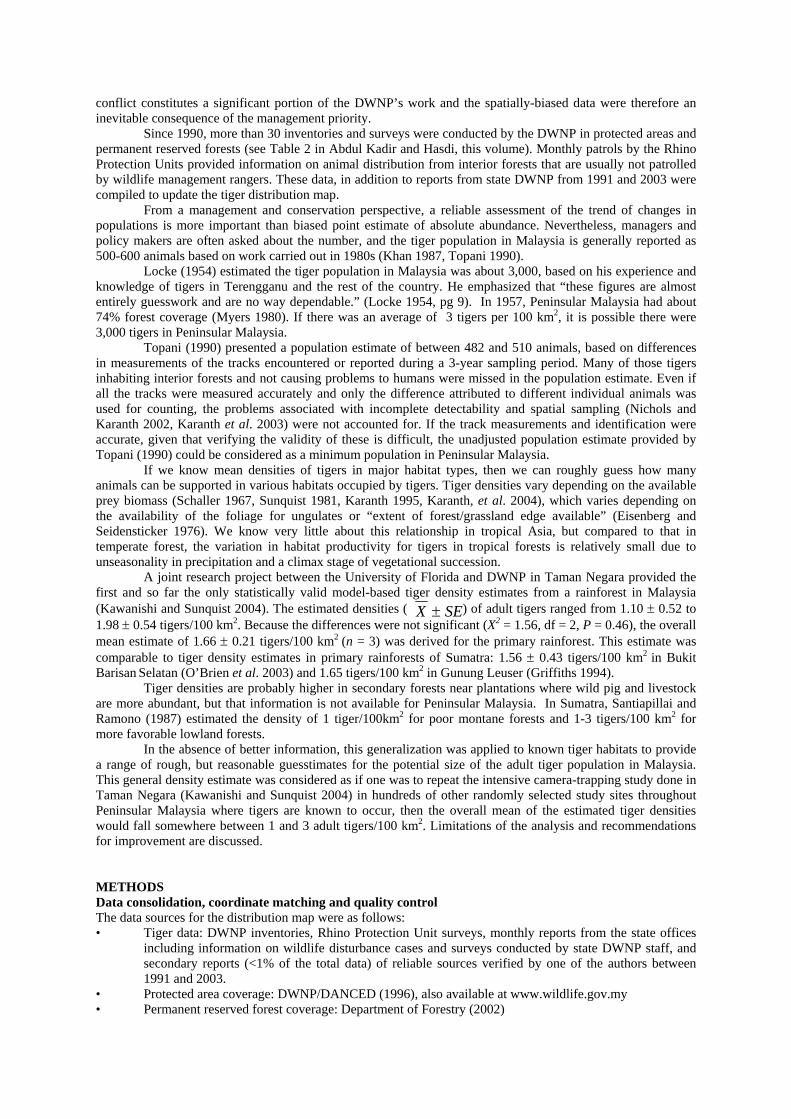
staff), the tiger locations were at forest fringe near human settlements or plantations. In such cases, it was assumed that the nearest conservation forest within 1000 m from the location was where the tiger came from. If all the nearby conservation forests were beyond 1000 m from the recorded location, it was assumed that the tiger lived in belukar or a small pocket of forests in the vicinity, and therefore a dot on the map represented the tiger location outside TCF. As conservation forests are relatively safe from uncontrolled development and large-scale disturbance, the conservation value of this habitat type is high. 2. Expected tiger habitat These are forest areas connected to the above Tiger Conservation Forest, but lacking tiger data because they have not been surveyed or are located far (>1000m) from tiger disturbance sites outside the forest. These are data deficient areas that require surveys to document the presence of tigers. Due to the connectivity to the TCF, the conservation value of this habitat type is considered fair. 3. Possible tiger habitat This habitat type includes belukar in the 4 eastern states and all other forests isolated from the TCF with or without tiger signs. Due to the fragmentation of the PRF and unprotected status of the state land forests and belukar, the conservation value of this habitat type is considered marginal. Size of potential tiger population The number of tigers observed or estimated from various reports were not used to estimate the size of tiger populations for Malaysia. Assuming that the estimated mean of tiger density in tropical forests falls somewhere between 1-3 tigers/100 km2 (Santiapillai and Ramono 1987), the lower and higher bounds of the expected estimated mean were applied to the acreage of confirmed tiger habitats. This figure was subsequently adjusted by adding the same assumed estimated mean of 1-3 tigers in every 100 km2 of expected tiger habitat to give a range of rough, but reasonable guesstimate for the size of the potential tiger population in Peninsular Malaysia. RESULTS Of 2,058 data entries, 1,775 entries with coordinates were used for mapping the tiger distribution. Tiger sign was not reported from 3 states (Perlis, Pulau Pinang, and Malacca) and 2 federal territories (Kuala Lumpur and Putra Jaya) in the west coast. Tiger sign was also absent from isolated PRF, namely Gunung Bangsu (89km2) in Kedah, Pondok Tanjung (64 km2) and Bubu (366 km2) in Perak, Rantau Panjang (87 km2) and Sungai Karang (501 km2) in Selangor, and Maokil (270 km2) in Johor, where sign was reported in the late 1980s (Topani 1990). All these PRFs are located in the western peninsula and most are isolated from the Main Range by major road development. Although the habitat appears to be connected for 400 km, extending from the Thai border in the north to Negri Sembilan in the south, only 4 tiger records were reported by DWNP staff from the Main Range south of the Selangor-Perak state border. On the contrary, many tiger signs were reported from the east coast, all the way from near Kota Bharu, Kelantan in the north to Pularek, Johor at the southern tip of continental Asia, a mere 10 km from Singapore. Many tiger sign were reported from belukar (i.e., early-succession vegetation fields) and agricultural areas outside forests in Kelantan, Terengganu, Pahang, and Johor (Figure 2). Besides belukar and agricultural fields, tigers were also reported from many riparian habitats outside forests in Pahang, Perak, Kelantan, Terengganu, and Johor (Table 1). Most of the major rivers (Department of Survey and Mapping Malaysia, 1996) that drain into the South China Sea had some evidence of tigers, whereas those draining into the Straits of Melaka in the west did not. Table 1: Riparian habitat outside forests inhabited by tigers in Peninsular Malaysia between 1991 and 2003. State River Pahang Pahang, Kuantan, Jelai, Jengka, Semantan, Lipis,
Teriang, Serting Perak Perak, Pelus, Kenderong, Kenering, Chor, Kinta, Bidor,
Trolak, Slim, Bernam Kelantan Kelantan, Jegor, Pergau, Galas, Nenggiri, Lebir, Relai Terengganu Terengganu, Setiu, Nerus, Besut, Marang, Peruh,
Mercang, Dungun, Paka, Jabur, Cukai, Kemaman, CerulJohor Muar, Paling, Sembrong, Ulu Pontian Besar, Sarang
Buaya, Gambut, Sedili Besar, Kahang, Lebam Kedah Muda Selangor Inki

#
#
#
#
#
#
#
##
#
#
#
#
#
#
#
#
###
#
#
##
##
##
#
#
###
#
####
#
#
##
##
#
#
###
#
######
#
#
####
#
#
#
#
#
#
##
#
#
#
##
#####
#
##
#
#
#
##
##
#
##
#
#
#
####
#
##
#
###
#
####
#
#
#
#
#
#
#
#
#
#
#
#
#
#
#
#
#
#
#
#
##
#
#
#
#
#
####
#
#
#
#
####
#
#
#
##
#
# #
#
#
##
# #
#
#
#
#
#
##
#
##
##
#
#
#
#
#
#
#
##
##
#
#
#
#
#
#
#
#
#
#
##
##
#
##
#
#
#
#
#
#
#
#
##
#
#
#
##
#
#
#
##
#
###
#####
#
#
#
#
###
#
#
#
#
##
#
#
##
#### #
#
#
#####
#
#
##
##
###
###
######## #
#
##
#
#
##
#
###
#
#
#
#
#
#
##
##
#
#
##
#
###
##
#
#
#
#
#
##
#
#
#
###
#
#
#
###
#
#
#
#
#
#
#
#
#
#
#
##
#
#
#
#
##
#
#
##
#
#
#
#
##
##
#
#
#
#
#
##
##
#
##
#
#
#
#
#
#
##
#
#
#
#
#####
##
#
##
#
#
#
# #
###
#
#
##
##
#
#
#
##
#
##
###
##
##
####
####
#
####
##
#
#
#
##
##
#
#
#
#
#
#
#
#
##
#
#
#
##
#
#
#
#
###
#
##
# ##
#
#
###
##
#
#
#
#
#
#
#
##
#
#
#########
##
#
#
#
#
##
##
#
###
#
#
#
#
###
#
#######
#
#
##
#
##
#
#
##
##
#
#
#
#
###
#
#####
#
#
## ###
###
# ##
#
##
#
#
#
##
#
#
##
#
#
#
###
##
#
##
##
# ##
#
#
###
##
#
#
#
#
##
#
#
#
#
#
#
#
##
#
#
#
#
#
#
#
#
##
##
##
#
#
#
#
##
#
#
##
#
#
#
#
##
#
#
#
#
#
##
#
# #
#####
#
#
##
#
####
#
#
#
#
#
#
##
#
#
#
#
#
##
##
#
##
#
## #
#
#
#
##
#
##
# #
#
#
#
#
#
##
#
#
#
##
##
#
#
#
#
#
##
#
#
#
# ###
##
#
##
#
##
#
#
#
#
#####
##
##
# #
##
#
##
##
## ##
#
#
#
#
###
#
#
#
#
#
#
#
# #
##
##
###
#
#
#
##
#
##
##
#
#
#
#
#
#
#
#
#
####
#
#
#
#
#
## ###
#
#
###
##
#
##
##
##
#
#
#
#
#
##
#
#
#
#
#
#
#
#
#
#
##
#
#
#
#
#
##
##
#
#
#
###
#
##
#
#
#
#
##
#
#
#
#
#
#
#
#
#
#
#
#
#
#
#
##
#
#
#
#
#
#
#
#
#
#
##
#
#
#
#
#
#
#
#
#
#
#
#
#
##
#
#
#
#
#
#
#
#
#
#
#
#
#
#
#
#
#
##
#
#
#
###
#
##
#
#
#
#
#
#
#
##
#
#
# #
##
#
#
#
##
##
#
#
#
#
#
#
#
#
#
#
#
#
#
#
#
#
#
#
#
#
##
###
##
#
####
#
#
#
#
#
#
##
#
#
#
#
##
###
#
#
#
###
#
#
#
#
#
# #
#
#
##
####
#
#
#
#
#
#
#
#
#
#
#
##
#
##
#
#
#
#
#
#
#
##
#
#
#
##
##
#
#
#
#
#
#
#
#
#
#
#
#
#
#
#
#
#
##
#
#
#
#
#
#
#
#
##
#
#
##
#
#
#
#
#
#
#
#
#
#
#
#
# #
#
#
#
#
##
#
#
#
#
#
#
##
#
#
#
#
#
#
#
#
#
#
#
#
#
#
#
#
#
#
#
#
#
#
#
#
# #
##
#
#
#
#
#
#
#
#
###
#
#
#
#
#
#
#
#
#
#
#
#
#
##
##
#
#
#
#
#
#
#
#
#
#
#
#
##
#
#
#
#
#
#
#
#
#
##
#
#
#
#
#
#
#
#
#
#
##
#
#
#
#
#
#
#
#
#
#
#
#
#
#
#
#
#
#
#
#
##
#
#
#
#
#
#
#
##
#
#
#
#
#
##
#
#
#
#
#
#
#
#
#
#
#
#
#
#
#
#
#
#
##
#
#
#
#
##
#
#
##
#
#
#
#
#
#
##
##
#
#
#
#
#
#
#
#
##
#
##
#
#
#
#
#
##
#
#
#
#
#
#
#
#
#
#
#
#
#
#
#
#
#
#
#
#
##
#
##
#
###
#
#
#
#
#
#
##
##
#
#
#
#
#
#
###
###
#
#
# #
##
#
#
##
#
#
#
#
#
#
#
#
#
#
#
#
#
####
##
#
##
#
#
#
#
#
#
#
#
#
#
#
#
#
#
#
#
#
#
#
#
#
#
#
#
##
#
#
#
#
#
#
#
#
#
#
#
##
#
#
#
#
#
#
#
#
#
#
#
#
#
#
#
#
#
#
#
#
##
#
#
## ##
#
##
##
#
#
#
#
#
#
###
#
#
##
#
#
#
#
###
#
#
#
#
##
##
#
#
#
#
#
#
#
#
#
#
#
##
#
#
#
#
#
#
#
#
#
#
#
#
##
#
##
##
#
#
#
#
#
#
#
#
#
#
##
#
#
#
#
#
#
#
#
#
#
#
#
#
#
#
#
#
#
###
#
#
#
#
#
#
#
#
#
#
#
#
####
#
#
100 0 100 Kilometers
Tiger HabitatTigers present
Tigers expected
Possible tiger habitat
N
Forest map source: Forestry Department (2002) and Agriculture Department (1997)
Figure 2: Three types of tiger habitat in Peninsular Malaysia based on data collected by Department of Wildlife and National Park between 1991 and 2003.
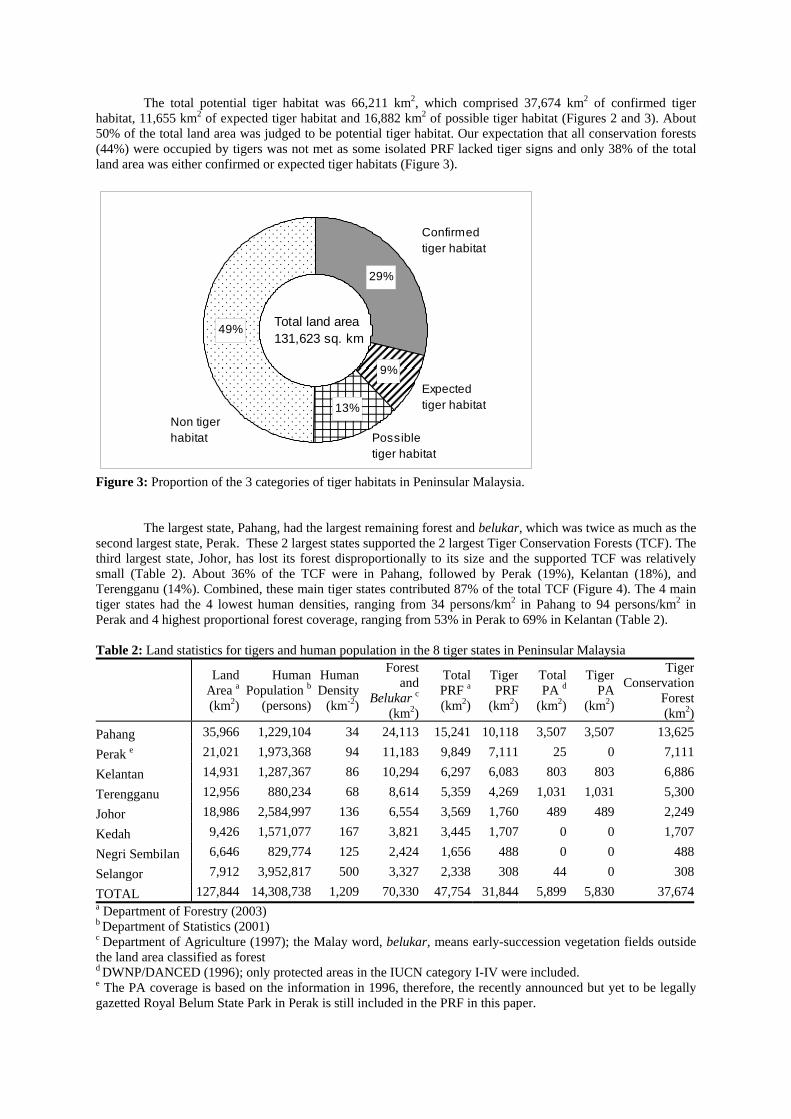
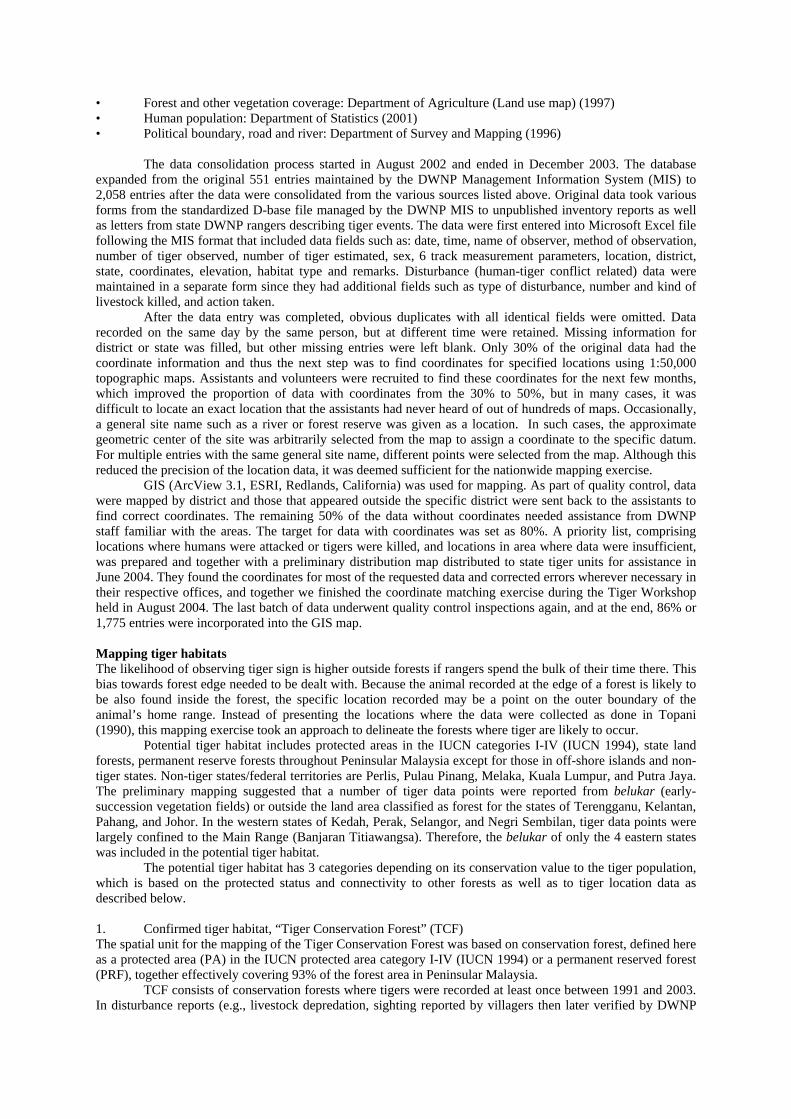
The total potential tiger habitat was 66,211 km2, which comprised 37,674 km2 of confirmed tiger habitat, 11,655 km2 of expected tiger habitat and 16,882 km2 of possible tiger habitat (Figures 2 and 3). About 50% of the total land area was judged to be potential tiger habitat. Our expectation that all conservation forests (44%) were occupied by tigers was not met as some isolated PRF lacked tiger signs and only 38% of the total land area was either confirmed or expected tiger habitats (Figure 3).
29%
9%
13%
49%
Non tiger habitat
Confirmed tiger habitat
Expected tiger habitat
Possible tiger habitat
Total land area131,623 sq. km
Figure 3: Proportion of the 3 categories of tiger habitats in Peninsular Malaysia.
The largest state, Pahang, had the largest remaining forest and belukar, which was twice as much as the second largest state, Perak. These 2 largest states supported the 2 largest Tiger Conservation Forests (TCF). The third largest state, Johor, has lost its forest disproportionally to its size and the supported TCF was relatively small (Table 2). About 36% of the TCF were in Pahang, followed by Perak (19%), Kelantan (18%), and Terengganu (14%). Combined, these main tiger states contributed 87% of the total TCF (Figure 4). The 4 main tiger states had the 4 lowest human densities, ranging from 34 persons/km2 in Pahang to 94 persons/km2 in Perak and 4 highest proportional forest coverage, ranging from 53% in Perak to 69% in Kelantan (Table 2). Table 2: Land statistics for tigers and human population in the 8 tiger states in Peninsular Malaysia
Land Area a(km2)
Human Population b
(persons)
HumanDensity
(km-2)
Forest and
Belukar c(km2)
Total PRF a(km2)
Tiger PRF
(km2)
Total PA d
(km2)
Tiger PA
(km2)
Tiger Conservation
Forest (km2)
Pahang 35,966 1,229,104 34 24,113 15,241 10,118 3,507 3,507 13,625
Perak e 21,021 1,973,368 94 11,183 9,849 7,111 25 0 7,111
Kelantan 14,931 1,287,367 86 10,294 6,297 6,083 803 803 6,886
Terengganu 12,956 880,234 68 8,614 5,359 4,269 1,031 1,031 5,300
Johor 18,986 2,584,997 136 6,554 3,569 1,760 489 489 2,249
Kedah 9,426 1,571,077 167 3,821 3,445 1,707 0 0 1,707
Negri Sembilan 6,646 829,774 125 2,424 1,656 488 0 0 488
Selangor 7,912 3,952,817 500 3,327 2,338 308 44 0 308
TOTAL 127,844 14,308,738 1,209 70,330 47,754 31,844 5,899 5,830 37,674a Department of Forestry (2003) b Department of Statistics (2001) c Department of Agriculture (1997); the Malay word, belukar, means early-succession vegetation fields outside the land area classified as forest d DWNP/DANCED (1996); only protected areas in the IUCN category I-IV were included. e The PA coverage is based on the information in 1996, therefore, the recently announced but yet to be legally gazetted Royal Belum State Park in Perak is still included in the PRF in this paper.
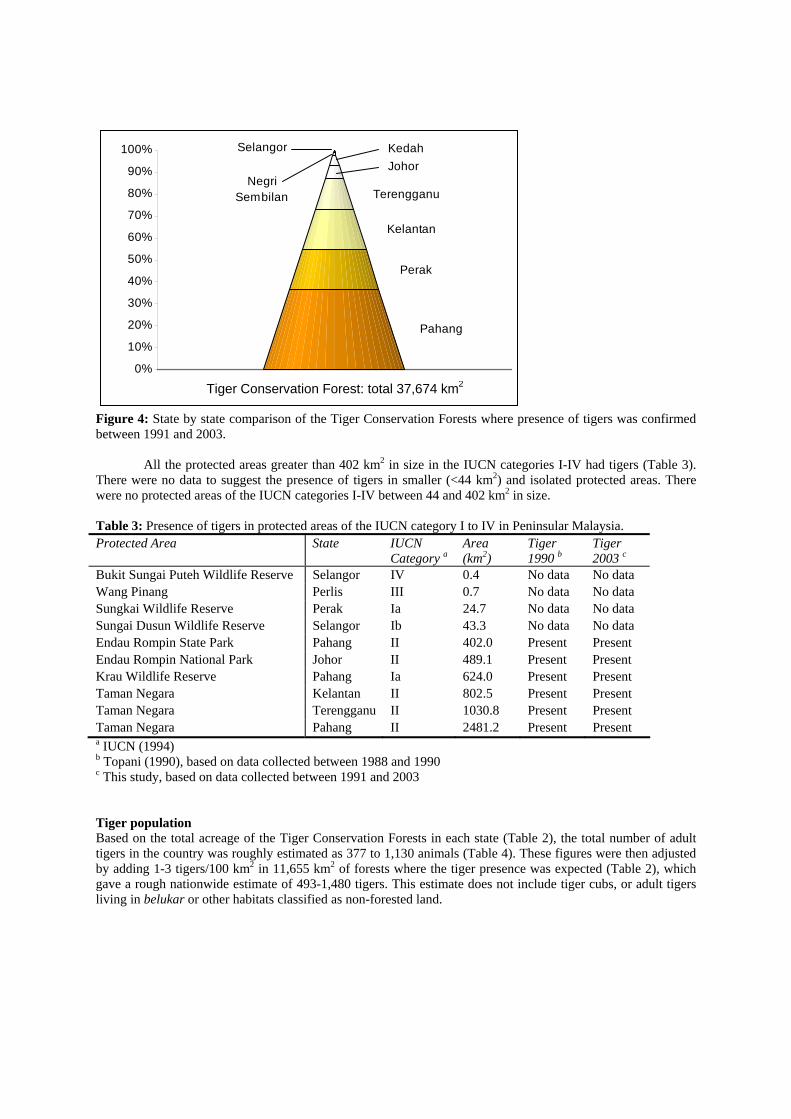
Pahang
Perak
Kelantan
Terengganu
JohorKedah
Negri Sembilan
Selangor
0%
10%
20%
30%
40%
50%
60%
70%
80%
90%
100%
Tiger Conservation Forest: total 37,674 km2
Figure 4: State by state comparison of the Tiger Conservation Forests where presence of tigers was confirmed between 1991 and 2003.
All the protected areas greater than 402 km2 in size in the IUCN categories I-IV had tigers (Table 3). There were no data to suggest the presence of tigers in smaller (<44 km2) and isolated protected areas. There were no protected areas of the IUCN categories I-IV between 44 and 402 km2 in size. Table 3: Presence of tigers in protected areas of the IUCN category I to IV in Peninsular Malaysia. Protected Area State IUCN
Category aArea (km2)
Tiger 1990 b
Tiger 2003 c
Bukit Sungai Puteh Wildlife Reserve Selangor IV 0.4 No data No data Wang Pinang Perlis III 0.7 No data No data Sungkai Wildlife Reserve Perak Ia 24.7 No data No data Sungai Dusun Wildlife Reserve Selangor Ib 43.3 No data No data Endau Rompin State Park Pahang II 402.0 Present Present Endau Rompin National Park Johor II 489.1 Present Present Krau Wildlife Reserve Pahang Ia 624.0 Present Present Taman Negara Kelantan II 802.5 Present Present Taman Negara Terengganu II 1030.8 Present Present Taman Negara Pahang II 2481.2 Present Present a IUCN (1994) b Topani (1990), based on data collected between 1988 and 1990 c This study, based on data collected between 1991 and 2003 Tiger population Based on the total acreage of the Tiger Conservation Forests in each state (Table 2), the total number of adult tigers in the country was roughly estimated as 377 to 1,130 animals (Table 4). These figures were then adjusted by adding 1-3 tigers/100 km2 in 11,655 km2 of forests where the tiger presence was expected (Table 2), which gave a rough nationwide estimate of 493-1,480 tigers. This estimate does not include tiger cubs, or adult tigers living in belukar or other habitats classified as non-forested land.
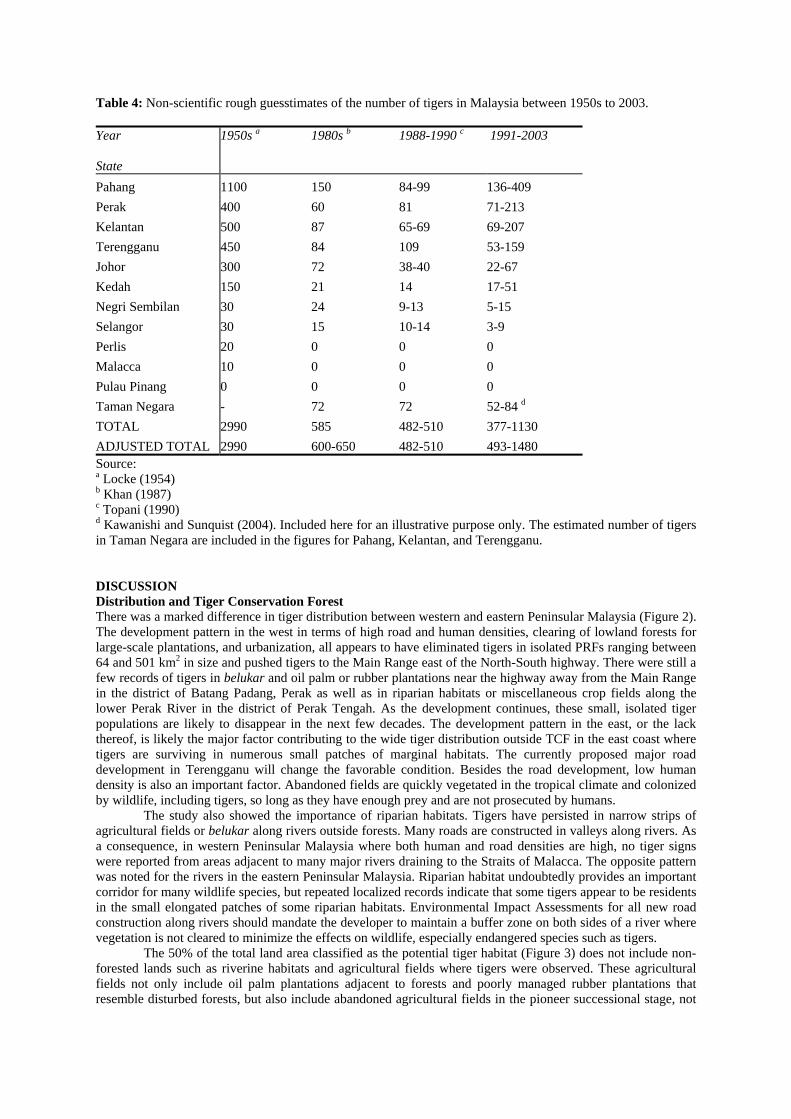
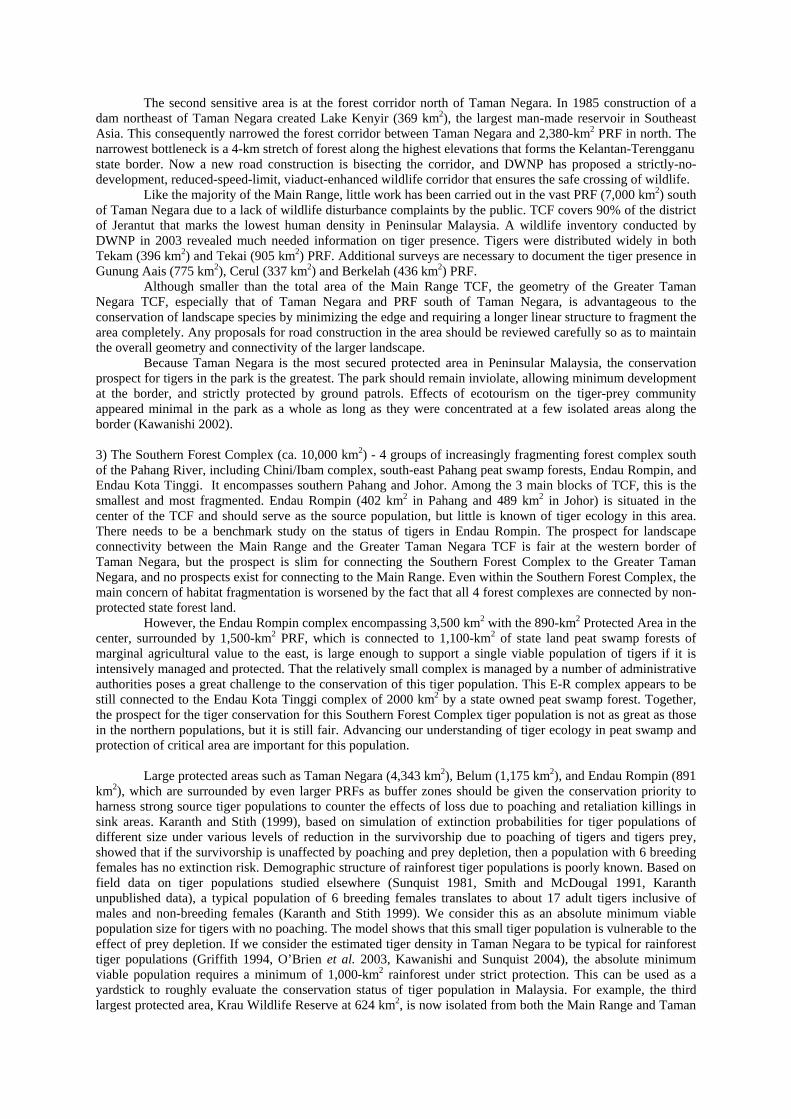
Table 4: Non-scientific rough guesstimates of the number of tigers in Malaysia between 1950s to 2003. Year State
1950s a
1980s b
1988-1990 c
1991-2003
Pahang 1100 150 84-99 136-409 Perak 400 60 81 71-213 Kelantan 500 87 65-69 69-207 Terengganu 450 84 109 53-159 Johor 300 72 38-40 22-67 Kedah 150 21 14 17-51 Negri Sembilan 30 24 9-13 5-15 Selangor 30 15 10-14 3-9 Perlis 20 0 0 0 Malacca 10 0 0 0 Pulau Pinang 0 0 0 0 Taman Negara - 72 72 52-84 d
TOTAL 2990 585 482-510 377-1130 ADJUSTED TOTAL 2990 600-650 482-510 493-1480 Source: a Locke (1954) b Khan (1987) c Topani (1990) d Kawanishi and Sunquist (2004). Included here for an illustrative purpose only. The estimated number of tigers in Taman Negara are included in the figures for Pahang, Kelantan, and Terengganu. DISCUSSION Distribution and Tiger Conservation Forest There was a marked difference in tiger distribution between western and eastern Peninsular Malaysia (Figure 2). The development pattern in the west in terms of high road and human densities, clearing of lowland forests for large-scale plantations, and urbanization, all appears to have eliminated tigers in isolated PRFs ranging between 64 and 501 km2 in size and pushed tigers to the Main Range east of the North-South highway. There were still a few records of tigers in belukar and oil palm or rubber plantations near the highway away from the Main Range in the district of Batang Padang, Perak as well as in riparian habitats or miscellaneous crop fields along the lower Perak River in the district of Perak Tengah. As the development continues, these small, isolated tiger populations are likely to disappear in the next few decades. The development pattern in the east, or the lack thereof, is likely the major factor contributing to the wide tiger distribution outside TCF in the east coast where tigers are surviving in numerous small patches of marginal habitats. The currently proposed major road development in Terengganu will change the favorable condition. Besides the road development, low human density is also an important factor. Abandoned fields are quickly vegetated in the tropical climate and colonized by wildlife, including tigers, so long as they have enough prey and are not prosecuted by humans.
The study also showed the importance of riparian habitats. Tigers have persisted in narrow strips of agricultural fields or belukar along rivers outside forests. Many roads are constructed in valleys along rivers. As a consequence, in western Peninsular Malaysia where both human and road densities are high, no tiger signs were reported from areas adjacent to many major rivers draining to the Straits of Malacca. The opposite pattern was noted for the rivers in the eastern Peninsular Malaysia. Riparian habitat undoubtedly provides an important corridor for many wildlife species, but repeated localized records indicate that some tigers appear to be residents in the small elongated patches of some riparian habitats. Environmental Impact Assessments for all new road construction along rivers should mandate the developer to maintain a buffer zone on both sides of a river where vegetation is not cleared to minimize the effects on wildlife, especially endangered species such as tigers.
The 50% of the total land area classified as the potential tiger habitat (Figure 3) does not include non-forested lands such as riverine habitats and agricultural fields where tigers were observed. These agricultural fields not only include oil palm plantations adjacent to forests and poorly managed rubber plantations that resemble disturbed forests, but also include abandoned agricultural fields in the pioneer successional stage, not

yet proclaimed as forests. Therefore, the actual area of potential tiger habitat in Malaysia is likely to be larger than the reported 66,211 km2.
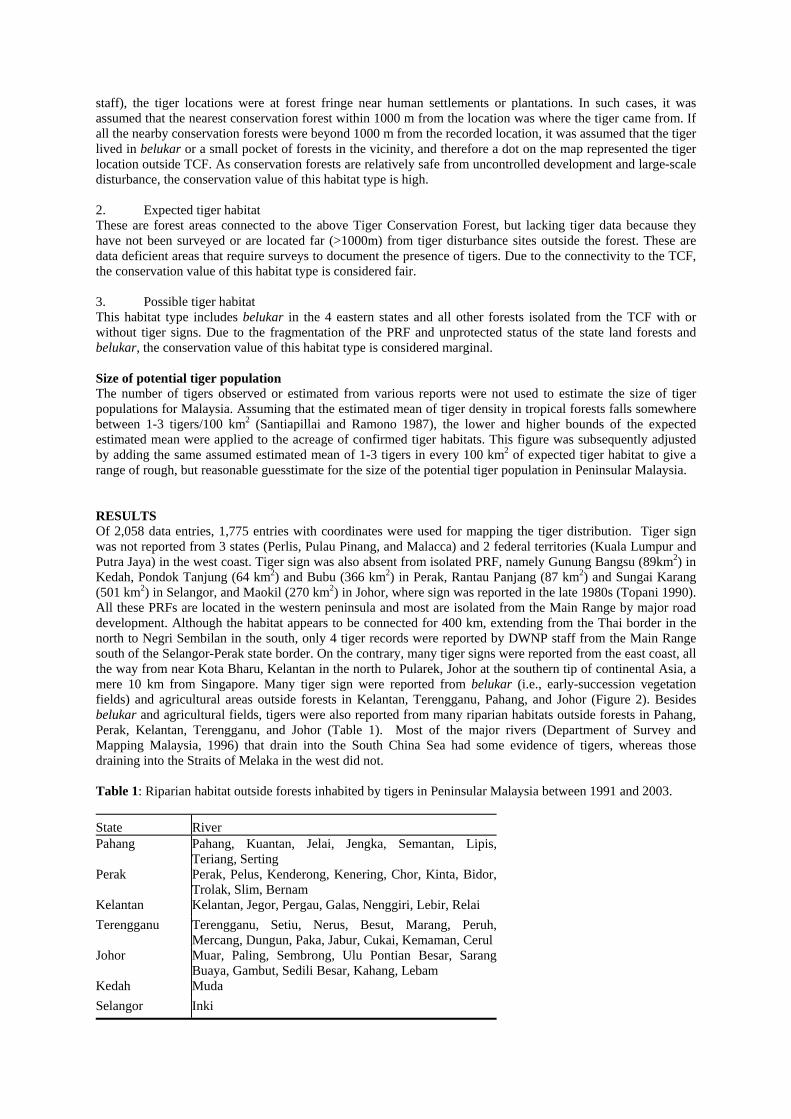
Three main blocks of Tiger Conservation Forest became apparent (Figure 5): 1) The Main Range (ca. 20,000 km2) – Hill and montane forests that stretch longitudinally over 5 or 6 states, from Perak at the Thai border, to Kelantan, Pahang, Selangor, Negri Sembilan, and possibly Kedah. It includes the Bintang Hijau forest complex in Perak, but may not include Ulu Muda in Kedah, which appears isolated by the Federal Road 67 bisecting 2-km width of forest corridor at the Perak-Kedah state border. The newly established Royal Belum State Park at 1,175 km2 at the northern end, which is adjacent to the Hala-Bala Wildlife Reserve in Thailand, is likely the main stronghold for the Main Range tiger population. Only general information on tigers is available from Belum and not much is known from the rest of the TCF. There needs to be a benchmark study on the status of tigers in Belum and rapid assessment surveys throughout the Main Range.
The forest enclave along the upper reach of the Perak River and the Federal Road 76 in the district of Hulu Perak is one of the critical conservation areas in this TCF; the number of disturbance cases is on the rise in this area and the further development along the road will isolate the Bintan Hijau forest complex to the west where a complete assemblage of large mammals is still found. The western edge of the northern Main Range TCF in the districts of Jeli and Kuala Krai in Kelantan marks the area with the highest per-district incidence of tiger-human conflicts in the past 13 years (Badrul Azhar, this volume), with the majority of incidences being concentrated along the Route 66 at the northeastern edge of the Main Range. Together with the Gua Musang district, south of Kuala Krai, this area reported the highest incidence of tigers attacking humans. As a measure of conflict management, at least 11 tigers were removed from this area between 1997 and 2002, of which 5 were removed along the road (DWNP unpublished data). The road is the major cause for the forest fragmentation in the area. Especially in poorly managed rubber plantations surrounding the road, the trend of tiger-human conflict is likely to continue until those PRF east of the road, namely Sokortaku, Jentiang, Ulu Temiang, Selara, and Relai, are completely separated from the Main Range and tigers can no longer disperse across the road and the Pergau and Galas Rivers. Among the patches of isolating PRFs, the Relai PRF at 322 km2 may still be connected, or has a good chance of being reconnected to the Greater Taman Negara at the border of the Relai and Lebir PRF if the riparian habitat along the Lebir River is maintained. On the other hand, the long-term prospect for the connectivity of the northern part of the isolating PRFs (i.e., Sokortaku, Jentiang, Ulu Temiang, and Selara) is minimal due to the existing railway and roads surrounding the PRFs as well as the expanding agricultural development around Kuala Krai (the administrative center of the Kuala Krai district) between the Ulu Temiang PRF to the west and the Greater Taman Negara to the east.
Elsewhere, much of the tiger habitat in the Main Range still appears to be connected. The Main Range tiger populations, due to expected lower densities and recruitment rates, are especially vulnerable to the effects of forest fragmentation. Due to the high elevations and steep slopes, much of the Main Range, especially the longitudinal spine of the mountain peaks that form the state borders between Perak, Kelantan, Pahang, Selangor and Negri Sembilan, are unsuitable for large-scale agricultural development and logging, and some are protected as water-catchment areas (i.e., protection forest in PRF). Therefore, road development, especially those bisecting the Main Range latitudinally, is the main threat to the Main Range tiger population. Development along the roads fragmenting the Main Range forests is already evident in Selangor and Negri Sembilan (Figure 5). Any future development along the road connecting Kuala Kubu Baru in Selangor and Raub in Pahang through Fraser’s Hill will isolate the Main Range in the south and thus increase the extinction probability of already diminishing Selangor and Negri Sembilan tiger populations. The northern Main Range tiger population, due to the vast size of contiguous TCF, is possibly viable. A closer investigation is, however, necessary to assess the viability.
2) The Greater Taman Negara (ca. 15,000 km2) - Taman Negara and contiguous PRF north and south
of the park that stretches over Kelantan, Terengganu, and Pahang. This is the largest remaining protected lowland forests in Peninsular Malaysia (Ebil and Sorenson 2000). The recently completed benchmark study (Kawanishi and Sunquist 2004) suggests that the Taman Negara tiger population, estimated at 52 – 84 adults, is viable if the threats from poaching are maintained at the current negligible level. Because the viability will be greatly enhanced by strong tiger-prey communities in the 11,000 km2 of PRF surrounding the park, efforts are underway to expand the research initiative in Taman Negara to this area and also to get local human communities in the vicinity involved in conservation.
The critical conservation areas at the western and northern borders of the park identified preliminarily by Kawanishi (2002) remain the same after this analysis. The railway and the Federal Road 8 paralleling the western border of Taman Negara at 1-2 km from the park may soon effectively separate the Greater Taman Negara from the Main Range. A 12-km stretch of the road is surrounded on both sides by state forest (not protected). Future development along the stretch of the road should be prohibited as it provides the last connectivity point between the Main Range and Greater Taman Negara.

Tiger HabitatTigers present or expected
Road
Critical Conservation AreaState Boundary
#S
Greater Taman Negara
Southern Forest Complex
Main Range
Figure 5: Three major blocks of Tiger Conservation Forests and locations of the most critical conservation areas to ensure the landscape connectivity of the TCF. See text for detailed description and discussion of the each area.
The second sensitive area is at the forest corridor north of Taman Negara. In 1985 construction of a dam northeast of Taman Negara created Lake Kenyir (369 km2), the largest man-made reservoir in Southeast Asia. This consequently narrowed the forest corridor between Taman Negara and 2,380-km2 PRF in north. The narrowest bottleneck is a 4-km stretch of forest along the highest elevations that forms the Kelantan-Terengganu state border. Now a new road construction is bisecting the corridor, and DWNP has proposed a strictly-no-development, reduced-speed-limit, viaduct-enhanced wildlife corridor that ensures the safe crossing of wildlife.
Like the majority of the Main Range, little work has been carried out in the vast PRF (7,000 km2) south of Taman Negara due to a lack of wildlife disturbance complaints by the public. TCF covers 90% of the district of Jerantut that marks the lowest human density in Peninsular Malaysia. A wildlife inventory conducted by DWNP in 2003 revealed much needed information on tiger presence. Tigers were distributed widely in both Tekam (396 km2) and Tekai (905 km2) PRF. Additional surveys are necessary to document the tiger presence in Gunung Aais (775 km2), Cerul (337 km2) and Berkelah (436 km2) PRF.
Although smaller than the total area of the Main Range TCF, the geometry of the Greater Taman Negara TCF, especially that of Taman Negara and PRF south of Taman Negara, is advantageous to the conservation of landscape species by minimizing the edge and requiring a longer linear structure to fragment the area completely. Any proposals for road construction in the area should be reviewed carefully so as to maintain the overall geometry and connectivity of the larger landscape.
Because Taman Negara is the most secured protected area in Peninsular Malaysia, the conservation prospect for tigers in the park is the greatest. The park should remain inviolate, allowing minimum development at the border, and strictly protected by ground patrols. Effects of ecotourism on the tiger-prey community appeared minimal in the park as a whole as long as they were concentrated at a few isolated areas along the border (Kawanishi 2002). 3) The Southern Forest Complex (ca. 10,000 km2) - 4 groups of increasingly fragmenting forest complex south of the Pahang River, including Chini/Ibam complex, south-east Pahang peat swamp forests, Endau Rompin, and Endau Kota Tinggi. It encompasses southern Pahang and Johor. Among the 3 main blocks of TCF, this is the smallest and most fragmented. Endau Rompin (402 km2 in Pahang and 489 km2 in Johor) is situated in the center of the TCF and should serve as the source population, but little is known of tiger ecology in this area. There needs to be a benchmark study on the status of tigers in Endau Rompin. The prospect for landscape connectivity between the Main Range and the Greater Taman Negara TCF is fair at the western border of Taman Negara, but the prospect is slim for connecting the Southern Forest Complex to the Greater Taman Negara, and no prospects exist for connecting to the Main Range. Even within the Southern Forest Complex, the main concern of habitat fragmentation is worsened by the fact that all 4 forest complexes are connected by non-protected state forest land.
However, the Endau Rompin complex encompassing 3,500 km2 with the 890-km2 Protected Area in the center, surrounded by 1,500-km2 PRF, which is connected to 1,100-km2 of state land peat swamp forests of marginal agricultural value to the east, is large enough to support a single viable population of tigers if it is intensively managed and protected. That the relatively small complex is managed by a number of administrative authorities poses a great challenge to the conservation of this tiger population. This E-R complex appears to be still connected to the Endau Kota Tinggi complex of 2000 km2 by a state owned peat swamp forest. Together, the prospect for the tiger conservation for this Southern Forest Complex tiger population is not as great as those in the northern populations, but it is still fair. Advancing our understanding of tiger ecology in peat swamp and protection of critical area are important for this population.
Large protected areas such as Taman Negara (4,343 km2), Belum (1,175 km2), and Endau Rompin (891
km2), which are surrounded by even larger PRFs as buffer zones should be given the conservation priority to harness strong source tiger populations to counter the effects of loss due to poaching and retaliation killings in sink areas. Karanth and Stith (1999), based on simulation of extinction probabilities for tiger populations of different size under various levels of reduction in the survivorship due to poaching of tigers and tigers prey, showed that if the survivorship is unaffected by poaching and prey depletion, then a population with 6 breeding females has no extinction risk. Demographic structure of rainforest tiger populations is poorly known. Based on field data on tiger populations studied elsewhere (Sunquist 1981, Smith and McDougal 1991, Karanth unpublished data), a typical population of 6 breeding females translates to about 17 adult tigers inclusive of males and non-breeding females (Karanth and Stith 1999). We consider this as an absolute minimum viable population size for tigers with no poaching. The model shows that this small tiger population is vulnerable to the effect of prey depletion. If we consider the estimated tiger density in Taman Negara to be typical for rainforest tiger populations (Griffith 1994, O’Brien et al. 2003, Kawanishi and Sunquist 2004), the absolute minimum viable population requires a minimum of 1,000-km2 rainforest under strict protection. This can be used as a yardstick to roughly evaluate the conservation status of tiger population in Malaysia. For example, the third largest protected area, Krau Wildlife Reserve at 624 km2, is now isolated from both the Main Range and Taman
Negara (Figure 2 and Figure 5), and by itself may not be large enough to support the absolute minimum viable population under no threat. However, together with 4 PRFs adjacent to Krau, the forest complex totals 1,585 km2. The problem for conservation of large mammals in Krau is not only the insularity of the habitat, but also the high development pressure surrounding the area since the 1960s and a large human population, estimated at 10 persons/km2 forest, depending on forest products for living (Laidlaw et al. 2000, DWNP/DANCED 2002). Cumulative effects of the 3 factors have driven the Sumatran rhinoceros (Dicerorhinus sumatrensis) and Asian elephant (Elephas maximus) to be locally extinct, and the dwindling population of gaur (Bos frontalis) is rather unfortunate since Krau WR was set up in 1923 to principally protect gaur. The minimum number of adult tigers known to be alive ranged from 2 (Laidlaw et al. 2000) to 3 (Hassan 1999), based on a camera-trapping study and general survey, respectively. Unless drastic measures are taken to greatly reduce the human pressure and reconnect the Krau complex back to the Greater Taman Negara, allowing tigers to disperse from Taman Negara to Krau through the increasingly human dominated landscape, Krau tigers will not survive in the long term. Krau WR is becoming a living laboratory to showcase the effects of habitat insularization and high human impacts on large mammal populations. The example of Krau also cautions that the absolute minimum area required for viable tiger population must be under strict protection. Alternatively, if one was to establish a tiger reserve a minimum area of 1,000 km2 is recommended. Potential Population Size When the general public refers to “tiger population”, it is usually inclusive of tiger cubs. Evidence of breeding is difficult to document, but if an area is known to be occupied by tigers for decades it is not unreasonable to assume that they are members of a breeding population or part of a breeding meta-population. There are no demographic data on a wild Malayan tiger population. If we assume that 25% of a typical tiger population consists of cubs as suggested by Karanth and Stith (1999), the total tiger population is estimated at 657 to 1,973 tigers in Malaysia. Without the demographic data on a Malayan tiger population, however, the discussion below is based only on the estimated adult tiger population.
Compared to the previous 2 population estimates (Khan 1987, Topani 1990), the exceptionally wide range of the current estimate is notable, yet normal for an informed guesstimate of this nature based on a non-scientific method. For example, Gros (2002) estimated cheetah (Acinonyx jubatus) numbers in Tanzania at 569 to 1,007. Similarly, Morrogh-Bernard, et al. (2003) estimated there were 5,671 to 8,951 orang-utan (Pongo pygmaeus) in a peat swamp of Kalimantan, Indonesia. In a sampling-based, statistical estimate of a population size, a wide variance or confidence interval indicates less precision in the estimate. The variance could not be estimated in this exercise, and the sources for variance were probably many but unknown. The wide estimated range given here provides the best guess based on the available information and is to be further refined by future improvements suggested below.
Direct comparison between this and past estimates are not advisable due to a lack of standardized methodology and variance estimates; yet, striking similarities are noted especially between this study and that of Topani (1990). In 7 of 9 states, Topani’s estimates (Table 4) were within the population range suggested in this study. As mentioned earlier, Topani’s estimates, based largely on data collected by following up disturbance cases without taking into an account of the whole area occupied by tigers, could be considered as the lower bound of Malaysia’s tiger population. This is supported by the result of our study, possibly suggesting that not everyone but only trained rangers who participated in Topani’s study could distinguish individual tigers in their home district based on the difference in pugmarks. The fact that tigers occur at lower densities in tropical Asia also contribute to the ease of differentiating animals by track at each site as in most cases, estimated numbers per site were between 1 and 3 animals (Topani 1990). Their skill can be tested using a similar method described by Karanth (1987) or Smith et al. (1999). To further support this claim, it was noted that the sampling-based density estimate of 1.66 tigers/100 km2, which translated into the 95% confidence interval of 52 to 84 adult tigers in Taman Negara (Kawanishi and Sunquist 2004), contained the point estimate of 72 tigers originally given by Khan (1987) based on expert knowledge and an arbitrary assumption of 3 tigers to every site with a tiger record. As a large protected primary forest with negligible negative human impact (Kawanishi and Sunquist 2004), the Taman Negara tiger population has probably been stable and all river systems reported to support tigers in 1990 (Khan 1990) still do today (Kawanishi and Sunquist unpublished data, DWNP unpublished data). There are a number of reasons why the pugmark method should not be used to estimate an absolute population size, but basically it provides an unreliable and sometimes dangerous result, especially if survey personnel are unskilled in field methods (Karanth et al. 2004). Of particular concern in Malaysia is that many skilled rangers with over 20 years of experience are approaching retirement age and field training of new staff has been slow, partly because many of the new staff are reluctant to work in the forest. Field surveys performed by unqualified staff will definitely lower the reliability of any future survey work.
The maximum estimate of 1,480 adult tigers assumes that on average every 100 km2 of known TCF and expected tiger habitat support 3 adult tigers, which is similar to the rough density estimate by Locke (1954) based on his observations and experience in Terengganu. TCFs at higher elevations, large primary forests, or
areas under high poaching pressure (of both tigers and tigers prey) are likely to support lower densities of tigers. On the other hand, TCFs in non-climax successional stage, near plantations with abundant pigs and livestock, are likely to support higher densities of tigers. For example, a study in a 140-km2 mosaic of logged and unlogged patches of forest reserve surrounding an oil palm plantation in Terengganu documented 7 adult tigers and 3 cubs in 9 months of camera-trapping (Mohd. Azlan and Sharma 2003). In another isolated, logged forest reserve adjacent to an oil palm plantation in Kelantan, a rapid assessment study documented 3 tigers in a small sampling area of 40 km2 during 1 month of camera trapping (WCS 2004). Likewise, occasionally up to 4 tigers have been sighted at once by DWNP staff (DWNP unpublished data) in or near oil palm plantations in other areas. In Way Kambas National Park, Sumatra, a camera-trap study in a 160-km2 mosaic of open grassland and secondary forest recorded 21 tigers over 16 months. The preliminary analysis indicated the tiger density in this study site at 4.3 tigers/100 km2 (Franklin et al. 1999).
There were many tiger records from Kelantan and Terengganu and some in Pahang and Johor that were not included in the TCF because they were from belukar or other non-forest habitat types (Figure 2). The estimate given here does not take into full consideration the number of tigers thriving in marginal habitats. It is thus unlikely that the total population is lower than the minimum estimate of 493 animals or the overall mean density of <1 tiger/100 km2 unless tigers and their principal prey are being depleted due to poaching all over Malaysia. An accurate assessment of the extent of poaching is difficult. The number of tiger-related offences apprehended and fined levied between 1990 and 2000 in Peninsular Malaysia was 31 cases with an average of 3 cases per year (Elagupillay et al. 2001). Until more in-depth investigation of the extent of poaching is conducted, the available information indicates that the negative impact of poaching on the existing tiger population is negligible.
The rough estimate of tiger populations in Malaysia can be further refined, and the estimated range narrowed by stratifying TCFs by habitat types such as montane forest, secondary hill dipterocarp forests, and peat swamps. Future camera-trapping studies in a sampling-based mark-recapture framework from the various habitat types will improve our understanding of tiger densities in habitats of varying quality. Furthermore, densities in the upper (e.g., in mosaics of forests in early successional stage adjacent to plantations) and lower bounds (e.g., montane forests or populations under high threats) should be investigated to test whether the general assumption of 1-3 tigers/100 km2 is valid for tropical forests. In tropical forests where vegetation and water are unlimited, habitat quality is largely determined by the abundance of available prey. It is commonly assumed that even though some of the deer species may be locally depleted, wild boar is abundant and omnipresent, especially near oil palm plantations. This claim, as well as to what extent the tiger diet is supplemented by livestock, must be investigated to understand the actual habitat productivity beyond what nature could provide.
Wild boar is a protected game species and thus hunting is regulated by DWNP through licensing. The Malaysian population is made up of 65% Bumiputera (Malays and Indigenous minorities), 26% Chinese and 8% Indians (Department of Statistics 2001). Each ethnic group tends to congregate locally and with Chinese populations preferring urban areas, many rural areas are occupied only by Bumiputera, whose Islamic belief prohibits them from consuming wild boar. Some plantation managers in these areas will hire Chinese hunters from elsewhere to shoot the pests. In other areas with local Chinese populations, wild boar are readily taken in oil palm plantations as hunters do not need to go deep into the forest. We hypothesize that wild boar density would correlate positively with amount of forest edge against oil palm plantations and negatively with the size of local Chinese population, and that the cumulative effect of these 2 factors in turn affects the local tiger density. It is also important to more closely investigate the extent of poaching and retaliation killings, which may have an irreversible effect on local tiger populations.
Until we have a better understanding of tiger densities from habitats of different quality and the effect of various threats to the population size, the estimate remains a reasonable guesstimate based on area occupied by tigers and our general understanding of tiger densities in tropical forests. Yet, we believe that if the known and current land area for the potential tiger habitat is maintained, the refined estimate will fall somewhere between 493 and 1,480 adult tigers. If Malaysia maintains its current tiger habitat, the country can support the largest nationwide tiger population in Southeast Asia, assuming that the unknown effect of poaching is not detrimental. Limitations of this analysis and recommendations
• The majority of the data were collected and recorded by rangers with various skills in a non-standardized manner. The precision and quality of the data are compensated over the quantity, and may not be “scientific” enough to be considered reliable by scientists. Or it may simply be regarded as an ‘unsubstantiated guess by the government’ (see Rabinowitz 1999). However, in this paper, improvements were made by documenting methodology, assumptions and limitations of the analysis. The result is not scientific, but is based on the available information on which further refinements are needed.
• The tiger data included mortalities and removals (trapped and sent to the Melaka Zoo). If a tiger removed from an isolated forest was the last tiger there, and no subsequent immigration occurred, then the area is actually void of tigers. Furthermore, if the presence was recorded in early 1990s of the last individual from an area and no subsequent immigration occurred, then the population may be extirpated by now. Confirmation of local extirpation (death of the last tiger from an isolated population) is extremely difficult. But these small isolated populations have little conservation value and may be considered “ecologically extinct”. Examples are the populations in Air Hitam PRF (Selangor), Belata PRF (Selangor), Gunung Ledang PRF (Johor), and Bukit Hantu PRF (Johor). Nevertheless, this distribution map shows where tigers were found between 1991 and 2003 instead of where they are today.
• Without coordinates, the tiger location information cannot be mapped using GIS. It took substantial additional effort to locate missing coordinates and correct wrong coordinates. As a result, coordinates for many tiger locations had to be approximated. This needs to be improved by standardizing the data collection form that mandates the coordinate information to be recorded using topo maps or GPS before submission to the DWNP headquarters. Every ranger should be trained to read maps and GPS correctly.
• Because data were collected by individuals with various field skills, there was a possibility that leopard tracks were misidentified as tiger tracks by less experienced staff. Tiger unit rangers and other experienced rangers should be encouraged to train new staff in how to differentiate the tracks of these 2 large cats. The morph-metrics of specimen tracks from captive animals should be studied to statistically differentiate the pad size so that the known difference can be applied in the field to differentiate between Peninsular Malaysia’s 2 largest carnivores.
Conservation Implications The priority for the future research and conservation of the Malayan tiger is: 1) monitor the source populations in Belum, Taman Negara, and Endau Rompin, 2) determine the source and extent of the threat to the populations and 3) reduce or eliminate the threat, while 4) strengthening the protection of the source populations, 5) minimizing the loss of tigers at forest edges and 6) maintaining the landscape connectivity at least within, and ideally across the TCF.
At the landscape level in the long term, those 3 main blocks of TCF are best connected as suggested by the National Physical Plan for Malaysia drafted by the Government of Malaysia due out in 2005 (Department of Town and Country Planning in litt.), but at least the landscape connectivity within each TCF should be maintained. In reality, the fragmentation process within each TCF is progressing whenever roads are constructed. The actual connectivity at the critical conservation areas identified in this study based on the GIS mapping (Figure 5) needs to be assessed on the ground and a closer investigation in the Main Range and Southern Forest Complex TCF may identify more areas. The National Physical Plan will provide the framework while collaboration with the Public Works Department and state landuse authorities are needed to ensure the connectivity at the critical areas.
At the national level, resources for tiger conservation are better distributed proportionally to the state total acreage of the Tiger Conservation Forests whereas that for tiger-human conflict management requires further investigation into spatial concentration of such conflict. Unless resources are allocated separately for conflict management (i.e., attending villagers complains) and conservation activities, states with large number of disturbance cases would have little resources left for the latter that deals with long-term effects instead of reactions to complains. Some of the examples of the long-term conservation activities include: research on population dynamic of tigers and prey species, research on impacts of hunting on prey populations, management (manipulation) of populations of tigers and prey species, identification and protection of wildlife movement corridors, education of school children, eradication of market and trade for traditional medicines and bush-meat restaurants, protected area zonation and habitat enhancement, blockage of idle logging roads, support network and incentives for rangers and informants, and forest stewardship programs for villagers and orang asli. Much more research is needed to improve our understanding of the status of the Malayan tigers and impacts of threats to the populations. This requires collaboration with local and international academic/research institutions.
At the state level, the effort to minimize the disturbance cases caused by tigers at almost every forest edge needs to be continued as part of DWNP’s client charter to the public while the focus for protection of tigers and their habitats needs to go closer to the source populations in large protected areas because with the current resources, to some extent occasional losses to the tiger population inhabiting marginal habitats is inevitable. The budget needs to be allocated separately so as not to compromise one over the other. More research on various ecological aspects of tigers are encouraged at every tiger state, but especially monitoring of the source populations at the 3 large protected area needs to be implemented following the methods described by Karanth and Nichols (2002).

ACKNOWLEDGMENTS We would like to thank the DWNP Director General, Dato’ Musa Nordin, and the former Division Director of the Research and Conservation, Hj Sahir Othman for overall support and guidance for this project. Thanks are also due to DWNP state directors for facilitation and support for data collection and data transfer as well as state rangers for their work on the ground. Over the 13-year data collection period, hundreds of DWNP staff were involved in the data collection in one way or the other. The effort of each deserves recognition as without them there are no data. The primary author would especially like to acknowledge Mr. Mohamad Ismail for valuable discussion on tiger ecology and his leadership and dedication in the tiger work in northern states. Lastly a handful of tiger rangers who voluntarily provided expert inputs and time to find coordinates to location data in order to improve the preliminary distribution map were greatly appreciate. Drs. Melvin Sunquist and Zainal Zahari Zainuddin reviewed the manuscript and provided valuable inputs. The final data consolidation and mapping exercise were funded by the Save the Tiger Fund, a special project of the National Fish and Wildlife Foundation in partnership with ExxonMobil Foundation. LITERATURE CITED Boomgaard, P. 2001. Frontiers of fear: tigers and people in the Malay World 1600-1950. Yale Univ. Press, New Haven. Dinerstein, E., E. Wikramanayake, J. Robinson, U, Karanth, A. Rabinowitz, D. Olson, T. Mathew, P. Hedao, M. Connor, G. Hemley, and D. Bolze. 1997. A framework for identifying high priority areas and actions for the conservation of tigers in the wild. World Wildlife Fund-US, Washington, D. C., USA
Department of Forestry. 2003. Laporan Tahunan. Kuala Lumpur, Malaysia.
Department of Statistics. 2001. Population and housing census of Malaysia 2000: population distribution by local authority areas and mukims. Putra Jaya, Malaysia.
Department of Survey and Mapping. 1996. Map of Semenanjung Malaysia, 1:500 000, Edition PPNM, Series L4010, Sheet 1. Kuala Lumpur, Malaysia.
DWNP-DANCED. 1996. A master plan on capacity building & strengthening of the protected areas system in Peninsular Malaysia. Department of Wildlife and National Parks, Kuala Lumpur.
DWNP-DANCED. 2002. Management Plan for the Krau Wildlife Reserve. Kuala Lumpur, Malaysia.
Ebil, Y. and K. W. Sorenson. 2002. Introduction: protected area management experiences. Journal of Wildlife and Parks 18:3-13.
Eisenberg, J. F., and J. Seidensticker. 1976. Ungulates in southern Asia: a consideration of biomass estimates for selected habitats. Biological Conservation 10:293-308. Elagupillay S.T., R. Laidlaw, and W. N. WanShahuruddin. 2001. Tiger conservation and the Department of Wildlife and National Parks (DWNP), Peninsular Malaysia. Jounal of Wildlife and Parks 19: 89-97. Franklin, N. Bastoni, Sriyanto, D. Siswomartono, J. Manansang, and R. Tilson. 1999. Last of Indonesian tigers: a cause for optimism. Pages 130-147 in J. Seidensticker, S. Christie, and P. Jackson, eds. Riding the Tiger: tiger conservation in human-dominated landscapes. Cambridge University Press, Cambridge, UK. Griffiths, M., 1994. Population density of Sumatran tigers in Gunung Leuser National Park. In: Tilson, R.L., Soemarna, K., Ramono, W., Lusli, S., Traylor-Holzer, K., Seal, U.S. (Eds.), Sumatran Tiger Report: Population and Habitat Viability Analysis. Indonesian Directorate of Forest Protection and Nature Conservation and IUCN/SSC Conservation Breeding Specialist Group, Apple Valley, Minnesota, pp 93-102. Gros, P. M. 2002. The status and conservation of the cheetah Acinonyx jubatus in Tanzania. Biological Conservation 106: 177-185.
Hassan, K., A. C. Man, R. Topani, M. Muhamad, S. Wahid, and Y. Ebil. 1999. Large mammal survey at Krau Wildlife Reserve, Pahang. Journal of Wildlife and Parks 17:89-95.
Hemley, G. and J. A. Mills. 1999. The beginning of the end of tigers in trade? Pages 217-229 in J. Seidensticker, S. Christie, and P. Jackson, eds. Riding the Tiger: tiger conservation in human-dominated landscapes. Cambridge University Press, Cambridge, UK. IUCN 1994. Guidelines for protected area management categories. IUCN, Cambridge, UK and Gland, Switzerland. Karanth, K. U., 1987. Tigers in India: a critical review of field censuses. In Tigers of the world: the biology, biopolitics, management, and conservation of an endangered species, eds. R. C. Tilson & U. S. Seal, pp. 118-132. Noyes Publication, Park Ridge, New Jersey. Karanth, K. U. 1995. Estimating tiger Panthera tigris populations from camera-trapping data using capture-recapture models. Biological Conservation 71:333-338. Karanth, K. U., and B. M. Stith. 1999. Prey depletion as a critical determinant of tiger population viability. Pages 100-113 in J. Seidensticker, S. Christie, and P. Jackson, eds. Riding the Tiger: tiger conservation in human-dominated landscapes. Cambridge University Press, Cambridge, UK. Karanth, K. U., and J. D. Nichols. 2002. Monitoring tigers and their prey: a manual for wildlife researchers, managers and conservationists in tropical Asia. Center for Wildlife Studies, Bangalore, India. Karanth, K. U., J. D. Nichols, J. Seidensticker, E. Dinerstein, J. L. D. Smith, C. McDougal, A. J. T. Johnsingh, R. S. Chundawat, and V. Thapar. 2003. Science deficiency in conservation practice: the monitoring of tiger populations in India. Animal Conservation 6:141-146. Karanth, K. U., J. D. Nichols, N. S. Kumar, W. A. Link, and J. E. Hines. 2004. Tigers and their prey: Predicting carnivore densities from prey abundance. PNAS 101:4854-4858. Karanth, K. U., J. D. Nichols, P. K. Sen, and V. Rishi. 2002. Monitoring tigers and prey: conservation needs and managerial constrains. Pages 1-8 in K. U. Karanth and J. D. Nichols, eds. Monitoring tigers and their prey: a manual for wildlife researchers, managers and conservationists in tropical Asia. Center for Wildlife Studies, Bangalore, India. Kawanishi, K. 2002. Population status of tigers (Panthera tigris) in a primary rainforest of Peninsular Malaysia. Ph. D. Dissertation. University of Florida, Gainesville, USA. Kawanishi, K. and M. Sunquist. 2004. Conservation status of tigers in a primary rainforest of Peninsular Malaysia. Biological Conservation 120 (3): 329-344. Khan, M. K. M. 1987. Tiger in Malaysia: prospects for the future. Pages 75-84 in Tigers of the world. R. C. Tilson, and U. S. Seal, eds. Noyes Publications, Park Ridge, New Jersey, USA. Khan, M. K. M. 1990. Large Animals of Taman Negara. Journal of Wildlife and Parks 10:166-171. Laidlaw, R. K., M. T. Abdul Rahman, and Z. Zainal. 2000. Large mammals. Journal of Wildlife and Parks 18: 75-106. Locke, A. 1954. The tigers of Trengganu. Museum Press Ltd., London, UK. Morrogh-Bernard, H., S. Husson, S. E. Page, and J. O. Rieley. 2003. Population status of the Bornean orang-utan (Pongo pygmaeus) in the Sebangau peat swamp forest, Central Kalimantan, Indonesia. Biological Conservation 110: 141-152. Mohd Azlan, J., and D. S. K. Sharma. 2003. Camera trapping the Indochinese tiger, Panthera tigris corbetti, in a secondary forest in Peninsular Malaysia. The Raffles Bulletin of Zoology 51: 421-427. Myers, N. 1980. Conservation of tropical moist forests. National Academy of Science, Washington, D. C., USA.

Nichols, J. D., and K. U. Karanth. 2002. Population monitoring: a conceptual framework. Pages 23-28 in K. U. Karanth and J. D. Nichols, eds. Monitoring tigers and their prey: a manual for wildlife researchers, managers and conservationists in tropical Asia. Center for Wildlife Studies, Bangalore, India. O’Brien, T.G., M. F. Kinnaird, and H. T. Wibisono. 2003. Crouching tigers, hidden prey: Sumatran tiger and prey populations in a tropical forest landscape. Animal Conservation 6: 131-139. Rabinowitz, A. 1999. The status of the Indochinese tiger: separating fact from fiction. Pages 148-165 in J. Seidensticker, S. Christie, and P. Jackson, eds. Riding the Tiger: tiger conservation in human-dominated landscapes. Cambridge University Press, Cambridge, UK. Santiapillai, C., and W. S. Ramono. 1987. Tiger numbers and habitat evaluation in Indonesia. Pages 85-91 in R. C. Tilson, and U. S. Seal, eds. Tigers of the world. Noyes Publications, Park Ridge, New Jersey, USA. Schaller, G. B. 1967. The deer and the tigers: a study of wildlife in India. University of Chicago Press, Chicago, USA. Seidensticker, J., S. Christie, and P. Jackson. 1999. Preface. Pages xv – xix in J. Seidensticker, S. Christie, and P. Jackson, eds. Riding the Tiger: tiger conservation in human-dominated landscapes. Cambridge University Press, Cambridge, UK. Smith, D. J. L., and C. McDougal. 1991. The contribution of variance in lifetime reproduction to effective population size in tigers. Conservation Biology 5:484-490. Smith, D. J. L., C. McDougal, S. C. Ahearn, A. Joshi, and K. Conforti. 1999 Metapopulation structure of tigers in Nepal. Pages 176-191 in J. Seidensticker, S. Christie, and P. Jackson, eds. Riding the Tiger: tiger conservation in human-dominated landscapes. Cambridge University Press, Cambridge, UK. Sunquist, M. E. 1981. The social organization of tigers Panthera tigris in Royal Chitawan National Park, Nepal. Smithson. Contrib. Zool. 336:1-98. Topani, R. 1990. Status and distribution of tiger in Peninsular Malaysia. Journal of Wildlife and Parks 9:71-102. WCS. 2004. Status, ecology and conservation of tigers in Peninsular Malaysia. Unpublished report to the Department of Wildlife and National Parks Peninsular Malaysia.