preface - The Mori Memorial Foundation, Tokyomori-m-foundation.or.jp/pdf/GPCI2017_en.pdf · 1...
24
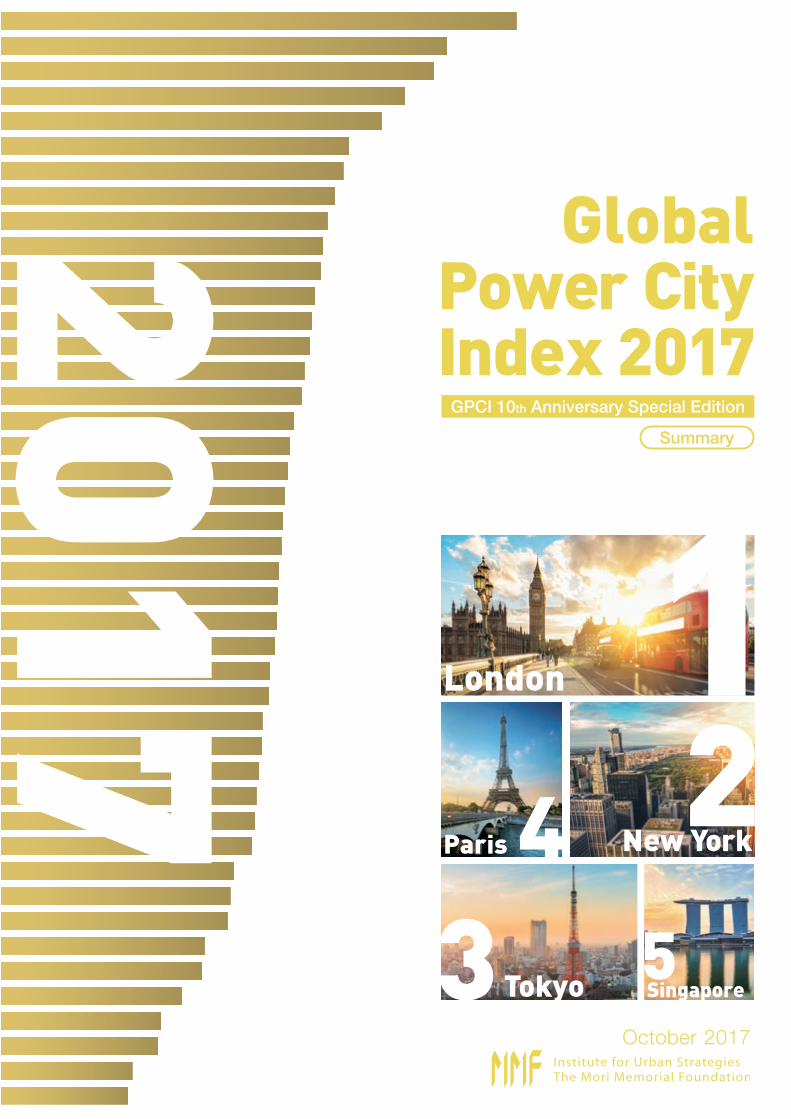
2017 GPCI 10th Anniversary Special Edition 1 2 4 5 3 London Tokyo Singapore Paris New York Summary October 2017 Global Power City Index 2017
Transcript of preface - The Mori Memorial Foundation, Tokyomori-m-foundation.or.jp/pdf/GPCI2017_en.pdf · 1...
1 London
2 New York
3 Tokyo
4 Paris
5 Singapore
6 Seoul
7 Amsterdam
8 Berlin
9 Hong Kong
10 Sydney
11 Los Angeles
12 Frankfurt
13 Beijing
14 Vienna
15 Shanghai
16 Stockholm
17 San Francisco
18 Zurich
19 Toronto
20 Copenhagen
21 Brussels
22 Chicago
23 Dubai
24 Barcelona
25 Boston
26 Osaka
27 Madrid
28 Vancouver
29 Washington D.C.
30 Istanbul
31 Kuala Lumpur
32 Milan
33 Bangkok
34 Geneva
35 Moscow
36 Taipei
37 Fukuoka
38 Mexico City
39 Sao Paulo
40 Buenos Aires
41 Jakarta
42 Mumbai
43 Cairo
44 Johannesburg
2017Global Power City Index 2017
© 2017 The Mori Memorial Foundation
GPCI 10th Anniversary Special Edition
124
53
London
Tokyo Singapore
Paris New York
Summary
October 2017
GlobalPower City Index 2017

Features of The Global Power City Index (GPCI)
In this report, the names of the GPCI functions are marked in bold, those of the indicators in italics, and those of the indicator groups and the factors are enclosed in quotation marks (“ ”).
Given the global competition between cities, the Global
Power City Index (GPCI) evaluates and ranks the major
cities of the world according to their “magnetism,” or
their comprehensive power to attract creative people and
business enterprises from around the world.
Considering that the comprehensive power sought
by each city fluctuates in accordance with economic
and social changes, the GPCI has continually strived to
improve its �ndings by revising its indicators and methods
of data collection. The GPCI-2017 has endeavored
to obtain more reliable and highly objective data for a
number of indicators, while adding new data that suitably
reflect current conditions, such as the advancement of
women in society, ICT infrastructure, and risks to mental
health. The breadth of the GPCI has also been expanded
this year to encompass 44 cities – the new cities being
Dubai, the center of trade and commerce in the Middle
East, and Buenos Aires, one of the major cities in South
America.
The GPCI is now in i ts tenth year of publ icat ion
following its initial release in 2008. During this decade-
long period, the world has seen financial crises, large-
scale natural disasters, a growing population that now
exceeds seven billion, and technological advancements
that have brought us the smartphone and other devices.
The urban environments that envelop cities have also
changed dramatically, and as if responding to such
changes, cities around the world have seen their urban
power affected relative to the global context. The Mori
Memorial Foundation’s Institute for Urban Strategies has
continued to follow this evolution of urban power over
the past decade.
The research results of the past 10 years should serve
as valuable data to help us understand the challenges
faced by cities around the world, as well as what makes
them appealing. We hope that the GPCI can assist many
people in the formulation of urban policies and corporate
strategies.
* More detailed results of research conducted for this ranking are scheduled to be published in January 2018 in the Global Power City Index YEARBOOK 2017. This report provides speci�c details on the methods of research used, scores for each city, ranking analyses, de�nitions of indicators and lists of data sources.
1. As opposed to limiting the ranking to particular areas of research such as “Finance” and “Livability,” the GPCI focuses on a wide variety of functions in order to assess and rank the global potential and comprehensive power of a city.
2. 44 of the world’s leading cities were selected and their global comprehensive power evaluated based on the following viewpoints: six main functions representing city strength (Economy, Research and Development , Cultural Interaction , Livabil ity , Environment , and Accessibility), and five global actors who lead the urban activities in their cities (Manager, Researcher, Artist, Visitor, and Resident), thus providing an all-encompassing view of the cities.
3. The GPCI reveals the strengths and weaknesses of each city and at the same time uncovers problems that need to be overcome.
4. This ranking has been produced with the involvement of the late Sir Peter Hall, a global authority in urban studies, as well as other academics in this �eld. It has been peer reviewed by third parties, all international experts from both the public and private sectors.
Global Power City Index 2017 01
Preface
25 Boston 25 Boston
38 Mexico City 38 Mexico City
17 San Francisco 17 San Francisco
22 Chicago 22 Chicago
19 Toronto 19 Toronto
42 Mumbai 42 Mumbai
23 Dubai 23 Dubai 36 Taipei 36 Taipei
13 Beijing 13 Beijing
15 Shanghai 15 Shanghai
33 Bangkok 33 Bangkok
31 Kuala Lumpur 31 Kuala Lumpur
35 Moscow 35 Moscow
27 Madrid 27 Madrid 32 Milan 32 Milan
18 Zurich 18 Zurich 12 Frankfurt12 Frankfurt
14 Vienna14 Vienna
34 Geneva 34 Geneva
21 Brussels 21 Brussels
20 Copenhagen 20 Copenhagen
39 Sao Paulo 39 Sao Paulo
40 Buenos Aires40 Buenos Aires
43 Cairo 43 Cairo
37 Fukuoka 37 Fukuoka
26 Osaka 26 Osaka
28 Vancouver 28 Vancouver
30 Istanbul 30 Istanbul 24 Barcelona 24 Barcelona
16 Stockholm 16 Stockholm
11 Los Angeles 11 Los Angeles
29 Washington, D.C. 29 Washington, D.C.
41 Jakarta41 Jakarta
44 Johannesburg44 Johannesburg
Top 10 Cities by Function-Specific Ranking
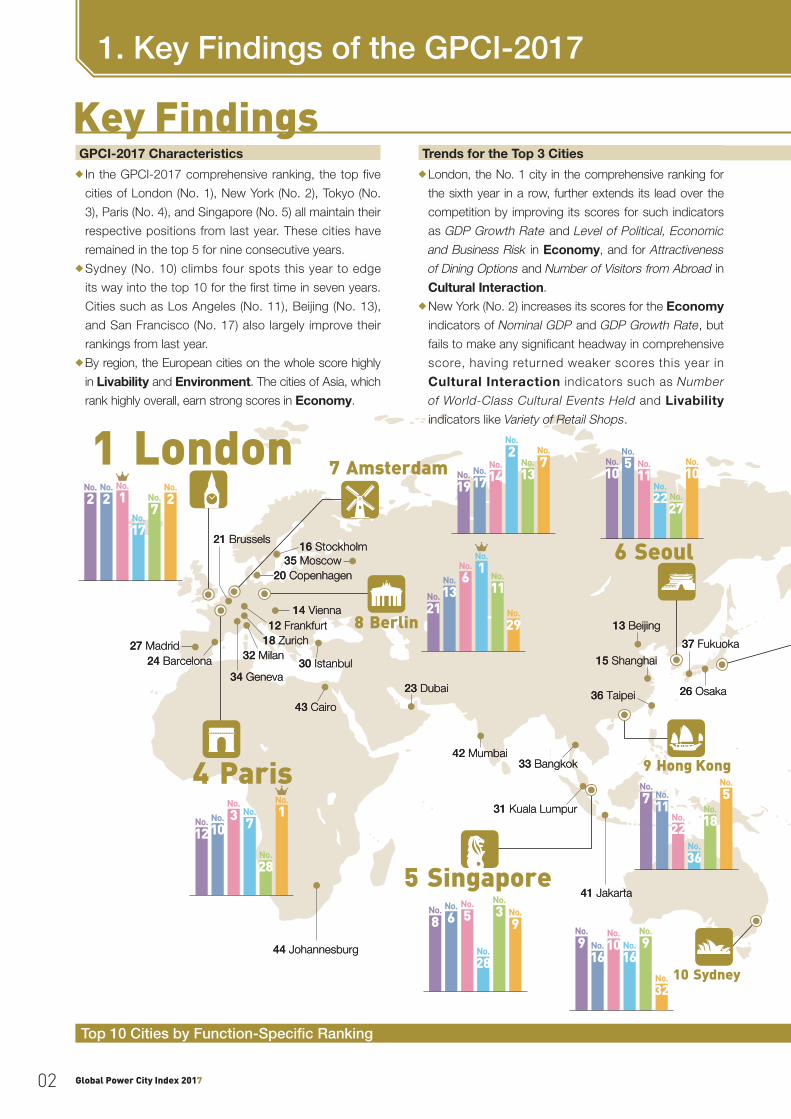
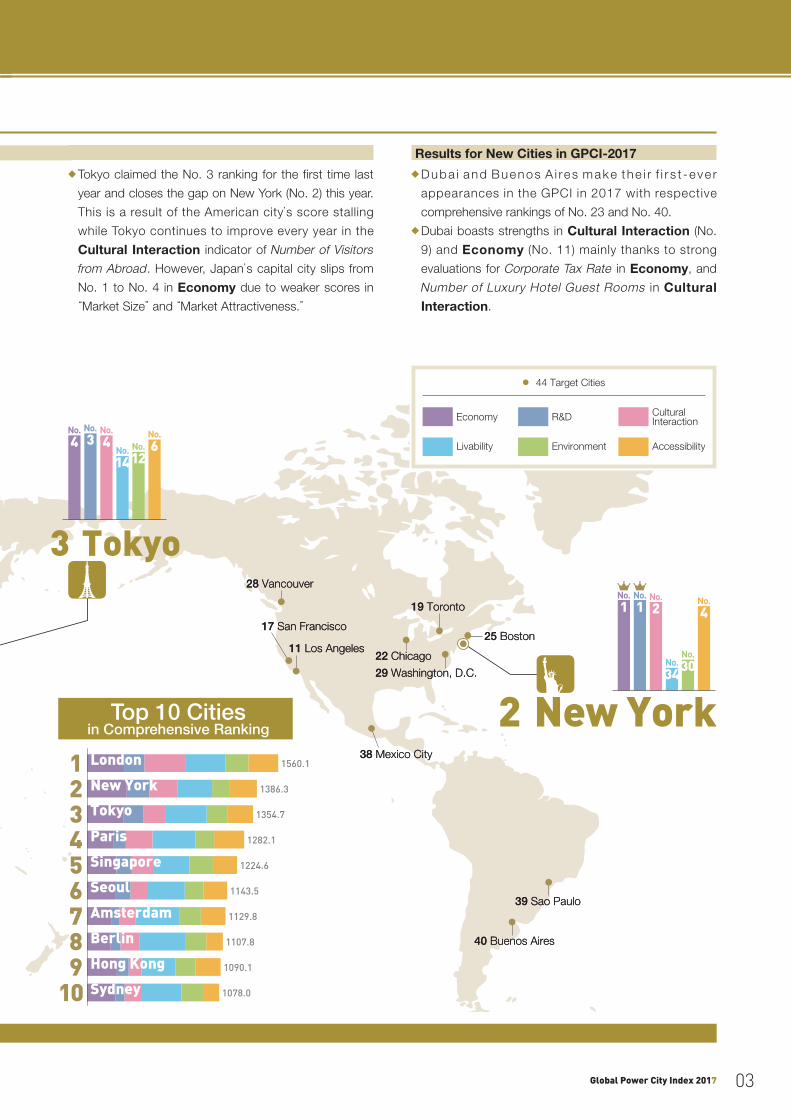
GPCI-2017 Characteristics◆ In the GPCI-2017 comprehensive ranking, the top �ve
cities of London (No. 1), New York (No. 2), Tokyo (No.
3), Paris (No. 4), and Singapore (No. 5) all maintain their
respective positions from last year. These cities have
remained in the top 5 for nine consecutive years.◆ Sydney (No. 10) climbs four spots this year to edge
its way into the top 10 for the �rst time in seven years.
Cities such as Los Angeles (No. 11), Beijing (No. 13),
and San Francisco (No. 17) also largely improve their
rankings from last year.◆ By region, the European cities on the whole score highly
in Livability and Environment. The cities of Asia, which
rank highly overall, earn strong scores in Economy.
Trends for the Top 3 Cities◆ London, the No. 1 city in the comprehensive ranking for
the sixth year in a row, further extends its lead over the
competition by improving its scores for such indicators
as GDP Growth Rate and Level of Political, Economic
and Business Risk in Economy, and for Attractiveness
of Dining Options and Number of Visitors from Abroad in
Cultural Interaction.◆ New York (No. 2) increases its scores for the Economy
indicators of Nominal GDP and GDP Growth Rate, but
fails to make any signi�cant headway in comprehensive
score, having returned weaker scores this year in
Cultural Interaction indicators such as Number
of World-Class Cultural Events Held and Livability
indicators like Variety of Retail Shops.
Key Findings
No.1
No.2
No.2
No.17
No.7
No.2
No.3No.
10No.12
No.7
No.28
No.1
4 Paris
No.6No.
13No.21
No.11
No.29
No.1
8 Berlin
No.2
No.1
No.1
No.34
No.30
No.4
2 New York
No.22
No.11
No.7
No.36
No.18
No.5
9 Hong Kong
No.14No.
17No.19
No.2
No.13
No.77 Amsterdam No.
11
No.5No.
10No.22 No.
27
No.10
6 Seoul
No.4
No.3
No.4
No.14
No.12
No.6
3 Tokyo
5 Singapore
1 London
No.10No.
16
No.9
No.9
No.32
No.16
10 Sydney
Economy Cultural Interaction
Environment
R&D
Livability Accessibility
44 Target Cities
Top 10 Citiesin Comprehensive Ranking
Sydney
London
New York
Paris
Tokyo
Singapore
Seoul
Amsterdam
Hong Kong
Berlin
10
123456789
1078.0
1090.1
1107.8
1129.8
1143.5
1224.6
1282.1
1354.7
1386.3
1560.1
No.5
No.6
No.8
No.28
No.3 No.
9
◆ Tokyo claimed the No. 3 ranking for the first time last
year and closes the gap on New York (No. 2) this year.
This is a result of the American city’s score stalling
while Tokyo continues to improve every year in the
Cultural Interaction indicator of Number of Visitors
from Abroad. However, Japan’s capital city slips from
No. 1 to No. 4 in Economy due to weaker scores in “Market Size” and “Market Attractiveness.”
Results for New Cities in GPCI-2017◆ Duba i and Buenos A i res make the i r f i r s t - eve r
appearances in the GPCI in 2017 with respective
comprehensive rankings of No. 23 and No. 40.◆ Dubai boasts strengths in Cultural Interaction (No.
9) and Economy (No. 11) mainly thanks to strong
evaluations for Corporate Tax Rate in Economy, and
Number of Luxury Hotel Guest Rooms in Cultural Interaction.
Global Power City Index 2017 Global Power City Index 201702 03
1. Key Findings of the GPCI-2017
25 Boston 25 Boston
38 Mexico City 38 Mexico City
17 San Francisco 17 San Francisco
22 Chicago 22 Chicago
19 Toronto 19 Toronto
42 Mumbai 42 Mumbai
23 Dubai 23 Dubai 36 Taipei 36 Taipei
13 Beijing 13 Beijing
15 Shanghai 15 Shanghai
33 Bangkok 33 Bangkok
31 Kuala Lumpur 31 Kuala Lumpur
35 Moscow 35 Moscow
27 Madrid 27 Madrid 32 Milan 32 Milan
18 Zurich 18 Zurich 12 Frankfurt12 Frankfurt
14 Vienna14 Vienna
34 Geneva 34 Geneva
21 Brussels 21 Brussels
20 Copenhagen 20 Copenhagen
39 Sao Paulo 39 Sao Paulo
40 Buenos Aires40 Buenos Aires
43 Cairo 43 Cairo
37 Fukuoka 37 Fukuoka
26 Osaka 26 Osaka
28 Vancouver 28 Vancouver
30 Istanbul 30 Istanbul 24 Barcelona 24 Barcelona
16 Stockholm 16 Stockholm
11 Los Angeles 11 Los Angeles
29 Washington, D.C. 29 Washington, D.C.
41 Jakarta41 Jakarta
44 Johannesburg44 Johannesburg
Top 10 Cities by Function-Specific Ranking
GPCI-2017 Characteristics◆ In the GPCI-2017 comprehensive ranking, the top �ve
cities of London (No. 1), New York (No. 2), Tokyo (No.
3), Paris (No. 4), and Singapore (No. 5) all maintain their
respective positions from last year. These cities have
remained in the top 5 for nine consecutive years.◆ Sydney (No. 10) climbs four spots this year to edge
its way into the top 10 for the �rst time in seven years.
Cities such as Los Angeles (No. 11), Beijing (No. 13),
and San Francisco (No. 17) also largely improve their
rankings from last year.◆ By region, the European cities on the whole score highly
in Livability and Environment. The cities of Asia, which
rank highly overall, earn strong scores in Economy.
Trends for the Top 3 Cities◆ London, the No. 1 city in the comprehensive ranking for
the sixth year in a row, further extends its lead over the
competition by improving its scores for such indicators
as GDP Growth Rate and Level of Political, Economic
and Business Risk in Economy, and for Attractiveness
of Dining Options and Number of Visitors from Abroad in
Cultural Interaction.◆ New York (No. 2) increases its scores for the Economy
indicators of Nominal GDP and GDP Growth Rate, but
fails to make any signi�cant headway in comprehensive
score, having returned weaker scores this year in
Cultural Interaction indicators such as Number
of World-Class Cultural Events Held and Livability
indicators like Variety of Retail Shops.
Key Findings
No.1
No.2
No.2
No.17
No.7
No.2
No.3No.
10No.12
No.7
No.28
No.1
4 Paris
No.6No.
13No.21
No.11
No.29
No.1
8 Berlin
No.2
No.1
No.1
No.34
No.30
No.4
2 New York
No.22
No.11
No.7
No.36
No.18
No.5
9 Hong Kong
No.14No.
17No.19
No.2
No.13
No.77 Amsterdam No.
11
No.5No.
10No.22 No.
27
No.10
6 Seoul
No.4
No.3
No.4
No.14
No.12
No.6
3 Tokyo
5 Singapore
1 London
No.10No.
16
No.9
No.9
No.32
No.16
10 Sydney
Economy Cultural Interaction
Environment
R&D
Livability Accessibility
44 Target Cities
Top 10 Citiesin Comprehensive Ranking
Sydney
London
New York
Paris
Tokyo
Singapore
Seoul
Amsterdam
Hong Kong
Berlin
10
123456789
1078.0
1090.1
1107.8
1129.8
1143.5
1224.6
1282.1
1354.7
1386.3
1560.1
No.5
No.6
No.8
No.28
No.3 No.
9
◆ Tokyo claimed the No. 3 ranking for the first time last
year and closes the gap on New York (No. 2) this year.
This is a result of the American city’s score stalling
while Tokyo continues to improve every year in the
Cultural Interaction indicator of Number of Visitors
from Abroad. However, Japan’s capital city slips from
No. 1 to No. 4 in Economy due to weaker scores in “Market Size” and “Market Attractiveness.”
Results for New Cities in GPCI-2017◆ Duba i and Buenos A i res make the i r f i r s t - eve r
appearances in the GPCI in 2017 with respective
comprehensive rankings of No. 23 and No. 40.◆ Dubai boasts strengths in Cultural Interaction (No.
9) and Economy (No. 11) mainly thanks to strong
evaluations for Corporate Tax Rate in Economy, and
Number of Luxury Hotel Guest Rooms in Cultural Interaction.
Global Power City Index 2017 Global Power City Index 201702 03
1. Key Findings of the GPCI-2017
Research Organization
Working Committee●Fundamental Research
and Analysis of Cities●Creation of Draft Rankings Hiroo Ichikawa
Principal
Mitsubishi Research Institute, Inc.Institute for Urban Strategies,The Mori Memorial Foundation
Members
Executive CommitteeSupervision of Ranking Creation
Chairman
Heizo TakenakaProfessor, Toyo University Professor Emeritus, Keio UniversityChairman, Institute for Urban Strategies, The Mori Memorial Foundation
Principal Advisor
Sir Peter Hall(1932-2014)
Professor, University College London
Expert PartnersCooperation in Research
International experts
Members
Hiroo IchikawaProfessor and Dean, Professional Graduate School of Governance Studies, Meiji UniversityExecutive Director, The Mori Memorial Foundation
Saskia SassenRobert S. Lynd Professor, Columbia University
Richard BenderProfessor and Dean Emeritus, University of California, Berkeley
Allen J. ScottDistinguished Research Professor, University of California, Los Angeles
Peter NijkampFellow, Tinbergen Institute, AmsterdamProfessor, Adam Mickiewicz University, Poznan
Michael Batty CBEProfessor, University College London
Peer ReviewersReview of Ranking
Andrés Rodríguez-PoseProfessor, London School of EconomicsImmediate Past President, Regional Science Association International
Heng Chye KiangLum Chang Chair Professor, National University of Singapore
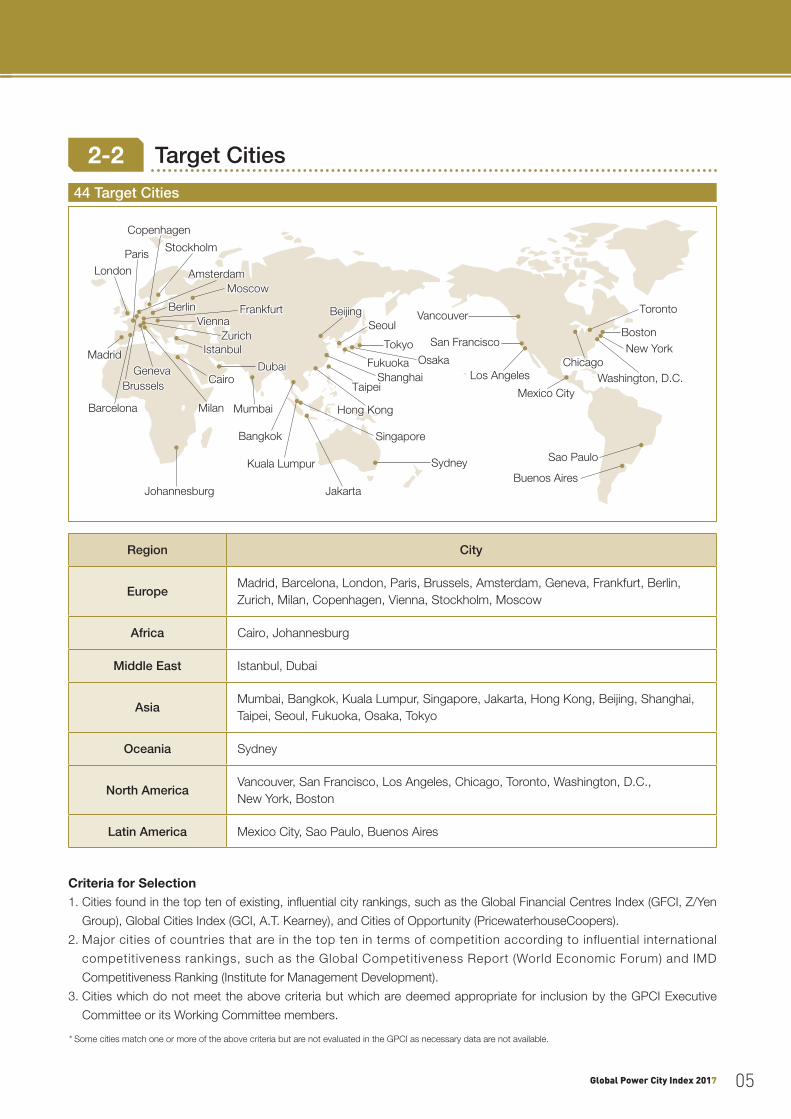
2-2 Target Cities
Criteria for Selection1. Cities found in the top ten of existing, in�uential city rankings, such as the Global Financial Centres Index (GFCI, Z/Yen
Group), Global Cities Index (GCI, A.T. Kearney), and Cities of Opportunity (PricewaterhouseCoopers).
2. Major cities of countries that are in the top ten in terms of competition according to influential international
competitiveness rankings, such as the Global Competitiveness Report (World Economic Forum) and IMD
Competitiveness Ranking (Institute for Management Development).
3. Cities which do not meet the above criteria but which are deemed appropriate for inclusion by the GPCI Executive
Committee or its Working Committee members.
* Some cities match one or more of the above criteria but are not evaluated in the GPCI as necessary data are not available.
44 Target Cities
Tokyo Tokyo New York New York Boston Boston
Mexico City Mexico City
San Francisco San Francisco
Chicago Chicago
Seoul Seoul Toronto Toronto
Sydney Sydney
DubaiDubai
Mumbai Mumbai
Taipei Taipei
Hong Kong Hong Kong
Beijing Beijing
Shanghai Shanghai
Bangkok Bangkok
Kuala Lumpur Kuala Lumpur
Singapore Singapore
JakartaJakartaJohannesburgJohannesburg
Moscow Moscow
Madrid Madrid
Milan Milan
London London Paris Paris
Vienna Vienna Berlin Berlin
Amsterdam Amsterdam
Zurich Zurich
Geneva Geneva Brussels Brussels
Copenhagen Copenhagen
Frankfurt Frankfurt
Sao Paulo Sao Paulo
Buenos AiresBuenos Aires
Cairo Cairo Fukuoka Fukuoka Osaka Osaka
Vancouver Vancouver
Istanbul Istanbul
Barcelona Barcelona
Stockholm Stockholm
Los Angeles Los Angeles Washington, D.C. Washington, D.C.
Region City
EuropeMadrid, Barcelona, London, Paris, Brussels, Amsterdam, Geneva, Frankfurt, Berlin, Zurich, Milan, Copenhagen, Vienna, Stockholm, Moscow
Africa Cairo, Johannesburg
Middle East Istanbul, Dubai
AsiaMumbai, Bangkok, Kuala Lumpur, Singapore, Jakarta, Hong Kong, Beijing, Shanghai, Taipei, Seoul, Fukuoka, Osaka, Tokyo
Oceania Sydney
North AmericaVancouver, San Francisco, Los Angeles, Chicago, Toronto, Washington, D.C., New York, Boston
Latin America Mexico City, Sao Paulo, Buenos Aires
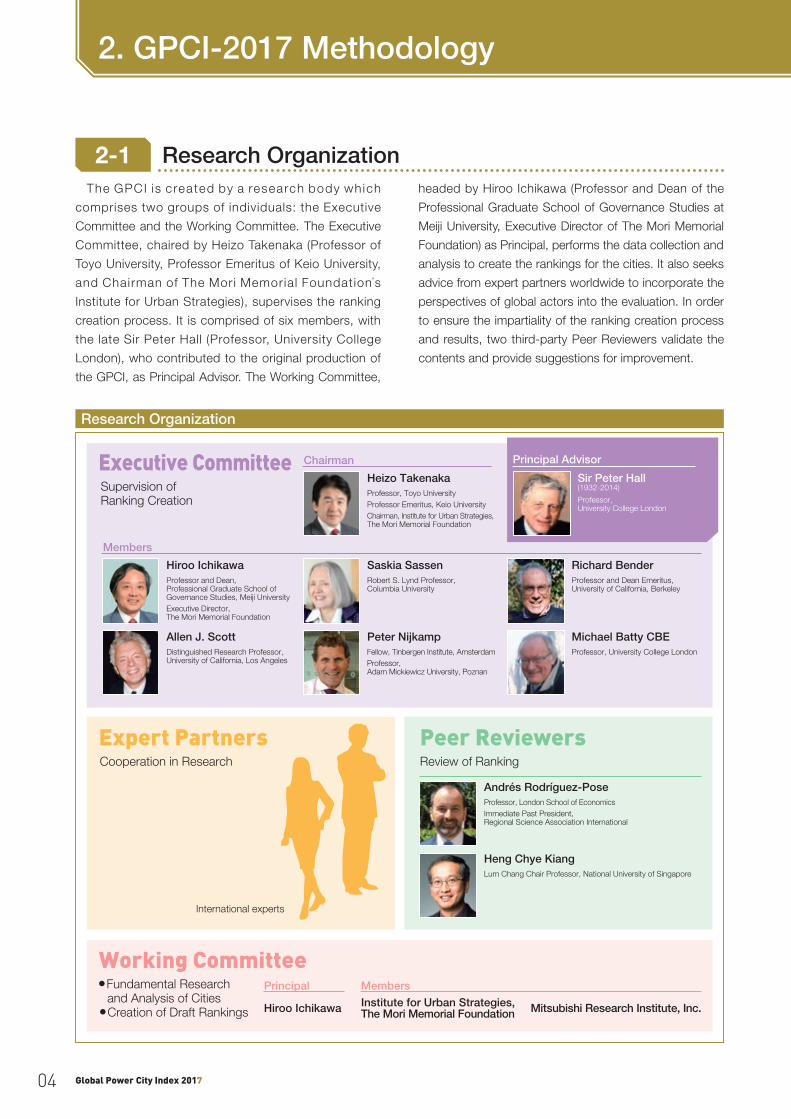
2-1 Research OrganizationThe GPCI is created by a research body which
comprises two groups of individuals: the Executive
Committee and the Working Committee. The Executive
Committee, chaired by Heizo Takenaka (Professor of
Toyo University, Professor Emeritus of Keio University,
and Chairman of The Mori Memorial Foundation’s
Institute for Urban Strategies), supervises the ranking
creation process. It is comprised of six members, with
the late Sir Peter Hall (Professor, University College
London), who contributed to the original production of
the GPCI, as Principal Advisor. The Working Committee,
headed by Hiroo Ichikawa (Professor and Dean of the
Professional Graduate School of Governance Studies at
Meiji University, Executive Director of The Mori Memorial
Foundation) as Principal, performs the data collection and
analysis to create the rankings for the cities. It also seeks
advice from expert partners worldwide to incorporate the
perspectives of global actors into the evaluation. In order
to ensure the impartiality of the ranking creation process
and results, two third-party Peer Reviewers validate the
contents and provide suggestions for improvement.
Global Power City Index 2017 Global Power City Index 201704 05
2. GPCI-2017 Methodology
Research Organization
Working Committee●Fundamental Research
and Analysis of Cities●Creation of Draft Rankings Hiroo Ichikawa
Principal
Mitsubishi Research Institute, Inc.Institute for Urban Strategies,The Mori Memorial Foundation
Members
Executive CommitteeSupervision of Ranking Creation
Chairman
Heizo TakenakaProfessor, Toyo University Professor Emeritus, Keio UniversityChairman, Institute for Urban Strategies, The Mori Memorial Foundation
Principal Advisor
Sir Peter Hall(1932-2014)
Professor, University College London
Expert PartnersCooperation in Research
International experts
Members
Hiroo IchikawaProfessor and Dean, Professional Graduate School of Governance Studies, Meiji UniversityExecutive Director, The Mori Memorial Foundation
Saskia SassenRobert S. Lynd Professor, Columbia University
Richard BenderProfessor and Dean Emeritus, University of California, Berkeley
Allen J. ScottDistinguished Research Professor, University of California, Los Angeles
Peter NijkampFellow, Tinbergen Institute, AmsterdamProfessor, Adam Mickiewicz University, Poznan
Michael Batty CBEProfessor, University College London
Peer ReviewersReview of Ranking
Andrés Rodríguez-PoseProfessor, London School of EconomicsImmediate Past President, Regional Science Association International
Heng Chye KiangLum Chang Chair Professor, National University of Singapore
2-2 Target Cities
Criteria for Selection1. Cities found in the top ten of existing, in�uential city rankings, such as the Global Financial Centres Index (GFCI, Z/Yen
Group), Global Cities Index (GCI, A.T. Kearney), and Cities of Opportunity (PricewaterhouseCoopers).
2. Major cities of countries that are in the top ten in terms of competition according to influential international
competitiveness rankings, such as the Global Competitiveness Report (World Economic Forum) and IMD
Competitiveness Ranking (Institute for Management Development).
3. Cities which do not meet the above criteria but which are deemed appropriate for inclusion by the GPCI Executive
Committee or its Working Committee members.
* Some cities match one or more of the above criteria but are not evaluated in the GPCI as necessary data are not available.
44 Target Cities
Tokyo Tokyo New York New York Boston Boston
Mexico City Mexico City
San Francisco San Francisco
Chicago Chicago
Seoul Seoul Toronto Toronto
Sydney Sydney
DubaiDubai
Mumbai Mumbai
Taipei Taipei
Hong Kong Hong Kong
Beijing Beijing
Shanghai Shanghai
Bangkok Bangkok
Kuala Lumpur Kuala Lumpur
Singapore Singapore
JakartaJakartaJohannesburgJohannesburg
Moscow Moscow
Madrid Madrid
Milan Milan
London London Paris Paris
Vienna Vienna Berlin Berlin
Amsterdam Amsterdam
Zurich Zurich
Geneva Geneva Brussels Brussels
Copenhagen Copenhagen
Frankfurt Frankfurt
Sao Paulo Sao Paulo
Buenos AiresBuenos Aires
Cairo Cairo Fukuoka Fukuoka Osaka Osaka
Vancouver Vancouver
Istanbul Istanbul
Barcelona Barcelona
Stockholm Stockholm
Los Angeles Los Angeles Washington, D.C. Washington, D.C.
Region City
EuropeMadrid, Barcelona, London, Paris, Brussels, Amsterdam, Geneva, Frankfurt, Berlin, Zurich, Milan, Copenhagen, Vienna, Stockholm, Moscow
Africa Cairo, Johannesburg
Middle East Istanbul, Dubai
AsiaMumbai, Bangkok, Kuala Lumpur, Singapore, Jakarta, Hong Kong, Beijing, Shanghai, Taipei, Seoul, Fukuoka, Osaka, Tokyo
Oceania Sydney
North AmericaVancouver, San Francisco, Los Angeles, Chicago, Toronto, Washington, D.C., New York, Boston
Latin America Mexico City, Sao Paulo, Buenos Aires
2-1 Research OrganizationThe GPCI is created by a research body which
comprises two groups of individuals: the Executive
Committee and the Working Committee. The Executive
Committee, chaired by Heizo Takenaka (Professor of
Toyo University, Professor Emeritus of Keio University,
and Chairman of The Mori Memorial Foundation’s
Institute for Urban Strategies), supervises the ranking
creation process. It is comprised of six members, with
the late Sir Peter Hall (Professor, University College
London), who contributed to the original production of
the GPCI, as Principal Advisor. The Working Committee,
headed by Hiroo Ichikawa (Professor and Dean of the
Professional Graduate School of Governance Studies at
Meiji University, Executive Director of The Mori Memorial
Foundation) as Principal, performs the data collection and
analysis to create the rankings for the cities. It also seeks
advice from expert partners worldwide to incorporate the
perspectives of global actors into the evaluation. In order
to ensure the impartiality of the ranking creation process
and results, two third-party Peer Reviewers validate the
contents and provide suggestions for improvement.
Global Power City Index 2017 Global Power City Index 201704 05
2. GPCI-2017 Methodology
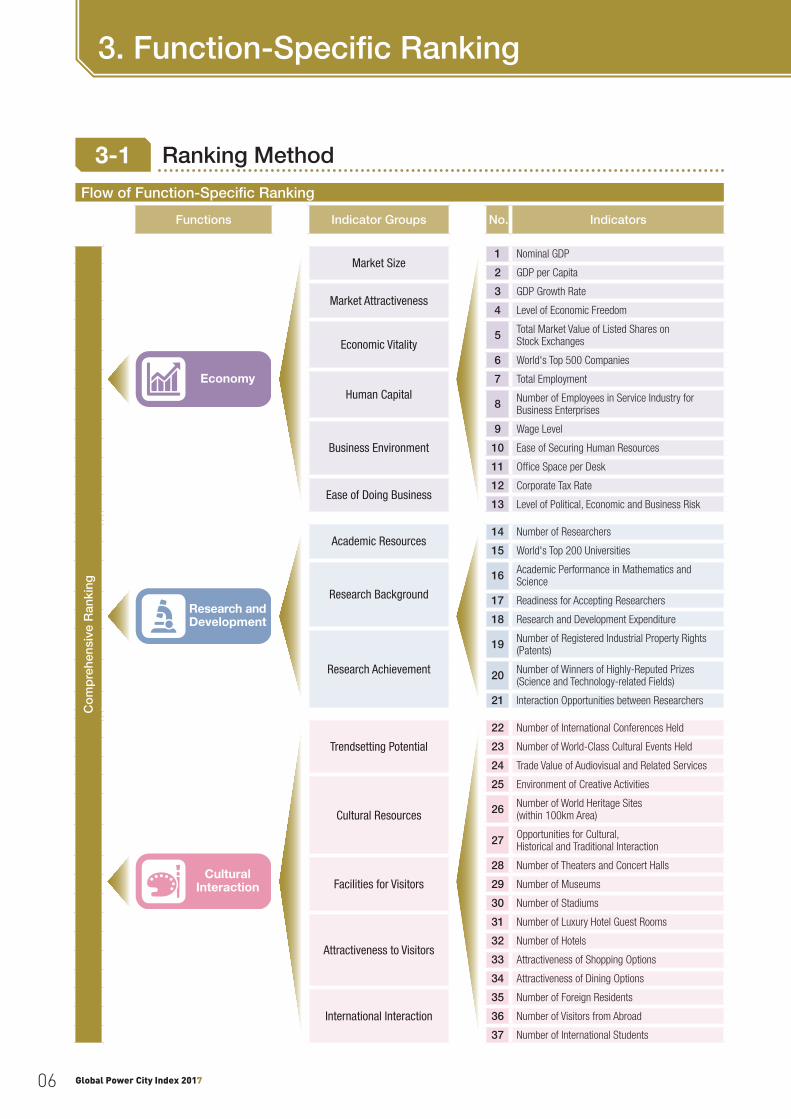
3-1 Ranking Method
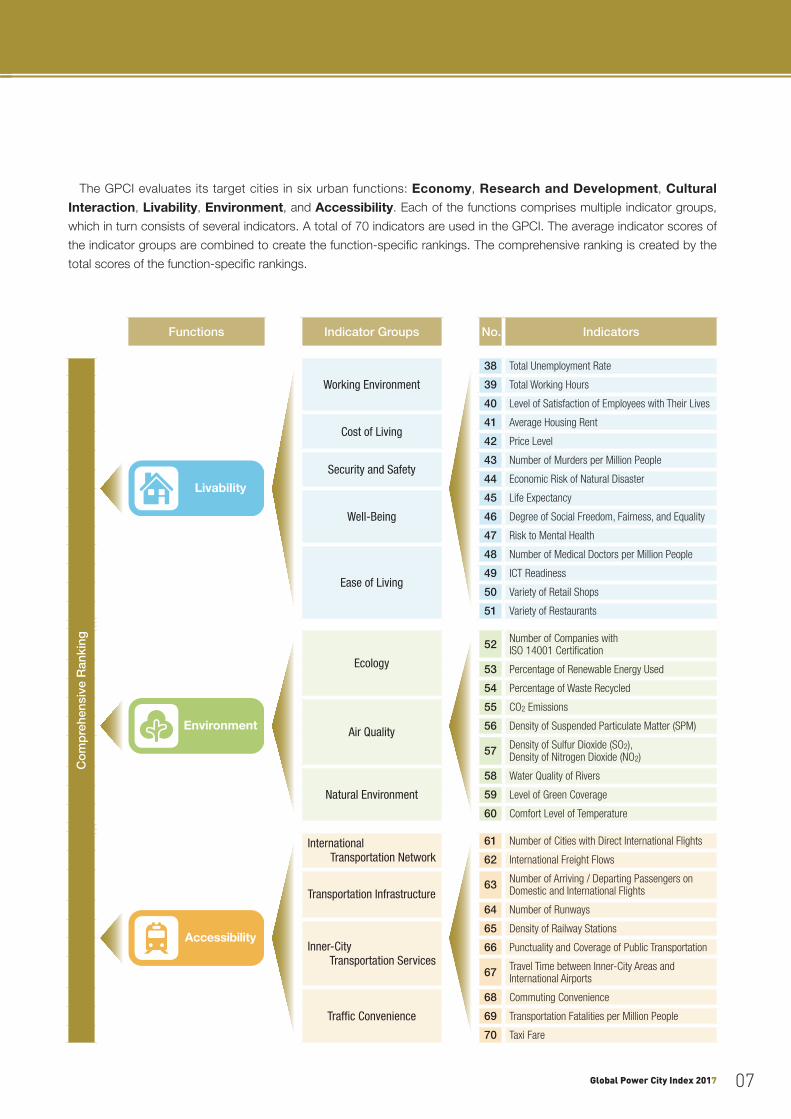
Flow of Function-Specific Ranking The GPCI evaluates its target cities in six urban functions: Economy, Research and Development, Cultural Interaction, Livability, Environment, and Accessibility. Each of the functions comprises multiple indicator groups,
which in turn consists of several indicators. A total of 70 indicators are used in the GPCI. The average indicator scores of
the indicator groups are combined to create the function-speci�c rankings. The comprehensive ranking is created by the
total scores of the function-speci�c rankings.
Functions Indicator Groups No. Indicators
Co
mp
rehe
nsiv
e R
anki
ng
Livability
Working Environment
38 Total Unemployment Rate
39 Total Working Hours
40 Level of Satisfaction of Employees with Their Lives
Cost of Living41 Average Housing Rent
42 Price Level
Security and Safety43 Number of Murders per Million People
44 Economic Risk of Natural Disaster
Well-Being
45 Life Expectancy
46 Degree of Social Freedom, Fairness, and Equality
47 Risk to Mental Health
Ease of Living
48 Number of Medical Doctors per Million People
49 ICT Readiness
50 Variety of Retail Shops
51 Variety of Restaurants
Environment
Ecology
52 Number of Companies with ISO 14001 Certification
53 Percentage of Renewable Energy Used
54 Percentage of Waste Recycled
Air Quality
55 CO2 Emissions
56 Density of Suspended Particulate Matter (SPM)
57 Density of Sulfur Dioxide (SO2), Density of Nitrogen Dioxide (NO2)
Natural Environment
58 Water Quality of Rivers
59 Level of Green Coverage
60 Comfort Level of Temperature
Accessibility
International Transportation Network
61 Number of Cities with Direct International Flights
62 International Freight Flows
Transportation Infrastructure63 Number of Arriving / Departing Passengers on
Domestic and International Flights
64 Number of Runways
Inner-City Transportation Services
65 Density of Railway Stations
66 Punctuality and Coverage of Public Transportation
67 Travel Time between Inner-City Areas and International Airports
Traffic Convenience
68 Commuting Convenience
69 Transportation Fatalities per Million People
70 Taxi Fare
Functions Indicator Groups No. Indicators
Co
mp
rehe
nsiv
e R
anki
ng
Economy
Market Size1 Nominal GDP
2 GDP per Capita
Market Attractiveness3 GDP Growth Rate
4 Level of Economic Freedom
Economic Vitality5 Total Market Value of Listed Shares on
Stock Exchanges
6 World's Top 500 Companies
Human Capital7 Total Employment
8 Number of Employees in Service Industry for Business Enterprises
Business Environment
9 Wage Level
10 Ease of Securing Human Resources
11 Office Space per Desk
Ease of Doing Business12 Corporate Tax Rate
13 Level of Political, Economic and Business Risk
Research andDevelopment
Academic Resources14 Number of Researchers
15 World's Top 200 Universities
Research Background
16 Academic Performance in Mathematics and Science
17 Readiness for Accepting Researchers
18 Research and Development Expenditure
Research Achievement
19 Number of Registered Industrial Property Rights (Patents)
20 Number of Winners of Highly-Reputed Prizes (Science and Technology-related Fields)
21 Interaction Opportunities between Researchers
CulturalInteraction
Trendsetting Potential
22 Number of International Conferences Held
23 Number of World-Class Cultural Events Held
24 Trade Value of Audiovisual and Related Services
Cultural Resources
25 Environment of Creative Activities
26 Number of World Heritage Sites (within 100km Area)
27 Opportunities for Cultural, Historical and Traditional Interaction
Facilities for Visitors
28 Number of Theaters and Concert Halls
29 Number of Museums
30 Number of Stadiums
Attractiveness to Visitors
31 Number of Luxury Hotel Guest Rooms
32 Number of Hotels
33 Attractiveness of Shopping Options
34 Attractiveness of Dining Options
International Interaction
35 Number of Foreign Residents
36 Number of Visitors from Abroad
37 Number of International Students
Global Power City Index 2017 Global Power City Index 201706 07
3. Function-Specific Ranking
3-1 Ranking Method
Flow of Function-Specific Ranking The GPCI evaluates its target cities in six urban functions: Economy, Research and Development, Cultural Interaction, Livability, Environment, and Accessibility. Each of the functions comprises multiple indicator groups,
which in turn consists of several indicators. A total of 70 indicators are used in the GPCI. The average indicator scores of
the indicator groups are combined to create the function-speci�c rankings. The comprehensive ranking is created by the
total scores of the function-speci�c rankings.
Functions Indicator Groups No. Indicators
Co
mp
rehe
nsiv
e R
anki
ng
Livability
Working Environment
38 Total Unemployment Rate
39 Total Working Hours
40 Level of Satisfaction of Employees with Their Lives
Cost of Living41 Average Housing Rent
42 Price Level
Security and Safety43 Number of Murders per Million People
44 Economic Risk of Natural Disaster
Well-Being
45 Life Expectancy
46 Degree of Social Freedom, Fairness, and Equality
47 Risk to Mental Health
Ease of Living
48 Number of Medical Doctors per Million People
49 ICT Readiness
50 Variety of Retail Shops
51 Variety of Restaurants
Environment
Ecology
52 Number of Companies with ISO 14001 Certification
53 Percentage of Renewable Energy Used
54 Percentage of Waste Recycled
Air Quality
55 CO2 Emissions
56 Density of Suspended Particulate Matter (SPM)
57 Density of Sulfur Dioxide (SO2), Density of Nitrogen Dioxide (NO2)
Natural Environment
58 Water Quality of Rivers
59 Level of Green Coverage
60 Comfort Level of Temperature
Accessibility
International Transportation Network
61 Number of Cities with Direct International Flights
62 International Freight Flows
Transportation Infrastructure63 Number of Arriving / Departing Passengers on
Domestic and International Flights
64 Number of Runways
Inner-City Transportation Services
65 Density of Railway Stations
66 Punctuality and Coverage of Public Transportation
67 Travel Time between Inner-City Areas and International Airports
Traffic Convenience
68 Commuting Convenience
69 Transportation Fatalities per Million People
70 Taxi Fare
Functions Indicator Groups No. Indicators
Co
mp
rehe
nsiv
e R
anki
ng
Economy
Market Size1 Nominal GDP
2 GDP per Capita
Market Attractiveness3 GDP Growth Rate
4 Level of Economic Freedom
Economic Vitality5 Total Market Value of Listed Shares on
Stock Exchanges
6 World's Top 500 Companies
Human Capital7 Total Employment
8 Number of Employees in Service Industry for Business Enterprises
Business Environment
9 Wage Level
10 Ease of Securing Human Resources
11 Office Space per Desk
Ease of Doing Business12 Corporate Tax Rate
13 Level of Political, Economic and Business Risk
Research andDevelopment
Academic Resources14 Number of Researchers
15 World's Top 200 Universities
Research Background
16 Academic Performance in Mathematics and Science
17 Readiness for Accepting Researchers
18 Research and Development Expenditure
Research Achievement
19 Number of Registered Industrial Property Rights (Patents)
20 Number of Winners of Highly-Reputed Prizes (Science and Technology-related Fields)
21 Interaction Opportunities between Researchers
CulturalInteraction
Trendsetting Potential
22 Number of International Conferences Held
23 Number of World-Class Cultural Events Held
24 Trade Value of Audiovisual and Related Services
Cultural Resources
25 Environment of Creative Activities
26 Number of World Heritage Sites (within 100km Area)
27 Opportunities for Cultural, Historical and Traditional Interaction
Facilities for Visitors
28 Number of Theaters and Concert Halls
29 Number of Museums
30 Number of Stadiums
Attractiveness to Visitors
31 Number of Luxury Hotel Guest Rooms
32 Number of Hotels
33 Attractiveness of Shopping Options
34 Attractiveness of Dining Options
International Interaction
35 Number of Foreign Residents
36 Number of Visitors from Abroad
37 Number of International Students
Global Power City Index 2017 Global Power City Index 201706 07
3. Function-Specific Ranking
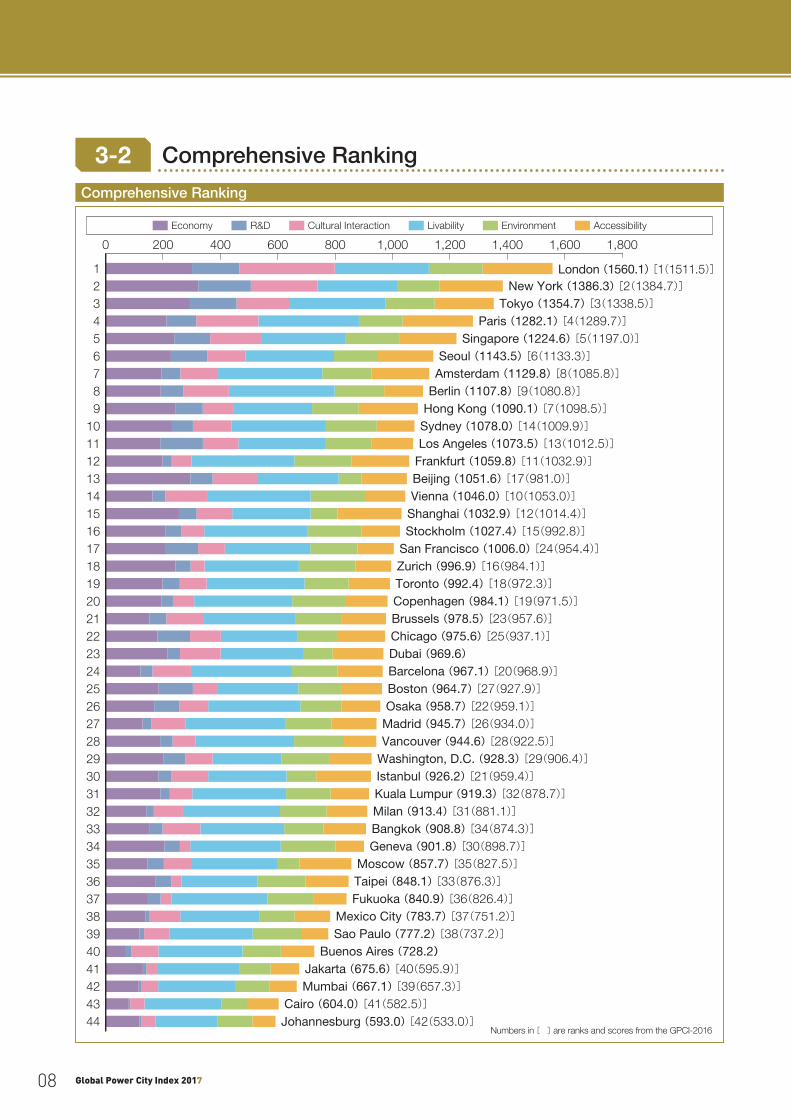
3-2 Comprehensive Ranking
Comprehensive Ranking
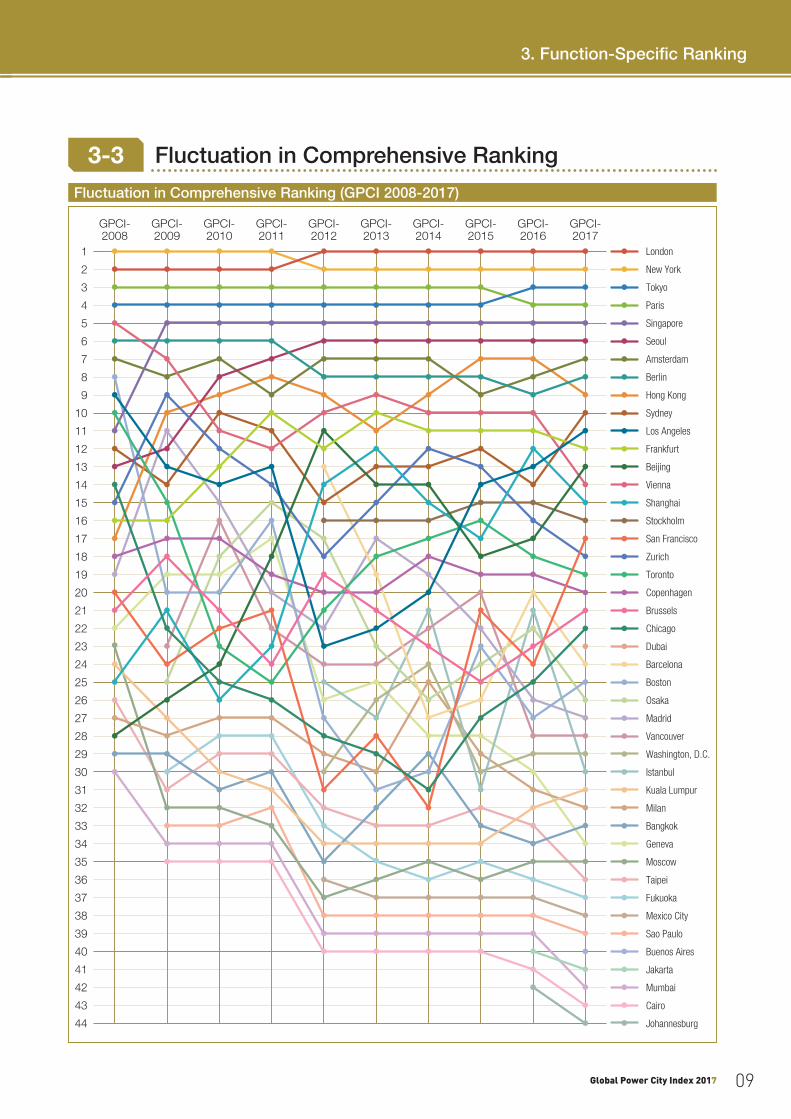
3-3 Fluctuation in Comprehensive Ranking
Fluctuation in Comprehensive Ranking (GPCI 2008-2017)
Numbers in [ ] are ranks and scores from the GPCI-2016
123456789
1011121314151617181920212223242526272829303132333435363738394041424344
0 200 400 600 800 1,000 1,200 1,400 1,600 1,800
Johannesburg (593.0) [42(533.0)]Cairo (604.0) [41(582.5)]
Mumbai (667.1) [39(657.3)]Jakarta (675.6) [40(595.9)]
Buenos Aires (728.2)Sao Paulo (777.2) [38(737.2)]Mexico City (783.7) [37(751.2)]
Fukuoka (840.9) [36(826.4)]Taipei (848.1) [33(876.3)]Moscow (857.7) [35(827.5)]
Geneva (901.8) [30(898.7)]Bangkok (908.8) [34(874.3)]Milan (913.4) [31(881.1)]Kuala Lumpur (919.3) [32(878.7)]Istanbul (926.2) [21(959.4)]Washington, D.C. (928.3) [29(906.4)]Vancouver (944.6) [28(922.5)]Madrid (945.7) [26(934.0)]Osaka (958.7) [22(959.1)]Boston (964.7) [27(927.9)]Barcelona (967.1) [20(968.9)]Dubai (969.6)Chicago (975.6) [25(937.1)]Brussels (978.5) [23(957.6)]Copenhagen (984.1) [19(971.5)]Toronto (992.4) [18(972.3)]Zurich (996.9) [16(984.1)]San Francisco (1006.0) [24(954.4)]Stockholm (1027.4) [15(992.8)]Shanghai (1032.9) [12(1014.4)]Vienna (1046.0) [10(1053.0)]Beijing (1051.6) [17(981.0)]Frankfurt (1059.8) [11(1032.9)]Los Angeles (1073.5) [13(1012.5)]Sydney (1078.0) [14(1009.9)]Hong Kong (1090.1) [7(1098.5)]Berlin (1107.8) [9(1080.8)]Amsterdam (1129.8) [8(1085.8)]Seoul (1143.5) [6(1133.3)]
Singapore (1224.6) [5(1197.0)]Paris (1282.1) [4(1289.7)]
Tokyo (1354.7) [3(1338.5)]New York (1386.3) [2(1384.7)]
London (1560.1) [1(1511.5)]
Economy R&D Cultural Interaction Livability Environment Accessibility
London
New York
Tokyo
Paris
Singapore
Seoul
Amsterdam
Berlin
Hong Kong
Sydney
Los Angeles
Frankfurt
Beijing
Vienna
Shanghai
Stockholm
San Francisco
Zurich
Toronto
Copenhagen
Brussels
Chicago
Dubai
Barcelona
Boston
Osaka
Madrid
Vancouver
Washington, D.C.
Istanbul
Kuala Lumpur
Milan
Bangkok
Geneva
Moscow
Taipei
Fukuoka
Mexico City
Sao Paulo
Buenos Aires
Jakarta
Mumbai
Cairo
Johannesburg
1
2
3
4
5
6
7
8
9
10
11
12
13
14
15
16
17
18
19
20
21
22
23
24
25
26
27
28
29
30
31
32
33
34
35
36
37
38
40
39
42
43
44
41
GPCI-2011
GPCI-2010
GPCI-2009
GPCI-2008
GPCI-2012
GPCI-2013
GPCI-2014
GPCI-2015
GPCI-2016
GPCI-2017
Global Power City Index 2017 Global Power City Index 201708 09
3. Function-Specific Ranking
3-2 Comprehensive Ranking
Comprehensive Ranking
3-3 Fluctuation in Comprehensive Ranking
Fluctuation in Comprehensive Ranking (GPCI 2008-2017)
Numbers in [ ] are ranks and scores from the GPCI-2016
123456789
1011121314151617181920212223242526272829303132333435363738394041424344
0 200 400 600 800 1,000 1,200 1,400 1,600 1,800
Johannesburg (593.0) [42(533.0)]Cairo (604.0) [41(582.5)]
Mumbai (667.1) [39(657.3)]Jakarta (675.6) [40(595.9)]
Buenos Aires (728.2)Sao Paulo (777.2) [38(737.2)]Mexico City (783.7) [37(751.2)]
Fukuoka (840.9) [36(826.4)]Taipei (848.1) [33(876.3)]Moscow (857.7) [35(827.5)]
Geneva (901.8) [30(898.7)]Bangkok (908.8) [34(874.3)]Milan (913.4) [31(881.1)]Kuala Lumpur (919.3) [32(878.7)]Istanbul (926.2) [21(959.4)]Washington, D.C. (928.3) [29(906.4)]Vancouver (944.6) [28(922.5)]Madrid (945.7) [26(934.0)]Osaka (958.7) [22(959.1)]Boston (964.7) [27(927.9)]Barcelona (967.1) [20(968.9)]Dubai (969.6)Chicago (975.6) [25(937.1)]Brussels (978.5) [23(957.6)]Copenhagen (984.1) [19(971.5)]Toronto (992.4) [18(972.3)]Zurich (996.9) [16(984.1)]San Francisco (1006.0) [24(954.4)]Stockholm (1027.4) [15(992.8)]Shanghai (1032.9) [12(1014.4)]Vienna (1046.0) [10(1053.0)]Beijing (1051.6) [17(981.0)]Frankfurt (1059.8) [11(1032.9)]Los Angeles (1073.5) [13(1012.5)]Sydney (1078.0) [14(1009.9)]Hong Kong (1090.1) [7(1098.5)]Berlin (1107.8) [9(1080.8)]Amsterdam (1129.8) [8(1085.8)]Seoul (1143.5) [6(1133.3)]
Singapore (1224.6) [5(1197.0)]Paris (1282.1) [4(1289.7)]
Tokyo (1354.7) [3(1338.5)]New York (1386.3) [2(1384.7)]
London (1560.1) [1(1511.5)]
Economy R&D Cultural Interaction Livability Environment Accessibility
London
New York
Tokyo
Paris
Singapore
Seoul
Amsterdam
Berlin
Hong Kong
Sydney
Los Angeles
Frankfurt
Beijing
Vienna
Shanghai
Stockholm
San Francisco
Zurich
Toronto
Copenhagen
Brussels
Chicago
Dubai
Barcelona
Boston
Osaka
Madrid
Vancouver
Washington, D.C.
Istanbul
Kuala Lumpur
Milan
Bangkok
Geneva
Moscow
Taipei
Fukuoka
Mexico City
Sao Paulo
Buenos Aires
Jakarta
Mumbai
Cairo
Johannesburg
1
2
3
4
5
6
7
8
9
10
11
12
13
14
15
16
17
18
19
20
21
22
23
24
25
26
27
28
29
30
31
32
33
34
35
36
37
38
40
39
42
43
44
41
GPCI-2011
GPCI-2010
GPCI-2009
GPCI-2008
GPCI-2012
GPCI-2013
GPCI-2014
GPCI-2015
GPCI-2016
GPCI-2017
Global Power City Index 2017 Global Power City Index 201708 09
3. Function-Specific Ranking
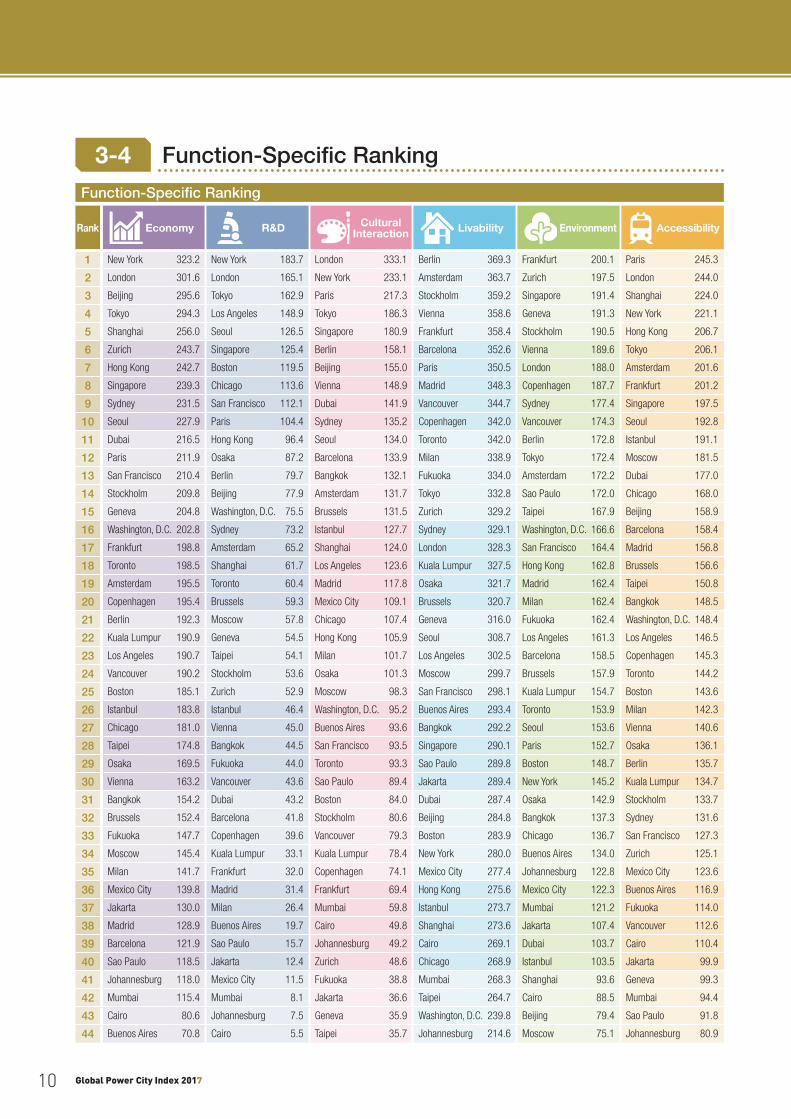
3-4 Function-Specific Ranking
Function-Specific Ranking
3-5 Function-Specific Ranking Key Findings
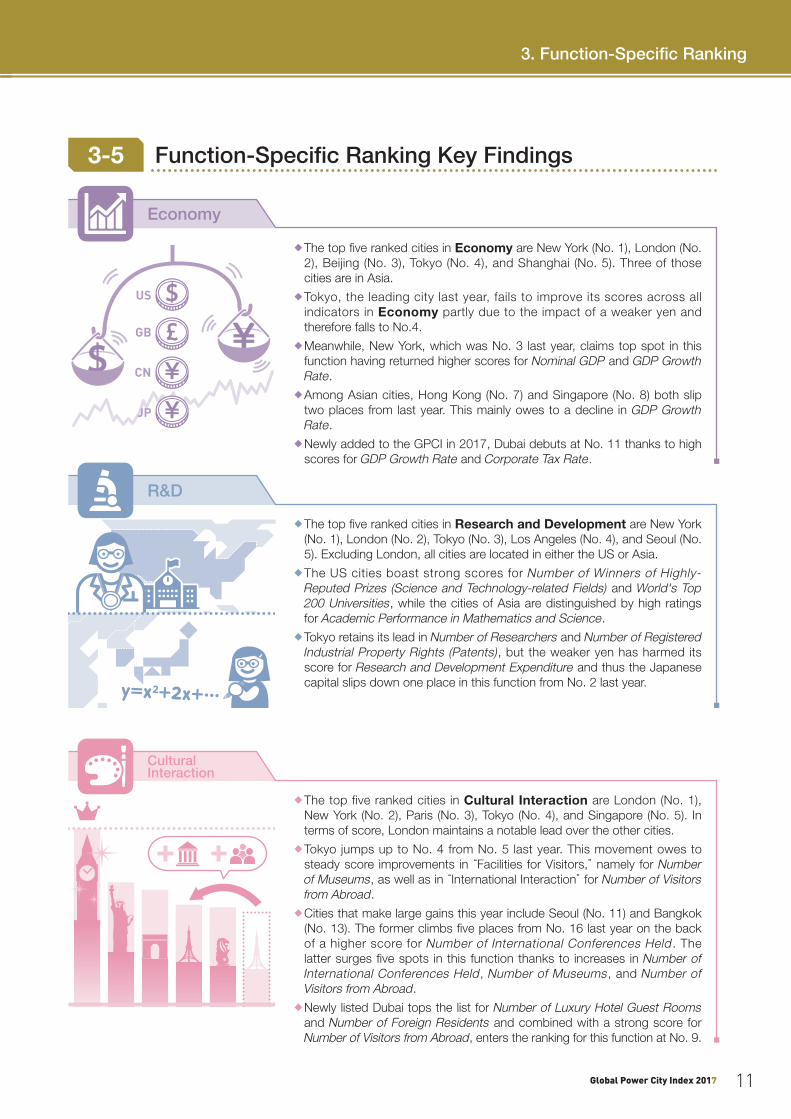
◆ The top �ve ranked cities in Economy are New York (No. 1), London (No. 2), Beijing (No. 3), Tokyo (No. 4), and Shanghai (No. 5). Three of those cities are in Asia.
◆ Tokyo, the leading city last year, fails to improve its scores across all indicators in Economy partly due to the impact of a weaker yen and therefore falls to No.4.
◆ Meanwhile, New York, which was No. 3 last year, claims top spot in this function having returned higher scores for Nominal GDP and GDP Growth Rate.
◆ Among Asian cities, Hong Kong (No. 7) and Singapore (No. 8) both slip two places from last year. This mainly owes to a decline in GDP Growth Rate.
◆ Newly added to the GPCI in 2017, Dubai debuts at No. 11 thanks to high scores for GDP Growth Rate and Corporate Tax Rate.
¥£¥¥
$US
GB
CN
JP
$
Economy
◆ The top five ranked cities in Cultural Interaction are London (No. 1), New York (No. 2), Paris (No. 3), Tokyo (No. 4), and Singapore (No. 5). In terms of score, London maintains a notable lead over the other cities.
◆ Tokyo jumps up to No. 4 from No. 5 last year. This movement owes to steady score improvements in “Facilities for Visitors,” namely for Number of Museums, as well as in “International Interaction” for Number of Visitors from Abroad.
◆ Cities that make large gains this year include Seoul (No. 11) and Bangkok (No. 13). The former climbs �ve places from No. 16 last year on the back of a higher score for Number of International Conferences Held . The latter surges �ve spots in this function thanks to increases in Number of International Conferences Held, Number of Museums, and Number of Visitors from Abroad.
◆ Newly listed Dubai tops the list for Number of Luxury Hotel Guest Rooms and Number of Foreign Residents and combined with a strong score for Number of Visitors from Abroad, enters the ranking for this function at No. 9.
Cultural Interaction
◆ The top �ve ranked cities in Research and Development are New York (No. 1), London (No. 2), Tokyo (No. 3), Los Angeles (No. 4), and Seoul (No. 5). Excluding London, all cities are located in either the US or Asia.
◆ The US cities boast strong scores for Number of Winners of Highly-Reputed Prizes (Science and Technology-related Fields) and World's Top 200 Universities, while the cities of Asia are distinguished by high ratings for Academic Performance in Mathematics and Science.
◆ Tokyo retains its lead in Number of Researchers and Number of Registered Industrial Property Rights (Patents), but the weaker yen has harmed its score for Research and Development Expenditure and thus the Japanese capital slips down one place in this function from No. 2 last year.y=x2+2x+…
R&D
Rank Economy R&D Cultural Interaction Livability Environment Accessibility
1 New York 323.2 New York 183.7 London 333.1 Berlin 369.3 Frankfurt 200.1 Paris 245.3
2 London 301.6 London 165.1 New York 233.1 Amsterdam 363.7 Zurich 197.5 London 244.0
3 Beijing 295.6 Tokyo 162.9 Paris 217.3 Stockholm 359.2 Singapore 191.4 Shanghai 224.0
4 Tokyo 294.3 Los Angeles 148.9 Tokyo 186.3 Vienna 358.6 Geneva 191.3 New York 221.1
5 Shanghai 256.0 Seoul 126.5 Singapore 180.9 Frankfurt 358.4 Stockholm 190.5 Hong Kong 206.7
6 Zurich 243.7 Singapore 125.4 Berlin 158.1 Barcelona 352.6 Vienna 189.6 Tokyo 206.1
7 Hong Kong 242.7 Boston 119.5 Beijing 155.0 Paris 350.5 London 188.0 Amsterdam 201.6
8 Singapore 239.3 Chicago 113.6 Vienna 148.9 Madrid 348.3 Copenhagen 187.7 Frankfurt 201.2
9 Sydney 231.5 San Francisco 112.1 Dubai 141.9 Vancouver 344.7 Sydney 177.4 Singapore 197.5
10 Seoul 227.9 Paris 104.4 Sydney 135.2 Copenhagen 342.0 Vancouver 174.3 Seoul 192.8
11 Dubai 216.5 Hong Kong 96.4 Seoul 134.0 Toronto 342.0 Berlin 172.8 Istanbul 191.1
12 Paris 211.9 Osaka 87.2 Barcelona 133.9 Milan 338.9 Tokyo 172.4 Moscow 181.5
13 San Francisco 210.4 Berlin 79.7 Bangkok 132.1 Fukuoka 334.0 Amsterdam 172.2 Dubai 177.0
14 Stockholm 209.8 Beijing 77.9 Amsterdam 131.7 Tokyo 332.8 Sao Paulo 172.0 Chicago 168.0
15 Geneva 204.8 Washington, D.C. 75.5 Brussels 131.5 Zurich 329.2 Taipei 167.9 Beijing 158.9
16 Washington, D.C. 202.8 Sydney 73.2 Istanbul 127.7 Sydney 329.1 Washington, D.C. 166.6 Barcelona 158.4
17 Frankfurt 198.8 Amsterdam 65.2 Shanghai 124.0 London 328.3 San Francisco 164.4 Madrid 156.8
18 Toronto 198.5 Shanghai 61.7 Los Angeles 123.6 Kuala Lumpur 327.5 Hong Kong 162.8 Brussels 156.6
19 Amsterdam 195.5 Toronto 60.4 Madrid 117.8 Osaka 321.7 Madrid 162.4 Taipei 150.8
20 Copenhagen 195.4 Brussels 59.3 Mexico City 109.1 Brussels 320.7 Milan 162.4 Bangkok 148.5
21 Berlin 192.3 Moscow 57.8 Chicago 107.4 Geneva 316.0 Fukuoka 162.4 Washington, D.C. 148.4
22 Kuala Lumpur 190.9 Geneva 54.5 Hong Kong 105.9 Seoul 308.7 Los Angeles 161.3 Los Angeles 146.5
23 Los Angeles 190.7 Taipei 54.1 Milan 101.7 Los Angeles 302.5 Barcelona 158.5 Copenhagen 145.3
24 Vancouver 190.2 Stockholm 53.6 Osaka 101.3 Moscow 299.7 Brussels 157.9 Toronto 144.2
25 Boston 185.1 Zurich 52.9 Moscow 98.3 San Francisco 298.1 Kuala Lumpur 154.7 Boston 143.6
26 Istanbul 183.8 Istanbul 46.4 Washington, D.C. 95.2 Buenos Aires 293.4 Toronto 153.9 Milan 142.3
27 Chicago 181.0 Vienna 45.0 Buenos Aires 93.6 Bangkok 292.2 Seoul 153.6 Vienna 140.6
28 Taipei 174.8 Bangkok 44.5 San Francisco 93.5 Singapore 290.1 Paris 152.7 Osaka 136.1
29 Osaka 169.5 Fukuoka 44.0 Toronto 93.3 Sao Paulo 289.8 Boston 148.7 Berlin 135.7
30 Vienna 163.2 Vancouver 43.6 Sao Paulo 89.4 Jakarta 289.4 New York 145.2 Kuala Lumpur 134.7
31 Bangkok 154.2 Dubai 43.2 Boston 84.0 Dubai 287.4 Osaka 142.9 Stockholm 133.7
32 Brussels 152.4 Barcelona 41.8 Stockholm 80.6 Beijing 284.8 Bangkok 137.3 Sydney 131.6
33 Fukuoka 147.7 Copenhagen 39.6 Vancouver 79.3 Boston 283.9 Chicago 136.7 San Francisco 127.3
34 Moscow 145.4 Kuala Lumpur 33.1 Kuala Lumpur 78.4 New York 280.0 Buenos Aires 134.0 Zurich 125.1
35 Milan 141.7 Frankfurt 32.0 Copenhagen 74.1 Mexico City 277.4 Johannesburg 122.8 Mexico City 123.6
36 Mexico City 139.8 Madrid 31.4 Frankfurt 69.4 Hong Kong 275.6 Mexico City 122.3 Buenos Aires 116.9
37 Jakarta 130.0 Milan 26.4 Mumbai 59.8 Istanbul 273.7 Mumbai 121.2 Fukuoka 114.0
38 Madrid 128.9 Buenos Aires 19.7 Cairo 49.8 Shanghai 273.6 Jakarta 107.4 Vancouver 112.6
39 Barcelona 121.9 Sao Paulo 15.7 Johannesburg 49.2 Cairo 269.1 Dubai 103.7 Cairo 110.4
40 Sao Paulo 118.5 Jakarta 12.4 Zurich 48.6 Chicago 268.9 Istanbul 103.5 Jakarta 99.9
41 Johannesburg 118.0 Mexico City 11.5 Fukuoka 38.8 Mumbai 268.3 Shanghai 93.6 Geneva 99.3
42 Mumbai 115.4 Mumbai 8.1 Jakarta 36.6 Taipei 264.7 Cairo 88.5 Mumbai 94.4
43 Cairo 80.6 Johannesburg 7.5 Geneva 35.9 Washington, D.C. 239.8 Beijing 79.4 Sao Paulo 91.8
44 Buenos Aires 70.8 Cairo 5.5 Taipei 35.7 Johannesburg 214.6 Moscow 75.1 Johannesburg 80.9
Global Power City Index 2017 Global Power City Index 201710 11
3. Function-Specific Ranking
3-4 Function-Specific Ranking
Function-Specific Ranking
3-5 Function-Specific Ranking Key Findings
◆ The top �ve ranked cities in Economy are New York (No. 1), London (No. 2), Beijing (No. 3), Tokyo (No. 4), and Shanghai (No. 5). Three of those cities are in Asia.
◆ Tokyo, the leading city last year, fails to improve its scores across all indicators in Economy partly due to the impact of a weaker yen and therefore falls to No.4.
◆ Meanwhile, New York, which was No. 3 last year, claims top spot in this function having returned higher scores for Nominal GDP and GDP Growth Rate.
◆ Among Asian cities, Hong Kong (No. 7) and Singapore (No. 8) both slip two places from last year. This mainly owes to a decline in GDP Growth Rate.
◆ Newly added to the GPCI in 2017, Dubai debuts at No. 11 thanks to high scores for GDP Growth Rate and Corporate Tax Rate.
¥£¥¥
$US
GB
CN
JP
$
Economy
◆ The top five ranked cities in Cultural Interaction are London (No. 1), New York (No. 2), Paris (No. 3), Tokyo (No. 4), and Singapore (No. 5). In terms of score, London maintains a notable lead over the other cities.
◆ Tokyo jumps up to No. 4 from No. 5 last year. This movement owes to steady score improvements in “Facilities for Visitors,” namely for Number of Museums, as well as in “International Interaction” for Number of Visitors from Abroad.
◆ Cities that make large gains this year include Seoul (No. 11) and Bangkok (No. 13). The former climbs �ve places from No. 16 last year on the back of a higher score for Number of International Conferences Held . The latter surges �ve spots in this function thanks to increases in Number of International Conferences Held, Number of Museums, and Number of Visitors from Abroad.
◆ Newly listed Dubai tops the list for Number of Luxury Hotel Guest Rooms and Number of Foreign Residents and combined with a strong score for Number of Visitors from Abroad, enters the ranking for this function at No. 9.
Cultural Interaction
◆ The top �ve ranked cities in Research and Development are New York (No. 1), London (No. 2), Tokyo (No. 3), Los Angeles (No. 4), and Seoul (No. 5). Excluding London, all cities are located in either the US or Asia.
◆ The US cities boast strong scores for Number of Winners of Highly-Reputed Prizes (Science and Technology-related Fields) and World's Top 200 Universities, while the cities of Asia are distinguished by high ratings for Academic Performance in Mathematics and Science.
◆ Tokyo retains its lead in Number of Researchers and Number of Registered Industrial Property Rights (Patents), but the weaker yen has harmed its score for Research and Development Expenditure and thus the Japanese capital slips down one place in this function from No. 2 last year.y=x2+2x+…
R&D
Rank Economy R&D Cultural Interaction Livability Environment Accessibility
1 New York 323.2 New York 183.7 London 333.1 Berlin 369.3 Frankfurt 200.1 Paris 245.3
2 London 301.6 London 165.1 New York 233.1 Amsterdam 363.7 Zurich 197.5 London 244.0
3 Beijing 295.6 Tokyo 162.9 Paris 217.3 Stockholm 359.2 Singapore 191.4 Shanghai 224.0
4 Tokyo 294.3 Los Angeles 148.9 Tokyo 186.3 Vienna 358.6 Geneva 191.3 New York 221.1
5 Shanghai 256.0 Seoul 126.5 Singapore 180.9 Frankfurt 358.4 Stockholm 190.5 Hong Kong 206.7
6 Zurich 243.7 Singapore 125.4 Berlin 158.1 Barcelona 352.6 Vienna 189.6 Tokyo 206.1
7 Hong Kong 242.7 Boston 119.5 Beijing 155.0 Paris 350.5 London 188.0 Amsterdam 201.6
8 Singapore 239.3 Chicago 113.6 Vienna 148.9 Madrid 348.3 Copenhagen 187.7 Frankfurt 201.2
9 Sydney 231.5 San Francisco 112.1 Dubai 141.9 Vancouver 344.7 Sydney 177.4 Singapore 197.5
10 Seoul 227.9 Paris 104.4 Sydney 135.2 Copenhagen 342.0 Vancouver 174.3 Seoul 192.8
11 Dubai 216.5 Hong Kong 96.4 Seoul 134.0 Toronto 342.0 Berlin 172.8 Istanbul 191.1
12 Paris 211.9 Osaka 87.2 Barcelona 133.9 Milan 338.9 Tokyo 172.4 Moscow 181.5
13 San Francisco 210.4 Berlin 79.7 Bangkok 132.1 Fukuoka 334.0 Amsterdam 172.2 Dubai 177.0
14 Stockholm 209.8 Beijing 77.9 Amsterdam 131.7 Tokyo 332.8 Sao Paulo 172.0 Chicago 168.0
15 Geneva 204.8 Washington, D.C. 75.5 Brussels 131.5 Zurich 329.2 Taipei 167.9 Beijing 158.9
16 Washington, D.C. 202.8 Sydney 73.2 Istanbul 127.7 Sydney 329.1 Washington, D.C. 166.6 Barcelona 158.4
17 Frankfurt 198.8 Amsterdam 65.2 Shanghai 124.0 London 328.3 San Francisco 164.4 Madrid 156.8
18 Toronto 198.5 Shanghai 61.7 Los Angeles 123.6 Kuala Lumpur 327.5 Hong Kong 162.8 Brussels 156.6
19 Amsterdam 195.5 Toronto 60.4 Madrid 117.8 Osaka 321.7 Madrid 162.4 Taipei 150.8
20 Copenhagen 195.4 Brussels 59.3 Mexico City 109.1 Brussels 320.7 Milan 162.4 Bangkok 148.5
21 Berlin 192.3 Moscow 57.8 Chicago 107.4 Geneva 316.0 Fukuoka 162.4 Washington, D.C. 148.4
22 Kuala Lumpur 190.9 Geneva 54.5 Hong Kong 105.9 Seoul 308.7 Los Angeles 161.3 Los Angeles 146.5
23 Los Angeles 190.7 Taipei 54.1 Milan 101.7 Los Angeles 302.5 Barcelona 158.5 Copenhagen 145.3
24 Vancouver 190.2 Stockholm 53.6 Osaka 101.3 Moscow 299.7 Brussels 157.9 Toronto 144.2
25 Boston 185.1 Zurich 52.9 Moscow 98.3 San Francisco 298.1 Kuala Lumpur 154.7 Boston 143.6
26 Istanbul 183.8 Istanbul 46.4 Washington, D.C. 95.2 Buenos Aires 293.4 Toronto 153.9 Milan 142.3
27 Chicago 181.0 Vienna 45.0 Buenos Aires 93.6 Bangkok 292.2 Seoul 153.6 Vienna 140.6
28 Taipei 174.8 Bangkok 44.5 San Francisco 93.5 Singapore 290.1 Paris 152.7 Osaka 136.1
29 Osaka 169.5 Fukuoka 44.0 Toronto 93.3 Sao Paulo 289.8 Boston 148.7 Berlin 135.7
30 Vienna 163.2 Vancouver 43.6 Sao Paulo 89.4 Jakarta 289.4 New York 145.2 Kuala Lumpur 134.7
31 Bangkok 154.2 Dubai 43.2 Boston 84.0 Dubai 287.4 Osaka 142.9 Stockholm 133.7
32 Brussels 152.4 Barcelona 41.8 Stockholm 80.6 Beijing 284.8 Bangkok 137.3 Sydney 131.6
33 Fukuoka 147.7 Copenhagen 39.6 Vancouver 79.3 Boston 283.9 Chicago 136.7 San Francisco 127.3
34 Moscow 145.4 Kuala Lumpur 33.1 Kuala Lumpur 78.4 New York 280.0 Buenos Aires 134.0 Zurich 125.1
35 Milan 141.7 Frankfurt 32.0 Copenhagen 74.1 Mexico City 277.4 Johannesburg 122.8 Mexico City 123.6
36 Mexico City 139.8 Madrid 31.4 Frankfurt 69.4 Hong Kong 275.6 Mexico City 122.3 Buenos Aires 116.9
37 Jakarta 130.0 Milan 26.4 Mumbai 59.8 Istanbul 273.7 Mumbai 121.2 Fukuoka 114.0
38 Madrid 128.9 Buenos Aires 19.7 Cairo 49.8 Shanghai 273.6 Jakarta 107.4 Vancouver 112.6
39 Barcelona 121.9 Sao Paulo 15.7 Johannesburg 49.2 Cairo 269.1 Dubai 103.7 Cairo 110.4
40 Sao Paulo 118.5 Jakarta 12.4 Zurich 48.6 Chicago 268.9 Istanbul 103.5 Jakarta 99.9
41 Johannesburg 118.0 Mexico City 11.5 Fukuoka 38.8 Mumbai 268.3 Shanghai 93.6 Geneva 99.3
42 Mumbai 115.4 Mumbai 8.1 Jakarta 36.6 Taipei 264.7 Cairo 88.5 Mumbai 94.4
43 Cairo 80.6 Johannesburg 7.5 Geneva 35.9 Washington, D.C. 239.8 Beijing 79.4 Sao Paulo 91.8
44 Buenos Aires 70.8 Cairo 5.5 Taipei 35.7 Johannesburg 214.6 Moscow 75.1 Johannesburg 80.9
Global Power City Index 2017 Global Power City Index 201710 11
3. Function-Specific Ranking
Flow of Actor-Specific Ranking
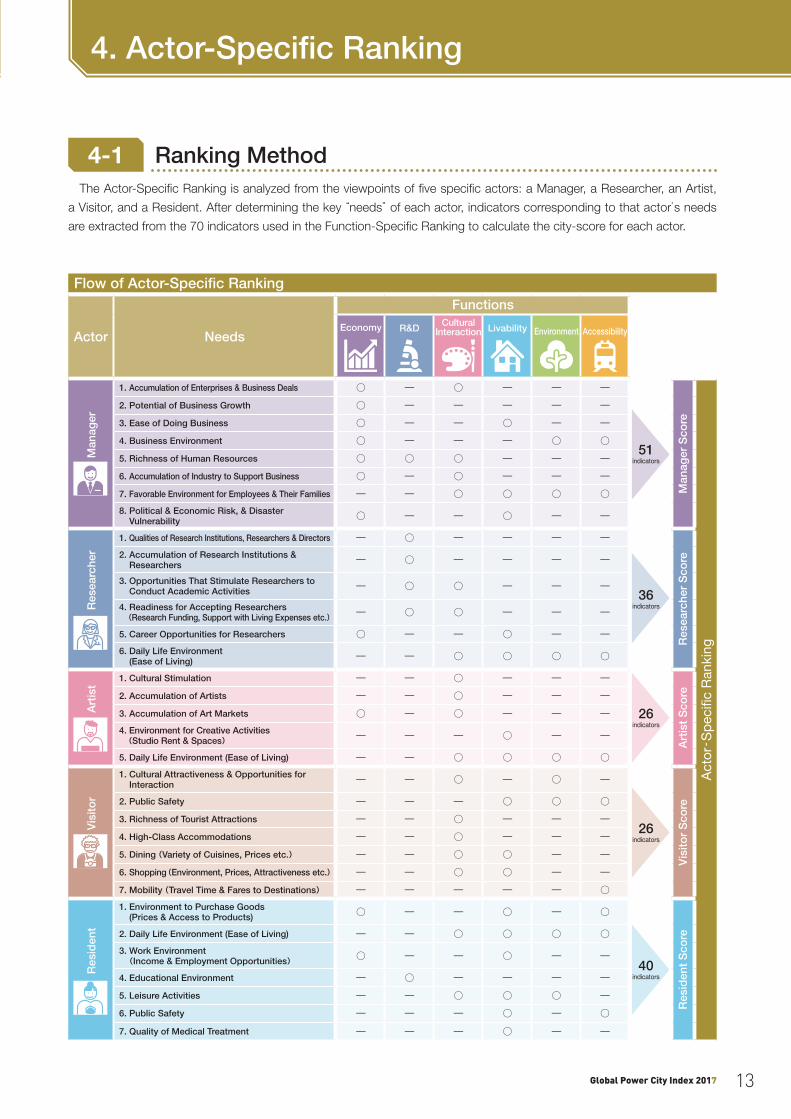
4-1 Ranking MethodThe Actor-Speci�c Ranking is analyzed from the viewpoints of �ve speci�c actors: a Manager, a Researcher, an Artist,
a Visitor, and a Resident. After determining the key “needs” of each actor, indicators corresponding to that actor’s needs
are extracted from the 70 indicators used in the Function-Speci�c Ranking to calculate the city-score for each actor.
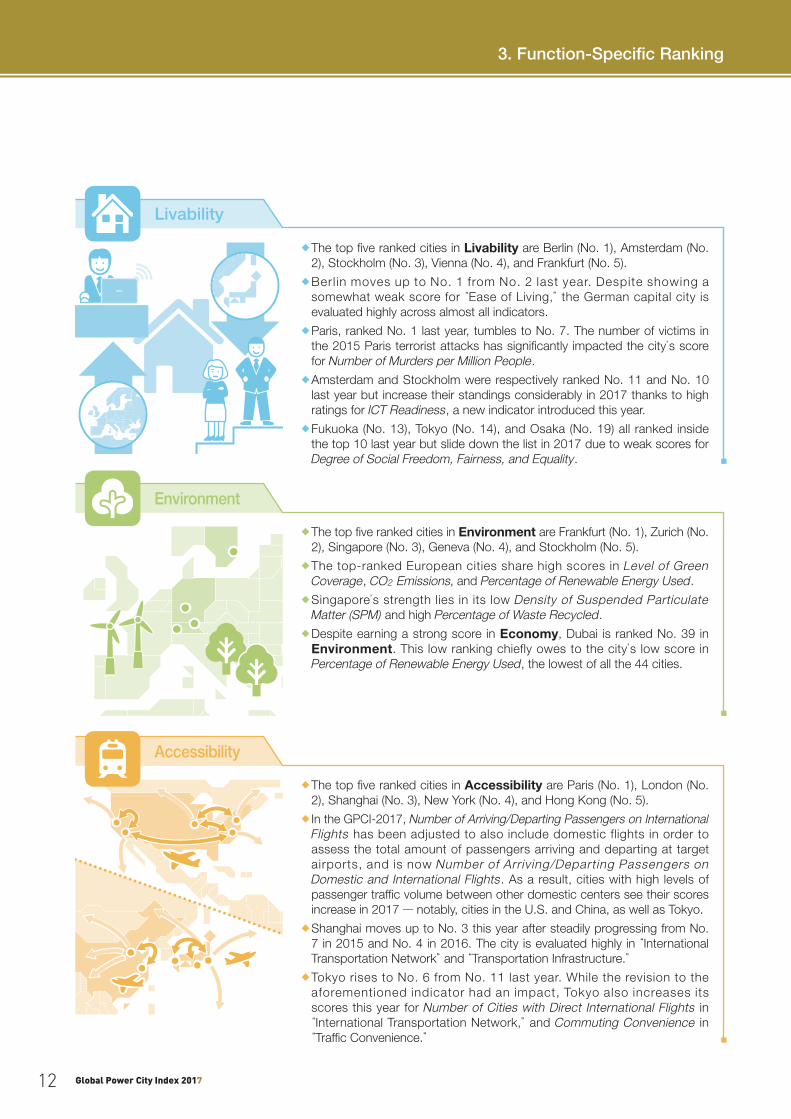
◆ The top �ve ranked cities in Livability are Berlin (No. 1), Amsterdam (No. 2), Stockholm (No. 3), Vienna (No. 4), and Frankfurt (No. 5).
◆ Berl in moves up to No. 1 from No. 2 last year. Despite showing a somewhat weak score for “Ease of Living,” the German capital city is evaluated highly across almost all indicators.
◆ Paris, ranked No. 1 last year, tumbles to No. 7. The number of victims in the 2015 Paris terrorist attacks has signi�cantly impacted the city’s score for Number of Murders per Million People.
◆ Amsterdam and Stockholm were respectively ranked No. 11 and No. 10 last year but increase their standings considerably in 2017 thanks to high ratings for ICT Readiness, a new indicator introduced this year.
◆ Fukuoka (No. 13), Tokyo (No. 14), and Osaka (No. 19) all ranked inside the top 10 last year but slide down the list in 2017 due to weak scores for Degree of Social Freedom, Fairness, and Equality.
Livability
◆ The top �ve ranked cities in Accessibility are Paris (No. 1), London (No. 2), Shanghai (No. 3), New York (No. 4), and Hong Kong (No. 5).
◆ In the GPCI-2017, Number of Arriving/Departing Passengers on International Flights has been adjusted to also include domestic flights in order to assess the total amount of passengers arriving and departing at target airports, and is now Number of Arriving/Departing Passengers on Domestic and International Flights. As a result, cities with high levels of passenger traf�c volume between other domestic centers see their scores increase in 2017 ― notably, cities in the U.S. and China, as well as Tokyo.
◆ Shanghai moves up to No. 3 this year after steadily progressing from No. 7 in 2015 and No. 4 in 2016. The city is evaluated highly in “International Transportation Network” and “Transportation Infrastructure.”
◆ Tokyo rises to No. 6 from No. 11 last year. While the revision to the aforementioned indicator had an impact, Tokyo also increases its scores this year for Number of Cities with Direct International Flights in “International Transportation Network,” and Commuting Convenience in “Traf�c Convenience.”
Accessibility
◆ The top �ve ranked cities in Environment are Frankfurt (No. 1), Zurich (No. 2), Singapore (No. 3), Geneva (No. 4), and Stockholm (No. 5).
◆ The top-ranked European cities share high scores in Level of Green Coverage, CO2 Emissions, and Percentage of Renewable Energy Used.
◆ Singapore’s strength lies in its low Density of Suspended Particulate Matter (SPM) and high Percentage of Waste Recycled.
◆ Despite earning a strong score in Economy, Dubai is ranked No. 39 in Environment. This low ranking chiefly owes to the city’s low score in Percentage of Renewable Energy Used, the lowest of all the 44 cities.
Environment
Actor Needs
Functions
Economy R&DCultural
Interaction Livability Environment Accessibility
Man
ager
1. Accumulation of Enterprises & Business Deals ○ ― ○ ― ― ―
51indicators
Man
ager
Sco
re
Act
or‐
Sp
eci�
c R
anki
ng
2. Potential of Business Growth ○ ― ― ― ― ―
3. Ease of Doing Business ○ ― ― ○ ― ―
4. Business Environment ○ ― ― ― ○ ○
5. Richness of Human Resources ○ ○ ○ ― ― ―
6. Accumulation of Industry to Support Business ○ ― ○ ― ― ―
7. Favorable Environment for Employees & Their Families ― ― ○ ○ ○ ○8. Political & Economic Risk, & Disaster
Vulnerability ○ ― ― ○ ― ―
Res
earc
her
1. Qualities of Research Institutions, Researchers & Directors ― ○ ― ― ― ―
36indicators
Res
earc
her
Sco
re2. Accumulation of Research Institutions & Researchers ― ○ ― ― ― ―
3. Opportunities That Stimulate Researchers to Conduct Academic Activities ― ○ ○ ― ― ―
4. Readiness for Accepting Researchers (Research Funding, Support with Living Expenses etc.) ― ○ ○ ― ― ―
5. Career Opportunities for Researchers ○ ― ― ○ ― ―6. Daily Life Environment
(Ease of Living) ― ― ○ ○ ○ ○
Art
ist
1. Cultural Stimulation ― ― ○ ― ― ―
26indicators
Art
ist
Sco
re2. Accumulation of Artists ― ― ○ ― ― ―
3. Accumulation of Art Markets ○ ― ○ ― ― ―4. Environment for Creative Activities (Studio Rent & Spaces) ― ― ― ○ ― ―
5. Daily Life Environment (Ease of Living) ― ― ○ ○ ○ ○
Vis
itor
1. Cultural Attractiveness & Opportunities for Interaction ― ― ○ ― ○ ―
26indicators
Vis
itor
Sco
re2. Public Safety ― ― ― ○ ○ ○
3. Richness of Tourist Attractions ― ― ○ ― ― ―
4. High-Class Accommodations ― ― ○ ― ― ―
5. Dining (Variety of Cuisines, Prices etc.) ― ― ○ ○ ― ―
6. Shopping (Environment, Prices, Attractiveness etc.) ― ― ○ ○ ― ―
7. Mobility (Travel Time & Fares to Destinations) ― ― ― ― ― ○R
esid
ent
1. Environment to Purchase Goods (Prices & Access to Products) ○ ― ― ○ ― ○
40indicators
Res
iden
t S
core2. Daily Life Environment (Ease of Living) ― ― ○ ○ ○ ○
3. Work Environment (Income & Employment Opportunities) ○ ― ― ○ ― ―
4. Educational Environment ― ○ ― ― ― ―
5. Leisure Activities ― ― ○ ○ ○ ―
6. Public Safety ― ― ― ○ ― ○
7. Quality of Medical Treatment ― ― ― ○ ― ―
Global Power City Index 2017 Global Power City Index 201712 13
3. Function-Specific Ranking 4. Actor-Specific Ranking
Flow of Actor-Specific Ranking
4-1 Ranking MethodThe Actor-Speci�c Ranking is analyzed from the viewpoints of �ve speci�c actors: a Manager, a Researcher, an Artist,
a Visitor, and a Resident. After determining the key “needs” of each actor, indicators corresponding to that actor’s needs
are extracted from the 70 indicators used in the Function-Speci�c Ranking to calculate the city-score for each actor.
◆ The top �ve ranked cities in Livability are Berlin (No. 1), Amsterdam (No. 2), Stockholm (No. 3), Vienna (No. 4), and Frankfurt (No. 5).
◆ Berl in moves up to No. 1 from No. 2 last year. Despite showing a somewhat weak score for “Ease of Living,” the German capital city is evaluated highly across almost all indicators.
◆ Paris, ranked No. 1 last year, tumbles to No. 7. The number of victims in the 2015 Paris terrorist attacks has signi�cantly impacted the city’s score for Number of Murders per Million People.
◆ Amsterdam and Stockholm were respectively ranked No. 11 and No. 10 last year but increase their standings considerably in 2017 thanks to high ratings for ICT Readiness, a new indicator introduced this year.
◆ Fukuoka (No. 13), Tokyo (No. 14), and Osaka (No. 19) all ranked inside the top 10 last year but slide down the list in 2017 due to weak scores for Degree of Social Freedom, Fairness, and Equality.
Livability
◆ The top �ve ranked cities in Accessibility are Paris (No. 1), London (No. 2), Shanghai (No. 3), New York (No. 4), and Hong Kong (No. 5).
◆ In the GPCI-2017, Number of Arriving/Departing Passengers on International Flights has been adjusted to also include domestic flights in order to assess the total amount of passengers arriving and departing at target airports, and is now Number of Arriving/Departing Passengers on Domestic and International Flights. As a result, cities with high levels of passenger traf�c volume between other domestic centers see their scores increase in 2017 ― notably, cities in the U.S. and China, as well as Tokyo.
◆ Shanghai moves up to No. 3 this year after steadily progressing from No. 7 in 2015 and No. 4 in 2016. The city is evaluated highly in “International Transportation Network” and “Transportation Infrastructure.”
◆ Tokyo rises to No. 6 from No. 11 last year. While the revision to the aforementioned indicator had an impact, Tokyo also increases its scores this year for Number of Cities with Direct International Flights in “International Transportation Network,” and Commuting Convenience in “Traf�c Convenience.”
Accessibility
◆ The top �ve ranked cities in Environment are Frankfurt (No. 1), Zurich (No. 2), Singapore (No. 3), Geneva (No. 4), and Stockholm (No. 5).
◆ The top-ranked European cities share high scores in Level of Green Coverage, CO2 Emissions, and Percentage of Renewable Energy Used.
◆ Singapore’s strength lies in its low Density of Suspended Particulate Matter (SPM) and high Percentage of Waste Recycled.
◆ Despite earning a strong score in Economy, Dubai is ranked No. 39 in Environment. This low ranking chiefly owes to the city’s low score in Percentage of Renewable Energy Used, the lowest of all the 44 cities.
Environment
Actor Needs
Functions
Economy R&DCultural
Interaction Livability Environment Accessibility
Man
ager
1. Accumulation of Enterprises & Business Deals ○ ― ○ ― ― ―
51indicators
Man
ager
Sco
re
Act
or‐
Sp
eci�
c R
anki
ng
2. Potential of Business Growth ○ ― ― ― ― ―
3. Ease of Doing Business ○ ― ― ○ ― ―
4. Business Environment ○ ― ― ― ○ ○
5. Richness of Human Resources ○ ○ ○ ― ― ―
6. Accumulation of Industry to Support Business ○ ― ○ ― ― ―
7. Favorable Environment for Employees & Their Families ― ― ○ ○ ○ ○8. Political & Economic Risk, & Disaster
Vulnerability ○ ― ― ○ ― ―
Res
earc
her
1. Qualities of Research Institutions, Researchers & Directors ― ○ ― ― ― ―
36indicators
Res
earc
her
Sco
re2. Accumulation of Research Institutions & Researchers ― ○ ― ― ― ―
3. Opportunities That Stimulate Researchers to Conduct Academic Activities ― ○ ○ ― ― ―
4. Readiness for Accepting Researchers (Research Funding, Support with Living Expenses etc.) ― ○ ○ ― ― ―
5. Career Opportunities for Researchers ○ ― ― ○ ― ―6. Daily Life Environment
(Ease of Living) ― ― ○ ○ ○ ○
Art
ist
1. Cultural Stimulation ― ― ○ ― ― ―
26indicators
Art
ist
Sco
re2. Accumulation of Artists ― ― ○ ― ― ―
3. Accumulation of Art Markets ○ ― ○ ― ― ―4. Environment for Creative Activities (Studio Rent & Spaces) ― ― ― ○ ― ―
5. Daily Life Environment (Ease of Living) ― ― ○ ○ ○ ○
Vis
itor
1. Cultural Attractiveness & Opportunities for Interaction ― ― ○ ― ○ ―
26indicators
Vis
itor
Sco
re2. Public Safety ― ― ― ○ ○ ○
3. Richness of Tourist Attractions ― ― ○ ― ― ―
4. High-Class Accommodations ― ― ○ ― ― ―
5. Dining (Variety of Cuisines, Prices etc.) ― ― ○ ○ ― ―
6. Shopping (Environment, Prices, Attractiveness etc.) ― ― ○ ○ ― ―
7. Mobility (Travel Time & Fares to Destinations) ― ― ― ― ― ○
Res
iden
t
1. Environment to Purchase Goods (Prices & Access to Products) ○ ― ― ○ ― ○
40indicators
Res
iden
t S
core2. Daily Life Environment (Ease of Living) ― ― ○ ○ ○ ○
3. Work Environment (Income & Employment Opportunities) ○ ― ― ○ ― ―
4. Educational Environment ― ○ ― ― ― ―
5. Leisure Activities ― ― ○ ○ ○ ―
6. Public Safety ― ― ― ○ ― ○
7. Quality of Medical Treatment ― ― ― ○ ― ―
Global Power City Index 2017 Global Power City Index 201712 13
3. Function-Specific Ranking 4. Actor-Specific Ranking
Actor-Specific Ranking
4-3 Actor-Specific Ranking Key Findings
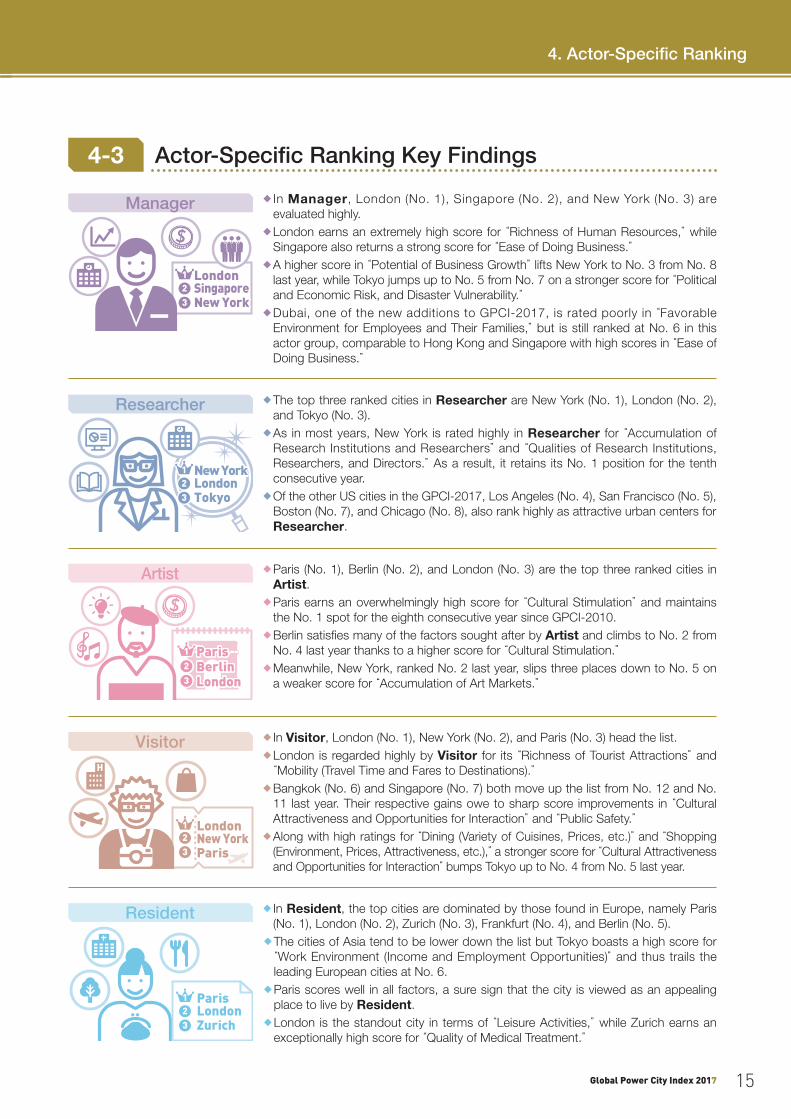
◆ In Manager, London (No. 1), Singapore (No. 2), and New York (No. 3) are evaluated highly.
◆ London earns an extremely high score for “Richness of Human Resources,” while Singapore also returns a strong score for “Ease of Doing Business.”
◆ A higher score in “Potential of Business Growth” lifts New York to No. 3 from No. 8 last year, while Tokyo jumps up to No. 5 from No. 7 on a stronger score for “Political and Economic Risk, and Disaster Vulnerability.”
◆ Dubai, one of the new additions to GPCI-2017, is rated poorly in “Favorable Environment for Employees and Their Families,” but is still ranked at No. 6 in this actor group, comparable to Hong Kong and Singapore with high scores in “Ease of Doing Business.”
$
SingaporeSingaporeLondonLondon
New YorkNew York
123
Manager
◆ The top three ranked cities in Researcher are New York (No. 1), London (No. 2), and Tokyo (No. 3).
◆ As in most years, New York is rated highly in Researcher for “Accumulation of Research Institutions and Researchers” and “Qualities of Research Institutions, Researchers, and Directors.” As a result, it retains its No. 1 position for the tenth consecutive year.
◆ Of the other US cities in the GPCI-2017, Los Angeles (No. 4), San Francisco (No. 5), Boston (No. 7), and Chicago (No. 8), also rank highly as attractive urban centers for Researcher.
LondonLondonNew YorkNew York1
2
TokyoTokyo3
Researcher
◆ In Visitor, London (No. 1), New York (No. 2), and Paris (No. 3) head the list.◆ London is regarded highly by Visitor for its “Richness of Tourist Attractions” and “Mobility (Travel Time and Fares to Destinations).”◆ Bangkok (No. 6) and Singapore (No. 7) both move up the list from No. 12 and No.
11 last year. Their respective gains owe to sharp score improvements in “Cultural Attractiveness and Opportunities for Interaction” and “Public Safety.”
◆ Along with high ratings for “Dining (Variety of Cuisines, Prices, etc.)” and “Shopping (Environment, Prices, Attractiveness, etc.),” a stronger score for “Cultural Attractiveness and Opportunities for Interaction” bumps Tokyo up to No. 4 from No. 5 last year.
H
New YorkNew YorkLondonLondon1
23 ParisParis
Visitor
◆ In Resident, the top cities are dominated by those found in Europe, namely Paris (No. 1), London (No. 2), Zurich (No. 3), Frankfurt (No. 4), and Berlin (No. 5).
◆ The cities of Asia tend to be lower down the list but Tokyo boasts a high score for “Work Environment (Income and Employment Opportunities)” and thus trails the leading European cities at No. 6.
◆ Paris scores well in all factors, a sure sign that the city is viewed as an appealing place to live by Resident.
◆ London is the standout city in terms of “Leisure Activities,” while Zurich earns an exceptionally high score for “Quality of Medical Treatment.”
123
LondonLondonParisParis
ZurichZurich
Resident
4-2 Actor-Specific Ranking
◆ Paris (No. 1), Berlin (No. 2), and London (No. 3) are the top three ranked cities in Artist.
◆ Paris earns an overwhelmingly high score for “Cultural Stimulation” and maintains the No. 1 spot for the eighth consecutive year since GPCI-2010.
◆ Berlin satis�es many of the factors sought after by Artist and climbs to No. 2 from No. 4 last year thanks to a higher score for “Cultural Stimulation.”
◆ Meanwhile, New York, ranked No. 2 last year, slips three places down to No. 5 on a weaker score for “Accumulation of Art Markets.”
BerlinBerlin
$
ParisParis
LondonLondon
1
2
3
Artist
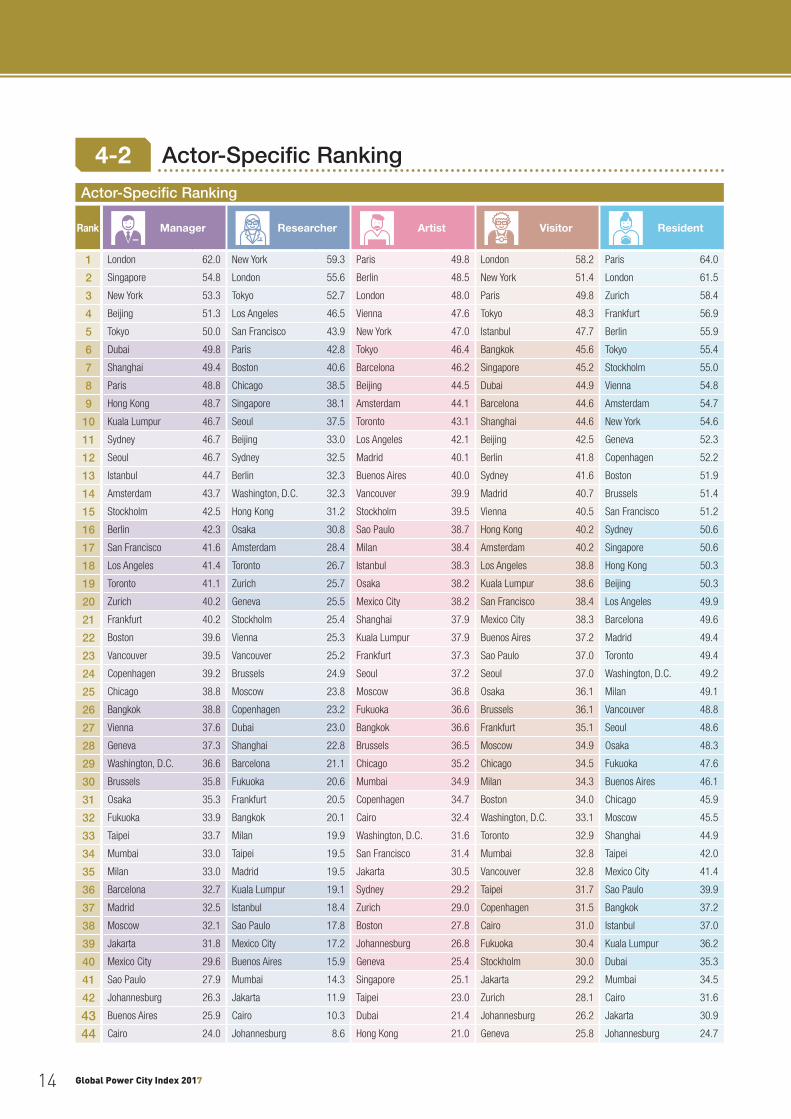
Rank Manager Researcher Artist Visitor Resident
1 London 62.0 New York 59.3 Paris 49.8 London 58.2 Paris 64.0
2 Singapore 54.8 London 55.6 Berlin 48.5 New York 51.4 London 61.5
3 New York 53.3 Tokyo 52.7 London 48.0 Paris 49.8 Zurich 58.4
4 Beijing 51.3 Los Angeles 46.5 Vienna 47.6 Tokyo 48.3 Frankfurt 56.9
5 Tokyo 50.0 San Francisco 43.9 New York 47.0 Istanbul 47.7 Berlin 55.9
6 Dubai 49.8 Paris 42.8 Tokyo 46.4 Bangkok 45.6 Tokyo 55.4
7 Shanghai 49.4 Boston 40.6 Barcelona 46.2 Singapore 45.2 Stockholm 55.0
8 Paris 48.8 Chicago 38.5 Beijing 44.5 Dubai 44.9 Vienna 54.8
9 Hong Kong 48.7 Singapore 38.1 Amsterdam 44.1 Barcelona 44.6 Amsterdam 54.7
10 Kuala Lumpur 46.7 Seoul 37.5 Toronto 43.1 Shanghai 44.6 New York 54.6
11 Sydney 46.7 Beijing 33.0 Los Angeles 42.1 Beijing 42.5 Geneva 52.3
12 Seoul 46.7 Sydney 32.5 Madrid 40.1 Berlin 41.8 Copenhagen 52.2
13 Istanbul 44.7 Berlin 32.3 Buenos Aires 40.0 Sydney 41.6 Boston 51.9
14 Amsterdam 43.7 Washington, D.C. 32.3 Vancouver 39.9 Madrid 40.7 Brussels 51.4
15 Stockholm 42.5 Hong Kong 31.2 Stockholm 39.5 Vienna 40.5 San Francisco 51.2
16 Berlin 42.3 Osaka 30.8 Sao Paulo 38.7 Hong Kong 40.2 Sydney 50.6
17 San Francisco 41.6 Amsterdam 28.4 Milan 38.4 Amsterdam 40.2 Singapore 50.6
18 Los Angeles 41.4 Toronto 26.7 Istanbul 38.3 Los Angeles 38.8 Hong Kong 50.3
19 Toronto 41.1 Zurich 25.7 Osaka 38.2 Kuala Lumpur 38.6 Beijing 50.3
20 Zurich 40.2 Geneva 25.5 Mexico City 38.2 San Francisco 38.4 Los Angeles 49.9
21 Frankfurt 40.2 Stockholm 25.4 Shanghai 37.9 Mexico City 38.3 Barcelona 49.6
22 Boston 39.6 Vienna 25.3 Kuala Lumpur 37.9 Buenos Aires 37.2 Madrid 49.4
23 Vancouver 39.5 Vancouver 25.2 Frankfurt 37.3 Sao Paulo 37.0 Toronto 49.4
24 Copenhagen 39.2 Brussels 24.9 Seoul 37.2 Seoul 37.0 Washington, D.C. 49.2
25 Chicago 38.8 Moscow 23.8 Moscow 36.8 Osaka 36.1 Milan 49.1
26 Bangkok 38.8 Copenhagen 23.2 Fukuoka 36.6 Brussels 36.1 Vancouver 48.8
27 Vienna 37.6 Dubai 23.0 Bangkok 36.6 Frankfurt 35.1 Seoul 48.6
28 Geneva 37.3 Shanghai 22.8 Brussels 36.5 Moscow 34.9 Osaka 48.3
29 Washington, D.C. 36.6 Barcelona 21.1 Chicago 35.2 Chicago 34.5 Fukuoka 47.6
30 Brussels 35.8 Fukuoka 20.6 Mumbai 34.9 Milan 34.3 Buenos Aires 46.1
31 Osaka 35.3 Frankfurt 20.5 Copenhagen 34.7 Boston 34.0 Chicago 45.9
32 Fukuoka 33.9 Bangkok 20.1 Cairo 32.4 Washington, D.C. 33.1 Moscow 45.5
33 Taipei 33.7 Milan 19.9 Washington, D.C. 31.6 Toronto 32.9 Shanghai 44.9
34 Mumbai 33.0 Taipei 19.5 San Francisco 31.4 Mumbai 32.8 Taipei 42.0
35 Milan 33.0 Madrid 19.5 Jakarta 30.5 Vancouver 32.8 Mexico City 41.4
36 Barcelona 32.7 Kuala Lumpur 19.1 Sydney 29.2 Taipei 31.7 Sao Paulo 39.9
37 Madrid 32.5 Istanbul 18.4 Zurich 29.0 Copenhagen 31.5 Bangkok 37.2
38 Moscow 32.1 Sao Paulo 17.8 Boston 27.8 Cairo 31.0 Istanbul 37.0
39 Jakarta 31.8 Mexico City 17.2 Johannesburg 26.8 Fukuoka 30.4 Kuala Lumpur 36.2
40 Mexico City 29.6 Buenos Aires 15.9 Geneva 25.4 Stockholm 30.0 Dubai 35.3
41 Sao Paulo 27.9 Mumbai 14.3 Singapore 25.1 Jakarta 29.2 Mumbai 34.5
42 Johannesburg 26.3 Jakarta 11.9 Taipei 23.0 Zurich 28.1 Cairo 31.6
43 Buenos Aires 25.9 Cairo 10.3 Dubai 21.4 Johannesburg 26.2 Jakarta 30.9
44 Cairo 24.0 Johannesburg 8.6 Hong Kong 21.0 Geneva 25.8 Johannesburg 24.7
Global Power City Index 2017 Global Power City Index 201714 15
4. Actor-Specific Ranking
Actor-Specific Ranking
4-3 Actor-Specific Ranking Key Findings
◆ In Manager, London (No. 1), Singapore (No. 2), and New York (No. 3) are evaluated highly.
◆ London earns an extremely high score for “Richness of Human Resources,” while Singapore also returns a strong score for “Ease of Doing Business.”
◆ A higher score in “Potential of Business Growth” lifts New York to No. 3 from No. 8 last year, while Tokyo jumps up to No. 5 from No. 7 on a stronger score for “Political and Economic Risk, and Disaster Vulnerability.”
◆ Dubai, one of the new additions to GPCI-2017, is rated poorly in “Favorable Environment for Employees and Their Families,” but is still ranked at No. 6 in this actor group, comparable to Hong Kong and Singapore with high scores in “Ease of Doing Business.”
$
SingaporeSingaporeLondonLondon
New YorkNew York
123
Manager
◆ The top three ranked cities in Researcher are New York (No. 1), London (No. 2), and Tokyo (No. 3).
◆ As in most years, New York is rated highly in Researcher for “Accumulation of Research Institutions and Researchers” and “Qualities of Research Institutions, Researchers, and Directors.” As a result, it retains its No. 1 position for the tenth consecutive year.
◆ Of the other US cities in the GPCI-2017, Los Angeles (No. 4), San Francisco (No. 5), Boston (No. 7), and Chicago (No. 8), also rank highly as attractive urban centers for Researcher.
LondonLondonNew YorkNew York1
2
TokyoTokyo3
Researcher
◆ In Visitor, London (No. 1), New York (No. 2), and Paris (No. 3) head the list.◆ London is regarded highly by Visitor for its “Richness of Tourist Attractions” and “Mobility (Travel Time and Fares to Destinations).”◆ Bangkok (No. 6) and Singapore (No. 7) both move up the list from No. 12 and No.
11 last year. Their respective gains owe to sharp score improvements in “Cultural Attractiveness and Opportunities for Interaction” and “Public Safety.”
◆ Along with high ratings for “Dining (Variety of Cuisines, Prices, etc.)” and “Shopping (Environment, Prices, Attractiveness, etc.),” a stronger score for “Cultural Attractiveness and Opportunities for Interaction” bumps Tokyo up to No. 4 from No. 5 last year.
H
New YorkNew YorkLondonLondon1
23 ParisParis
Visitor
◆ In Resident, the top cities are dominated by those found in Europe, namely Paris (No. 1), London (No. 2), Zurich (No. 3), Frankfurt (No. 4), and Berlin (No. 5).
◆ The cities of Asia tend to be lower down the list but Tokyo boasts a high score for “Work Environment (Income and Employment Opportunities)” and thus trails the leading European cities at No. 6.
◆ Paris scores well in all factors, a sure sign that the city is viewed as an appealing place to live by Resident.
◆ London is the standout city in terms of “Leisure Activities,” while Zurich earns an exceptionally high score for “Quality of Medical Treatment.”
123
LondonLondonParisParis
ZurichZurich
Resident
4-2 Actor-Specific Ranking
◆ Paris (No. 1), Berlin (No. 2), and London (No. 3) are the top three ranked cities in Artist.
◆ Paris earns an overwhelmingly high score for “Cultural Stimulation” and maintains the No. 1 spot for the eighth consecutive year since GPCI-2010.
◆ Berlin satis�es many of the factors sought after by Artist and climbs to No. 2 from No. 4 last year thanks to a higher score for “Cultural Stimulation.”
◆ Meanwhile, New York, ranked No. 2 last year, slips three places down to No. 5 on a weaker score for “Accumulation of Art Markets.”
BerlinBerlin
$
ParisParis
LondonLondon
1
2
3
Artist
Rank Manager Researcher Artist Visitor Resident
1 London 62.0 New York 59.3 Paris 49.8 London 58.2 Paris 64.0
2 Singapore 54.8 London 55.6 Berlin 48.5 New York 51.4 London 61.5
3 New York 53.3 Tokyo 52.7 London 48.0 Paris 49.8 Zurich 58.4
4 Beijing 51.3 Los Angeles 46.5 Vienna 47.6 Tokyo 48.3 Frankfurt 56.9
5 Tokyo 50.0 San Francisco 43.9 New York 47.0 Istanbul 47.7 Berlin 55.9
6 Dubai 49.8 Paris 42.8 Tokyo 46.4 Bangkok 45.6 Tokyo 55.4
7 Shanghai 49.4 Boston 40.6 Barcelona 46.2 Singapore 45.2 Stockholm 55.0
8 Paris 48.8 Chicago 38.5 Beijing 44.5 Dubai 44.9 Vienna 54.8
9 Hong Kong 48.7 Singapore 38.1 Amsterdam 44.1 Barcelona 44.6 Amsterdam 54.7
10 Kuala Lumpur 46.7 Seoul 37.5 Toronto 43.1 Shanghai 44.6 New York 54.6
11 Sydney 46.7 Beijing 33.0 Los Angeles 42.1 Beijing 42.5 Geneva 52.3
12 Seoul 46.7 Sydney 32.5 Madrid 40.1 Berlin 41.8 Copenhagen 52.2
13 Istanbul 44.7 Berlin 32.3 Buenos Aires 40.0 Sydney 41.6 Boston 51.9
14 Amsterdam 43.7 Washington, D.C. 32.3 Vancouver 39.9 Madrid 40.7 Brussels 51.4
15 Stockholm 42.5 Hong Kong 31.2 Stockholm 39.5 Vienna 40.5 San Francisco 51.2
16 Berlin 42.3 Osaka 30.8 Sao Paulo 38.7 Hong Kong 40.2 Sydney 50.6
17 San Francisco 41.6 Amsterdam 28.4 Milan 38.4 Amsterdam 40.2 Singapore 50.6
18 Los Angeles 41.4 Toronto 26.7 Istanbul 38.3 Los Angeles 38.8 Hong Kong 50.3
19 Toronto 41.1 Zurich 25.7 Osaka 38.2 Kuala Lumpur 38.6 Beijing 50.3
20 Zurich 40.2 Geneva 25.5 Mexico City 38.2 San Francisco 38.4 Los Angeles 49.9
21 Frankfurt 40.2 Stockholm 25.4 Shanghai 37.9 Mexico City 38.3 Barcelona 49.6
22 Boston 39.6 Vienna 25.3 Kuala Lumpur 37.9 Buenos Aires 37.2 Madrid 49.4
23 Vancouver 39.5 Vancouver 25.2 Frankfurt 37.3 Sao Paulo 37.0 Toronto 49.4
24 Copenhagen 39.2 Brussels 24.9 Seoul 37.2 Seoul 37.0 Washington, D.C. 49.2
25 Chicago 38.8 Moscow 23.8 Moscow 36.8 Osaka 36.1 Milan 49.1
26 Bangkok 38.8 Copenhagen 23.2 Fukuoka 36.6 Brussels 36.1 Vancouver 48.8
27 Vienna 37.6 Dubai 23.0 Bangkok 36.6 Frankfurt 35.1 Seoul 48.6
28 Geneva 37.3 Shanghai 22.8 Brussels 36.5 Moscow 34.9 Osaka 48.3
29 Washington, D.C. 36.6 Barcelona 21.1 Chicago 35.2 Chicago 34.5 Fukuoka 47.6
30 Brussels 35.8 Fukuoka 20.6 Mumbai 34.9 Milan 34.3 Buenos Aires 46.1
31 Osaka 35.3 Frankfurt 20.5 Copenhagen 34.7 Boston 34.0 Chicago 45.9
32 Fukuoka 33.9 Bangkok 20.1 Cairo 32.4 Washington, D.C. 33.1 Moscow 45.5
33 Taipei 33.7 Milan 19.9 Washington, D.C. 31.6 Toronto 32.9 Shanghai 44.9
34 Mumbai 33.0 Taipei 19.5 San Francisco 31.4 Mumbai 32.8 Taipei 42.0
35 Milan 33.0 Madrid 19.5 Jakarta 30.5 Vancouver 32.8 Mexico City 41.4
36 Barcelona 32.7 Kuala Lumpur 19.1 Sydney 29.2 Taipei 31.7 Sao Paulo 39.9
37 Madrid 32.5 Istanbul 18.4 Zurich 29.0 Copenhagen 31.5 Bangkok 37.2
38 Moscow 32.1 Sao Paulo 17.8 Boston 27.8 Cairo 31.0 Istanbul 37.0
39 Jakarta 31.8 Mexico City 17.2 Johannesburg 26.8 Fukuoka 30.4 Kuala Lumpur 36.2
40 Mexico City 29.6 Buenos Aires 15.9 Geneva 25.4 Stockholm 30.0 Dubai 35.3
41 Sao Paulo 27.9 Mumbai 14.3 Singapore 25.1 Jakarta 29.2 Mumbai 34.5
42 Johannesburg 26.3 Jakarta 11.9 Taipei 23.0 Zurich 28.1 Cairo 31.6
43 Buenos Aires 25.9 Cairo 10.3 Dubai 21.4 Johannesburg 26.2 Jakarta 30.9
44 Cairo 24.0 Johannesburg 8.6 Hong Kong 21.0 Geneva 25.8 Johannesburg 24.7
Global Power City Index 2017 Global Power City Index 201714 15
4. Actor-Specific Ranking
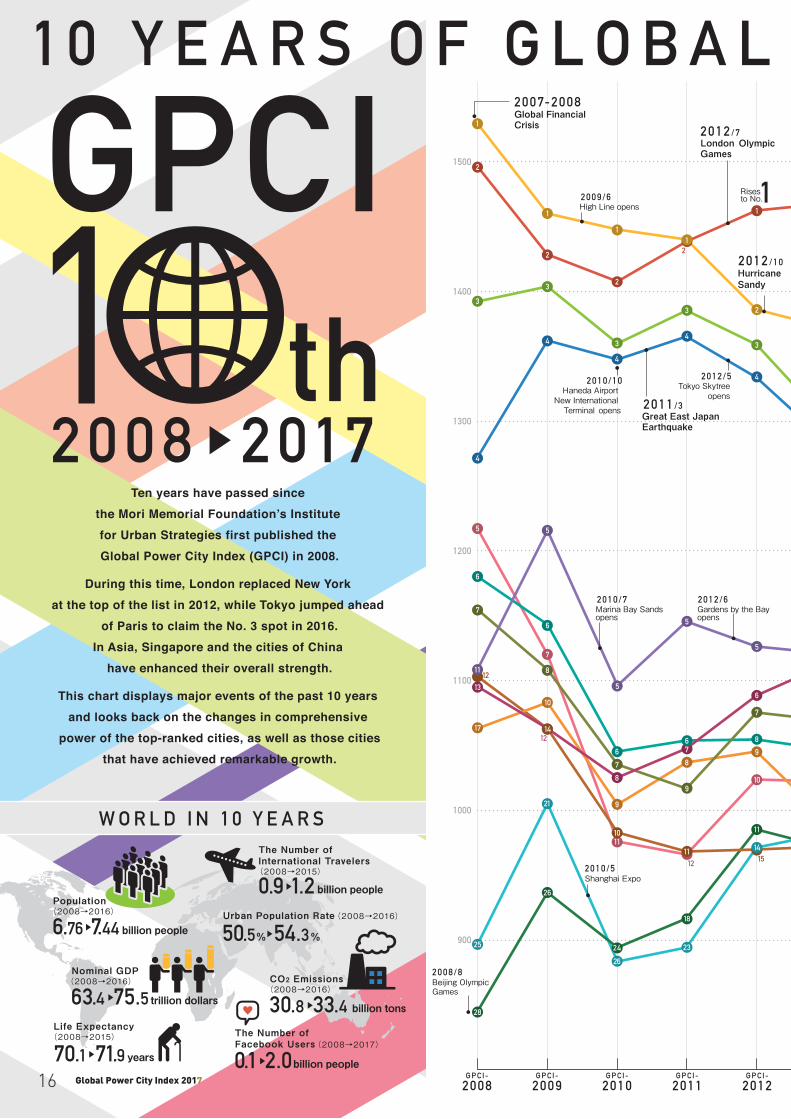
Global Power City Index 201716
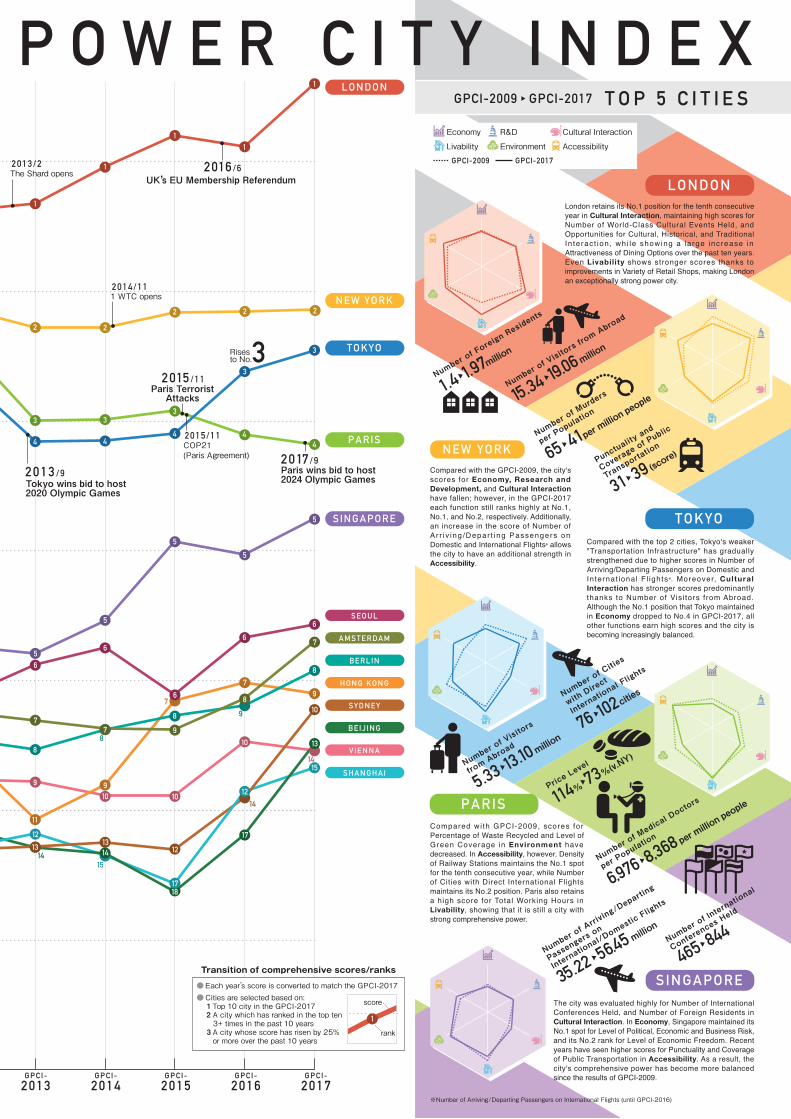
Global Power City Index 201716
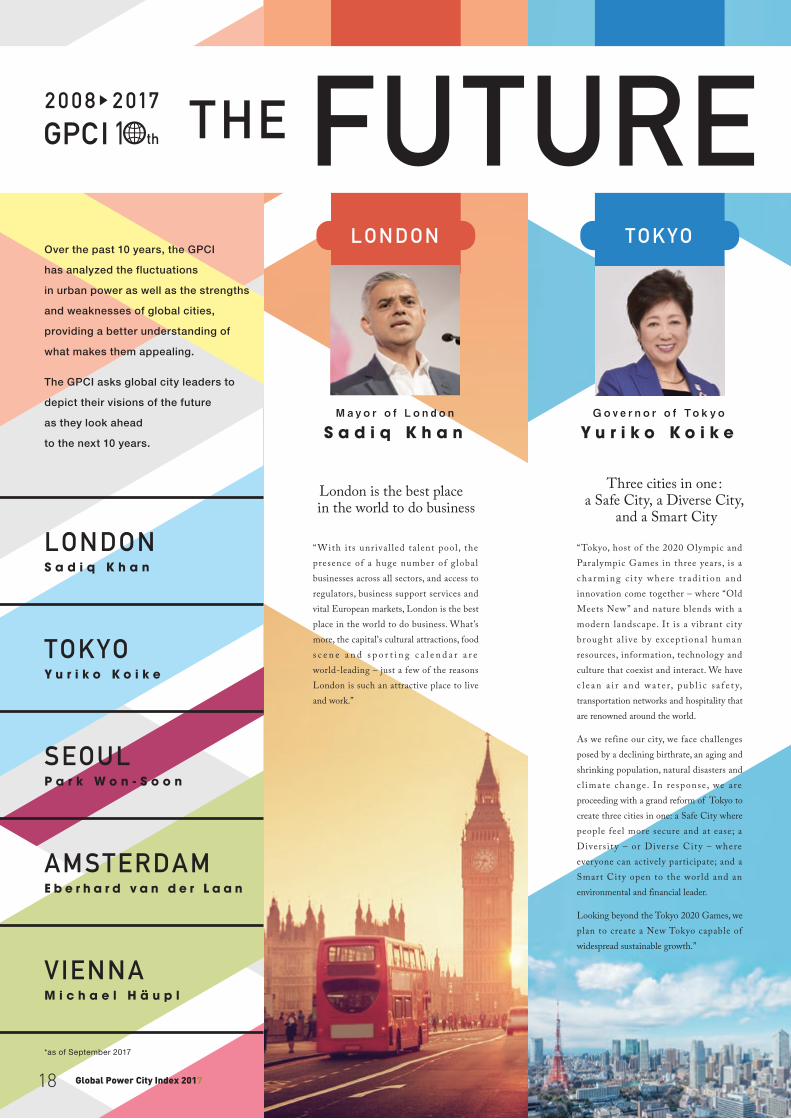
Global Power City Index 201718
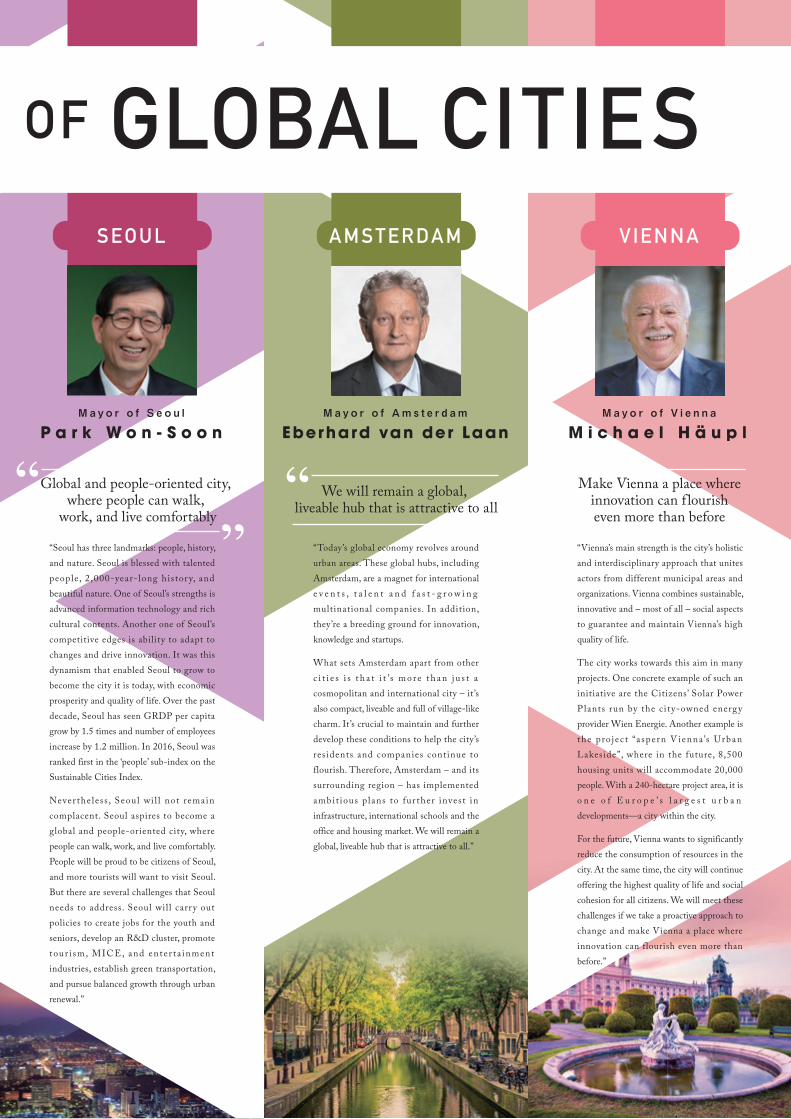
Global Power City Index 201718
October 2017
Edited and Published byInstitute for Urban Strategies,
The Mori Memorial FoundationNorio Yamato, Yuko Hamada, Mariko Matsuda, Peter Dustan, Noriko Taki
Translated by Alex YeomanDesigned and Produced by Nikkei Printing, Inc.
Special Feature Designed by Niimura Printing Co., Ltd.
Cover Photos © rcfotostock, Cla78, somchaij, Givaga, martinhosmat083 – FotoliaSources of Data for Special Feature The World Bank Group, data.worldbank.org BP p.l.c., tools.bp.com Statista Inc., statista.com
For more information on this [email protected]
Institute for Urban Strategies, The Mori Memorial FoundationToranomon 37 Mori Building, 5-1, Toranomon 3-chome,
Minato-ku, Tokyo 105-0001 JAPANTEL: +81-3-6406-6800
www.mori-m-foundation.or.jp/english/
© 2017 The Mori Memorial FoundationThis content is for general information purposes only.
Unauthorized reproduction of this document is forbidden.
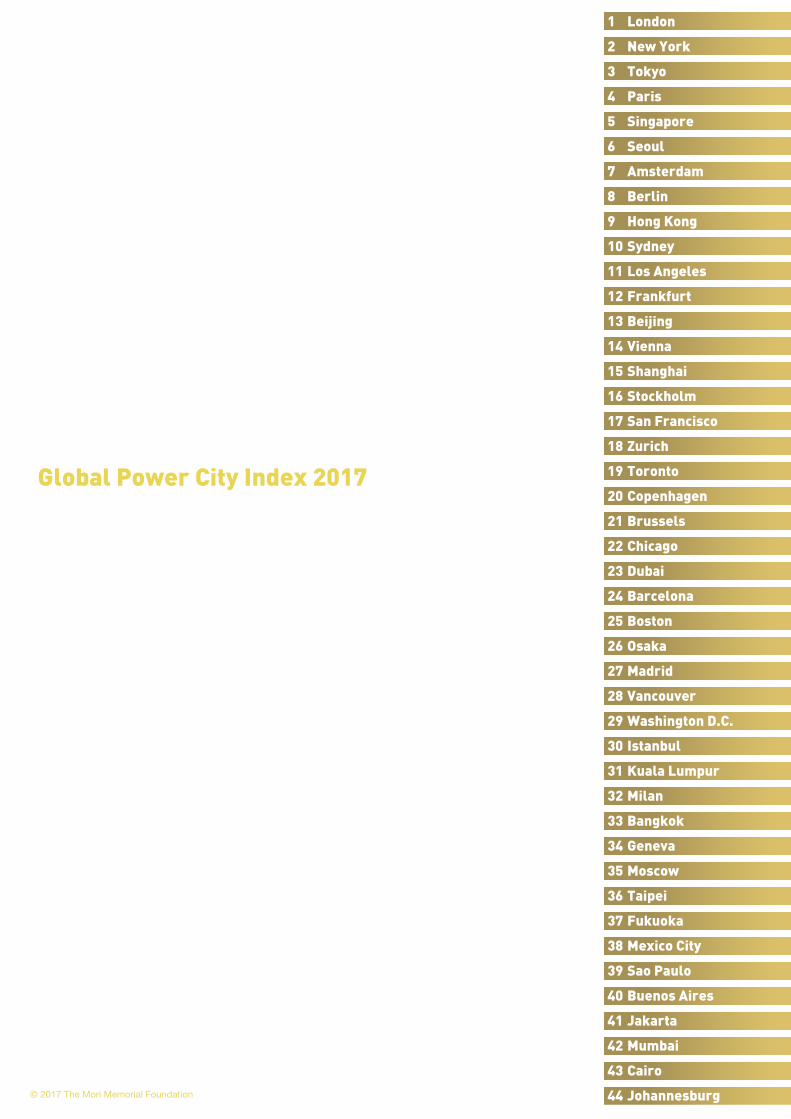
1 London
2 New York
3 Tokyo
4 Paris
5 Singapore
6 Seoul
7 Amsterdam
8 Berlin
9 Hong Kong
10 Sydney
11 Los Angeles
12 Frankfurt
13 Beijing
14 Vienna
15 Shanghai
16 Stockholm
17 San Francisco
18 Zurich
19 Toronto
20 Copenhagen
21 Brussels
22 Chicago
23 Dubai
24 Barcelona
25 Boston
26 Osaka
27 Madrid
28 Vancouver
29 Washington D.C.
30 Istanbul
31 Kuala Lumpur
32 Milan
33 Bangkok
34 Geneva
35 Moscow
36 Taipei
37 Fukuoka
38 Mexico City
39 Sao Paulo
40 Buenos Aires
41 Jakarta
42 Mumbai
43 Cairo
44 Johannesburg
2017
Global Power City Index 2017
© 2017 The Mori Memorial Foundation
GPCI 10th Anniversary Special Edition
124
53
London
Tokyo Singapore
Paris New York
Summary
October 2017
GlobalPower City Index 2017