Proposed a Smart Solutions Based -on Cloud Computing and ... · Proposed a Smart Solutions Based...
24
Proposed a Smart Solutions Based-on Cloud Computing and Wireless Sensing 1 Haider Rasheed Abdulshaheed, 2 Wahidah Binti Md Shah, 3 Siti Azirah Binti Asmai and 4 Isra Ibraheem Sadiq 1,2,3,4 Faculty of Information and Communication Technology, Universiti Teknikal Malaysia Melaka, HangTuah Jaya, 76100 Durian Tunggal, Melaka, Malaysia. Abstract this paper presents and discusses the performance results of both cloud service providers and sensor service provider’s integration process. The different security models, attacks and the efficacy of the proposed model are highlighted in previous chapter. It is not easy to evaluate the integration performance of cloud computing and wireless sensor network because it’s a different domain category. In this chapter, the proposed RIP- WSN-CC system satisfied the prearranged functions based on the trust and reputation estimation. Then, implementing the proposed system in the real time applications based on their security. Then, evaluate the individual performance of the RIP-WSN-CC system with accessing the relevant data in the network. Here, the proposed methods are tested by the suitable environment and compared with the existing integration techniques. The proposed system achieves better results when used high trust and reputation values which give less execution time, and high accuracy. Key Words:IoT, Cloud computing, wireless sensor. International Journal of Pure and Applied Mathematics Volume 119 No. 18 2018, 427-449 ISSN: 1314-3395 (on-line version) url: http://www.acadpubl.eu/hub/ Special Issue http://www.acadpubl.eu/hub/ 427
Transcript of Proposed a Smart Solutions Based -on Cloud Computing and ... · Proposed a Smart Solutions Based...
Proposed a Smart Solutions Based-on Cloud
Computing and Wireless Sensing 1Haider Rasheed Abdulshaheed,
2Wahidah Binti Md Shah,
3Siti Azirah Binti
Asmai and 4Isra Ibraheem Sadiq
1,2,3,4Faculty of Information and Communication Technology,
Universiti Teknikal Malaysia Melaka, HangTuah Jaya,
76100 Durian Tunggal, Melaka, Malaysia.
Abstract
this paper presents and discusses the performance results of both cloud
service providers and sensor service provider’s integration process. The
different security models, attacks and the efficacy of the proposed model
are highlighted in previous chapter. It is not easy to evaluate the
integration performance of cloud computing and wireless sensor network
because it’s a different domain category. In this chapter, the proposed RIP-
WSN-CC system satisfied the prearranged functions based on the trust and
reputation estimation. Then, implementing the proposed system in the real
time applications based on their security. Then, evaluate the individual
performance of the RIP-WSN-CC system with accessing the relevant data
in the network. Here, the proposed methods are tested by the suitable
environment and compared with the existing integration techniques. The
proposed system achieves better results when used high trust and
reputation values which give less execution time, and high accuracy.
Key Words:IoT, Cloud computing, wireless sensor.
International Journal of Pure and Applied MathematicsVolume 119 No. 18 2018, 427-449ISSN: 1314-3395 (on-line version)url: http://www.acadpubl.eu/hub/Special Issue http://www.acadpubl.eu/hub/
427
1. Introduction
Giving the most reliable, available, secure cloud and wireless sensing services
that achieve the end-user requirements and preferences is the most important
aspects in integrating both CC-WSN infrastructures. Even though many studies
in the literature addressed most of these aspects but still many works need to be
done to optimize the integration solution to reach to the level of answering end-
users enquires from most trusted sensors network providers that is connected
with the most reliable cloud service providers. This most trusted and reliable
integration is becoming more important recently in developing smart IoT
solutions. The planning of such design of integration solution involves on
complex mathematical modeling and equations that are defining the different
services with their associated parameters values according to the end-user
preferences of payment and the quality of the services. Also, the connection
between these different services of wireless sensing and cloud data storage.The
proposed integration platform in this research work is developed as
mathematical modeling and implemented in cloud-environment of the JAVA
and SQL/HTTP Servers (as Servers Services obtained from WAMP Server
platform). The certain tourism online sql database answer the end-user enquires
by giving the required information for certain places of tourism attractions taken
from big data of stored Indian places. These implementations showed how to
switch and connect to most trusted services providers based on their historical
reputation values. The analysis is extended to cover small entities of services’
providers and services’ users as well as the large entities. This analysis showed
the enhancements of the proposed integrated platform solution in many aspects
in comparison with other near-fields accessed controlled methods in the
literature.
2. Limitations of Existing Solutions
In existing work, cloud computing wireless sensor network (CC-WSN)
integration with the CSU does not recover the desirable service from CSP. But
satisfied the service obtained from SNP. The authenticating CSPs and SNPs and
the calculation value of trust, reputation of CSPs, SNPs are the two main critical
and scarcely explored issues (Savas, et al. 2013). The following points reveal
that the major problem arising in the existing works. Hence, required the
proposed system for solving the issues as less authentication security, CSU can
select the CSP with no trust and reputation, CSP can select the SNP with low
trust and reputation, produced low accuracy, high execution time,
eavesdropping, impersonation, limited resource and spoofing
3. Performance Metrics
The performance metrics used for analyzing the CC-WSN integration work are
like accessible resources, truth evaluation; turn around efficiency, reliability,
availability, data integrity, reputation value, effective recommendation rate,
International Journal of Pure and Applied Mathematics Special Issue
428
malicious node detection rate and malicious node isolation rate
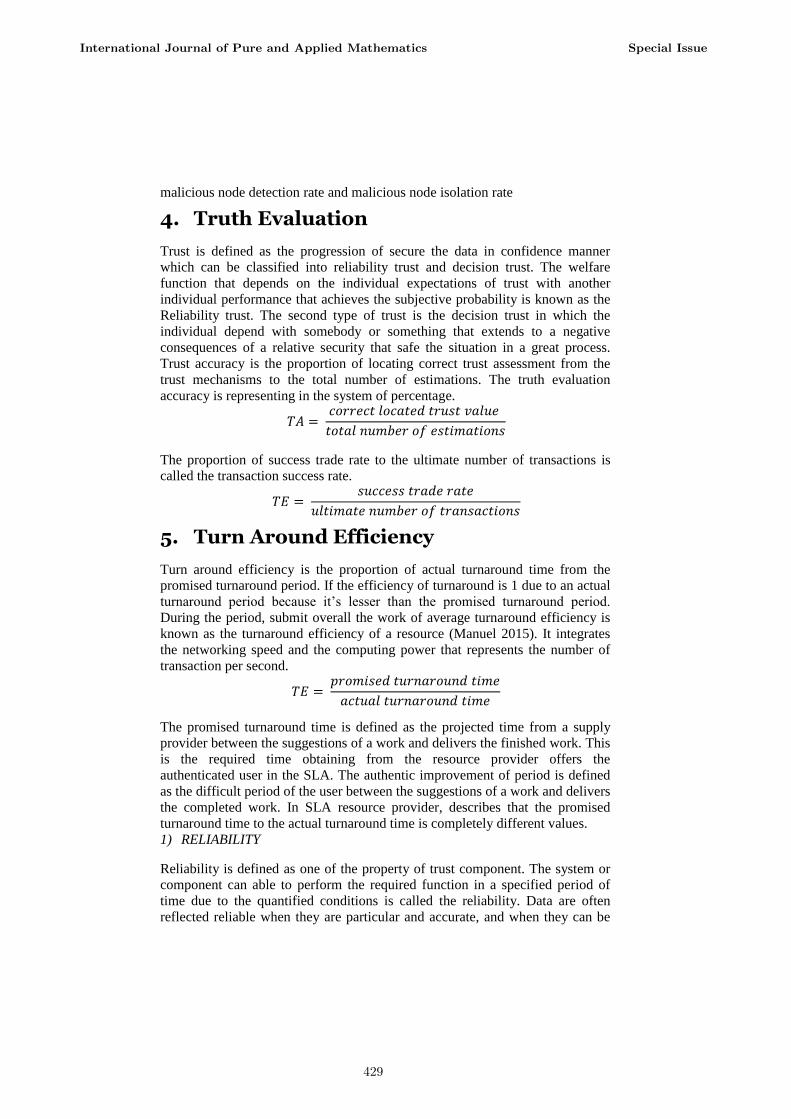
4. Truth Evaluation
Trust is defined as the progression of secure the data in confidence manner
which can be classified into reliability trust and decision trust. The welfare
function that depends on the individual expectations of trust with another
individual performance that achieves the subjective probability is known as the
Reliability trust. The second type of trust is the decision trust in which the
individual depend with somebody or something that extends to a negative
consequences of a relative security that safe the situation in a great process.
Trust accuracy is the proportion of locating correct trust assessment from the
trust mechanisms to the total number of estimations. The truth evaluation
accuracy is representing in the system of percentage.
𝑇𝐴 = 𝑐𝑜𝑟𝑟𝑒𝑐𝑡 𝑙𝑜𝑐𝑎𝑡𝑒𝑑 𝑡𝑟𝑢𝑠𝑡 𝑣𝑎𝑙𝑢𝑒
𝑡𝑜𝑡𝑎𝑙 𝑛𝑢𝑚𝑏𝑒𝑟 𝑜𝑓 𝑒𝑠𝑡𝑖𝑚𝑎𝑡𝑖𝑜𝑛𝑠
The proportion of success trade rate to the ultimate number of transactions is
called the transaction success rate.
𝑇𝐸 = 𝑠𝑢𝑐𝑐𝑒𝑠𝑠 𝑡𝑟𝑎𝑑𝑒 𝑟𝑎𝑡𝑒
𝑢𝑙𝑡𝑖𝑚𝑎𝑡𝑒 𝑛𝑢𝑚𝑏𝑒𝑟 𝑜𝑓 𝑡𝑟𝑎𝑛𝑠𝑎𝑐𝑡𝑖𝑜𝑛𝑠
5. Turn Around Efficiency
Turn around efficiency is the proportion of actual turnaround time from the
promised turnaround period. If the efficiency of turnaround is 1 due to an actual
turnaround period because it’s lesser than the promised turnaround period.
During the period, submit overall the work of average turnaround efficiency is
known as the turnaround efficiency of a resource (Manuel 2015). It integrates
the networking speed and the computing power that represents the number of
transaction per second.
𝑇𝐸 = 𝑝𝑟𝑜𝑚𝑖𝑠𝑒𝑑 𝑡𝑢𝑟𝑛𝑎𝑟𝑜𝑢𝑛𝑑 𝑡𝑖𝑚𝑒
𝑎𝑐𝑡𝑢𝑎𝑙 𝑡𝑢𝑟𝑛𝑎𝑟𝑜𝑢𝑛𝑑 𝑡𝑖𝑚𝑒
The promised turnaround time is defined as the projected time from a supply
provider between the suggestions of a work and delivers the finished work. This
is the required time obtaining from the resource provider offers the
authenticated user in the SLA. The authentic improvement of period is defined
as the difficult period of the user between the suggestions of a work and delivers
the completed work. In SLA resource provider, describes that the promised
turnaround time to the actual turnaround time is completely different values.
1) RELIABILITY
Reliability is defined as one of the property of trust component. The system or
component can able to perform the required function in a specified period of
time due to the quantified conditions is called the reliability. Data are often
reflected reliable when they are particular and accurate, and when they can be
International Journal of Pure and Applied Mathematics Special Issue
429
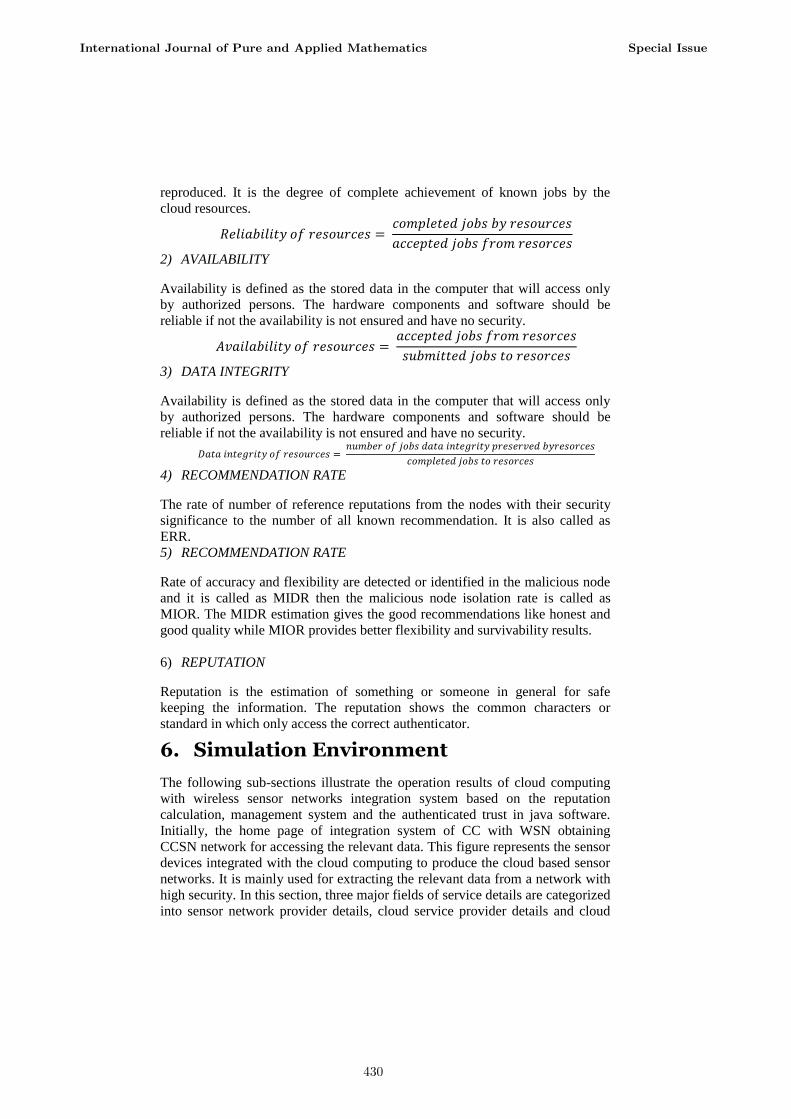
reproduced. It is the degree of complete achievement of known jobs by the
cloud resources.
𝑅𝑒𝑙𝑖𝑎𝑏𝑖𝑙𝑖𝑡𝑦 𝑜𝑓 𝑟𝑒𝑠𝑜𝑢𝑟𝑐𝑒𝑠 = 𝑐𝑜𝑚𝑝𝑙𝑒𝑡𝑒𝑑 𝑗𝑜𝑏𝑠 𝑏𝑦 𝑟𝑒𝑠𝑜𝑢𝑟𝑐𝑒𝑠
𝑎𝑐𝑐𝑒𝑝𝑡𝑒𝑑 𝑗𝑜𝑏𝑠 𝑓𝑟𝑜𝑚 𝑟𝑒𝑠𝑜𝑟𝑐𝑒𝑠
2) AVAILABILITY
Availability is defined as the stored data in the computer that will access only
by authorized persons. The hardware components and software should be
reliable if not the availability is not ensured and have no security.
𝐴𝑣𝑎𝑖𝑙𝑎𝑏𝑖𝑙𝑖𝑡𝑦 𝑜𝑓 𝑟𝑒𝑠𝑜𝑢𝑟𝑐𝑒𝑠 = 𝑎𝑐𝑐𝑒𝑝𝑡𝑒𝑑 𝑗𝑜𝑏𝑠 𝑓𝑟𝑜𝑚 𝑟𝑒𝑠𝑜𝑟𝑐𝑒𝑠
𝑠𝑢𝑏𝑚𝑖𝑡𝑡𝑒𝑑 𝑗𝑜𝑏𝑠 𝑡𝑜 𝑟𝑒𝑠𝑜𝑟𝑐𝑒𝑠
3) DATA INTEGRITY
Availability is defined as the stored data in the computer that will access only
by authorized persons. The hardware components and software should be
reliable if not the availability is not ensured and have no security.
𝐷𝑎𝑡𝑎 𝑖𝑛𝑡𝑒𝑔𝑟𝑖𝑡𝑦 𝑜𝑓 𝑟𝑒𝑠𝑜𝑢𝑟𝑐𝑒𝑠 = 𝑛𝑢𝑚𝑏𝑒𝑟 𝑜𝑓 𝑗𝑜𝑏𝑠 𝑑𝑎𝑡𝑎 𝑖𝑛𝑡𝑒𝑔𝑟𝑖𝑡𝑦 𝑝𝑟𝑒𝑠𝑒𝑟𝑣𝑒𝑑 𝑏𝑦𝑟𝑒𝑠𝑜𝑟𝑐𝑒𝑠
𝑐𝑜𝑚𝑝𝑙𝑒𝑡𝑒𝑑 𝑗𝑜𝑏𝑠 𝑡𝑜 𝑟𝑒𝑠𝑜𝑟𝑐𝑒𝑠
4) RECOMMENDATION RATE
The rate of number of reference reputations from the nodes with their security
significance to the number of all known recommendation. It is also called as
ERR.
5) RECOMMENDATION RATE
Rate of accuracy and flexibility are detected or identified in the malicious node
and it is called as MIDR then the malicious node isolation rate is called as
MIOR. The MIDR estimation gives the good recommendations like honest and
good quality while MIOR provides better flexibility and survivability results.
6) REPUTATION
Reputation is the estimation of something or someone in general for safe
keeping the information. The reputation shows the common characters or
standard in which only access the correct authenticator.
6. Simulation Environment
The following sub-sections illustrate the operation results of cloud computing
with wireless sensor networks integration system based on the reputation
calculation, management system and the authenticated trust in java software.
Initially, the home page of integration system of CC with WSN obtaining
CCSN network for accessing the relevant data. This figure represents the sensor
devices integrated with the cloud computing to produce the cloud based sensor
networks. It is mainly used for extracting the relevant data from a network with
high security. In this section, three major fields of service details are categorized
into sensor network provider details, cloud service provider details and cloud
International Journal of Pure and Applied Mathematics Special Issue
430
service user details fields. And also insert new button for each service providers.
It can used to insert the new data from the networks that can added more
numbers of data.
7. Exploration of Rip-WSN-CC Performance
The presentation analysis of the projected RIP-WSN-CC method is evaluated by
using JAVA language. The following sections show the projected method is
appraised with respect to corresponding functions. Accordingly, the third
proposed function evaluation based on the two case studies. It is recycled to
evaluate the usefulness of the projected RIP-WSN-CC method.
Analysis of the Scenario of Small Quantities of CSPs, SNPs, CSUs and SNUs
In this analysis, using small quantities of cloud and sensor network (users and
providers). In this review, taken for consideration such as 3 cloud users, 4 cloud
providers and 5 sensor providers are all involved. Cloud user strainer the cloud
providers which are never qualified based on the trust, reputation and
management calculation in between the CSU & CSPs and CSPs & SNPs.
According to their assumption, filter the attributes such as one CSP and two
SNPs and does not gratify the necessities. After assigned that three number of
cloud users, three cloud providers and the three sensor providers are used for
analyzing. Therefore, the users attribute requirements are satisfied by the cloud
provider characteristics and the cloud provider needs are satisfied by the sensor
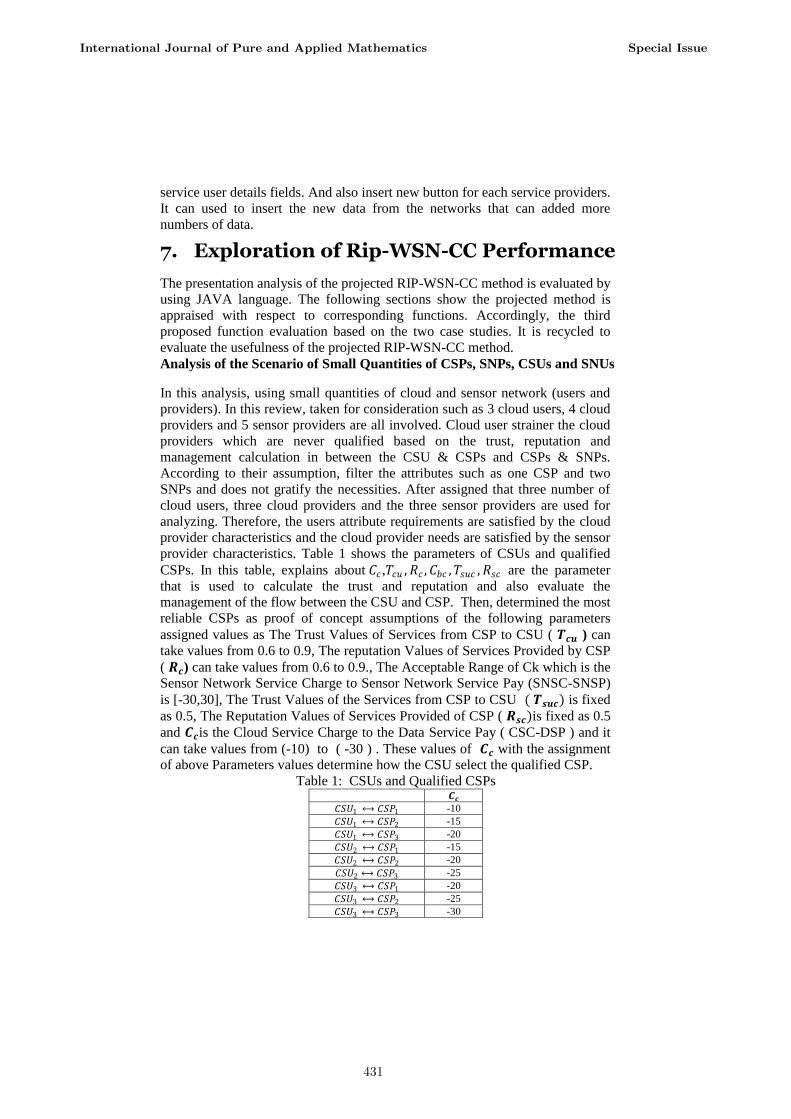
provider characteristics. Table 1 shows the parameters of CSUs and qualified
CSPs. In this table, explains about 𝐶𝑐 ,𝑇𝑐𝑢 ,𝑅𝑐 ,𝐶𝑏𝑐 ,𝑇𝑠𝑢𝑐 ,𝑅𝑠𝑐 are the parameter
that is used to calculate the trust and reputation and also evaluate the
management of the flow between the CSU and CSP. Then, determined the most
reliable CSPs as proof of concept assumptions of the following parameters
assigned values as The Trust Values of Services from CSP to CSU ( 𝑻𝒄𝒖 ) can
take values from 0.6 to 0.9, The reputation Values of Services Provided by CSP
( 𝑹𝒄) can take values from 0.6 to 0.9., The Acceptable Range of Ck which is the
Sensor Network Service Charge to Sensor Network Service Pay (SNSC-SNSP)
is [-30,30], The Trust Values of the Services from CSP to CSU ( 𝑻𝒔𝒖𝒄) is fixed
as 0.5, The Reputation Values of Services Provided of CSP ( 𝑹𝒔𝒄)is fixed as 0.5
and 𝑪𝒄is the Cloud Service Charge to the Data Service Pay ( CSC-DSP ) and it
can take values from (-10) to ( -30 ) . These values of 𝑪𝒄 with the assignment
of above Parameters values determine how the CSU select the qualified CSP.
Table 1: CSUs and Qualified CSPs 𝑪𝒄
𝐶𝑆𝑈1 ⟷ 𝐶𝑆𝑃1 -10
𝐶𝑆𝑈1 ⟷ 𝐶𝑆𝑃2 -15
𝐶𝑆𝑈1 ⟷ 𝐶𝑆𝑃3 -20
𝐶𝑆𝑈2 ⟷ 𝐶𝑆𝑃1 -15
𝐶𝑆𝑈2 ⟷ 𝐶𝑆𝑃2 -20
𝐶𝑆𝑈2 ⟷ 𝐶𝑆𝑃3 -25
𝐶𝑆𝑈3 ⟷ 𝐶𝑆𝑃1 -20
𝐶𝑆𝑈3 ⟷ 𝐶𝑆𝑃2 -25
𝐶𝑆𝑈3 ⟷ 𝐶𝑆𝑃3 -30
International Journal of Pure and Applied Mathematics Special Issue
431
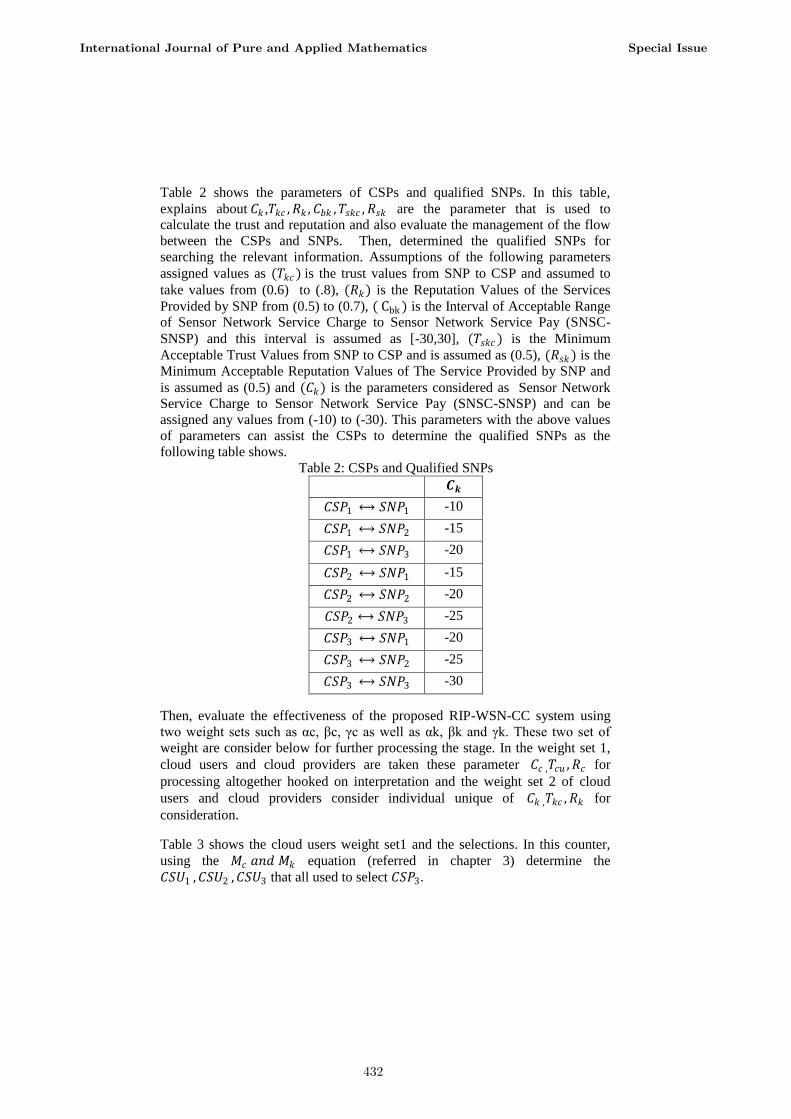
Table 2 shows the parameters of CSPs and qualified SNPs. In this table,
explains about 𝐶𝑘 ,𝑇𝑘𝑐 ,𝑅𝑘 ,𝐶𝑏𝑘 ,𝑇𝑠𝑘𝑐 ,𝑅𝑠𝑘 are the parameter that is used to
calculate the trust and reputation and also evaluate the management of the flow
between the CSPs and SNPs. Then, determined the qualified SNPs for
searching the relevant information. Assumptions of the following parameters
assigned values as (𝑇𝑘𝑐 ) is the trust values from SNP to CSP and assumed to
take values from (0.6) to (.8), (𝑅𝑘) is the Reputation Values of the Services
Provided by SNP from (0.5) to (0.7), ( Cbk ) is the Interval of Acceptable Range
of Sensor Network Service Charge to Sensor Network Service Pay (SNSC-
SNSP) and this interval is assumed as [-30,30], (𝑇𝑠𝑘𝑐 ) is the Minimum
Acceptable Trust Values from SNP to CSP and is assumed as (0.5), (𝑅𝑠𝑘) is the
Minimum Acceptable Reputation Values of The Service Provided by SNP and
is assumed as (0.5) and (𝐶𝑘) is the parameters considered as Sensor Network
Service Charge to Sensor Network Service Pay (SNSC-SNSP) and can be
assigned any values from (-10) to (-30). This parameters with the above values
of parameters can assist the CSPs to determine the qualified SNPs as the
following table shows.
Table 2: CSPs and Qualified SNPs
𝑪𝒌
𝐶𝑆𝑃1 ⟷ 𝑆𝑁𝑃1 -10
𝐶𝑆𝑃1 ⟷ 𝑆𝑁𝑃2 -15
𝐶𝑆𝑃1 ⟷ 𝑆𝑁𝑃3 -20
𝐶𝑆𝑃2 ⟷ 𝑆𝑁𝑃1 -15
𝐶𝑆𝑃2 ⟷ 𝑆𝑁𝑃2 -20
𝐶𝑆𝑃2 ⟷ 𝑆𝑁𝑃3 -25
𝐶𝑆𝑃3 ⟷ 𝑆𝑁𝑃1 -20
𝐶𝑆𝑃3 ⟷ 𝑆𝑁𝑃2 -25
𝐶𝑆𝑃3 ⟷ 𝑆𝑁𝑃3 -30
Then, evaluate the effectiveness of the proposed RIP-WSN-CC system using
two weight sets such as αc, βc, γc as well as αk, βk and γk. These two set of
weight are consider below for further processing the stage. In the weight set 1,
cloud users and cloud providers are taken these parameter 𝐶𝑐 ,𝑇𝑐𝑢 ,𝑅𝑐 for
processing altogether hooked on interpretation and the weight set 2 of cloud
users and cloud providers consider individual unique of 𝐶𝑘 ,𝑇𝑘𝑐 ,𝑅𝑘 for
consideration.
Table 3 shows the cloud users weight set1 and the selections. In this counter,
using the 𝑀𝑐 𝑎𝑛𝑑 𝑀𝑘 equation (referred in chapter 3) determine the
𝐶𝑆𝑈1 ,𝐶𝑆𝑈2 ,𝐶𝑆𝑈3 that all used to select 𝐶𝑆𝑃3.
International Journal of Pure and Applied Mathematics Special Issue
432
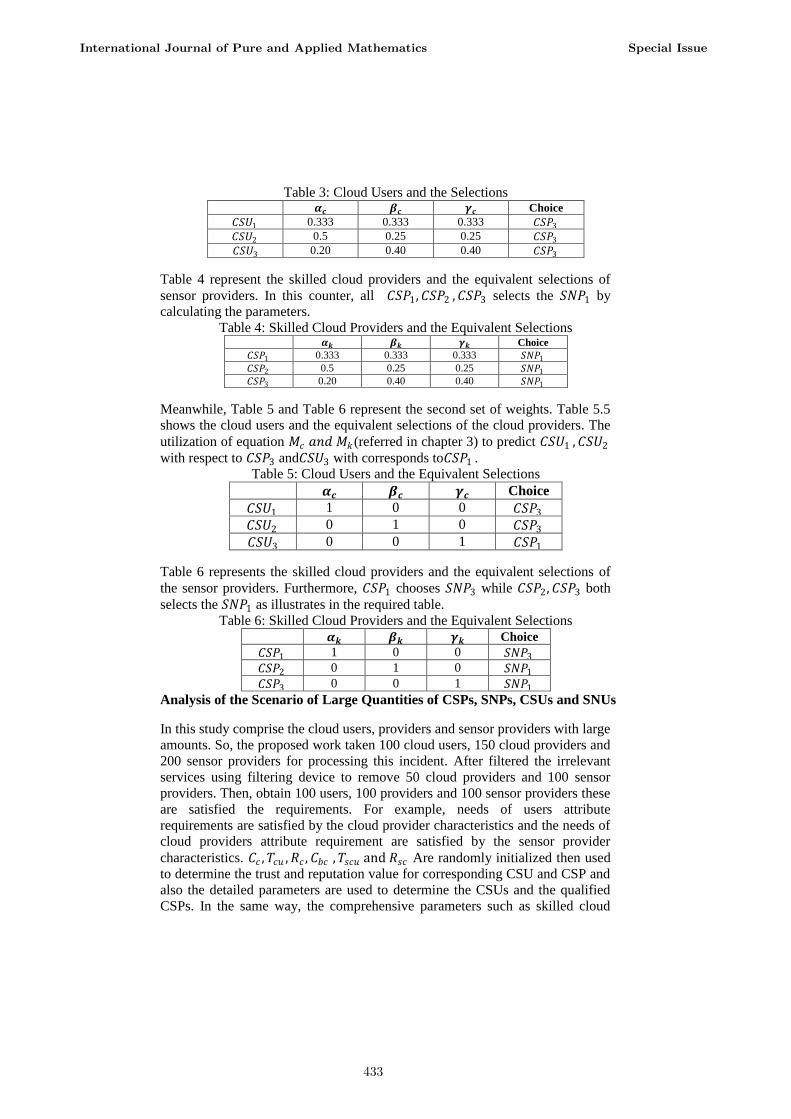
Table 3: Cloud Users and the Selections 𝜶𝒄 𝜷𝒄 𝜸𝒄 Choice
𝐶𝑆𝑈1 0.333 0.333 0.333 𝐶𝑆𝑃3
𝐶𝑆𝑈2 0.5 0.25 0.25 𝐶𝑆𝑃3
𝐶𝑆𝑈3 0.20 0.40 0.40 𝐶𝑆𝑃3
Table 4 represent the skilled cloud providers and the equivalent selections of
sensor providers. In this counter, all 𝐶𝑆𝑃1,𝐶𝑆𝑃2 ,𝐶𝑆𝑃3 selects the 𝑆𝑁𝑃1 by
calculating the parameters.
Table 4: Skilled Cloud Providers and the Equivalent Selections 𝜶𝒌 𝜷𝒌 𝜸𝒌 Choice
𝐶𝑆𝑃1 0.333 0.333 0.333 𝑆𝑁𝑃1
𝐶𝑆𝑃2 0.5 0.25 0.25 𝑆𝑁𝑃1
𝐶𝑆𝑃3 0.20 0.40 0.40 𝑆𝑁𝑃1
Meanwhile, Table 5 and Table 6 represent the second set of weights. Table 5.5
shows the cloud users and the equivalent selections of the cloud providers. The
utilization of equation 𝑀𝑐 𝑎𝑛𝑑 𝑀𝑘(referred in chapter 3) to predict 𝐶𝑆𝑈1 ,𝐶𝑆𝑈2
with respect to 𝐶𝑆𝑃3 and𝐶𝑆𝑈3 with corresponds to𝐶𝑆𝑃1 .
Table 5: Cloud Users and the Equivalent Selections
𝜶𝒄 𝜷𝒄 𝜸𝒄 Choice
𝐶𝑆𝑈1 1 0 0 𝐶𝑆𝑃3
𝐶𝑆𝑈2 0 1 0 𝐶𝑆𝑃3
𝐶𝑆𝑈3 0 0 1 𝐶𝑆𝑃1
Table 6 represents the skilled cloud providers and the equivalent selections of
the sensor providers. Furthermore, 𝐶𝑆𝑃1 chooses 𝑆𝑁𝑃3 while 𝐶𝑆𝑃2,𝐶𝑆𝑃3 both
selects the 𝑆𝑁𝑃1 as illustrates in the required table.
Table 6: Skilled Cloud Providers and the Equivalent Selections
𝜶𝒌 𝜷𝒌 𝜸𝒌 Choice
𝐶𝑆𝑃1 1 0 0 𝑆𝑁𝑃3
𝐶𝑆𝑃2 0 1 0 𝑆𝑁𝑃1
𝐶𝑆𝑃3 0 0 1 𝑆𝑁𝑃1
Analysis of the Scenario of Large Quantities of CSPs, SNPs, CSUs and SNUs
In this study comprise the cloud users, providers and sensor providers with large
amounts. So, the proposed work taken 100 cloud users, 150 cloud providers and
200 sensor providers for processing this incident. After filtered the irrelevant
services using filtering device to remove 50 cloud providers and 100 sensor
providers. Then, obtain 100 users, 100 providers and 100 sensor providers these
are satisfied the requirements. For example, needs of users attribute
requirements are satisfied by the cloud provider characteristics and the needs of
cloud providers attribute requirement are satisfied by the sensor provider
characteristics. 𝐶𝑐 ,𝑇𝑐𝑢 ,𝑅𝑐 ,𝐶𝑏𝑐 ,𝑇𝑠𝑐𝑢 and 𝑅𝑠𝑐 Are randomly initialized then used
to determine the trust and reputation value for corresponding CSU and CSP and
also the detailed parameters are used to determine the CSUs and the qualified
CSPs. In the same way, the comprehensive parameters such as skilled cloud
International Journal of Pure and Applied Mathematics Special Issue
433
providers and sensor providers are arbitrarily modified and they will be used
from the trust and reputation calculation between CSP and SNP (referred
chapter 3) about𝐶𝑘 ,𝑇𝑘𝑐 ,𝑅𝑘 ,𝐶𝑏𝑘 ,𝑇𝑠𝑘𝑐 and 𝑅𝑠𝑘 . Finally, validate the effectiveness
by initializing 100 varied weight sets like αc, βc, γc as well as αk, βk and γk.
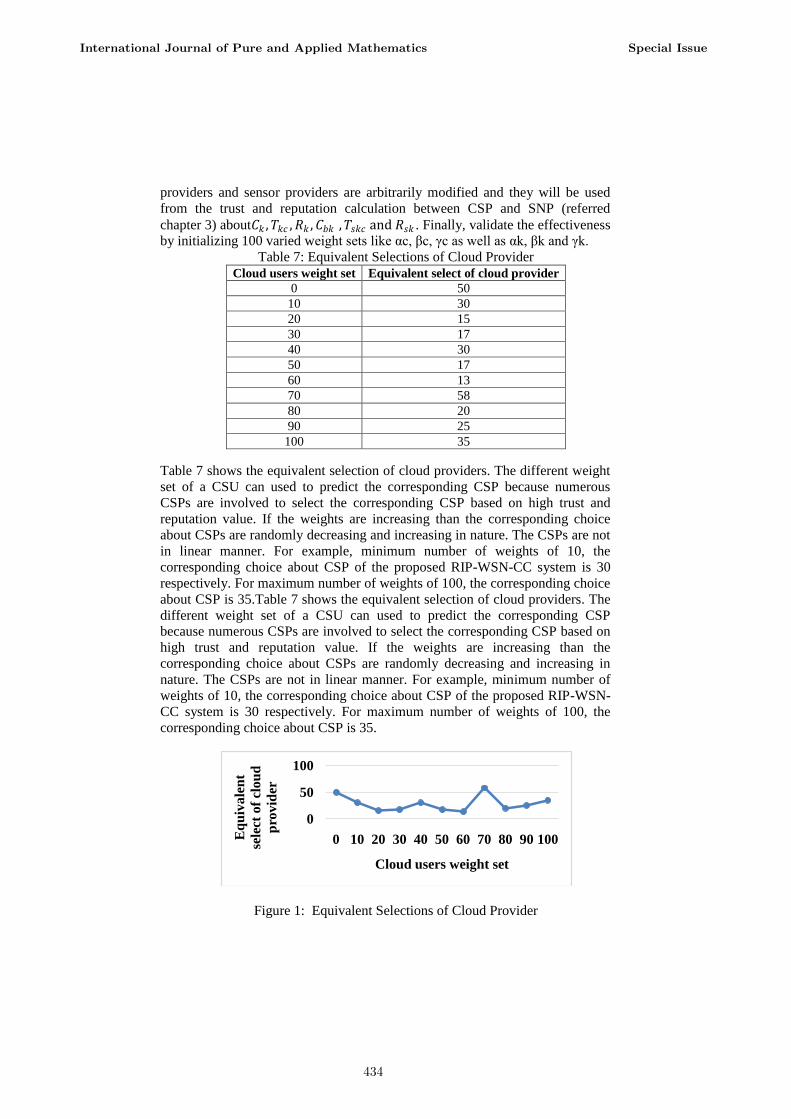
Table 7: Equivalent Selections of Cloud Provider
Cloud users weight set Equivalent select of cloud provider
0 50
10 30
20 15
30 17
40 30
50 17
60 13
70 58
80 20
90 25
100 35
Table 7 shows the equivalent selection of cloud providers. The different weight
set of a CSU can used to predict the corresponding CSP because numerous
CSPs are involved to select the corresponding CSP based on high trust and
reputation value. If the weights are increasing than the corresponding choice
about CSPs are randomly decreasing and increasing in nature. The CSPs are not
in linear manner. For example, minimum number of weights of 10, the
corresponding choice about CSP of the proposed RIP-WSN-CC system is 30
respectively. For maximum number of weights of 100, the corresponding choice
about CSP is 35.Table 7 shows the equivalent selection of cloud providers. The
different weight set of a CSU can used to predict the corresponding CSP
because numerous CSPs are involved to select the corresponding CSP based on
high trust and reputation value. If the weights are increasing than the
corresponding choice about CSPs are randomly decreasing and increasing in
nature. The CSPs are not in linear manner. For example, minimum number of
weights of 10, the corresponding choice about CSP of the proposed RIP-WSN-
CC system is 30 respectively. For maximum number of weights of 100, the
corresponding choice about CSP is 35.
Figure 1: Equivalent Selections of Cloud Provider
0
50
100
0 10 20 30 40 50 60 70 80 90 100Eq
uiv
ale
nt
sele
ct o
f cl
ou
d
pro
vid
er
Cloud users weight set
International Journal of Pure and Applied Mathematics Special Issue
434
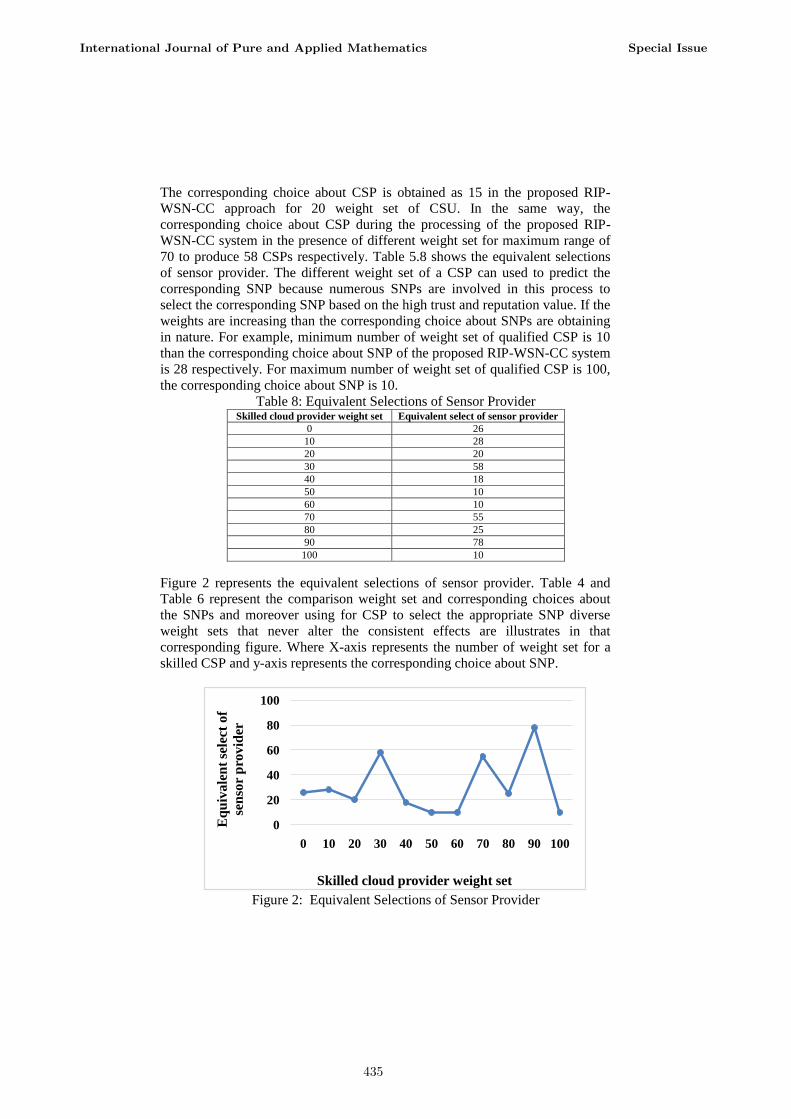
The corresponding choice about CSP is obtained as 15 in the proposed RIP-
WSN-CC approach for 20 weight set of CSU. In the same way, the
corresponding choice about CSP during the processing of the proposed RIP-
WSN-CC system in the presence of different weight set for maximum range of
70 to produce 58 CSPs respectively. Table 5.8 shows the equivalent selections
of sensor provider. The different weight set of a CSP can used to predict the
corresponding SNP because numerous SNPs are involved in this process to
select the corresponding SNP based on the high trust and reputation value. If the
weights are increasing than the corresponding choice about SNPs are obtaining
in nature. For example, minimum number of weight set of qualified CSP is 10
than the corresponding choice about SNP of the proposed RIP-WSN-CC system
is 28 respectively. For maximum number of weight set of qualified CSP is 100,
the corresponding choice about SNP is 10.
Table 8: Equivalent Selections of Sensor Provider Skilled cloud provider weight set Equivalent select of sensor provider
0 26
10 28
20 20
30 58
40 18
50 10
60 10
70 55
80 25
90 78
100 10
Figure 2 represents the equivalent selections of sensor provider. Table 4 and
Table 6 represent the comparison weight set and corresponding choices about
the SNPs and moreover using for CSP to select the appropriate SNP diverse
weight sets that never alter the consistent effects are illustrates in that
corresponding figure. Where X-axis represents the number of weight set for a
skilled CSP and y-axis represents the corresponding choice about SNP.
Figure 2: Equivalent Selections of Sensor Provider
0
20
40
60
80
100
0 10 20 30 40 50 60 70 80 90 100
Eq
uiv
ale
nt
sele
ct o
f
sen
sor
pro
vid
er
Skilled cloud provider weight set
International Journal of Pure and Applied Mathematics Special Issue
435
The corresponding choice about SNP is 78 in the proposed RIP-WSN-CC
approach for 90 weight set of a qualified CSP. In the same way, the
corresponding choice about SNP during processing the proposed RIP-WSN-CC
system in the presence of different weight set for maximum range of 70 to
produce 55 corresponding choice of SNPs respectively.
8. Comparison Analysis of Existing
with Proposed System
The comparison analysis is mainly established the RIP-WSN-CC flowcharts
and the utilities focused on three aimed functions. The Proposed RIP-WSN-CC
system results are compared with various existing system. Then, the upcoming
section deals with the performance evaluation of the proposed work. Table 5.9
explains about the comparative values of accessible resources of existing system
with the proposed RIP-WSN-CC system. This shows that the existing accessible
resources control based RBAC, TBAC compared with the proposed system that
achieves high available resources.
Table 9: Comparison of Existing with Proposed Accessible Resources
RBAC System Trust Based System RIP-WSN-CC
40 40 42
40 43 45
40 41 42
40 39 41
40 38 41
40 41 44
40 43 45
40 42 45
40 43 44
40 42 44
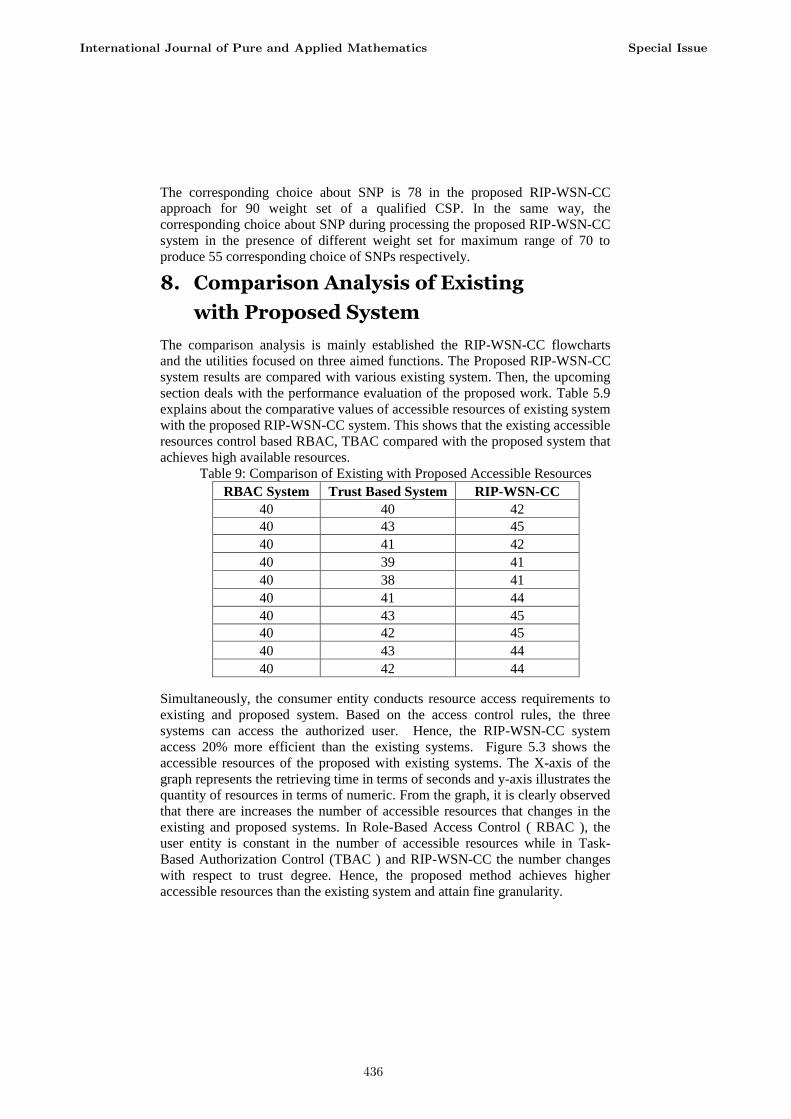
Simultaneously, the consumer entity conducts resource access requirements to
existing and proposed system. Based on the access control rules, the three
systems can access the authorized user. Hence, the RIP-WSN-CC system
access 20% more efficient than the existing systems. Figure 5.3 shows the
accessible resources of the proposed with existing systems. The X-axis of the
graph represents the retrieving time in terms of seconds and y-axis illustrates the
quantity of resources in terms of numeric. From the graph, it is clearly observed
that there are increases the number of accessible resources that changes in the
existing and proposed systems. In Role-Based Access Control ( RBAC ), the
user entity is constant in the number of accessible resources while in Task-
Based Authorization Control (TBAC ) and RIP-WSN-CC the number changes
with respect to trust degree. Hence, the proposed method achieves higher
accessible resources than the existing system and attain fine granularity.
International Journal of Pure and Applied Mathematics Special Issue
436
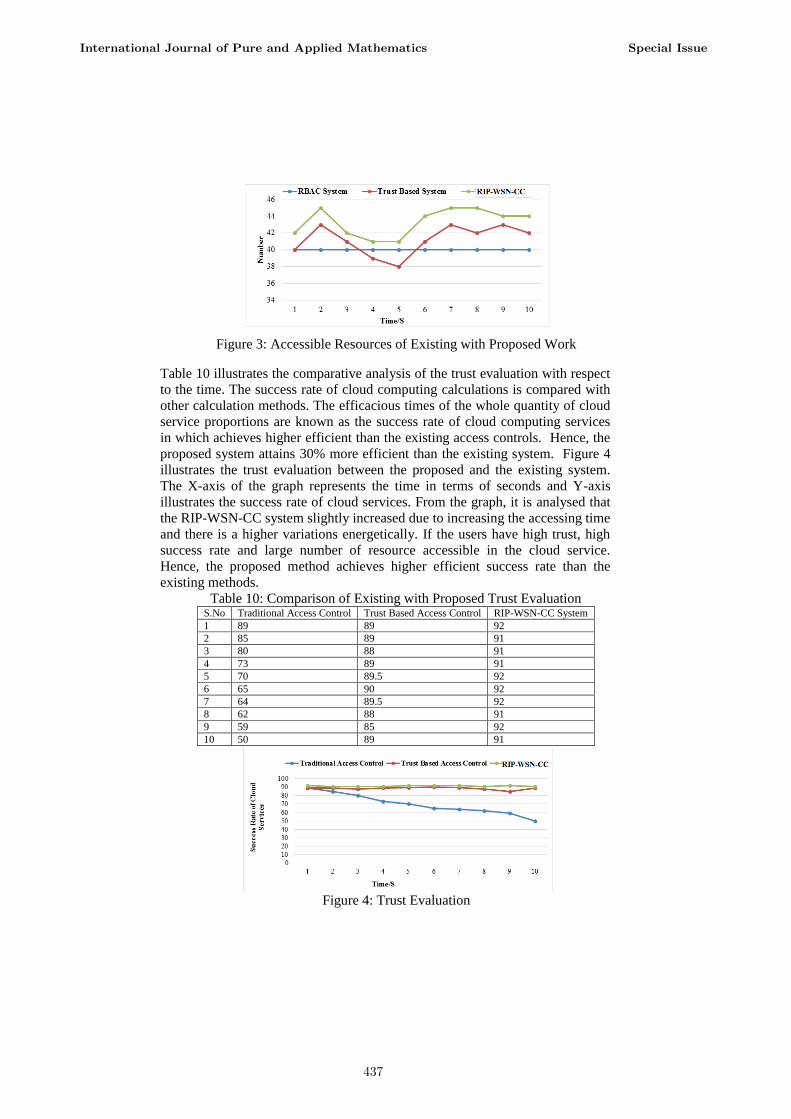
Figure 3: Accessible Resources of Existing with Proposed Work
Table 10 illustrates the comparative analysis of the trust evaluation with respect
to the time. The success rate of cloud computing calculations is compared with
other calculation methods. The efficacious times of the whole quantity of cloud
service proportions are known as the success rate of cloud computing services
in which achieves higher efficient than the existing access controls. Hence, the
proposed system attains 30% more efficient than the existing system. Figure 4
illustrates the trust evaluation between the proposed and the existing system.
The X-axis of the graph represents the time in terms of seconds and Y-axis
illustrates the success rate of cloud services. From the graph, it is analysed that
the RIP-WSN-CC system slightly increased due to increasing the accessing time
and there is a higher variations energetically. If the users have high trust, high
success rate and large number of resource accessible in the cloud service.
Hence, the proposed method achieves higher efficient success rate than the
existing methods.
Table 10: Comparison of Existing with Proposed Trust Evaluation S.No Traditional Access Control Trust Based Access Control RIP-WSN-CC System
1 89 89 92
2 85 89 91
3 80 88 91
4 73 89 91
5 70 89.5 92
6 65 90 92
7 64 89.5 92
8 62 88 91
9 59 85 92
10 50 89 91
Figure 4: Trust Evaluation
International Journal of Pure and Applied Mathematics Special Issue
437
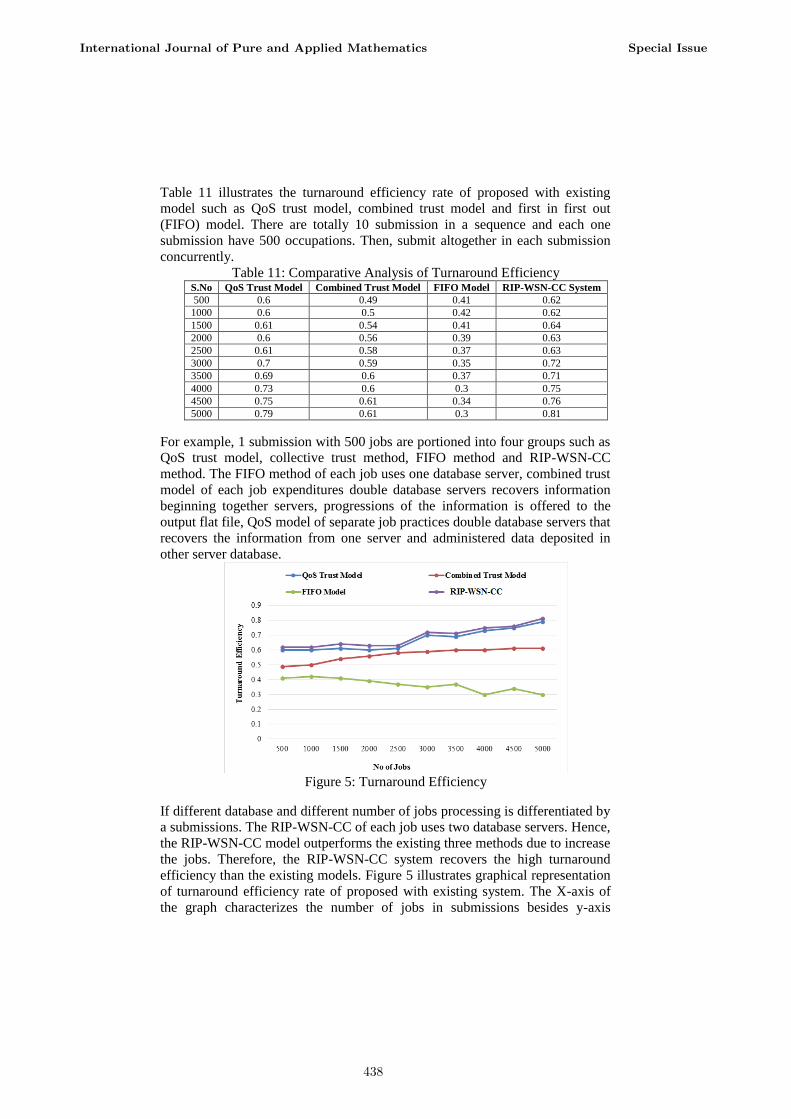
Table 11 illustrates the turnaround efficiency rate of proposed with existing
model such as QoS trust model, combined trust model and first in first out
(FIFO) model. There are totally 10 submission in a sequence and each one
submission have 500 occupations. Then, submit altogether in each submission
concurrently.
Table 11: Comparative Analysis of Turnaround Efficiency S.No QoS Trust Model Combined Trust Model FIFO Model RIP-WSN-CC System
500 0.6 0.49 0.41 0.62
1000 0.6 0.5 0.42 0.62
1500 0.61 0.54 0.41 0.64
2000 0.6 0.56 0.39 0.63
2500 0.61 0.58 0.37 0.63
3000 0.7 0.59 0.35 0.72
3500 0.69 0.6 0.37 0.71
4000 0.73 0.6 0.3 0.75
4500 0.75 0.61 0.34 0.76
5000 0.79 0.61 0.3 0.81
For example, 1 submission with 500 jobs are portioned into four groups such as
QoS trust model, collective trust method, FIFO method and RIP-WSN-CC
method. The FIFO method of each job uses one database server, combined trust
model of each job expenditures double database servers recovers information
beginning together servers, progressions of the information is offered to the
output flat file, QoS model of separate job practices double database servers that
recovers the information from one server and administered data deposited in
other server database.
Figure 5: Turnaround Efficiency
If different database and different number of jobs processing is differentiated by
a submissions. The RIP-WSN-CC of each job uses two database servers. Hence,
the RIP-WSN-CC model outperforms the existing three methods due to increase
the jobs. Therefore, the RIP-WSN-CC system recovers the high turnaround
efficiency than the existing models. Figure 5 illustrates graphical representation
of turnaround efficiency rate of proposed with existing system. The X-axis of
the graph characterizes the number of jobs in submissions besides y-axis
International Journal of Pure and Applied Mathematics Special Issue
438
illustrates turnaround efficiency rate. From the graph, it is clearly observed that
there is increasing in number of jobs with increase the turnaround efficiency
21% more than existing works. The proposed method achieves higher efficiency
than the existing system.
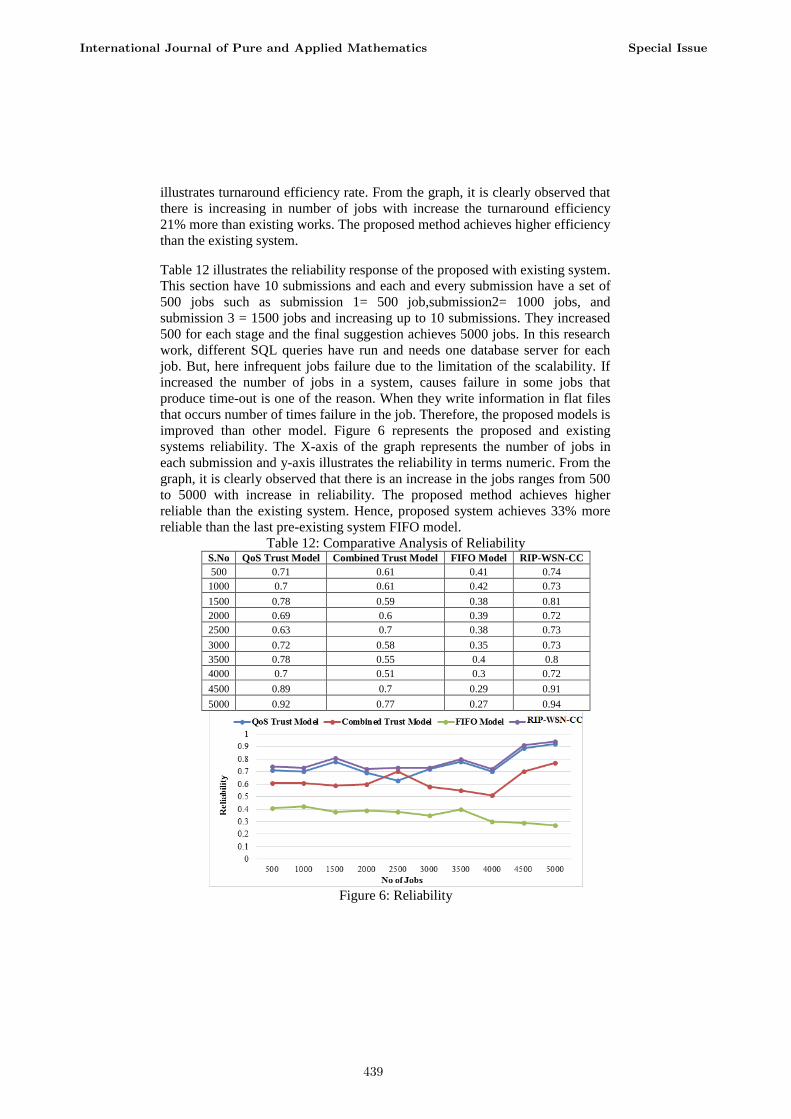
Table 12 illustrates the reliability response of the proposed with existing system.
This section have 10 submissions and each and every submission have a set of
500 jobs such as submission 1= 500 job,submission2= 1000 jobs, and
submission 3 = 1500 jobs and increasing up to 10 submissions. They increased
500 for each stage and the final suggestion achieves 5000 jobs. In this research
work, different SQL queries have run and needs one database server for each
job. But, here infrequent jobs failure due to the limitation of the scalability. If
increased the number of jobs in a system, causes failure in some jobs that
produce time-out is one of the reason. When they write information in flat files
that occurs number of times failure in the job. Therefore, the proposed models is
improved than other model. Figure 6 represents the proposed and existing
systems reliability. The X-axis of the graph represents the number of jobs in
each submission and y-axis illustrates the reliability in terms numeric. From the
graph, it is clearly observed that there is an increase in the jobs ranges from 500
to 5000 with increase in reliability. The proposed method achieves higher
reliable than the existing system. Hence, proposed system achieves 33% more
reliable than the last pre-existing system FIFO model.
Table 12: Comparative Analysis of Reliability S.No QoS Trust Model Combined Trust Model FIFO Model RIP-WSN-CC
500 0.71 0.61 0.41 0.74
1000 0.7 0.61 0.42 0.73
1500 0.78 0.59 0.38 0.81
2000 0.69 0.6 0.39 0.72
2500 0.63 0.7 0.38 0.73
3000 0.72 0.58 0.35 0.73
3500 0.78 0.55 0.4 0.8
4000 0.7 0.51 0.3 0.72
4500 0.89 0.7 0.29 0.91
5000 0.92 0.77 0.27 0.94
Figure 6: Reliability
International Journal of Pure and Applied Mathematics Special Issue
439
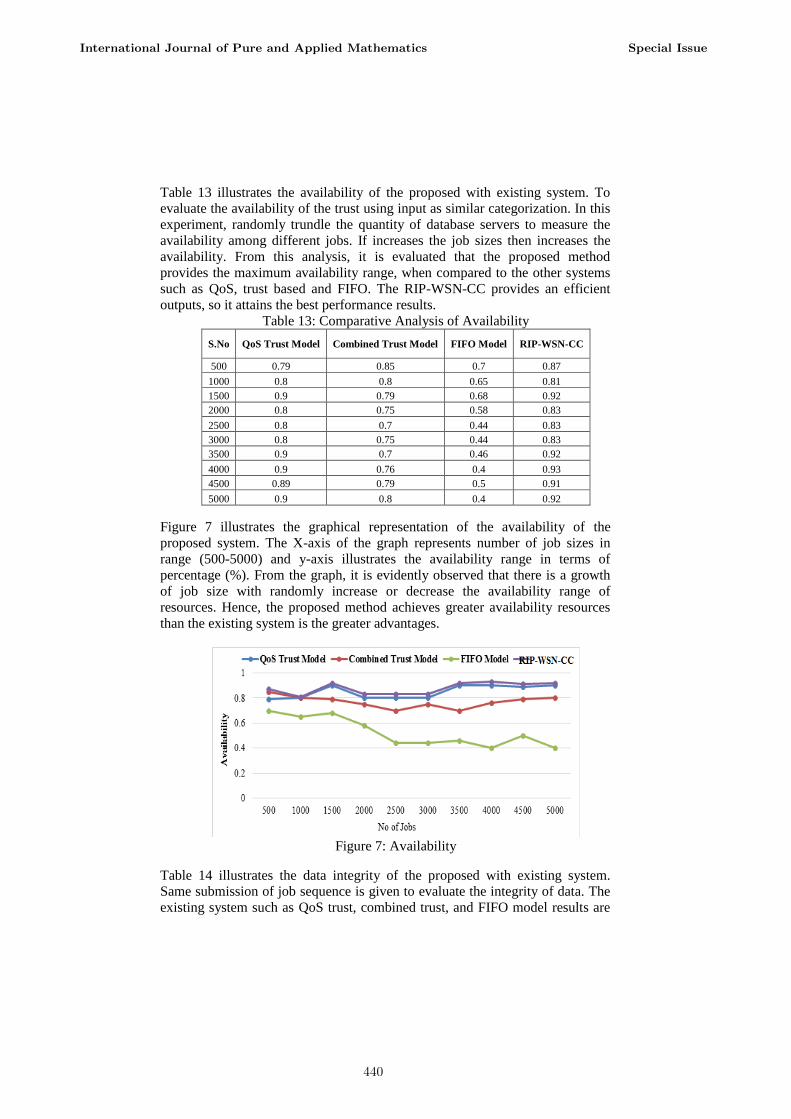
Table 13 illustrates the availability of the proposed with existing system. To
evaluate the availability of the trust using input as similar categorization. In this
experiment, randomly trundle the quantity of database servers to measure the
availability among different jobs. If increases the job sizes then increases the
availability. From this analysis, it is evaluated that the proposed method
provides the maximum availability range, when compared to the other systems
such as QoS, trust based and FIFO. The RIP-WSN-CC provides an efficient
outputs, so it attains the best performance results.
Table 13: Comparative Analysis of Availability
S.No QoS Trust Model Combined Trust Model FIFO Model RIP-WSN-CC
500 0.79 0.85 0.7 0.87
1000 0.8 0.8 0.65 0.81
1500 0.9 0.79 0.68 0.92
2000 0.8 0.75 0.58 0.83
2500 0.8 0.7 0.44 0.83
3000 0.8 0.75 0.44 0.83
3500 0.9 0.7 0.46 0.92
4000 0.9 0.76 0.4 0.93
4500 0.89 0.79 0.5 0.91
5000 0.9 0.8 0.4 0.92
Figure 7 illustrates the graphical representation of the availability of the
proposed system. The X-axis of the graph represents number of job sizes in
range (500-5000) and y-axis illustrates the availability range in terms of
percentage (%). From the graph, it is evidently observed that there is a growth
of job size with randomly increase or decrease the availability range of
resources. Hence, the proposed method achieves greater availability resources
than the existing system is the greater advantages.
Figure 7: Availability
Table 14 illustrates the data integrity of the proposed with existing system.
Same submission of job sequence is given to evaluate the integrity of data. The
existing system such as QoS trust, combined trust, and FIFO model results are
International Journal of Pure and Applied Mathematics Special Issue
440
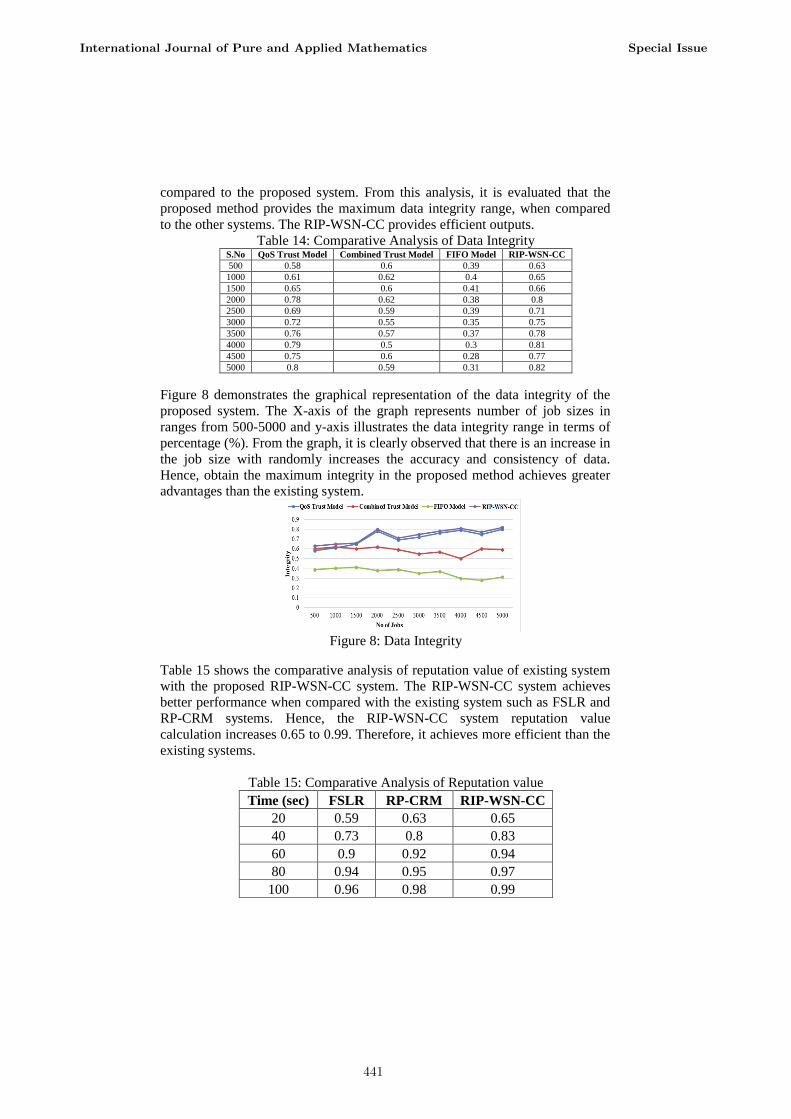
compared to the proposed system. From this analysis, it is evaluated that the
proposed method provides the maximum data integrity range, when compared
to the other systems. The RIP-WSN-CC provides efficient outputs.
Table 14: Comparative Analysis of Data Integrity S.No QoS Trust Model Combined Trust Model FIFO Model RIP-WSN-CC
500 0.58 0.6 0.39 0.63
1000 0.61 0.62 0.4 0.65
1500 0.65 0.6 0.41 0.66
2000 0.78 0.62 0.38 0.8
2500 0.69 0.59 0.39 0.71
3000 0.72 0.55 0.35 0.75
3500 0.76 0.57 0.37 0.78
4000 0.79 0.5 0.3 0.81
4500 0.75 0.6 0.28 0.77
5000 0.8 0.59 0.31 0.82
Figure 8 demonstrates the graphical representation of the data integrity of the
proposed system. The X-axis of the graph represents number of job sizes in
ranges from 500-5000 and y-axis illustrates the data integrity range in terms of
percentage (%). From the graph, it is clearly observed that there is an increase in
the job size with randomly increases the accuracy and consistency of data.
Hence, obtain the maximum integrity in the proposed method achieves greater
advantages than the existing system.
Figure 8: Data Integrity
Table 15 shows the comparative analysis of reputation value of existing system
with the proposed RIP-WSN-CC system. The RIP-WSN-CC system achieves
better performance when compared with the existing system such as FSLR and
RP-CRM systems. Hence, the RIP-WSN-CC system reputation value
calculation increases 0.65 to 0.99. Therefore, it achieves more efficient than the
existing systems.
Table 15: Comparative Analysis of Reputation value
Time (sec) FSLR RP-CRM RIP-WSN-CC
20 0.59 0.63 0.65
40 0.73 0.8 0.83
60 0.9 0.92 0.94
80 0.94 0.95 0.97
100 0.96 0.98 0.99
International Journal of Pure and Applied Mathematics Special Issue
441
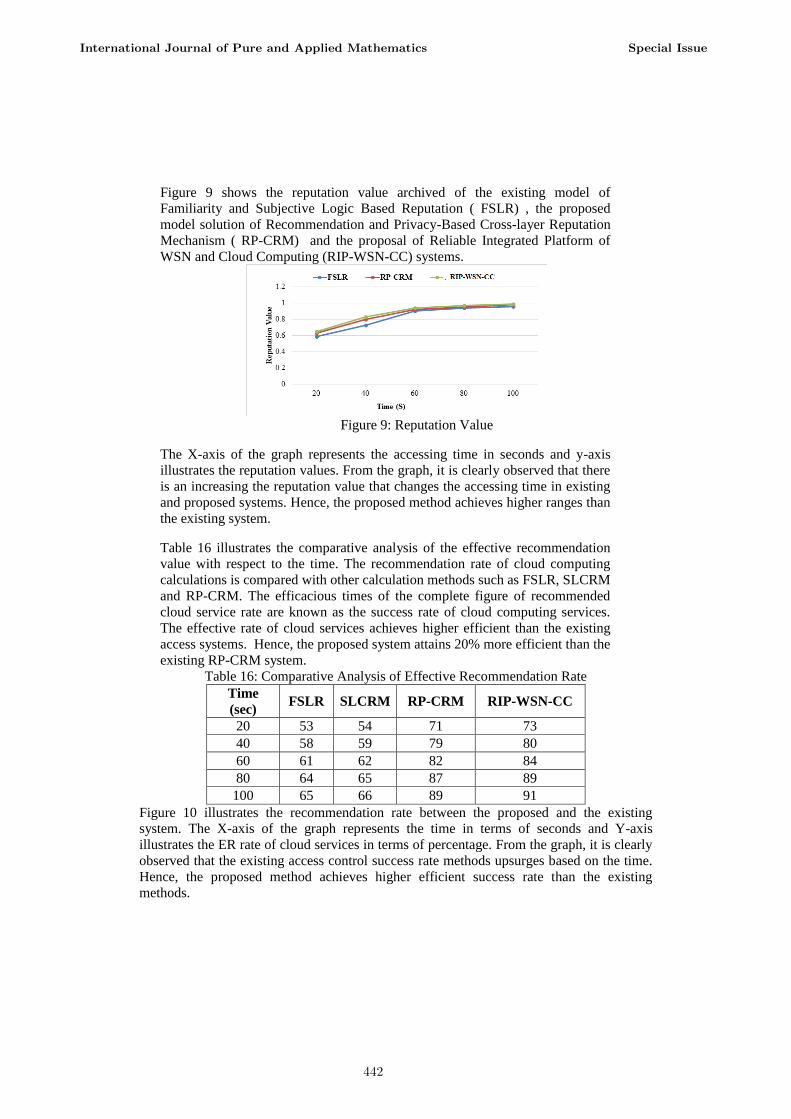
Figure 9 shows the reputation value archived of the existing model of
Familiarity and Subjective Logic Based Reputation ( FSLR) , the proposed
model solution of Recommendation and Privacy-Based Cross-layer Reputation
Mechanism ( RP-CRM) and the proposal of Reliable Integrated Platform of
WSN and Cloud Computing (RIP-WSN-CC) systems.
Figure 9: Reputation Value
The X-axis of the graph represents the accessing time in seconds and y-axis
illustrates the reputation values. From the graph, it is clearly observed that there
is an increasing the reputation value that changes the accessing time in existing
and proposed systems. Hence, the proposed method achieves higher ranges than
the existing system.
Table 16 illustrates the comparative analysis of the effective recommendation
value with respect to the time. The recommendation rate of cloud computing
calculations is compared with other calculation methods such as FSLR, SLCRM
and RP-CRM. The efficacious times of the complete figure of recommended
cloud service rate are known as the success rate of cloud computing services.
The effective rate of cloud services achieves higher efficient than the existing
access systems. Hence, the proposed system attains 20% more efficient than the
existing RP-CRM system.
Table 16: Comparative Analysis of Effective Recommendation Rate
Time
(sec) FSLR SLCRM RP-CRM RIP-WSN-CC
20 53 54 71 73
40 58 59 79 80
60 61 62 82 84
80 64 65 87 89
100 65 66 89 91
Figure 10 illustrates the recommendation rate between the proposed and the existing
system. The X-axis of the graph represents the time in terms of seconds and Y-axis
illustrates the ER rate of cloud services in terms of percentage. From the graph, it is clearly
observed that the existing access control success rate methods upsurges based on the time.
Hence, the proposed method achieves higher efficient success rate than the existing
methods.
International Journal of Pure and Applied Mathematics Special Issue
442
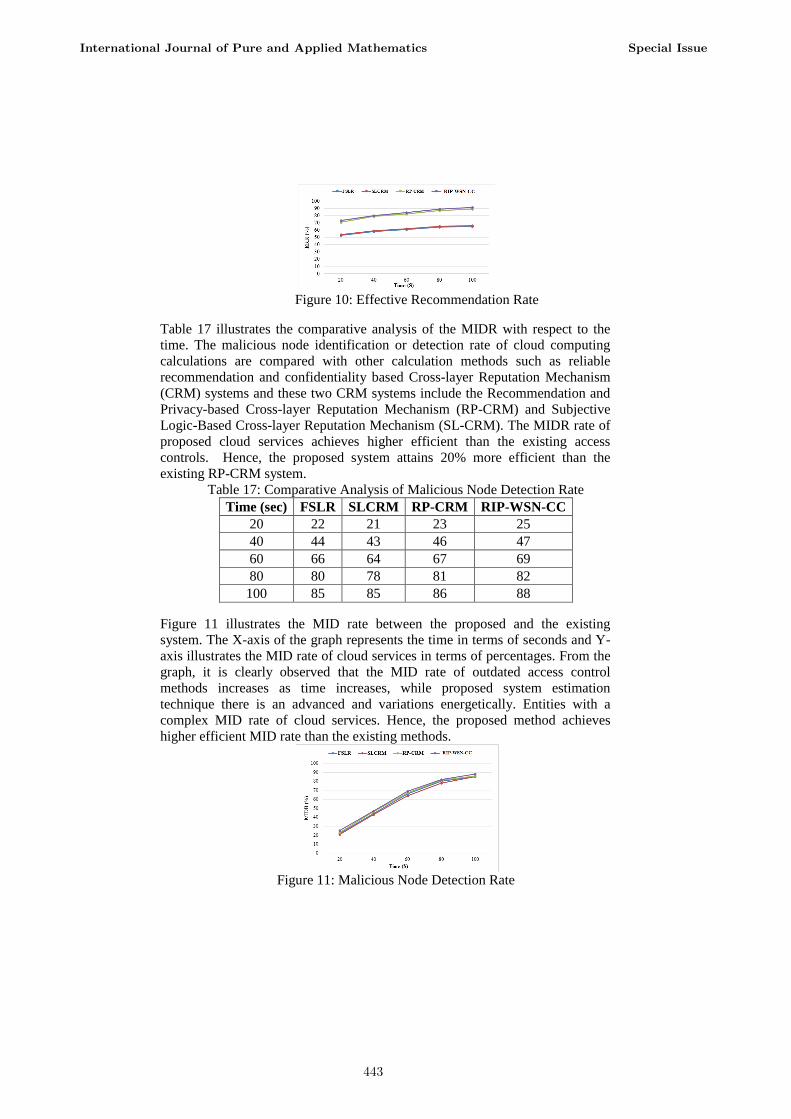
Figure 10: Effective Recommendation Rate
Table 17 illustrates the comparative analysis of the MIDR with respect to the
time. The malicious node identification or detection rate of cloud computing
calculations are compared with other calculation methods such as reliable
recommendation and confidentiality based Cross-layer Reputation Mechanism
(CRM) systems and these two CRM systems include the Recommendation and
Privacy-based Cross-layer Reputation Mechanism (RP-CRM) and Subjective
Logic-Based Cross-layer Reputation Mechanism (SL-CRM). The MIDR rate of
proposed cloud services achieves higher efficient than the existing access
controls. Hence, the proposed system attains 20% more efficient than the
existing RP-CRM system.
Table 17: Comparative Analysis of Malicious Node Detection Rate
Time (sec) FSLR SLCRM RP-CRM RIP-WSN-CC
20 22 21 23 25
40 44 43 46 47
60 66 64 67 69
80 80 78 81 82
100 85 85 86 88
Figure 11 illustrates the MID rate between the proposed and the existing
system. The X-axis of the graph represents the time in terms of seconds and Y-
axis illustrates the MID rate of cloud services in terms of percentages. From the
graph, it is clearly observed that the MID rate of outdated access control
methods increases as time increases, while proposed system estimation
technique there is an advanced and variations energetically. Entities with a
complex MID rate of cloud services. Hence, the proposed method achieves
higher efficient MID rate than the existing methods.
Figure 11: Malicious Node Detection Rate
International Journal of Pure and Applied Mathematics Special Issue
443
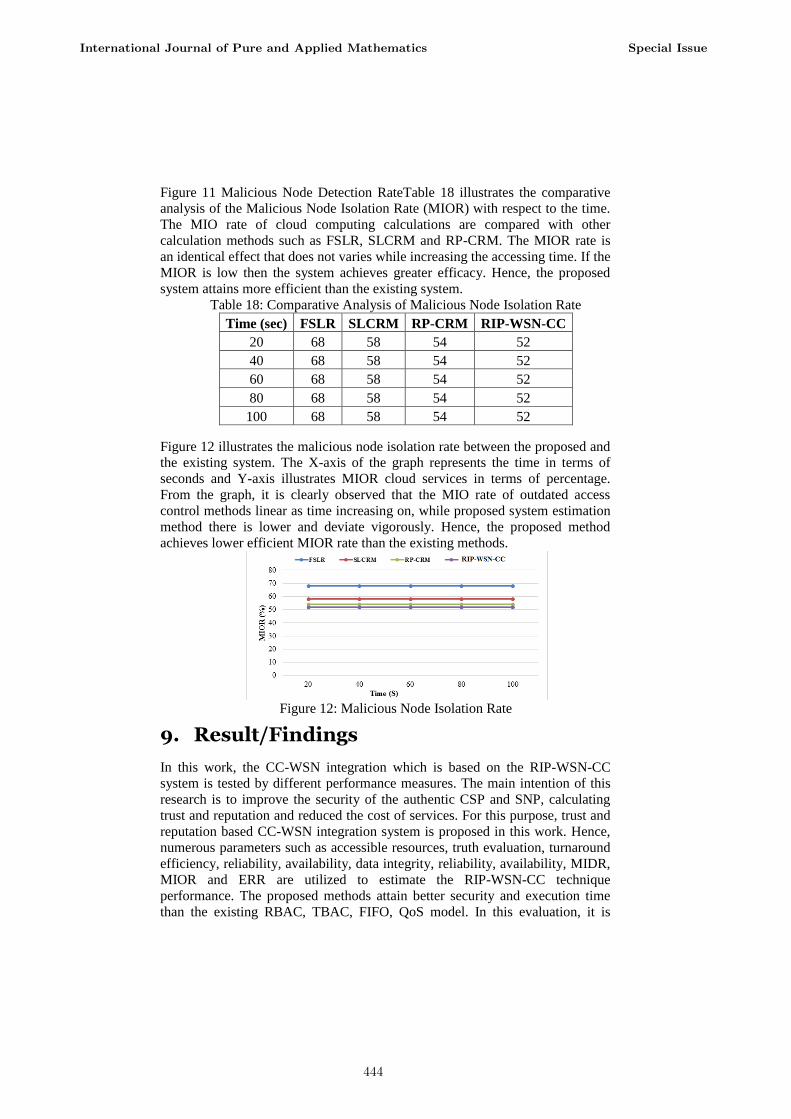
Figure 11 Malicious Node Detection RateTable 18 illustrates the comparative
analysis of the Malicious Node Isolation Rate (MIOR) with respect to the time.
The MIO rate of cloud computing calculations are compared with other
calculation methods such as FSLR, SLCRM and RP-CRM. The MIOR rate is
an identical effect that does not varies while increasing the accessing time. If the
MIOR is low then the system achieves greater efficacy. Hence, the proposed
system attains more efficient than the existing system.
Table 18: Comparative Analysis of Malicious Node Isolation Rate
Time (sec) FSLR SLCRM RP-CRM RIP-WSN-CC
20 68 58 54 52
40 68 58 54 52
60 68 58 54 52
80 68 58 54 52
100 68 58 54 52
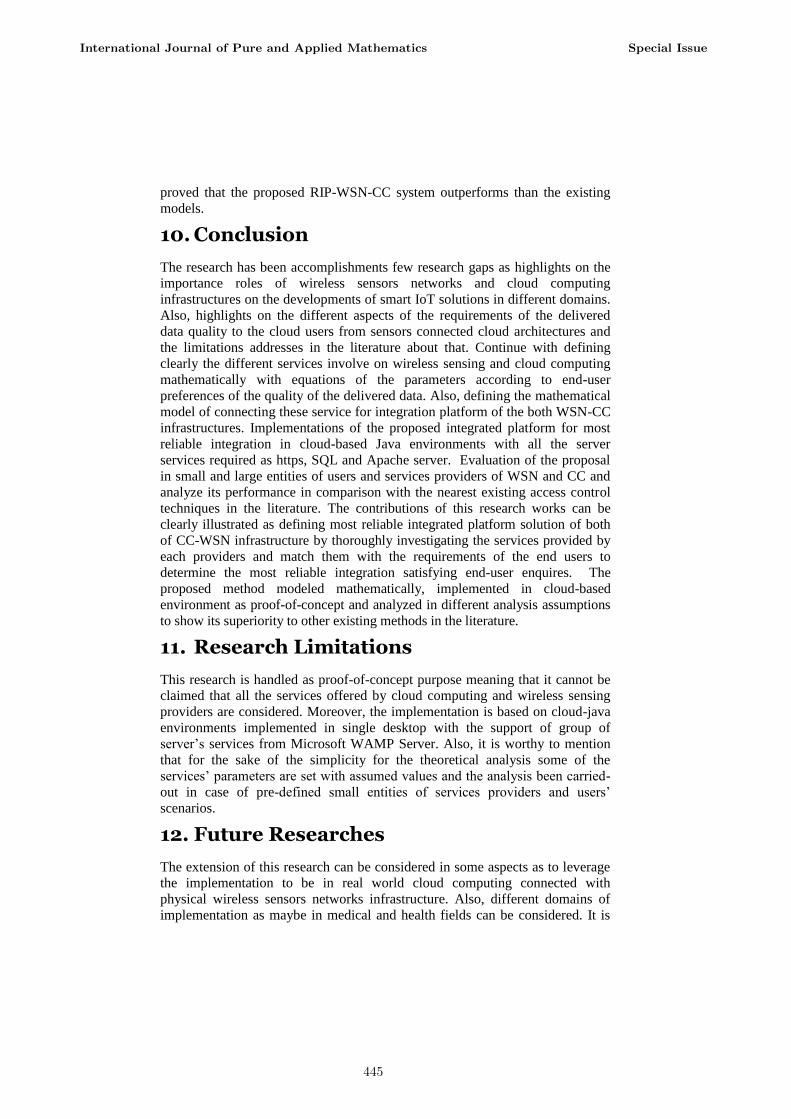
Figure 12 illustrates the malicious node isolation rate between the proposed and
the existing system. The X-axis of the graph represents the time in terms of
seconds and Y-axis illustrates MIOR cloud services in terms of percentage.
From the graph, it is clearly observed that the MIO rate of outdated access
control methods linear as time increasing on, while proposed system estimation
method there is lower and deviate vigorously. Hence, the proposed method
achieves lower efficient MIOR rate than the existing methods.
Figure 12: Malicious Node Isolation Rate
9. Result/Findings
In this work, the CC-WSN integration which is based on the RIP-WSN-CC
system is tested by different performance measures. The main intention of this
research is to improve the security of the authentic CSP and SNP, calculating
trust and reputation and reduced the cost of services. For this purpose, trust and
reputation based CC-WSN integration system is proposed in this work. Hence,
numerous parameters such as accessible resources, truth evaluation, turnaround
efficiency, reliability, availability, data integrity, reliability, availability, MIDR,
MIOR and ERR are utilized to estimate the RIP-WSN-CC technique
performance. The proposed methods attain better security and execution time
than the existing RBAC, TBAC, FIFO, QoS model. In this evaluation, it is
International Journal of Pure and Applied Mathematics Special Issue
444
proved that the proposed RIP-WSN-CC system outperforms than the existing
models.
10. Conclusion
The research has been accomplishments few research gaps as highlights on the
importance roles of wireless sensors networks and cloud computing
infrastructures on the developments of smart IoT solutions in different domains.
Also, highlights on the different aspects of the requirements of the delivered
data quality to the cloud users from sensors connected cloud architectures and
the limitations addresses in the literature about that. Continue with defining
clearly the different services involve on wireless sensing and cloud computing
mathematically with equations of the parameters according to end-user
preferences of the quality of the delivered data. Also, defining the mathematical
model of connecting these service for integration platform of the both WSN-CC
infrastructures. Implementations of the proposed integrated platform for most
reliable integration in cloud-based Java environments with all the server
services required as https, SQL and Apache server. Evaluation of the proposal
in small and large entities of users and services providers of WSN and CC and
analyze its performance in comparison with the nearest existing access control
techniques in the literature. The contributions of this research works can be
clearly illustrated as defining most reliable integrated platform solution of both
of CC-WSN infrastructure by thoroughly investigating the services provided by
each providers and match them with the requirements of the end users to
determine the most reliable integration satisfying end-user enquires. The
proposed method modeled mathematically, implemented in cloud-based
environment as proof-of-concept and analyzed in different analysis assumptions
to show its superiority to other existing methods in the literature.
11. Research Limitations
This research is handled as proof-of-concept purpose meaning that it cannot be
claimed that all the services offered by cloud computing and wireless sensing
providers are considered. Moreover, the implementation is based on cloud-java
environments implemented in single desktop with the support of group of
server’s services from Microsoft WAMP Server. Also, it is worthy to mention
that for the sake of the simplicity for the theoretical analysis some of the
services’ parameters are set with assumed values and the analysis been carried-
out in case of pre-defined small entities of services providers and users’
scenarios.
12. Future Researches
The extension of this research can be considered in some aspects as to leverage
the implementation to be in real world cloud computing connected with
physical wireless sensors networks infrastructure. Also, different domains of
implementation as maybe in medical and health fields can be considered. It is
International Journal of Pure and Applied Mathematics Special Issue
445
expected also that more services to be considered based on the uniqueness of
the implementation scenarios in certain domains also, the analysis can be
carried out with end-user real requirements of the data delivery quality. All
these points can shift the proposed method to be implemented from proof-of-
concept level to the level of real cloud computing connected wireless sensing
networks for future smart IoT applications.
References
[1] Wang S, Liu Y & Dey S 2012, ‘Wireless network aware cloud scheduler for scalable cloud mobile gaming’, Communications (ICC), 2012 IEEE International Conference on, pp. 2081-2086.
[2] Duan, J., Gao, D., Foh, C. H., & Leung, V. C. (2013, September). Trust and Risk Assessment Approach for Access Control in Wireless Sensor Networks. In Vehicular Technology Conference (VTC Fall), 2013 IEEE 78th (pp. 1-5). IEEE.
[3] Younis, Y. A., Kifayat, K., & Merabti, M. (2014). An access control model for cloud computing. Journal of Information Security and Applications, 19(1), 45-60.
[4] Wei L, Zhu H, Cao Z, Dong X, Jia W, Chen Y, et al. 2014, ‘Security and privacy for storage and computation in cloud computing’, Information Sciences, vol. 258, pp. 371-386.
[5] Xu H, Huang L, Qiao C, Dai W & Sun Y-e 2015, ‘Joint virtual MIMO and data gathering for wireless sensor networks’, IEEE Transactions on Parallel and Distributed Systems, vol. 26, no. 4, pp. 1034-1048.
[6] Yan Q, Yu FR, Gong Q & Li J 2016, ‘Software-defined networking (SDN) and distributed denial of service (DDoS) attacks in cloud computing environments: A survey, some research issues, and challenges’, IEEE Communications Surveys & Tutorials, vol. 18, no. 1, pp. 602-622.
[7] Yang C, Zhang X, Zhong C, Liu C, Pei J, Ramamohanarao K, et al. 2014, ‘A spatiotemporal compression based approach for efficient big data processing on cloud’, Journal of Computer and System Sciences, vol. 80, no. 8, pp. 1563-1583.
[8] Yang K & Jia X 2014, DAC-MACS: Effective data access control for multi-authority cloud storage systems, in Security for Cloud Storage Systems, Springer, pp. 59-83.
[9] Yao Y, Cao Q & Vasilakos AV 2013, ‘EDAL: An energy-efficient, delay-aware, and lifetime-balancing data collection protocol for wireless sensor networks’, Mobile ad-hoc and sensor systems (MASS), 2013 IEEE 10th international conference on, pp. 182-190.
International Journal of Pure and Applied Mathematics Special Issue
446
[10] Yin Z, Yu FR, Bu S & Han Z 2015, ‘Joint cloud and wireless networks operations in mobile cloud computing environments with telecom operator cloud’, IEEE Transactions on Wireless Communications, vol. 14, no. 7, pp. 4020-4033.
[11] Zhang N, Cheng N, Gamage AT, Zhang K, Mark JW & Shen X 2015, ‘Cloud assisted HetNets toward 5G wireless networks’, IEEE Communications Magazine, vol. 53, no. 6, pp. 59-65.
[12] Zhang P, Yan Z & Sun H 2013, ‘A novel architecture based on cloud computing for wireless sensor network’, Proceedings of the 2nd International Conference on Computer Science and Electronics Engineering. Atlantis Press.
[13] Zhang W, Wen Y & Wu DO 2015, ‘Collaborative task execution in mobile cloud computing under a stochastic wireless channel’, IEEE Transactions on Wireless Communications, vol. 14, no. 1, pp. 81-93.
[14] Zhang Y, He S & Chen J 2016, ‘Data gathering optimization by dynamic sensing and routing in rechargeable sensor networks’, IEEE/ACM Transactions on Networking, vol. 24, no. 3, pp. 1632-1646.
[15] Zhao M, Li J & Yang Y 2014, ‘A framework of joint mobile energy replenishment and data gathering in wireless rechargeable sensor networks’, IEEE Transactions on Mobile Computing, vol. 13, no. 12, pp. 2689-2705.
[16] Zheng H, Yang F, Tian X, Gan X, Wang X & Xiao S 2015, ‘Data gathering with compressive sensing in wireless sensor networks: a random walk based approach’, IEEE Transactions on Parallel and Distributed Systems, vol. 26, no. 1, pp. 35-44.
[17] Zhou J, Leppanen T, Harjula E, Ylianttila M, Ojala T, Yu C, et al. 2013, ‘Cloudthings: A common architecture for integrating the internet of things with cloud computing’, Computer Supported Cooperative Work in Design (CSCWD), 2013 IEEE 17th International Conference on, pp. 651-657.
[18] Zhou J, Cao Z, Dong X, Xiong N & Vasilakos AV 2015, ‘4S: A secure and privacy-preserving key management scheme for cloud-assisted wireless body area network in m-healthcare social networks’, Information Sciences, vol. 314, pp. 255-276.
[19] Zhu C, Li X, Leung VC, Hu X & Yang LT 2014, ‘Job scheduling for cloud computing integrated with wireless sensor network’, Cloud Computing Technology and Science (CloudCom), 2014 IEEE 6th International Conference on, pp. 62-69.
International Journal of Pure and Applied Mathematics Special Issue
447
[20] Zhu C, Wang H, Liu X, Shu L, Yang LT & Leung VC 2016, ‘A novel sensory data processing framework to integrate sensor networks with mobile cloud’, IEEE Systems Journal, vol. 10, no. 3, pp. 1125-1136.
[21] Chethana M & Kusuma R 2016, ‘An Legal Trust and Reputation Calculation and Management System for Cloud and Sensor Networks Integration’,
[22] Manuel P 2015, ‘A trust model of cloud computing based on Quality of Service’, Annals of Operations Research, vol. 233, no. 1, pp. 281-292.
[23] Savas O, Jin G & Deng J 2013, ‘Trust management in cloud-integrated wireless sensor networks’, Collaboration Technologies and Systems (CTS), 2013 International Conference on, pp. 334-341.
International Journal of Pure and Applied Mathematics Special Issue
448

449

450