Rencana Penerimaan Sampel ì Acceptance...
41
ì Rencana Penerimaan Sampel (Acceptance Sampling) 12 – Pengendalian Kualitas Debrina Puspita Andriani Teknik Industri Universitas Brawijaya e-Mail : [email protected] Blog : hDp://debrina.lecture.ub.ac.id/
Transcript of Rencana Penerimaan Sampel ì Acceptance...
ìRencanaPenerimaanSampel(AcceptanceSampling)12–PengendalianKualitas
DebrinaPuspitaAndrianiTeknikIndustriUniversitasBrawijayae-Mail:[email protected]:hDp://debrina.lecture.ub.ac.id/
RENCANAPENERIMAANSAMPEL(AcceptanceSamplingPlans)
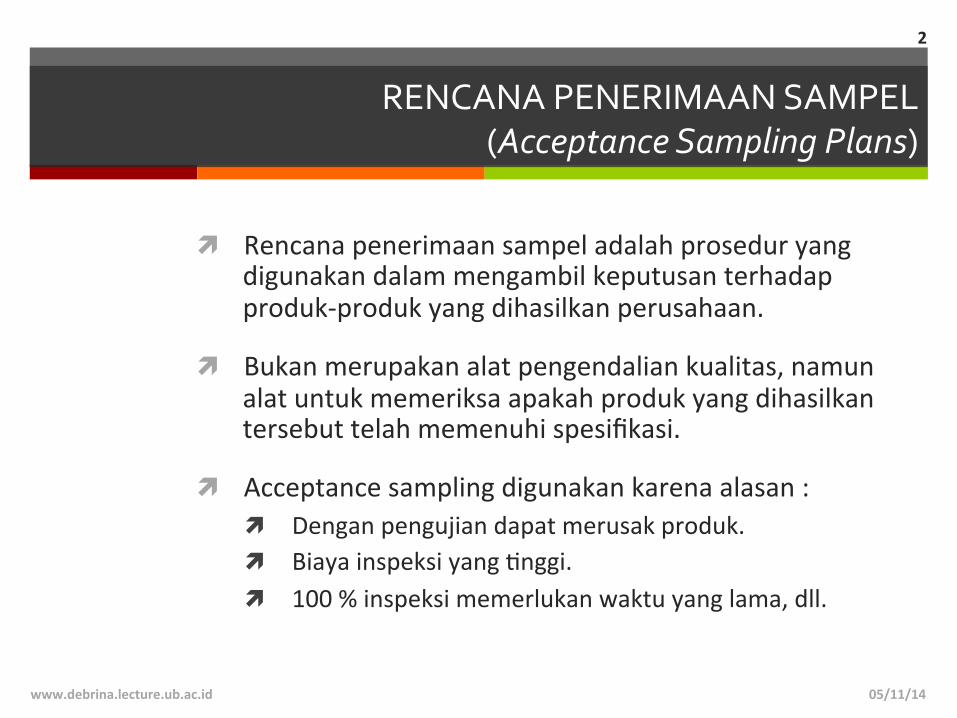
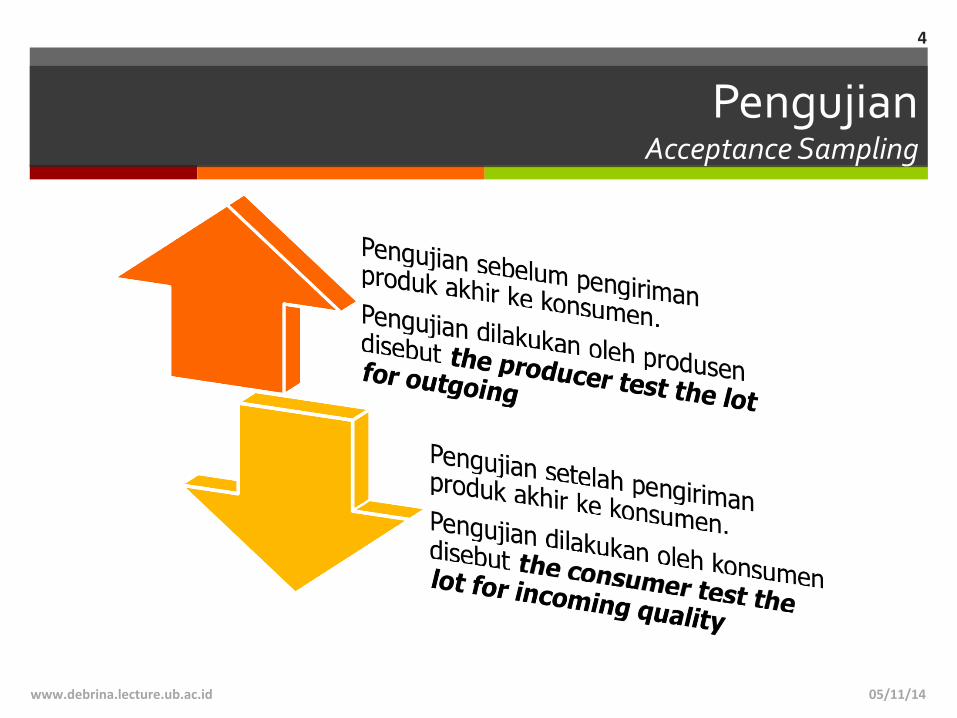
ì Rencanapenerimaansampeladalahproseduryangdigunakandalammengambilkeputusanterhadapproduk-produkyangdihasilkanperusahaan.
ì Bukanmerupakanalatpengendaliankualitas,namunalatuntukmemeriksaapakahprodukyangdihasilkantersebuttelahmemenuhispesifikasi.
ì Acceptancesamplingdigunakankarenaalasan:ì Denganpengujiandapatmerusakproduk.ì BiayainspeksiyangMnggi.ì 100%inspeksimemerlukanwaktuyanglama,dll.
05/11/14www.debrina.lecture.ub.ac.id
2
+vs.–AcceptanceSampling
05/11/14www.debrina.lecture.ub.ac.id
3
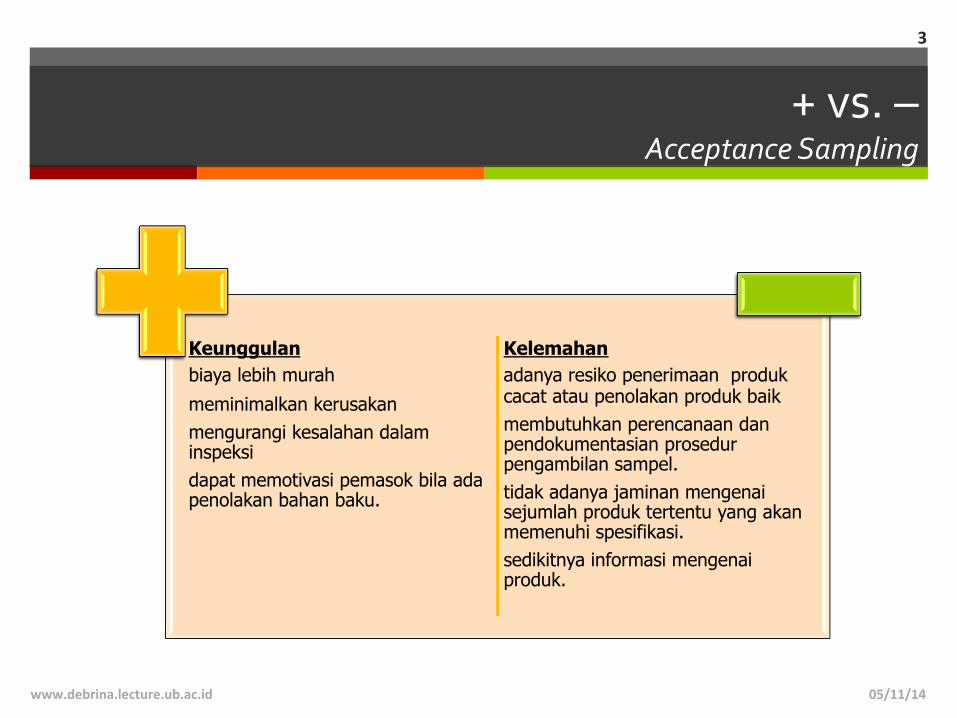
Keunggulan biaya lebih murah
meminimalkan kerusakan mengurangi kesalahan dalam inspeksi dapat memotivasi pemasok bila ada penolakan bahan baku.
Kelemahan adanya resiko penerimaan produk cacat atau penolakan produk baik membutuhkan perencanaan dan pendokumentasian prosedur pengambilan sampel. tidak adanya jaminan mengenai sejumlah produk tertentu yang akan memenuhi spesifikasi. sedikitnya informasi mengenai produk.
PengujianAcceptanceSampling
05/11/14www.debrina.lecture.ub.ac.id
4
JenisDataAcceptanceSampling
05/11/14www.debrina.lecture.ub.ac.id
5
ìRencanaPenerimaanSampel(AcceptanceSampling)untukDataVariabel12–PengendalianKualitas
DebrinaPuspitaAndrianiTeknikIndustriUniversitasBrawijayae-Mail:[email protected]:hDp://debrina.lecture.ub.ac.id/
ì
05/11/14www.debrina.lecture.ub.ac.id
7
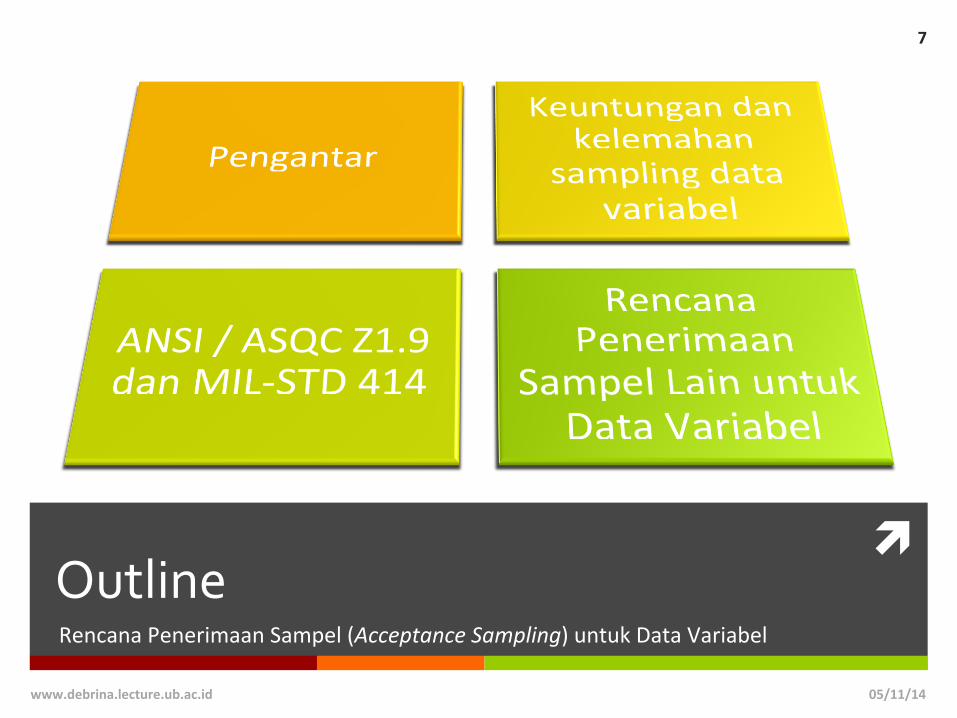
OutlineRencanaPenerimaanSampel(AcceptanceSampling)untukDataVariabel
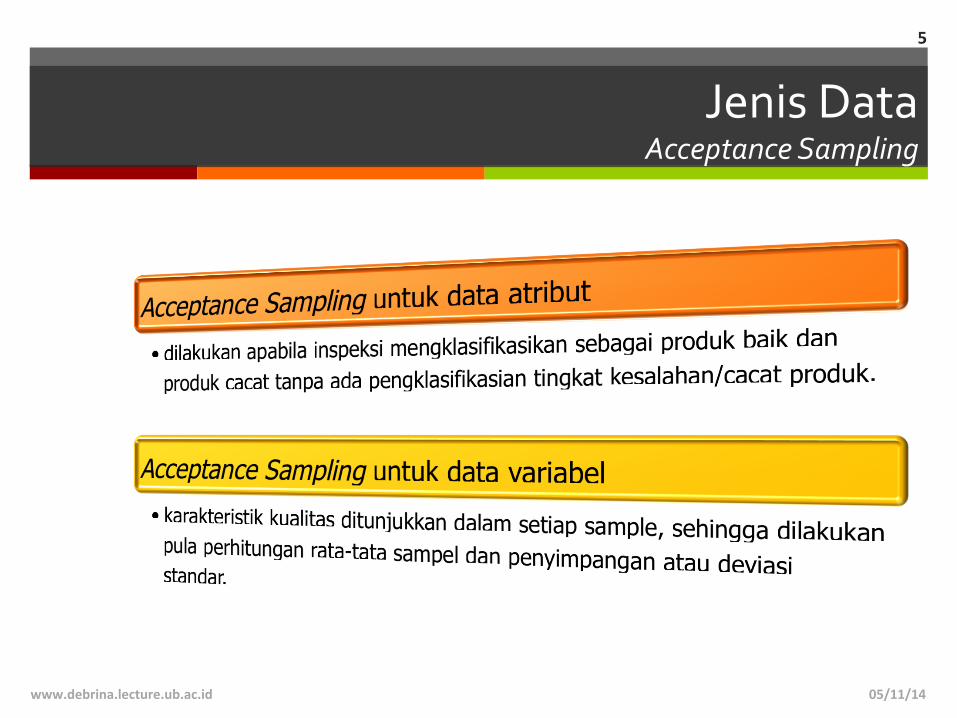
ì Pengambilandanpenerimaandatavariabeldidasarkanpadarata-ratadanstandardeviasi,sertadistribusifrekuensi
ì DatavariabeladalahkarakterisMkmutupadaskalanumerikseperMMnggi,tekanan,suhu,panjang,dsb
ì Adakondisitertentuyangmembutuhkanpengambilansampeluntukdatavariabel(misalnya:sampelharusberdistribusinormal).
ì Pengambilandataberdasarkanpadarata-rata,standardeviasi,dandistribusifrekuensi
ì Teknikinidilakukanjika:ì JikapengujianbersifatdestrukMfì Highcostì Kebutuhanakaninformasiseberapajauh
penyimpangan
05/11/14www.debrina.lecture.ub.ac.id
8
RencanaPenerimaanSampel(AcceptanceSampling)untukDataVariabel
Pengantar
Kelebihan&Kekurangan
Kelebihanì Jumlahsamplelebihsedikit
ì Menyediakanlebihbanyakinformasiterutamadapatmengetahuiseberapajauhpenyimpanganataukesalahanyangterjadi
ì Bermanfaatuntukusahaperbaikanmutu
Kekuranganì Pengambilansampleharus
dibagikedalambeberapakarakterisMkproses
ì BiayaadministrasilebihMnggi
ì SeringkaliterjadibeberapasampledatavariabeldapatdiganMdenganhanya1sampleatribut
05/11/14www.debrina.lecture.ub.ac.id
9
RencanaPenerimaanSampel(AcceptanceSampling)untukDataVariabel
JenisPerencanaanVariabel
Presentaseketidaksesuaianì Plansthatcontrolthelotor
processfrac5ondefec5ve(ornonconforming).[Procedure1]
ì Dirancanguntukmenentukanproporsiprodukyangberadadiluarbatasspesifikasi.
ì UntukmenyelesaikanpermasalahaninidapatdigunakanstandarANSI/ASQCZI.9-1993
Parameterprosesì Plansthatcontrolalotorprocess
parameter(usuallythemean).[Procedure2]
ì Dirancanguntukmengendalikanrata-ratadanpenyimpanganataustandardeviasidaridistribusiprodukpadaMngkattertentu.
ì Untukmenyelesaikanmasalahinidapatdigunakanmetodeacceptancecontrolchart,sequen5alsamplingforvariable,danhypothesistes5ng
05/11/14www.debrina.lecture.ub.ac.id
10
RencanaPenerimaanSampel(AcceptanceSampling)untukDataVariabel
ANSI/ASQCZI.9danMIL-STD414
ì ANSI/ASQCZI.9adalahperencanaansampleyangberdasarpadaAQLyangmengasumsikanbahwadistribusinormaldenganmenggunakanvariabelacak
ì Perencanaanpengambilansampleiniditunjukkandengannilai-nilainumerikdariAQLdenganjarak0,10%sampaidengan10%
ì StandarinimembuatketentuanyangmelipuM9proseduryangdapatdigunakanuntukmengevaluasi
05/11/14www.debrina.lecture.ub.ac.id
11
RencanaPenerimaanSampel(AcceptanceSampling)untukDataVariabel
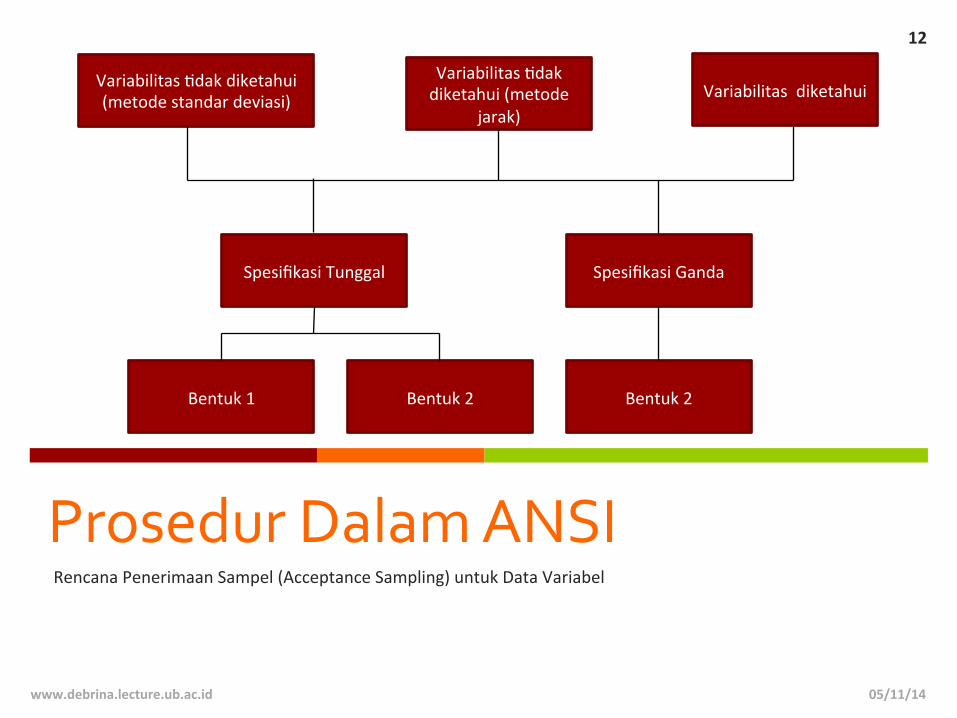
ProsedurDalamANSIRencanaPenerimaanSampel(AcceptanceSampling)untukDataVariabel
05/11/14www.debrina.lecture.ub.ac.id
12
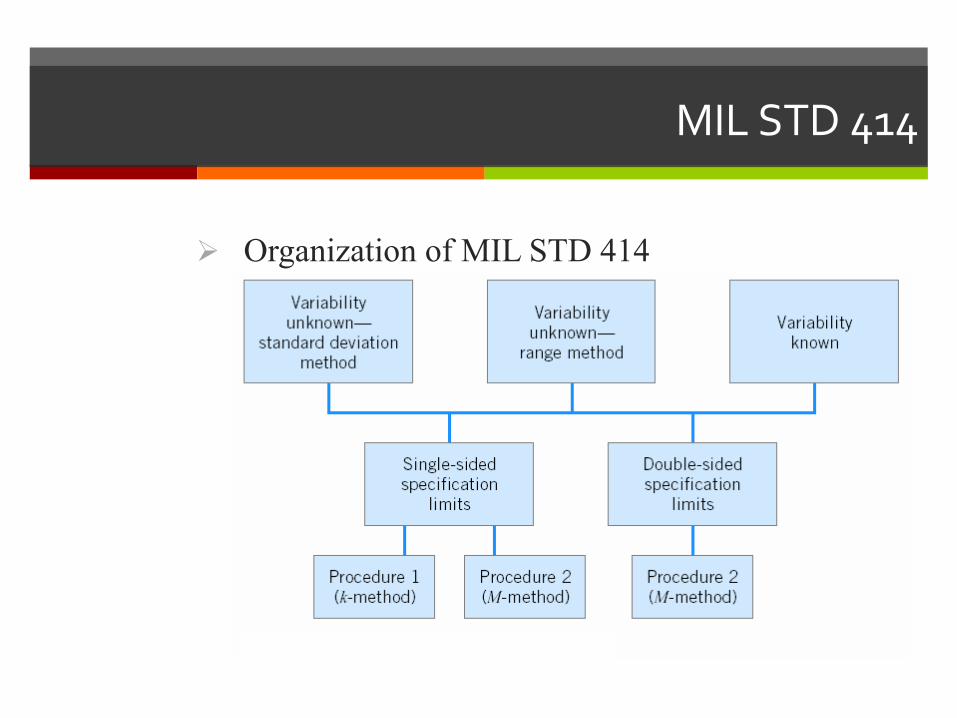
VariabilitasMdakdiketahui(metodestandardeviasi)
VariabilitasMdakdiketahui(metode
jarak)Variabilitasdiketahui
SpesifikasiTunggal SpesifikasiGanda
Bentuk1 Bentuk2 Bentuk2
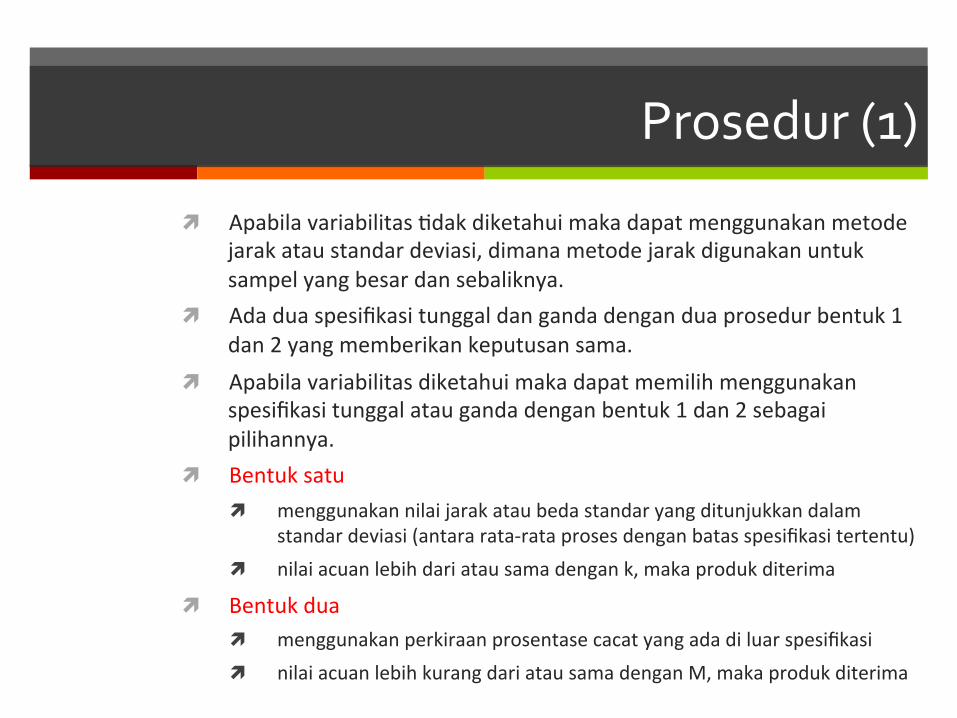
Prosedur(1)
ì ApabilavariabilitasMdakdiketahuimakadapatmenggunakanmetodejarakataustandardeviasi,dimanametodejarakdigunakanuntuksampelyangbesardansebaliknya.
ì Adaduaspesifikasitunggaldangandadenganduaprosedurbentuk1dan2yangmemberikankeputusansama.
ì Apabilavariabilitasdiketahuimakadapatmemilihmenggunakanspesifikasitunggalataugandadenganbentuk1dan2sebagaipilihannya.
ì Bentuksatuì menggunakannilaijarakataubedastandaryangditunjukkandalam
standardeviasi(antararata-rataprosesdenganbatasspesifikasitertentu)ì nilaiacuanlebihdariatausamadengank,makaprodukditerima
ì Bentukduaì menggunakanperkiraanprosentasecacatyangadadiluarspesifikasiì nilaiacuanlebihkurangdariatausamadenganM,makaprodukditerima
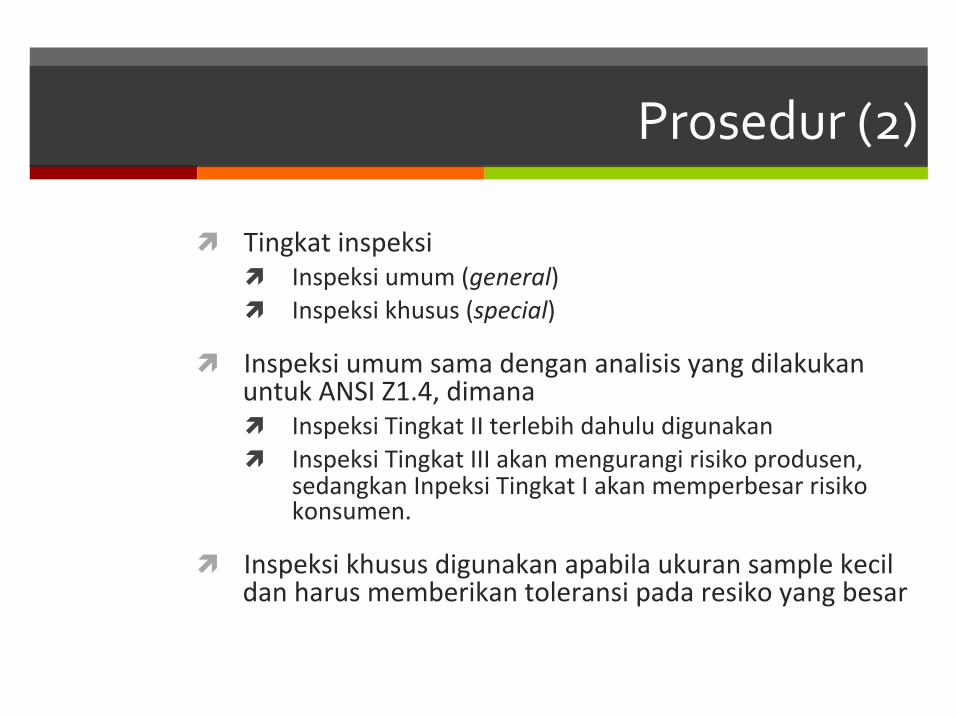
Prosedur(2)
ì Tingkatinspeksiì Inspeksiumum(general)ì Inspeksikhusus(special)
ì InspeksiumumsamadengananalisisyangdilakukanuntukANSIZ1.4,dimanaì InspeksiTingkatIIterlebihdahuludigunakanì InspeksiTingkatIIIakanmengurangirisikoprodusen,
sedangkanInpeksiTingkatIakanmemperbesarrisikokonsumen.
ì Inspeksikhususdigunakanapabilaukuransamplekecildanharusmemberikantoleransipadaresikoyangbesar
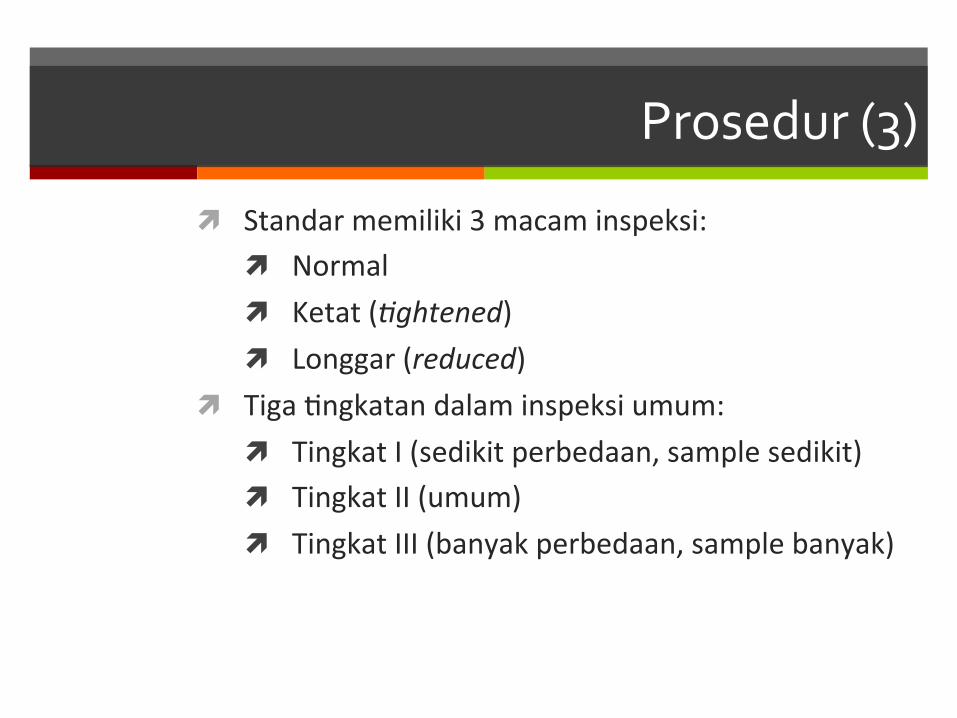
Prosedur(3)
ì Standarmemiliki3macaminspeksi:ì Normalì Ketat(5ghtened)ì Longgar(reduced)
ì TigaMngkatandalaminspeksiumum:ì TingkatI(sedikitperbedaan,samplesedikit)ì TingkatII(umum)ì TingkatIII(banyakperbedaan,samplebanyak)
LangkahPerhitunganANSI/ASQCZ1.9
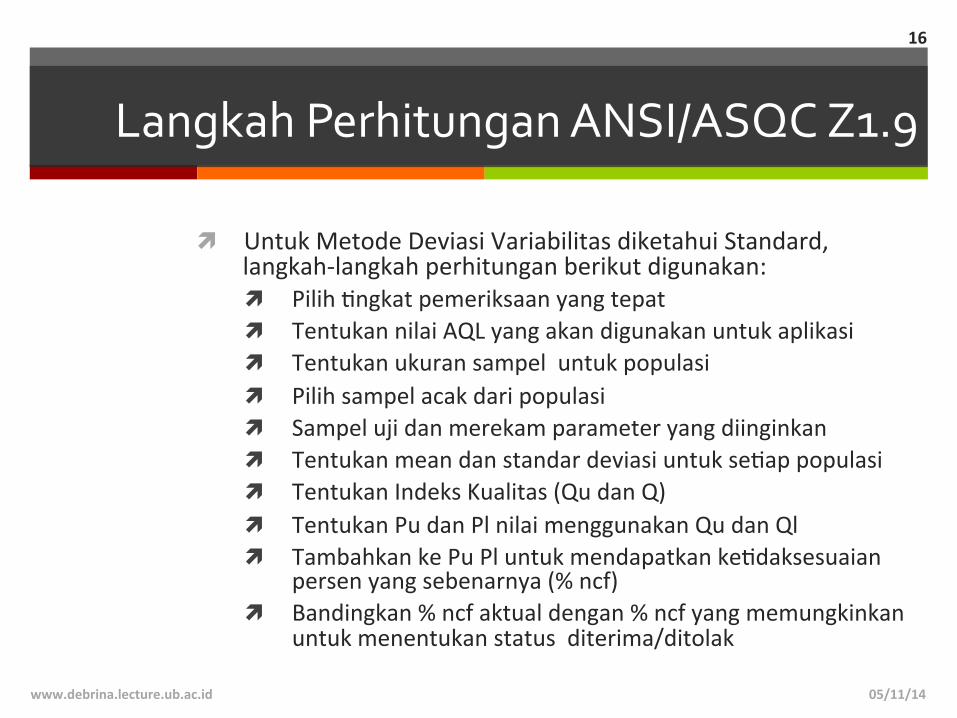
ì UntukMetodeDeviasiVariabilitasdiketahuiStandard,langkah-langkahperhitunganberikutdigunakan:ì PilihMngkatpemeriksaanyangtepatì TentukannilaiAQLyangakandigunakanuntukaplikasiì Tentukanukuransampeluntukpopulasiì Pilihsampelacakdaripopulasiì Sampelujidanmerekamparameteryangdiinginkanì TentukanmeandanstandardeviasiuntukseMappopulasiì TentukanIndeksKualitas(QudanQ)ì TentukanPudanPlnilaimenggunakanQudanQlì TambahkankePuPluntukmendapatkankeMdaksesuaian
persenyangsebenarnya(%ncf)ì Bandingkan%ncfaktualdengan%ncfyangmemungkinkan
untukmenentukanstatusditerima/ditolak
05/11/14www.debrina.lecture.ub.ac.id
16
05/11/14www.debrina.lecture.ub.ac.id
17
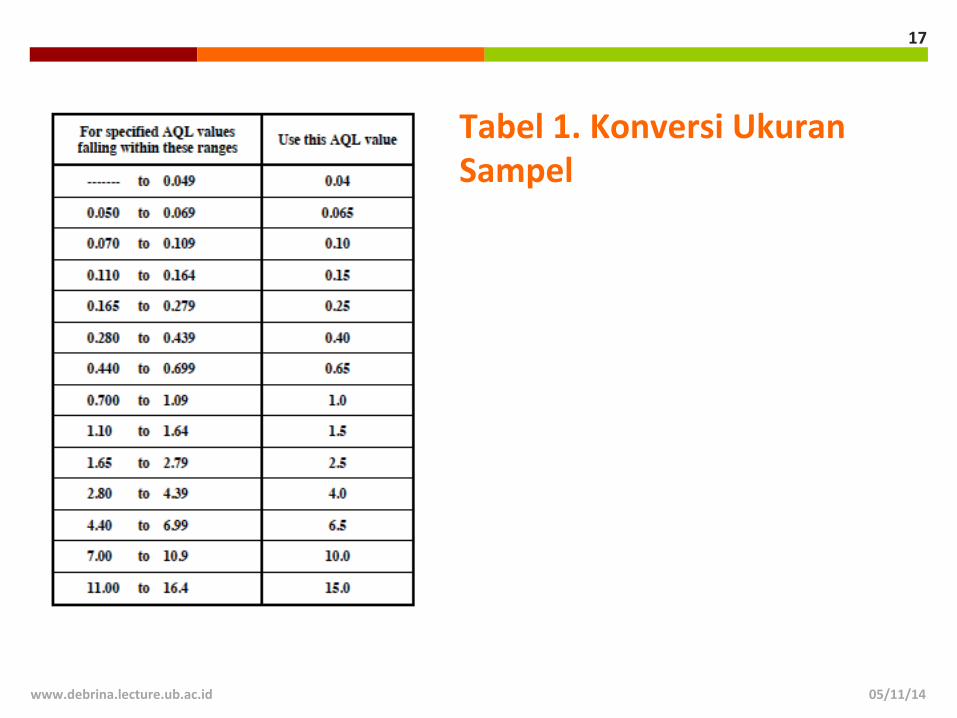
Tabel1.KonversiUkuranSampel
05/11/14www.debrina.lecture.ub.ac.id
18
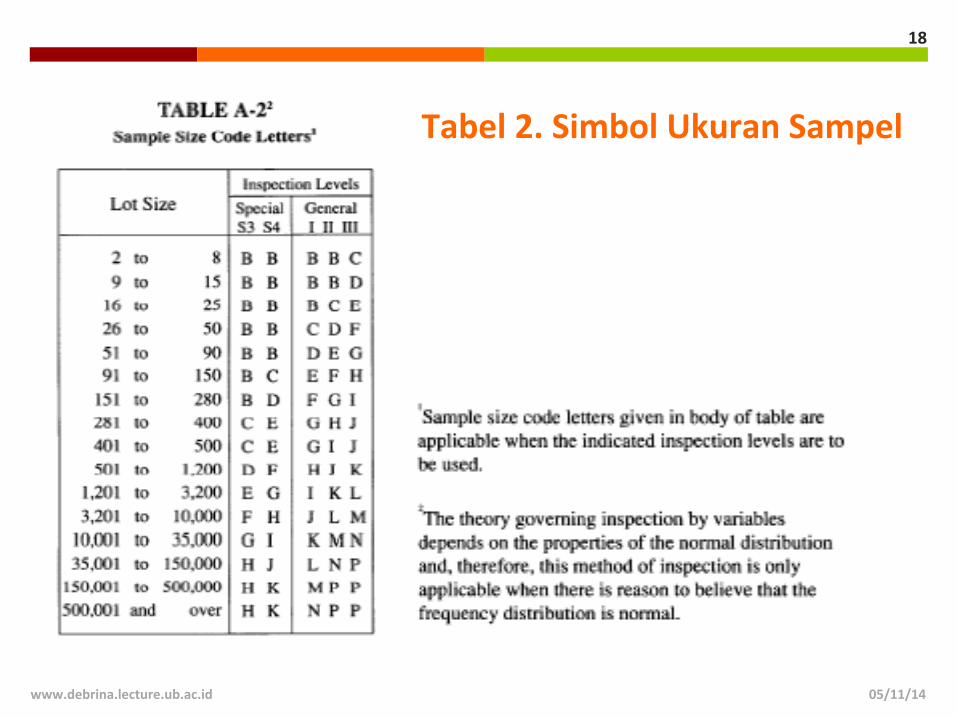
Tabel2.SimbolUkuranSampel
05/11/14www.debrina.lecture.ub.ac.id
19
05/11/14www.debrina.lecture.ub.ac.id
20
ANSI/ASQCZ1.9CalculationsForStandardDeviationMethod
ì DeterminethemeanandthestandarddeviaMonforthesampleresults.
ì DetermineQualityIndexesì Qu=(UpperLimit-mean)/standarddeviaMonì Ql=(mean-LowerLimit)/standarddeviaMon
ì UpperLimitisnormally102,andLowerLimitisnormally98.
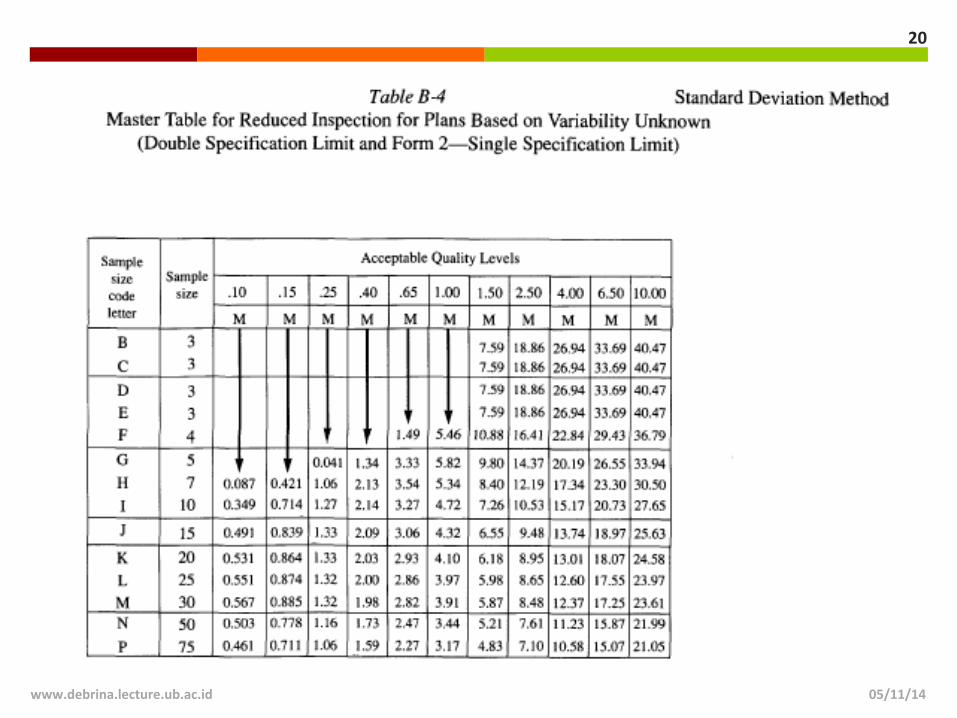
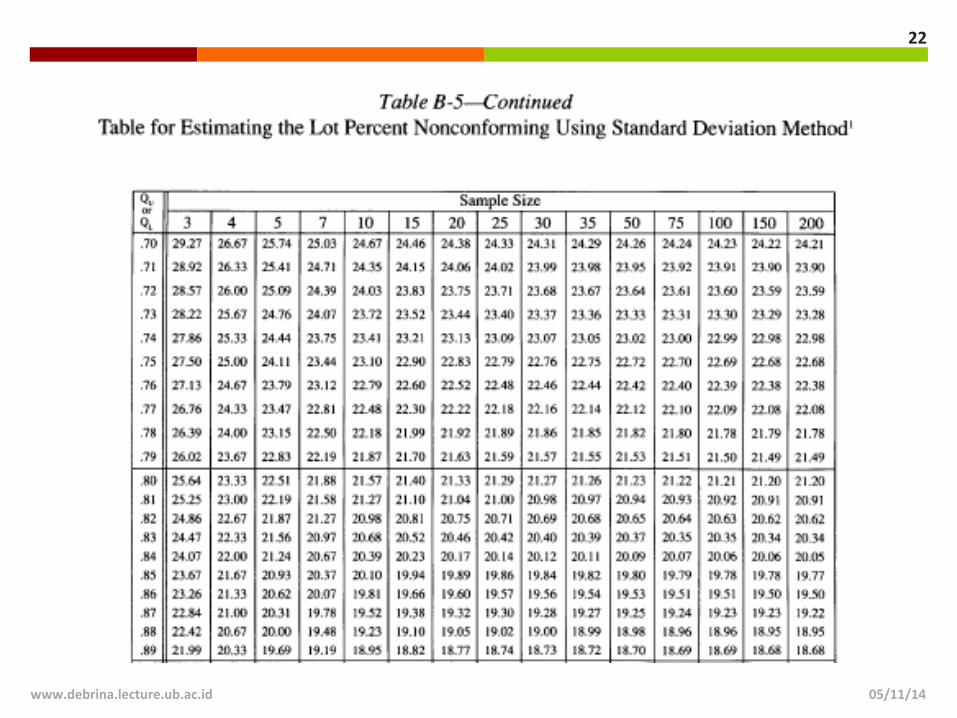
ì UseQuandQltodetermineesMmateofpercentnonconformanceabovetheUpperLimit(Pu)andbelowtheLowerLimit(Pl)usingTableB-5.
05/11/14www.debrina.lecture.ub.ac.id
21
05/11/14www.debrina.lecture.ub.ac.id
22
ANSI/ASQCZ1.9CalculationsForStandardDeviationMethod
ì WiththevaluesofPuandPldeterminedfromTableB-5usingQuandQl,esMmatedpercentnonconformanceequalstoPuplusPl.(%ncf=Pu+Pl)
ì AcceptanceisbasedonwhethertheesMmatedpercentnonconformanceisbelowtheallowedpercentnonconformancegiveninTableB-3.
05/11/14www.debrina.lecture.ub.ac.id
23
ANSI/ASQCZ1.9AcceptableQualityLevel(AQL’s)
ì AQListhemaximumpercentnonconformingthat,forpurposesofsamplinginspecMon,canbeconsideredsaMsfactoryasaprocessaverage.
ì ForANSI/ASQCZ1.9,AQL’svaryfrom0.10to10.00with11pre-definedAQLvalues.
ì ForusewithelectricmetertesMng,eitherin-servicetesMngorreceiptinspecMon,AQL’sof0.25to2.50arenormallyuMlized.
05/11/14www.debrina.lecture.ub.ac.id
24
RencanaPenerimaanSampelLainuntukDataVariabel
ì Berkaitandengankualitasrata-rataatauvariabilitaspadakualitasprodukdanbukandenganpresentasekeMdaksesuaian.
ì Contoh:variabelhilangnyaenergipadapengganMankekuatan.
ì Teknikyangbisadigunakan:ì Petapengendalipenerimaan(AcceptanceControlChart)ì Pengambilansampelberurutanuntukdatavariabel
(Sequen5alSamplingbyVariables)ì PengujianHipotesis(HypothesisTes5ng)ì Lot-PlotMethodì ShaininLotPlotPlan
05/11/14www.debrina.lecture.ub.ac.id
25
PlanstoControlProcessFractionDefective
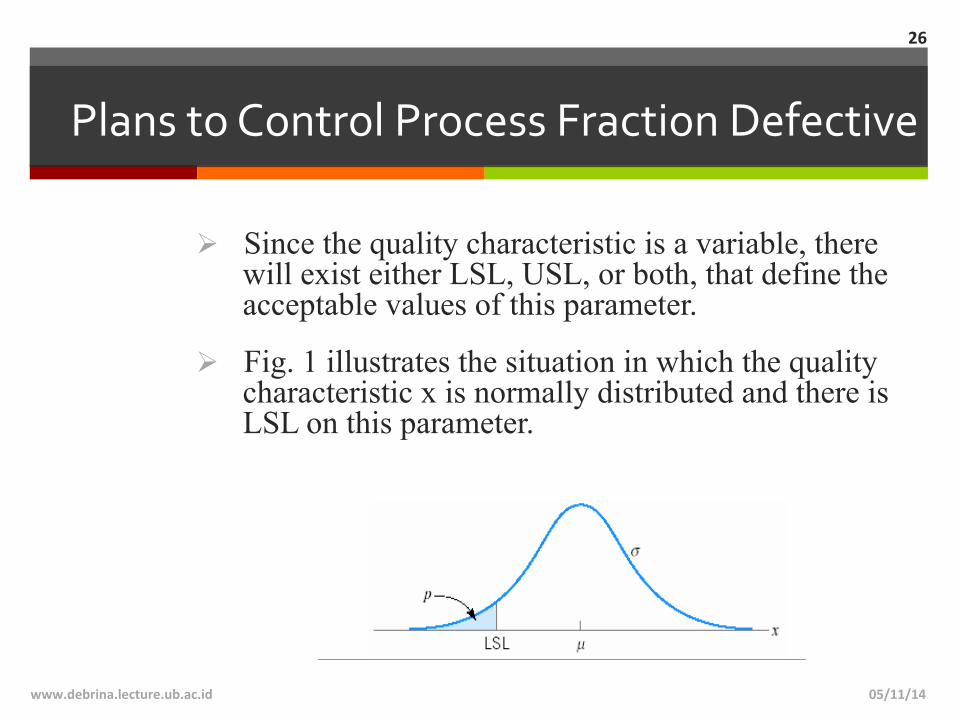
Ø Since the quality characteristic is a variable, there will exist either LSL, USL, or both, that define the acceptable values of this parameter.
Ø Fig. 1 illustrates the situation in which the quality characteristic x is normally distributed and there is LSL on this parameter.
05/11/14www.debrina.lecture.ub.ac.id
26
PlanstoControlProcessFractionDefective
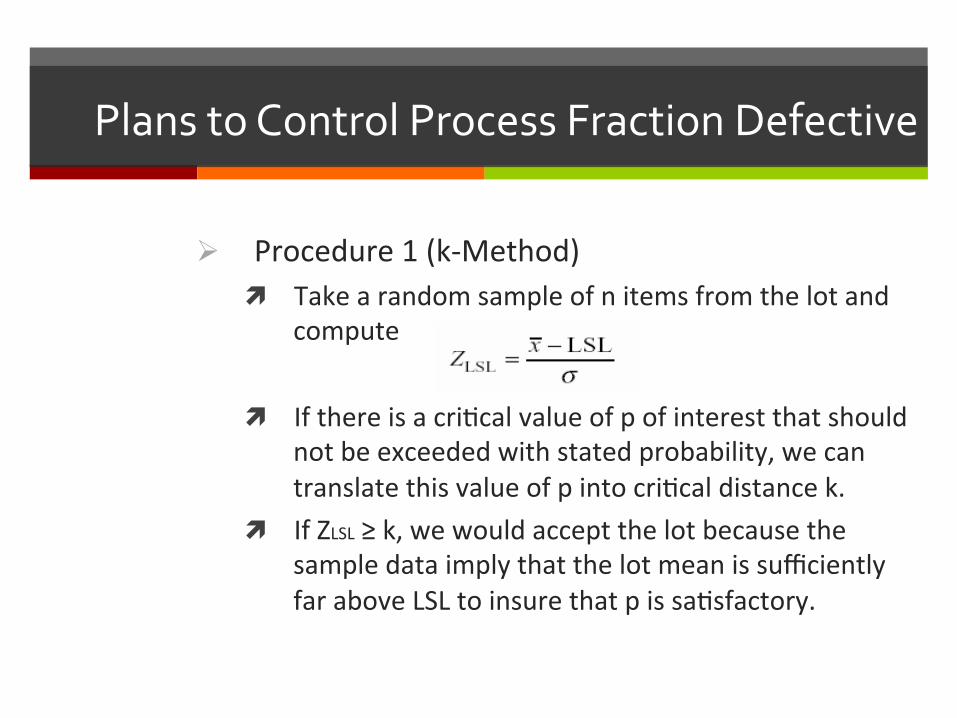
Ø Procedure1(k-Method)ì Takearandomsampleofnitemsfromthelotand
computeì IfthereisacriMcalvalueofpofinterestthatshould
notbeexceededwithstatedprobability,wecantranslatethisvalueofpintocriMcaldistancek.
ì IfZLSL≥k,wewouldacceptthelotbecausethesampledataimplythatthelotmeanissufficientlyfaraboveLSLtoinsurethatpissaMsfactory.
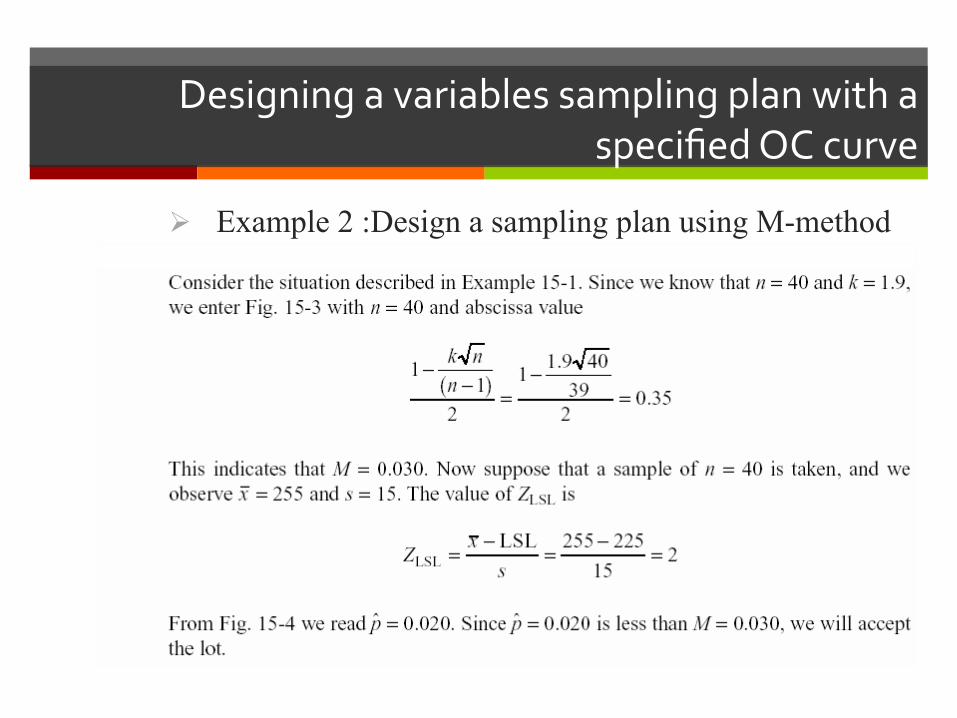
PlanstoControlProcessFractionDefective
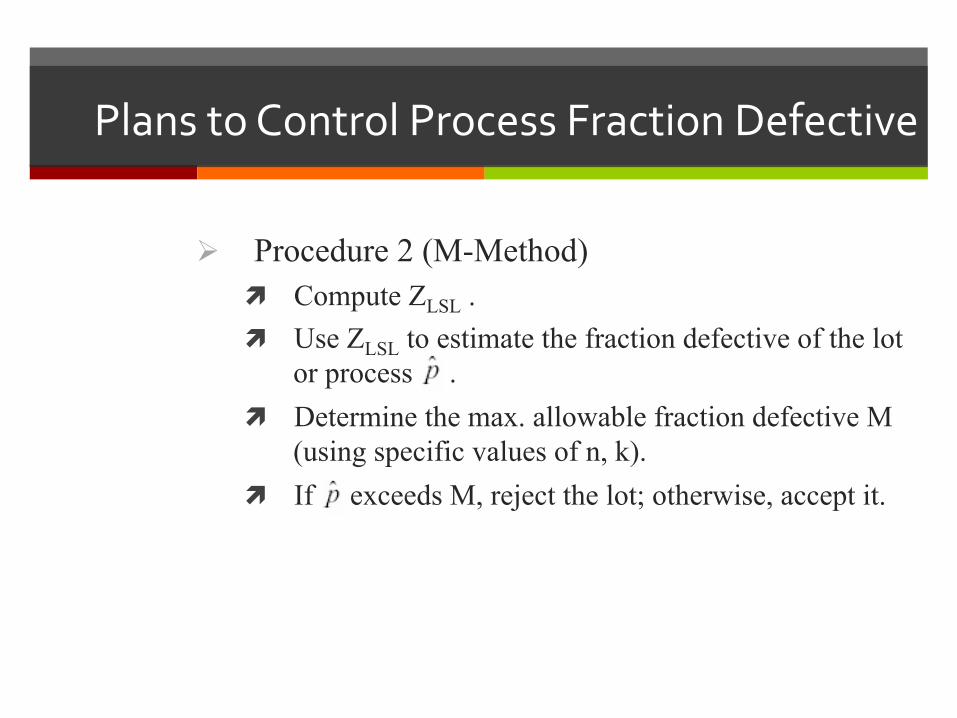
Ø Procedure 2 (M-Method) ì Compute ZLSL . ì Use ZLSL to estimate the fraction defective of the lot
or process . ì Determine the max. allowable fraction defective M
(using specific values of n, k). ì If exceeds M, reject the lot; otherwise, accept it.
PlanstoControlProcessFractionDefective
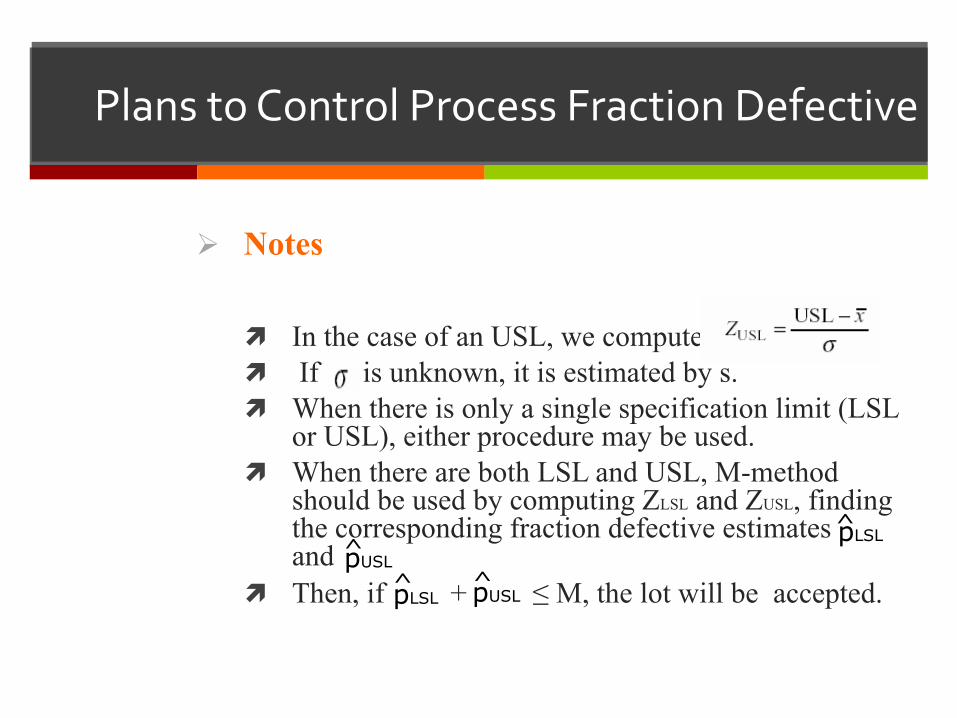
Ø Notes
ì In the case of an USL, we compute ì If is unknown, it is estimated by s. ì When there is only a single specification limit (LSL
or USL), either procedure may be used. ì When there are both LSL and USL, M-method
should be used by computing ZLSL and ZUSL, finding the corresponding fraction defective estimates and
ì Then, if + ≤ M, the lot will be accepted. ^ ^
pLSL pUSL
pLSL pUSL
^^
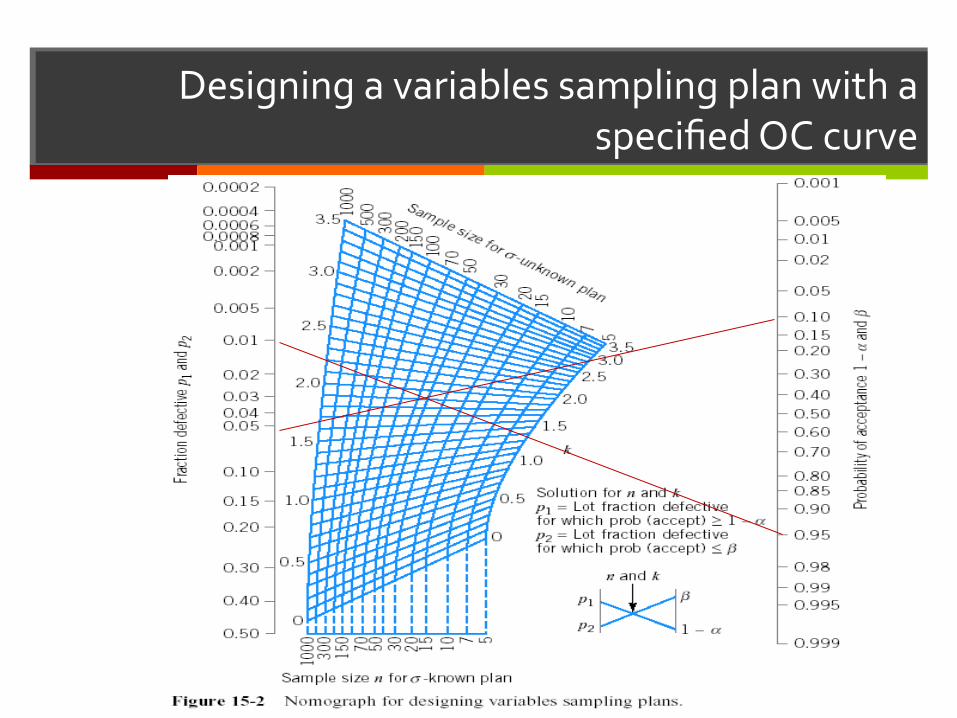
DesigningavariablessamplingplanwithaspecifiedOCcurve
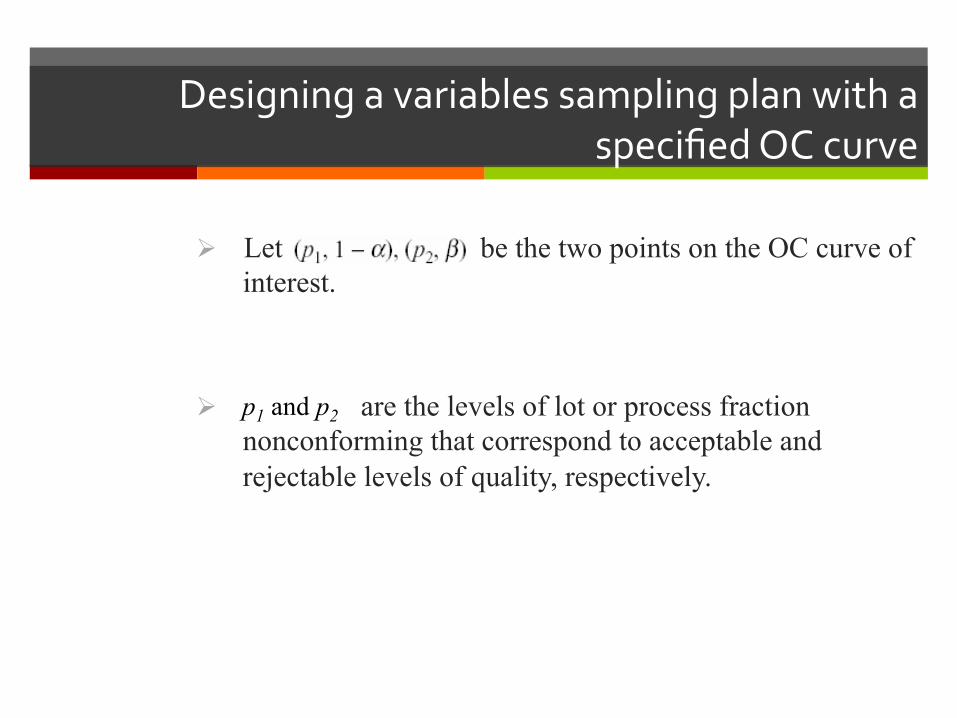
Ø Let be the two points on the OC curve of interest.
Ø are the levels of lot or process fraction nonconforming that correspond to acceptable and rejectable levels of quality, respectively.
p1 and p2
DesigningavariablessamplingplanwithaspecifiedOCcurve
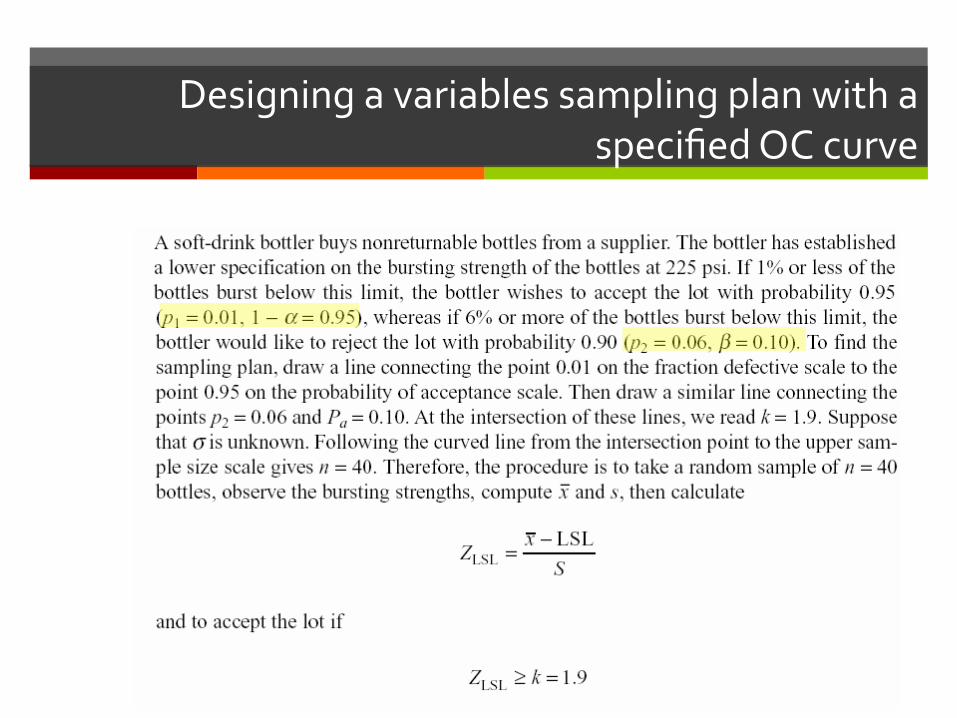
Ø Example 1
DesigningavariablessamplingplanwithaspecifiedOCcurve
DesigningavariablessamplingplanwithaspecifiedOCcurve
Ø Example 2 :Design a sampling plan using M-method
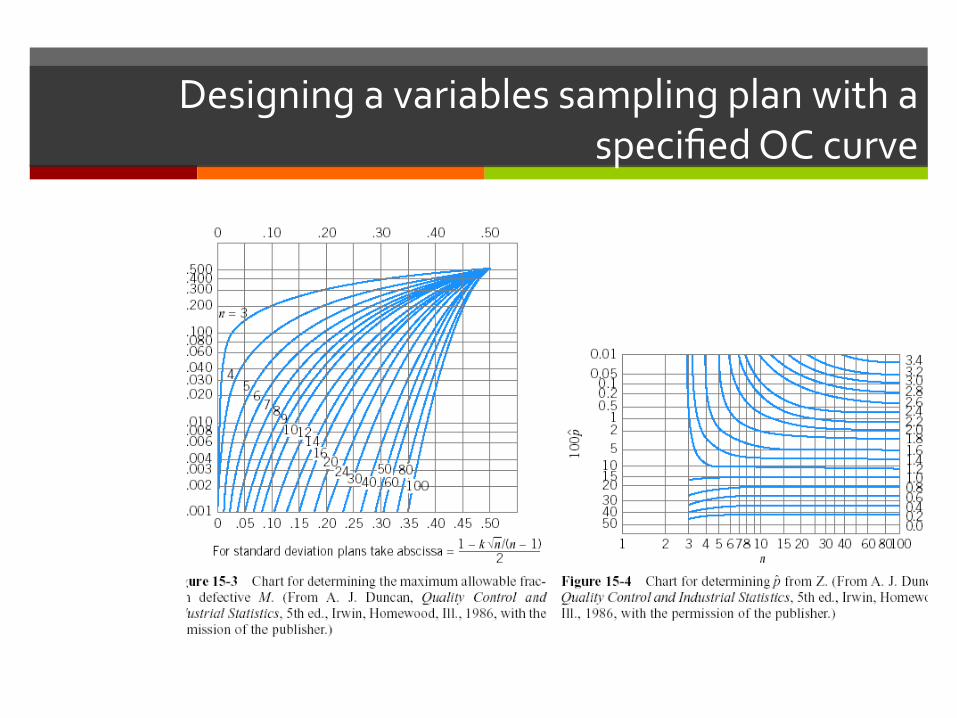
DesigningavariablessamplingplanwithaspecifiedOCcurve
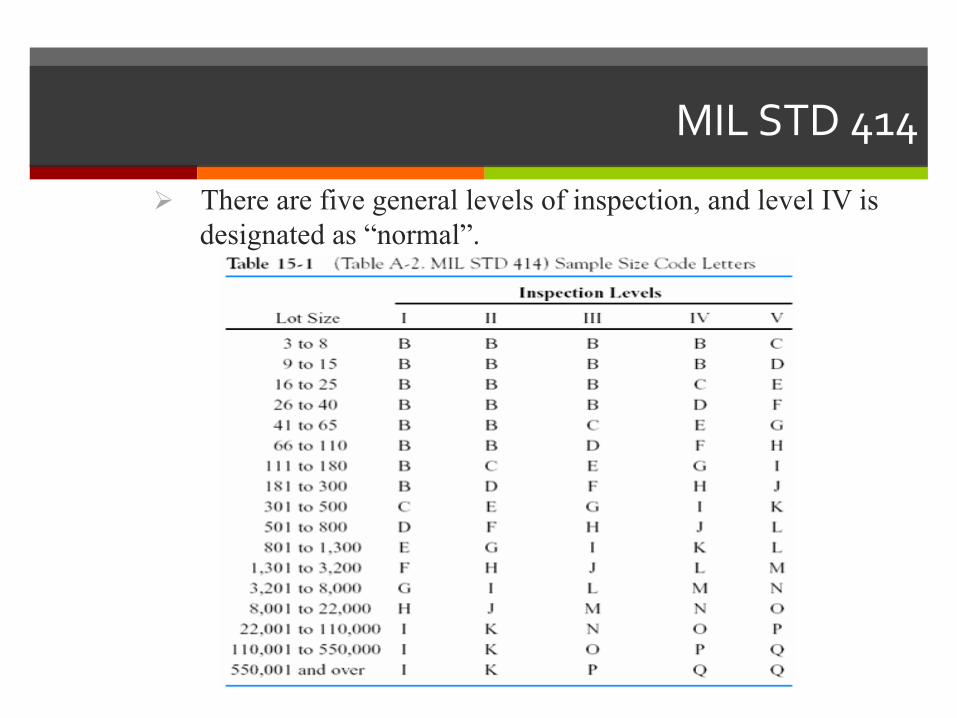
MILSTD414
Ø There are five general levels of inspection, and level IV is designated as “normal”.
MILSTD414
Ø As MIL STD 105E, sample size code letters are used, but the same code letter does not imply the same sample size in both standards.
Ø Sample sizes are a function of the lot size and the inspection level.
Ø All the sampling plans in the standards assume that the quality characteristic is normally distributed.
MILSTD414
Ø Organization of MIL STD 414
MILSTD414
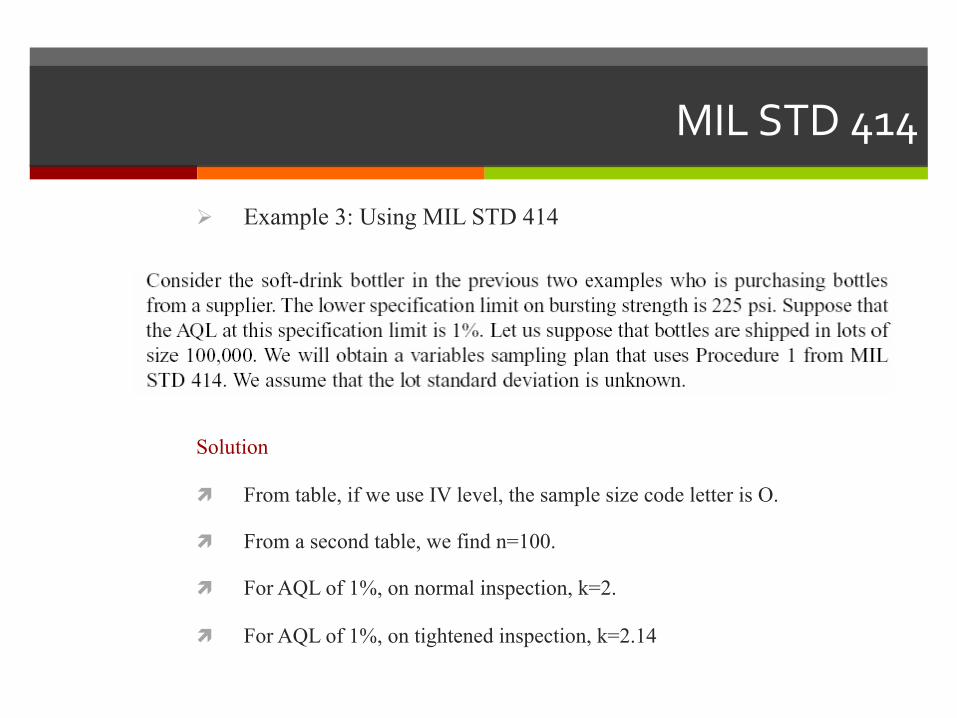
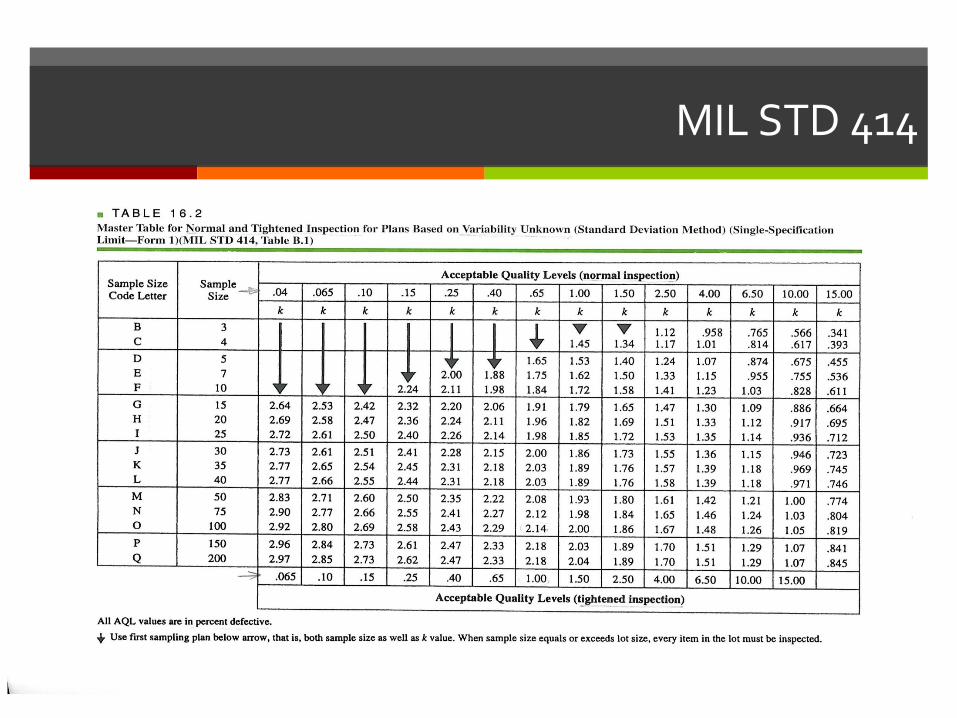
Ø Example 3: Using MIL STD 414
Solution
ì From table, if we use IV level, the sample size code letter is O.
ì From a second table, we find n=100.
ì For AQL of 1%, on normal inspection, k=2.
ì For AQL of 1%, on tightened inspection, k=2.14
MILSTD414
PlanstoControlAProcessMean
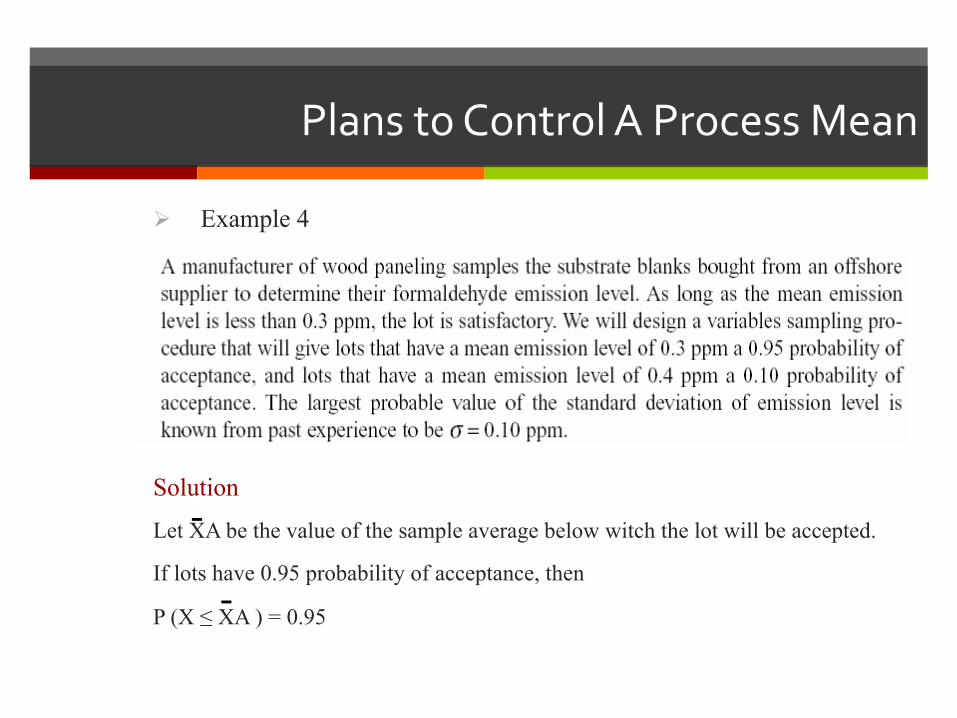
Ø Example 4
Solution
Let XA be the value of the sample average below witch the lot will be accepted.
If lots have 0.95 probability of acceptance, then
P (X ≤ XA ) = 0.95
-
-
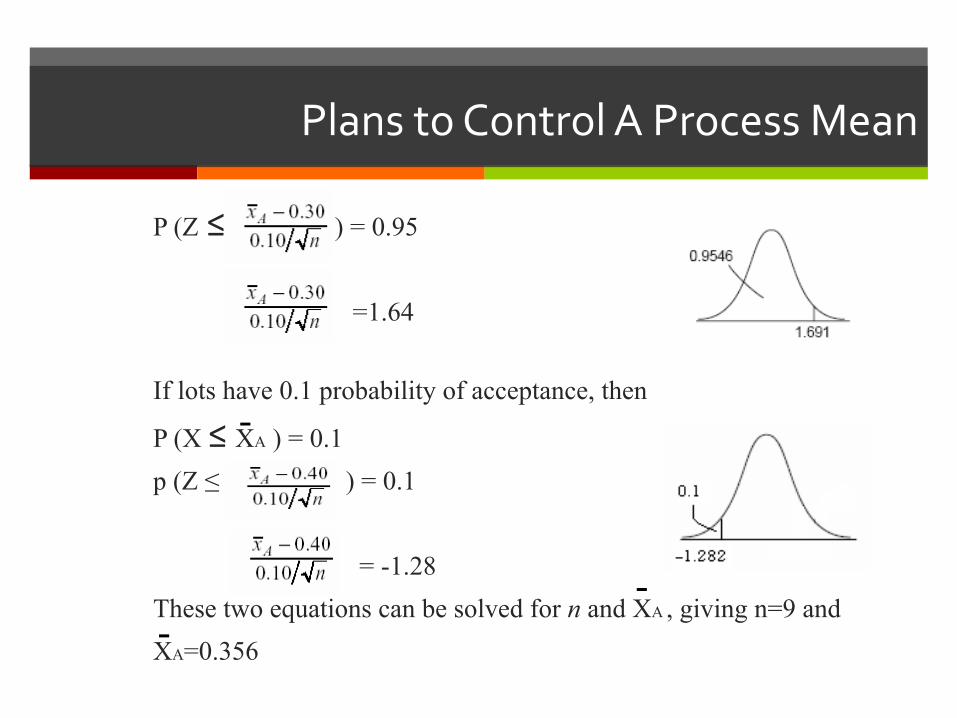
PlanstoControlAProcessMean
P (Z ≤) = 0.95 =1.64
If lots have 0.1 probability of acceptance, then
P (X ≤XA ) = 0.1 p (Z ≤ ) = 0.1 = -1.28 These two equations can be solved for n and XA , giving n=9 and XA=0.356
-
- -