Sidang Akhbar Prestasi Ekonomi Suku Pertama Tahun 2019 · 2 Sidang akhbar akan meliputi Prestasi...
28
Prestasi Ekonomi Suku Pertama Tahun 2019 Gabenor Bank Negara Malaysia 16 Mei 2019 Sidang Akhbar
-
Upload
hoangthien -
Category
Documents
-
view
221 -
download
0
Transcript of Sidang Akhbar Prestasi Ekonomi Suku Pertama Tahun 2019 · 2 Sidang akhbar akan meliputi Prestasi...
Prestasi Ekonomi Suku Pertama Tahun 2019
Gabenor
Bank Negara Malaysia
16 Mei 2019
Sidang Akhbar
2
Sidang akhbar akan meliputi
Prestasi ekonomi pada suku pertama 2019
Perkembangan monetari dan kewangan
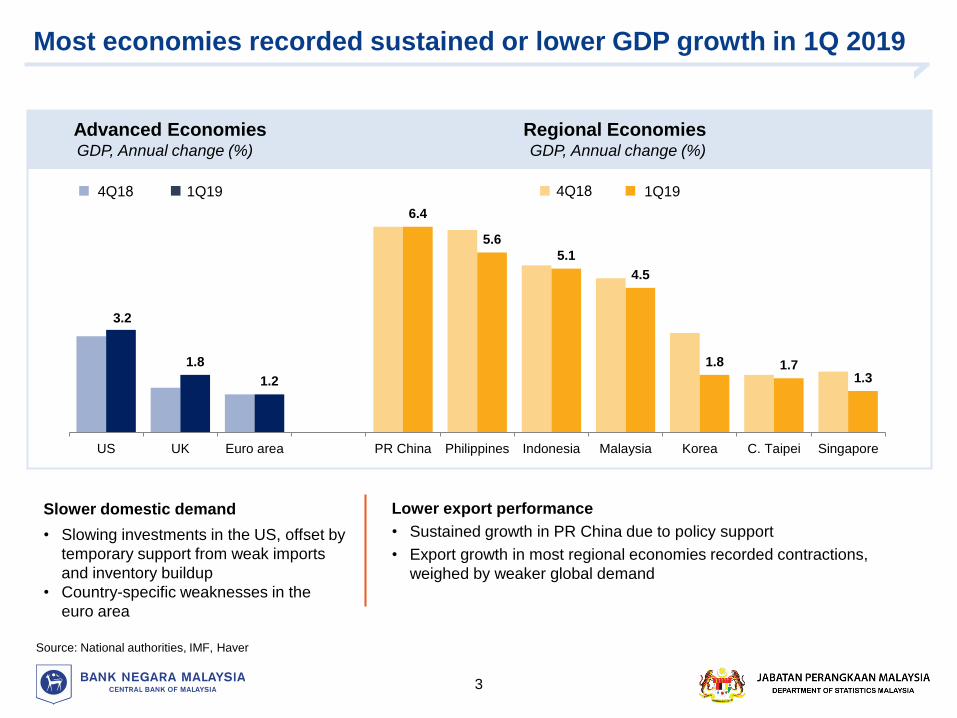
Most economies recorded sustained or lower GDP growth in 1Q 2019
3
Advanced Economies Regional EconomiesGDP, Annual change (%) GDP, Annual change (%)
4Q18 1Q19
Lower export performance
• Sustained growth in PR China due to policy support
• Export growth in most regional economies recorded contractions,
weighed by weaker global demand
Slower domestic demand
• Slowing investments in the US, offset by
temporary support from weak imports
and inventory buildup
• Country-specific weaknesses in the
euro area
4Q18 1Q19
Source: National authorities, IMF, Haver
3.2
1.8
1.2
6.4
5.6
5.1
4.5
1.8 1.71.3
US UK Euro area PR China Philippines Indonesia Malaysia Korea C. Taipei Singapore
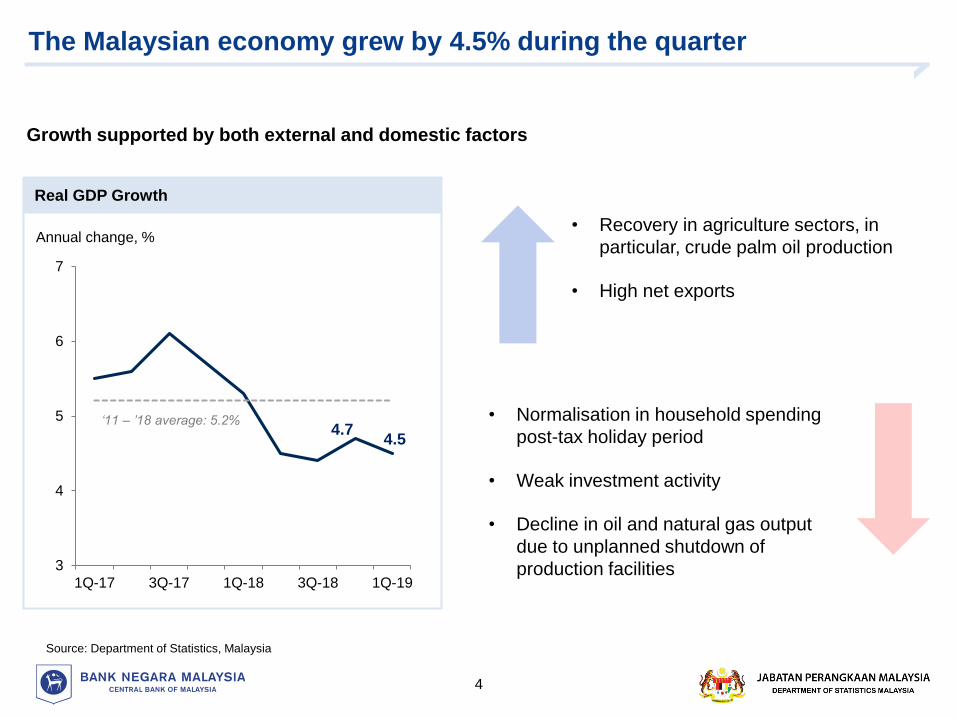
The Malaysian economy grew by 4.5% during the quarter
4
Growth supported by both external and domestic factors
• Normalisation in household spending
post-tax holiday period
• Weak investment activity
• Decline in oil and natural gas output
due to unplanned shutdown of
production facilities
• Recovery in agriculture sectors, in
particular, crude palm oil production
• High net exports
Annual change, %
4.74.5
3
4
5
6
7
1Q-17 3Q-17 1Q-18 3Q-18 1Q-19
‘11 – ’18 average: 5.2%
Real GDP Growth
Source: Department of Statistics, Malaysia
0.23
-0.12
-0.06
0.00
0.40
-0.3
0.0
0.3
0.6
1Q-18 2Q-18 3Q-18 4Q-18 1Q-19
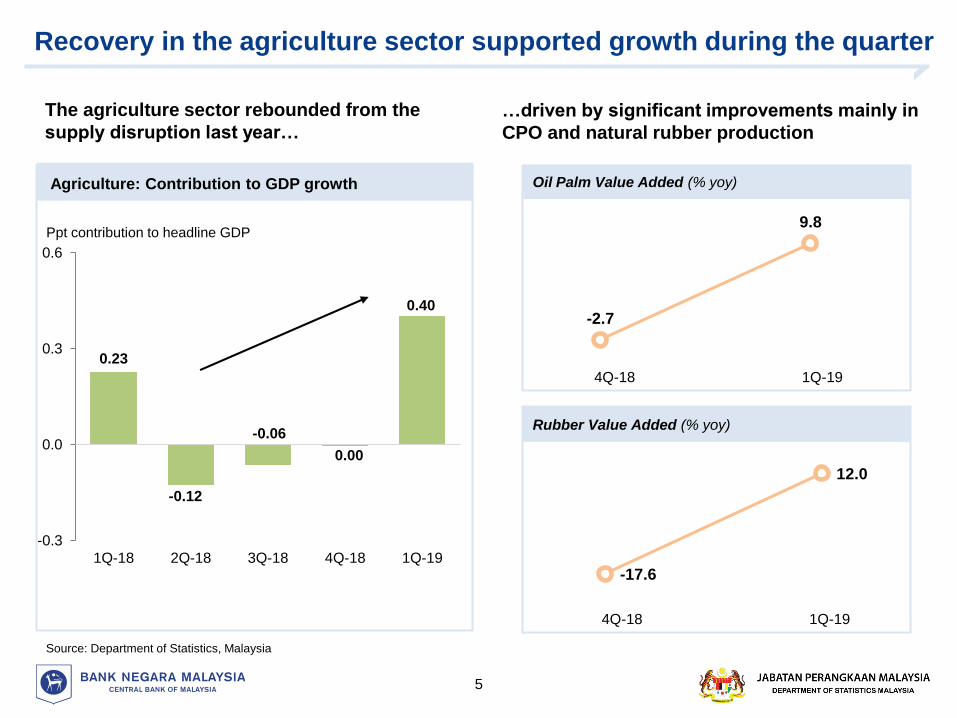
Recovery in the agriculture sector supported growth during the quarter
5
Source: Department of Statistics, Malaysia
Ppt contribution to headline GDP
…driven by significant improvements mainly in
CPO and natural rubber production
The agriculture sector rebounded from the
supply disruption last year…
Agriculture: Contribution to GDP growth
-2.7
9.8
Oil Palm Value Added (% yoy)
4Q-18 1Q-19
Rubber Value Added (% yoy)
4Q-18 1Q-19
-17.6
12.0
-2
0
2
4
6
1Q-18 2Q-18 3Q-18 4Q-18 1Q-19
Agriculture MiningConstruction ManufacturingServices GDP Growth
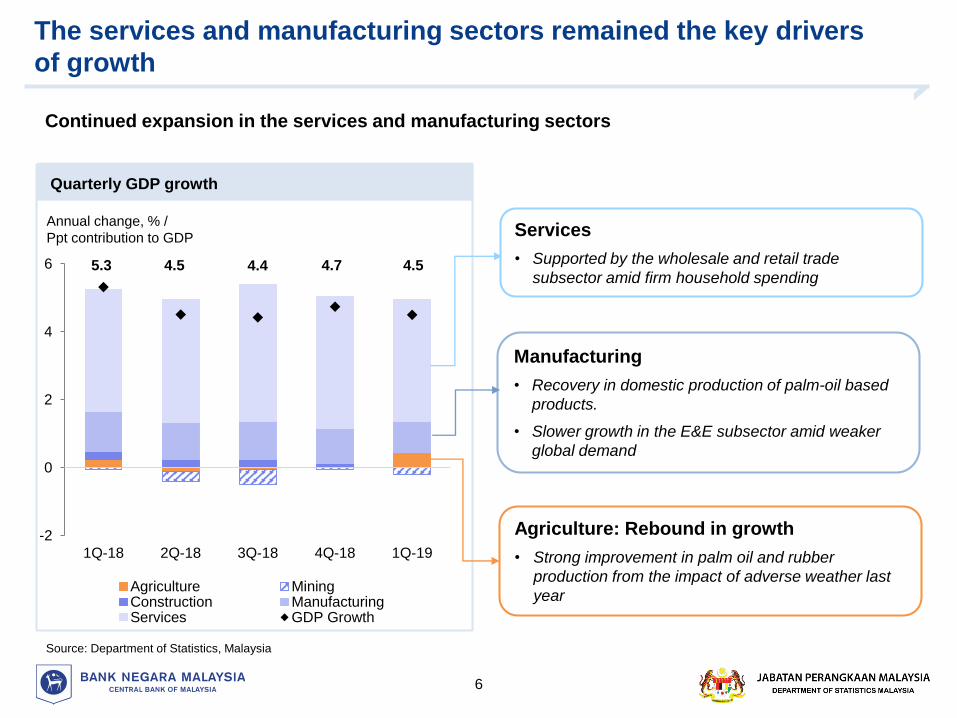
The services and manufacturing sectors remained the key drivers
of growth
6
Source: Department of Statistics, Malaysia
Annual change, % /
Ppt contribution to GDP
Agriculture: Rebound in growth
• Strong improvement in palm oil and rubber
production from the impact of adverse weather last
year
Services
• Supported by the wholesale and retail trade
subsector amid firm household spending
Continued expansion in the services and manufacturing sectors
4.75.3 4.5 4.4
Quarterly GDP growth
4.5
Manufacturing
• Recovery in domestic production of palm-oil based
products.
• Slower growth in the E&E subsector amid weaker
global demand
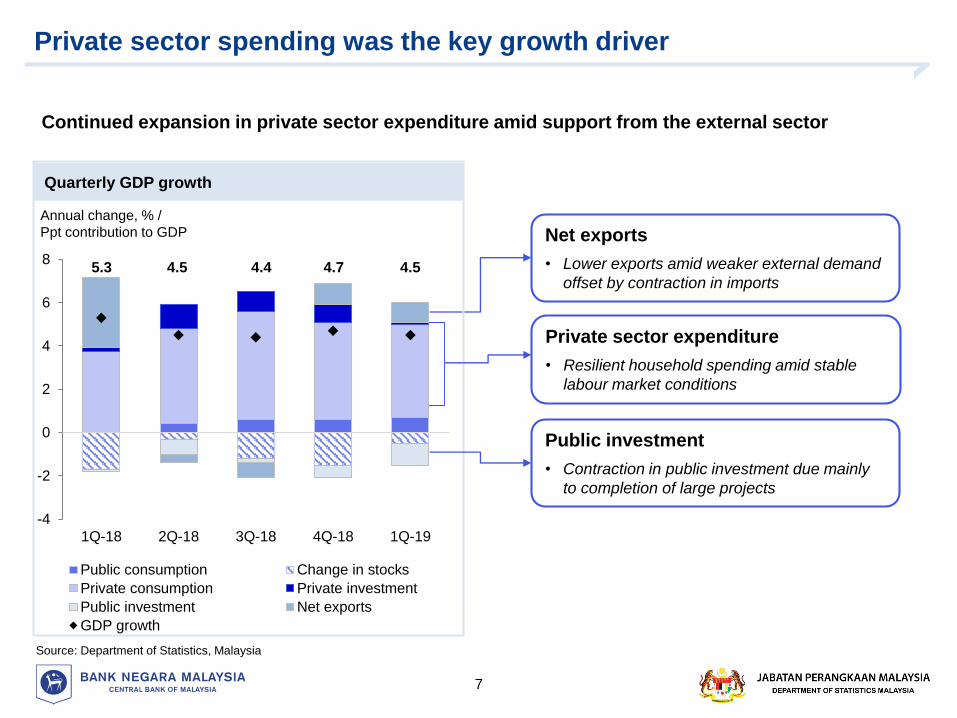
Continued expansion in private sector expenditure amid support from the external sector
Source: Department of Statistics, Malaysia
Private sector spending was the key growth driver
Private sector expenditure
• Resilient household spending amid stable
labour market conditions
Net exports
• Lower exports amid weaker external demand
offset by contraction in imports
Annual change, % /
Ppt contribution to GDP
Quarterly GDP growth
Public investment
• Contraction in public investment due mainly
to completion of large projects
-4
-2
0
2
4
6
8
1Q-18 2Q-18 3Q-18 4Q-18 1Q-19
Public consumption Change in stocks
Private consumption Private investment
Public investment Net exports
GDP growth
5.3 4.5 4.4 4.7 4.5
7
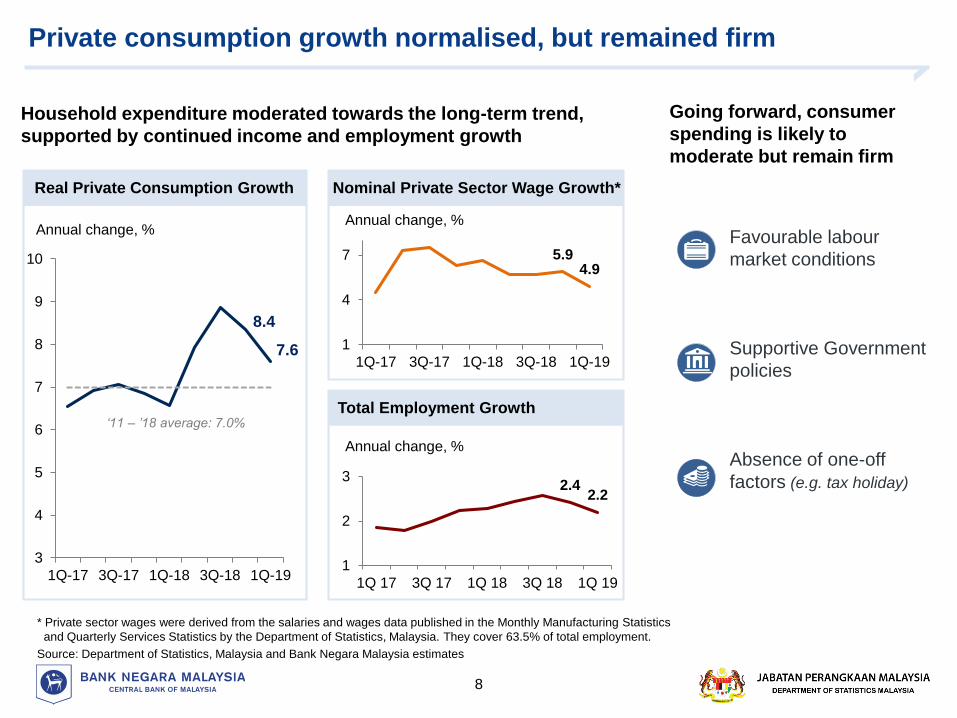
Private consumption growth normalised, but remained firm
8
* Private sector wages were derived from the salaries and wages data published in the Monthly Manufacturing Statistics
and Quarterly Services Statistics by the Department of Statistics, Malaysia. They cover 63.5% of total employment.
Source: Department of Statistics, Malaysia and Bank Negara Malaysia estimates
Household expenditure moderated towards the long-term trend,
supported by continued income and employment growth
Annual change, %
8.4
7.6
3
4
5
6
7
8
9
10
1Q-17 3Q-17 1Q-18 3Q-18 1Q-19
‘11 – ’18 average: 7.0%
Going forward, consumer
spending is likely to
moderate but remain firm
5.94.9
1
4
7
1Q-17 3Q-17 1Q-18 3Q-18 1Q-19
Real Private Consumption Growth
Annual change, %
Nominal Private Sector Wage Growth*
2.42.2
1
2
3
1Q 17 3Q 17 1Q 18 3Q 18 1Q 19
Annual change, %
Total Employment Growth
Favourable labour
market conditions
Supportive Government
policies
Absence of one-off
factors (e.g. tax holiday)
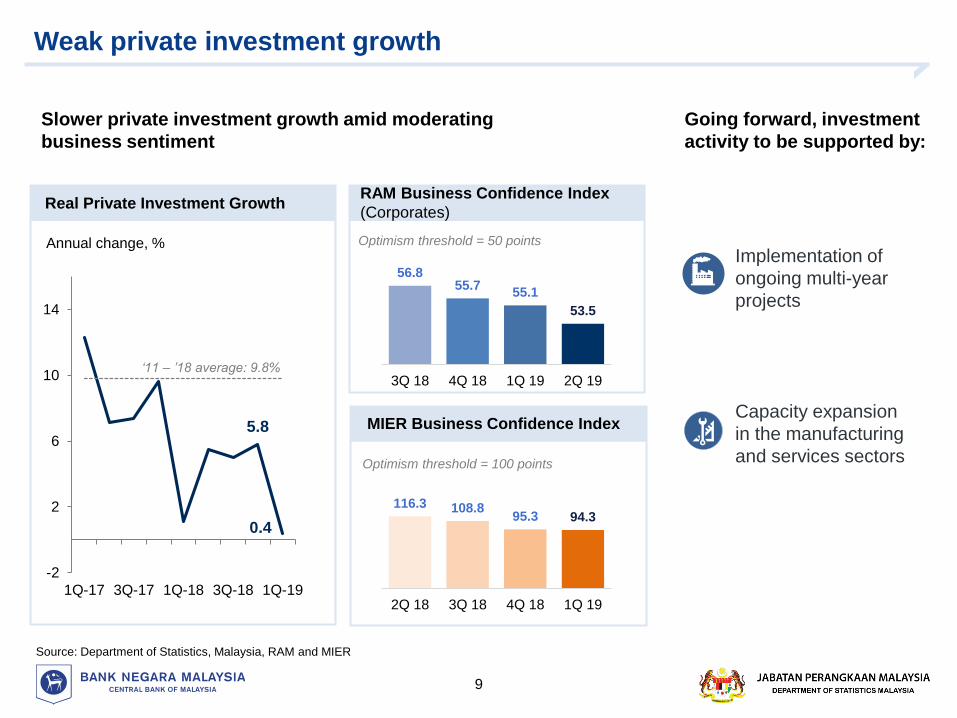
Weak private investment growth
9
5.8
0.4
-2
2
6
10
14
1Q-17 3Q-17 1Q-18 3Q-18 1Q-19
Source: Department of Statistics, Malaysia, RAM and MIER
‘11 – ’18 average: 9.8%
Annual change, %
RAM Business Confidence Index
(Corporates)
Slower private investment growth amid moderating
business sentiment
Real Private Investment Growth
Going forward, investment
activity to be supported by:
Implementation of
ongoing multi-year
projects
Optimism threshold = 50 points
56.855.7
55.1
53.5
3Q 18 4Q 18 1Q 19 2Q 19
MIER Business Confidence Index
116.3 108.895.3 94.3
2Q 18 3Q 18 4Q 18 1Q 19
Optimism threshold = 100 points
Capacity expansion
in the manufacturing
and services sectors
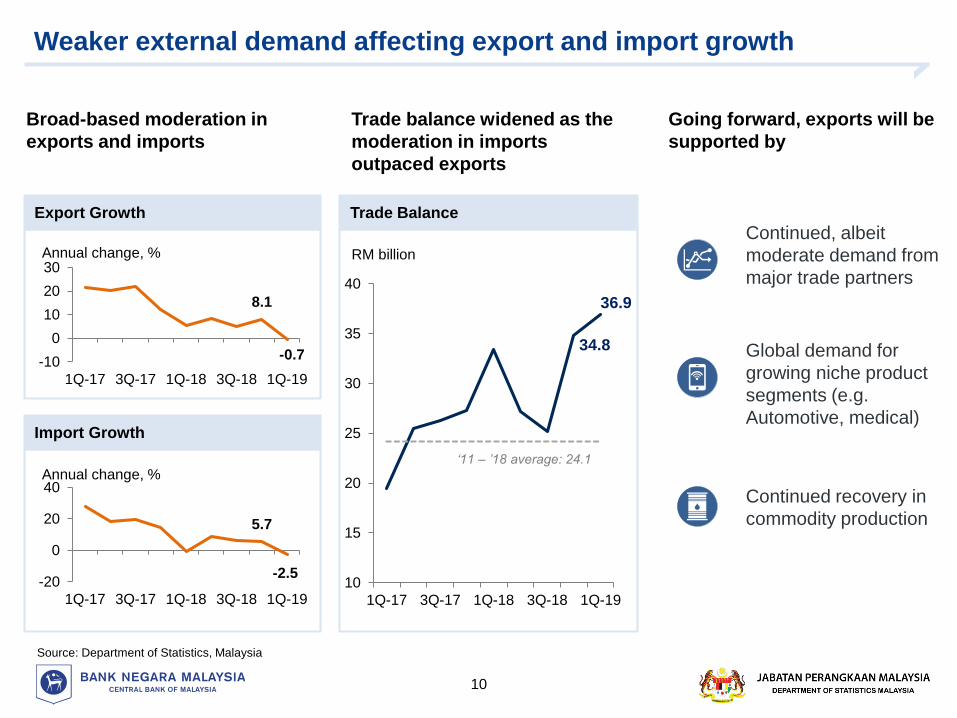
Weaker external demand affecting export and import growth
10
Broad-based moderation in
exports and imports
RM billion
34.8
36.9
10
15
20
25
30
35
40
1Q-17 3Q-17 1Q-18 3Q-18 1Q-19
‘11 – ’18 average: 24.1
Source: Department of Statistics, Malaysia
Going forward, exports will be
supported by
8.1
-0.7-10
0
10
20
30
1Q-17 3Q-17 1Q-18 3Q-18 1Q-19
Trade Balance
Trade balance widened as the
moderation in imports
outpaced exports
Annual change, %
Export Growth
5.7
-2.5-20
0
20
40
1Q-17 3Q-17 1Q-18 3Q-18 1Q-19
Annual change, %
Import Growth
Continued, albeit
moderate demand from
major trade partners
Global demand for
growing niche product
segments (e.g.
Automotive, medical)
Continued recovery in
commodity production
11
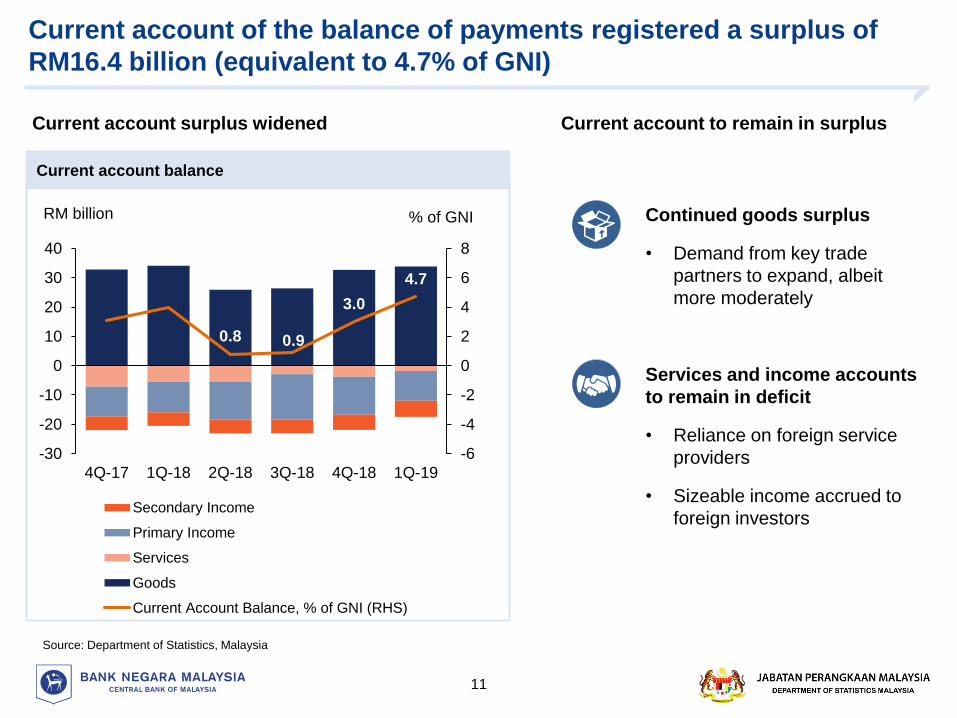
Current account of the balance of payments registered a surplus of
RM16.4 billion (equivalent to 4.7% of GNI)
0.8 0.9
3.0
4.7
-6
-4
-2
0
2
4
6
8
-30
-20
-10
0
10
20
30
40
4Q-17 1Q-18 2Q-18 3Q-18 4Q-18 1Q-19
% of GNIRM billion
Secondary Income
Primary Income
Services
Goods
Current Account Balance, % of GNI (RHS)
Current account to remain in surplus
Continued goods surplus
• Demand from key trade
partners to expand, albeit
more moderately
Services and income accounts
to remain in deficit
• Reliance on foreign service
providers
• Sizeable income accrued to
foreign investors
Source: Department of Statistics, Malaysia
Current account surplus widened
Current account balance
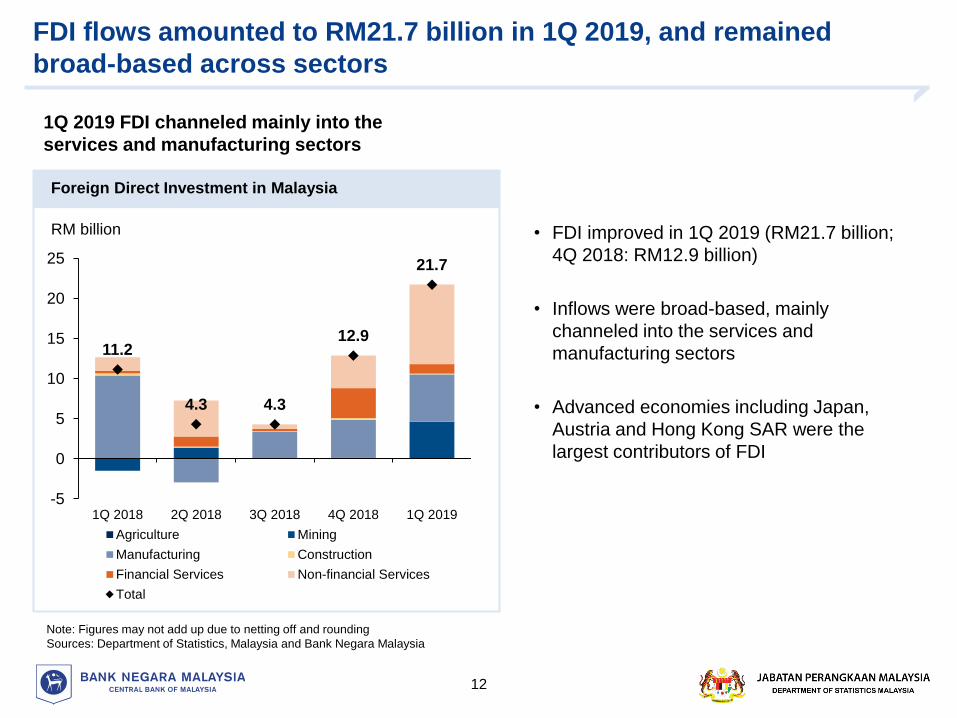
FDI flows amounted to RM21.7 billion in 1Q 2019, and remained
broad-based across sectors
12
Note: Figures may not add up due to netting off and rounding
Sources: Department of Statistics, Malaysia and Bank Negara Malaysia
• FDI improved in 1Q 2019 (RM21.7 billion;
4Q 2018: RM12.9 billion)
• Inflows were broad-based, mainly
channeled into the services and
manufacturing sectors
• Advanced economies including Japan,
Austria and Hong Kong SAR were the
largest contributors of FDI
1Q 2019 FDI channeled mainly into the
services and manufacturing sectors
Foreign Direct Investment in Malaysia
RM billion
11.2
4.3 4.3
12.9
21.7
-5
0
5
10
15
20
25
1Q 2018 2Q 2018 3Q 2018 4Q 2018 1Q 2019
Agriculture Mining
Manufacturing Construction
Financial Services Non-financial Services
Total
Monetary and Financial Developments
13
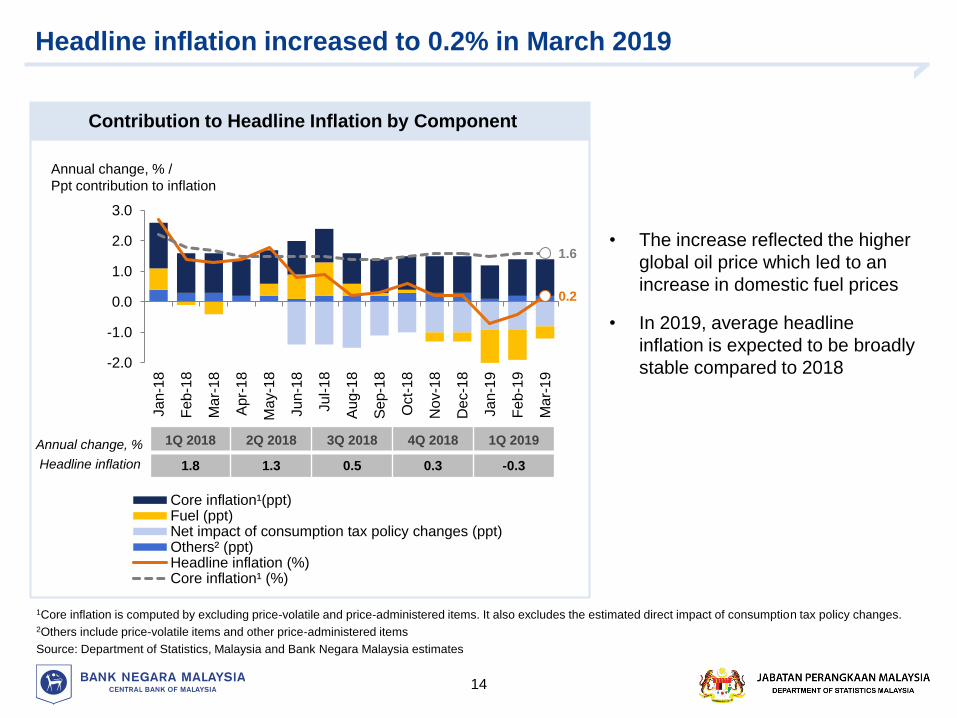
Headline inflation increased to 0.2% in March 2019
14
1Core inflation is computed by excluding price-volatile and price-administered items. It also excludes the estimated direct impact of consumption tax policy changes.2Others include price-volatile items and other price-administered items
Source: Department of Statistics, Malaysia and Bank Negara Malaysia estimates
Annual change, % /
Ppt contribution to inflation
0.2
1.6
-2.0
-1.0
0.0
1.0
2.0
3.0
Ja
n-1
8
Fe
b-1
8
Ma
r-1
8
Ap
r-1
8
Ma
y-1
8
Ju
n-1
8
Ju
l-1
8
Au
g-1
8
Se
p-1
8
Oct-
18
No
v-1
8
Dec-1
8
Ja
n-1
9
Fe
b-1
9
Ma
r-1
9
Core inflation¹(ppt)Fuel (ppt)Net impact of consumption tax policy changes (ppt)Others² (ppt)Headline inflation (%)Core inflation¹ (%)
Contribution to Headline Inflation by Component
• The increase reflected the higher
global oil price which led to an
increase in domestic fuel prices
• In 2019, average headline
inflation is expected to be broadly
stable compared to 2018
1Q 2018 2Q 2018 3Q 2018 4Q 2018 1Q 2019
1.8 1.3 0.5 0.3 -0.3Headline inflation
Annual change, %
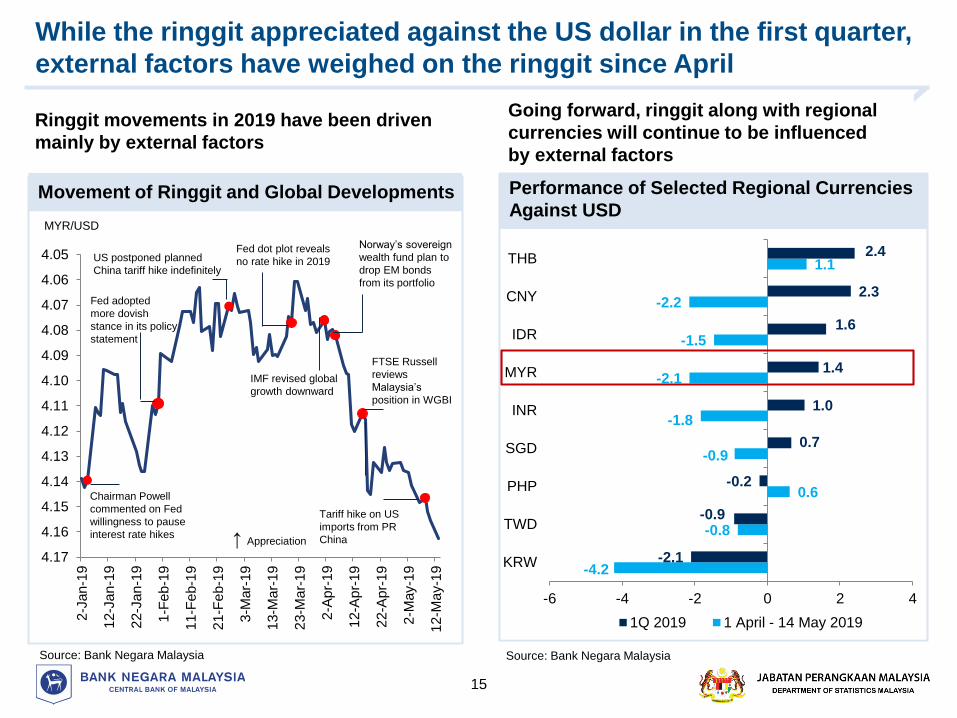
While the ringgit appreciated against the US dollar in the first quarter,
external factors have weighed on the ringgit since April
15
Ringgit movements in 2019 have been driven
mainly by external factors
4.05
4.06
4.07
4.08
4.09
4.10
4.11
4.12
4.13
4.14
4.15
4.16
4.17
2-J
an
-19
12-J
an
-19
22-J
an
-19
1-F
eb
-19
11-F
eb-1
9
21-F
eb-1
9
3-M
ar-
19
13-M
ar-
19
23-M
ar-
19
2-A
pr-
19
12-A
pr-
19
22-A
pr-
19
2-M
ay-1
9
12-M
ay-1
9
Fed adopted
more dovish
stance in its policy
statement
Fed dot plot reveals
no rate hike in 2019
FTSE Russell
reviews
Malaysia’s
position in WGBI
IMF revised global
growth downward
US postponed planned
China tariff hike indefinitely
Chairman Powell
commented on Fed
willingness to pause
interest rate hikes ↑ Appreciation
Tariff hike on US
imports from PR
China
Going forward, ringgit along with regional
currencies will continue to be influenced
by external factors
Source: Bank Negara Malaysia
Norway’s sovereign
wealth fund plan to
drop EM bonds
from its portfolio
Movement of Ringgit and Global Developments
MYR/USD
Performance of Selected Regional Currencies
Against USD
-4.2
-0.8
0.6
-0.9
-1.8
-2.1
-1.5
-2.2
1.1
-2.1
-0.9
-0.2
0.7
1.0
1.4
1.6
2.3
2.4
-6 -4 -2 0 2 4
KRW
TWD
PHP
SGD
INR
MYR
IDR
CNY
THB
1Q 2019 1 April - 14 May 2019
Source: Bank Negara Malaysia
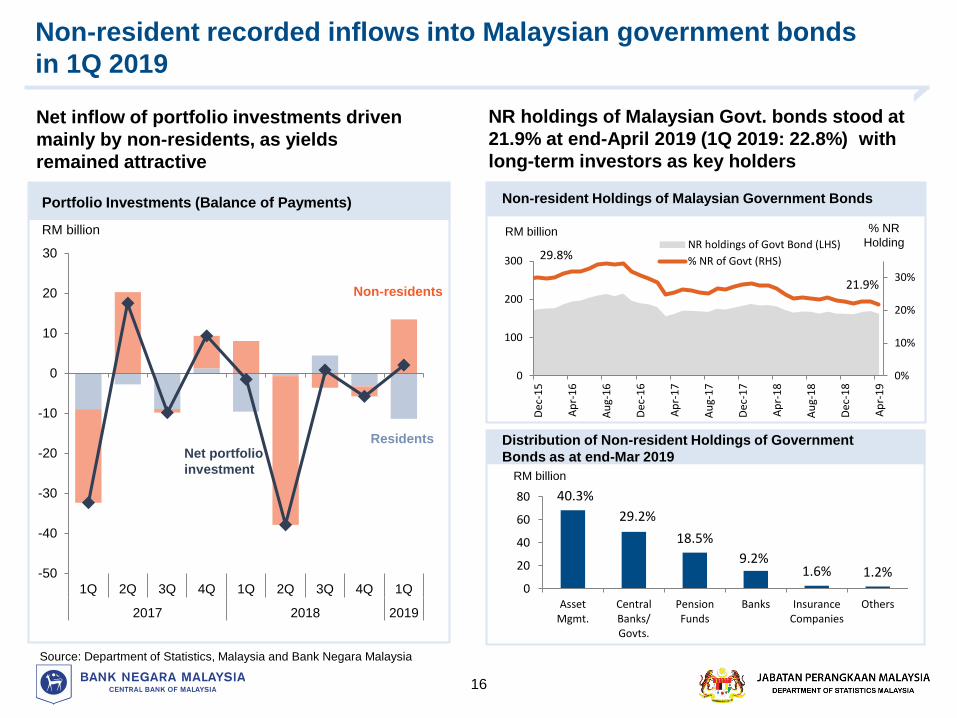
Non-resident recorded inflows into Malaysian government bonds
in 1Q 2019
16
Net inflow of portfolio investments driven
mainly by non-residents, as yields
remained attractive
Source: Department of Statistics, Malaysia and Bank Negara Malaysia
RM billion
Residents
Non-residents
Net portfolio
investment
40.3%
29.2%
18.5%
9.2%1.6% 1.2%
0
20
40
60
80
AssetMgmt.
CentralBanks/Govts.
PensionFunds
Banks InsuranceCompanies
Others
RM billion
Portfolio Investments (Balance of Payments)
Distribution of Non-resident Holdings of Government
Bonds as at end-Mar 2019
-50
-40
-30
-20
-10
0
10
20
30
1Q 2Q 3Q 4Q 1Q 2Q 3Q 4Q 1Q
2017 2018 2019
NR holdings of Malaysian Govt. bonds stood at
21.9% at end-April 2019 (1Q 2019: 22.8%) with
long-term investors as key holders
21.9%
0%
10%
20%
30%
0
100
200
300
Dec
-15
Ap
r-1
6
Au
g-1
6
Dec
-16
Ap
r-1
7
Au
g-1
7
Dec
-17
Ap
r-1
8
Au
g-1
8
Dec
-18
Ap
r-1
9
NR holdings of Govt Bond (LHS)
% NR of Govt (RHS)29.8%
RM billion % NR
Holding
Non-resident Holdings of Malaysian Government Bonds
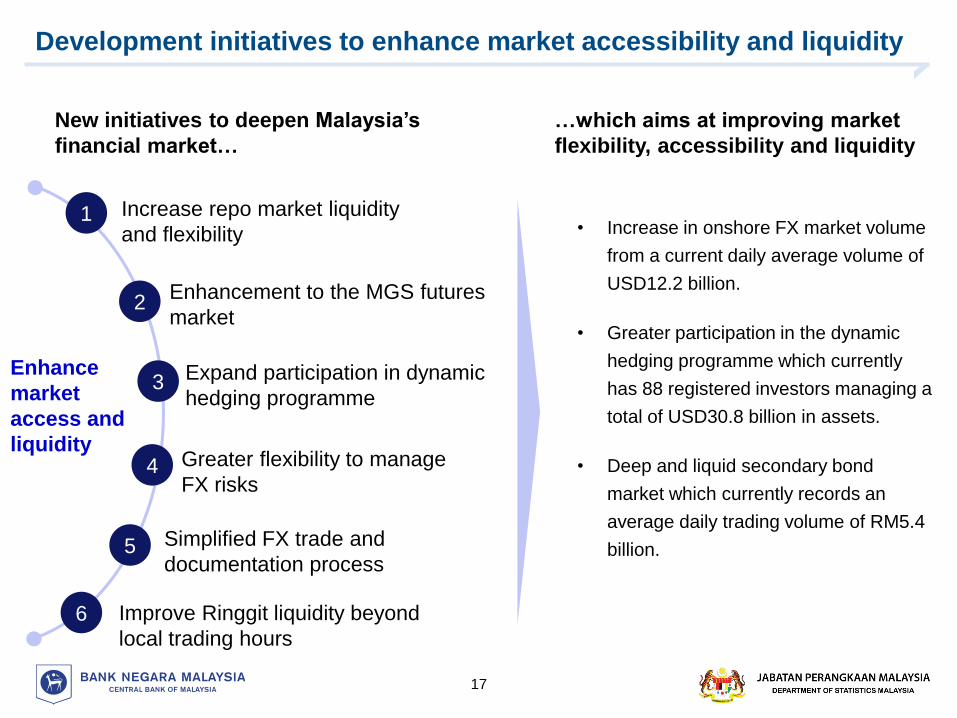
Development initiatives to enhance market accessibility and liquidity
17
Greater flexibility to manage
FX risks
Enhancement to the MGS futures
market
Expand participation in dynamic
hedging programme
Enhance
market
access and
liquidity
Increase repo market liquidity
and flexibility
Simplified FX trade and
documentation process
Improve Ringgit liquidity beyond
local trading hours
1
2
3
4
5
6
• Increase in onshore FX market volume
from a current daily average volume of
USD12.2 billion.
• Greater participation in the dynamic
hedging programme which currently
has 88 registered investors managing a
total of USD30.8 billion in assets.
• Deep and liquid secondary bond
market which currently records an
average daily trading volume of RM5.4
billion.
…which aims at improving market
flexibility, accessibility and liquidity
New initiatives to deepen Malaysia’s
financial market…
18
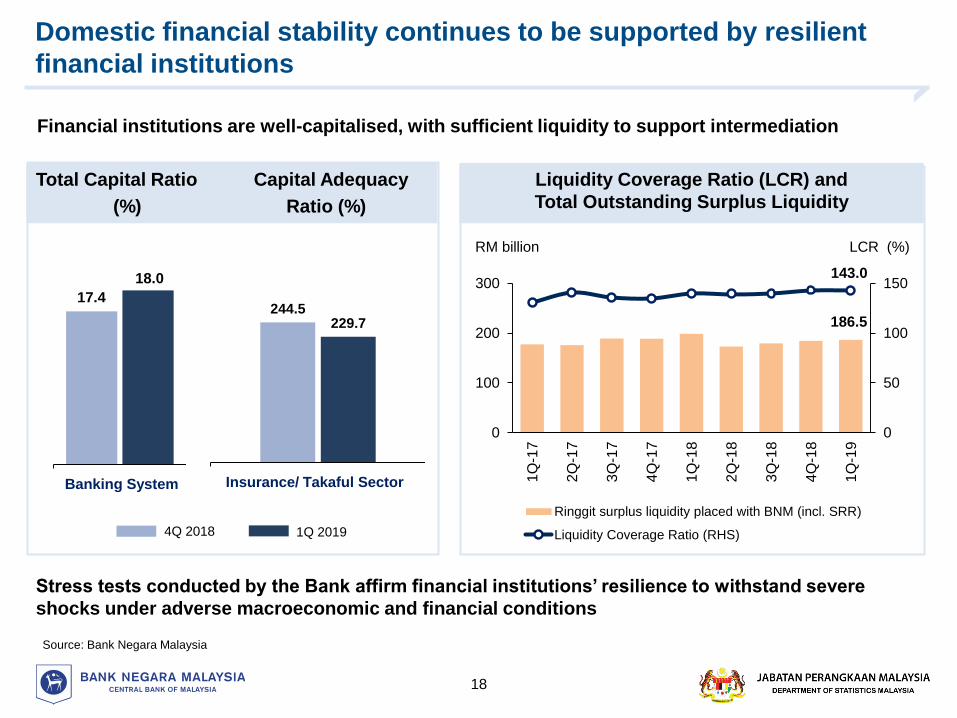
Financial institutions are well-capitalised, with sufficient liquidity to support intermediation
Stress tests conducted by the Bank affirm financial institutions’ resilience to withstand severe
shocks under adverse macroeconomic and financial conditions
Source: Bank Negara Malaysia
RM billion LCR (%)
Total Capital Ratio Capital Adequacy
(%) Ratio (%)
Liquidity Coverage Ratio (LCR) and
Total Outstanding Surplus Liquidity
Domestic financial stability continues to be supported by resilient
financial institutions
1Q 20194Q 2018
Insurance/ Takaful SectorBanking System
244.5229.7
17.4
18.0
186.5
143.0
0
50
100
150
0
100
200
300
1Q
-17
2Q
-17
3Q
-17
4Q
-17
1Q
-18
2Q
-18
3Q
-18
4Q
-18
1Q
-19
Ringgit surplus liquidity placed with BNM (incl. SRR)
Liquidity Coverage Ratio (RHS)
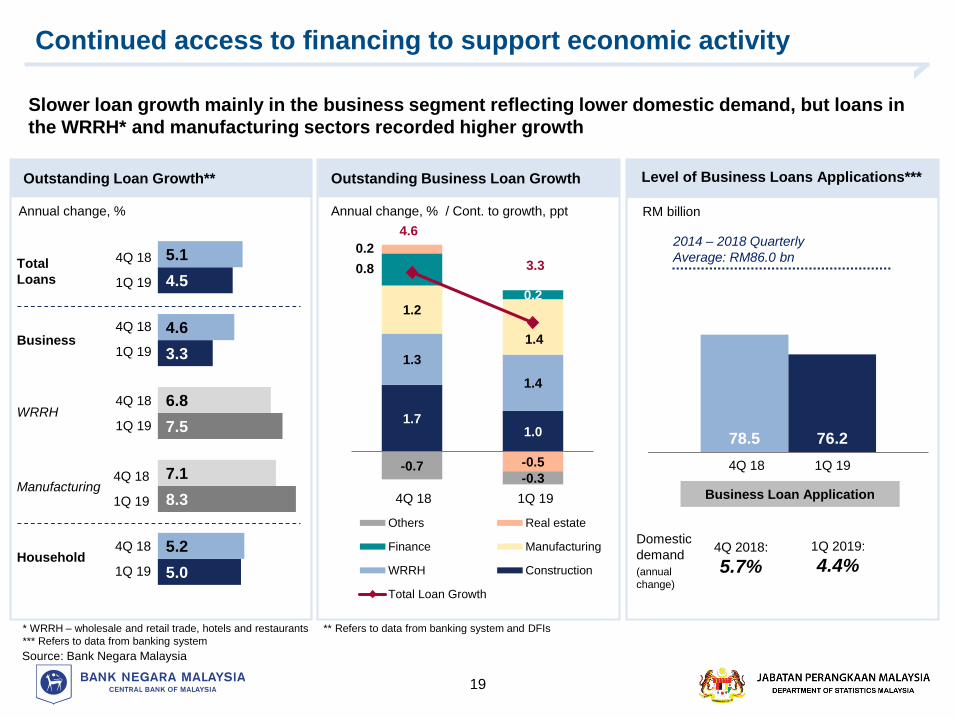
Continued access to financing to support economic activity
19
78.5 76.2
Business loan applications
Slower loan growth mainly in the business segment reflecting lower domestic demand, but loans in
the WRRH* and manufacturing sectors recorded higher growth
Annual change, % Annual change, % / Cont. to growth, ppt
5.0
8.3
7.5
3.3
4.5
5.2
7.1
6.8
4.6
5.1
1.71.0
1.3
1.4
1.2
1.4
0.8
0.2
0.2
-0.5-0.7-0.3
4.6
3.3
4Q 2018 1Q 2019
Others Real estate
Finance Manufacturing
WRRH Construction
Total Loan Growth
4Q 18 1Q 19
1Q 19
4Q 18
Business
Household
Outstanding Loan Growth** Outstanding Business Loan Growth
Source: Bank Negara Malaysia
Total
Loans
1Q 19
4Q 18
* WRRH – wholesale and retail trade, hotels and restaurants ** Refers to data from banking system and DFIs
*** Refers to data from banking system
1Q 19
4Q 18
1Q 19
4Q 18
1Q 19
4Q 18
WRRH
Manufacturing
Level of Business Loans Applications***
1Q 194Q 18
Business Loan Application
RM billion
2014 – 2018 Quarterly
Average: RM86.0 bn
Domestic
demand
(annual
change)
1Q 2019:
4.4%4Q 2018:
5.7%
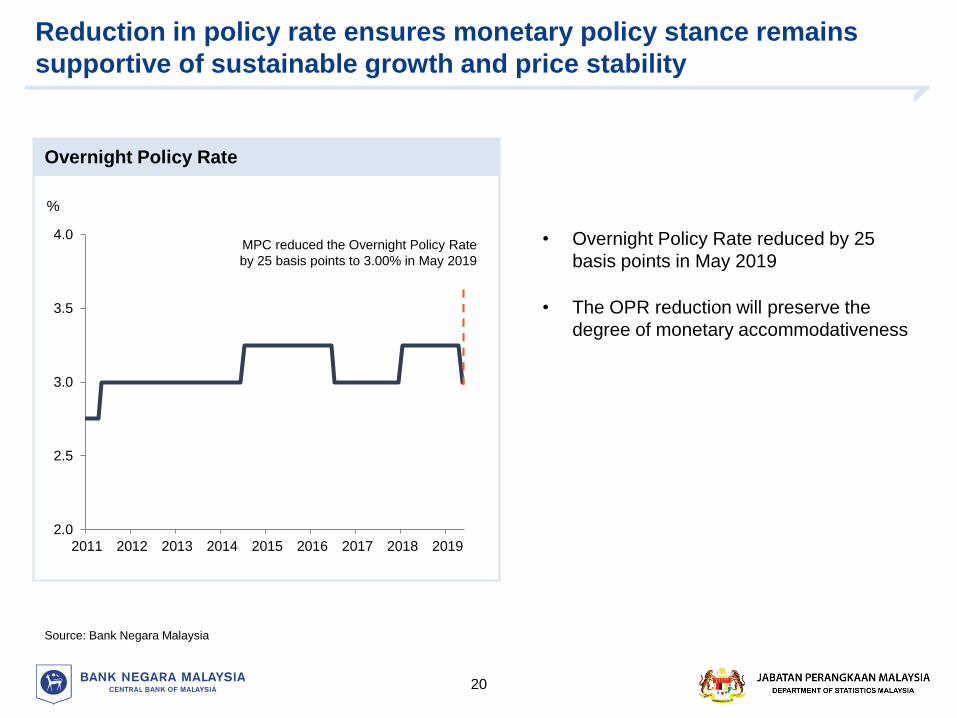
Reduction in policy rate ensures monetary policy stance remains
supportive of sustainable growth and price stability
20
• Overnight Policy Rate reduced by 25
basis points in May 2019
• The OPR reduction will preserve the
degree of monetary accommodativeness
Source: Bank Negara Malaysia
%
Overnight Policy Rate
2.0
2.5
3.0
3.5
4.0
2011 2012 2013 2014 2015 2016 2017 2018 2019
MPC reduced the Overnight Policy Rate
by 25 basis points to 3.00% in May 2019
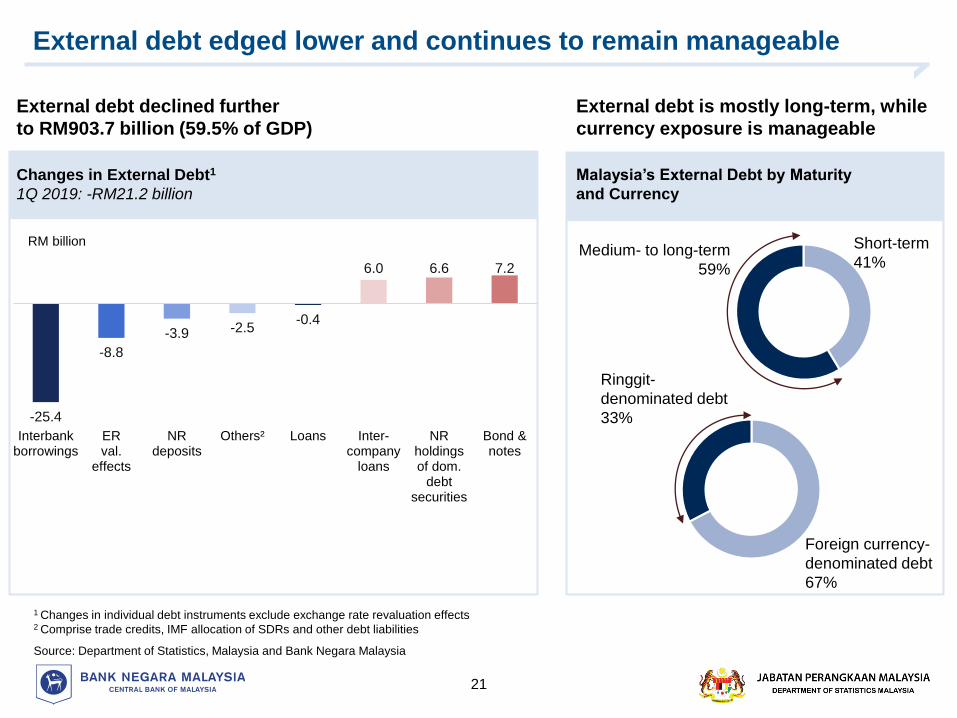
External debt edged lower and continues to remain manageable
21
1 Changes in individual debt instruments exclude exchange rate revaluation effects2 Comprise trade credits, IMF allocation of SDRs and other debt liabilities
Source: Department of Statistics, Malaysia and Bank Negara Malaysia
External debt declined further
to RM903.7 billion (59.5% of GDP)
External debt is mostly long-term, while
currency exposure is manageable
Medium- to long-term
59%
Ringgit-
denominated debt
33%
Foreign currency-
denominated debt
67%
Changes in External Debt1
1Q 2019: -RM21.2 billion
Short-term
41%
Malaysia’s External Debt by Maturity
and Currency
-25.4
-8.8
-3.9 -2.5-0.4
6.0 6.6 7.2
Interbankborrowings
ERval.
effects
NRdeposits
Others² Loans Inter-company
loans
NRholdingsof dom.
debtsecurities
Bond ¬es
RM billion
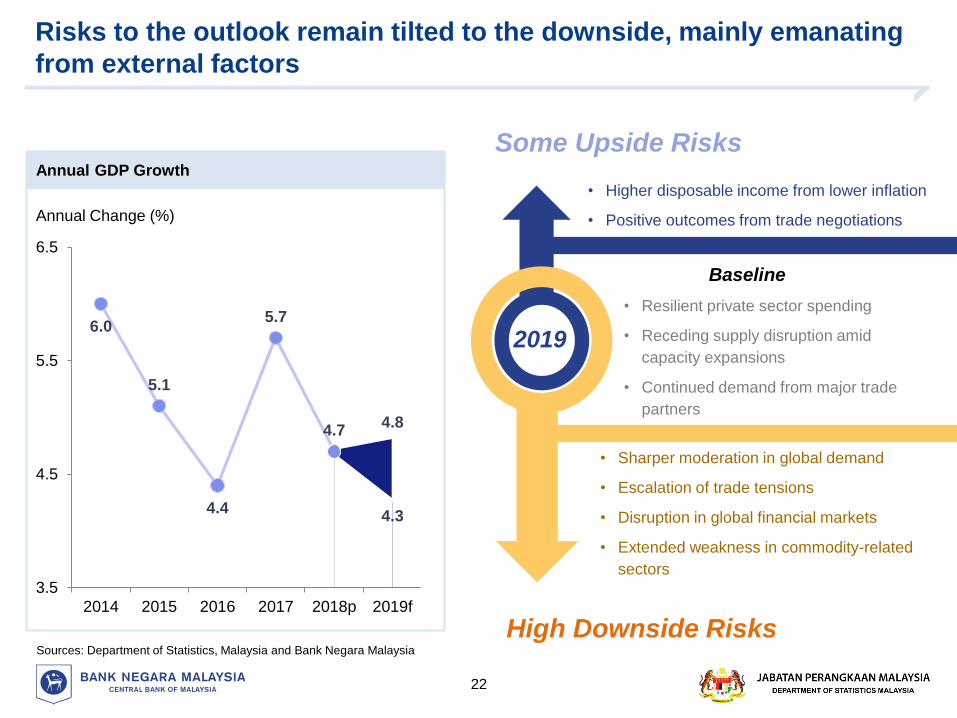
Risks to the outlook remain tilted to the downside, mainly emanating
from external factors
22
6.0
5.1
4.4
5.7
4.74.8
4.3
3.5
4.5
5.5
6.5
2014 2015 2016 2017 2018p 2019f
2019
Some Upside Risks
High Downside Risks
• Sharper moderation in global demand
• Escalation of trade tensions
• Disruption in global financial markets
• Extended weakness in commodity-related
sectors
• Resilient private sector spending
• Receding supply disruption amid
capacity expansions
• Continued demand from major trade
partners
• Higher disposable income from lower inflation
• Positive outcomes from trade negotiations
Annual GDP Growth
Annual Change (%)
Sources: Department of Statistics, Malaysia and Bank Negara Malaysia
Baseline
Malaysia to remain on a steady growth path
23
Cyclical policies
Structural policies
• Monetary policy well-calibrated to provide support to growth
• Timely and prudent fiscal spending to ensure effectiveness and discipline
• Greater clarity on public projects to benefit the economy
• Preemptively tackle existing weaknesses (i.e. elevated debt levels, cost of living, overhang in
the property market)
• Address long-standing issues (i.e. education, upskilling, social safety net, investment quality)
• Institutional and governance reforms

Q & A
24
Additional Information
25
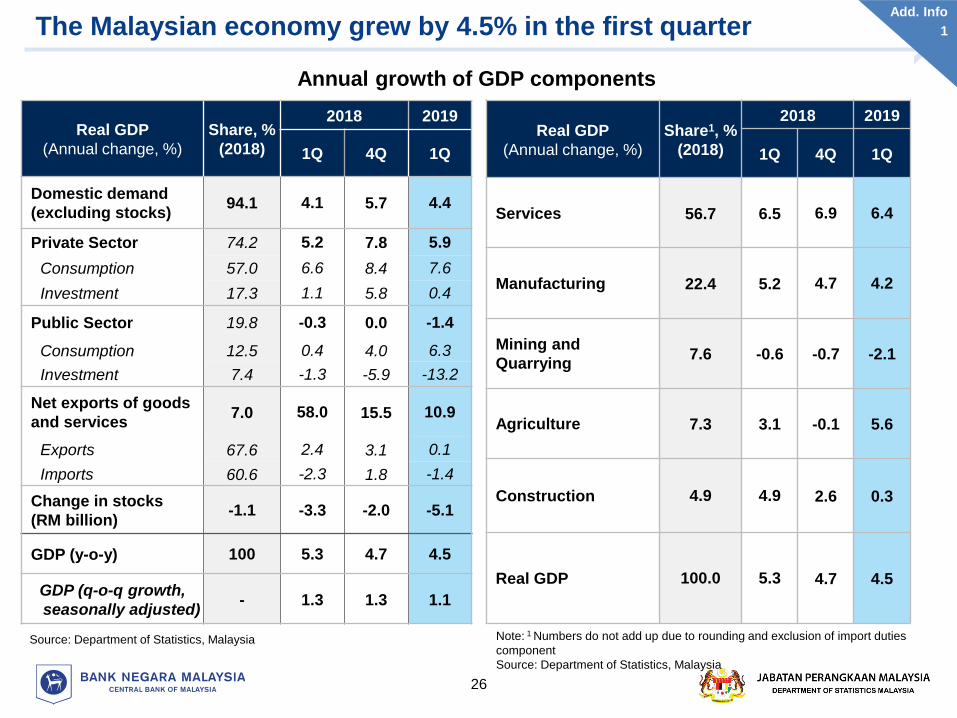
The Malaysian economy grew by 4.5% in the first quarter
26
Source: Department of Statistics, Malaysia Note: 1 Numbers do not add up due to rounding and exclusion of import duties
component
Source: Department of Statistics, Malaysia
Real GDP
(Annual change, %)
Share, %
(2018)
2018 2019
1Q 4Q 1Q
Domestic demand
(excluding stocks)94.1 4.1 5.7 4.4
Private Sector 74.2 5.2 7.8 5.9
Consumption 57.0 6.6 8.4 7.6
Investment 17.3 1.1 5.8 0.4
Public Sector 19.8 -0.3 0.0 -1.4
Consumption 12.5 0.4 4.0 6.3
Investment 7.4 -1.3 -5.9 -13.2
Net exports of goods
and services7.0 58.0 15.5 10.9
Exports 67.6 2.4 3.1 0.1
Imports 60.6 -2.3 1.8 -1.4
Change in stocks
(RM billion)-1.1 -3.3 -2.0 -5.1
GDP (y-o-y) 100 5.3 4.7 4.5
GDP (q-o-q growth,
seasonally adjusted)- 1.3 1.3 1.1
Real GDP
(Annual change, %)
Share1, %
(2018)
2018 2019
1Q 4Q 1Q
Services 56.7 6.5 6.9 6.4
Manufacturing 22.4 5.2 4.7 4.2
Mining and
Quarrying7.6 -0.6 -0.7 -2.1
Agriculture 7.3 3.1 -0.1 5.6
Construction 4.9 4.9 2.6 0.3
Real GDP 100.0 5.3 4.7 4.5
Annual growth of GDP components
Add. Info
1
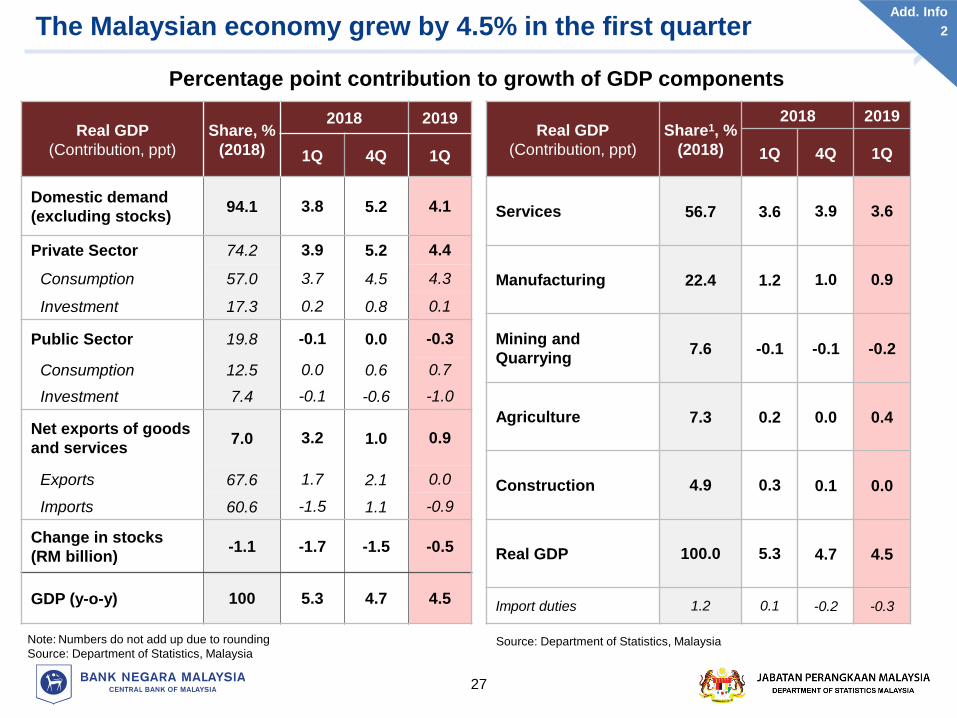
The Malaysian economy grew by 4.5% in the first quarter
27
Note: Numbers do not add up due to rounding
Source: Department of Statistics, MalaysiaSource: Department of Statistics, Malaysia
Real GDP
(Contribution, ppt)
Share, %
(2018)
2018 2019
1Q 4Q 1Q
Domestic demand
(excluding stocks)94.1 3.8 5.2 4.1
Private Sector 74.2 3.9 5.2 4.4
Consumption 57.0 3.7 4.5 4.3
Investment 17.3 0.2 0.8 0.1
Public Sector 19.8 -0.1 0.0 -0.3
Consumption 12.5 0.0 0.6 0.7
Investment 7.4 -0.1 -0.6 -1.0
Net exports of goods
and services7.0 3.2 1.0 0.9
Exports 67.6 1.7 2.1 0.0
Imports 60.6 -1.5 1.1 -0.9
Change in stocks
(RM billion)-1.1 -1.7 -1.5 -0.5
GDP (y-o-y) 100 5.3 4.7 4.5
Real GDP
(Contribution, ppt)
Share1, %
(2018)
2018 2019
1Q 4Q 1Q
Services 56.7 3.6 3.9 3.6
Manufacturing 22.4 1.2 1.0 0.9
Mining and
Quarrying7.6 -0.1 -0.1 -0.2
Agriculture 7.3 0.2 0.0 0.4
Construction 4.9 0.3 0.1 0.0
Real GDP 100.0 5.3 4.7 4.5
Import duties 1.2 0.1 -0.2 -0.3
Percentage point contribution to growth of GDP components
Add. Info
2

End