STATISTICS FOR COMMUNICATION RESEARCH. OBJEKTIF KURSUS Pada akhir kursus ini pelajar dapat: Pada...
48
STATISTICS FOR STATISTICS FOR COMMUNICATION COMMUNICATION RESEARCH RESEARCH
-
Upload
margaret-gaines -
Category
Documents
-
view
224 -
download
1
Transcript of STATISTICS FOR COMMUNICATION RESEARCH. OBJEKTIF KURSUS Pada akhir kursus ini pelajar dapat: Pada...
STATISTICS FOR STATISTICS FOR COMMUNICATION COMMUNICATION
RESEARCHRESEARCH
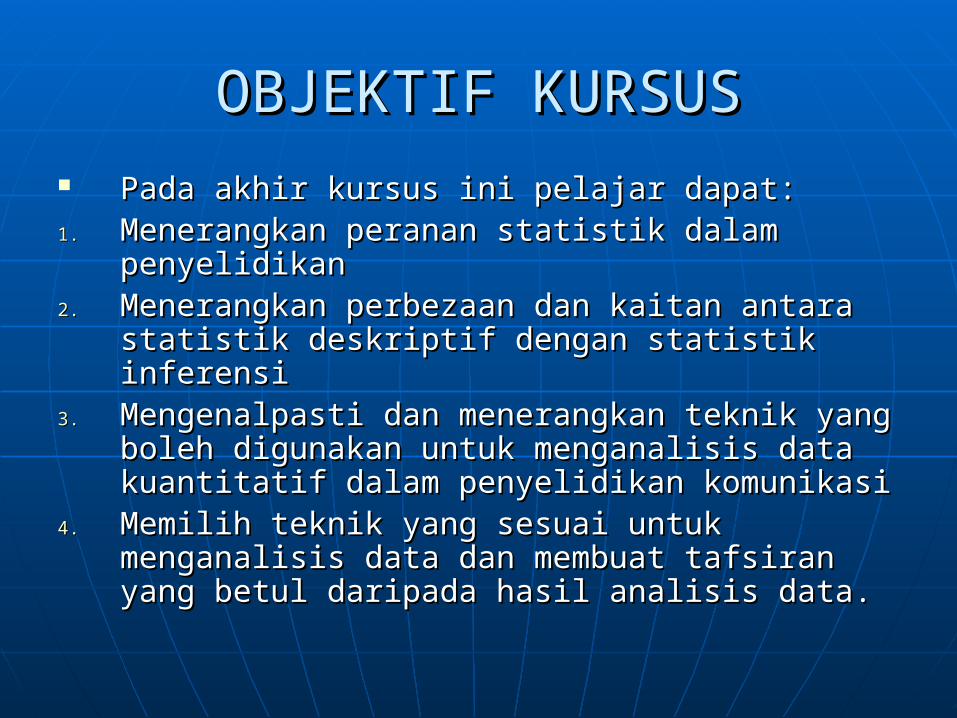
OBJEKTIF KURSUSOBJEKTIF KURSUS Pada akhir kursus ini pelajar dapat:Pada akhir kursus ini pelajar dapat:1.1. Menerangkan peranan statistik dalam Menerangkan peranan statistik dalam
penyelidikan penyelidikan 2.2. Menerangkan perbezaan dan kaitan antara Menerangkan perbezaan dan kaitan antara
statistik deskriptif dengan statistik inferensistatistik deskriptif dengan statistik inferensi3.3. Mengenalpasti dan menerangkan teknik yang Mengenalpasti dan menerangkan teknik yang
boleh digunakan untuk menganalisis data boleh digunakan untuk menganalisis data kuantitatif dalam penyelidikan komunikasikuantitatif dalam penyelidikan komunikasi
4.4. Memilih teknik yang sesuai untuk menganalisis Memilih teknik yang sesuai untuk menganalisis data dan membuat tafsiran yang betul daripada data dan membuat tafsiran yang betul daripada hasil analisis data.hasil analisis data.
KANDUNGAN KURSUSKANDUNGAN KURSUS
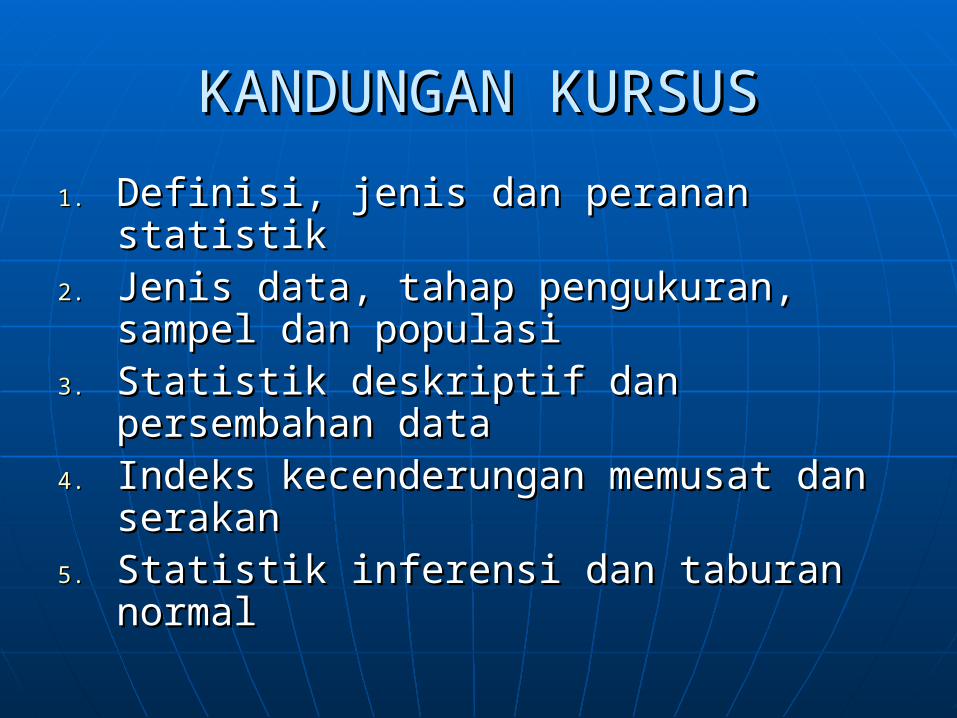
1.1. Definisi, jenis dan peranan statistikDefinisi, jenis dan peranan statistik2.2. Jenis data, tahap pengukuran, Jenis data, tahap pengukuran,
sampel dan populasisampel dan populasi3.3. Statistik deskriptif dan Statistik deskriptif dan
persembahan datapersembahan data4.4. Indeks kecenderungan memusat Indeks kecenderungan memusat
dan serakandan serakan5.5. Statistik inferensi dan taburan Statistik inferensi dan taburan
normalnormal
KANDUNGAN KURSUS (Samb.)KANDUNGAN KURSUS (Samb.)
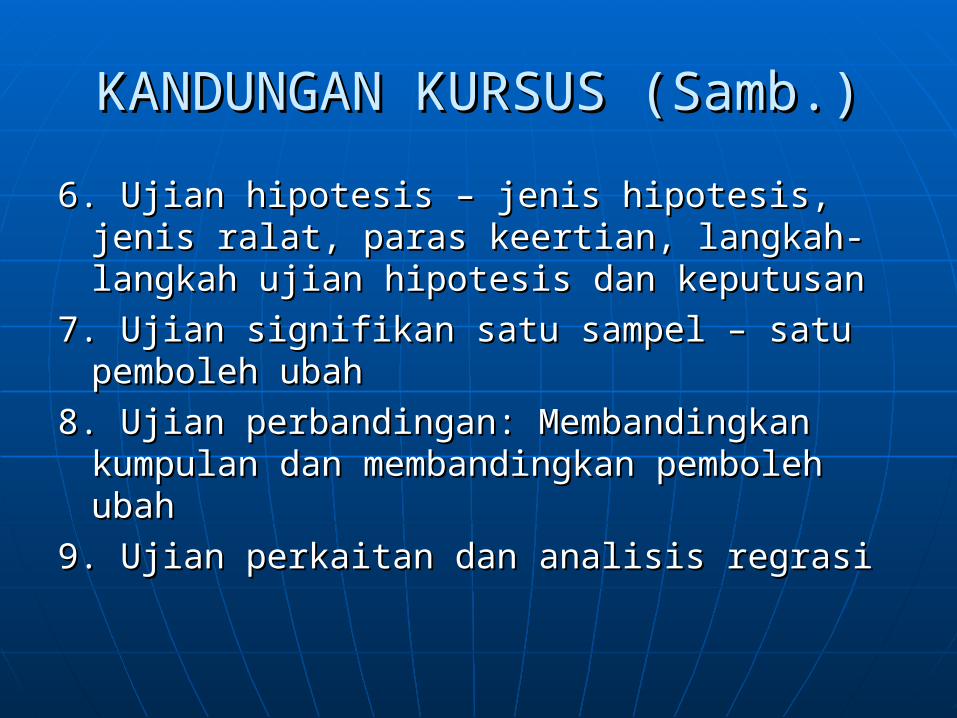
6. Ujian hipotesis – jenis hipotesis, jenis 6. Ujian hipotesis – jenis hipotesis, jenis ralat, paras keertian, langkah-langkah ralat, paras keertian, langkah-langkah ujian hipotesis dan keputusanujian hipotesis dan keputusan
7. Ujian signifikan satu sampel – satu 7. Ujian signifikan satu sampel – satu pemboleh ubahpemboleh ubah
8. Ujian perbandingan: Membandingkan 8. Ujian perbandingan: Membandingkan kumpulan dan membandingkan pemboleh kumpulan dan membandingkan pemboleh ubahubah
9. Ujian perkaitan dan analisis regrasi9. Ujian perkaitan dan analisis regrasi
Penilaian KursusPenilaian Kursus
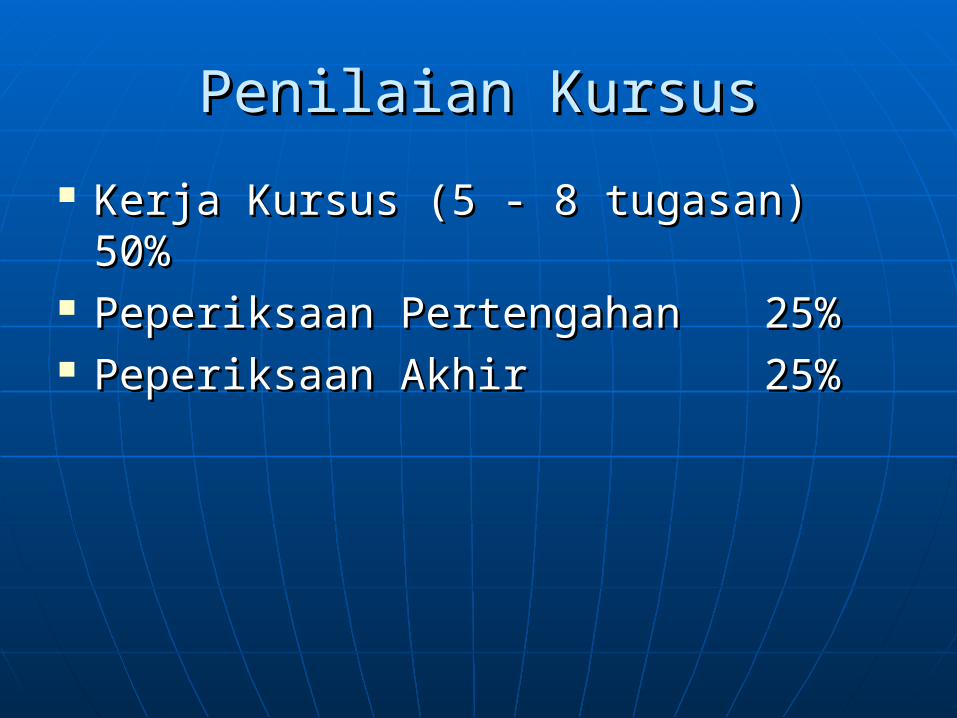
Kerja Kursus (5 - 8 tugasan)Kerja Kursus (5 - 8 tugasan) 50%50% Peperiksaan PertengahanPeperiksaan Pertengahan 25%25% Peperiksaan AkhirPeperiksaan Akhir 25%25%
StatisticsStatistics
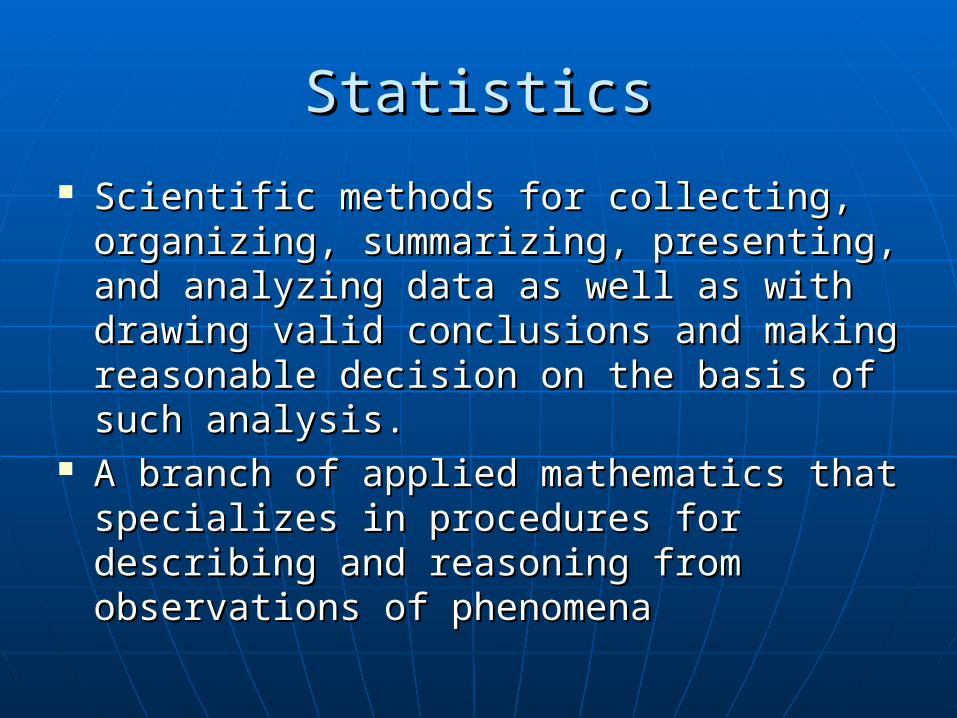
Scientific methods for collecting, Scientific methods for collecting, organizing, summarizing, presenting, and organizing, summarizing, presenting, and analyzing data as well as with drawing analyzing data as well as with drawing valid conclusions and making reasonable valid conclusions and making reasonable decision on the basis of such analysis.decision on the basis of such analysis.
A branch of applied mathematics that A branch of applied mathematics that specializes in procedures for describing specializes in procedures for describing and reasoning from observations of and reasoning from observations of phenomenaphenomena
Purpose of StatisticsPurpose of Statistics
1.1. To describe phenomena,To describe phenomena,
2.2. To organize and summarize our To organize and summarize our result more conveniently and result more conveniently and meaningfully,meaningfully,
3.3. To make inference or make certain To make inference or make certain predictions,predictions,
4.4. To make explain, andTo make explain, and
5.5. To make conclusion.To make conclusion.
Type of StatisticsType of Statistics
1. Descriptive Statistics1. Descriptive Statistics
- Concerned with summarizing the - Concerned with summarizing the distribution of single variable or measuring distribution of single variable or measuring relationship between two or more relationship between two or more variables (Eg: Frequency distribution, variables (Eg: Frequency distribution, measure of central tendencies, measures measure of central tendencies, measures of dispersion, correlation coefficient and of dispersion, correlation coefficient and deriving regression equation (prediction deriving regression equation (prediction equation) equation)
Type of Statistics (cont.)Type of Statistics (cont.)
2. Inferential Statistics2. Inferential Statistics
- Concerned with making - Concerned with making generalization from sample to generalization from sample to population (Eg: T-test, Analysis of population (Eg: T-test, Analysis of Variance and Chi-square).Variance and Chi-square).
Concepts in StatisticsConcepts in Statistics
PopulationPopulation- The entire group being observed, almost The entire group being observed, almost
always assumed to be infinite in sizealways assumed to be infinite in size- The total collection of all cases in which The total collection of all cases in which
the researcher is interested and wishes to the researcher is interested and wishes to understanding.understanding.
- Group or set of human subjects or other Group or set of human subjects or other entities (Ex: all student at the UPM, all entities (Ex: all student at the UPM, all members at Jabatan Komunikasi)members at Jabatan Komunikasi)
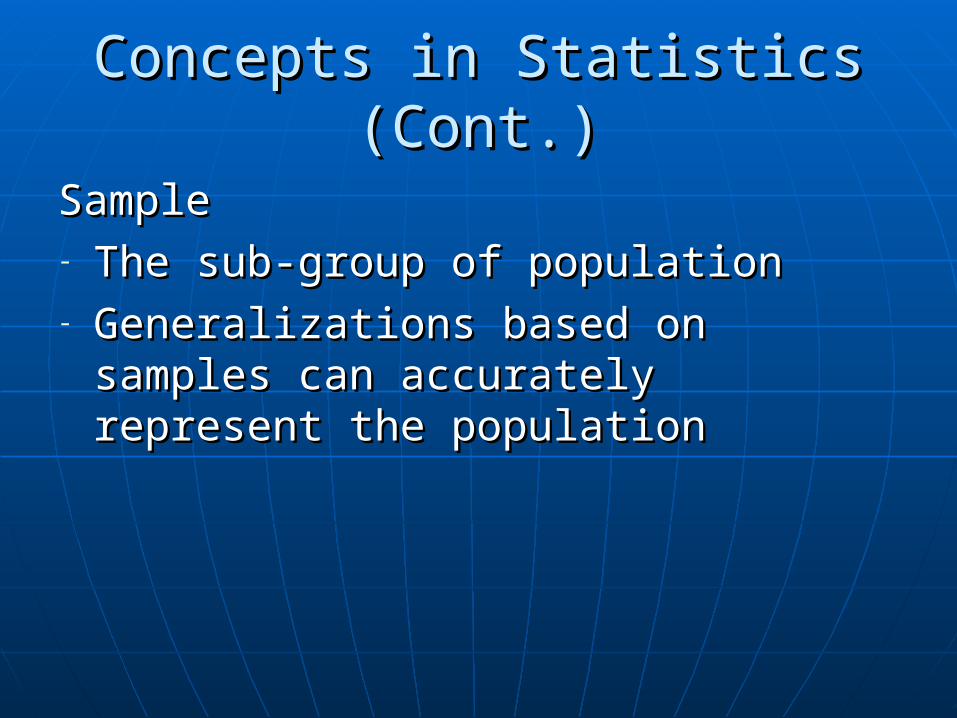
Concepts in Statistics (Cont.)Concepts in Statistics (Cont.)
SampleSample- The sub-group of populationThe sub-group of population- Generalizations based on samples Generalizations based on samples
can accurately represent the can accurately represent the populationpopulation
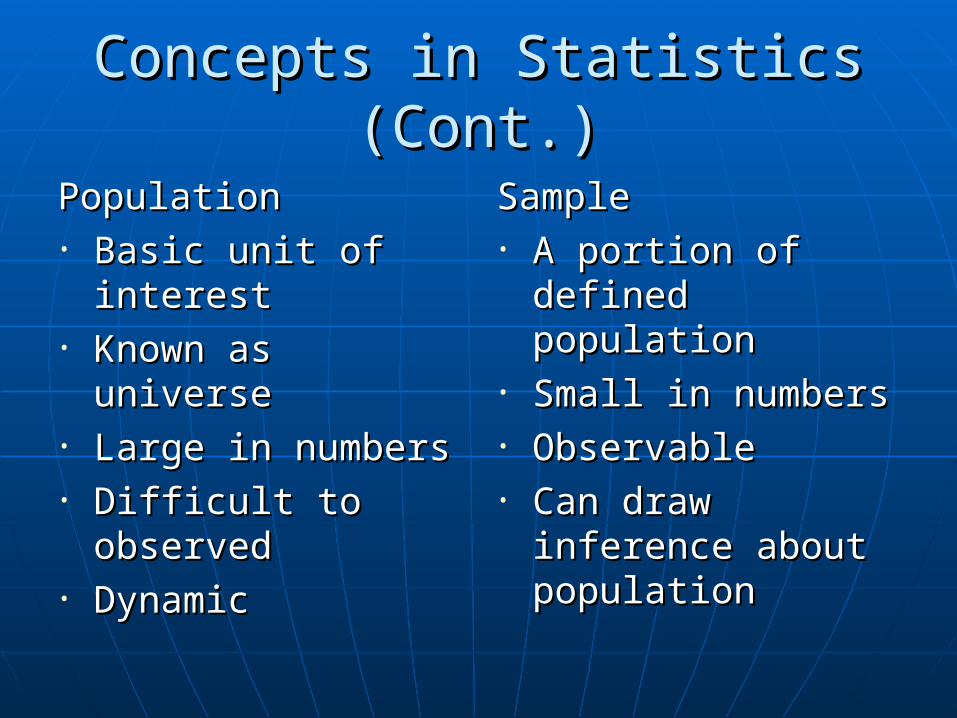
Concepts in Statistics (Cont.)Concepts in Statistics (Cont.)
PopulationPopulation• Basic unit of Basic unit of
interestinterest• Known as universeKnown as universe• Large in numbersLarge in numbers• Difficult to Difficult to
observedobserved• DynamicDynamic
SampleSample• A portion of A portion of
defined populationdefined population• Small in numbersSmall in numbers• ObservableObservable• Can draw inference Can draw inference
about populationabout population
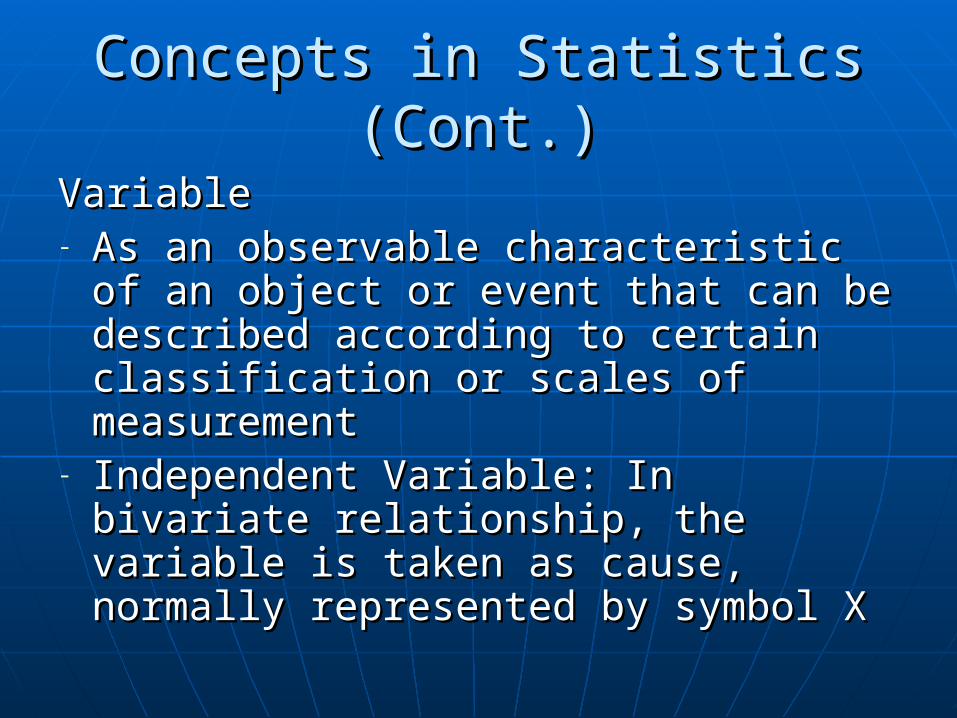
Concepts in Statistics (Cont.)Concepts in Statistics (Cont.)
VariableVariable- As an observable characteristic of an As an observable characteristic of an
object or event that can be described object or event that can be described according to certain classification or according to certain classification or scales of measurementscales of measurement
- Independent Variable: In bivariate Independent Variable: In bivariate relationship, the variable is taken as relationship, the variable is taken as cause, normally represented by cause, normally represented by symbol X symbol X
Concepts in Statistics (Cont.)Concepts in Statistics (Cont.)
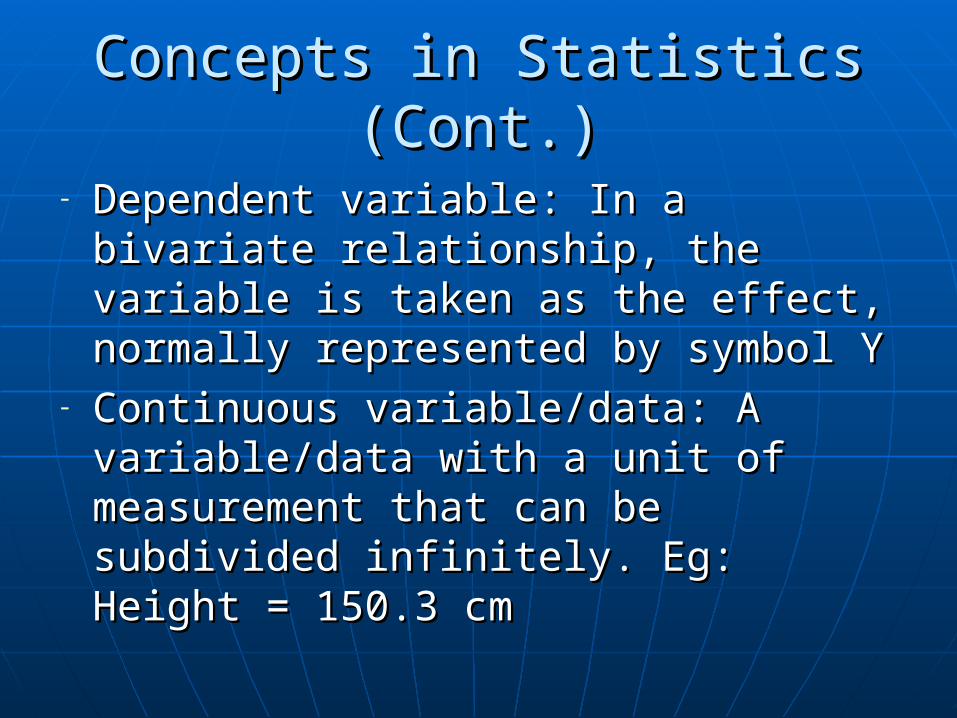
- Dependent variable: In a bivariate Dependent variable: In a bivariate relationship, the variable is taken as relationship, the variable is taken as the effect, normally represented by the effect, normally represented by symbol Ysymbol Y
- Continuous variable/data: A Continuous variable/data: A variable/data with a unit of variable/data with a unit of measurement that can be subdivided measurement that can be subdivided infinitely. Eg: Height = 150.3 cminfinitely. Eg: Height = 150.3 cm
Concepts in Statistics (Cont.)Concepts in Statistics (Cont.)
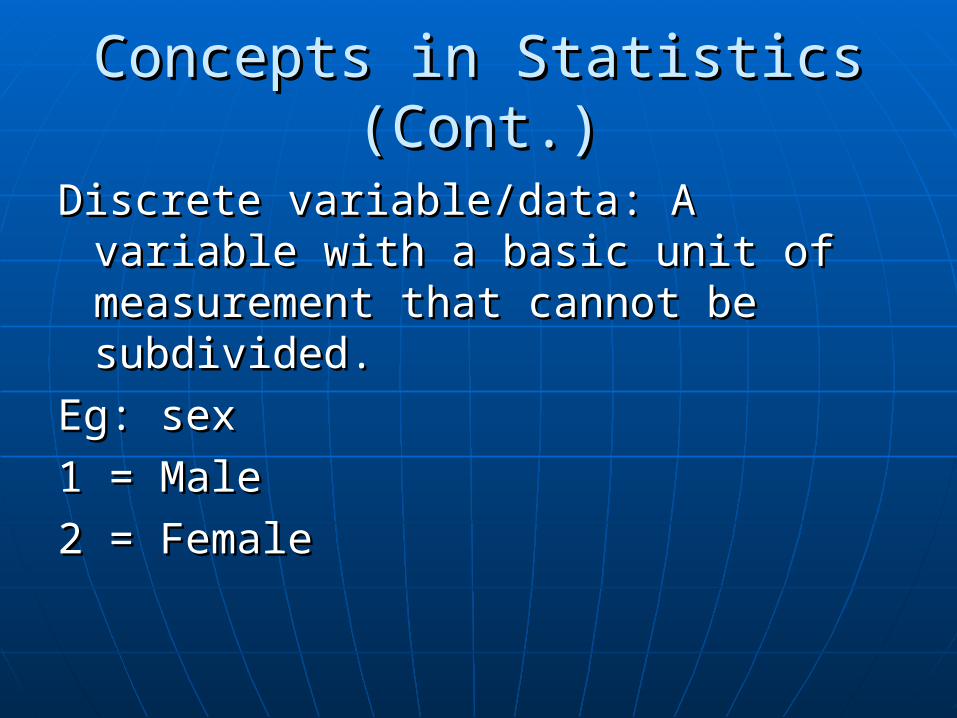
Discrete variable/data: A variable with Discrete variable/data: A variable with a basic unit of measurement that a basic unit of measurement that cannot be subdivided. cannot be subdivided.
Eg: sex Eg: sex
1 = Male1 = Male
2 = Female2 = Female
MeasurementMeasurement
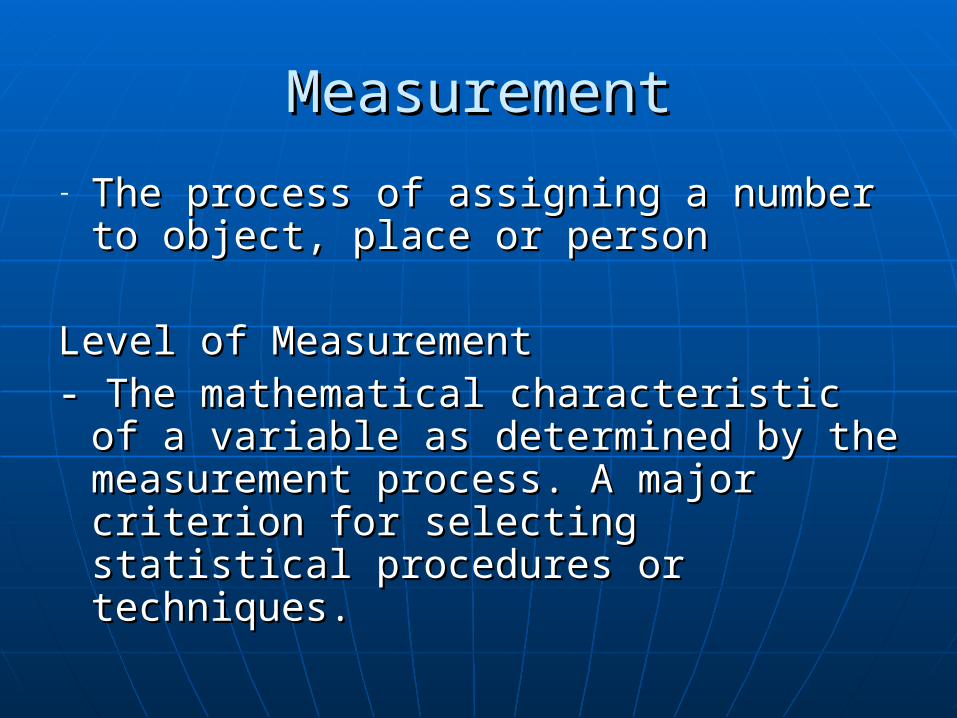
- The process of assigning a number to The process of assigning a number to object, place or personobject, place or person
Level of MeasurementLevel of Measurement- The mathematical characteristic of a - The mathematical characteristic of a
variable as determined by the variable as determined by the measurement process. A major measurement process. A major criterion for selecting statistical criterion for selecting statistical procedures or techniques.procedures or techniques.
Level of Measurement Level of Measurement (Type of Data)(Type of Data)
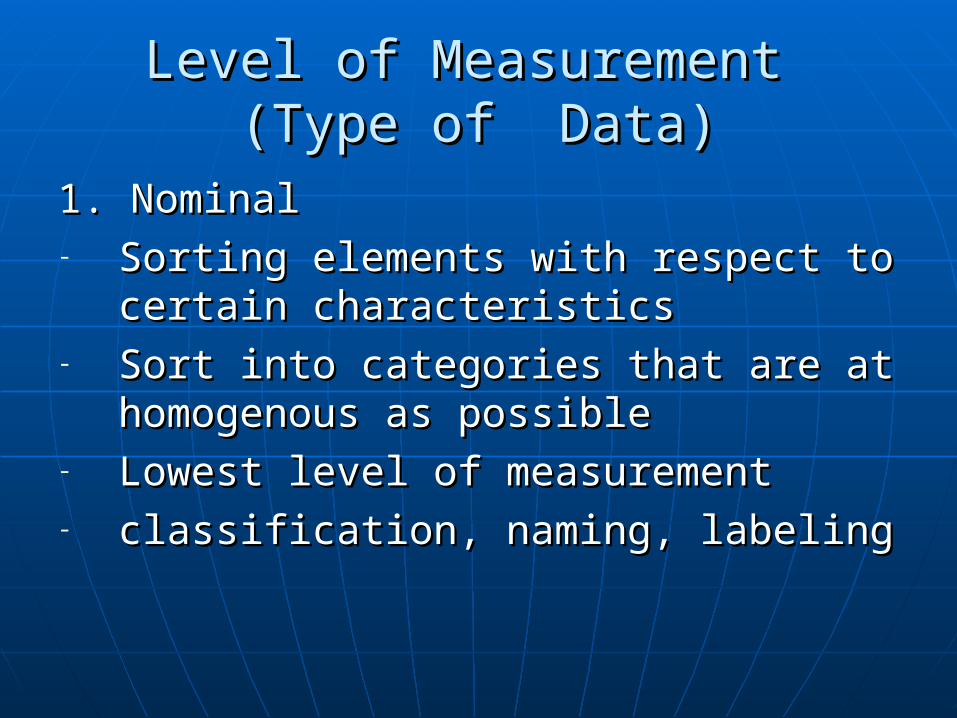
1. Nominal1. Nominal- Sorting elements with respect to Sorting elements with respect to
certain characteristicscertain characteristics- Sort into categories that are at Sort into categories that are at
homogenous as possiblehomogenous as possible- Lowest level of measurementLowest level of measurement- classification, naming, labelingclassification, naming, labeling
Level of Measurement Level of Measurement (Type of Data)(Type of Data)
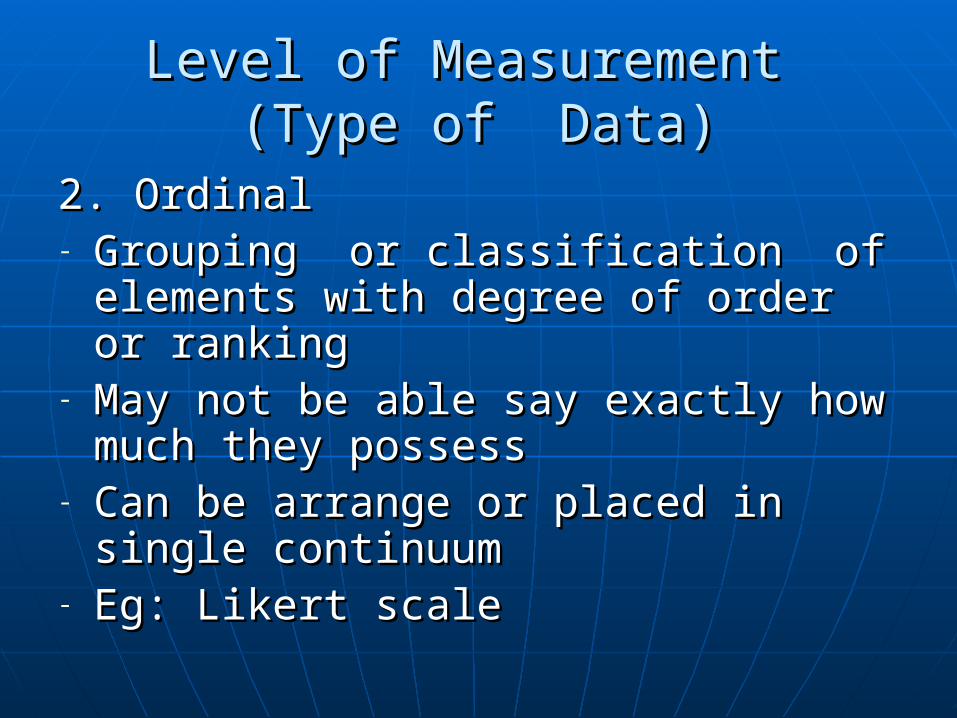
2. Ordinal2. Ordinal- Grouping or classification of Grouping or classification of
elements with degree of order or elements with degree of order or rankingranking
- May not be able say exactly how May not be able say exactly how much they possessmuch they possess
- Can be arrange or placed in single Can be arrange or placed in single continuumcontinuum
- Eg: Likert scaleEg: Likert scale
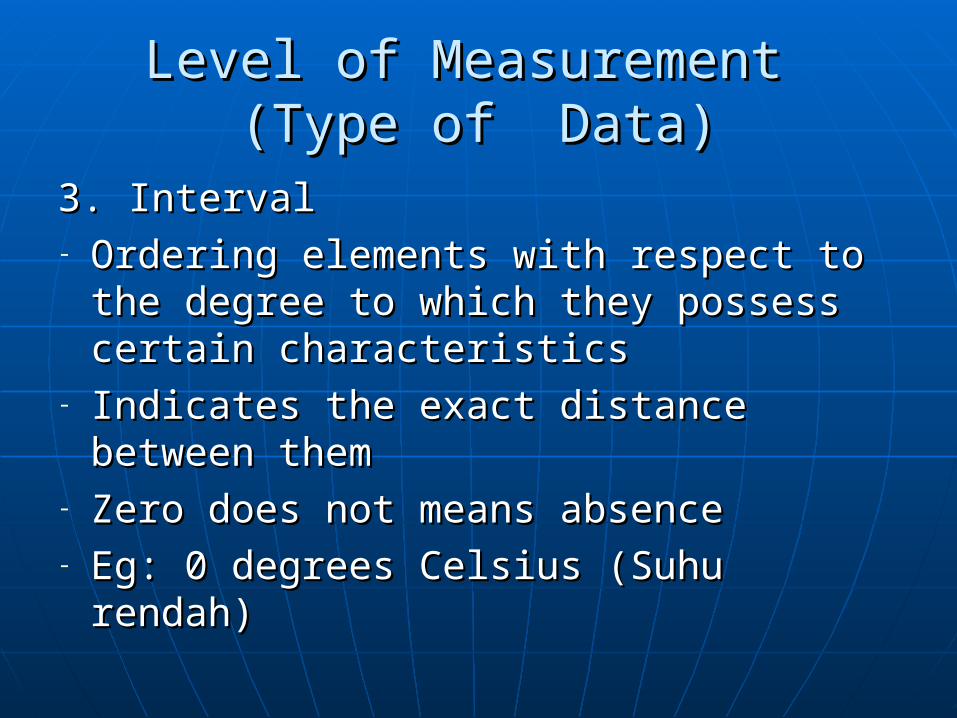
Level of Measurement Level of Measurement (Type of Data)(Type of Data)
3. Interval3. Interval- Ordering elements with respect to Ordering elements with respect to
the degree to which they possess the degree to which they possess certain characteristicscertain characteristics
- Indicates the exact distance between Indicates the exact distance between themthem
- Zero does not means absence Zero does not means absence - Eg: 0 degrees Celsius (Suhu rendah)Eg: 0 degrees Celsius (Suhu rendah)
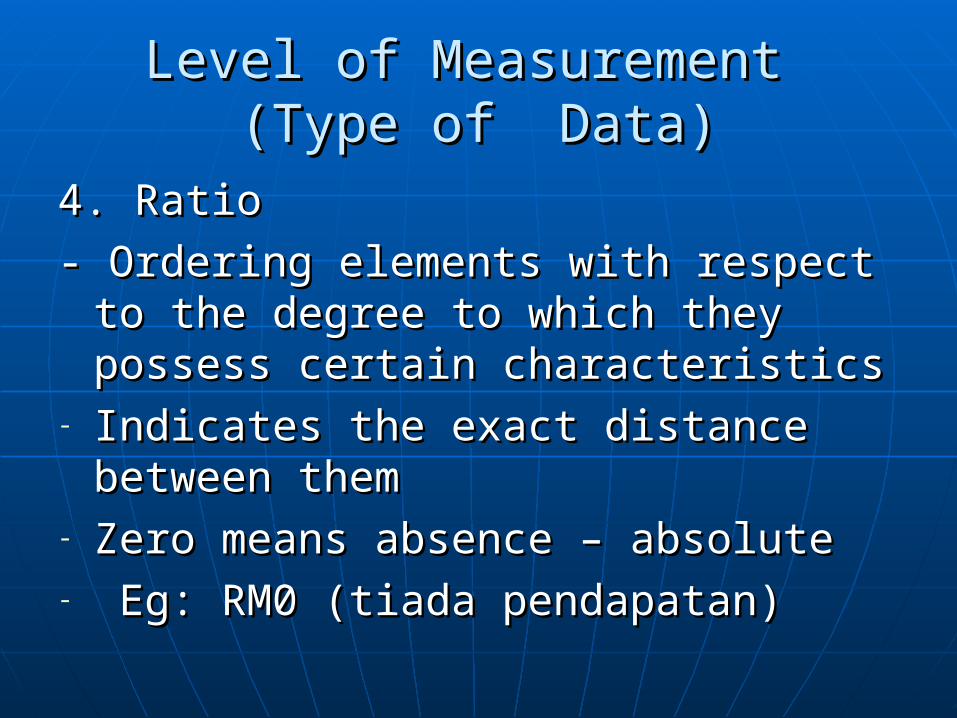
Level of Measurement Level of Measurement (Type of Data)(Type of Data)
4. Ratio4. Ratio
- Ordering elements with respect to - Ordering elements with respect to the degree to which they possess the degree to which they possess certain characteristicscertain characteristics
- Indicates the exact distance between Indicates the exact distance between themthem
- Zero means absence – absoluteZero means absence – absolute- Eg: RM0 (tiada pendapatan)Eg: RM0 (tiada pendapatan)
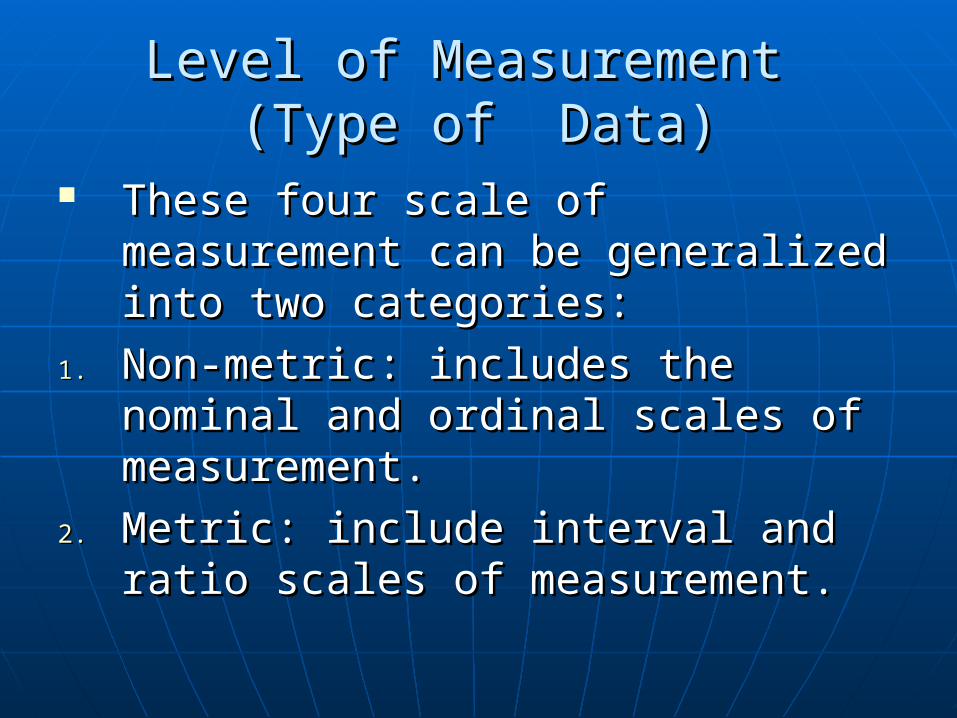
Level of Measurement Level of Measurement (Type of Data)(Type of Data)
These four scale of measurement These four scale of measurement can be generalized into two can be generalized into two categories:categories:
1.1. Non-metric: includes the nominal Non-metric: includes the nominal and ordinal scales of measurement.and ordinal scales of measurement.
2.2. Metric: include interval and ratio Metric: include interval and ratio scales of measurement.scales of measurement.
Descriptive StatisticsDescriptive Statistics
Frequency distributionFrequency distribution Measure of central tendencyMeasure of central tendency Measure of dispersionMeasure of dispersion Measure of associationMeasure of association
Data PresentationData Presentation
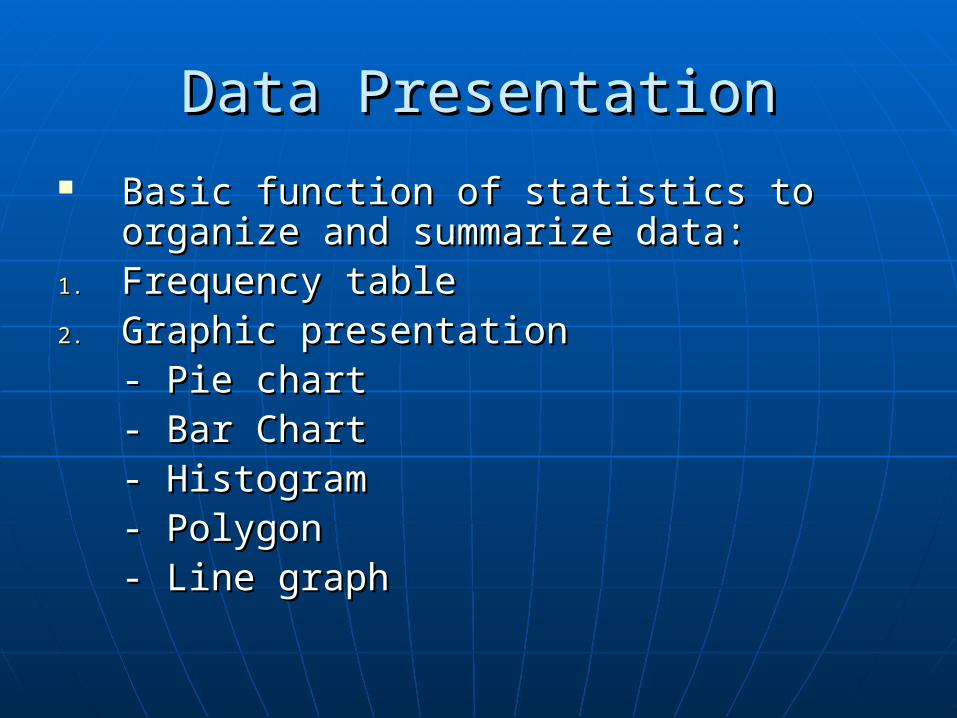
Basic function of statistics to organize Basic function of statistics to organize and summarize data:and summarize data:
1.1. Frequency tableFrequency table2.2. Graphic presentationGraphic presentation
- Pie chart- Pie chart- Bar Chart- Bar Chart- Histogram- Histogram- Polygon- Polygon- Line graph- Line graph
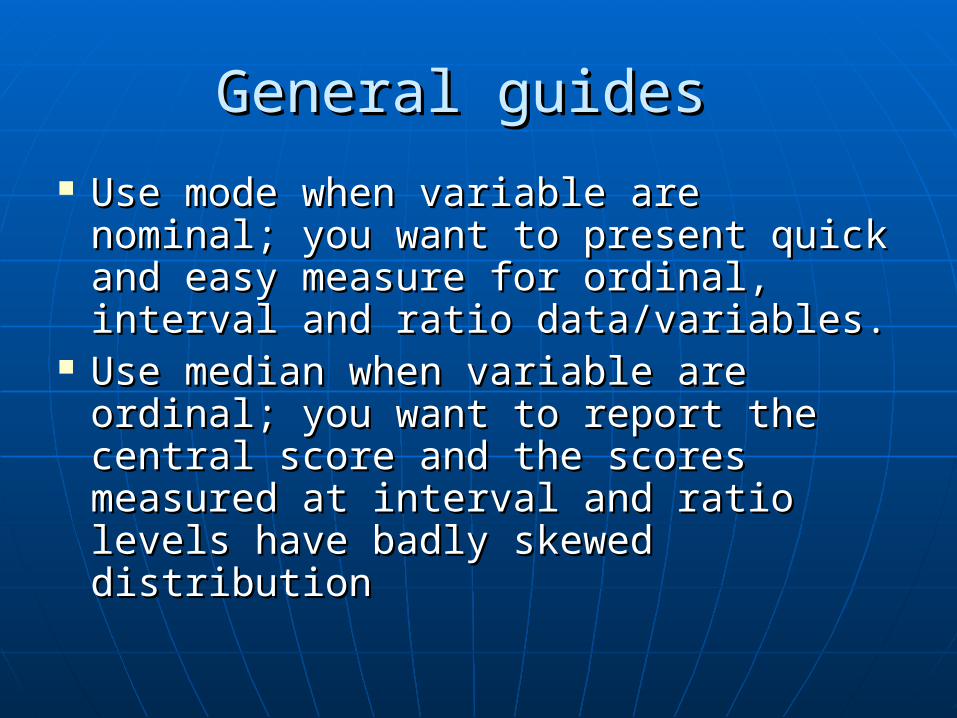
General guides General guides
Use mode when variable are Use mode when variable are nominal; you want to present quick nominal; you want to present quick and easy measure for ordinal, and easy measure for ordinal, interval and ratio data/variables.interval and ratio data/variables.
Use median when variable are Use median when variable are ordinal; you want to report the ordinal; you want to report the central score and the scores central score and the scores measured at interval and ratio levels measured at interval and ratio levels have badly skewed distributionhave badly skewed distribution
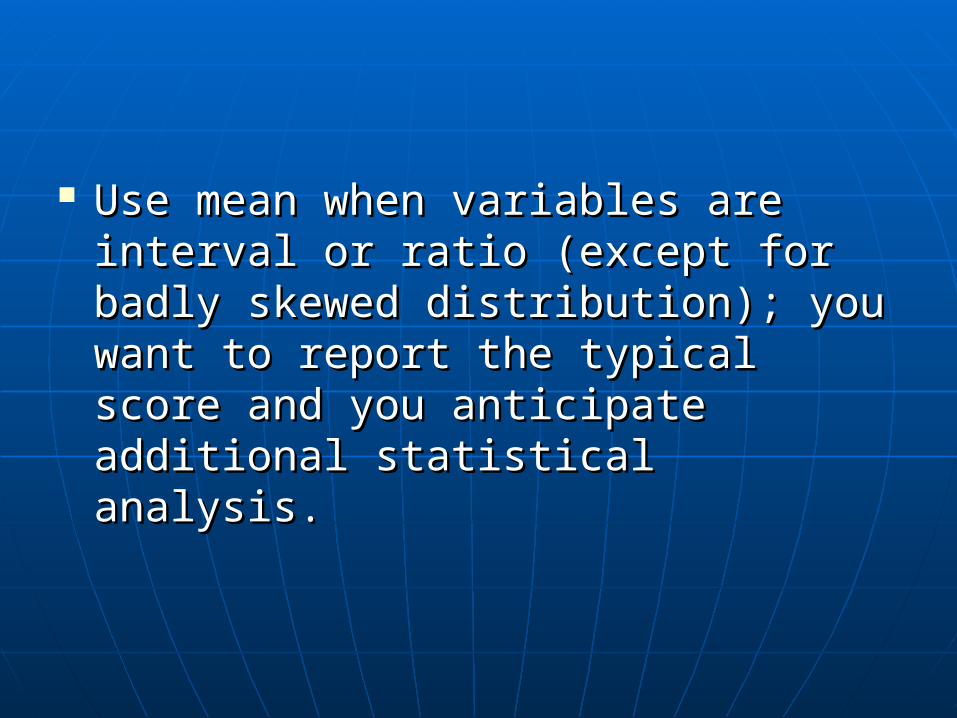
Use mean when variables are Use mean when variables are interval or ratio (except for badly interval or ratio (except for badly skewed distribution); you want to skewed distribution); you want to report the typical score and you report the typical score and you anticipate additional statistical anticipate additional statistical analysis.analysis.
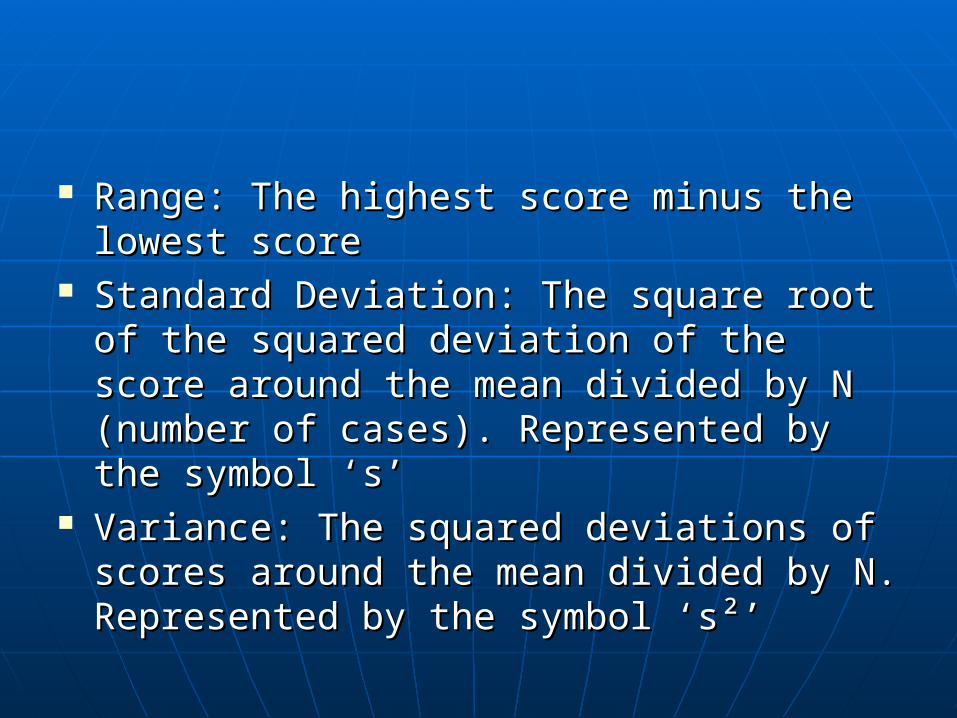
Range: The highest score minus the lowest Range: The highest score minus the lowest scorescore
Standard Deviation: The square root of the Standard Deviation: The square root of the squared deviation of the score around the squared deviation of the score around the mean divided by N (number of cases). mean divided by N (number of cases). Represented by the symbol ‘s’Represented by the symbol ‘s’
Variance: The squared deviations of scores Variance: The squared deviations of scores around the mean divided by N. around the mean divided by N. Represented by the symbol ‘s²’Represented by the symbol ‘s²’
Inferential StatisticsInferential Statistics
To enable researcher to make statement To enable researcher to make statement or summary or decision about the or summary or decision about the population based on the samplepopulation based on the sample
To enable researcher to make statement To enable researcher to make statement or summary or decision on the unseen or summary or decision on the unseen data based on the empirical datadata based on the empirical data
To enable researcher to make statement To enable researcher to make statement or summary or decision on the large group or summary or decision on the large group based on data from the small group.based on data from the small group.
Two main procedures of Inferential Two main procedures of Inferential StatisticsStatistics
EstimatesEstimates Hypothesis TestingHypothesis Testing
Statistical AssumptionStatistical Assumption
A set of parameters, guidelines A set of parameters, guidelines indicating the conditions under which indicating the conditions under which the procedures can be most the procedures can be most appropriately used.appropriately used.
Every test has own assumption that Every test has own assumption that should not be violatedshould not be violated
Four main assumption of Inferential Four main assumption of Inferential StatisticsStatistics
1.1. Random sampleRandom sample2.2. Characteristics are related to true Characteristics are related to true
populationpopulation3.3. Multiple random sample from same Multiple random sample from same
population yield similar statistics population yield similar statistics that cluster around true population that cluster around true population parametersparameters
4.4. Can calculate the sampling error Can calculate the sampling error associated with a sample statisticsassociated with a sample statistics
Normal DistributionNormal Distribution The normal probability distribution is a The normal probability distribution is a
continuous probability distribution (Ref. continuous probability distribution (Ref. Equation pg 70)Equation pg 70)
Data in the normal distribution are measured in Data in the normal distribution are measured in terms of standard deviation from mean and are terms of standard deviation from mean and are called standard scores or Z score.called standard scores or Z score.
Characteristics of Normal Distribution:Characteristics of Normal Distribution:1. It is a continuous probability distribution1. It is a continuous probability distribution2. Symmetrical or bell-shaped with the mode, 2. Symmetrical or bell-shaped with the mode,
median and mean are equalmedian and mean are equal
3. The distribution contains an infinite 3. The distribution contains an infinite number of casesnumber of cases
4. The distribution is asymptotic – the 4. The distribution is asymptotic – the tails approach abscissa: range from tails approach abscissa: range from negative to positive infinitynegative to positive infinity
5. About 95% of distribution lies within 5. About 95% of distribution lies within 2 standard deviation from the mean.2 standard deviation from the mean.
Hypothesis TestingHypothesis Testing
Hypothesis is a tentative statement Hypothesis is a tentative statement about something.about something.
Statement concerning:Statement concerning:
a.a. Differences between groupsDifferences between groups
b.b. Relationship or association between Relationship or association between variablesvariables
c.c. Changes that occursChanges that occurs
Statement related to our prediction Statement related to our prediction about population characteristics or about population characteristics or relationshiprelationship
Statement related to research Statement related to research questionquestion
Statement must be testable or Statement must be testable or verifiableverifiable
Hypothesis statement and testing Hypothesis statement and testing help us on:help us on:
a.a. Drawing conclusionDrawing conclusion
b.b. Making implicationMaking implication
c.c. Making suggestionMaking suggestion
We are not going to prove the We are not going to prove the hypothesis is true, but we are to hypothesis is true, but we are to prove that is not true or falseprove that is not true or false
Statistical test is to test the Statistical test is to test the hypothesishypothesis
Two types of hypothesis:Two types of hypothesis:a.a. Null Hypothesis (Ho)Null Hypothesis (Ho)b.b. Alternative or Research Hypothesis Alternative or Research Hypothesis
(Ha or H1)(Ha or H1)
Null Hypothesis : A statement of no Null Hypothesis : A statement of no difference or no association (among difference or no association (among variables, samples etc)variables, samples etc)
Alternative or Research hypothesis: A Alternative or Research hypothesis: A statement asserting that there is statement asserting that there is difference or association (among difference or association (among variables, samples, etc)variables, samples, etc)
Two forms of hypothesis:Two forms of hypothesis:
1. Directional Hypothesis. Eg:1. Directional Hypothesis. Eg:
Ha: Ha: μμ >230 or >230 or
Ha: Ha: μμ < 230 < 230
2. Non-directional Hypothesis. Eg:2. Non-directional Hypothesis. Eg:
Ha: Ha: μμ = 230 = 230
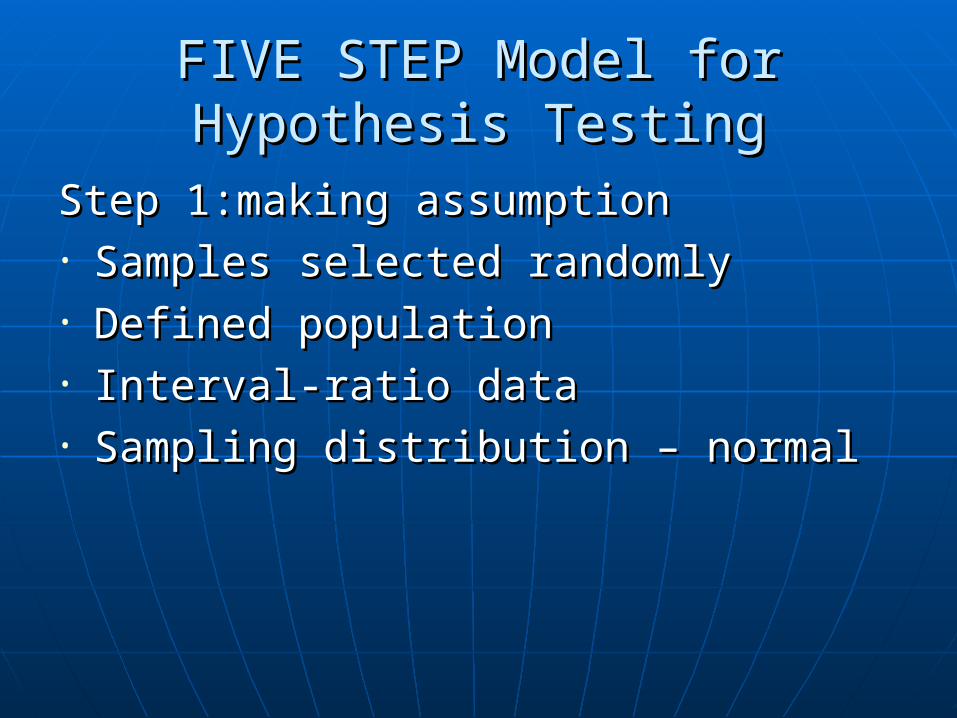
FIVE STEP Model for Hypothesis FIVE STEP Model for Hypothesis TestingTesting
Step 1:making assumptionStep 1:making assumption• Samples selected randomlySamples selected randomly• Defined populationDefined population• Interval-ratio dataInterval-ratio data• Sampling distribution – normalSampling distribution – normal
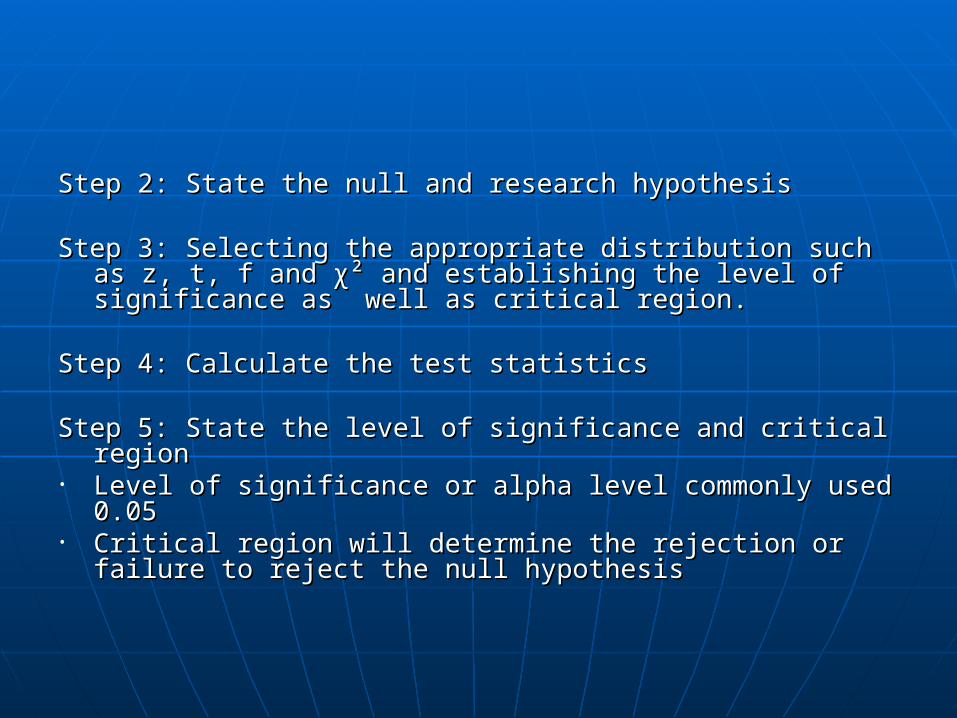
Step 2: State the null and research hypothesisStep 2: State the null and research hypothesis
Step 3: Selecting the appropriate distribution such as z, t, f Step 3: Selecting the appropriate distribution such as z, t, f and and χχ² and establishing the level of significance as well as ² and establishing the level of significance as well as critical region.critical region.
Step 4: Calculate the test statisticsStep 4: Calculate the test statistics
Step 5: State the level of significance and critical regionStep 5: State the level of significance and critical region• Level of significance or alpha level commonly used 0.05Level of significance or alpha level commonly used 0.05• Critical region will determine the rejection or failure to Critical region will determine the rejection or failure to
reject the null hypothesisreject the null hypothesis
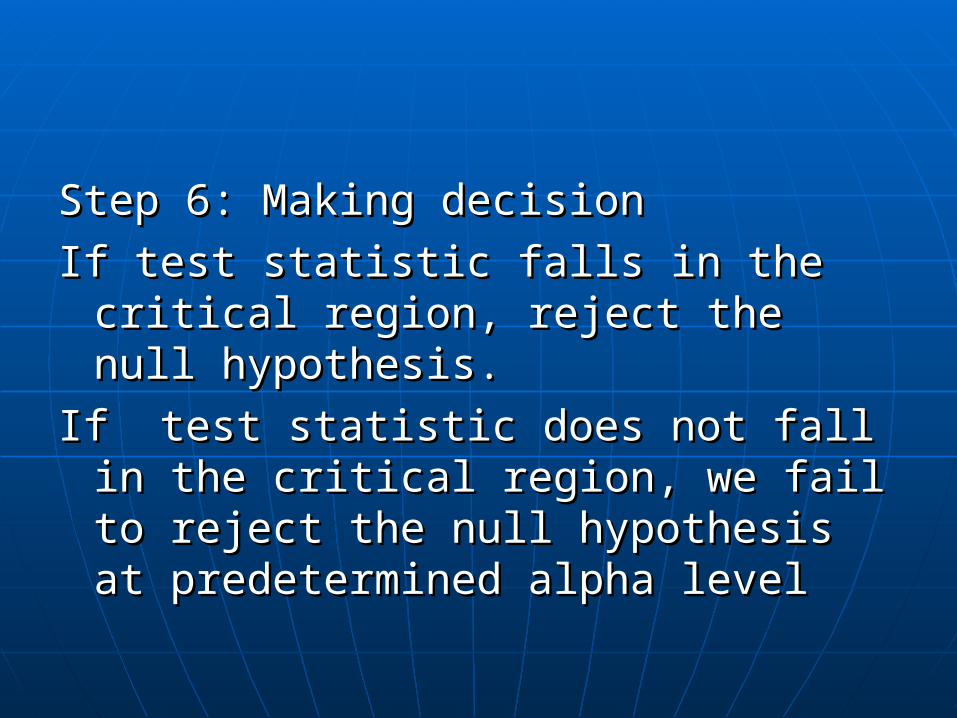
Step 6: Making decisionStep 6: Making decision
If test statistic falls in the critical If test statistic falls in the critical region, reject the null hypothesis.region, reject the null hypothesis.
If test statistic does not fall in the If test statistic does not fall in the critical region, we fail to reject the critical region, we fail to reject the null hypothesis at predetermined null hypothesis at predetermined alpha levelalpha level
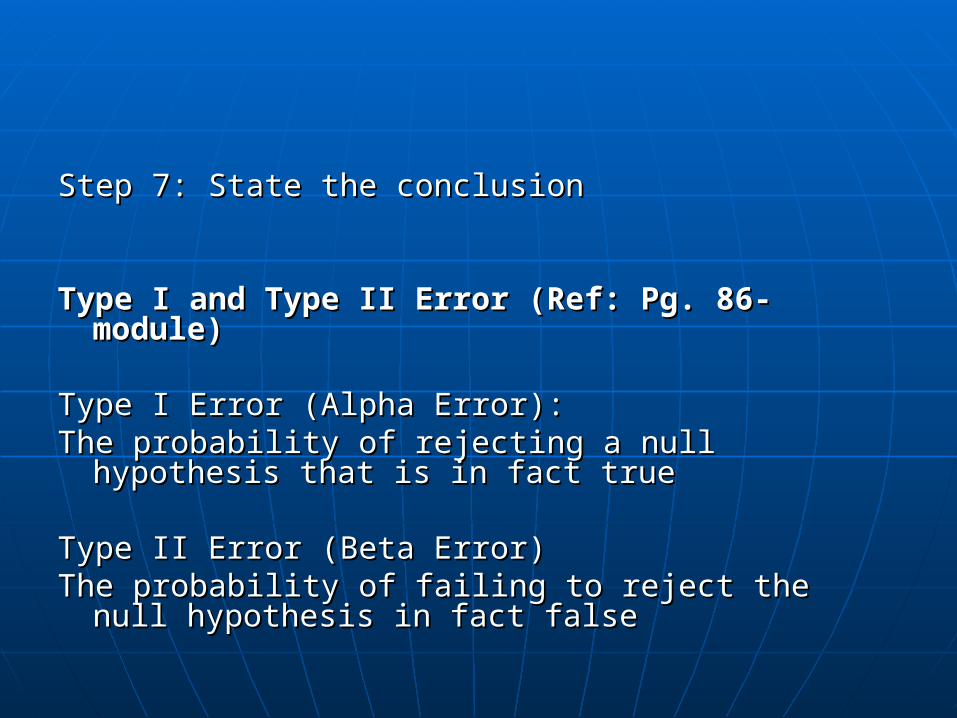
Step 7: State the conclusionStep 7: State the conclusion
Type I and Type II Error (Ref: Pg. 86-module)Type I and Type II Error (Ref: Pg. 86-module)
Type I Error (Alpha Error):Type I Error (Alpha Error):The probability of rejecting a null hypothesis that is The probability of rejecting a null hypothesis that is
in fact truein fact true
Type II Error (Beta Error)Type II Error (Beta Error)The probability of failing to reject the null The probability of failing to reject the null
hypothesis in fact falsehypothesis in fact false
Level of Significance (Alpha Level)Level of Significance (Alpha Level)
The probability of area under the sampling The probability of area under the sampling distribution that contains unlikely sample distribution that contains unlikely sample outcomes given that the null hypothesis is outcomes given that the null hypothesis is true. Also, the probability of type I errortrue. Also, the probability of type I error
Commonly expressed as 90%, 95% or 99% Commonly expressed as 90%, 95% or 99% or written as alpha = 0.10, 0.05 or 0.01or written as alpha = 0.10, 0.05 or 0.01
95%, refers to alpha 0.05 which means 95%, refers to alpha 0.05 which means that we are 95% sure of making the right that we are 95% sure of making the right decision and 5% error.decision and 5% error.
Critical RegionCritical Region
The area under the sampling distribution The area under the sampling distribution that, in advance of the test itself, is that, in advance of the test itself, is defined as including unlikely sample defined as including unlikely sample outcome given that the null hypothesis is outcome given that the null hypothesis is true.true.
Critical value of the test statistic to reject Critical value of the test statistic to reject null hypothesisnull hypothesis
Critical value is defined from the test Critical value is defined from the test statistic table corresponding to its level of statistic table corresponding to its level of significance and degree of freedom.significance and degree of freedom.
The null hypothesis is rejected when The null hypothesis is rejected when the value of test statistics exceed the the value of test statistics exceed the critical value and lies in the critical critical value and lies in the critical regionregion
One-tailed and Two-tailed TestOne-tailed and Two-tailed Test
Critical region on one side or both Critical region on one side or both sides of the distribution depending sides of the distribution depending on the nature of alternative or on the nature of alternative or research hypothesis.research hypothesis.
Eg: Ho: a = b (Two-tailed)Eg: Ho: a = b (Two-tailed)
Ha: a ≠bHa: a ≠b
Ha: a > b (One-tailed)Ha: a > b (One-tailed)
Ha: a < bHa: a < b
Two-tailed TestTwo-tailed Test
A type of hypothesis test used when A type of hypothesis test used when direction of difference between direction of difference between variables or samples cannot be variables or samples cannot be predicted (Non-directional predicted (Non-directional hypothesis)hypothesis)
Two-tailed test has a two critical Two-tailed test has a two critical regions on both sides of the regions on both sides of the distributiondistribution
One-tailed TestOne-tailed Test
A type of hypothesis test used when A type of hypothesis test used when the direction of the difference the direction of the difference between variables or samples can be between variables or samples can be predicted (Directional hypothesis)predicted (Directional hypothesis)
One-tailed test has a one critical One-tailed test has a one critical region that correspond to the region that correspond to the direction of the research hypothesis.direction of the research hypothesis.
![JADUAL WAKTU PEPERIKSAAN AKHIR SEMESTER ...JADUAL WAKTU PEPERIKSAAN AKHIR SEMESTER KETIGA 2015/16 (ASPER) TUGAS PENGAWASAN GURU BAHASA CALC [29 APRIL 2016] TARIKH/ HARI KOD KURSUS](https://static.fdokumen.site/doc/165x107/5e2df04b6e5be63ec6325cae/jadual-waktu-peperiksaan-akhir-semester-jadual-waktu-peperiksaan-akhir-semester.jpg)