Bahasa
Halaman
Undang-undang

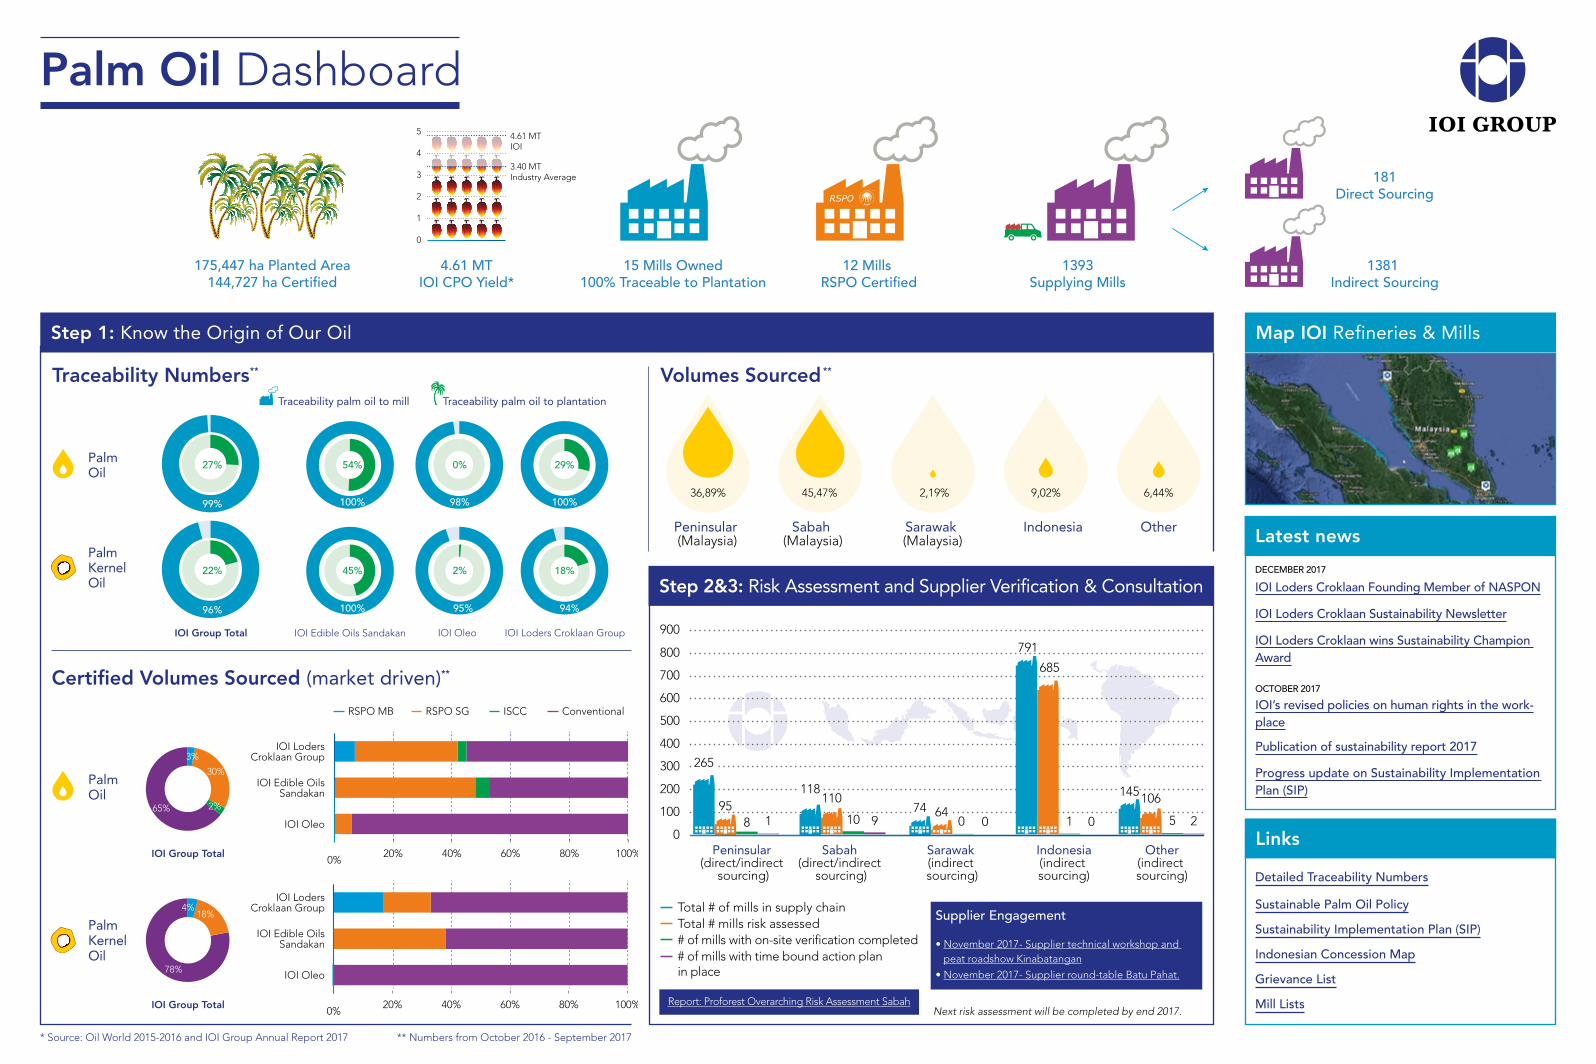
Peninsular (Malaysia)
Sabah (Malaysia)
Sarawak (Malaysia)
OtherIndonesia
6,44%36,89% 45,47% 2,19% 9,02%
Palm Oil Dashboard
175,447 ha Planted Area144,727 ha Certified
4.61 MTIOI CPO Yield*
15 Mills Owned100% Traceable to Plantation
12 Mills RSPO Certified
RSPO
1393Supplying Mills
181Direct Sourcing
1381 Indirect Sourcing
1
0
2
3
4
5 4.61 MT IOI
3.40 MTIndustry Average
Step 1: Know the Origin of Our Oil
Step 2&3: Risk Assessment and Supplier Verification & Consultation
Total # of mills in supply chain Total # mills risk assessed# of mills with on-site verification completed# of mills with time bound action plan in place
600
700
800
500
400
300
900
200
100
0Peninsular
(direct/indirect sourcing)
Sabah (direct/indirect
sourcing)
Sarawak (indirect sourcing)
Other(indirect sourcing)
Indonesia(indirect sourcing)
685
1 0
791
640 0
745 2
106145
8 1
265
95118
110
10 9
Supplier Engagement
• November 2017- Supplier technical workshop and peat roadshow Kinabatangan
• November 2017- Supplier round-table Batu Pahat.
Report: Proforest Overarching Risk Assessment Sabah
Map IOI Refineries & Mills
Links
Sustainable Palm Oil Policy
Detailed Traceability Numbers
Sustainability Implementation Plan (SIP)
Latest news
Grievance List
Palm Oil
Palm Kernel Oil
IOI Edible Oils Sandakan IOI Oleo IOI Loders Croklaan GroupIOI Group Total
99%
27%
100%
54%
98%
0%
100%
29%
Traceability palm oil to mill Traceability palm oil to plantation
22% 45% 2% 18%
96% 100% 95% 94%
Volumes Sourced **
Certified Volumes Sourced (market driven)**
0%20% 40% 60% 80% 100%
IOI Edible OilsSandakan
IOI Oleo
0%20% 40% 60% 80% 100%
RSPO MB ConventionalRSPO SG ISCC
IOI LodersCroklaan Group
IOI Edible OilsSandakan
IOI Oleo
IOI LodersCroklaan Group
Palm Oil
Palm Kernel Oil
IOI Group Total
IOI Group Total
3%
30%
2%65%
4%18%
78%
Mill Lists
* Source: Oil World 2015-2016 and IOI Group Annual Report 2017 ** Numbers from October 2016 - September 2017
Next risk assessment will be completed by end 2017.
Indonesian Concession Map
Traceability Numbers **
OCTOBER 2017
IOI’s revised policies on human rights in the work-place
Progress update on Sustainability Implementation Plan (SIP)
Publication of sustainability report 2017
DECEMBER 2017
IOI Loders Croklaan Founding Member of NASPON
IOI Loders Croklaan Sustainability Newsletter
IOI Loders Croklaan wins Sustainability Champion Award
Top Related