Analysis of Adex Size and Trend in Malaysia
29
Analysis of Adex Size and Trend in Malaysia
Transcript of Analysis of Adex Size and Trend in Malaysia

Analysis of Adex Size andTrend in Malaysia
Suruhanjaya Komunikasi dan Multimedia MalaysiaMalaysian Communication and Multimedia Commission
63000 Cyberjaya, Selangor Darul EhsanTel: 603-8688 8000 Fax: 603-8688 1000
http://www.mcmc.gov.my


| �Analysis of Adex Size & Trend in Malaysia
FOREWORD 2EXECUTIVESUMMARY 3ADEXSIZECOMPARATIVES 4Selected Countries Adex versus Malaysia 4ASEAN Countries Adex 5MALAYSIANADEX 6Trend and Current Market Share 6Key Broadcasting Statistics 2005 7 HouseholdPenetration(TVandRadio) 7 BroadcastRevenueandAdex 7Television Sector 8 IndustryStructurebyEconomicComposition 8 TelevisionRevenue 8 AdexTrendsbyLanguage(FTATV) 9 SectorOrganisation 9 TelevisionStations:Calculated“Discounts”onAdvertisingRates 9 Free-To-AirTelevision(FTATV) 10 AdexandYear-On-Year(YOY)GrowthbyChannels 10 No.ofAdvertisementsandAdvertisementsinseconds 11 AdvertisingRatesbyTVstations 11 EBITDAandOperatingMarginsincludingContrastwithASTRO 11 ChannelPortfolioObjectives 12 Pay-TV:ASTRO 12 Revenue:SubscriptionversusAds 12 SubscriberAcquisitionCosts&ChurnincludingARPUTrends 12 LaunchofMEASAT-3andDTHCompetitiveAnalysis 13Radio Sector 14 MalaysianRadioSectorOrganisationandAdexbyRadioStations 14 TrendofRadioAdexversusYearsinOperation 14 CompetitiveAnalysisofRadioStationAdvertisements 15 AdexTrendsbyLanguage 15ADEXGROWTHTRENDS 16Selected Developed and ASEAN Countries 16 MalaysianAdexGrowthCloselyRelatedtoGDP 16 GDPperCapitaversusAdexperCapita 16 Adexas%ofGDP 16 BroadcastAdexas%ofGDPandbyMedium 17 AdexForecasts 17FACTORSAFFECTINGADEXTRENDS 18Regulations under the CMA 18Switchover to Digital including 18Digital Radio Developments 19Advertising Avenues Widening 19 IPTV–FastDeveloping 20 MobileTV–AdsontheWay 21 Postal–NewRevenueStreamPotentialfromDirectMail 22 Online–AdsMoreEntrenched 23 InteractiveTV–NewEmergingWave 24CONCLUSION 25Adex Potential 25Conducive Environment 25CONTACTUS 26
Contents

Analysis of Adex Size & Trend in Malaysia2 |
The Malaysian Communications and Multimedia Commission (MCMC) is working to publish a number of topical industry reports during the year. The Report on Analysis of Adex Size and Trends in Malaysia is the first of such reports planned for 2007.
The publication features comparisons of the Malaysian advertising expenditure (adex) with those of selected developed countries, ASEAN and Asia Pacific countries. The analysis includes highlights on adex size compared to GDP of the country; adex compositions in its various forms such as Free-To-Air television (FTA TV) as well as pay-TV and radio channels in Malaysia; discount factors; trends in adex growth and factors peculiar to Malaysia and those affecting this trend in the immediate years to come such as digitisation and the switchover to digital.
The analysis in the publication are based on various information sources such as internal information from the MCMC as well as external data and information purchased or obtained from licensees’ company accounts and reports, newswires, economic reports, and industry research reports and database sources.
A soft copy of this report is available at the MCMC’s website at:
http://mcmc.gov.my/what_we_do/Research/industry_studies.asp
I trust this document will provide useful information to readers and indeed can serve as a catalyst to constructive business ideas and perspectives that can propel the communications and multimedia industry development. We welcome feedback that will help us improve our industry reports in the future. Please send your comments to [email protected].
Thank you.
Yang Berbahagia Datuk Dr. Halim ShafieChairmanMalaysian Communications and Multimedia Commission
Foreword

| �Analysis of Adex Size & Trend in Malaysia
Advertising expenditure (adex) is the revenue realised from the sale of advertising. It is a paid form of non-personal communication that is conveyed through media such as TV, radio, newspapers, magazines, direct mail (currently at least in the US), public transport vehicles, outdoor displays and the Internet. It is one of the most important revenue component of the mass media business and an essential economic indicator as it contributes significantly to the growth of a country.
Adex growth worldwide was encouraging in 2005, registering USD309 billion among our list of selected countries for comparison purposes. The US is the largest spender followed by Japan (USD50 billion) and China (USD39 billion). In the ASEAN region, Malaysian adex was worth USD1.5 billion, at fourth place after Philippines (USD2.5 billion), Indonesia (USD2.5 billion) and Thailand (USD2.2 billion). Overall, the global advertising market value is expected firm in 2006 and 2007, with industry estimates at USD509.2 billion and USD536.5 billion respectively.
The Malaysian adex market posted above average steady growth in the 1980’s and remained resilient since the financial crisis in 1997/1998 mainly because of the resilient domestic economy which has made possible for a host of major events and other social and technological development to take place that have spurred adex growth. In many markets, broadcasting remains the most important media for adex. As technology advances, more sophisticated delivery platforms are emerging. TV switchover to digital is a transformation that offers much enhanced images to viewers, and added versatility in operations. Malaysia’s government-owned Radio Television Malaysia (RTM) is currently pilot testing for digital TV, which is paving the way for shutdown of analogue TV in year 2015. Another favourite platform in Malaysia and other Asian countries is the Direct-To-Home (DTH) pay-TV services, currently supplied by ASTRO in Malaysia, which is another potential growth area for adex.
Free-To-Air (FTA) TV adex in Malaysia is worth RM1.2 billion as of October 2006 and an annualised RM1.4 billion for 2006, while ASTRO’s pay-TV services have annualised adex of RM119.4 million. With the newly-launched MEASAT-3 satellite, ASTRO will have more channels to offer advertisers both in Malaysia, and Indonesia where it launched its services in early 2006. Radio is one of the cheapest media in advertising. Era FM and My FM of ASTRO take the lion’s share in advertising, raking in a combined adex of RM70.1 million.
Adex is seen developing in many ways, with new platforms such as IPTV, mobile TV, postal, online and interactive TV services. Many of these platforms are still at an initial stage of development, and penetrating the market, albeit TV operators, mobile operators, advertisers, advertising agencies and web site partners are all joining hands and collaborating to create ways to effectively reach customers, particularly offering personalising options to cater to customer preferences. These new platforms make it easier for customers to communicate and advertisers to target their customers in engaging relevant advertisement.
Adex outlook remains positive, particularly in the Asia Pacific region, led by explosive economic growth in China and India. Against this backdrop, Malaysia is rapidly moving to deploy new technologies to compete in the broadcasting landscape. It is up to the stakeholders, industry players and regulators to create a conducive environment for new adex business models to grow and old ones to rejuvenate to tap the existing potential of generating higher adex levels in Malaysia, thus contributing to the wealth of the private sector as an engine of growth, and to the nation as well.
Executive Summary

Analysis of Adex Size & Trend in Malaysia4 |
Adex Size Comparatives
SELECTED COUNTRIES ADEX VERSUS MALAYSIA
As the largest economy in the world, the US accounts for 50% of the aggregate adex in our list of countries, totaling USD309.292 billion, and about one third of the world adex at USD404.110 billion in 2005. The US adex market of USD139.765 billion is bigger than the adex markets of Japan, China and the UK combined at USD122.729 billion.
Adex by medium shows the broadcasting industry leads the media channels for advertising, accounting for USD140.202 billion in 2005. Although very small compared to the giant adex markets, Malaysian print adex registered USD0.779 billion, which is peculiarly more than those for India, New Zealand and Taiwan where broadcasting medium is more popular. Malaysia’s adex profile is, however, similar to that of UK, with print medium more popular for adex compared to broadcast.
United StatesJapanChinaUnited KingdomGermanyAustraliaSouth KoreaHong KongIndiaNew ZealandTaiwanMalaysia
WORLD ADEX
12,4564,5602,2241,8182,984
711787177
3,699108346146
26.67817.25530.687
7.746n.a.
2.8372.0341.9151.1501.0280.1480.351
91.829
31.4030.411
n.a.n.a.n.a.n.a.n.a.
0.479n.a
0.0260.510
*0.311
33.140
56.72112.110
8.31112.857
n.a.2.9373.5933.0440.6040.4750.7740.779
102.210
10.9791.5030.4331.154
n.a.0.4180.2180.1570.0720.1490.1030.047
15.233
13.98419.120
n.a.11.142
n.a.0.486
n.a.0.2090.2620.1530.0860.030
45.472
139.76550.39939.43132.89921.413
6.6785.8455.8042.0881.8311.6211.518
309.292
404.110
45.216.312.710.6
6.92.21.91.90.70.60.50.5
100.0
GDP USD
(billion)FTA TV Pay-TV Print Radio Others Total
Adex
% of Total Adex
Adex 2005 USD (billion)
Countries
n.a. - not available *ASTRO net adex Source: Nielsen Media Research Service, TNS Media Intelligence, Dentsu Inc., Zenith Optimedia, MCMC
Land area (km2)Population (million)Income per capita (RM) Adults (Age 15+) (million)Citizens (million): Bumiputera Chinese Indian Others
330,25226.64
18,03916.77
*16.59
*6.04*1.78*0.25
Basic Demographics of Malaysia 2006
*2005 figure Source: Economic Planning Unit, Statistics Department, Economic Report 2006/2007
Source: Nielsen Media Research Service, TNS Media Intelligence, Dentsu Inc., MCMC
Selected Countries Adex 2005 Market Share
United States45.2%
Japan16.3%
China12.7%
United Kingdom10.6%
Malaysia0.5%
Taiwan0.5%
India0.7%
Hong Kong1.9%
Germany6.9%
Australia2.2%
South Korea1.9%
New Zealand0.6%

| 5Analysis of Adex Size & Trend in Malaysia
ASEAN COUNTRIES ADEX
Adex Size Comparatives
The Philippines, Indonesia and Thailand share the highest adex market share, with well over USD2 billion worth of adex. This appears to be underpinned by their large population base versus other ASEAN countries.
The print medium in Malaysia posts highest adex among other ASEAN countries. Malaysia’s pay-TV medium is gaining attention among advertisers. With a combined adex of USD0.7 billion in the television segment alone, the additional revenue under pay-TV medium is expected to receive a boost as Malaysia’s sole satellite pay-TV operator recently launched its third satellite.
The global advertising market was valued at USD430.8 billion in 2000. However, it declined in 2001 following a general economic slowdown and rising unemployment across the globe. The market recovered in 2002 and reached a CAGR1 of 1.7% from 2000 until 2004. The estimated global adex market value is firm for both 2007 and 2008.
PhilippinesIndonesiaThailandMalaysiaSingaporeBruneiCambodiaLaosMyanmarVietnam
TOTAL ASEAN ADEX
87.900242.000
65.500**26.640
4.3000.300
14.0006.000
n.a83.800
1.7121.7221.2200.3510.433
n.a. n.a.n.a.n.a.n.a.
5.438
0.159n.a.n.a.
*0.311n.a.n.a.n.a.n.a.n.a.n.a.
0.47
0.2140.7530.6040.7790.495
n.a.n.a.n.a.n.a.n.a.
2.845
0.394n.a.
0.1720.0470.106
n.a.n.a.n.a.n.a.n.a.
0.719
n.a.n.a.
0.1770.0300.079
n.a.n.a.n.a.n.a.n.a.
0.286
2.4792.4752.1731.5181.113
- - - - -
9.758
25.425.422.315.611.3
-----
100.0
Population (million) FTA TV Pay-TV Print Radio Others
Total Country
Adex
% of ASEAN Adex
Adex 2005 USD (billion)ASEANCountries
n.a. - not available *ASTRO net adex **2006 figures Source: Nielsen Media Research Service, MCMC
ASEAN Countries Adex 2005 Market Share
Philippines25.4%
Indonesia25.4%
Singapore11.3%
Malaysia15.6% Thailand
22.3%
Source: Nielsen Media Research Service
200020012002200320042005(e)
2006(e)
2007(e)
430.8413.0419.2436.3460.2483.6509.2536.5
Global Advertising Market ValueUSD (billion)
(e) - estimateSource: Datamonitor
1 CAGR – Compound Annual Growth Rate. This is a formula to measure the annual growth rate of a market over a period of several years. It is a constant percentage rate at which a market would have to grow, year-on-year, to reach its current value from the value in a base year.

Analysis of Adex Size & Trend in Malaysia6 |
Malaysian Adex
Overall, adex growth for the media sector in Malaysia remains positive, except for a negative growth in 1998 due to the Asian financial crisis. The 1980s and 90s saw double-digit growth until 1996, with an exceptional year in 1991, posting growth of 34.9%. In 1999, adex spurred double-digit again until year 2000. A decline by 21.2% in 2001 was due to the effects of Dot Com bust and economic downturn. The CAGR is 14.1% from 1988 to 2005. Fundamental to adex growth is the still resilient Malaysian economy.
Malaysian Adex�988 - October 2006
5
4
3
2
1
0
40
30
20
10
0
-10
-20
-30
RM (b
illio
n)
Gro
wth
(%)
1988
28.1
0.5 0.6 0.81.1 1.2 1.4
1.72.0
2.42.6
2.12.5
3.1 3.2 3.43.8
4.54.7
4.0
24.8 25.4
34.9
12.1 15.2 16.620.9 19.8
8.8
-17.8
16.6
24.4
3.2 6.211.8
18.4
4.4
1989 1990 1991 1992 1993 1994 1995 1996 1997 1998 1999 2000 2001 2002 2003 2004 2005 Oct-2006
Adex RM (billion) Adex Growth (%)
TREND AND CURRENT MARKET SHARE
Main Events
Launch of New Economic Development Programme and Vision 2020. Continued growth from 1990 events such as inaugural Visit Malaysia Year tourism promotion event.Recovered from economic crisis; started first Formula One Petronas Malaysian Grand Prix at Sepang International Circuit; general elections; World Cup Golf Malaysia; launch of Petronas Twin Towers; and Multimedia Super Corridor in Cyberjaya.Continued growth from 1999 events; KLSE Composite Index milestone rise to 1,000 points.Effects of Dot Com bust, economic downturn and 9/11 terrorist attacks on US.New FTA TV channel; 8TV launched; General Elections; “Tak Nak!” anti-smoking campaigns; international events such as the Greek Summer Olympics and the Euro Cup. FIFA World CupVisit Malaysia Year 2007; Beijing Olympic Games 2008
Note: Includes ASTRO net adex since 2003 Source: Nielsen Media Research Service, MCMC
Year1991
1999
2000
2001
2004
20062007/08
Malaysian Adex Market Share YTD October 2006
Source: Newswires, MCMC
Note: Includes ASTRO net adexSource: Nielsen Media Research Service, MCMC
Note: Includes ASTRO net adex since 2003Source: Nielsen Media Research Service, MCMC
Adex Quarter-to-Quarter(200�-October 2006)
Newspaper56.3%
Cinema0.4%
Point of Sale1.0%
Outdoor2.1%*Pay-TV
3.0%Magazine
3.1%
Radio3.9%
FTA TV30.2%
TotalRM3.974
billion
5,000
4,000
3,000
2,000
1,000
0
RM (m
illio
n)
2001
1Q 2Q 3Q 4Q
2002 2003 2004 2005 2006
692
771
835
859
739
905
891
913
782
862
1,010
1,108
989
1,105
1,156
1,212
1,085
1,157
1,186
1,235
1,054
1,215
1,714

| �Analysis of Adex Size & Trend in Malaysia
Malaysian Adex
KEY BROADCASTING STATISTICS 2005 Household Penetration (TV and Radio)
With Media Prima as the owner of all FTA private TV stations, RTM-government and ASTRO in the pay-TV segment, the broadcasting sector revenue posts positive contribution to the industry - from RM2.023 billion in 2004 to RM2.388 billion in 2005, an encouraging growth of 18.1% for the period.
n.a.- not available *Adjusted year-end ** Jan - Dec 2006Source: Company Reports, RTM (Ministry of Information)
Media Prima*ASTRO RTM
Total Broadcasting
328.41,694.8
104.8
2,128.0
399.71,988.7
101.2
2,489.6
YTD Sep 2006
RM (million)Broadcast Revenue
20052004
387.81,638.8**113.0
2,139.6
Television and radio remain the most important traditional media for advertisements. With technology advancing fast, traditional broadcasting is gradually transforming to revitalize the industry – changing the prevalent traditional “analogue” formats we have today to the new digital models in time. Benefits of digital formats include significantly improved services, more channels, clearer and better quality of picture and sound, delivering on new platforms to viewers and listeners in the new model of digitisation and digital formats.
As the migration from analogue to digital technology proceeds, advertisers are tuned in to the added value it can provide in terms of more versatile delivery of advertisements such as interactivity, on demand options, targeted audience and listeners and the accompanying better reach via personalisation of programmes and services.
Malaysia had a total of 5.7 million households in 2005 and out of this 97.6% owned TV. More than 80% have radios, albeit not counting car radios considering its heavy numbers in Malaysia. Such household TV and radio reach is supported by six FTA TV channels; a sole satellite pay-TV; and two new entrants in the pay-TV segment. Currently, there are a total of 18 radio stations operating in Malaysia, in which are owned by three radio media operators.
Broadcast Adex
Broadcast Adex(Jan-Oct 2006)
RTM13%
ASTRO8%
Radio10% TV
90%
Source: Nielsen Media Research Service, Company Reports, MCMC
TV Adex Revenue(RM1.320 billion)
MediaPrima69%

Analysis of Adex Size & Trend in Malaysia8 |
Malaysian Adex
Undoubtedly, TV adex takes the lion’s share of the broadcast adex pie, comprised of three major media players, RTM, Media Prima and ASTRO, with an aggregate RM1.32 billion worth of adex. Although TV and radio form the second largest contribution to the adex cake after print, the broadcasting advertising revenue growth is expected to outpace the print medium in the next few years. The revenue growth is likely to be seen through major sports events and improved quality of local and foreign programmes from TV operators, which likely will increase viewership and directly improve the effectiveness of advertising.
Being highly segmented, radio is successfully generating more consumer interest. It was reported that nine out of ten people tune in to radio every week. In the increasingly competitive media arena, ASTRO leads the radio media, dominating radio adex airwaves with multi-radio channels. In 2005, Media Prima entered the fray with two new radio channels.
Adex by Medium(200�- YTD October 2006)
131.25,000
4,500
4,000
3,500
3,000
2,500
2,000
1,500
1,000
500
0
RM (m
illio
n)
40.138.0
46.4
46.8
138.2
55.0
103.9 112.5
119.4
993.8
1,300.7 1,309.9
1,201.0921.9
878.1
2,524.5
2,837.8 2,936.3
2,361.12,343.12,118.9
152.5 168.8 178.2 154.2144.4119.7
2001 2002 2003 2004 2005 YTD Oct 2006
Radio Print FTA TV *Pay-TV Others
* Includes ASTRO net adex since 2003Source: Nielsen Media Research Service
TELEVISION SECTOR Industry Structure by Economic Composition
Television Revenue
Revenue Growth for Total TV Industry200�-2005
TV Adex(Jan-Oct 2006)
3,500
3,000
2,500
2,000
1,500
1,000
500
0
RM (m
illio
n)
2001 2002 2003 2004 2005
43%
11%67%
36%
Total
Subscription Fees
FTA TV Adex
SubcriptionTV Adex
*ASTRO9%
TV211%
TV14%
TV94%
8TV14%NTV7
17%
TV341%
FTA TV Adex(RM1.201 billion)
FTA TV91%
Source: Nielsen Media Research Service, Company Reports * Calendarised Net AdexSource: Nielsen Media Research Service, Company Reports, MCMC
CAGR (%)01-05

| 9Analysis of Adex Size & Trend in Malaysia
Malaysian Adex
From 2001 until 2005, the total television industry revenue achieved a CAGR of 36%, in which mostly subscription fees from pay-TV operators accounted for the bulk of growth. Subscription TV adex accounts for 9% of TV adex in Malaysia, worth an annualised RM119.4 million. FTA TV adex is worth RM1.2 billion as of October 2006, representing 91% of the total TV industry adex. Media Prima holds 76% of the total FTA TV adex pie.
Bahasa Malaysia advertisements are preferred by advertisers, raking in not only more revenue but also posted 22.1% growth from 2004. The Government has encouraged the use of Bahasa Malaysia in foreign advertisements so as to widen the usage of the national language. Advertisements in other languages is observed to be declining.
Source: Nielsen Media Research Service
Bahasa MalaysiaEnglishChineseTamilOthers
446.5309.8181.6
60.60.7
2004 vs 2005Growth (%)RM (million)
Languages2005200�
22.1-13.8
-1.4-41.6-30.1
Adex Trends by Language (FTA TV)
481.8368.3323.5
24.3102.9
7.918.978.1
-59.914,600
588.1317.3319.1
14.271.9
2004 200� vs 2004Growth (%) RM (million)
Sector OrganisationTelevision
FTA TV PAY-TV
Commercial - Private terrestrial broadcast
Government - owned: terrestrial TV broadcast
ASTRO - Satellite DTH
TV3Fine TV - VOD/IPTVNTV7
8TV
TV9
RTM1
RTM2
MiTV -IPTV
Source: MCMC
Television Stations: Calculated “Discounts” on Advertising Rates
TV38TVNTV7TV9TV1TV2Fine TVMiTVASTRO
TOTAL
TV Stations2005 Audited
Accounts Net RevenueRM (million)
Non-discountedGross TV Adex
RM (million)
Discount Factor
304.461.141.0
1.0n.a.n.a.
--
*2,005.0
2,412.5
565.3215.9332.0
1.840.9
154.1---
1,310.0
260.9154.8290.9
0.8 -- - --
707.4
53.928.312.457.6
-----
n.a. - not available * Adjusted year-end Source: Company Accounts, MCMC, Nielsen Media Research Service
RM (million) (%)

Analysis of Adex Size & Trend in Malaysia10 |
Malaysian Adex
Nielsen Media Research Service adex report is based on rate card, so this does not include discounts negotiated. As such, we term Nielsen Media Research Service adex as non-discounted “gross TV adex” in contrast to company revenue source of adex that is recorded on a “net of discount basis” or termed as “net revenue”. Therefore, the gross adex in 2005 totaled RM1.31 billion and excludes pay-TV adex. In contrast, Government-owned channels raked in a total of RM195 million of gross TV adex.
An analysis for indicative size of discounts showed that TV3 has about 54% discount factor. In contrast, the newly introduced TV station, TV9 has a discount factor of about 58%. The average discount factor for the FTA TV industry is a calculated figure of 38%. It is logical that higher discounts create lesser revenues for TV operators. As such, TV stations would experience higher revenue if reduction of discounts are successfully negotiated with the programmers and advertisers. Industry experts suggest that excessive discounts could be reduced on better bargaining power with advertisers in terms of bulk bookings and cross-selling opportunities for TV, radio and newspapers.
Free-to-Air Television (FTA TV)
Adex and YOY2 Growth by Channels
FTA TV Channels Adex RM (million)
200� 2002 200� 2004 2005 YTD Oct 2006
Adex Growth%
57103421297
--
878
-12.3-15.6
-2.3-9.5
--
-39.7
6789
456310
--
922
17.5-13.6
8.34.4
--
16.6
33155525282
7-
1,002
-50.874.215.3-9.0
--
29.7
27141565386
46136
1,301
-19.4-9.07.6
36.8557.1
-
573.1
41154565332
2216
1,310
53.89.20.0
-14.0-96.158.5
11.4
4714
546228
4884
967
TV1TV2TV3NTV7TV98TV
Total
Source: Nielsen Media Research Service, Zenith Optimedia, MCMC
FTA TV charted the highest adex in year 2005 exceeding RM1.3 billion, augmented by two new entrants from the Media Prima family, 8TV and TV9. As of October 2006, only TV1 and TV9 managed to surpass their adex figure from year 2005. The growth of TV3 is observed to be relatively s t e a d y . However, the newer stations post growth rates that are more volatile, albeit from small base.
FTA TV Channels Adex
100
80
60
40
20
0
-20
-40
-60
Gro
wth
%
2001 2002 2003 2004 2005
TV3
NTV7
TV2
TV1
Source: Nielsen Media Research Service, Zenith Optimedia, MCMC
2 Year-On-Year (YOY) – A calculation of growth from previous to current year.
TV StationsGrowth
%Adex Adex Growth
%Adex Growth
%Adex Growth
%Adex
| ��Analysis of Adex Size & Trend in Malaysia
Malaysian Adex
At more than 75,000 advertisements with 20.6 million of advertisements in seconds, the year 2004 was a bumper year for advertisements.
No. of Advertisements and Advertisements in Seconds
Source: Nielsen Media Research Service, MCMC Source: Nielsen Media Research Service, MCMC
FTA TV: No. of Advertisements200� - Oct 2006
FTA TV: No. of Advertisement in Seconds200� - Oct 2006
TV1 TV2 TV3 NTV7 TV9 8TV
0.8
0.7
0.6
0.5
0.4
0.3
0.2
0.1
02001 2002 2003 2004 2005 YTD
Oct 06
0.27
0.18
0.060.05
0.23
0.19
0.070.05
0.15
0.21
0.10
0.05
0.18
0.22
0.10
0.05
0.09
0.11
0.16
0.23
0.11
0.07
0.01
0.14
0.13
0.22
0.10
0.06
0.04
0.13
(mill
ion)
TV1 TV2 TV3 NTV7 TV9 8TV
2001 2002 2003 2004 2005 YTDOct 06
25
20
15
10
5
0
(mill
ion)
6.04
4.95
1.911.50
5.15
5.54
2.35
1.59
4.20
5.74
3.22
1.65
4.48
5.83
3.07
1.57
2.66
3.01
4.52
5.63
3.47
2.32
0.20
3.65
3.41
5.33
3.11
1.77
1.01
3.28
Advertisement Rates by TV Stations
For calculation on the rate of an advertisement in seconds, advertising charges differ. Industry experts indicated that it is such that for a 30 second advertisement during peak hour, the charge could be as much as RM21,000 per advertisement. However, this would still differ in terms of whether it is a moving picture or a non-moving picture. For a moving picture during peak hour in a 60 seconds advertisement, a normal charge would be around RM40,000 whereas for a non-moving picture during non-peak hour, the charge is around RM250 per advertisement. Advertisement packages can be in the form of text advertising, sound slide and infoservice. These packages indicate the minimum investment that an advertiser would have to put in depending on the duration of an advertisement, airtime placement, the number of spots and the format of the advertisement.
EBITDA and Operating Margin Including Contrast with ASTRO
ASTRO: EBITDA & Operating Margin Media Prima: EBITDA & Operating Margin
Source: Company reports Source: Company reports
Media Prima and ASTRO both were equally strong in 2003, with EBITDA and operating margin being in a steady position in which period the Media Prima group underwent management and structural changes and ASTRO made its public listing debut.
Operating Margin(%)EBITDA Margin (%)
70
60
50
40
30
20
10
0
%
2003 2004 2005 3Q 2006
57.7
27.7 26.2 26.9 24.4
19.818.519.0
30
25
20
15
10
5
0
%
Aug 2003 -Jan 2004
FY End2005
FY End2006
YTD 3Q2007
10.5
16.9
21.5
17.5
13.6
21.6
25.8
Operating Margin(%)EBITDA Margin (%)
17.0
Analysis of Adex Size & Trend in Malaysia12 |
Malaysian Adex
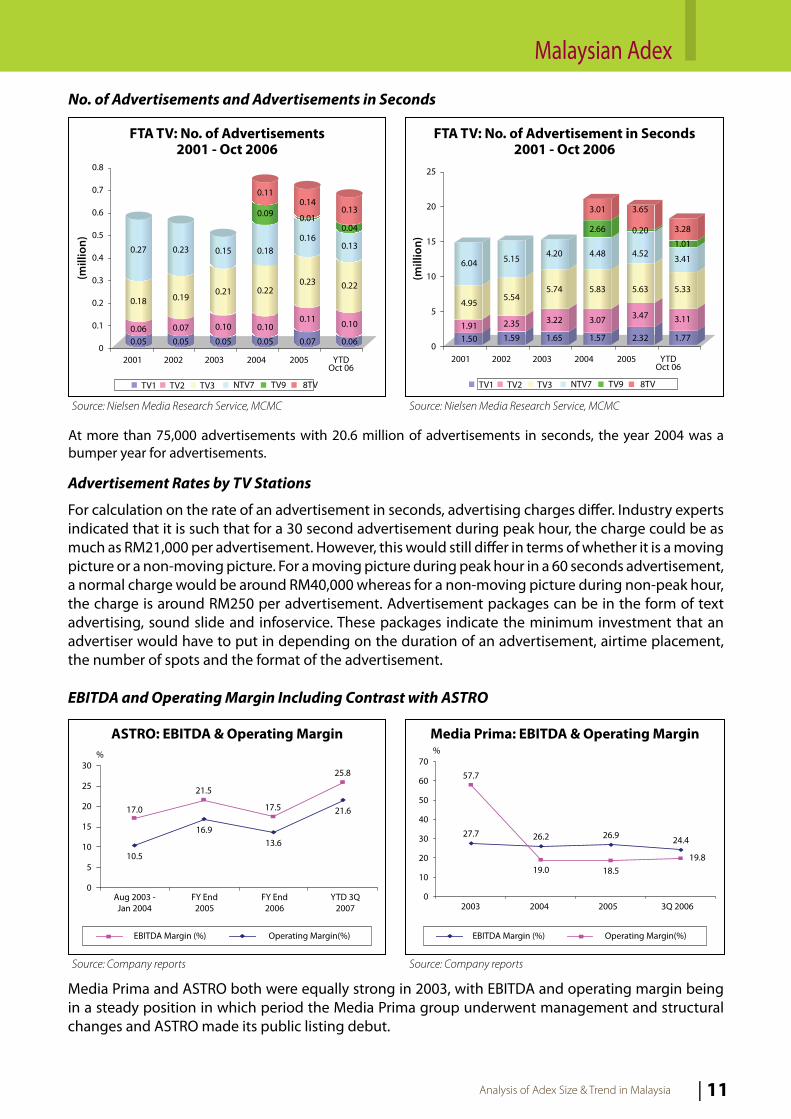
Channel Portfolio Objectives
TV3
NTV7
8TV
TV9
Channel Target viewers Positioning Advertising FocusFMCG products, communications, services, transportation
Brands targeting the Malaysian urban middle to high class. Image products and lifestyle
Brands targeting the young urban, sports, energy drink, fashion, and Chinese viewers health and wealth related
FMCG products, non traditional advertisers, government
Channel synonymous with family, real-life, entertainment and news content leaning towards cultural proximity
Television as a form of escapism, “my feel good channel”
Tastemaker, energetic and differentiation in content – “we are different”
Traditional Malay skewed content with a mixture of drama, real-life and current affairs
Mass market skewed towards Malay audience, with progressive mindsets
Malaysian urban households, 25-45 age group. Kids and Chinese audience
Young Malaysian Urban, Chinese audience, 15-24 age group
Mass market, skewed towards “traditionalist” Malay audience
Source: Media Prima
Pay-TV: ASTRO
Revenue: Subscription Versus Ads
ARPU Trends
Since the public-listing of ASTRO in 2003, the subsequent year subscription revenue more than doubled, with concurrent increase in advertising revenue. Although the sole satellite pay-TV operator in Malaysia, ASTRO’s ARPU shows decline over the years. This could be due to more low-revenue generating customers added to their base, resulting from more affordable packages offered. This is a trade off nevertheless if the objective is to grow market share as a first priority.
3 Subscriber Acquisition Cost (SAC) is a cost incurred in activating new subscribers for the period under review in the TV subscription service, including sales and marketing related expenses and subsidized set-top box equipment costs.4 Churn is the difference between total subscriber disconnections and total reconnections of previously disconnected subscribers computed as a moving annual total over the period in review.
SAC3 AND CHURN4
Source: Company reports, MCMC Source: Company reports, MCMC
Source: Company reports
Subscription Revenue versus TV Adex
ARPU82
81.581
80.580
79.579
78.578
77.577
81
Aug 2003 -Jan 2004
RM
80
79
78
FY End2005
FY End2006
YTD 3Q2007
450400350300250200150100
500
371.9
RM (m
illio
n)
Aug 2003 -Jan 2004
FY End2005
FY End2006
YTD 3Q2007
336.9384.3
196.6
1614121086420
%
10.6
7.99.0
13.4
ChurnSAC
SAC and Churn
TV AdexSubscription Revenue
2,0001,8001,6001,4001,2001,000
800600400200
0
584.6
1,375.71,641.1
1,335.8
108.7113.7
106.2
55.0
Aug 2003 - Jan 2004 FY End 2005 FY End 2006 YTD 3Q 2007
RM (m
illio
n)

| ��Analysis of Adex Size & Trend in Malaysia
Malaysian Adex
For countries such as UK, Japan, Germany and France, DTH pay-TV subscribers are at a double-digit increasing trend, with UK having the highest subscriber rate at 31.5 million in 2005. Industry experts are expecting 100 million digital DTH pay-TV subscribers by the end of 2008, continuing the DTH reign as the top digital TV platform. However, challenges such as upgrading technological infrastructure and creating a fair regulatory environment will occur as competition heats up among TV operators.
Meanwhile, for ASTRO, branching into the Indonesian market has been encouraging. As a newcomer in Indonesia, ASTRO was able to register 45,000 customers since their launch in February 2006. With the launch of MEASAT-3, ASTRO will be able to increase its channels to 120 from 48 channels currently in Indonesia. Reflecting the growth of telecommunications technology, ASTRO is expecting three million subscribers in the next three years.
Launch of MEASAT-3
ASTRO, with the MEASAT-3 newly-launched in December 2006 will be able to provide viewers more programmes containing new and fresh content plus a greater selection of TV channels and easy access to high-speed Internet connections throughout the country. It will not only increase viewers’ preferences but it is also expected to directly improve the reach and effectiveness of TV advertising.
Competitive Analysis (DTH)
MEASAT-� Ku-Band
Features• High-powered C-band coverage over 70% of the world’s population• High-powered DTH quality Ku-band coverage over 60 million TV households• Improve communications network with the new high bandwidth, Very Small Aperture Terminal (VSAT) networks, servicing broadcasting applications such as High Definition Television (HDTV) and Video On Demand (VOD)
GeographicCoverage
Design Life
South Asia, Malaysia and Indonesia15 years
Source: Company press release
Country TV Station
*Includes Free-To-Air DTHs Source: TV International (3 November 2006), Asiacom, Company reports
Australia Foxtel AustarChina CBSatIndia Dish TVIndonesia IndovisionJapan SkyPerfect CommsMalaysia ASTRONew Zealand Sky Network TVPhillipines Dream Broadcast SystemSouth Korea SkylifeThailand UBC*UK Sky DigitalFrance CanalSat TPSGermany PremiereCanada Bell ExpressVu Star Choice
Pay-TV Subscribers (DTH) (million)2Q-4Q-200� 2004 2005 YTD 2Q 2006
1.11.30.20.10.19.23.31.60.12.90.6
23.58.03.78.34.12.4
1.71.90.20.50.2
12.95.72.30.25.81.2
30.811.5
5.212.1
5.83.3
2.02.10.21.70.4
13.66.82.20.37.11.3
31.512.3
5.513.6
6.53.4
1.01.10.12.30.27.73.81.40.23.71.0
15.46.42.77.03.51.7

Analysis of Adex Size & Trend in Malaysia14 |
Malaysian Adex
RADIO SECTOR Malaysian Radio Sector Organisation
Radio
Government
RTMSTAR RFMAMP
Commercial
Source: MCMC
Radio Adex
AMP radio stations continue to take up a major portion of radio adex market share in Malaysia, accounting for approximately 80% market share. ASTRO reported that their eight radio stations command a weekly listenership of 11.2 million people, representing 60% of the listening share.
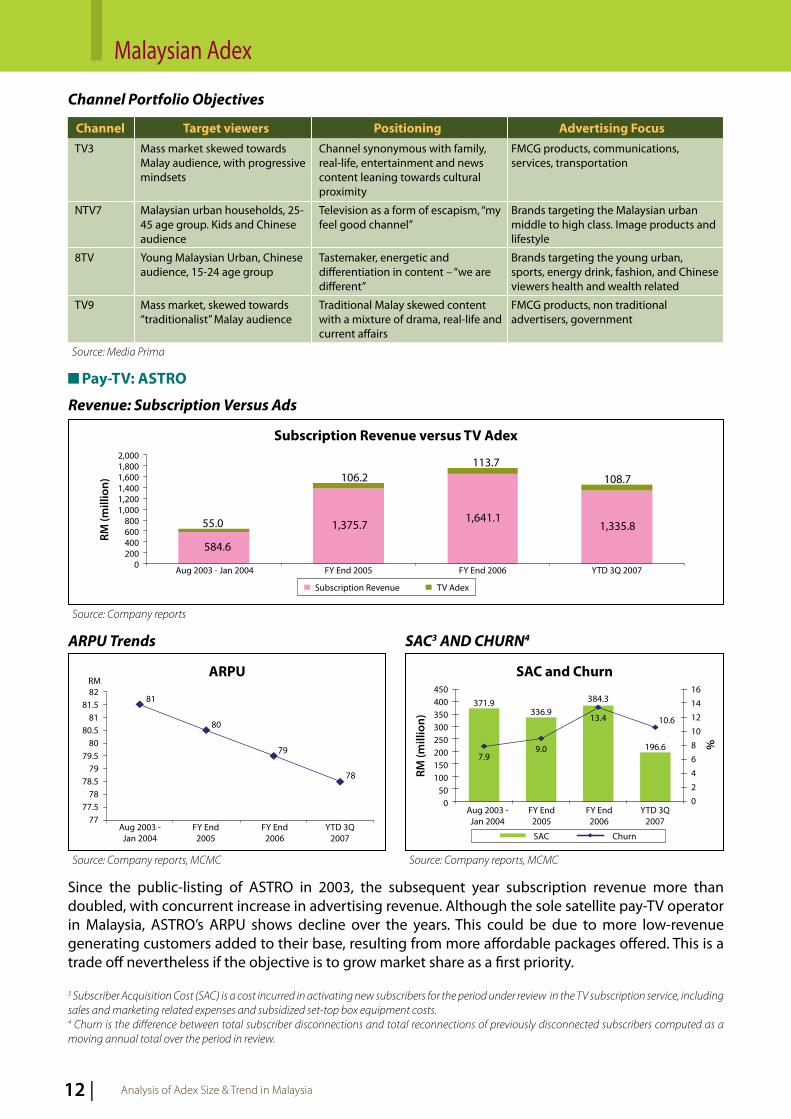
Trend of Radio Adex Versus Years in Operation
Era FM of AMP with just seven years in operation leads in terms of radio advertising revenue, raking in RM41.7 million as of end 2005. Government-owned radio, Nasional FM is the longest serving radio channel, of 46 years, while Minnal FM collected the highest adex among the RTM channels of RM3.3 million as at December 2005. Meanwhile, redi 988 of STAR RFM has been in operation for nine years and has surpassed a few of AMP radio stations adex, leading to stiff competition in the industry.
RM (million)*Revenue Adex
2005 2005 YTD Oct 2006
Market Share Adex(%)
Media
AMPSTAR RFMRTM
TOTAL
70.325.216.2
111.7
141.924.412.1
178.4
122.019.113.2
154.3
79.112.4
8.5
100.0n.a. - not available * Revenue as per company accountsSource: Nielsen Media Research Service, RTM (Ministry of Information)
Radio Adex by Stations
AMP (under ASTRO)Era FMHitz FMLight & EasyMix FMMy FMSinar FMTHRXfresh FMSTAR RFM redi 988red 104.9RTM KL FM (RMS KL)Nasional FM (RMS 1)Traxx FM (RMS 4)Ai FM (RMS 5)Minnal (RMS 6)Music FM (RMS Music)Selangor FM (RMS S’gor)Other Regional (RTM)Grand Total
Source: Industry, MCMC
41.719.910.525.628.9
4.59.51.3
22.61.8
0.92.40.63.13.31.40.4
0178.4
38.915.7
8.719.925.3
5.86.21.5
17.91.2
0.61.40.64.02.40.90.33.0
154.3
Radio Station 2005RM (million)
YTD Oct-06RM (million)
| �5Analysis of Adex Size & Trend in Malaysia
Malaysian Adex
Source: Nielsen Media Research Service, MCMC
Competitive Analysis of Radio Station Advertisements
Media
Era FMhitz.fmLight & EasyMix FMMy FMredi 988red 104.9KL FM (RMS KL)Nasional FM (RMS 1)Traxx FM (RMS 4)Ai FM (RMS 5)Minnal (RMS 6)Muzik FM (RMS Muzik)Selangor FM (RMS S’gor)Sinar FMTHRXfresh FMOther Regional (RTM)
Total No. of Ads(million)
2005 0.12 0.06 0.04 0.08 0.10 0.12 0.02 0.01 0.01 0.03 0.02 0.04 0.01 0.01
0.03 0.05 0.01
-
0.090.040.040.050.080.080.01
0.0030.0040.003
0.020.03
0.0040.005
0.040.050.010.01
3.44 1.69 1.32 2.28 3.08 3.12 0.56 0.16 0.21 0.09 0.57 0.80 0.20 0.15 0.89 1.56 0.26
-
2.661.251.021.542.362.200.310.090.120.080.450.540.110.111.081.310.300.33
YTD Oct 2006 2005 YTD Oct 2006
Total No. of Ads in Seconds (million)
Source: Nielsen Media Research Service, MCMC
Radio Adex Trends by Language
Bahasa MalaysiaEnglishChineseTamilOthers
37.152.144.4
3.515.4
Radio advertisers prefer Bahasa Malaysia as their chosen language given the bulk of radio listeners are Malay or are Malay literate, and the most popular radio station is in Malay.
Language RM (million)200� 200� vs 2004
Growth (%)
Source: Nielsen Media Research Service
Radio Adex versus Years in Operation45
40
35
30
25
20
15
10
5
0
Era Fm
MY FmMix Fm
redi 988hitz.Fm
Light & EasyTHR
Sinar FMXfresh FM
red 104.9Selangor FM(RMS S’gor)
Minnal FMAi FM (RMS 5)
Muzik FM(RMS Muzik) KL FM
(RMS KL)
Nasional FM(RMS 1)
RM (m
illio
n)
5 10 15 20 25 30 35 40 45 50
No. of Years
0
2004 2004 vs 2005Growth (%)
2005
45.660.150.4
2.913.1
22.915.413.5
-17.1-14.9
52.958.554.9
3.310.2
16.0-2.78.9
13.8-22.1
RM (million)

Analysis of Adex Size & Trend in Malaysia16 |
Adex Growth Trends
SELECTED DEVELOPED AND ASEAN COUNTRIES Malaysian Adex Growth Closely Related to GDP
In tandem with the moderate growth of the economy, Malaysian adex growth recorded a more passive growth of 4.4% in 2005. Pending detailed analysis, the initial observation shows that there is a positive relation between advertising expenditure per capita and GDP per capita, that is, countries with higher GDP per capita also cite higher adex per capita. Hong Kong is observed to have higher adex per capita compared to UK and New Zealand. Hong Kong is a unique economy, nevertheless, with high service industry oriented growth, established broadcasting sector and “city-state” characteristics.Source: Nielsen Media Research Service, Zenith Optimedia,
www.economist.com., MCMC
GDP per Capita versus Adex per Capita
Hong Kong also shows the highest contribution of adex to GDP at 3.3%. With GDP at USD98.4 billion, Philippines has second highest adex to GDP in contrast to other developed countries. Despite a GDP of USD4,560 billion, the highest among our list of countries, Japan’s adex contributed 1.1% of adex to GDP in 2005. Noteworthy is that Malaysia contributed 0.8% of adex to GDP, higher than South Korea, Taiwan and India.
Adex as % of GDP
Source: MCMC, Zenith Optimedia, www.economist.com
Source: Nielsen Media Research Service, www.economist.com
Malaysia Adex Growth Relation to GDP2000 - 2005
GDP Growth Adex Growth
25
20
15
10
5
0
% Adex Growth % GDP Growth
12
10
8
6
4
2
02000 2001 2002 2003 2004 2005
GDP per capita (USD ‘000)
1,000
800
600
400
200
0
x1 - Thailandx2 - Chinax3 - Indonesiax4 - Philippines
IndiaMalaysia Taiwan
South Korea
Singapore
JapanAustralia
United States
United Kingdom
Hong Kong
New Zealand
x3 x2 x1
x40 10 20 30 40 50
Ade
x pe
r cap
ita
(USD
‘000
)
GDP per capita versus Adex per capita : Selected Developed and ASEAN Countries 2005
3.53.02.52.01.51.00.5
0
Indi
a
Taiw
an
Sout
h Ko
rea
Mal
aysi
a
Indo
nesi
a
Aust
ralia
Sing
apor
e
Japa
n
Uni
ted
Stat
es
Thai
land
New
Zea
land
Chin
a
Uni
ted
King
dom
Phili
ppin
es
Hon
g Ko
ng
0.10.5 0.7 0.8 0.9 0.9 1.0 1.1 1.1 1.2
1.7 1.8 1.8
2.5
3.3
Adex as a % of GDP : Selected Developed and ASEAN Countries 2005
Ade
x as
% o
f GD
P

| ��Analysis of Adex Size & Trend in Malaysia
Broadcasting Adex as % of GDP by Medium
2005 Adex in USD (billion)
Broadcasting as % of GDP
United States Japan China United Kingdom Australia South Korea Hong Kong India New Zealand Taiwan Malaysia PhilippinesIndonesiaThailandSingapore
* ASTRO figures only (net adex) n.a. - not availableSource: Nielsen Media Research Service, TNS Media Intelligence, Dentsu Inc., Zenith Optimedia, MCMC, www.economist.com, www.cia.gov
GDP FTA TV Pay-TV Radio
Adex % of GDP Adex % of
GDP Adex % of GDP
Countries
12,4564,5602,2241,818
711787177
3,699108346146
98281176116
26.67817.25530.687
7.7462.8372.0341.9151.1501.0280.1480.3511.7121.7221.2200.433
0.2140.3781.3790.4260.3990.2581.0780.0310.0010.0430.2390.1590.6120.6910.371
31.4030.411
n.a.n.a.n.a.n.a.
0.479n.a.
0.0260.510
*0.3110.159
n.a.n.a.n.a.
0.2520.009
n.a.n.a.n.a.n.a.
0.27n.a.
0.000240.1470.2120.162
n.a.n.a.n.a.
10.9791.5030.4331.1540.4180.2180.1570.0720.1490.1030.0470.394
n.a.0.1720.106
0.0880.0330.0190.0630.0590.0280.0880.002
0.00010.0300.0320.400
n.a.0.0970.091
0.5540.4201.4000.4890.4580.2861.4360.0331.1100.2200.4832.3020.6120.7710.460
The highest broadcasting adex as a percentage of GDP is that of the Philippines, at 2.3% with TV accounting for the highest adex. The highest broadcasting adex as percentage of GDP among our list of countries is China. Hong Kong has the highest for pay-TV and United States for radio.
Adex Forecasts by Region
Region2006 200� 2008 2009
USD(billion)
%Growth
USD(billion)
%Growth
USD(billion)
%Growth
USD(billion)
%Growth
North America
Western Europe
Asia Pacific
Central & EasternEurope
Latin America
Africa/MiddleEast/*ROW
183.182
101.544
90.542
27.21
19.732
12.812
5.2
3.5
5.9
16.6
7.2
22.8
190.828
105.391
96.217
31.455
20.568
14.188
4.2
3.8
6.3
15.6
4.2
10.7
198.634
109.706
103.334
35.994
21.57
15.863
4.1
4.1
7.4
14.4
4.9
11.8
205.69
114.442
109.441
41.006
22.647
17.588
3.6
4.3
5.9
13.9
5.0
10.9
Industry experts are forecasting adex growth in Asia Pacific to accelerate due to the Beijing Olympics in 2008, however there is a drop slightly in 2009. Double-digit growth rates are expected to continue in China, India and Indonesia.
Asia Pacific, Central and Eastern Europe and the Middle East are major drivers for the world adex growth. For North America, adex is forecasted to grow slow as US economic growth continues to subside from its 2004 peak. The Western Europe region accelerated in 2006 due to hosting of major sport events, such as the Winter Olympics in Italy, and the football World Cup in Germany.
* Rest of World Source: Zenith Optimedia
Adex Growth Trends
Analysis of Adex Size & Trend in Malaysia18 |
Factors Affecting Adex Trends
REGULATIONS UNDER THE CMAContent Applications Service Provider individual licences or CASP(I) and licences registered under the Communications and Multimedia Act,1998 (CMA), are subject to the requirements as stated in the Content Code, section 211 of the CMA and special licence conditions relating to content requirements. This includes advertising content in Malaysia. It is noted that for overall content, there are also conditions relating to language/local content requirements, where conditions differ between the licences, and may be applicable to advertising content.
The Content Code was formulated by the Communications and Multimedia Content Forum (CMCF) and was officially registered with the MCMC on 1 September 2004. The Content Code is available at www.cmcf.org.my
Prohibition on provision of offensive content, that is, no content applications provider, or other person using a content applications service, shall provide content which is indecent, obscene, false, menacing, or offensive in character with intent to annoy, abuse, threaten or harass any person.
A person contravening subsection (1) commits an offence and shall, on conviction, be liable to a fine not exceeding RM50,000 or to imprisonment for a term not exceeding one year or to both and shall also be liable to a further fine of RM1,000 for every day or part of a day during which the offence is continued after conviction.
Section 2�� on Content Requirements of the CMA (as at 2006)
Content RequirementsThe Licensee shall provide local content programmes and those that promote Malaysian culture and national identity.
Prohibited Content The Licensee shall not provide any content which:- directly propagates any religious belief other than Islam which has been approved by the Department of Islamic Development Malaysia of the Prime Minister’s Department (Jabatan Kemajuan Islam Malaysia, Jabatan Perdana Menteri);- may upset the sensibilities and sentiment of any race or religion in this country;- contains cultural and moral values that are against the community aspirations of the nation.
Commercial AdvertisementsThe Licensee shall ensure that the period of transmission of commercials advertisements shall not exceed ten minutes during each one hour of transmission; and that all commercial advertisements transmitted shall comply with the Advertising Code which has been adopted by the Ministry of Energy, Water and Communications. For the purpose of this condition, “Commercials Advertisements” means any content which is transmitted through any electronic media for the purpose of advertisement and its transmission is paid by the advertiser.
Censorship Of ContentAll content to be transmitted by the Licensee shall be subjected to the Film (Censorship) Act, 1952 and Regulation made hereunder including any statutory revisions or re-enactments made after the effective date of this license. The Licensee shall ensure that all content is censored and approved by the Film Censorship Board (Lembaga Penapisan Filem) before its transmission, as required under the law.
Special Licence Conditions under the CMA (as at 2006)
SWITCHOVER TO DIGITALThe new digital environment brings more than a thousand lines per picture as opposed to a few hundred lines on most of our TV sets today. Such is high-definition TV or HDTV, which makes pictures extremely clear, achievable through digital broadcasting; sending huge quantities of data to TV sets through cable, satellite and terrestrial transmission. This is an encouraging example of one of the benefits of digital TV. Overall, the switchover from analogue to digital is at various stages across various countries.
| �9Analysis of Adex Size & Trend in Malaysia
Asia Japan South Korea Malaysia Philippines Australia ChinaEurope UK Netherlands France Germany Italy Sweden Finland Norway Spain Nordic CountriesAmericas US Brazil
2006-2011From 20052015201520122007From 2008-201211 Dec 2006*2009-20112007-20082008From 2005-200720072007-200920102010
From 2006-20092016
Analogue TV Shutdown
Top �0 Digital Music Sales Markets 2005
USJapanUKGermanyFranceItalyCanadaSouth KoreaAustraliaNetherlands
636278
693928161512
75
689
6266473171424182
32913834536929585918
Trade Revenues
USD (million)
Sales by Channel (%)
CountriesOnline Mobile
*First country gone completely to digital broadcastingSource: Newswires, IDATE, MCMC
Source: International Federation of the Phonographic Industry (IFPI)
5 “Digital Formats Continue to Drive the Global Music Market” - Press Release 31 March 2006, International Federation of the Phonographic Industry (IFPI)
DIGITAL RADIO DEVELOPMENTS
• Open standard digital radio system for shortwave, AM/mediumwave and longwave• Used for a range audio content, including multilingual speech and music• Uses existing AM broadcast frequency bands, ideal where new spectrum is unavailable• Offers high-quality multichannel audio and rich media services such as mobile video• Operates more like a TV system with respect to transmitter, RF bandwidth and RF system• Ability to have a system for both AM and FM which allows the digital signal to co-exist with the analogue signal on standard frequencies• Supports multiple audio channels and advanced data services including visual content• Digital television (DTV) and digital audio broadcasting (DAB) format that Japan has created to allow radio and TV stations there to convert to digital
• Based in Silver Spring, MD, US• Many channels are free of advertising and are known for their high quality programs with “near CD quality” audio.Sirius:3 satellites in elliptical orbit - subscription service XM: 2 satellite in geostationary orbit - subscription service and carries advertising
Digital Radio Mondale (DRM)
Digital Audio Broadcasting/Digital Multimedia Broadcasting (DAB/DMB-T)HD Radio or In Band On Channel (IBOC)
Integrated Services Digital Broadcasting (ISDB-T)Satellite RadioWorldspace
Sirius and XM
UK
South Korea
US
Japan
Africa, Asia and Europe
North America
StandardsTerrestrial Features Country
Source: ABU Digital Radio Convention 2006, Newswires
Digital formats have now become the driving force in the global music market. Digital music sales globally nearly tripled in value, from USD400 million in 2004 to USD1.1 billion in 20055. Digital radio is another development hitting markets and opening wider avenues for advertisements in new formats or traditional advertising over new delivery formats.
Total Digital Market
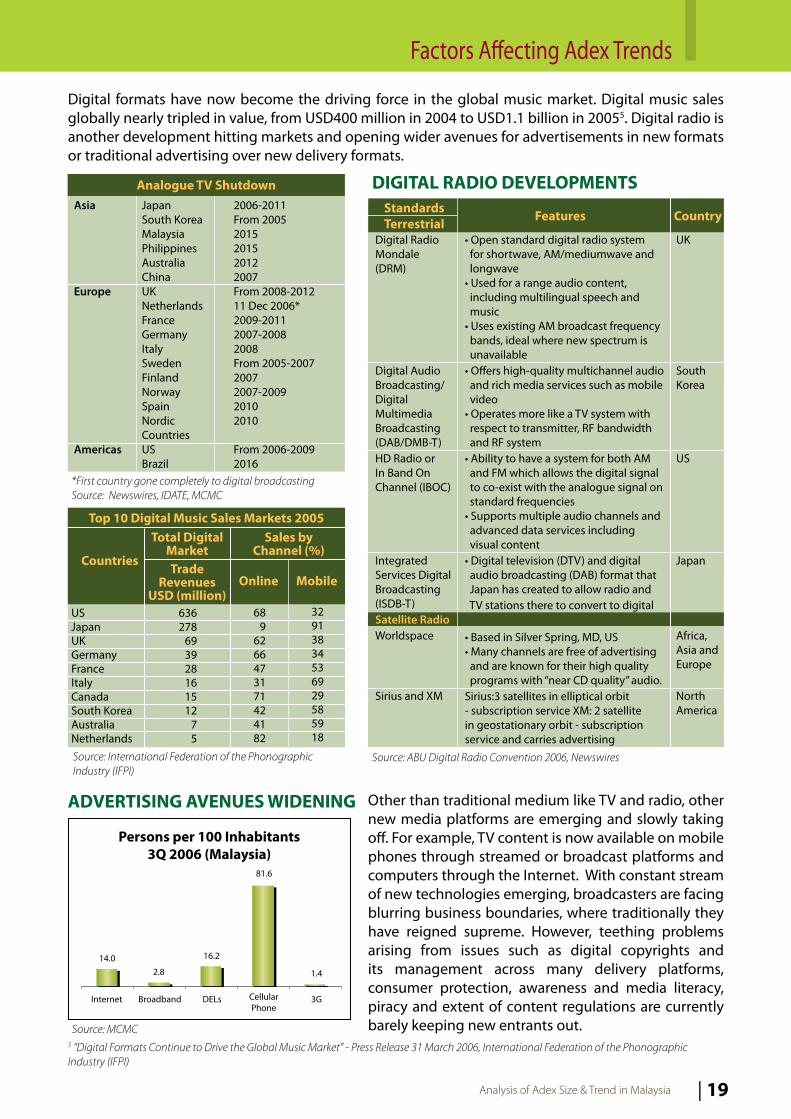
ADVERTISING AVENUES WIDENING Other than traditional medium like TV and radio, other new media platforms are emerging and slowly taking off. For example, TV content is now available on mobile phones through streamed or broadcast platforms and computers through the Internet. With constant stream of new technologies emerging, broadcasters are facing blurring business boundaries, where traditionally they have reigned supreme. However, teething problems arising from issues such as digital copyrights and its management across many delivery platforms, consumer protection, awareness and media literacy, piracy and extent of content regulations are currently barely keeping new entrants out.Source: MCMC
Internet Broadband DELs Cellular Phone
3G
1.4
81.6
16.2
2.814.0
Persons per �00 Inhabitants�Q 2006 (Malaysia)
Factors Affecting Adex Trends

Analysis of Adex Size & Trend in Malaysia20 |
Factors Affecting Adex Trends
Wherever in the world there is connection to the Internet, IPTV is able to deliver the same channels as received at home. Well, this is yet to arrive in its entirety considering the many different stages of network development. A technical reality is that streaming of HD content typically requires a dedicated 12 Mbps per stream. For example, reports indicate that for BT Vision to offer HD IPTV services, there is a requirement to wait until BT Wholesale rolls out its upgraded network from 2007 onwards.
IPTV is to date developing at rapid pace globally, with expectations of subscriber boost as higher bandwidth, standardisation, and advanced compression technology becomes pervasive compared to current emergent status. IPTV subscribers today is more than 2.5 million worldwide, reaping revenue of over USD0.5 billion and potential viewers to be well over 25 million subscribers in 2010.
A key aspect of IPTV is its delivery using broadband links to viewers’ homes. As the links are in place to deliver Internet, which is highly personalised, it allows TV to be delivered in a highly personalised way as well. This is not possible using cable, satellite or terrestrial on broadcast format where one source of content is delivered to everyone. Thus, TV advertising on IPTV is more personalised.
Focus on Video on Demand (VOD) as differentiator from cable and satellite. Launching HDTV. Bundling of services to include video calling into TV services.Upgrading to MPEG4 in 2006 to enable high definition launch. Aiming also for multiroom and HD.Deutsche Telekom (T-Online) is launching 100-channel service available to 10 German cities. Will use Bundesliga soccer and link-up with Premiere to drive take-up.Telekom Austria (AonDigital TV) has more than 40 channels for its AonDigital IPTV service and similarly for VOD deals. ReelTime (ScreenTime Media) closing on VOD content deals with Paramount and Universal. Plans to launch set-top box with an integrated DTT tuner to enable broadcast-channel element.PCCW’s Now Broadband TV is working with Star to export Now BB into Asian markets with low pay-TV take-up. South Koreans on trials for IPTV.SMG (Shanghai Media Group) is in discussion with China’s communications and media regulatory authorities on a national roll-out of IPTV services.MTNL is seeking regulatory approval to launch IPTV. Expected to launch late 2006.
France
Spain
Germany
AustriaAustralia
Hong Kong
South KoreaChina
India
Country IPTV Highlights
Source: TV International 30 Jun-06, Korea Times, ipTVnews Analys May-06, IPTV Daily 1Sep-06
IPTV – Fast Developing
IPTV – Countries at Various Stages
6 “Lessons in Addressable IPTV” – 10 September 2006, IBC Daily
According to an international specialized-advertising company, a new system called Addressable IPTV Advertising6 enables broadcasters, network operators and advertisers to tailor IP-based advertising to viewers. The platform is designed to show different advertisements on different TVs based on criteria like demographics and geography. In this case, addressable advertising means targeted advertising. For viewers, channels that come through IPTV platforms will simply provide advertisements that are more relevant and engaging.

| 2�Analysis of Adex Size & Trend in Malaysia
Factors Affecting Adex Trends
Mobile operators in Malaysia are currently offering mobile TV services using the 2G/2.5G/2.75G or 3G networks to stream TV content to mobile handsets. This is helped by recent upgrades, such as HSDPA (High-Speed Downlink Packet Access) which more than doubled the speeds for data transfer. Maxis and Celcom collaborates with ASTRO for their 3G video content which are distributed and supported on a 24x7 daily basis.
Interestingly, mobile TV might actually improve the take-up of 3G services for mobile operators, since the subscriber rate was patchy when introduced in 2005. This might be ‘a killer type application’ that could accelerate 2G users to 3G networks and become major source of new income for telcos, as 3G handset prices decline. However, the downside of streamed services is that it uses voice bandwidth thus lowering the overall capacity of the network for all users.
In countries like South Korea, Japan, US and Italy, live broadcast TV is used as their mobile TV platform. However, the question of which broadcast mobile TV technologies has the strongest offer, is still very much debated. Nevertheless, mobile TV advertising has high potential for revenue streams. Mobile operators are opening their services to advertising, working with publishers and vendor partners to pilot various approaches such as WAP. Other platforms emerging are video, downloads and search. Negotiations among broadcasters, mobile operators, advertisers and ad agencies should sort out who controls what portion of the investment. Advertisers are happy to tap into this market in view of the dual function of handsets allowing consumers to immediately call an advertiser in response to a commercial.
In the US, Verizon Wireless and Sprint Nextel have launched initiatives to test how consumers react to short video advertisements on their mobile phones. In Europe, 3 and Orange have begun selling banner advertisements on their portals to drive users to click on games and video downloads. In Asia, China Mobile and China Unicom have plans to sell advertising space via SMS/MMS, games, IVR and mobile Internet services. Operators like 3 HK and SmarTone-Vodafone are partnering with media agencies and advertisers rolling out mobile advertising campaigns. Industry experts are forecasting global mobile TV advertising revenues will rise from USD173 million in 2006 to USD577 million in 20077.
Mobile TV – Ads on the WayMaxis
July 2005Over 20 Variety Package: Entertainment Daily, MTV 2Go, Cartoon Network, ASTRO Hitz.TV, CNN, Channel Add-On: Discovery Mobile, Fashion TV, CNBC Asia, BBC World, Bloomberg, Jia Yu Entertainment, Jaiyu News, ASTRO Ria, ASTRO AEC, ASTRO VaanavilSports TV: European Tour, Arsenal TV, Barca TV, LiverpoolFC.TVRadio Package: MY FM, Era FM, Hitz FM, Lite FM, Mix FM*Variety Package: RM20 per monthChannel Add-On: RM5 per month for each channelSports TV: RM20 per monthRadio Package: RM5 per monthOne-day Access: RM1 per channel, per dayAla-Carte/Single Channel: RM8 per channel, per month*free 30-day trial period
EDGE, GPRS
DiGiSeptember 20067 D’Channels:DiGi News, DiGi Sports, DiGi Toons, DiGi Music, DiGi Fashion, Jia Yu, SCTV Clips:Latest music videos
D’Channels:7 channels: RM14.905 channels: RM10.003 channels: RM8.001 channel: RM6.00Clips:Monthly package: RM14.90Weekly package: RM8.00Pay per view content: RM4.00EDGE, GPRS
CelcomMay 20058Live TV:TV3, NTV7, 8TV, Cartoon Network, Bloomberg, CNBC, MyNewsNetwork, CNN
Currently free for both TV3 and 8TV channels (For 3G subscribers only). Updates on package price will be notified soon.
GPRS, WCDMA 2.0 (3G)
MalaysiaDate LaunchedNo. of ChannelsChannels
Package Price
Technology
Source: Company reports, MCMC
7 “Ads Migrate to Your Handset” – 13 November 2006, telecomasia.net
Analysis of Adex Size & Trend in Malaysia22 |
Factors Affecting Adex Trends
Competing Standards on Mobile TVFeatures
• As of 11 July 2006, had 111,000 subscribers • 9 channels at the launch, plan to increase to 20 at the end of the year and 40 for 2008• Business models: Pay-TV, Free-to-Air, Pay-per-view• Packages: Pay-as-you-go users - €3 per day, €12 per week or €29 per month. Alternatively, €49 per month to all of the mobile TV services, one hour of calls per day and one GB of internet downloads per month.• In 2005, successfully piloted its DVB-H mobile broadcast network in Pittsburgh. • Service content: Live TV, Live Radio - Music videos, cartoons, sports, news• Currently working on a nationwide deployment of its network to the top 30 US markets, with launches targeted throughout 2007.• To begin pilot DVB-H broadcasts in Las Vegas.• Will use Aloha’s spectrum to deploy its DVB-H network.• Business models: Pay-TV, Free-to-Air, Pay-per-view• S-DMB: 11 TV channels, 25 radio channels and 3 data channels (As of October 2006, subscribers stood at 843,300)• T-DMB: 11 TV channels, 25 radio channels and 8 data channels (As of October 2006, subscribers stood at 2.21 million)• ISDB-T is the same system that will be used in Japan to deliver DTV services to the home, allowing greater economies of scale for providers, with minimal service interruption for consumers.• Developed in Japan for NHK (Japan Broadcasting Corp.) and only used in Japan for mobile TV.• FLO™ technology is a new air interface with multicasting capabilities designed to increase capacity and reduce content delivery costs to mobile handsets. • Enables mobile users to see and hear high quality video and audio, browse and buy merchandise, or watch the stock ticker - wherever they are, anytime, and without delays.
Network Operator3 Italia (launched the world’s first commercial mobile TV service using DVB-H technology on 5 June 2006)
Modeo (formerly known as Crown Castle Mobile Media)
Hiwire (a division of Aloha Partners)TU Media (subsidiary of SK Telecom)
NTT DoCoMo / KDDI
Qualcomm
CountryItaly
US
US
SouthKorea
Japan
US
StandardDVB-H
DMB
ISDB-T (One Seg)
MediaFLO
(Extracted from telecomasia.net (November 13, 2006 – “Ads migrate to your handset”)Source: Company websites, www.dvb-h.org, ABU Weekly News Digest (17 November 2006), MCMC
Postal - New Revenue Stream Potential from Direct Mail
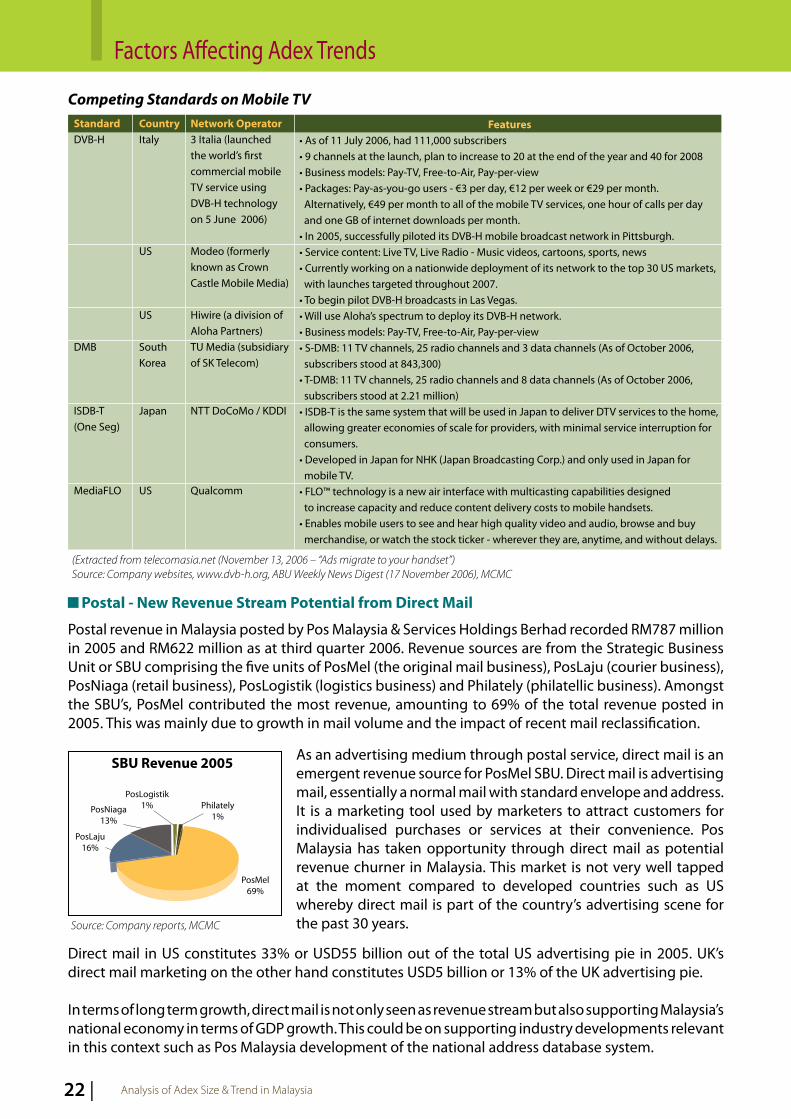
Postal revenue in Malaysia posted by Pos Malaysia & Services Holdings Berhad recorded RM787 million in 2005 and RM622 million as at third quarter 2006. Revenue sources are from the Strategic Business Unit or SBU comprising the five units of PosMel (the original mail business), PosLaju (courier business), PosNiaga (retail business), PosLogistik (logistics business) and Philately (philatellic business). Amongst the SBU’s, PosMel contributed the most revenue, amounting to 69% of the total revenue posted in 2005. This was mainly due to growth in mail volume and the impact of recent mail reclassification.
Source: Company reports, MCMC
SBU Revenue 2005
PosLaju16%
PosNiaga13%
PosLogistik1% Philately
1%
PosMel69%
As an advertising medium through postal service, direct mail is an emergent revenue source for PosMel SBU. Direct mail is advertising mail, essentially a normal mail with standard envelope and address. It is a marketing tool used by marketers to attract customers for individualised purchases or services at their convenience. Pos Malaysia has taken opportunity through direct mail as potential revenue churner in Malaysia. This market is not very well tapped at the moment compared to developed countries such as US whereby direct mail is part of the country’s advertising scene for the past 30 years.
Direct mail in US constitutes 33% or USD55 billion out of the total US advertising pie in 2005. UK’s direct mail marketing on the other hand constitutes USD5 billion or 13% of the UK advertising pie.
In terms of long term growth, direct mail is not only seen as revenue stream but also supporting Malaysia’s national economy in terms of GDP growth. This could be on supporting industry developments relevant in this context such as Pos Malaysia development of the national address database system.

| 2�Analysis of Adex Size & Trend in Malaysia
Factors Affecting Adex Trends
Online – Ads More Entrenched
Online advertising market may be a virtual marketplace but it is delivering real results. The reason is that the Internet is relatively cheap and can reach its target effectively. It is suitable for smaller advertisers and for some, traditional mass media campaigns may be too expensive or wasteful.
Online advertisers use lucrative marketing channels offered by Google and Yahoo. Their sales referrals are generated by clicks on the brief advertising links popularised by the two Internet powerhouses. Google, Yahoo and partner Web sites are paid each time someone clicks on advertising links usually displayed at the top and on the side of Web pages. Advertisers pay the commission even when the click doesn’t produce a sale. However, it was reported recently that click frauds emerged and fleeced millions of dollars from online advertisers, costing advertisers USD800 million in 20058.
European Online Adex 2005USD (billion)
Surveys indicate that Europeans spend an average four hours a week online. According to industry experts, there are two factors affecting their Internet usage, which are age and broadband access. France has the highest average hours spent online because of the highest rates of broadband household access, as opposed to Germany, which has the lowest ranks in both cases but has the highest weekly TV consumption time at 14 hours due to the widespread availability of FTA multi-channel TV9.
Newspapers websites are attracting a lot of readers and is considered a lucrative online adex market. For first half of 2006, there was an average of more than 55.5 million visitors in a month viewing websites of US newspapers, a 31% increase from the same period in 200510. It was reported that Yahoo is to work with seven US newspaper groups to share online advertising that can help newspaper industry increase their ad revenues.
Source: European Interactive Advertising Association
0.072 0.11 0.13 0.16 0.181 0.197 0.21
1.161.44
2.76
Belg
ium
Den
mar
k
Net
herla
nds
Nor
way
Italy
Spai
n
Swed
en
Ger
man
y
Fran
ce
Uni
ted
King
dom
8 “Bogus Clicks on Web Ads Still Rising” – July 17, 2006, telecomasia.net9 “Internet Overtakes Newspapers as Primary News Source in Europe-Study” – 10 October 2006, telecomasia.net10 “Surveys: More Internet Users Visiting US Newspaper Web Sites” – 6 October 2006, telecomasia.net
Online advertising
E-mail marketing
600
30
1,000
40
Online ServiceTM Net (RM’000)
YTD October 20062005
Source: TM Net
TM Net’s total online advertising spend has increased to nearly double as of October 2006 while e-mail marketing notched a 33% increase.
Ad banner advertisement Other Online Advertisement Keyword Advertising Total Online Ad Market
General Online AdvertisingClassifieds Online Advertising Search and Directory Total Online Ad Market
Display Search Classifieds Solus E-mail Total Online Ad Market
Search Classifieds Referrals/Lead Generation E-mail Display Related Total Online Ad Market
831047
140
605365
178
4231,042
31815
1,798
3,1641,582
592158
2,4137,909
*China
Australia
UK
US
Selected Countries for Online Advertisement Market
(First Half of 2006)USD
(million)
* Figures are for 2Q 2006 onlySource: Interactive Advertising Bureau, Internet Advertising Bureau UK, Analysys International (23 Aug 2006), Interactive Advertising Bureau Australia

Analysis of Adex Size & Trend in Malaysia24 |
Factors Affecting Adex Trends
DSL broadband technology for Internet access shows that China has the world’s highest number of DSL subscribers followed by US. The total global 164 million DSL subscribers was boosted by strong growth in the European Union.
Interactive TV – New Emerging Wave
Interactive TV or iTV has captured the market of many viewers. Its enhanced programmes and channels are in a way a unique interactivity with the audience. With expected growth in this platform, advertisers are looking at how accountable and effective iTV is for direct response. Another key use of iTV is direct marketing, which include tools used such as subscriptions, coupons, vouchers and direct sales. ASTRO Malaysia is currently the active iTV provider.
Using the Red Button, community chat services and games as their interactivity platform, it was reported that seven million chat messages was sent through the community TV chat services in 2005. ASTRO TV coupons is another new iTV service. It enables discount coupons to be virtually downloaded from the ASTRO set-top box to subscribers’ credit cards for redemption at participating merchants.
China USEuropean UnionRest of regionTotal
33.323.256.051.5
164.0
Global DSL (First Half of 2006)Million
Source: telecomasia.net (20 September 2006)
Country/Region
Competitive Analysis
Description
Channel 200 – GamesChannel 800 - Interactive TV (features MyKad reader & TV coupons)Channel 888 - Astro Stock LinkChannel 998 - Astro Box Office (Astro Max decoders only)Channel 999 - My MAX (exclusive to Astro Max decoders)
iTV: information services like weather, lottery results, horoscopes and multitude of games. Most recently: NFL Sunday Ticket package now offers an iTV service. Allows clients to keep track of multiple simultaneous football games. Even if the client is concentrating on one single game, he will be notified if there are any other score changes for other games with the option of switching over to that channel.
SkyBet-interactive sports betting service. Electronic Programme Guide (EPG)-Television listing information.PlayinTV Games-video games.MindGames-challenging video games.Weather Channel-interactive weather maps and information.
Country
Malaysia:ASTRO
Canada:Bell ExpressVU
New Zealand:SKY Network Television
Source: Newswires
ASTRO (Financial Year)
Interactive TV & Mobile
No. of Transactions (million)
iTV Services Launched (SMS
& Red Button - Services)
Revenue RM (million)
Average Revenue per
Transaction (RM)
Interactive Radio & Mobile
No. of SMS Transactions
(million)
Revenue RM (million)
2004
36.4
50
8.4
0.23
-
2.61
2005
65.8
43
15.3
0.23
1.3
4.22
ASTRO’s multimedia interactive garnered RM15 million worth of revenue and close to 60 million transactions for FY 2006 with transactions overall largely coming from its most popular Malay reality show, Akademi Fantasia.
Source: Company reports
2006
57.8
135
15.1
0.26
1.3
5.51

| 25Analysis of Adex Size & Trend in Malaysia
Conclusion
ADEX POTENTIAL At this juncture of the Malaysian adex scenario, we can only conclude that there are areas where parties could maximise on to increase the low adex base in Malaysia and to contribute to a much bigger portion of the GDP of the country.
A flavour of the tasks at hand to boost adex include development of new indicators or measurements on impact of advertising reach in changing viewing environment and service delivery platforms; creating greater awareness of guidelines on advertising in the country; creating greater awareness of advertising reach through new media; content development initiatives to include advertising possibilities as well; and of course developing the skills and talents in the advertising field in Malaysia.
CONDUCIVE ENVIRONMENTAs new entrants and new media emerge and hence new avenues of advertising expands, changing the competitive nature of traditional means through broadcasting in TV and radio as we know it today, there is a need for operators traditionally working in their respective silos, with mutually exclusive business models, to come together and work closely with each other. In this way, the stakeholders, industry players, the regulators and various government agencies involved can mutually create a conducive environment for communications and multimedia operators to share a larger portion of a much bigger Malaysian advertising cake.

Analysis of Adex Size & Trend in Malaysia26 |
Contact Us
Malaysian Communications and Multimedia Commission63000 Cyberjaya Selangor Darul EhsanTelephone : +603 8688 8000 Facsimile : +603 8688 1000 E-mail : [email protected] : www.mcmc.gov.myFreephone number: 1-800-888-030
Northern Regional OfficeUnit 3, Level 11Menara UMNO128, Jalan Macalister10400 PenangTel : (604) 227 1657Fax : (604) 227 1650
Eastern Regional OfficeLevel 2, Bangunan Tabung HajiJalan Bukit Ubi25200 KuantanPahangTel : (609) 512 1100 / 1119Fax : (609) 515 7566
Southern Regional OfficeSuite 7A, Level 7Menara AnsarJalan Trus80000 Johor BahruJohorTel : (607) 226 6700Fax : (607) 227 8700
Sabah Regional Office6-10-10, Tingkat 10 No. 6, Menara MAA Lorong Api-Api, Api-Api Centre 88000 Kota Kinabalu Sabah Tel : 088-270550 Fax : 088-253205
Sarawak Regional OfficeLevel 5 (North), Wisma STA26, Jalan Datuk Abang Abdul Rahim93450 KuchingSarawakTel : (6082) 331 900 Fax : (6082) 331 901
Central Regional OfficeLevel 17, Wisma SunwayMas1, Jalan Tengku Ampuan Zabedah C9/C Section 940100 Shah AlamSelangor Darul EhsanTel : (603) 5518 7701 Fax : (603) 5518 77
Communications and Multimedia Content Forum of Malaysia Unit 1206, Block B, Pusat Dagangan Phileo Damansara 19 Jalan 16/11, Off Jalan Damansara, 46350 Petaling JayaSelangor Darul Ehsan, Malaysia.Tel: +603-79548105/+603-79583690 Fax: +603-79541260/+603-76608532Website: www.cmcf.org.my Email: [email protected]
EnquiriesFor any details and enquiries please contact the Market Research Department team:Yee Sye Chung, Mooi Mee Mee, Sharmila Manoharan, Azrita Abdul Kadir and Nurul Ashirah Othman.

Analysis of AdexSize and Trend
in Malaysia
Suruhanjaya Komunikasi dan Multimedia MalaysiaMalaysian Communication and Multimedia Commission
63000 Cyberjaya, Selangor Darul EhsanTel: 603-8688 8000 Fax: 603-8688 1000
http://www.mcmc.gov.my