EVALUATION OF DYNAMIC CHARACTERISTICS ON PRT AND...
24
EVALUATION OF DYNAMIC CHARACTERISTICS ON PRT AND THERMOCOUPLE SENSORS IN AN AUTOMATED TEMPERATURE CALIBRATION SYSTEM ILHAM HADI BIN SYAHRIL UNIVERSITI TEKNIKAL MALAYSIA MELAKA
Transcript of EVALUATION OF DYNAMIC CHARACTERISTICS ON PRT AND...
EVALUATION OF DYNAMIC CHARACTERISTICS ON PRT AND
THERMOCOUPLE SENSORS IN AN AUTOMATED TEMPERATURE
CALIBRATION SYSTEM
ILHAM HADI BIN SYAHRIL
UNIVERSITI TEKNIKAL MALAYSIA MELAKA
EVALUATION OF DYNAMIC CHARACTERISTICS ON PRT AND
THERMOCOUPLE SENSORS IN AN AUTOMATED TEMPERATURE
CALIBRATION SYSTEM
ILHAM HADI BIN SYAHRIL
Laporan ini dikemukakan sebagai
memenuhi sebahagian daripada syarat penganugerahan
Ijazah Sarjana Muda Kejuruteraan Mekanikal (Rekabentuk & Inovasi)
Fakulti Kejuruteraan Mekanikal
Universiti Teknikal Malaysia Melaka
JUN 2013
i
SUPERVISOR DECLARATION
“I hereby declare that I have read this thesis and in my opinion this report is
sufficient in term of scope and quality for the award of degree of Bachelor of
Mechanical Engineering (Design & Innovation)”.
Signature: ………………………………….
Supervisor: Dr. Nor Salim b. Muhammad
Date: ………………………………….
ii
DECLARATION
“I hereby declare that the work in this report is my own except for summaries and
quotations which have been duly acknowledged.”
Signature: …………………………………..
Author: Ilham Hadi bin Syahril
Date: …………………………………..

iii
Khas buat
Ayah dan Ibu tersayang
iv
ACKNOWLEDGEMENT
` Alhamdulillah, praise be only to Allah S.W.T. for making this Final Year
Project to its completion. There have been many who have assisted, guided and have
become the source of inspiration and aspiration for me to succeed in this pursuit,
especially to my parents and family for their full support for me to finish this project.
Thanks a lot for my supervisor, Dr. Nor Salim bin Muhammad because guiding and
helping me throughout this project until the completion. Not to be forgotten, laboratory
technician for helping me in the experiment process at the laboratory. They were very
kind by sharing their experienced and knowledge. A high appreciation to Head of
Department Mechanical Engineering (Design and Innovation) and the members of the
staff of Universiti Teknikal Malaysia Melaka (UTeM) for constant support and benefits
input from time to time. Last but not least, to all of my friend that have been helping
me directly or indirectly in completion of this Final Year Project report.
v
ABSTRACT
` It is important to identify the static and dynamic characteristic of temperature
transducer in order to get a precise measurement in temperature calibration. Most of
the previous studies in temperature calibration system only focus on static
characteristic of the transducer. While the diameter of temperature probe does not
affect the steady state temperature, it is important factor when considering the dynamic
characteristic of the transducer. Different sizes probe diameter may alter the time
response of the systems due to different loading error. When dealing with dynamic
analysis of temperature transducer, it is necessary to design a measurement system that
having as small as possible time constant to reduce the error cause by the dynamic
characteristic of the system. This dynamic characteristic of temperature transducer is
studied using an automated temperature calibration system. An automated calibration
system is different from manual temperature calibration by utilizing computer
interface in calibration process. LabVIEW is used to develop the computer interface
that control the calibration parameters precisely and display the result. From the
calibration result obtain, the uncertainty analysis of the measured data is carried out
including the population of mean and variant of the data.
vi
ABTRAK
Adalah penting untuk mengenal pasti ciri-ciri statik dan dinamik transduser
suhu untuk mendapatkan ukuran yang tepat dalam penentukuran suhu. Kebanyakan
kajian sebelumnya dalam sistem penentukuran suhu hanya memberi tumpuan kepada
ciri-ciri statik penderia. Walaupun diameter pengukur suhu tidak menjejaskan suhu
keadaan mantap, ia adalah faktor penting apabila mempertimbangkan ciri-ciri dinamik
transduser. Diameter pengukur yang berbeza boleh mengubah masa tindak balas
sistem kerana ralat muatan yang berbeza. Apabila berurusan dengan analisis dinamik
transduser suhu, adalah perlu untuk mereka bentuk sistem pengukuran yang
mempunyai sekecil mungkin pemalar masa untuk mengurangkan ralat yang
disebabkan oleh ciri-ciri dinamik sistem. Ciri-ciri dinamik transduser suhu dikaji
menggunakan penentukuran suhu sistem automatik. Satu sistem penentukuran
automatik adalah berbeza dari penentukuran suhu manual kerana menggunakan antara
muka komputer dalam proses penentukuran. LabVIEW digunakan untuk
membangunkan antara muka komputer yang mengawal parameter penentukuran
dengan tepat dan memaparkan keputusannya. Dari hasil penentukuran yang diperolehi,
analisis ketidakpastian data yang diukur dijalankan termasuk populasi purata dan
taburan data.
vii
TABLE OF CONTENT
CHAPTER CONTENT PAGE
SUPERVISOR DECLARATION i
DECLARATION ii
DEDICATION iii
ACKNOWLEDGEMENT iv
ABSTRACT v
ABTRAK vi
TABLE OF CONTENT vii
LIST OF FIGURE ix
LIST OF TABLE xii
LIST OF ABBREVIATIONS xiv
LIST OF SYMBOLS xv
LIST OF APPENDIX xvi
CHAPTER 1 INTRODUCTION
1.1 Objective 1
1.2 Problem statement 1
1.3 Scope of study 2
CHAPTER 2 LITERATURE REVIEW 3
2.1 Previous studies on temperature
calibration
3
2.2 Static and dynamic characteristic of
temperature transducer
4
2.2.1 Static characteristic of temperature
transducer
4
viii
2.2.1.1 Accuracy 4
2.2.1.2 Resolution 5
2.2.1.3 Sensitivity 6
2.2.2 Dynamic characteristic of temperature
transducer
8
2.2.2.1 Time constant 8
2.3 Platinum resistive thermometer (PRT) 9
2.3.1 PRT construction 9
2.4 Thermocouple 12
2.4.1 Choice of thermocouple materials 12
2.4.2 Summary of the law of thermoelectric
circuits
14
2.4.2.1 Law of homogenous materials 14
2.4.2.2 Law of intermediate materials 15
2.4.2.3 Law of successive of
intermediate temperature
16
2.5 Automated temperature calibration system 17
2.6 Development of computer interface
18
CHAPTER 3 METHODOLOGY 20
3.1 Introduction 20
3.2 Experiment preparation 20
3.1.2 Fabrication of insert 20
3.2.2 Fabrication of temperature probe 21
3.3 Experiment apparatus 22
3.3.1 Heat source 23
3.3.2 Thermometer readout and data logger 23
3.3.2.1 2562 PRT Scanner Module 24
3.3.2.2 2566 Thermocouple Scanner
Module
26
3.3.3 PC interface 27
3.4 Experiment procedure 28
3.4.1 Automated temperature calibration 28
ix
3.4.2 Soaking time 29
3.4.3 Time constant
33
CHAPTER 4 RESULT AND DISCUSSION 35
4.1 Soaking time 35
4.1.1 Aluminium insert 36
4.1.2 Brass insert 41
4.2 Time constant 46
4.2.1 Effect of probe diameter
46
CHAPTER 5 ANALYSIS OF CALIBRATION DATA 50
5.1 Thermocouple 50
5.2 Estimation of population mean 53
5.3 Estimation of population variance
60
CHAPTER 6 CONCLUSION 63
REFERENCES 64
APPENDIX 66
x
LIST OF FIGURE
FIGURE
TITLE
PAGES
Figure 2.1 Accuracy as a percentage of full scale 5
Figure 2.2 Resolution of a measuring system 6
Figure 2.3 Thermocouple sensitivity 7
Figure 2.4 Zero drift and sensitivity drift 7
Figure 2.5 Response of a measurement system to a step change in input 8
Figure 2.6 (a) platinum wire; (b) thin film 10
Figure 2.7 Connections configuration and termination colour codes
according to British Standard 11
Figure 2.8 Resistance vs. temperature for common type of RTD 11
Figure 2.9 Output for some common thermocouples 12
Figure 2.10 E.m.f, E is not affected by T3 and T4 14
Figure 2.11 E.m.f (E) unaffected by third material, C 15
Figure 2.12 E.m.fs are additive for materials. 16
Figure 2.13 E.m.fs are addictive for temperature intervals 16
Figure 3.1 Insert dimension and holes configuration 21
Figure 3.2 Temperature probe 21
Figure 3.3 Experimental setup for automated temperature calibrator 22
Figure 3.4 Fluke 9170 Series Metrology Well Calibrator 23
xi
Figure 3.5 Fluke 1560 Black Stack Thermometer Readout 24
Figure 3.6 PRT Scanner Module Sensor Wiring Detail 25
Figure 3.7 Thermocouple Scanner Module Sensor Connection Detail 27
Figure 3.8 Diagram for automated temperature calibration system 28
Figure 3.9 LabVIEW user interface for heat source setup 30
Figure 3.10 LabVIEW user interface for temperature probe configuration 31
Figure 3.11 LabVIEW user interface for set point configuration 32
Figure 3.12 LabVIEW program front panel for time constant
measurement 33
Figure 4.1 Graph of set point vs. error for PRT (1st reading) 36
Figure 4.2 Graph of set point vs. error for PRT (average reading) 36
Figure 4.3 Graph of set point vs. error for thermocouple 3.2 mm (1st
reading) 37
Figure 4.4 Graph of set point vs. error for thermocouple 3.2 mm
(average reading) 37
Figure 4.5 Graph of set point vs. error for thermocouple 6.0 mm (1st
reading) 38
Figure 4.6 Graph of set point vs. error for thermocouple 6.0 mm
(average reading) 38
Figure 4.7 Graph of Set Point vs. Error for Thermocouple 8.0 mm (1st
Reading) 39
Figure 4.8 Graph of Set Point vs. Error for Thermocouple 8.0 mm
(Average Reading) 39
Figure 4.9 Graph of set point vs. error for PRT (1st reading) 41
Figure 4.10 Graph of set point vs. error for PRT (average reading) 41
Figure 4.11 Graph of set point vs. error for thermocouple 3.2 mm (1st
reading) 42
Figure 4.12 Graph of set point vs. error for thermocouple 3.2 mm
(average reading) 42
xii
Figure 4.13 Graph of set point vs. error for thermocouple 6.0 mm (1st
reading) 43
Figure 4.14 Graph of set point vs. error for thermocouple 6.0 mm
(average reading) 43
Figure 4.15 Graph of Set Point vs. Error for Thermocouple 8.0 mm (1st
Reading) 44
Figure 4.16 Graph of Set Point vs. Error for Thermocouple 8.0 mm
(Average Reading) 44
Figure 4.17 Graph of Time [min] Vs. Temperature [°C] at 0°C 46
Figure 4.18 Graph Temperature [°C] Vs. Time [min] at 30°C 47
Figure 4.19 Graph of Temperature [°C] Vs. Time [min] at 60°C 47
Figure 4.20 Graph of Time [Min] vs. Temperature [°C] at 90°C 48
Figure 5.1 Graph of Vemf vs. ∆T for Thermocouple 3.2 mm diameter 51
Figure 5.2 Graph of Vemf vs. ∆T for Thermocouple 6.0 mm diameter 51
Figure 5.3 Graph of Vemf vs. ∆T for Thermocouple 8.0 mm diameter 52
Figure 5.4 Confidence interval for the t-distribution 57
Figure 5.5 Confidence interval for the 2- distribution 60
xiii
LIST OF TABLE
TABLE TITLE PAGES
Table 1.1 Composition of thermocouple, trade names and letter
designations for standardized thermocouples
13
Table 3.1 PRT Scanner Commands 26
Table 4.1 Time constant, 𝜏 (min) for PRT and thermocouple 49
Table 5.1 Measured temperature by thermocouple probe (3.2 mm
diameter) n aluminium insert
53
Table 5.2 Measured temperature by thermocouple probe (3.2 mm
diameter) in brass insert
54
Table 5.3 Measured temperature by thermocouple probe (6.0 mm
diameter) in aluminium insert
54
Table 5.4 Measured temperature by thermocouple probe (6.0 mm
diameter) in brass insert
55
Table 5.5 Measured temperature by thermocouple probe (8.0 mm
diameter) in aluminium insert
55
Table 5.6 Measured temperature by thermocouple probe (8.0 mm
diameter) in brass insert
56
Table 5.7 Measured temperature by PRT probe (6.0 mm diameter)
in aluminium insert
56
Table 5.8 Measured temperature by PRT probe (6.0 mm diameter)
in brass insert
57
Table 5.9 Confidence interval of mean for thermocouple probe
(3.2mm diameter) in aluminium and brass inserts
59
Table 5.10 Confidence interval of mean for thermocouple probe
(6.0 mm diameter) in aluminium and brass inserts
59
xiv
Table 5.11 Confidence interval of mean for thermocouple probe
(8.0 mm diameter) in aluminium and brass inserts
59
Table 5.12 Confidence interval of mean for PRT probe (6.0 mm
diameter) in aluminium and brass inserts
59
Table 5.13 Confidence interval of standard deviation for
thermocouple probe (3.2 mm diameter) in aluminium
and brass inserts
61
Table 5.14 Confidence interval of standard deviation for
thermocouple probe (6.0 mm diameter) in aluminium
and brass inserts
62
Table 5.15 Confidence interval of standard deviation for
thermocouple probe (8.0 mm diameter) in aluminium
and brass inserts
62
Table 5.16 Confidence interval of standard deviation for PRT probe
(6.0 mm diameter) in aluminium and brass inserts
62
xv
LIST OF ABBREVIATIONS
PRT = Platinum resistive thermometer
TC = Thermocouple
MMSL = Microgravity Materials Science Laboratory
NASA = National Aeronautics and Space Administration
PID = Proportional integral derivative
ITS = International temperature scale
RTD = Resistance temperature detectors
ISA = Instrument Society of America
FYP = Final year project
xvi
LIST OF SYMBOLS
𝜏@ 𝑑𝑇𝑡
𝑑𝑡 = Time constant
I = Current (A)
[email protected] = Electromotive force (V)
T = Temperature(°C)
m = Bulb mass
c = Bulb specific heat
y/ye
= Step input
R = Resistance (Ω)
𝛼 = Dominant constant (/0𝐶)
𝛿 = Constant
𝛽 = Constant
𝑈 = Thermoelectric voltage (V)
∆𝑇 = Temperature different (°C)
∝ = Seebeck coefficient (Wm−2K−1) @ (𝜇𝑉/)
xvii
LIST OF APPENDIX
APPENDIX TITLE PAGES
APPENDIX 1 Technical specification for Fluke 9170 Series Metrology
Well Calibrator
66
APPENDIX 2 Table of detail specification of 2562/2568 PRT Scanner
Module
67
APPENDIX 3 Table of detail specification of 2566 Thermocouple
Scanner Module
68
APPENDIX 4 Gantt chart for FYP 1 70
APPENDIX 5 Gantt chart for FYP 2 71
1
CHAPTER 1
INTRODUCTION
1.1 OBJECTIVE
Those objectives evaluated are to assist and complete this study:
To measure and analyze the transient response of temperature probe
characteristic.
To study the effect of loading error due to the change of probe diameter for
PRT and Thermocouple probes.
1.2 PROBLEM STATEMENT
Temperature transducers range from different types of diameters made of PRTs,
Thermistors, Thermocouple and infrared thermometers. Each of this probes has
different characteristics due to the types of sensors and diameters of the probes. Most
of the calibration system only focus on the steady - state temperature characteristics
but the change of probe diameters also may alter the dynamic response of the
transducer. Therefore, it is necessary to measure the effect of these factor in order to
obtain precise measurement in temperature calibration.
2
1.3 SCOPE OF STUDY
The scope of this study has been identified. The thermocouple itself can be
treated as first order system and serve to demonstrate the application of first order
dynamic analysis. The probe characteristics will be measured using an automated
temperature calibrator to estimate the time constant, 𝜏 for the temperature probes. The
effect of using different diameter of temperature probe also will be studied to measure
the effect of probe diameter on the temperature calibration. At the end of the study, the
uncertainty analysis will be carried out including the population of mean and variant
of the data.
3
CHAPTER 2
LITERATURE REVIEW
2.1 PREVIOUS STUDIES ON TEMPERATURE CALIBRATION
.
Temperature calibration has been focused in industries as an indicator to maintain
the quality of products especially in steel and food processing industries. Therefore, many
studies on temperature calibration were conducted by previous researchers such as
Mark D. Bethea, Bruce N. Rosenthal, Janko Drnovisek, Jovan B Djkovski, Igor Pusnik,
Tanasko Tasic, Jie Chen, Xuejun Hu, Lixin Xu for thermocouples (TC), Platinum
Resistive Thermometers (PRT) and thermistors.
An automated calibration system has been started by Bethea and Rosenthal
(1992) which developed an automated thermocouple calibration system for use in the
Microgravity Materials Science Laboratory (MMSL) at the NASA LeRC. There is
capable of calibrating a large number of thermocouples simultaneously up to 60
thermocouples. On the other hand it also reduce the calibration time significantly while
maintaining accuracy of ±0.7 .
The method of automated temperature calibration systems using PC based
controller systems also applied by Drnovisek et al. (1999) in their research, that
emphasize the reliability of measurements, repeatability and minimization of various
influences, which are likely the cause of gross measurements errors, as basic
requirements for performance of the work in every precision calibration laboratory.
However, the automation calibration systems require a suitable hardware and software
which might be very costly due to their performance and quality.
4
Recently, a new thermocouple auto-calibration system then have been develop
by Chen et al. (2008) by applying fuzzy-PID controller based system. It can improve
the accuracy and eliminate the self-oscillation of the system. This control module is
developed using LabVIEW that capable to control the calibration temperatures
precisely and also to manage data and display the result.
2.2 STATIC AND DYNAMIC CHARACTERISTIC OF TEMPERATURE
TRANSDUCER
2.2.1 Static Characteristic of Temperature transducer
Every equipment and transducer has their own static characteristics consist of
accuracy, resolution, and sensitivity. The characteristics probably change due to the
aging or thermal stress in applications.
2.2.1.1 Accuracy
Accuracy is defined as the closeness of agreement between a measured value
and the true value. It is a quantified in terms of measurement error, i.e. the difference
between the measured value and the true value. Thus the accuracy of a laboratory
standard PRT is the closeness of the reading to the true value of temperature. This
brings us back to the problem, of how to establish the true value of a variable. The true
value of temperature often referred to primary standard which is International
Temperature Scale of 1990 (ITS-90). (Bentley, 2005)
Generally, manufacturer specifications of accuracy describe residual
uncertainty that exists when a device has been properly adjusted and calibrated and is
used in specified manner. Accuracy specifications generally include residual
systematic and random errors in the measuring systems itself.
5
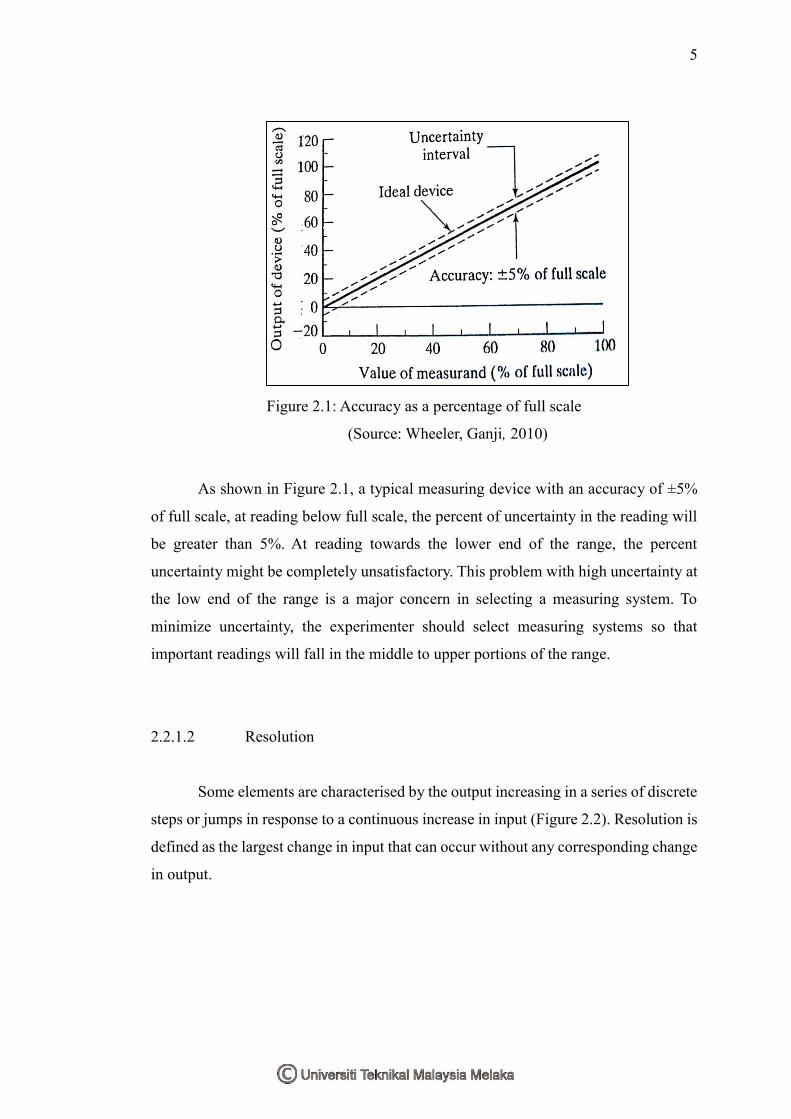
Figure 2.1: Accuracy as a percentage of full scale
(Source: Wheeler, Ganji, 2010)
As shown in Figure 2.1, a typical measuring device with an accuracy of ±5%
of full scale, at reading below full scale, the percent of uncertainty in the reading will
be greater than 5%. At reading towards the lower end of the range, the percent
uncertainty might be completely unsatisfactory. This problem with high uncertainty at
the low end of the range is a major concern in selecting a measuring system. To
minimize uncertainty, the experimenter should select measuring systems so that
important readings will fall in the middle to upper portions of the range.
2.2.1.2 Resolution
Some elements are characterised by the output increasing in a series of discrete
steps or jumps in response to a continuous increase in input (Figure 2.2). Resolution is
defined as the largest change in input that can occur without any corresponding change
in output.