First Part thesis - eprints.uthm.edu.myeprints.uthm.edu.my/id/eprint/1735/1/maimunah_razali.pdf ·...
35
i ABSTRACT With increasing sensitivity of electronic equipment and automated controls in modern power systems, the power quality monitoring become growing concerns for many industrial facilities and a common practice for utilities. Studies of power quality phenomena have emerged as an important subject in recent years due to renewed interest in improving the quality of the electric supply. Power quality issue has attained considerable attention in last decade due to the increased use of power electronics in residential, commercial and industrial. The most frequently power quality events occur are voltage sag, voltage swell and harmonics distortion. All of the power quality events may interrupt working processes or even cause electronic devices to malfunction. Therefore, it is very important to detect and classified the power quality event occur. This study presents methods to detect and classify power quality events using Analysis of Variance (ANOVA) and Wavelet Transform. This method is tested for a large class of test conditions simulated in MATLAB and focused on the three major of power quality problems which are voltage sag, voltage swell and harmonics distortion in 22 kV distribution network. For the result of this study, the two methods used are able to classify and identify the power quality events. The ANOVA method can detect the range and type of power quality events occur and the wavelet transform can identify the location and time for every problem occur in this distribution network. Keywords: Power Quality events, ANOVA, Wavelet Transform, Voltage Sag, Voltage Swell, Harmonics Distortion
Transcript of First Part thesis - eprints.uthm.edu.myeprints.uthm.edu.my/id/eprint/1735/1/maimunah_razali.pdf ·...
i
ABSTRACT
With increasing sensitivity of electronic equipment and automated controls in
modern power systems, the power quality monitoring become growing concerns for
many industrial facilities and a common practice for utilities. Studies of power
quality phenomena have emerged as an important subject in recent years due to
renewed interest in improving the quality of the electric supply. Power quality issue
has attained considerable attention in last decade due to the increased use of power
electronics in residential, commercial and industrial. The most frequently power
quality events occur are voltage sag, voltage swell and harmonics distortion. All of
the power quality events may interrupt working processes or even cause electronic
devices to malfunction. Therefore, it is very important to detect and classified the
power quality event occur. This study presents methods to detect and classify power
quality events using Analysis of Variance (ANOVA) and Wavelet Transform. This
method is tested for a large class of test conditions simulated in MATLAB and
focused on the three major of power quality problems which are voltage sag, voltage
swell and harmonics distortion in 22 kV distribution network. For the result of this
study, the two methods used are able to classify and identify the power quality
events. The ANOVA method can detect the range and type of power quality events
occur and the wavelet transform can identify the location and time for every problem
occur in this distribution network.
Keywords: Power Quality events, ANOVA, Wavelet Transform, Voltage Sag,
Voltage Swell, Harmonics Distortion
ii
ABSTRAK
Dengan meningkatnya kepekaan alat elektronik dan kawalan automasi dalam system kuasa
moden, pengesanan kualiti kuasa menjadi kebimbangan bagi kemudahan industri dan
menjadi amalan biasa kepada utility-utiliti. Sejak kebelakangan ini, kajian fenomena kualiti
kuasa telah muncul sebagai satu perkara yang sangat penting dengan adanya minat baru
untuk meningkatkan kualiti bekalan elektrik. Sejak sedekad lalu, isu kualiti kuasa telah
menjadi satu perkara yang perlu dititikberatkan disebabkan meningkatnya alat-alat elektronik
kuasa di kawasan kediaman, komersial dan industri. Voltan lendut, voltan kembang dan
herotan harmonik adalah masalah kualiti kuasa yang seringkali berlaku. Kesemua masalah
kualiti kuasa ini bukan sahaja menyebabkan gangguan proses kerja malahan akan
menyebabkan kerosakkan peralatan elektronik. Lantaran itu, adalah sangat penting untuk
mengesan dan mengklasifikasi masalah-masalah kualiti kuasa. Kajian ini membentangkan
kaedah-kaedah untuk mengesan dan mengklasifikasi masalah kualiti kuasa dengan
menggunakan kaedah Analisis Varian (ANOVA) dan Wavelet Transform. Kaedah ini diuji
dengan meluas menggunakan perisian MATLAB dan memfokuskan kepada tiga major
masalah kualiti kuasa iaitu voltan lendut, voltan kembang dan herotan harmonik dalam
sistem pengagihan 22 kV. Hasil daripada kajian ini telah membuktikan kedua-dua kaedah ini
mampu mengklasifikasi dan mengenalpasti masalah-masalah kualiti kuasa. Kaedah ANOVA
dapat mengesan julat dan jenis masalah-masalah kualiti kuasa yang berlaku dan wavelet
transform boleh mengenalpasti lokasi dan masa untuk setiap masalah kualiti kuasa yang
terdapat dalam sistem pengagihan ini.
iii
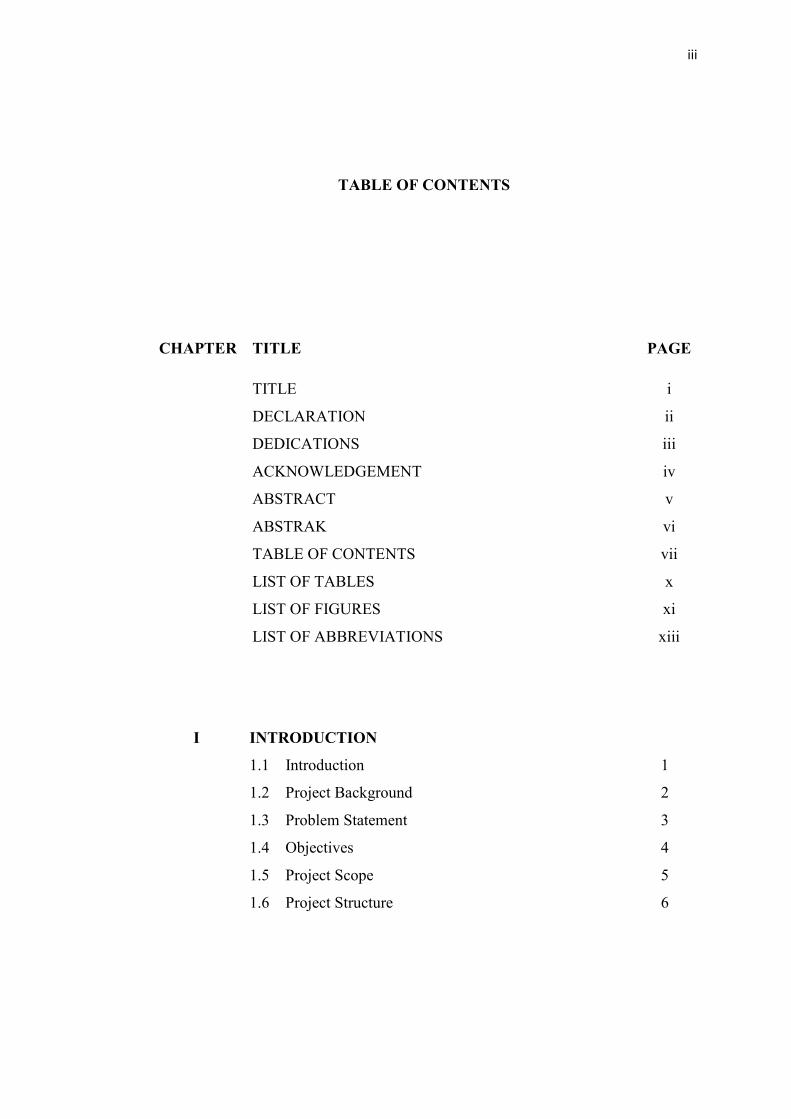
TABLE OF CO TE TS
CHAPTER TITLE PAGE
TITLE i
DECLARATION ii
DEDICATIONS iii
ACKNOWLEDGEMENT iv
ABSTRACT v
ABSTRAK vi
TABLE OF CONTENTS vii
LIST OF TABLES x
LIST OF FIGURES xi
LIST OF ABBREVIATIONS xiii
I I TRODUCTIO
1.1 Introduction 1
1.2 Project Background 2
1.3 Problem Statement 3
1.4 Objectives 4
1.5 Project Scope 5
1.6 Project Structure 6
iv
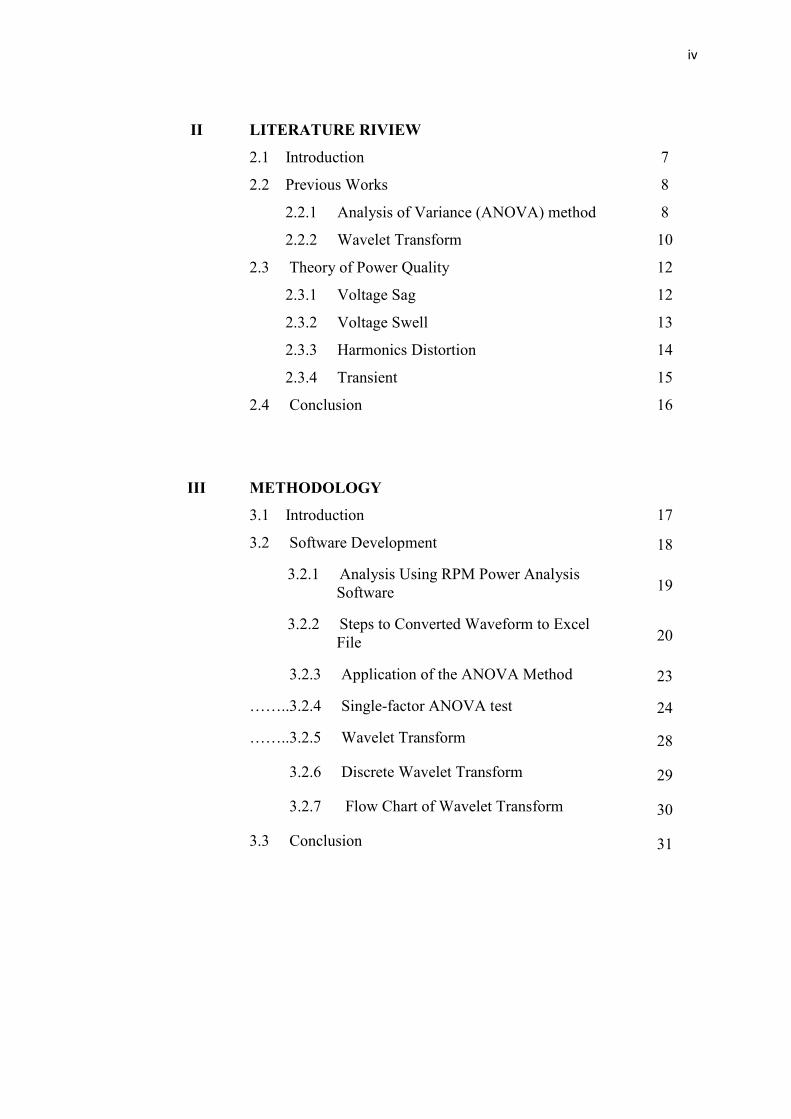
II LITERATURE RIVIEW
2.1 Introduction 7
2.2 Previous Works 8
2.2.1 Analysis of Variance (ANOVA) method 8
2.2.2 Wavelet Transform 10
2.3 Theory of Power Quality 12
2.3.1 Voltage Sag 12
2.3.2 Voltage Swell 13
2.3.3 Harmonics Distortion 14
2.3.4 Transient 15
2.4 Conclusion 16
III METHODOLOGY
3.1 Introduction 17
3.2 Software Development 18
3.2.1 Analysis Using RPM Power Analysis
Software 19
3.2.2 Steps to Converted Waveform to Excel
File 20
3.2.3 Application of the ANOVA Method 23
……..3.2.4 Single-factor ANOVA test 24
……..3.2.5 Wavelet Transform 28
3.2.6 Discrete Wavelet Transform 29
3.2.7 Flow Chart of Wavelet Transform 30
3.3 Conclusion 31
v
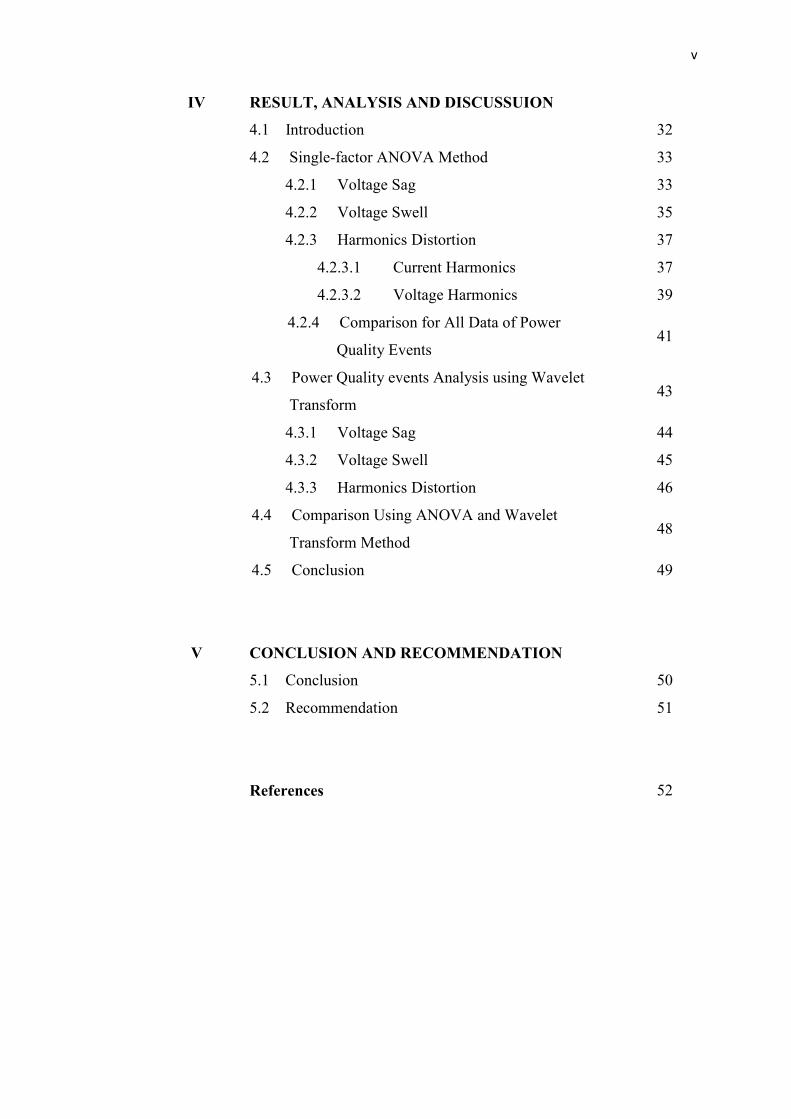
IV RESULT, A ALYSIS A D DISCUSSUIO
4.1 Introduction 32
4.2 Single-factor ANOVA Method 33
4.2.1 Voltage Sag 33
4.2.2 Voltage Swell 35
4.2.3 Harmonics Distortion 37
4.2.3.1 Current Harmonics 37
4.2.3.2 Voltage Harmonics 39
4.2.4 Comparison for All Data of Power
Quality Events 41
4.3 Power Quality events Analysis using Wavelet
Transform 43
4.3.1 Voltage Sag 44
4.3.2 Voltage Swell 45
4.3.3 Harmonics Distortion 46
4.4 Comparison Using ANOVA and Wavelet
Transform Method 48
4.5 Conclusion 49
V CO CLUSIO A D RECOMME DATIO
5.1 Conclusion 50
5.2 Recommendation 51
References 52
vi
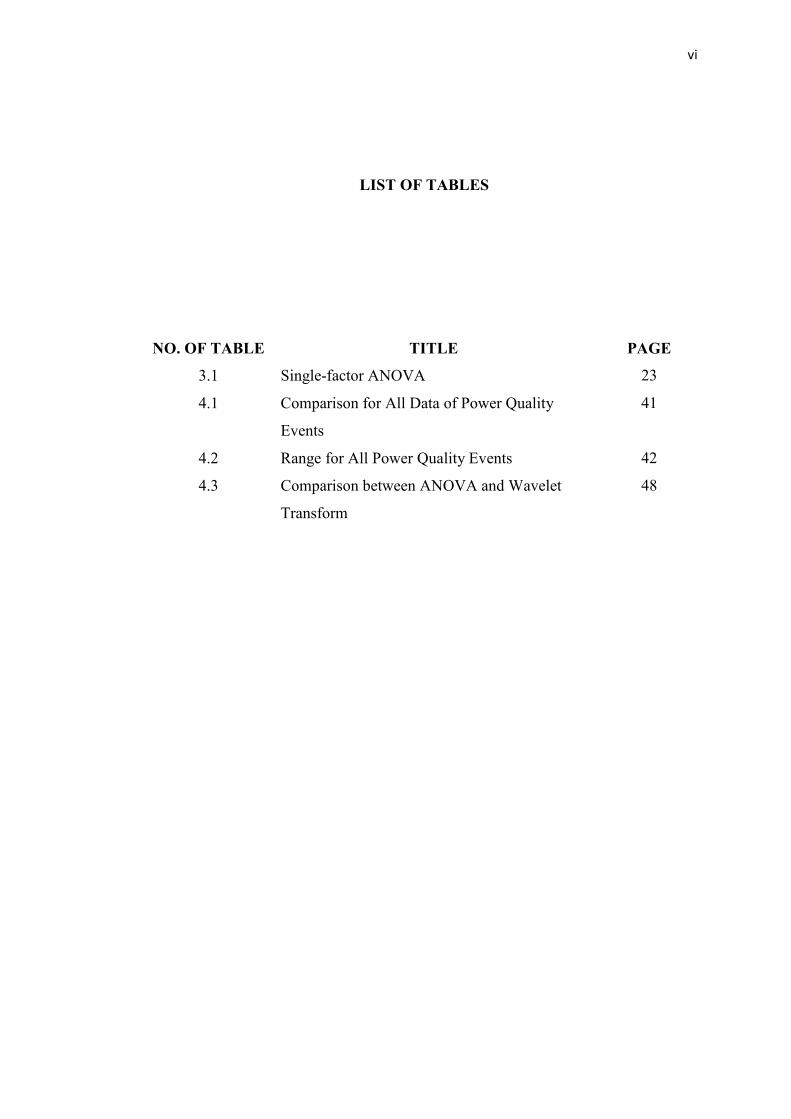
LIST OF TABLES
O. OF TABLE TITLE PAGE
3.1 Single-factor ANOVA 23
4.1 Comparison for All Data of Power Quality
Events
41
4.2 Range for All Power Quality Events 42
4.3 Comparison between ANOVA and Wavelet
Transform
48
vii
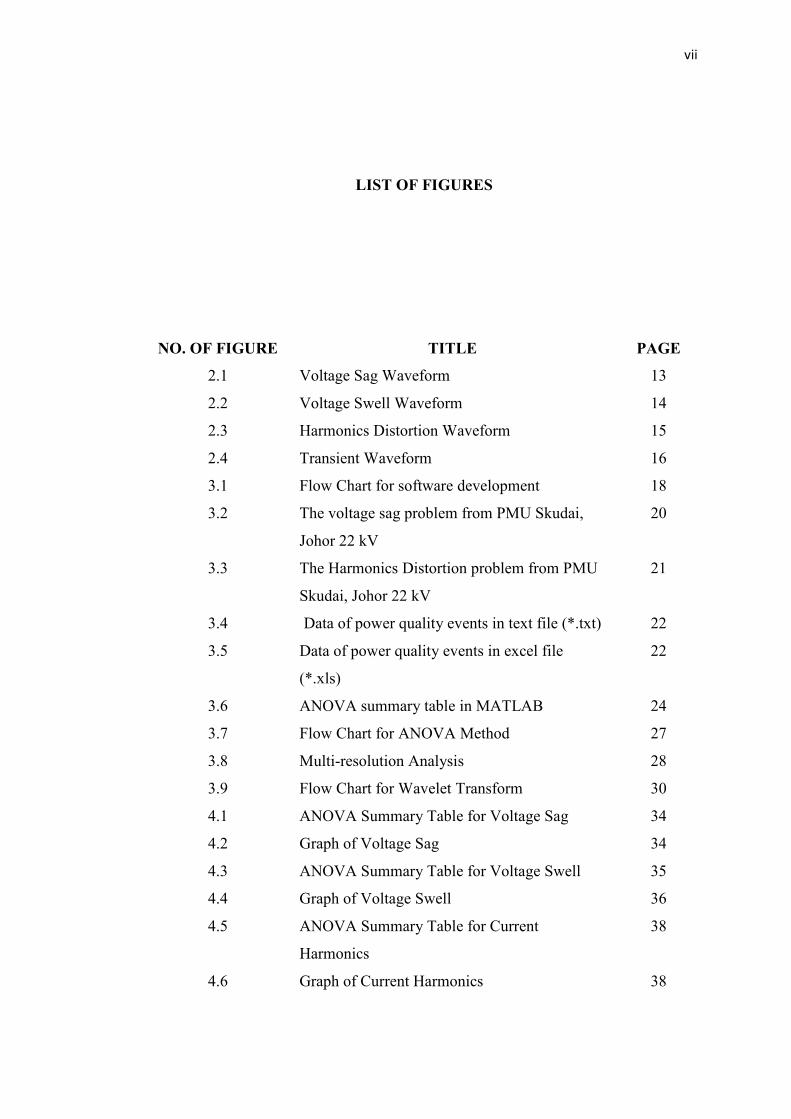
LIST OF FIGURES
O. OF FIGURE TITLE PAGE
2.1 Voltage Sag Waveform 13
2.2 Voltage Swell Waveform 14
2.3 Harmonics Distortion Waveform 15
2.4 Transient Waveform 16
3.1 Flow Chart for software development 18
3.2 The voltage sag problem from PMU Skudai,
Johor 22 kV
20
3.3 The Harmonics Distortion problem from PMU
Skudai, Johor 22 kV
21
3.4 Data of power quality events in text file (*.txt) 22
3.5 Data of power quality events in excel file
(*.xls)
22
3.6 ANOVA summary table in MATLAB 24
3.7 Flow Chart for ANOVA Method 27
3.8 Multi-resolution Analysis 28
3.9 Flow Chart for Wavelet Transform 30
4.1 ANOVA Summary Table for Voltage Sag 34
4.2 Graph of Voltage Sag 34
4.3 ANOVA Summary Table for Voltage Swell 35
4.4 Graph of Voltage Swell 36
4.5 ANOVA Summary Table for Current
Harmonics
38
4.6 Graph of Current Harmonics 38
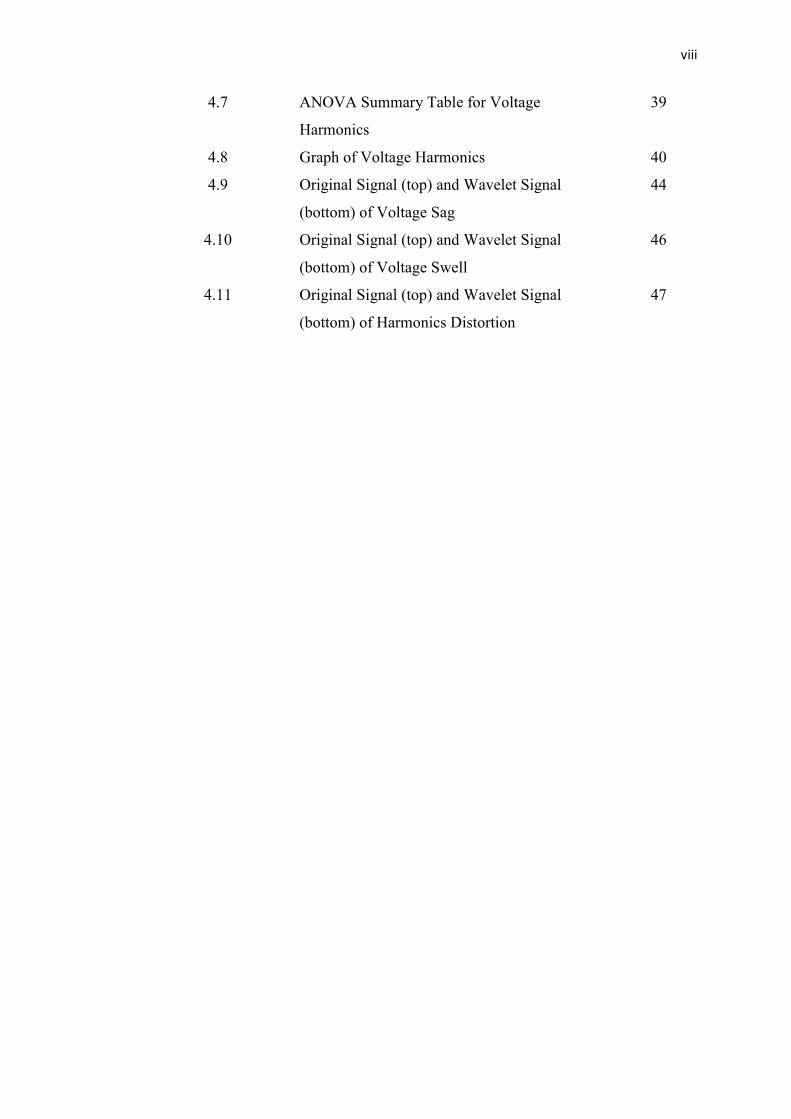
viii
4.7 ANOVA Summary Table for Voltage
Harmonics
39
4.8 Graph of Voltage Harmonics 40
4.9 Original Signal (top) and Wavelet Signal
(bottom) of Voltage Sag
44
4.10 Original Signal (top) and Wavelet Signal
(bottom) of Voltage Swell
46
4.11 Original Signal (top) and Wavelet Signal
(bottom) of Harmonics Distortion
47
ix
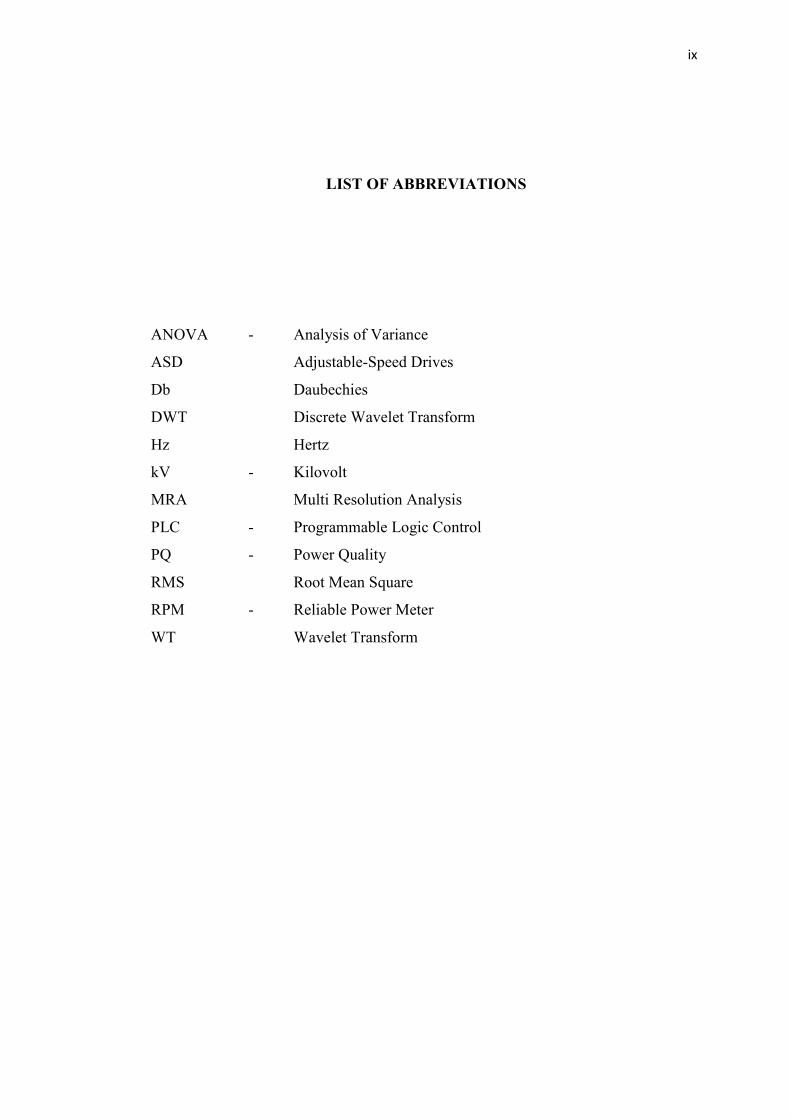
LIST OF ABBREVIATIO S
ANOVA - Analysis of Variance
ASD Adjustable-Speed Drives
Db Daubechies
DWT Discrete Wavelet Transform
Hz Hertz
kV - Kilovolt
MRA Multi Resolution Analysis
PLC - Programmable Logic Control
PQ - Power Quality
RMS Root Mean Square
RPM - Reliable Power Meter
WT Wavelet Transform
1
CHAPTER I
ITRODUCTIO
1.1 Introduction
With increasing sensitivity of electronic equipment and automated controls in
modern power systems, the power quality monitoring become growing concerns for
many industrial facilities and a common practice for utilities. Studies of power
quality phenomena have emerged as an important subject in recent years due to
renewed interest in improving the quality of the electric supply [1]. The qualities of
electric power are concerned in both electric utilities and end users of electrical
power. The term power quality has become one of the most prolific buzzword in the
power industry since the late 1980s [2]. The power quality events are not confined to
only energy efficiency and environment but more importantly on quality and
continuity of supply or power quality and supply quality.
A power quality event is defined as any power problem manifested in voltage,
current, or frequency deviations that result in power failure or disoperation of
equipment [3].
Power quality problems concerning frequency deviation are the presence of
harmonics and other departures from the intended frequency of the alternating supply
2
voltage. On the other hand, power quality problems concerning voltage magnitude
deviations can be in the form of voltage fluctuations, especially those causing flicker.
Other voltage problems are the voltage sags, short interruptions and transient over
voltages. Among them, three power quality problems have been identified to the
major concern to the customers are voltage sags, voltage swell and harmonics, and
this project is focussed on that three major of power quality problems.
1.2 Project Background
Power quality issue has attained considerable attention in last decade due to
the increased use of power electronics in residential, commercial and industrial [4].
The most frequent occurred power quality events are voltage sag, swell, harmonics
and transients. All of the power quality events may interrupt working processes or
even cause electronic devices to malfunction [5]. Therefore, it is very important to
detect and classified the power quality event occur. There are some various method
have been proposed for classification and identification of power quality events such
as Analysis of Variance (ANOVA), Wavelet Transform, Fast Fourier Transform, S-
Transform and etc.
In this project, the ANOVA method in Data Mining and wavelets transform
are proposed to identify the power quality events. ANOVA is an analytical process
design to explore large amounts of data in search of consistent pattern and systematic
relationships between variables and then to validate the finding by applying the
detected pattern to new subsets of data [6]. Wavelets transform is also one of the
methods to detect the power quality problems. Wavelet Transform is a mathematical
tool that provides an automatic detection of power quality problems waveform [7]..
The large amount data of 22 kV distribution network is used in this project, so the
ANOVA and wavelets transform method are the best solution that can be used to
analyze the data. The ANOVA method is a good skill to illustrate the behaviour of
3
power quality events for various combinations of PQ events. In order to form the
better result, the data is analyzed again with wavelets transform method. This is
because by using ANOVA method, only the range of the type of power quality
events can detect and the specific place and time the power quality event can’t be
detect by ANOVA method [8]. Due to this problem, the wavelets transform can used
to detect the specific time when the power quality events occur. Beside the several
method used to detect the power quality problems, there are some method comes
with this advantage such as Neural Network and fuzzy logic. This method fails to
detect voltage sag/swell and has a complex calculation and it also required lots of
data for training and learning process [9].
1.3 Problem Statement
Electric utilities have made a substantial amount of investment to improve the
reliability of the system network that can reduce the number of faults occurs but they
still cannot control and predict the existence of faults in distribution networks. Due to
the increase used of microelectronic processors in various types of equipments such
as computer terminals, programmable logic controllers and diagnostic systems, the
demand for clean power has been increasing in the past several years [9].
Based on the factor that are driving for power quality events, it shows that
recently most of modern load whether in industrial or commercial scales are
inverter-based such as adjustable-speed drives (ASDs), air condition, voltage
controlled power supplies and etc. Due to the usage of sensitive load, the efficiency,
energy saving, and high controllability can increased. The increment can cause the
electric power disturbances will occur [1]. The interruption or disturbances can
stimulate the sensitive equipment damage and costly to repair. The cost to repair
causes severe financial losses [10].
4
1.4 Objectives
The major objective of this project is to diagnose power quality events in distribution
network by using ANOVA Method. There are several measurable objectives to be
achieved in the end of the project which include:
a) To analyze power quality events base on given data using ANOVA and
Wavelet Transform method
b) To analyze the data of power quality events by using the RPM Power
Analysis Software
c) To investigate the different between ANOVA Method and Wavelet
transform for power quality diagnosis.
1.5 Project Scope
The scopes and limitation of this study are:
1. This study is only focused on three major power quality events that usually
occur and identified. The power quality events are voltage sags, voltage
swell and harmonics distortion.
2. The data is taken from 22 kV distribution systems in Skudai, Johor.
3. The technique used to identify the power quality events is Analysis of
Variances (ANOVA) and Wavelet Transform method.
4. Identification or simulation of power quality events using the Matlab
software.
5. The data of power quality events is analyzing using RPM Power Analysis
Software.
5
1.6 Project structures
This final project report is divided into five main chapters. The presented
chapters are introduction, literature review, methodology, results, analysis and
discussion, and conclusion.
Chapter 1 gives slightly entire introductions regarding this project. The project
overview, objectives and scopes of study are all viewable in this chapter.
Chapter 2 of this report consists of literature review of the project which
detailed the theoretical background and the previous studies that related to this
project.
The project’s procedure and also the approach taken to implement this project
such as the software development and method used will be explained in the Chapter
3. The following Chapter 4 consists of the results, analysis and discussion that
obtained using this method.
Chapter 5 is the final chapter which includes conclusion and recommendation
for future work as well as the commercial potential.
6
CHAPTER II
LITERATURE REVIEW
2.1 Introduction
In recent, power quality has become a growing concern due to increased of
sensitive power electronic equipment in moderns’ power system [11]. The increasing
of power quality events has stimulated the researchers to do many researches to
investigate the problem of power quality. Beside from the problem of power quality,
there are several techniques are approach to investigate the problem such as data
mining, S-transform, wavelet transform, neural network and more. For the first phase
of this study, the information have been gather based on the theory and also previous
research work have been done before.
7
2.2 Previous Work
This section is discussed about the previous research that had been carried out
on power quality problems. There are many researches have been done in previous
literature on power quality identification using various method as mention before.
2.2.1 Analysis of Variance (AOVA) method
Claudio De Capua, Stefano De Falco, Annalisa Liccardo and Amelia Romeo
[12] have discussed about the improvement of new synthetic power quality problem.
The proposed approach consists of two steps. The first one concerns definition and
validation of the indexes of measure with the statistical validation with correlation
and ANOVA approach, the second one is about the evaluation of the effects (costs
for the user experiencing PQ decrease) through the Taguchi’s function. Through the
ANOVA technique, it has been realized the base to build the cost function and this is
true when a correspondence is found between the indexes variance levels and the
cost of the technologic solution to overcome PQ problem [13]. In view of this study,
it’s not carried on to validate and prove its significance in terms of effective cost.
This paper also did not acquire the information related to economics effect generated
by the voltage and current disturbances detect through define more sensible indexes.
Shuang-Huan Zhan and Hong-Bin Zhang [8] have discussed about blind
stegan alysis using statistical model based on high-order wavelet decomposition and
Analysis of Variance (ANOVA). The wavelet decomposition method is used to
capture statistical difference between cover images and stego images and the
ANOVA method is applied to test which wavelet statistics are more sensitive to
hidden message. The goal of this paper is to investigate the sensitivity of wavelet
statistics to hidden message. In order to identify these wavelet statistics’ effective in
8
steganalysis, ANOVA method is used to test which statistics are consistent and
accurate against the effects of various steganography tools or various steganography
rate. For the conclusion, the author was state that the ANOVA technique is used to
test which statistics are more significant to hidden messages compared with other
wavelet statistics. Those statistics with higher F-scores (low p-value) are significant
to hidden message and accordingly chosen as images’ features. The results of
classification show that the ANOVA used to test proper wavelet statistics is effective
and testing accurate rate have got been apparently improved.
For the conclusion in this part, from the previous work it can show that, the
ANOVA method is not very familiar with power quality field. The ANOVA method
mostly use in image processing. Because of some advantages of ANOVA method,
this method is prefer to used in this project.
2.2.2 Wavelet Transform
C. Sharmeela, M.R. Mohan, G.Uma and J.Baskaran [9] have discussed about
a novel method to detect and classify power quality disturbances using wavelets. The
proposed algorithm uses different wavelets each for a particular class of disturbance.
The method used wavelet filter banks in an effective way and does multiple filtering
to detect the disturbances. A qualitative comparison of results shows the advantages
and drawbacks of each wavelet when applied to the detection of the disturbances.
This method is tested for a large class of test conditions simulated in MATLAB. In
this paper, the author choose the wavelet method because the wavelet method have
more advantages compare to others method. The authors also state that, the Fourier
transform is less efficient in tracking the signal dynamics. A point to point
comparison scheme has been proposed to discover the dissimilarities between
consecutivecycles. This approach was feasible in detecting certain kinds of
disturbances but fail to detect those disturbances that appear periodically. In this
9
paper, the author also discuss about the advantages using the wavelet method. This
method is independent of the load voltage and can be easily customized for different
sampling frequencies. In this approach, for detecting each disturbance a particular
wavelet is used. The method uses wavelet filter banks in an effective way and does
multiple filtering to detect the disturbances. The performance evaluation of different
wavelets in the proposed method shows the capability of a particular wavelet in
detecting a particular disturbance.
A. Mahmoudi, S. H. Hosseinian, A. Doroudi [11] proposed new and fast
method for detection of power quality disturbances using wavelets transform. In this
paper, the author was state that, there are several methods have been proposed for
detection and classification of power quality (PQ) issues using wavelet transform
(WT). In this paper, the best method is presented for each disturbance using
comparison and combination of these methods. The proposed method increases
accuracy of detection and, moreover, it has better performance for detection of
frequency intervals of the disturbances. However, this method has some
shortcomings such as large amount of computations. Therefore, a new method is
proposed which decreases the computations and, moreover, this method can perform
detection, processing and comparison of disturbances simultaneously. The author
also disscuss the disadvantages using fourier transform for detct the PQ events. The
author was state that the Fourier transform cannot track the signal dynamics. For the
result of this paper, it shows that in this situationsuitable levels and mother wavelet
for each disturbance are transient is the first level of detail coefficients with Db3. For
the harmonics, the PQ events is detect in sixth level detail coefficients with Dmey
and the flicker events, the eight lecel detail coefficient with Db10 and sym8 mother
wavelets. For the sag and swell, the fifth level approximate coefficient with Db 10
and sym8 is the best solution to detect the PQ events. For the conclusion of this
paper, the best method was presented for each disturbance using comparison and
combination of different methods. The combined method increased the accuracy of
detection for each disturbance and, moreover, it had better performance for detection
of frequencies of the disturbances. However, this method had some shortc
omingssuch as large amount of computations. Therefore, a newmethod was proposed
which decrea sed the computations and, moreover, this method could perform
10
detection, processing and comparison of disturbances simultaneously. This method
also can detect the time of disturbances.
From the previous work, it can shows that the wavelet transform method is a
good method used to detect and classify the PQ events.
2.3 Theory of Power Quality
A power quality problem is defined as any power problem manifested in
voltage, current, or frequency deviations that result in power failure or disoperation
of customer of equipment from the perspective of customers [15].
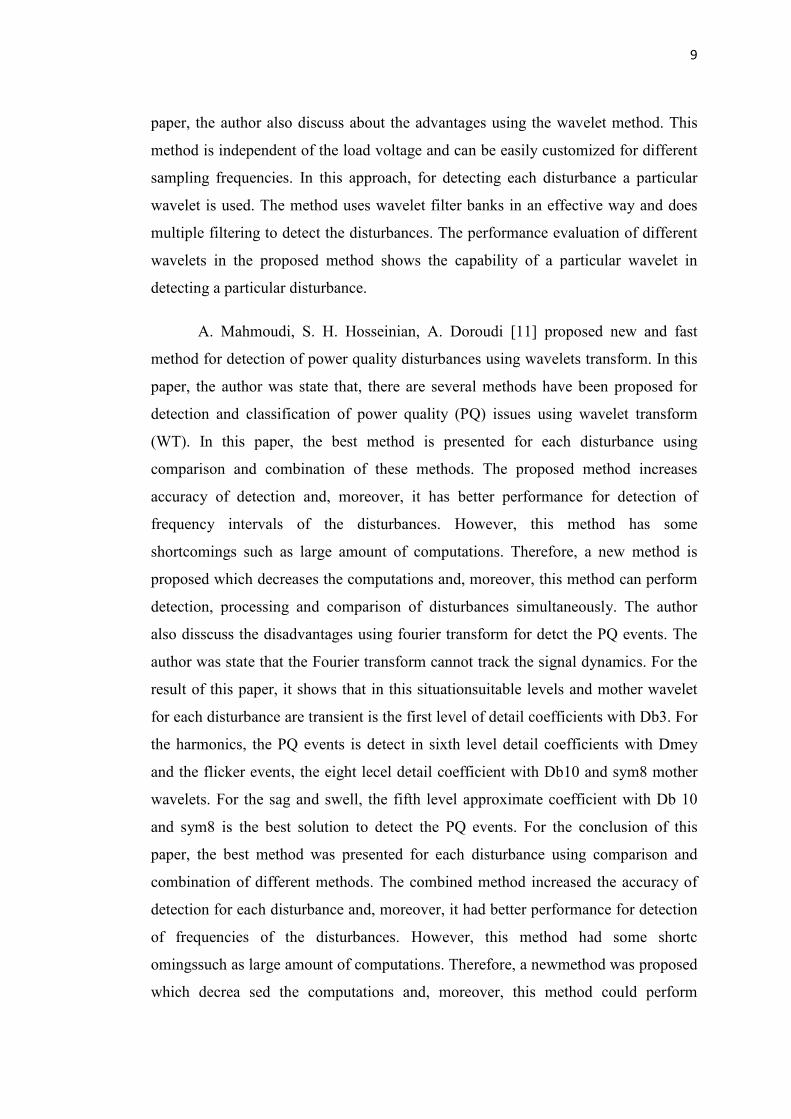
2.3.1 Voltage Sag
Voltage sag is described as a drop of 10-90% of the rated system voltage
lasting for half a cycle to 1 min. The causes of voltage sags are caused by system
faults and energisation of heavy loads. Voltage sag is not a complete interruptionof
power; it is a temporary drop below 90 percent of the nominal voltage level [16] .
Voltage sag is also caused a problem will depend on the magnitude and duration of
the sag and on the sensitivity of your equipment. The following Figure 2.1 shows the
voltage sag phenomena in power quality events.
11
0 0.2 0.4 0.6 0.8 1-2
-1.5
-1
-0.5
0
0.5
1
1.5
2x 10
4
TIme (s)
Voltage (V)
Voltage Sag
Figure 2.1: Voltage Sag Waveform
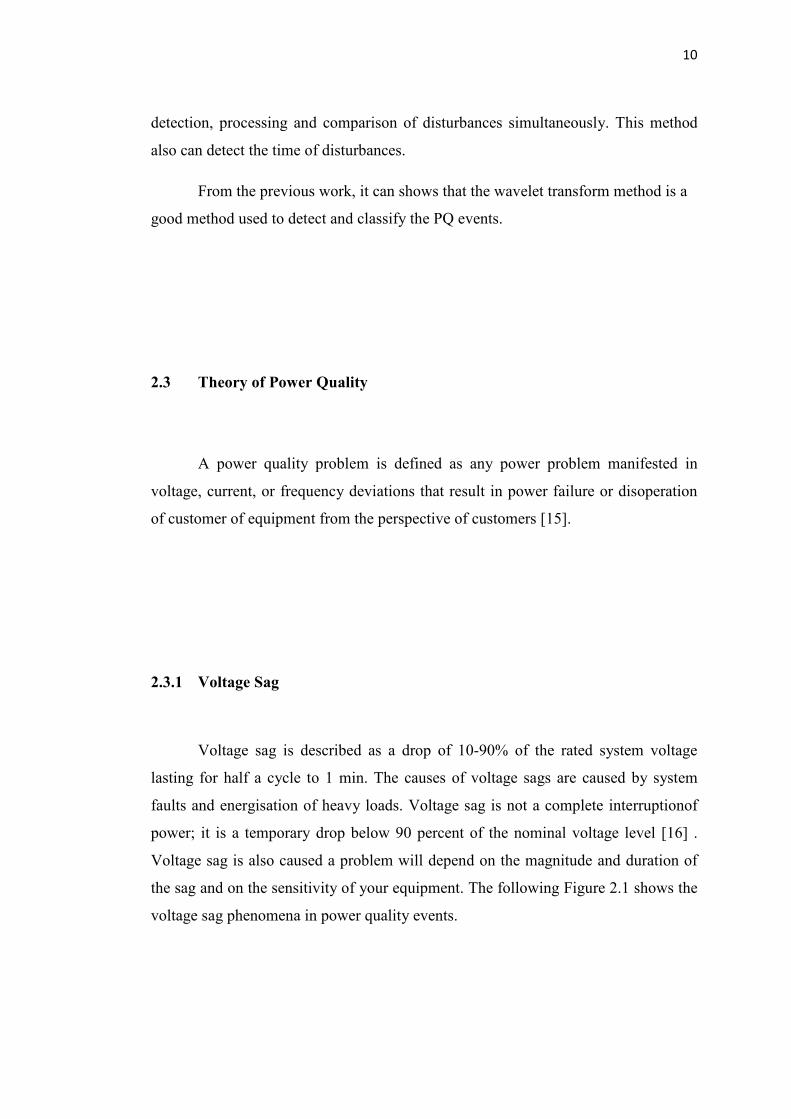
2.3.2 Voltage Swell
Voltage swells are defined as the increase of fundamental frequency voltage
for a short duration lasting for half a cycle to 1 min [17]. The overvoltage condition
may cause breakdown of components on the power supplies of the equipment,
though the effect may be a gradual, accumulative effect. The increase in output from
incandescent lighting may be noticeable, if the duration is longer than three cycles.
The following Figure 2.2 shows the voltage swell waveform in power quality events.
12
0.38 0.4 0.42 0.44 0.46 0.48 0.5 0.52-3
-2
-1
0
1
2
3x 10
4
Time (s)
VOltage (V)
Voltage Swell
Figure 2.2: Voltage Swell Waveform
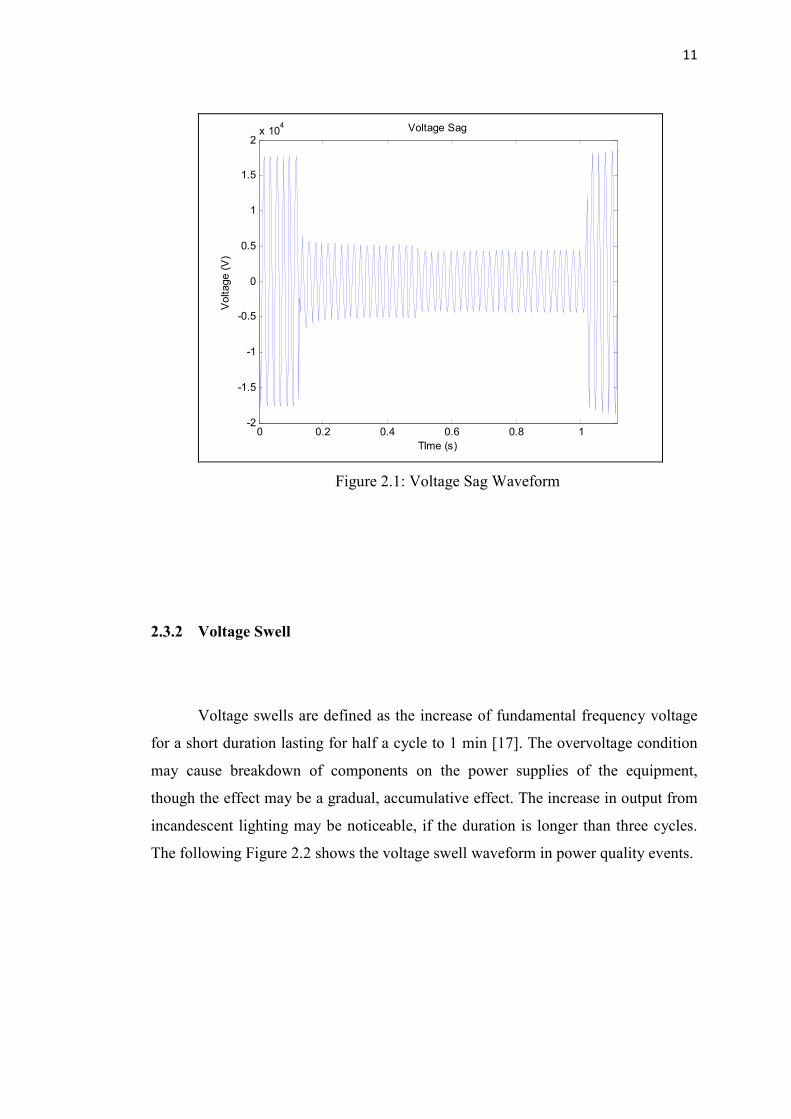
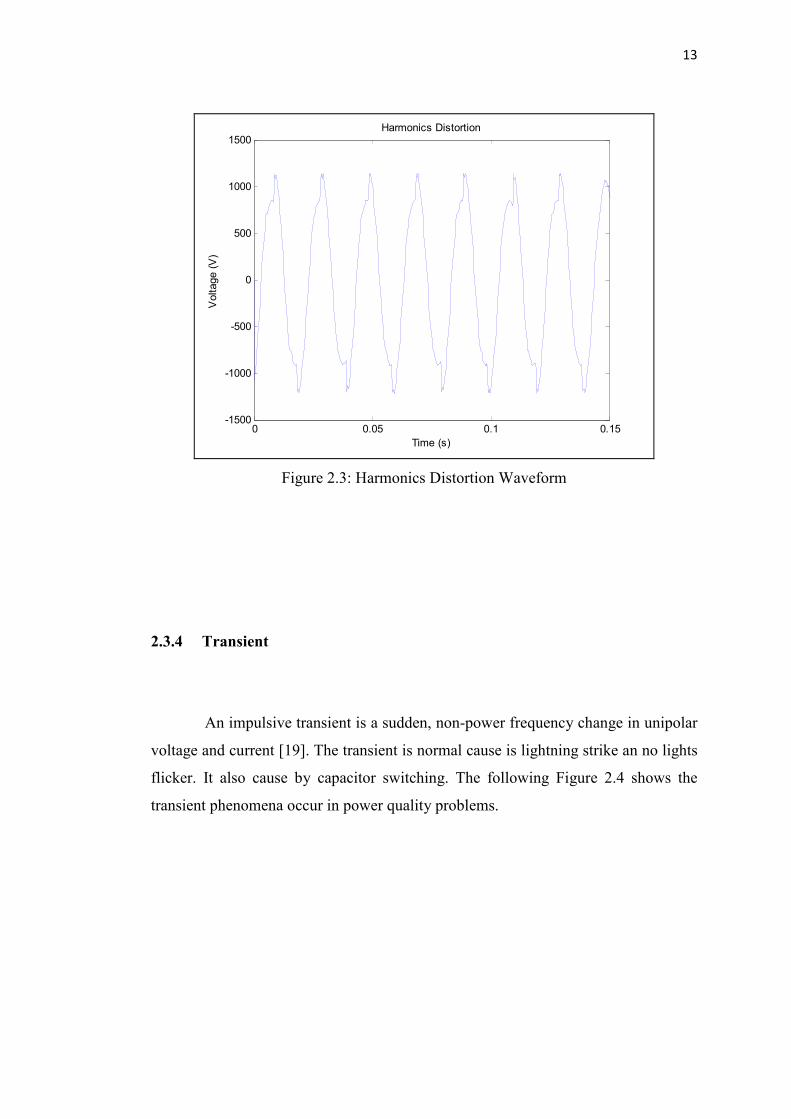
2.3.3 Harmonics Distortion
Harmonic distortion is found in both the voltage and the current waveform
generated by electronic loads, also called non-linear loads drives. Harmonics
distortion can cause the waveforms of the voltage supplied by the utility and the
current utilized by consumers are perfect 50 Hz sine wave deformed and produce
multiple frequencies other than the 50 Hz sine wave [18]. Figure 2.3 shows the
harmonics distortion phenomena in power quality events.
.
13
0 0.05 0.1 0.15-1500
-1000
-500
0
500
1000
1500
Time (s)
Voltage (V)
Harmonics Distortion
Figure 2.3: Harmonics Distortion Waveform
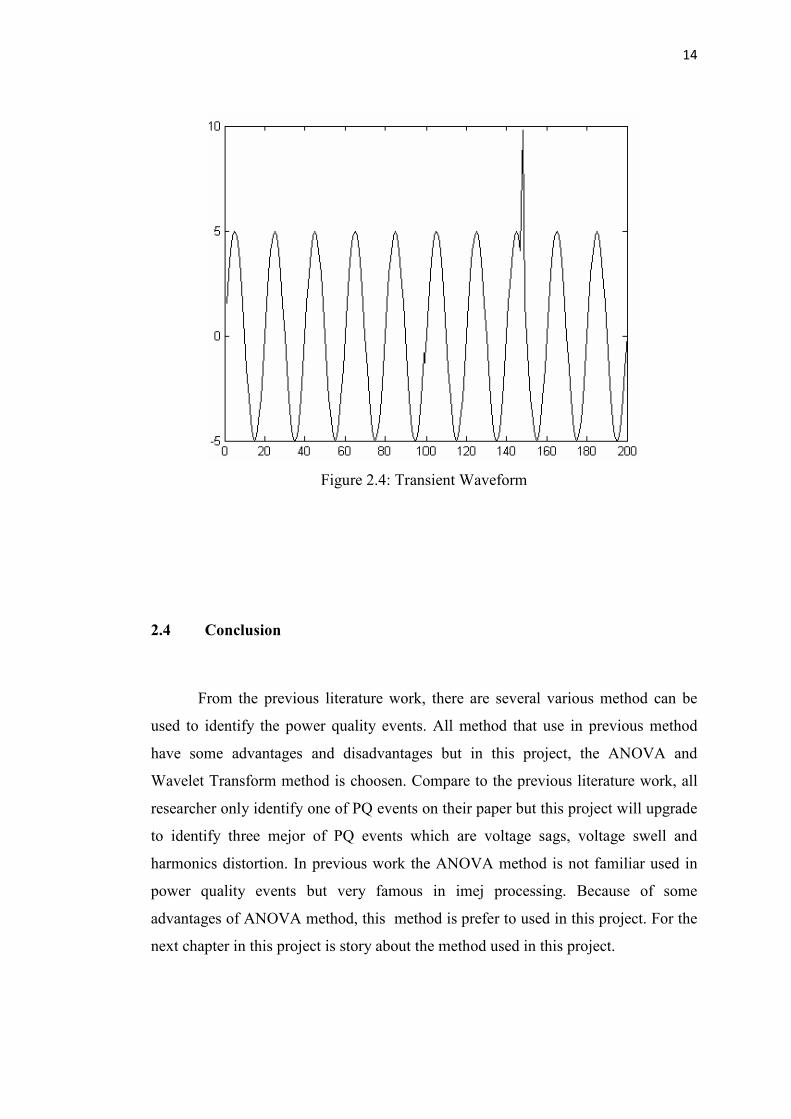
2.3.4 Transient
An impulsive transient is a sudden, non-power frequency change in unipolar
voltage and current [19]. The transient is normal cause is lightning strike an no lights
flicker. It also cause by capacitor switching. The following Figure 2.4 shows the
transient phenomena occur in power quality problems.
14
Figure 2.4: Transient Waveform
2.4 Conclusion
From the previous literature work, there are several various method can be
used to identify the power quality events. All method that use in previous method
have some advantages and disadvantages but in this project, the ANOVA and
Wavelet Transform method is choosen. Compare to the previous literature work, all
researcher only identify one of PQ events on their paper but this project will upgrade
to identify three mejor of PQ events which are voltage sags, voltage swell and
harmonics distortion. In previous work the ANOVA method is not familiar used in
power quality events but very famous in imej processing. Because of some
advantages of ANOVA method, this method is prefer to used in this project. For the
next chapter in this project is story about the method used in this project.
15
CHAPTER III
METHODOLOGY
3.1 Introduction
There are two methods used in this project. The first used the Analysis of
Variance (ANOVA) method and another one used Wavelet Transform. The ANOVA
method is an analytical process design to explore large amounts of data in search of
consistent pattern and systematic relationships between variables and then to validate
the finding by applying the detected pattern to new subsets of data and Wavelet
Transform is a mathematical tool that provides an automatic detection of power
quality problems waveform. Wavelet will represent the signal as a sum of the
wavelets at different location and scales and it also will transform the signal into
different time domain.
16
3.2 Software Development
The main purpose of this study is to construct a simple programming to detect
and classify power quality events based on ANOVA and Wavelet Transform method
using MATLAB software version 7.8. Figure 3.1 shows the flow chart for software
development in this study.
3.2.1 Analysis Using RPM Power Analysis Software
The data contain the power quality events like voltage sags, voltage swell and
harmonics distortion is identified and analyzed using the RPM Power Analysis
Software. The data in this project is taken from 22 kV distribution systems in Skudai,
Johor. By using the RPM Power Analysis Software the data of power quality events
is identified in graph form. In order to analyzed the data, graph must be convert excel
file (*.xls). This is because using the MATLAB software, all the data need to be
analyzed must be in excel file (*.xls).
3.2.2 Steps to Converted Waveform to Excel File
By using RPM Power Analysis software, it only identified the waveform of
the power quality events. So, the data must be converted into excel file due to
MATLAB. Software needed.
17
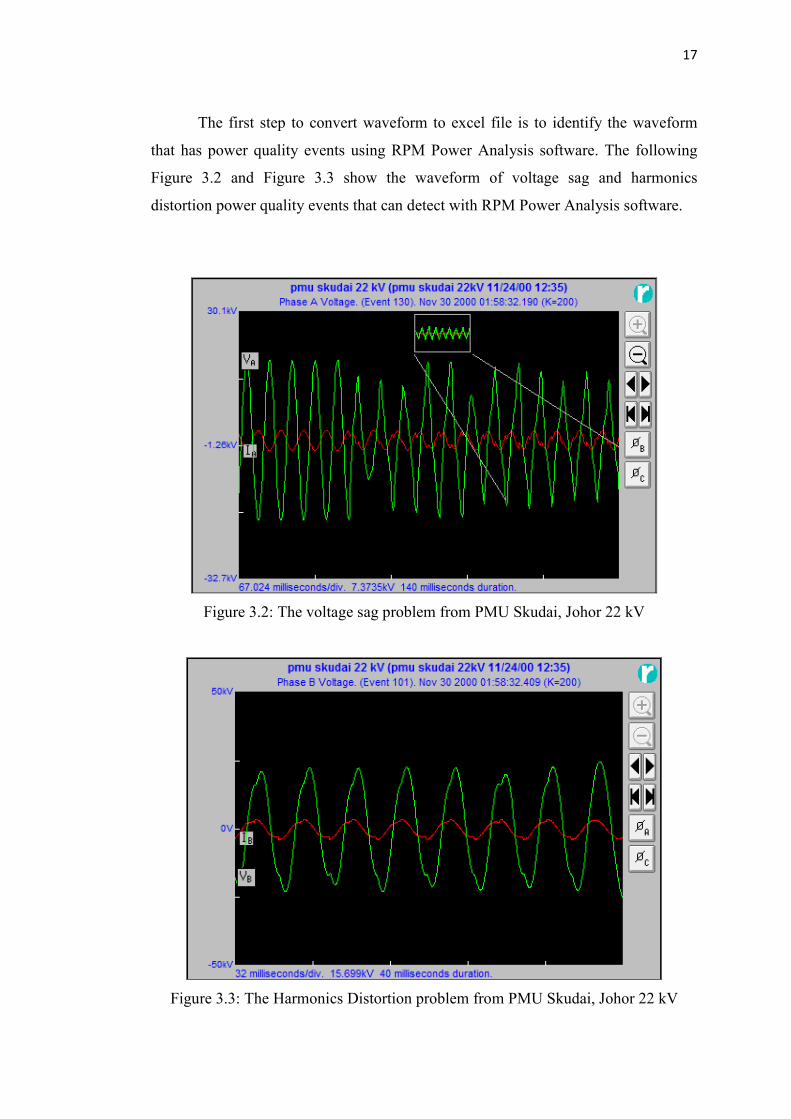
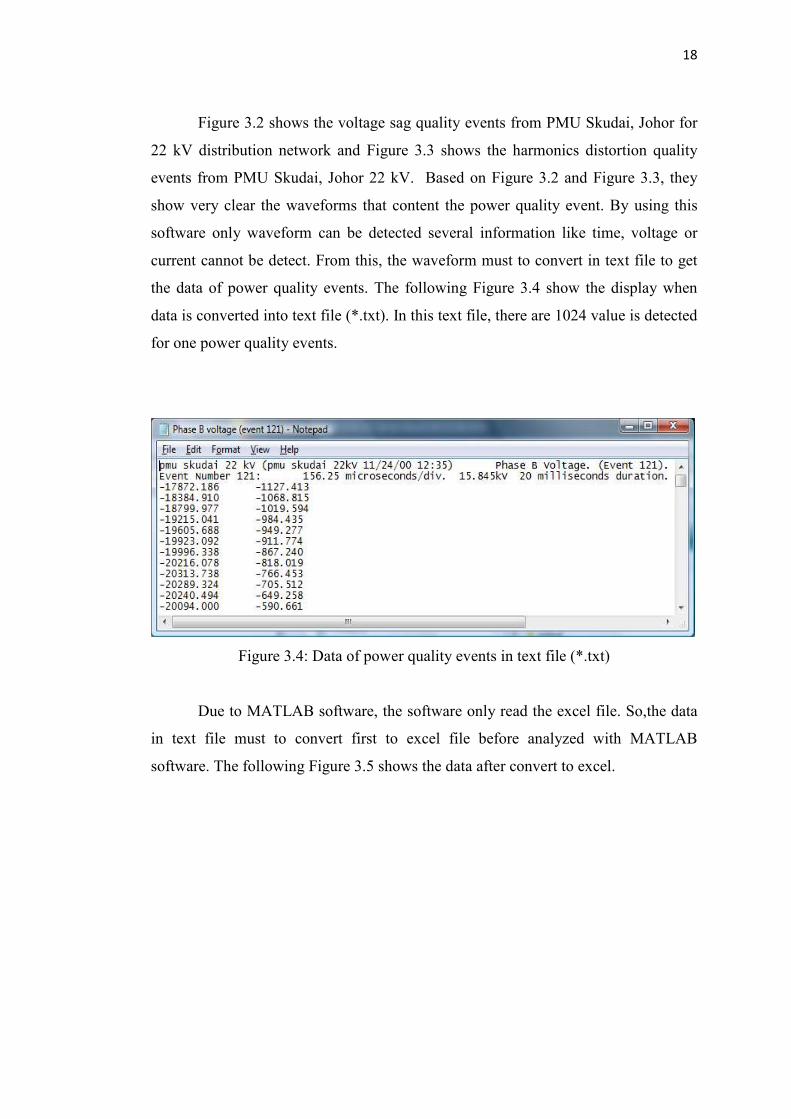
The first step to convert waveform to excel file is to identify the waveform
that has power quality events using RPM Power Analysis software. The following
Figure 3.2 and Figure 3.3 show the waveform of voltage sag and harmonics
distortion power quality events that can detect with RPM Power Analysis software.
Figure 3.2: The voltage sag problem from PMU Skudai, Johor 22 kV
Figure 3.3: The Harmonics Distortion problem from PMU Skudai, Johor 22 kV
18
Figure 3.2 shows the voltage sag quality events from PMU Skudai, Johor for
22 kV distribution network and Figure 3.3 shows the harmonics distortion quality
events from PMU Skudai, Johor 22 kV. Based on Figure 3.2 and Figure 3.3, they
show very clear the waveforms that content the power quality event. By using this
software only waveform can be detected several information like time, voltage or
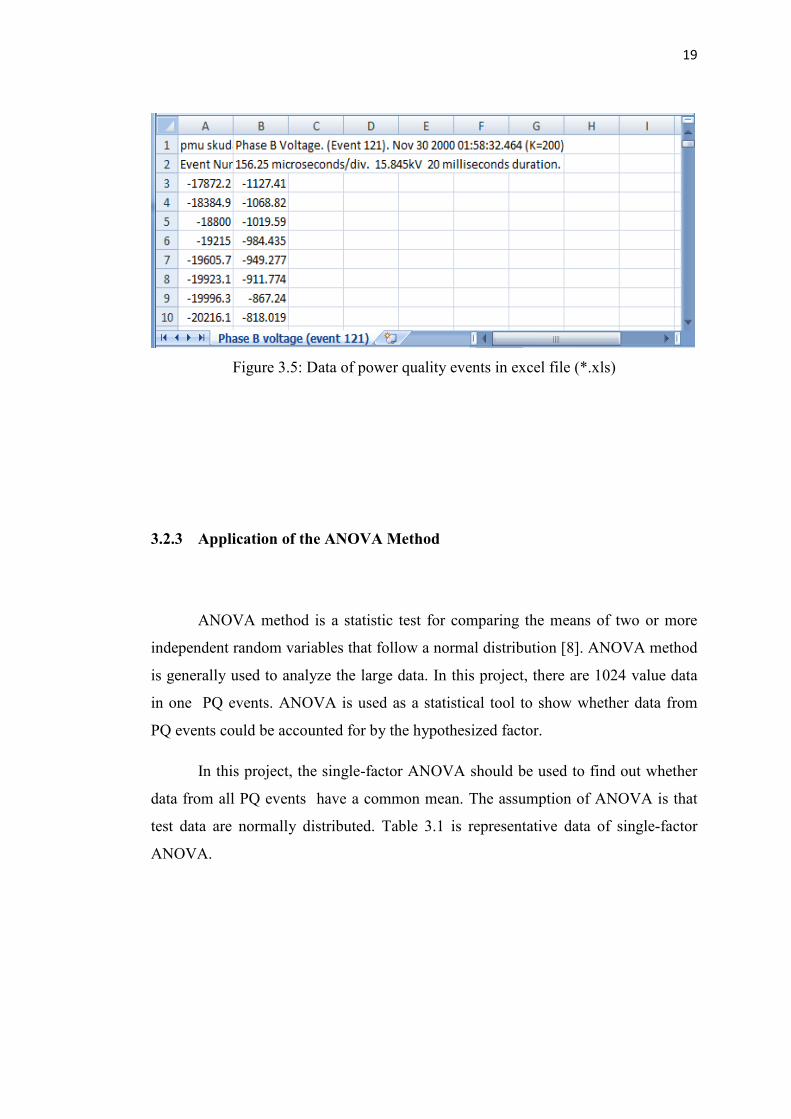
current cannot be detect. From this, the waveform must to convert in text file to get
the data of power quality events. The following Figure 3.4 show the display when
data is converted into text file (*.txt). In this text file, there are 1024 value is detected
for one power quality events.
Figure 3.4: Data of power quality events in text file (*.txt)
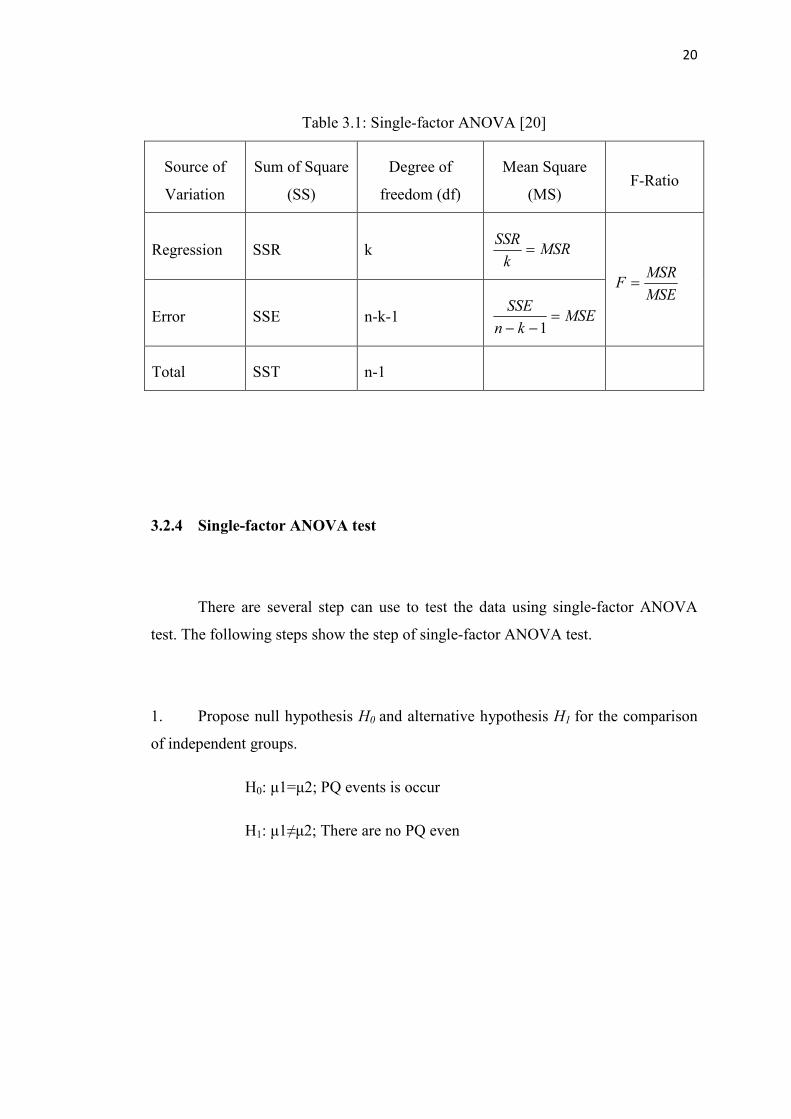
Due to MATLAB software, the software only read the excel file. So,the data
in text file must to convert first to excel file before analyzed with MATLAB
software. The following Figure 3.5 shows the data after convert to excel.
19
Figure 3.5: Data of power quality events in excel file (*.xls)
3.2.3 Application of the AOVA Method
ANOVA method is a statistic test for comparing the means of two or more
independent random variables that follow a normal distribution [8]. ANOVA method
is generally used to analyze the large data. In this project, there are 1024 value data
in one PQ events. ANOVA is used as a statistical tool to show whether data from
PQ events could be accounted for by the hypothesized factor.
In this project, the single-factor ANOVA should be used to find out whether
data from all PQ events have a common mean. The assumption of ANOVA is that
test data are normally distributed. Table 3.1 is representative data of single-factor
ANOVA.
20
Table 3.1: Single-factor ANOVA [20]
Source of
Variation
Sum of Square
(SS)
Degree of
freedom (df)
Mean Square
(MS) F-Ratio
Regression SSR k MSRk
SSR=
MSE
MSRF =
Error SSE n-k-1 MSEkn
SSE=
−− 1
Total SST n-1
3.2.4 Single-factor AOVA test
There are several step can use to test the data using single-factor ANOVA
test. The following steps show the step of single-factor ANOVA test.
1. Propose null hypothesis H0 and alternative hypothesis H1 for the comparison
of independent groups.
H0: µ1=µ2; PQ events is occur
H1: µ1≠µ2; There are no PQ even
21
2. Compute Mean Square for regression and Mean Square for error
a. Mean square for regression, MSR
k
SSRMSR = ............................................................(4.1)
b. Mean square for error MSE:
1−−=
kn
SSEMSE ...................................................... (4.2)
3. Compute statistic F
MSE
MSRF = ............................................................... (4.3)
4. Determine significant level and select test statistics
Given a significant level α, the probability of F ≥ Fα is P{F≥Fα}=α. ANOVA
returns P value for null hypothesis that means there are no PQ events. A low P value,
namely high F-statistic, indicates that there is evidence to reject the null hypothesis
H0 in favor of the alternative H1. Given a significant level of 0.05, any test resulting
in a P value under 0.05 would be significant. Therefore, the null hypothesis would be
rejected in favor of the alternative hypothesis, means that the data have no PQ
events.
3.2.5 Wavelet Transform
22
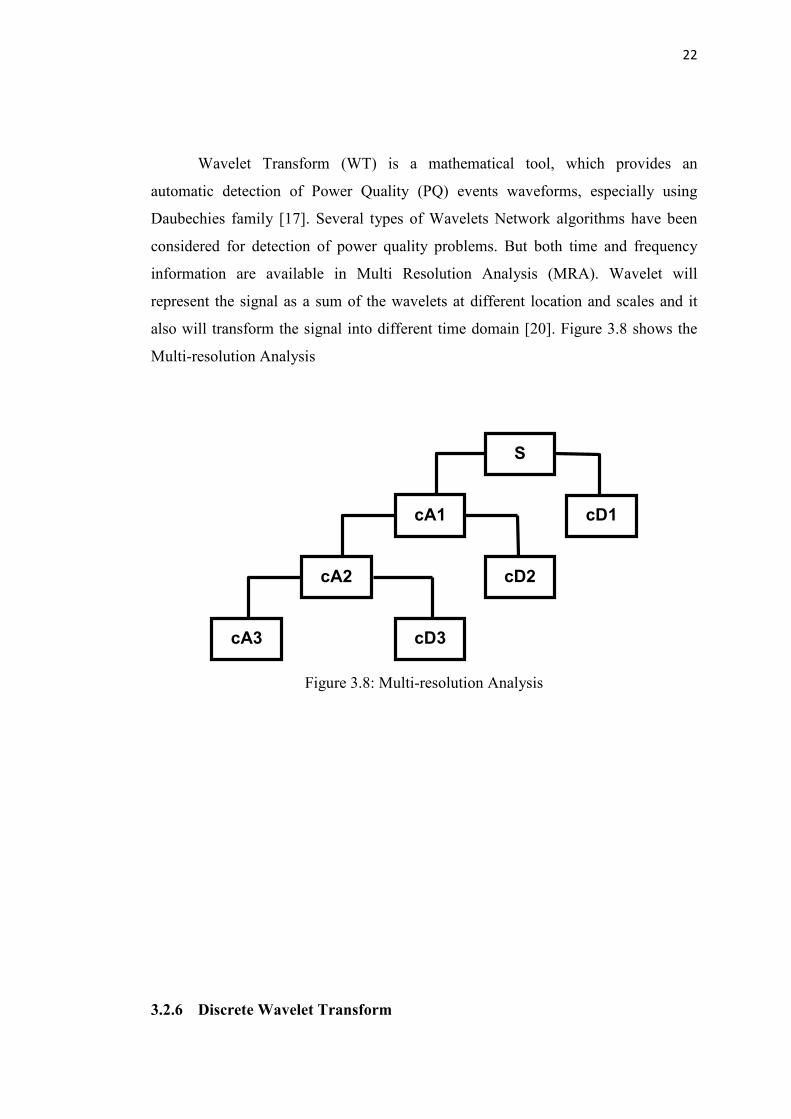
Wavelet Transform (WT) is a mathematical tool, which provides an
automatic detection of Power Quality (PQ) events waveforms, especially using
Daubechies family [17]. Several types of Wavelets Network algorithms have been
considered for detection of power quality problems. But both time and frequency
information are available in Multi Resolution Analysis (MRA). Wavelet will
represent the signal as a sum of the wavelets at different location and scales and it
also will transform the signal into different time domain [20]. Figure 3.8 shows the
Multi-resolution Analysis
Figure 3.8: Multi-resolution Analysis
3.2.6 Discrete Wavelet Transform
S
cD 1 cA 1
cA 3
cA 2
cD 3
cD2
23
The discrete wavelet transform (DWT) is one of the three forms of wavelet
transform. It moves a time domain discritized signal into its corresponding wavelet
domain. This is done through a process called “sub-band codification”, which is done
through digital filter techniques [22]. In power quality researches, however, more
properties other than stationary are required, and thus make the DWT application
more appropriate than Fourier transform [23].
3.3 Conclusion
For the methodology, all method used in this project is explain. From this it
can conclude that, the ANOVA and Wavelet Transform method are useful method
used to detect and classify power quality events. The next chapter can explain about
the result analysis and discussion for this project
24
CHAPTER IV
RESULT, AALYSIS AD DISCUSSIO
4.1 Introduction
This chapter provides the results, analysis data and discussion for this
project. The analysis in this project used MATLAB software. MATLAB software in
Analysis of Varience (ANOVA) method and wavelets transform are used to identify
and classify the power quality events.This project is only focusing on the
distribution network for 22 kV. The analysis of the Power Quality (PQ) events is
taken from several data of voltage sag, voltage swell and harmonics distortion in 22
kV distribution network. For the overall analysis, it consists of several data from
three major PQ events. In order to form a better result, all data is analyzed first with
ANOVA method and is followed with wavelet transform.
37
REFERECES
[1] D. Saxena, K.S. Verma and S.N. Singh, (2010). “Power quality event
classification: an overview and key issues”, International Journal of
Engineering, Science and Technology, Vol. 2, No. 3, 2010, pp. 186-199
[2] Alok Thapar, Tapan Kumar Saha, Zhao Yang Dong, “Investigation of Power
Quality Categorisation and Simulating It’s Impact on Sensetive Electronic
Equipment”, University of Queensland, Australia
[3] Sudipta Nath, Arindam Dey and Abhijit Chakrabarti, (2009). “Detection of
Power Quality Disturbances using Wavelet Transform”, World Academy of
Science, Engineering and Technology 49
[4] Roger C. Dugan, Mark F. McGranaghan and H. Wayne Beaty, TK1001.D84
(1996). “Electrical Power Systems Quality”, Mc Graw-Hill. Pages 1-8 and 39-
80.
[5] Muhammad Faizal bin Mohamad Yusof, (2009). “Voltage Sags Ride Through
Mitigation Techniques”, UTM
[6] J. JIN and H. GUO, (2003). ANOVA Method for Variance Component
Decomposition and Diagnosis in Batch Manufacturing Processes, The
International Journal of Flexible Manufacturing Systems, 15, 167–186
38
[7] Santoso, S., Powers, E. J. & Grady, W. M. (1997). Power Quality Disturbance
Data Compression Using Wavelet Transform Methods. University of Texas:
IEEE. pp. – 1250 – 1256.
[8] Shuang-Huan Zhan and Hong-Bin Zhang (2007). “Blind Steganalysis Using
Wavelet Statistic and ANOVA”, Proceedings of the Sixth International
Conference on Machine Learning and Cybernetics, Hong Kong
[9] Sharmeela, C., Mohan, M. R., Uma, G. & Baskaran, J. (2006). A Novel
Detection and Classification Algorithm for Power Quality Disturbances Using
Wavelets, American Journal of Applied Sciences, Vol. 3. No. 10, pp. 2049-
2053.
[10] Norshafinash binti Saudin, (2007). Voltage Sags Mitigation Techniques
Analysis, Master Thesis, UTM
[11] A. Mahmoudi, S. H. Hosseinian, A. Doroudi (2010). “ANew and Fast Method
for Detection of Power Quality Disturbances Using Wavelet Transform”,
Tehran, Iran, PQC2010-1217
[12] Claudio De Capua, Stefano De Falco, Annalisa Liccardo and Amelia Romeo,
(2005). “Improvement of New Synthetic Power Quality Indexes: An Original
Approach to Their Validation”, Technology Conference Ottawa, Canada
[13] Claudio De Capua, E. Remeo, A. Liccardo, (2004). “New Synthetic Power
Quality Indexes and associated Measurement Techniques”, Proc. Of 13th
IMEKO TC4 Symposium, Athens
[14] Irina Codreanu (2007), “A Procedure Based on ANOVA Method for Estimating
The Maximum Number of Generations for Optimzation Genetic Algorithm”,
Bucharest, Romania