
GROWTH OF ZINC OXIDE NANO-RODS ON OPTICAL … · adalah kaedah yang ringkas dan kos rendah yang...
135
GROWTH OF ZINC OXIDE NANO-RODS ON OPTICAL FIBERS FOR OPTICAL INTERCONNECTS AND SIDE COUPLING APPLICATIONS HOORIEH FALLAH DISSERTATION SUBMISSION IN FULFILMENT OF THE REQUIRMENTS FOR THE DOCTOR OF PHILOSOPHY INSTITUTE OF GRADUATE STUDIES UNIVERSITY OF MALAYA KUALA LUMPUR 2016
-
Upload
truonghanh -
Category
Documents
-
view
227 -
download
0
Transcript of GROWTH OF ZINC OXIDE NANO-RODS ON OPTICAL … · adalah kaedah yang ringkas dan kos rendah yang...
GROWTH OF ZINC OXIDE NANO-RODS ON OPTICAL FIBERS FOR OPTICAL INTERCONNECTS AND SIDE
COUPLING APPLICATIONS
HOORIEH FALLAH
DISSERTATION SUBMISSION IN FULFILMENT OF THE REQUIRMENTS FOR THE DOCTOR OF PHILOSOPHY
INSTITUTE OF GRADUATE STUDIES UNIVERSITY OF MALAYA
KUALA LUMPUR
2016

UNIVERSITY MALAYA
ORIGINAL LITERARY WORK DECLARATION
Name of Candidate: HOORIEH FALLAH (I.C/Passport No: L95239738) Registration/ Matric No: HHE120001
Name of Degree: DOCTOR OF PHILOSOPHY
Title of Project Paper/Research Report/Dissertation/Thesis (“this Work”): GROWTH OF ZINC OXIDE NANO-RODS ON OPTICAL FIBERS FOR OPTICAL INTERCONNECTS AND SIDE COUPLING APPLICATIONS
Field of Study: PHOTONICS/ PHYSIC
I do solemnly and sincerely declare that:
1) I am the sole author/writer of this Work; 2) This Work is original; 3) Any use of any work in which copyright exists was done by way of fair
dealing and for permitted purposes and any excerpt or extract from, or reference to or reproduction of any copyright work has been disclosed expressly and sufficiently and the title of the Work and its authorship have been acknowledged in this Work;
4) I do not have any actual knowledge nor do I ought reasonably to know that the making of this work constitutes an infringement of any copyright work;
5) I hereby assign all and every rights in the copyright to this Work to the University of Malaya (“UM”), who henceforth shall be owner of the copyright in this Work and that any reproduction or use in any form or by any means whatsoever is prohibited without the written consent of UM having been first had and obtained;
6) I am fully aware that if in the course of making this Work I have infringed any copyright whether intentionally or otherwise, I may be subject to legal action or any other action as may be determined by UM
Candidate’s Signature Date 22/1/2016
Subscribed and solemnly declared before
Witness’s Signature Date
Name:
Designation
iii
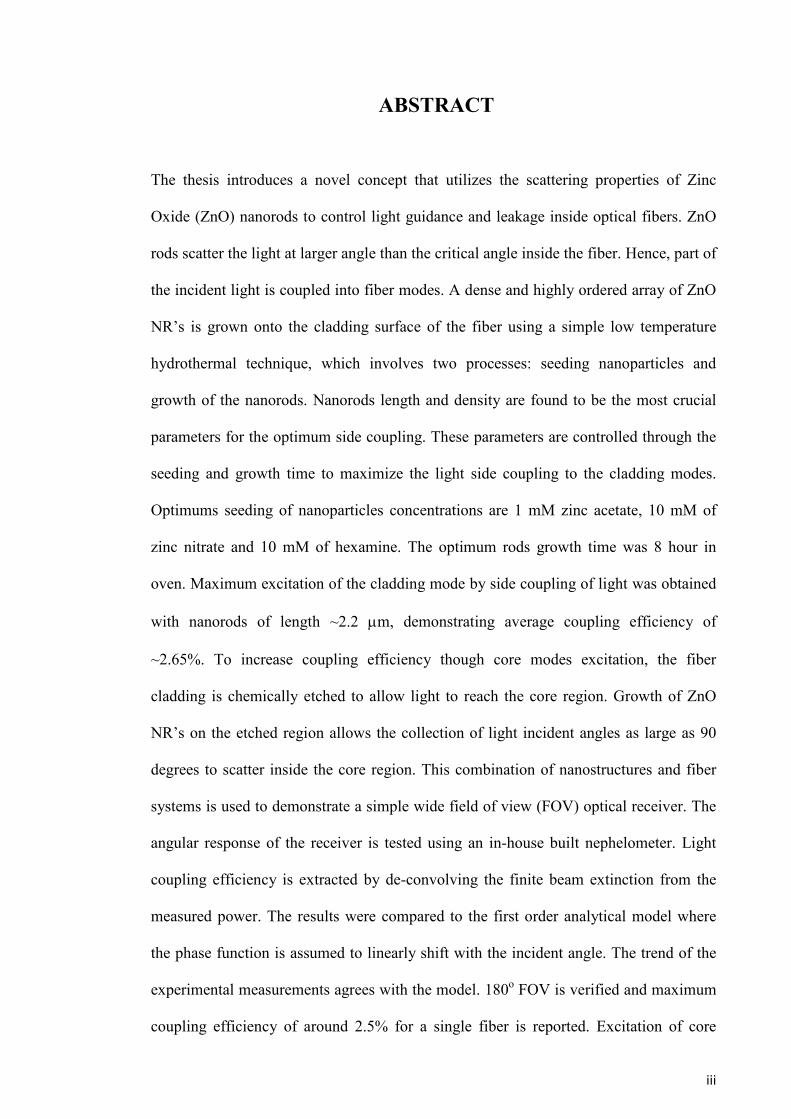
ABSTRACT
The thesis introduces a novel concept that utilizes the scattering properties of Zinc
Oxide (ZnO) nanorods to control light guidance and leakage inside optical fibers. ZnO
rods scatter the light at larger angle than the critical angle inside the fiber. Hence, part of
the incident light is coupled into fiber modes. A dense and highly ordered array of ZnO
NR’s is grown onto the cladding surface of the fiber using a simple low temperature
hydrothermal technique, which involves two processes: seeding nanoparticles and
growth of the nanorods. Nanorods length and density are found to be the most crucial
parameters for the optimum side coupling. These parameters are controlled through the
seeding and growth time to maximize the light side coupling to the cladding modes.
Optimums seeding of nanoparticles concentrations are 1 mM zinc acetate, 10 mM of
zinc nitrate and 10 mM of hexamine. The optimum rods growth time was 8 hour in
oven. Maximum excitation of the cladding mode by side coupling of light was obtained
with nanorods of length ~2.2 µm, demonstrating average coupling efficiency of
~2.65%. To increase coupling efficiency though core modes excitation, the fiber
cladding is chemically etched to allow light to reach the core region. Growth of ZnO
NR’s on the etched region allows the collection of light incident angles as large as 90
degrees to scatter inside the core region. This combination of nanostructures and fiber
systems is used to demonstrate a simple wide field of view (FOV) optical receiver. The
angular response of the receiver is tested using an in-house built nephelometer. Light
coupling efficiency is extracted by de-convolving the finite beam extinction from the
measured power. The results were compared to the first order analytical model where
the phase function is assumed to linearly shift with the incident angle. The trend of the
experimental measurements agrees with the model. 180o FOV is verified and maximum
coupling efficiency of around 2.5% for a single fiber is reported. Excitation of core

iv
modes through side coupling allows for application of these devices towards wide FOV
optical receivers.
v
ABSTRAK
Kerja yang dibentangkan di sini memperkenalkan satu konsep baru yang menggunakan
ciri-ciri penyerakan nanorod zink oksida untuk mengawal pemanduan cahaya dan
kebocoran di dalam gentian optik yang disalut dengan nanorod.Rod zink oksida
menyerak cahaya pada sudut yang besar daripada sudut genting di dalam gentian.Oleh
sebab itu, sebahagian pelanggaran cahaya digandingkan ke dalam mod gentian. Satu
kepadatan dan susunan yang amat teratur nanorod zink oksida ditumbuhkan pada
gentian menggunakan proses hidroterma bersuhu rendah. Pertumbuhan hidroterma
adalah kaedah yang ringkas dan kos rendah yang mana tidak memerlukan vakum dan
sistem yang rumit. Proses tersebut mempunyai dua bahagian: pembenihan nanopartikal
dan pertumbuhan nanorod. Apabila penyerakan cahaya di dalam gentian, panjang
nanorod dan kepadatan didapati sebagai parameter yang penting untuk mengoptimum
gandingan sisi.Dua parameters tersebut dikawal melalui pembenihan dan masa
pertumbuhan.Kesan pertumbuhan nanorod pada penyerakan cahaya dan gandingan
kepada gentian optik diselidiki secara eksperimen.Pertama sekali, process tersebut
dioptimumkan untuk memaksimumkan gandingan kepada mod pelapisan.Optimum
pembenihan nanopartikal dengan kepekatan 1 mM zink asetat, 10 mM zink nitrat dan
10 mM hexamine dilaporkan. Masa pertumbuhan rod tersebut juga dioptimumkan, di
mana 8 jam pertumbuhan di dalam oven didapati mencapai kuasa gandingan yang tinggi
kepada pelapisan mod. Pengujaan maksimum mod pelapisan oleh gandingan sisi cahaya
ditentukan dengan nanorod ZnO dengan panjang ~2.2 µm, menunjukan purata
kecekapan gandingan ialah ~2.65%.Untuk meningkatkan kecekapan melalui pengujaan
mod teras, pelapisan gentian tersebut ditanggalkan untuk membenarkan cahaya sampai
ke bahagian teras.Pertumbuhan nanorod ZnO pada gentian yang dinipiskan secara
kimia membenarkan pengumpulan sudut-sudut tuju cahaya pada 90 darjah untuk

vi
menyerak di dalam bahagian teras. Kombinasi nanostruktur dan system-sistem gentian
digunakan untuk menunjukan satu penerima gentian pandangan medan luas. Sambutan
sudut penerima diuji menggunakan satu nephelometer yang dibina di dalam
makmal.Kecekapan gandingan cahaya diekstrak oleh penggabungan semula kepupusan
rasuk terhingga daripada kuasa yang diukur. Keputusan-keputusan dibandingkan
dengan model analisis peringkat pertama di mana fungsi fasa dianggap beranjak secara
linear dengan sudut tuju.Trend pengukuran eksperimentasi bersetuju dengan model
tersebut. 180o FOV disahkan dan maksimum kecekapan gandingan adalah sekitar 2.5%
untuk satu gentian tunggal dilaporkan. Pengujaan mod teras melalui gandingan sisi
membolehkan penggunaan alat-alat ini ke arah penerima-penerima gentian pandangan
medan luas.

vii
ACKNOWLEDGMENT
First and the most, I would like to sincerely thank to my supervisor Professor Dr
Sulaiman Wadi Bin Harun, Faculty of Engineering, University of Malaya, for his
supervision and constant support. My special and deepest appreciation to my co –
advisor, Dr Waleed Soliman Mohammad, Center of Research in Optoelectronics, and
Communications and Control Systems (BU-CROCCS), school of engineering, Bangkok
University for his motivation to pursue my postgraduate study in optic and photonic
field. His constructive advices and comments through the experimental and thesis work
have contributed to the success of this research. I would like to thank Professor Dr
Joydeep Dutta, Chair in Nanotechnology, and Sultan Qaboos University for his precious
suggestion during experimental work of this research. Special thanks to Professor Dr
Harith Ahmad, head of Photonic Research Center, University of Malaya, which is also
my co-supervisor.
Sincere thanks to all members of BU-CROCCS, Dr Karel Streckx, Dr Poompat
Saenqudomlert, Dr Romual Jolivot, and also my friends, Thanit, Thanujjal, Komal,
Ajay, Rafis, and Mayur for their kindness, moral support and unforgettable memories
during my study.
Finally I would like to thank you all those who directly or indirectly helped me during
this research work.

viii
DEDICATION
This thesis dedicate
To my parents
And well-wishers

ix
TABLE OF CONTENTS
ABSTRACT ..................................................................................................................... iii
ACKNOWLEDGMENT ................................................................................................. vii
DEDICATION ............................................................................................................... viii
LIST OF FIGURES ......................................................................................................... xi
LIST OF TABLES .......................................................................................................... xv
LIST OF SYMBOLS AND ABBREVIATIONS .......................................................... xvi
CHAPTER 1 ..................................................................................................................... 1
INTRODUCTION ............................................................................................................ 1
1.1 Motivation .......................................................................................................... 1
1.2 Background theory ............................................................................................. 3
1.3 Research objective ............................................................................................ 10
1.4 Organization of dissertation ............................................................................. 11
CHAPTER 2 ................................................................................................................... 12
LITERATURE REVIEW................................................................................................ 12
2.1 ZnO NR’s growth ............................................................................................. 12
2.2 Optical fiber ...................................................................................................... 16
2.2.1 Polymer optical fiber(POF) ....................................................................... 20
2.3 Recent progress on the application of ZnO nanostructure ............................... 22
2.4 Recent progress on wide field of View (FOV) antenna for communication application ................................................................................................................... 24
CHAPTER 3 ................................................................................................................... 26
GROWTH OF ZINC OXIDE NANORODS ON OPTICAL FIBER ............................. 26
3.1 Introduction ...................................................................................................... 26
3.2 Growth of ZnO NR’s on silica multimode fiber .............................................. 28
3.3 Growth of ZnO NR’s on an etched silica multimode fiber .............................. 31
3.4 Growth of ZnO NR’s on a plastic fiber ............................................................ 33
3.5 Summary .......................................................................................................... 40
CHAPTER 4 ................................................................................................................... 41
OPTIMIZATION OF GROWTH CONDITION FOR MAXIMUM SIDE COUPLING ......................................................................................................................................... 41
4.1 Introduction ...................................................................................................... 41
4.2 Scattering properties of ZnO nanorods on optical fiber ................................... 41
4.3 Extraction of scattering coefficient using longitudinal scanning approach...... 47
4.4 Scattering parameters extraction using nephelometer ...................................... 53
x
4.4.1 Direct angular spectrum measurement ...................................................... 54
4.4.2 Growth optimization on flat surface ......................................................... 57
4.4.3 Effect of Csc , ρa a and (ἠ)on the coupling efficiency ............................... 58
4.5 Growth optimization on optical fiber ............................................................... 61
4.6 Summary .......................................................................................................... 68
CHAPTER 5 ................................................................................................................... 70
EXCITATION OF CORE MODES THROUGH SIDE COUPLING TO MULTIMODE OPTICAL FIBER BY ZINC OXIDE NANORODS FOR WIDE ANGLE OPTICAL RECEPTION ................................................................................................................... 70
5.1 Introduction ...................................................................................................... 70
5.2 Fabrication of wide FOV optical receiver ........................................................ 72
5.3 Concept of wide FOV optical receiver utilizing the ZnO NR’s ....................... 73
5.3.1 Finite beam effect ...................................................................................... 76
5.3.2 Effect of angle of incident on signal collection ........................................ 81
5.4 Optical characterization of the proposed wide FOV receiver on MMF ........... 83
5.4.1 Wide Field of View ................................................................................... 88
5.5 Optical characterization for FOV optical receiver on POF .............................. 91
5.5.1 Eye diagram graph .................................................................................... 92
5.5.2 Bit Error Rate (BER) measurement .......................................................... 96
5.6 Summary ........................................................................................................ 101
CHAPTER 6 ................................................................................................................. 103
CONCLUSION AND FUTURE OUTLOOK .............................................................. 103
6.1 Introduction .................................................................................................... 103
6.2 Suggestion for future works ........................................................................... 106
REFERENCES .............................................................................................................. 108
LIST OF PUBLICATIONS…………………………………………………………………………………..………….117
xi
LIST OF FIGURES
Figure 1.1: Scattering light with ZnO NR’s on cladding and core modes of silica
multimode optical fiber .............................................................................................. 4
Figure 1.2: Light is incident from a lower refractive index medium (Fresnel reflection).
................................................................................................................................... 5
Figure 1.3: Leakage of the light inside the high index region when incident from the
side of the waveguide. ............................................................................................... 6
Figure 1.4: Total internal reflection when light propagates from a denser media to lower
density at angles larger than the critical angle. .......................................................... 7
Figure 1.5: Allowing light to guide inside the high index region when incident from the
side utilizing an extra element (diffraction or scattering for example). ..................... 8
Figure 2.1: The Wurtzite structure model of ZnO. ......................................................... 13
Figure 2.2: Different growth morphology of ZnO nanostructure. .................................. 14
Figure 2.3: (a) Attachment of HTM to the non - polar facet of ZnO crystal, Hexagonal
ZnO crystal, (b) possible attachment of HTM to the non-polar facet of ZnO and
allow polar surface to growth at c-axis. .................................................................. 16
Figure 2.4: Schematic of an optical fiber structure: a circular solid core with refractive
index n1 surrounded by cladding region with refractive index n2<n1 and a plastic
buffer covers the fiber for mechanical support. ....................................................... 17
Figure 2.5: Comparison of the single mode and multimode optical fibers and the light
guidance inside both fibers ...................................................................................... 18
Figure 2.6: Plastic optical fiber structure. ....................................................................... 21
Figure 2.7: Utilizing bulky hemispherical lens and angle diversity in optical wireless
communication system to improve wide field of view. ........................................... 25
Figure 3.1: Hydrothermal growth of ZnO NR’s on optical fibers. ................................. 27
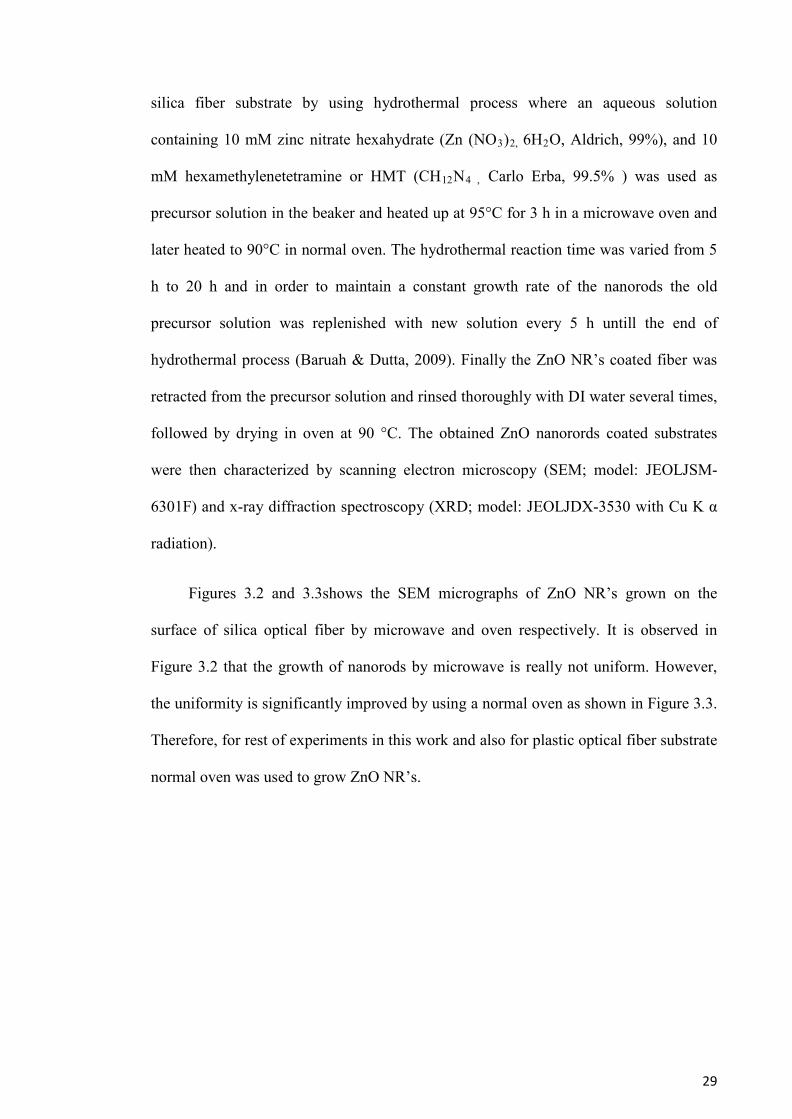
Figure 3.2: (a) Low magnification scanning electron microscope (SEM) images of the
fiber coated with ZnO NR's by microwave technique, (b) Higher magnification of
the nanorods. ................................................................................................. 30
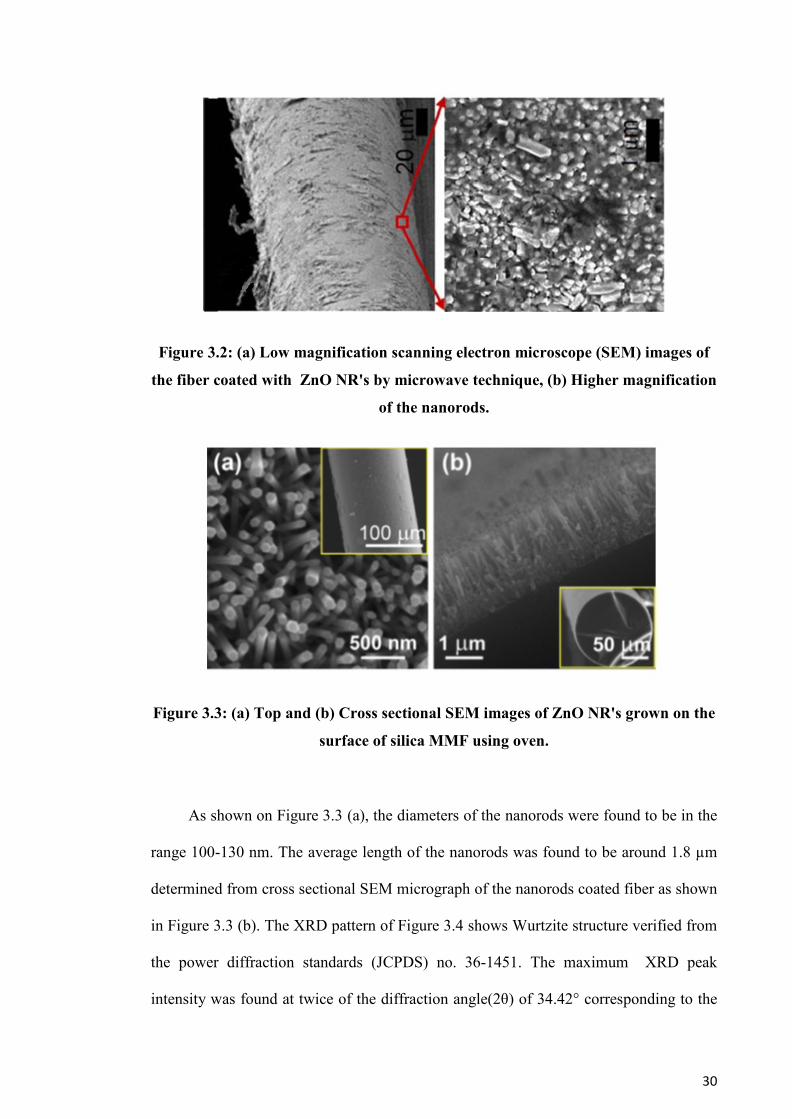
Figure 3.3: (a) Top and (b) Cross sectional SEM images of ZnO NR's grown on the
surface of silica MMF using oven. .......................................................................... 30
Figure 3.4: XRD pattern of ZnO NR's grown on silica MMF. ....................................... 31
Figure 3.5: Fiber diameter versus the etching time in hydrofluoric acid. ....................... 32
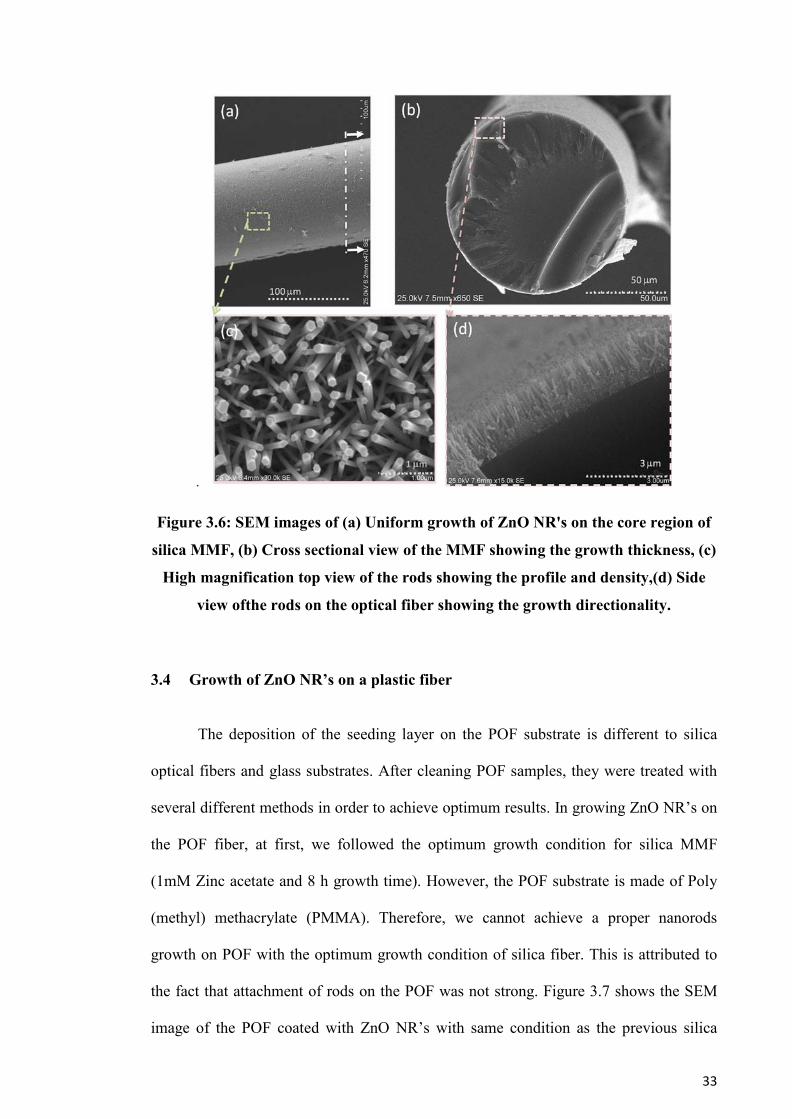
Figure 3.6: SEM images of (a) Uniform growth of ZnO NR's on the core region of silica
MMF, (b) Cross sectional view of the MMF showing the growth thickness, (c)
xii
High magnification top view of the rods showing the profile and density, (d) Side
view of the rods on the optical fiber showing the growth directionality. ................ 33
Figure 3.7: SEM image of not successful growth of ZnO NR's on the POF surface ...... 34
Figure 3.8: SEM image of the POF, which was treated with dodecane thiol to have
stronger attachment between NR's and fiber surface. .............................................. 35
Figure 3.9: SEM image of the nanorods grown on the POF, which was treated with
NaOH during seeding process ................................................................................. 36
Figure 3.10: SEM image of nanorods grown on the POF, which was treated with thiol
and NaOH during the seeding process. .................................................................... 36
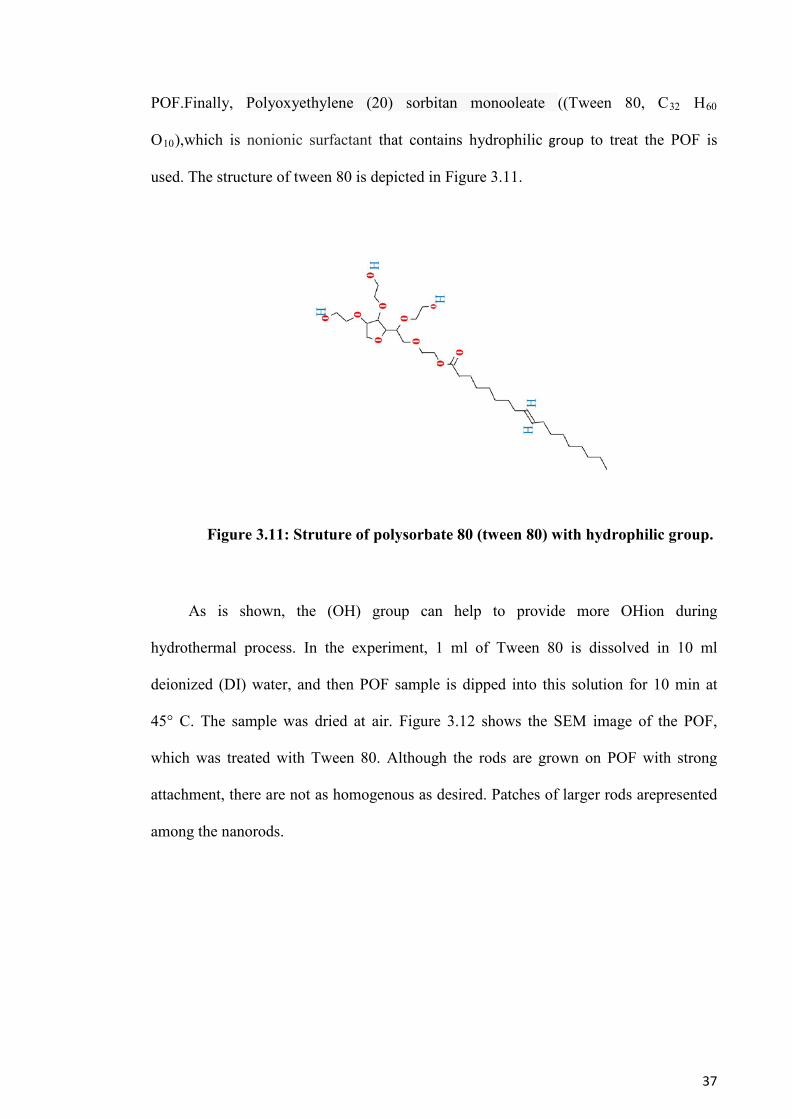
Figure 3.11: Struture of polysorbate 80 (tween 80) with hydrophilic group. ................. 37
Figure 3.12: SEM images of ZnO NR's on the POF, which was traeted with tween ..... 38
80. 38
Figure 3.13: (a) Cross sectional SEM of the aligned ZnO NR's growth on the POF,
which was treated with tween 80 and NaOH , (b) Top view. .................................. 38
Table 3.1: Results of POF treatment to have optimum growth of ZnO NR’s ................ 39
Figure 4.1: Schematic representation of two possible configuration of side coupling to
cladding modes with guided and leakage intensity responses of light paths in the
side-coupling configuration ..................................................................................... 42
Figure 4.2: Illustration of light scattering from one rod.................................................. 43
Figure 4.3: Illustration of light scattering from several rods. ......................................... 44
Figure 4.4: (a) Definition of the polar coordinated and (b) Measured polar plot for the
ZnO NR'S grown on coated fibers, considering symmetry along the θ direction . . 46
Figure 4.5: Optical charachterization setup for the side coupling in wet etched fibers
coated with ZnO NR's. ............................................................................................. 49
Figure 4.6: Different concentration of zinc acetate (2-6 mM concentartion ) used for
growing seed crystal. Images of the output tip of the fiber show relative coupling
intensities and coupling to cladding modes.. ........................................................... 50
Figure 4.7: Measured coupling intesnity (left axis) and average scattering coefficient
(right axis) versus the concentration of zinc acetate for growing ZnO seed crystals.
................................................................................................................................. 51
Figure 4.8: Coupling intensity versus scattering coefficient. .......................................... 52
Figure 4.9: Optical nephelometer setup for testing scattering properties of ZnO grown
on glass substrate. .................................................................................................... 55
xiii
Figure 4.10: The measured normalized angular power spectrum for different seeding
concentration of zinc acetate, lowest concentration showed higher power at larger
angles. ...................................................................................................................... 57
Figure 4.11: Variation of the coupling efficiency (CE) versus the concentration of zinc
acetate used for preparing the ZnO seed layer on glass substrates. ......................... 58
Figure 4.12: Variation in density ρa versus differnet concentrations of Zinc acetate used
for preparing the ZnO seed layer on galss susbtartes. ............................................. 59
Figure 4.13: Variation of Csc versus different concentrations of zinc acetate used for
preparing the ZnO seed layer on glass substrates. ................................................... 60
Figure 4.14: Variation reduction ratio (ἠ) versus different concentrations of Zinc acetate
used for preparing the ZnO seed layer on glass substartes. ..................................... 61
Figure 4.15: SEM microgarphs of ZnO NR's grown hydrothermally on optical fibers for
(a) 5 h , (b) 8 h, (c) 10 h, (d) 15 h, and (e) 20 h. ...................................................... 62
Figure 4.16: Variation in the (a) length and (b) Diameter of the nanorods as a function
of the growth time. ................................................................................................... 63
Figure 4.17: (a) Scattering cross section (Csc) and (b) Scattering coefficient (αs) versus
the length of the ZnO NR's. ..................................................................................... 64
Figure 4.18: Change in CE versus the lenght of the NR's. ............................................. 65
Figure 4.19: Rod density versus the lenght of the ZnO NR's. ........................................ 66
Figure 4.20: Decay of coupling efficiency (CE) along the fibers coated with ZnO NR's
grown hydrothermally for different growth times. .................................................. 67
Figure 5.1: (a) Schematic view of the propsed optical antenna configuration (b)
Schematic representation of scattering of light from the ZnO NR's through cladding
and core modes of MMF and (c) Simulated response with the finite excitation beam
effect. ....................................................................................................................... 73
Figure 5.2: Definition of the step function u ( Z- Z0) ..................................................... 75
Figure 5.3: Calculated reduction of the peak power with normalized beam width. ....... 81
Figure 5.4: Calculated normalized power angular spectrum of the total coupled light
inside the fiber at optimum growth condition. ......................................................... 82
Figure 5.5: Calculated change of the coupled power with incident angle. ..................... 83
Figure 5.6: Light scattering through fiber from cladding mode to the core mode at
different parts of the fiber; transition region has highst peak .The images taken at
the tip of the fibers are also shown in the figure.The captured images show high
confinement in the cladding and the core regions. The exponential decay of the
power is due to leakage of the core mode. ............................................................... 85
xiv
Figure 5.7: Measured power at the end of the fiber coated with ZnO NR's for different
etching times versus the canning distance when exiting the core modes. ............... 86
Figure 5.8: Maximum core power versus etching time................................................... 86
Figure 5.9: In house built nephelometer to measure the response of one fiber with ZnO
NR's attached to an optical detectore used as an optical reciever. ........................... 89
Figure 5.10: Measured normalized coupling power (to 90° incident) versus incident
angle. Dashed line shows the theoretically calculated coupling power. The inner
graph shows the polar plot of the normalized coupled power. ................................ 90
Figure 5.11: Wide FOV optcial receiver based on plastic optcial fiber. ......................... 91
Figure 5.12: Optical set up for POF wide FOV optical receiver for eye diagram
measurement. ........................................................................................................... 93
Figure 5.13 :(a) Eye digaram garph for treated POF with thiol for different distance , (b)
Treated POF with Thiol and NaOH , (c) Treated POF with tween 80 , (d) Treated
POF with tween 80 and NaOH. ............................................................................... 94
Figure 5.14: Voltage peak to peak versus the distance (in cm) for POF treated with
different compunds. ................................................................................................. 95
Figure 5.15: Peak to peak voltage as a function of the angle for bare and tretaed POF. 96
Figure 5.16: Example of BER coding pattern tester. ...................................................... 97
Figure 5.17: BER set up to measure the quality of optical link when using coated POF
as an optical receiver............................................................................................... 99
Figure 5.18 : BER for different treated POF groups at 90 °angle. ................................ 100
Figure 5.19: BER for treated POF with NaOH and tween 80 at 40 and 50 cm distance
and high angles (50 ° to 90°). ............................................................................... 100

xv
LIST OF TABLES
Table 3.1: Results of POF treatment to have optimum growth of ZnO NR’s ................ 39
xvi
LIST OF SYMBOLS AND ABBREVIATIONS
0D Zero dimension
1D One dimension
2D Two dimension
3D Three dimension
ZnO NR’s Zinc oxide nanorods
UV Ultraviolet
ZAH Zinc acetate hydrate
NaOH Sodium Hydroxide
PVD Physical vapor deposition
CVD Chemical vapor deposition
Hexamin (HMT) Hexamethylenetetramine
SMF Single mode fiber
MMF Multimode mode fiber
POF Plastic fiber
PMMA Poly methyl methacrylate
CYTOP Cyclized transparent optical polymer cytop
LED Light emitting diode
GaAs Gallium arsenide
SEM Scanning electron microscopy
OWC Optical wireless communication

xvii
XRD x-ray diffraction spectroscopy
C2H6O Ethanol
Zn(NO3)2,6H2O Zinc nitrate hexahydrate
Thiol, C12H26S Dodecanethiol 908%
HF Hydrofluoric acid
Tween 80 Polyoxyethylene (20) sorbitan monooleate
OHˉ Hydroxyl
H Hour
µl Microliter
Ml Milliliter
min Minute
CCD Charge-coupled device
Eq Equation
CE Coupling efficiency
BER Bite error rate
DAC Digital to Analogue Converter
ADC Analog to digital converter
1
CHAPTER 1
INTRODUCTION
1.1 Motivation
Nanotechnology is one of the most growing technologies due to its’ potential
applications in different fields such as electronics, mechanical device, optical and
magnetic component, biotechnology and tissue engineering (Sohaebuddin et al., 2010;
Hayat et al., 2014). Nanomaterial size are reduced into the nanoscale, while their surface
area, surface roughness and surface area to volume ratios increased (Zhang and,
Webster, 2009; Pajnič et al., 2015; Li et al., 2009).This technology involves the
development of nanostructured materials, which basically can be classified into four
types based on the number of dimensions; zero-dimensional (0-D), one-dimensional (1-
D), two-dimensional (2-D), and three-dimensional (3-D). 0-D nanomaterials are defined
as materials wherein all the dimensions are measured within the nanoscale. The most
common representations of zero-dimensional nanomaterial are nanoparticles, which
include gold, silver and quantum-dot metallic nanoparticles (Cao, 2004). 1-D
nanomaterials have needle like-shaped where one dimension is outside the nanoscale.
Carbon nanotube (Meagan et al., 2008), nanowire and ZnO nanorods (ZnO NR’s) are
examples of the one dimension nanomaterial’s (Dingand, Wang,2009). 2-D
nanomaterials have two of the dimensions that are not confined to the nanoscale.
Therefore they exhibit plate-like shape. Nanofilms, nanolayers, and nanocoatings are
examples of 2-D nanomaterials (Hang et al., 2010; Rao et al., 2009).3-D nanomaterials
are materials that are not confined to the nano scale in any dimension. These materials
2
are referred to dispersions of nanoparticles, bundles of nanowires, and nanotubes as well
as multi nanolayers (Schodek et al., 2009; Liu et al., 2013).
One dimension (1D) nanostructures are primary material for electronic and
photonic devices due to their small size and improve change carrier mobility (He et al.,
2007;Weintraub et al. , 2010). ZnO is one of the most important nanomaterials that have
been widely studied in recent years. Due to the lack of center of symmetry in wurtzite
structure of ZnO, this material has strong piezoelectric and pyroelectric properties when
a stress force is applied (Gandh et al., 2010; Mazingue et al., 2005; Baruah et al., 2008).
Furthermore, ZnO is an important semiconductor with a large direct band gap of 3.37
eV, high electron mobility of 200 cm2 V -1 S-1, and high excitation binding energy of 60
meV. Therefore, ZnO nanostructures have many applications in optoelectronic, sensors,
transducer, catalysts, optical coating, and electrical devices (Chen et al., 2012; Wang,
2007). An efficient excitation emission at room temperature is due to high binding
energy (60 meV) in ZnO crystal while wide band energy makes this material suitable for
short wavelength optoelectronic devices (Özgür et al., 2005; Baruah & Dutta, 2009).
Many studied have been reported about different morphology’s of ZnO
nanostructure such as, nanowire, nanorods, nanocomb, nanorings, nanobows, nanobelts,
nanohelics, and nanocage (Schmidt-Mende and, MacManus-Driscoll, 2007 ;Hughes &
Wang, 2005; Zhuo et al., 2008; Yu et Al., 2008; Leschkies et al., 2007). ZnO
nanostructures attracted a lot of attention and play an important role in many recent
devices because of their wide range of properties (Desai and, Haque, 2007). Among
these nanostructures of ZnO, particularly nanorods and nanowires are widely used in
electronic and optical devices due to their high surface to volume ratio (Guo et al., 2002;
Wei et al., 2005) Growth of nanorods has been reported on different flat surfaces such
as glass (Umar et al., 2009), silicon (Choy et al. , 2003) and sapphire (Hong-Yuan et al.,
3
2007). There was however less attention given to curved surfaces; optical fiber and
waveguides (Zhou et al. ,2013).Utilizing the growth of ZnO NR’s on round optical fiber
is a new field of interest due to their optical quality and diversity of fabrication scheme
(Chen et al. , 2004 ;Thankappan et al. , 2013)
1.2 Background theory
Typical fiber structure comprises of a higher refractive index core surrounded by a
lower index cladding (Keiser, 2010). Thus, the existence of nanorod structures on the
fiber surface allows the light to scatter from the fiber as well as to couple inside the
guiding region. ZnO high refractive index (~2) and high surface to volume make it
proper material to enhance light coupling between the device and ambient environment
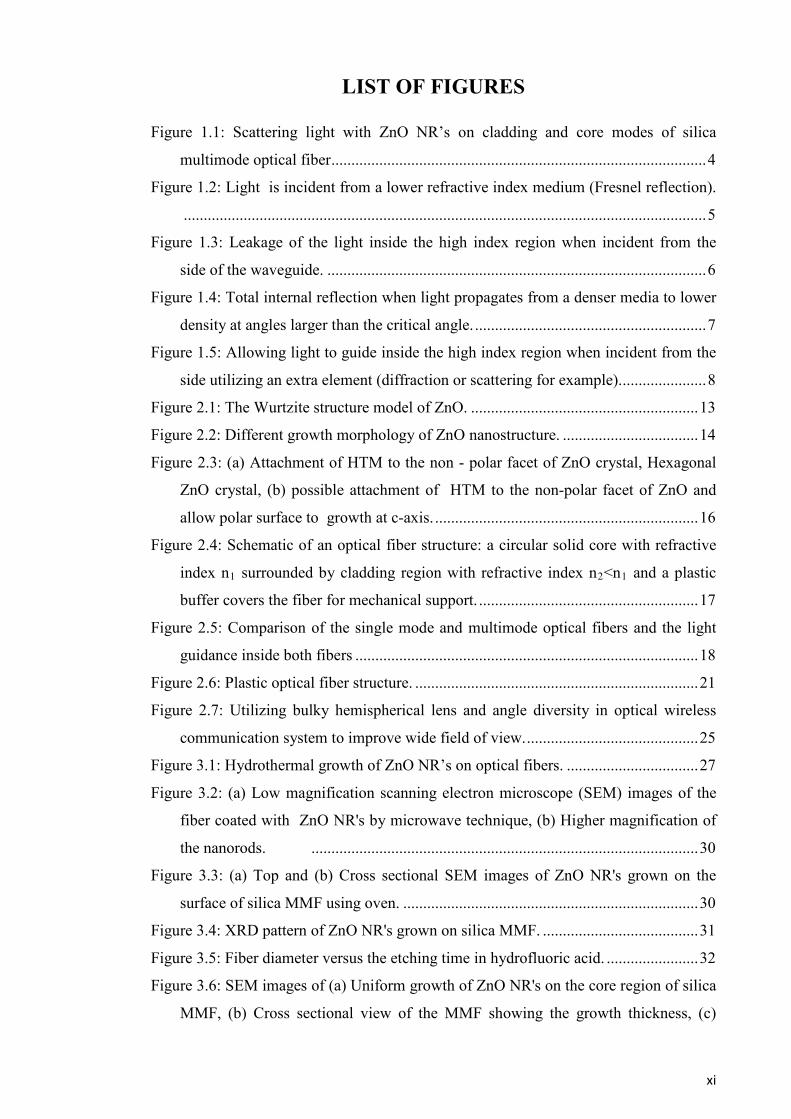
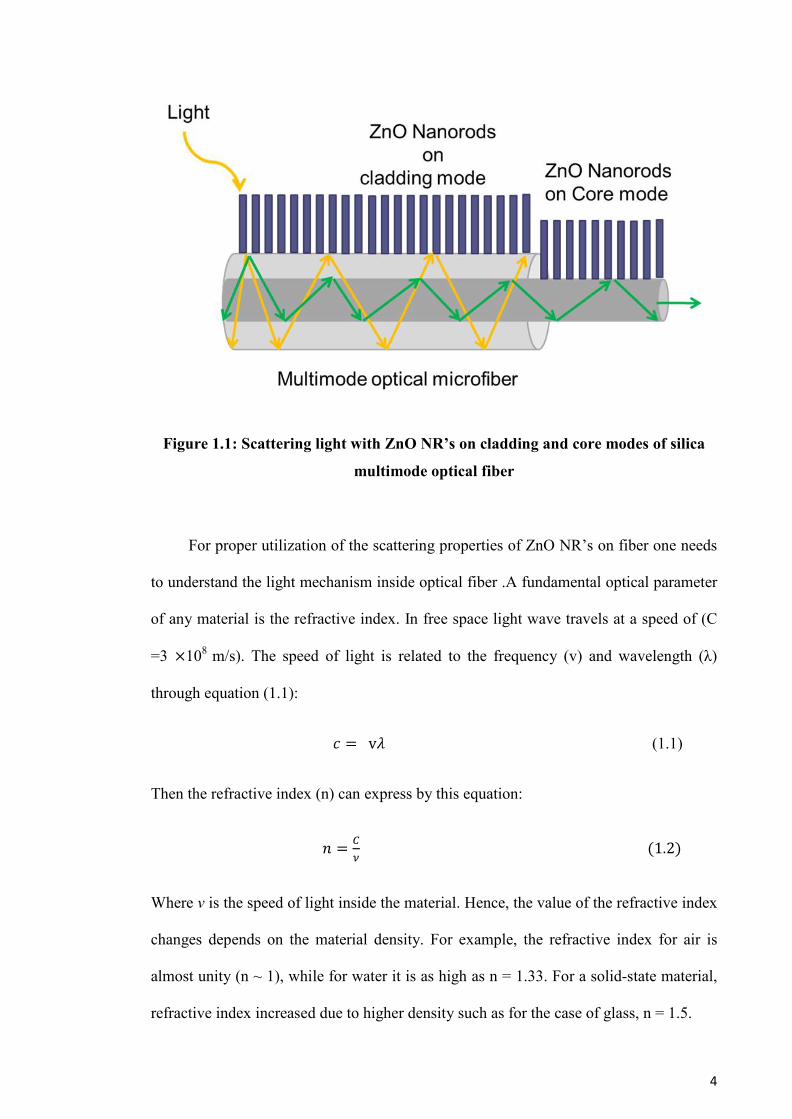
(Zhou et al., 2013).When growing ZnO on the cladding region, scattering by nanorods
excites cladding modes which are sensitive to the changes of the surrounding
environment. This effect is illustrated in Figure 1.1 below. This scattering of light by the
nanorods can be implemented using the current fiber optics technology for potential
applications in many areas such as optical communication, fiber laser and interferometry
(Goodman, 2005).
.
4
Figure 1.1: Scattering light with ZnO NR’s on cladding and core modes of silica
multimode optical fiber
For proper utilization of the scattering properties of ZnO NR’s on fiber one needs
to understand the light mechanism inside optical fiber .A fundamental optical parameter
of any material is the refractive index. In free space light wave travels at a speed of (C
=3 ×10⁸ m/s). The speed of light is related to the frequency (v) and wavelength (λ)
through equation (1.1):
𝑐 = ᴠ𝜆 (1.1)
Then the refractive index (n) can express by this equation:
𝑛 = 𝐶𝜈
(1.2)
Where ν is the speed of light inside the material. Hence, the value of the refractive index
changes depends on the material density. For example, the refractive index for air is
almost unity (n ~ 1), while for water it is as high as n = 1.33. For a solid-state material,
refractive index increased due to higher density such as for the case of glass, n = 1.5.
5
The light propagation inside an optical fiber can be explained based on the
concept of reflection and refraction .The light transmitted is trapped inside the core of
the optical fiber due to the total internal reflection phenomenon. This total reflection can
happen when the light ray incident at the interface between the core and cladding
regions inside the optical fiber at angles larger than the critical angle. When a plane
wave of light propagates through an interface between two dielectric media, it refracts
according to the following Snell’s law:
𝑛1 sin𝜃1 = 𝑛2 sin𝜃2 (1.3)
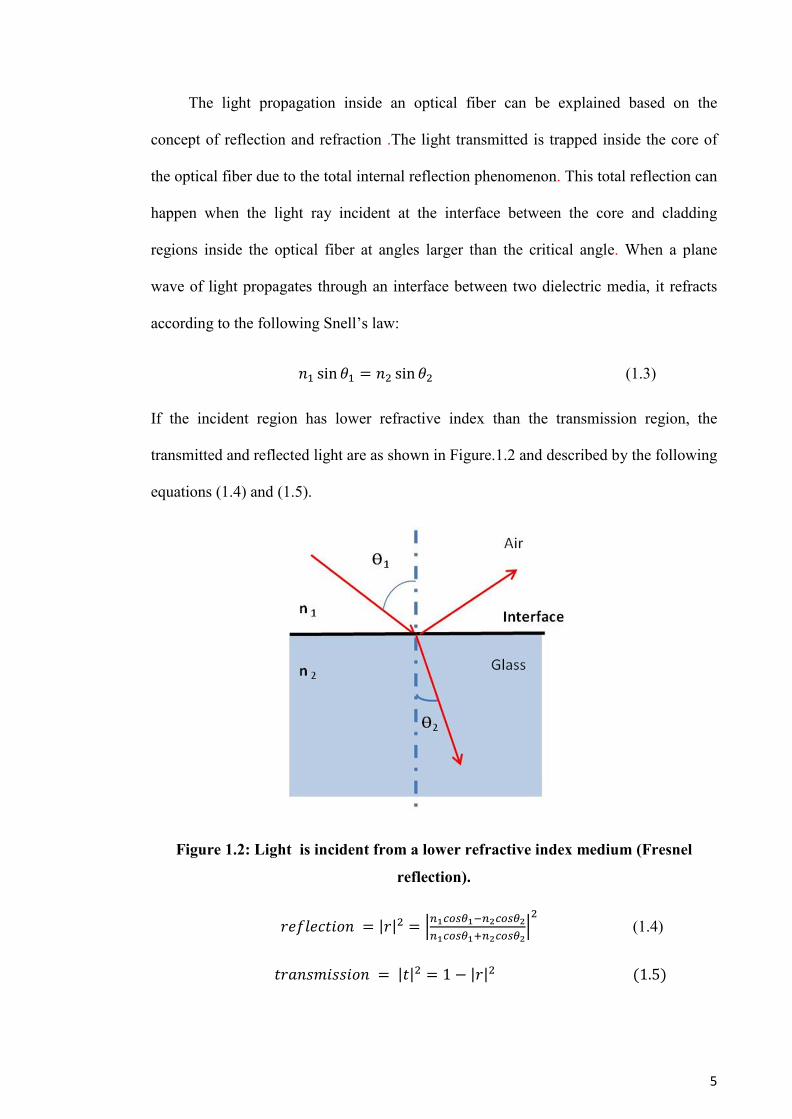
If the incident region has lower refractive index than the transmission region, the
transmitted and reflected light are as shown in Figure.1.2 and described by the following
equations (1.4) and (1.5).
Figure 1.2: Light is incident from a lower refractive index medium (Fresnel
reflection).
𝑟𝑒𝑓𝑙𝑒𝑐𝑡𝑖𝑜𝑛 = |𝑟|2 = �𝑛1𝑐𝑜𝑠𝜃1−𝑛2𝑐𝑜𝑠𝜃2𝑛1𝑐𝑜𝑠𝜃1+𝑛2𝑐𝑜𝑠𝜃2
�2
(1.4)
𝑡𝑟𝑎𝑛𝑠𝑚𝑖𝑠𝑠𝑖𝑜𝑛 = |𝑡|2 = 1 − |𝑟|2 (1.5)
6
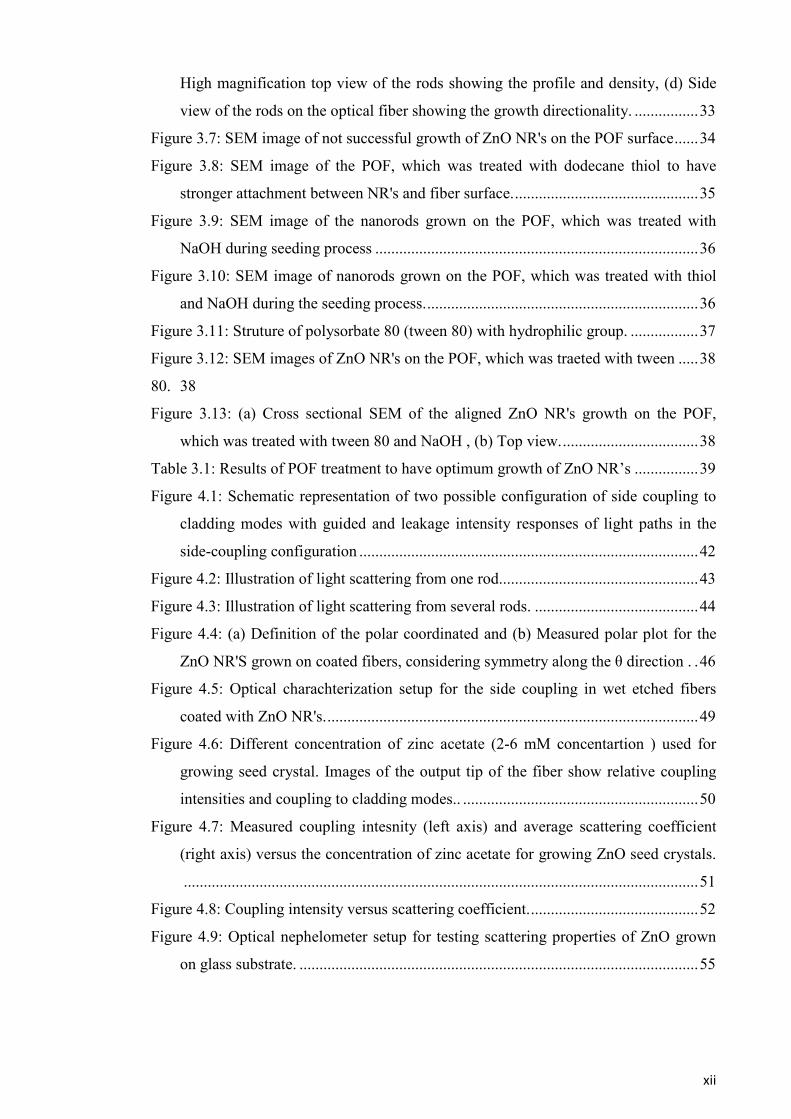
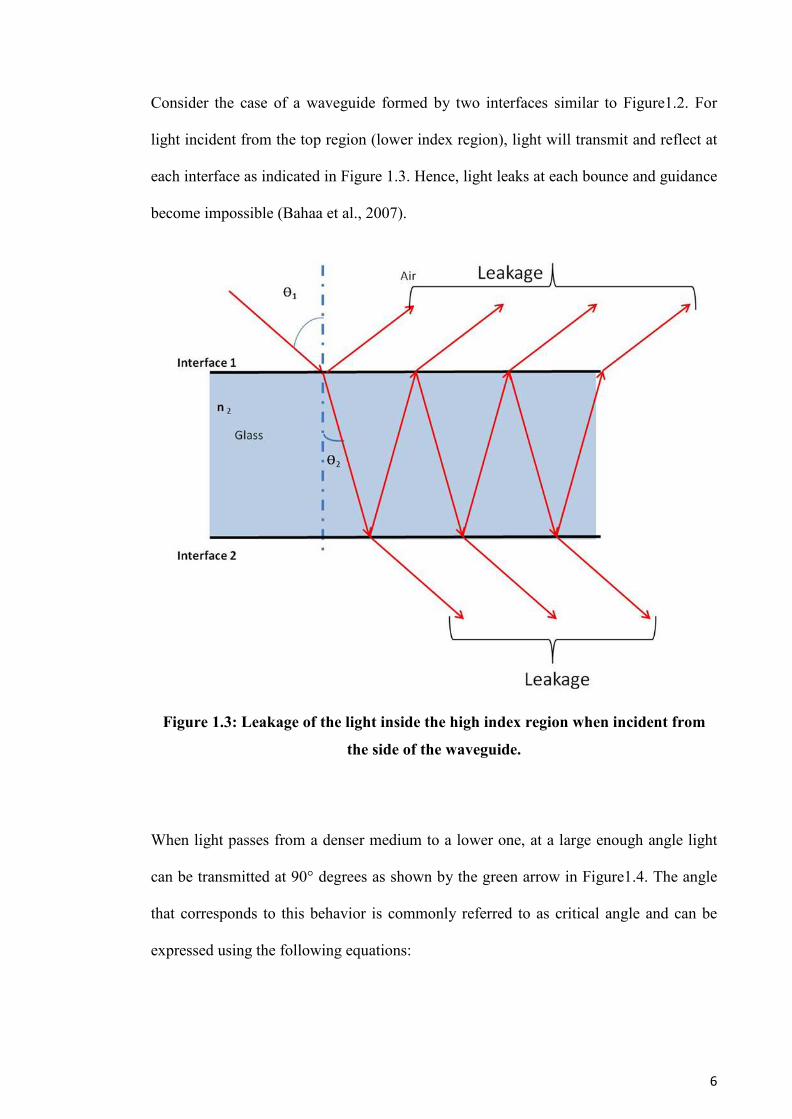
Consider the case of a waveguide formed by two interfaces similar to Figure1.2. For
light incident from the top region (lower index region), light will transmit and reflect at
each interface as indicated in Figure 1.3. Hence, light leaks at each bounce and guidance
become impossible (Bahaa et al., 2007).
Figure 1.3: Leakage of the light inside the high index region when incident from
the side of the waveguide.
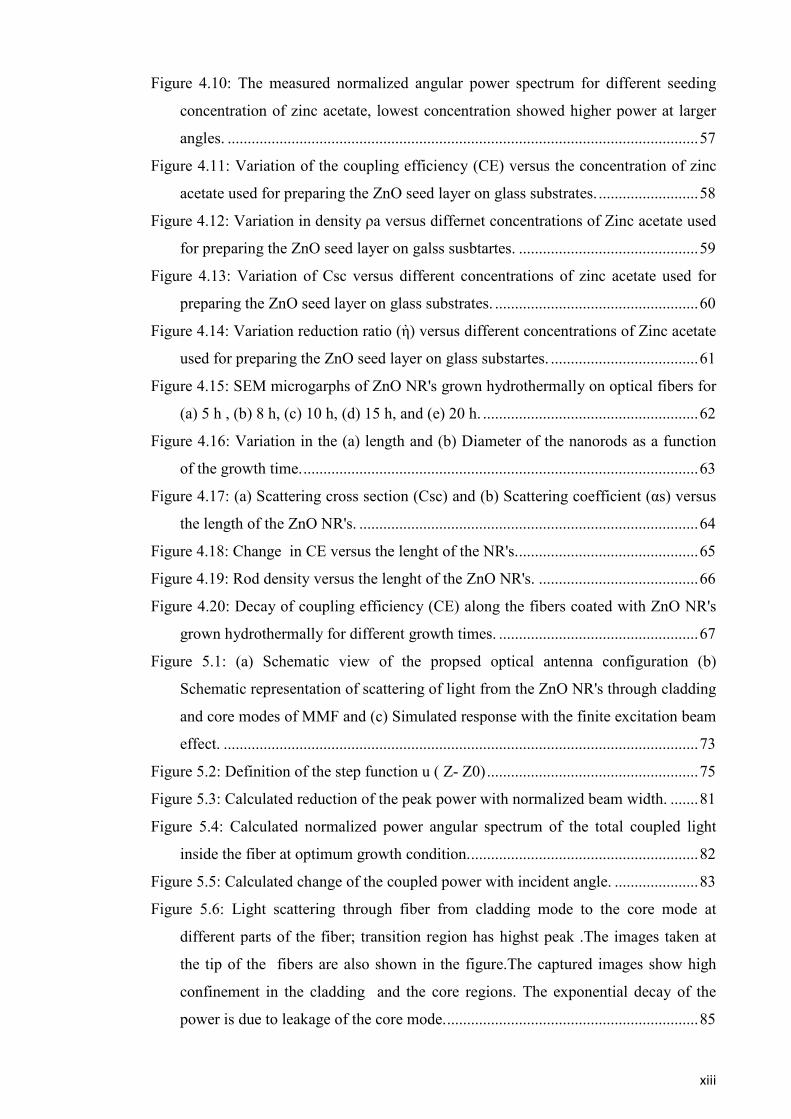
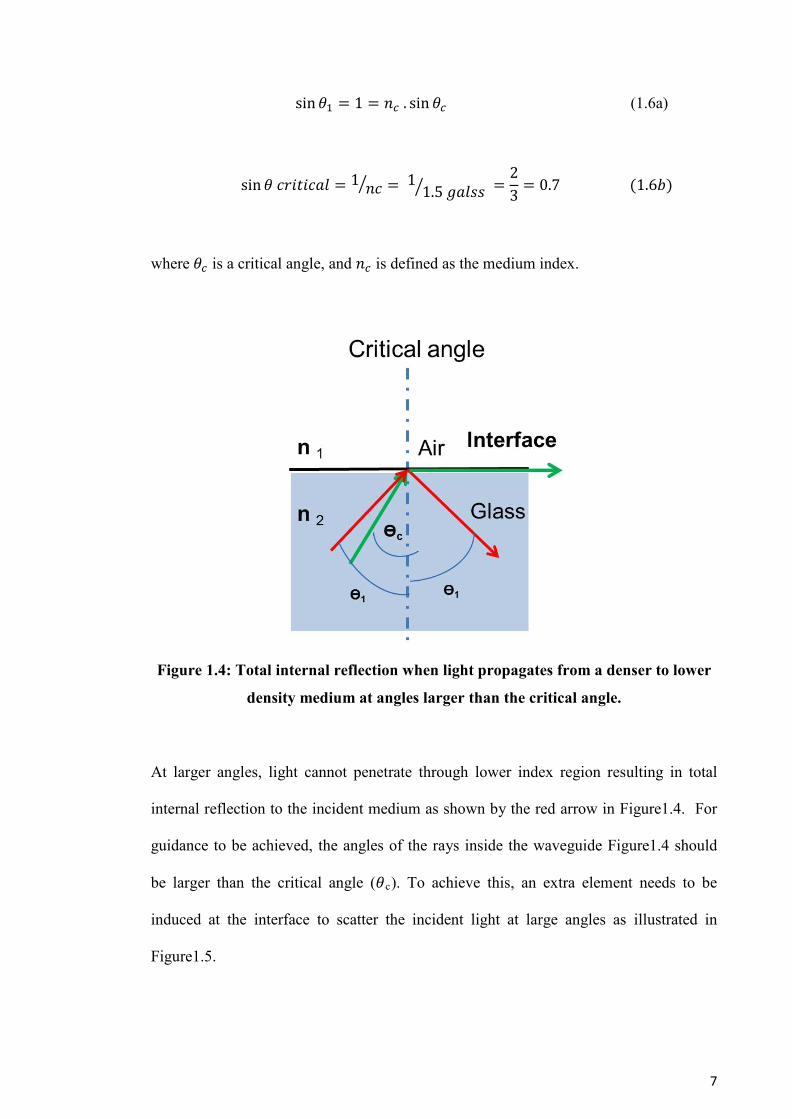
When light passes from a denser medium to a lower one, at a large enough angle light
can be transmitted at 90° degrees as shown by the green arrow in Figure1.4. The angle
that corresponds to this behavior is commonly referred to as critical angle and can be
expressed using the following equations:
7
sin𝜃1 = 1 = 𝑛𝑐 . sin 𝜃𝑐 (1.6a)
sin𝜃 𝑐𝑟𝑖𝑡𝑖𝑐𝑎𝑙 = 1 𝑛𝑐� = 11.5 𝑔𝑎𝑙𝑠𝑠 � =
23
= 0.7 (1.6𝑏)
where 𝜃𝑐 is a critical angle, and 𝑛𝑐 is defined as the medium index.
Figure 1.4: Total internal reflection when light propagates from a denser to lower
density medium at angles larger than the critical angle.
At larger angles, light cannot penetrate through lower index region resulting in total
internal reflection to the incident medium as shown by the red arrow in Figure1.4. For
guidance to be achieved, the angles of the rays inside the waveguide Figure1.4 should
be larger than the critical angle (𝜃Rc). To achieve this, an extra element needs to be
induced at the interface to scatter the incident light at large angles as illustrated in
Figure1.5.
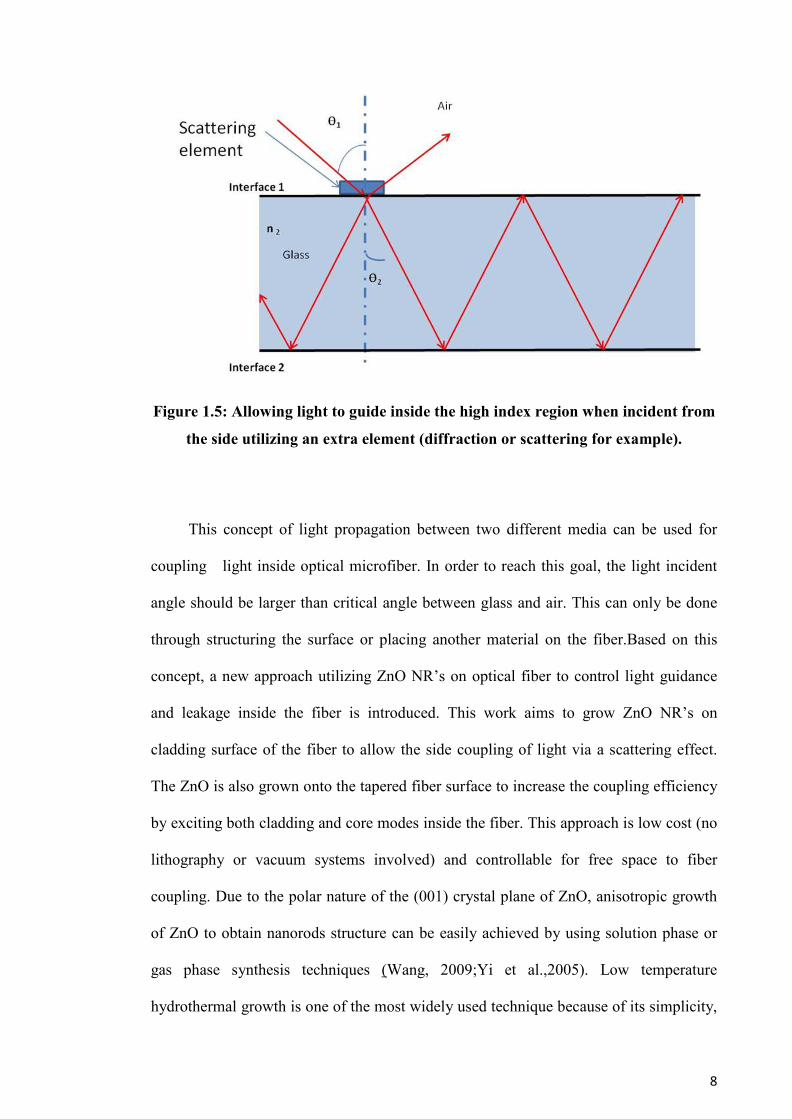
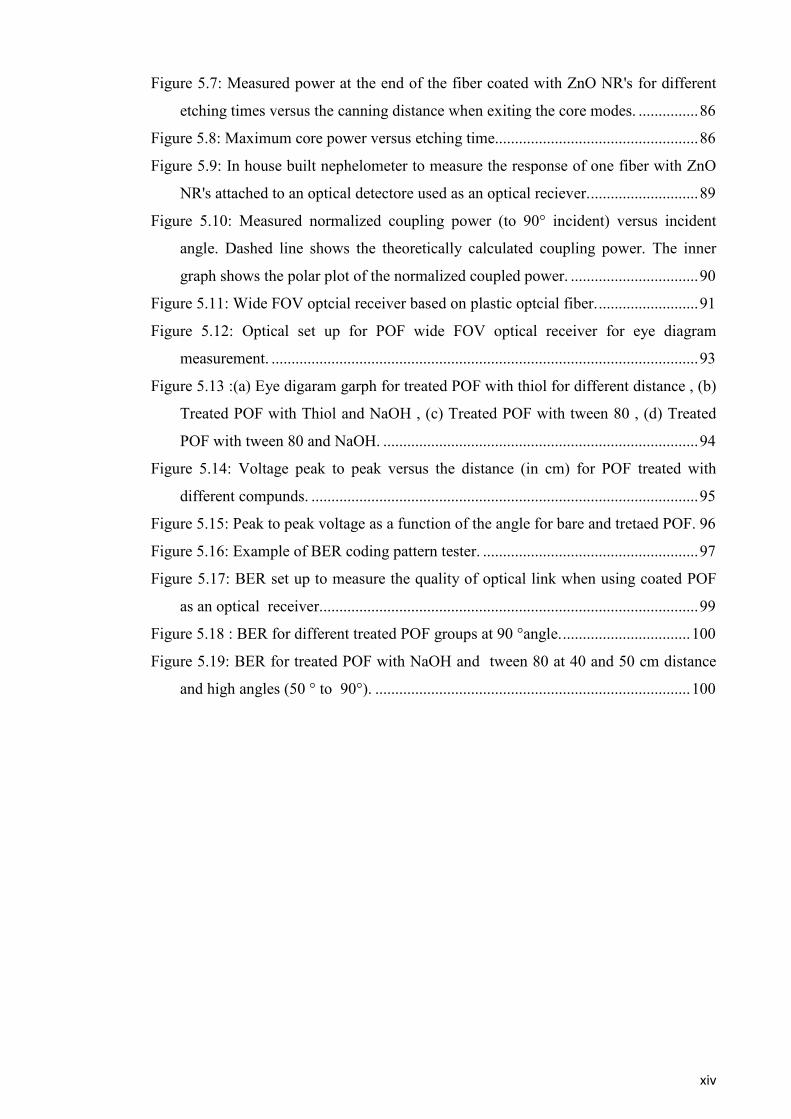
8
Figure 1.5: Allowing light to guide inside the high index region when incident from
the side utilizing an extra element (diffraction or scattering for example).
This concept of light propagation between two different media can be used for
coupling light inside optical microfiber. In order to reach this goal, the light incident
angle should be larger than critical angle between glass and air. This can only be done
through structuring the surface or placing another material on the fiber.Based on this
concept, a new approach utilizing ZnO NR’s on optical fiber to control light guidance
and leakage inside the fiber is introduced. This work aims to grow ZnO NR’s on
cladding surface of the fiber to allow the side coupling of light via a scattering effect.
The ZnO is also grown onto the tapered fiber surface to increase the coupling efficiency
by exciting both cladding and core modes inside the fiber. This approach is low cost (no
lithography or vacuum systems involved) and controllable for free space to fiber
coupling. Due to the polar nature of the (001) crystal plane of ZnO, anisotropic growth
of ZnO to obtain nanorods structure can be easily achieved by using solution phase or
gas phase synthesis techniques (Wang, 2009;Yi et al.,2005). Low temperature
hydrothermal growth is one of the most widely used technique because of its simplicity,

9
low cost and potential to produce highly ordered arrays of ZnO NR’s in large scales
(Baruah, & Dutta, 2009). The alignment and uniformity of ZnO NR’s have a strong
effect on the scattering properties of the structure. During the growth of ZnO NR’s,
chemical concentration and time for growth are two important main factors which can
effect on length and alignment of ZnO NR’s. Hence, these two factors are investigated
during the growth process.
10
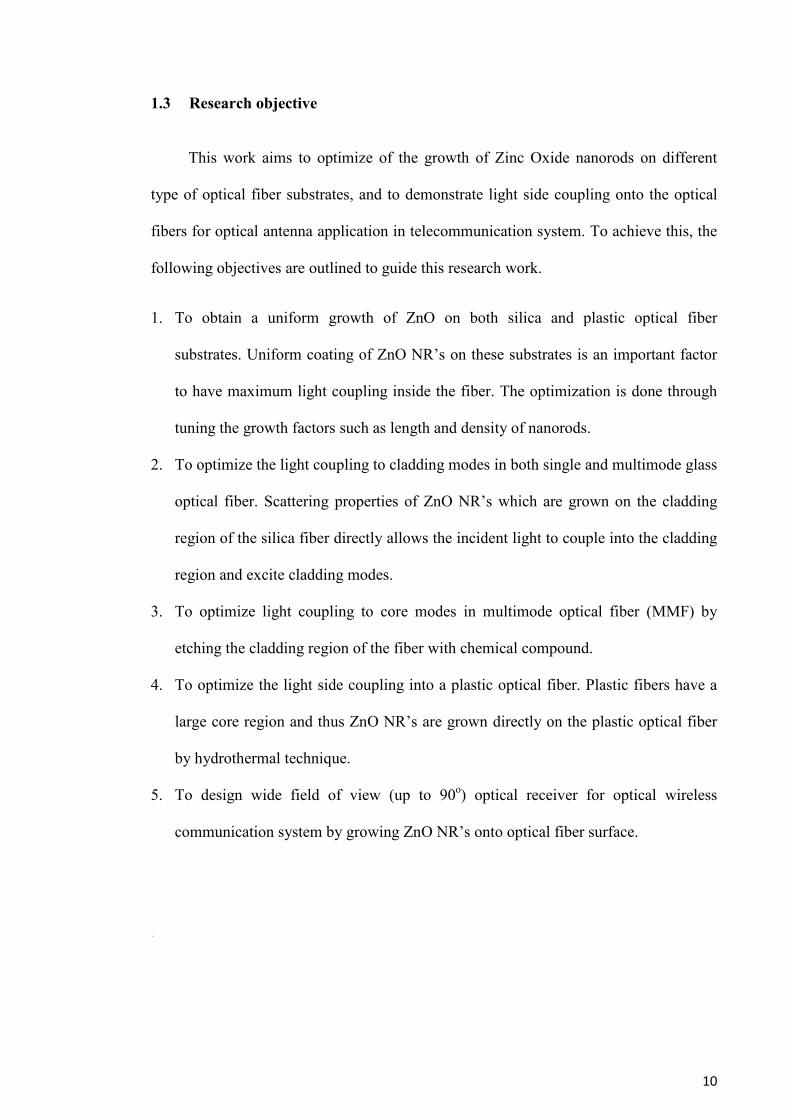
1.3 Research objective
This work aims to optimize of the growth of Zinc Oxide nanorods on different
type of optical fiber substrates, and to demonstrate light side coupling onto the optical
fibers for optical antenna application in telecommunication system. To achieve this, the
following objectives are outlined to guide this research work.
1. To obtain a uniform growth of ZnO on both silica and plastic optical fiber
substrates. Uniform coating of ZnO NR’s on these substrates is an important factor
to have maximum light coupling inside the fiber. The optimization is done through
tuning the growth factors such as length and density of nanorods.
2. To optimize the light coupling to cladding modes in both single and multimode glass
optical fiber. Scattering properties of ZnO NR’s which are grown on the cladding
region of the silica fiber directly allows the incident light to couple into the cladding
region and excite cladding modes.
3. To optimize light coupling to core modes in multimode optical fiber (MMF) by
etching the cladding region of the fiber with chemical compound.
4. To optimize the light side coupling into a plastic optical fiber. Plastic fibers have a
large core region and thus ZnO NR’s are grown directly on the plastic optical fiber
by hydrothermal technique.
5. To design wide field of view (up to 90o) optical receiver for optical wireless
communication system by growing ZnO NR’s onto optical fiber surface.
.
11
1.4 Organization of dissertation
This thesis comprises of six main chapters where the first and last chapters are
dedicated to introduction and conclusion, respectively. The first chapter explains the
motivation, objective and outline of this thesis. The introductions of Zinc Oxide
nanomaterial and background theory of the side coupling are also discussed in this
chapter towards application in optical telecommunication. The second chapter reviews
on the literatures regarding the growth of ZnO NR’s, optical fibers and previous works
on ZnO nanostructures applications and wide field of view (FOV) antenna. The growth
of ZnO NR’s on the optical fiber and its controlling parameters to achieve well
alignment of nanorods are presented and discussed in Chapter three. The forth chapter
discusses ZnO NR’s scattering properties on the optical fibers. An analytical model is
developed to demonstrate the effect of the nano-rods parameters on the scattering
pattern as well as the coupling efficiency. In chapter five, the side coupling of light into
the core mode of optical fiber by etching the cladding region of optical fiber and its
application in wide field of view optical reception is explained. The findings of this
work are concluded in Chapter 6. Some suggestions for future works are also given in
this final chapter.
12
CHAPTER 2
LITERATURE REVIEW
2.1 ZnO NR’s growth
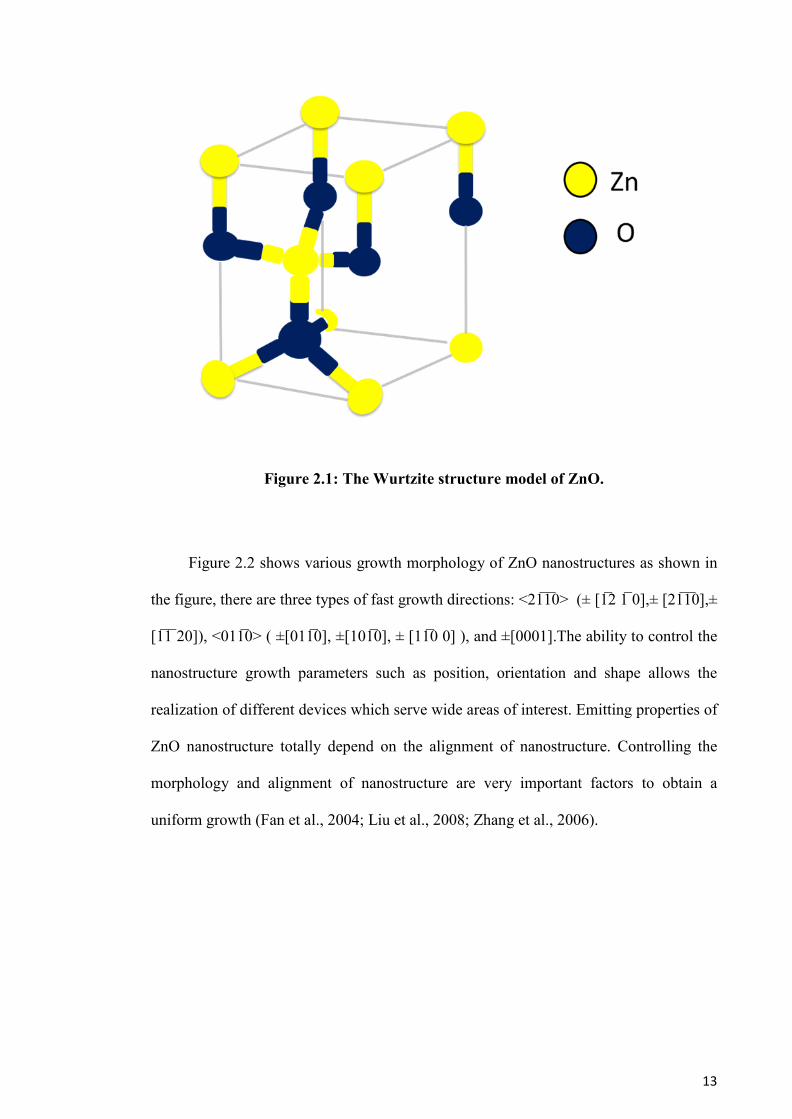
ZnO has a Wrutize structure with no center that makes it a strong piezoelectric
and pyroelectric property (Yang et al., 2002). The structure of ZnO Crystal is a
hexagonal structure with lattice parameter a=0.3226, c = 0.52065 nm as shown in Figure
2.1.This structure has alternating planes implicated of tetrahedral coordinated Zn+2 and
O-2 ions attached along c- axis , where the ends are terminated with either polar or non-
polar surfaces ( Baruah & Dutta, 2009; Gandhi et al., 2010). The most common polar
surface is (0001). In ZnO crystal the highest growth is along c- axis (Gandhi et al.,
2010), which results in anisotropic structures. Many polar surfaces show large surface
reconstruction, when ZnO surface is stable, flat and does not suffer of reconstruction
(Yanget al., 2002). Other non-polar surface are {011-0} and {21-1-0} which have low
energy in compare to ±(0001) surfaces, as result the dipole moment will disappear and
the piezoelectricity properties is reduced. Hence, the most favorable morphology to
increase the piezoelectricity effect is to fabricate nanostructure that keep large area of
±(0001) polar surface( Wu & Xue,2010).
13
Figure 2.1: The Wurtzite structure model of ZnO.
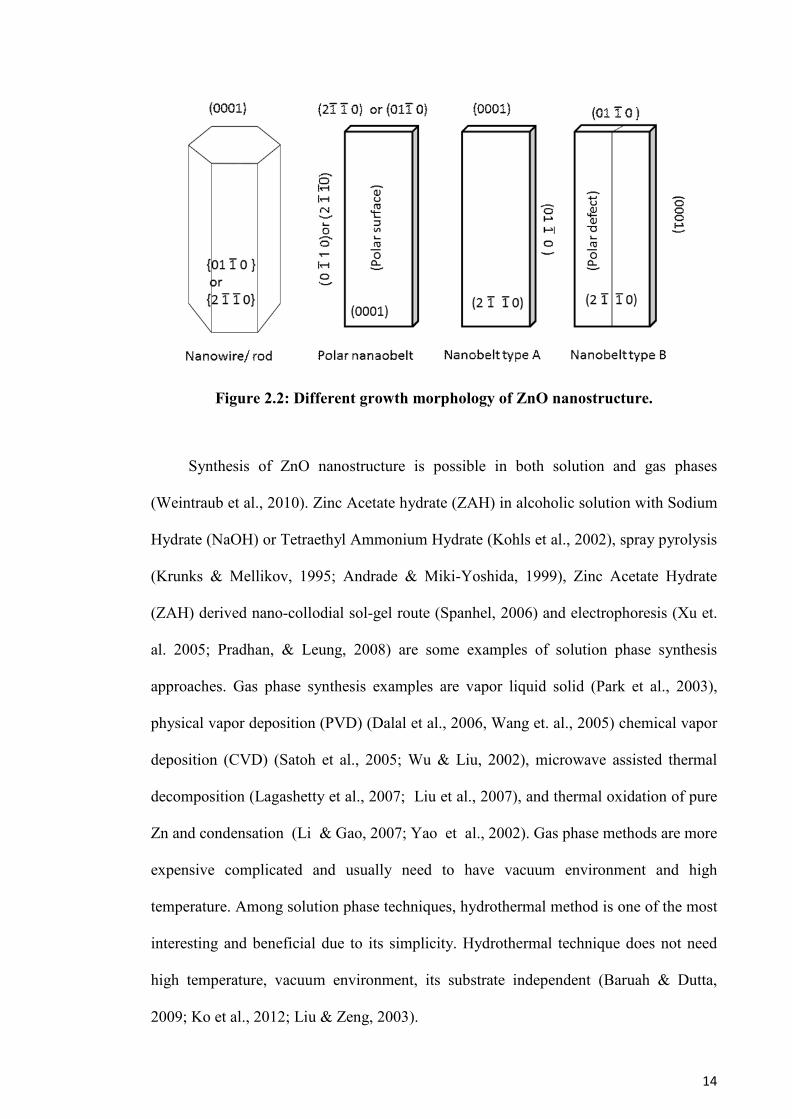
Figure 2.2 shows various growth morphology of ZnO nanostructures as shown in
the figure, there are three types of fast growth directions: <21̅1̅0> (± [1̅2 1̅ 0],± [21̅1̅0],±
[1̅1̅ 20]), <011̅0> ( ±[0110̅], ±[101̅0], ± [11̅0 0] ), and ±[0001].The ability to control the
nanostructure growth parameters such as position, orientation and shape allows the
realization of different devices which serve wide areas of interest. Emitting properties of
ZnO nanostructure totally depend on the alignment of nanostructure. Controlling the
morphology and alignment of nanostructure are very important factors to obtain a
uniform growth (Fan et al., 2004; Liu et al., 2008; Zhang et al., 2006).
14
Figure 2.2: Different growth morphology of ZnO nanostructure.
Synthesis of ZnO nanostructure is possible in both solution and gas phases
(Weintraub et al., 2010). Zinc Acetate hydrate (ZAH) in alcoholic solution with Sodium
Hydrate (NaOH) or Tetraethyl Ammonium Hydrate (Kohls et al., 2002), spray pyrolysis
(Krunks & Mellikov, 1995; Andrade & Miki-Yoshida, 1999), Zinc Acetate Hydrate
(ZAH) derived nano-collodial sol-gel route (Spanhel, 2006) and electrophoresis (Xu et.
al. 2005; Pradhan, & Leung, 2008) are some examples of solution phase synthesis
approaches. Gas phase synthesis examples are vapor liquid solid (Park et al., 2003),
physical vapor deposition (PVD) (Dalal et al., 2006, Wang et. al., 2005) chemical vapor
deposition (CVD) (Satoh et al., 2005; Wu & Liu, 2002), microwave assisted thermal
decomposition (Lagashetty et al., 2007; Liu et al., 2007), and thermal oxidation of pure
Zn and condensation (Li & Gao, 2007; Yao et al., 2002). Gas phase methods are more
expensive complicated and usually need to have vacuum environment and high
temperature. Among solution phase techniques, hydrothermal method is one of the most
interesting and beneficial due to its simplicity. Hydrothermal technique does not need
high temperature, vacuum environment, its substrate independent (Baruah & Dutta,
2009; Ko et al., 2012; Liu & Zeng, 2003).
15
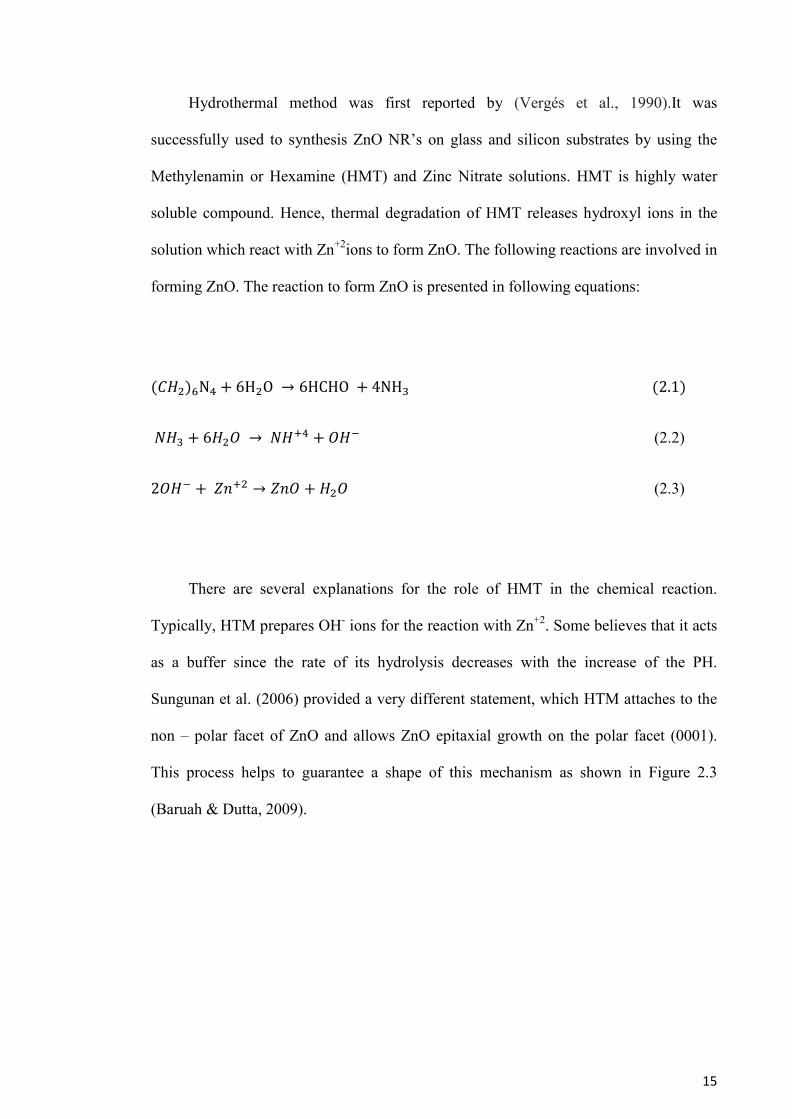
Hydrothermal method was first reported by (Vergés et al., 1990).It was
successfully used to synthesis ZnO NR’s on glass and silicon substrates by using the
Methylenamin or Hexamine (HMT) and Zinc Nitrate solutions. HMT is highly water
soluble compound. Hence, thermal degradation of HMT releases hydroxyl ions in the
solution which react with Zn+2ions to form ZnO. The following reactions are involved in
forming ZnO. The reaction to form ZnO is presented in following equations:
(𝐶𝐻2)6N4 + 6H2O → 6HCHO + 4NH3 (2.1)
𝑁𝐻3 + 6𝐻2𝑂 → 𝑁𝐻+4 + 𝑂𝐻− (2.2)
2𝑂𝐻− + 𝑍𝑛+2 → 𝑍𝑛𝑂 + 𝐻2𝑂 (2.3)
There are several explanations for the role of HMT in the chemical reaction.
Typically, HTM prepares OH- ions for the reaction with Zn+2. Some believes that it acts
as a buffer since the rate of its hydrolysis decreases with the increase of the PH.
Sungunan et al. (2006) provided a very different statement, which HTM attaches to the
non – polar facet of ZnO and allows ZnO epitaxial growth on the polar facet (0001).
This process helps to guarantee a shape of this mechanism as shown in Figure 2.3
(Baruah & Dutta, 2009).
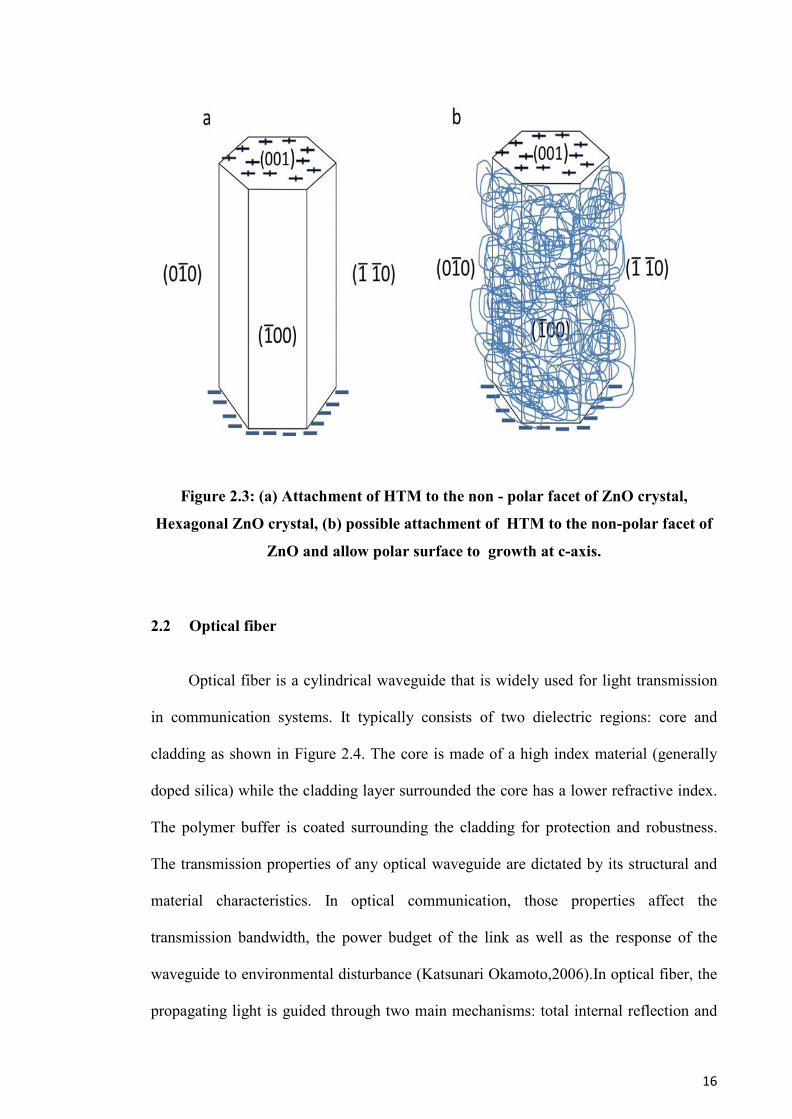
16
Figure 2.3: (a) Attachment of HTM to the non - polar facet of ZnO crystal,
Hexagonal ZnO crystal, (b) possible attachment of HTM to the non-polar facet of
ZnO and allow polar surface to growth at c-axis.
2.2 Optical fiber
Optical fiber is a cylindrical waveguide that is widely used for light transmission
in communication systems. It typically consists of two dielectric regions: core and
cladding as shown in Figure 2.4. The core is made of a high index material (generally
doped silica) while the cladding layer surrounded the core has a lower refractive index.
The polymer buffer is coated surrounding the cladding for protection and robustness.
The transmission properties of any optical waveguide are dictated by its structural and
material characteristics. In optical communication, those properties affect the
transmission bandwidth, the power budget of the link as well as the response of the
waveguide to environmental disturbance (Katsunari Okamoto,2006).In optical fiber, the
propagating light is guided through two main mechanisms: total internal reflection and
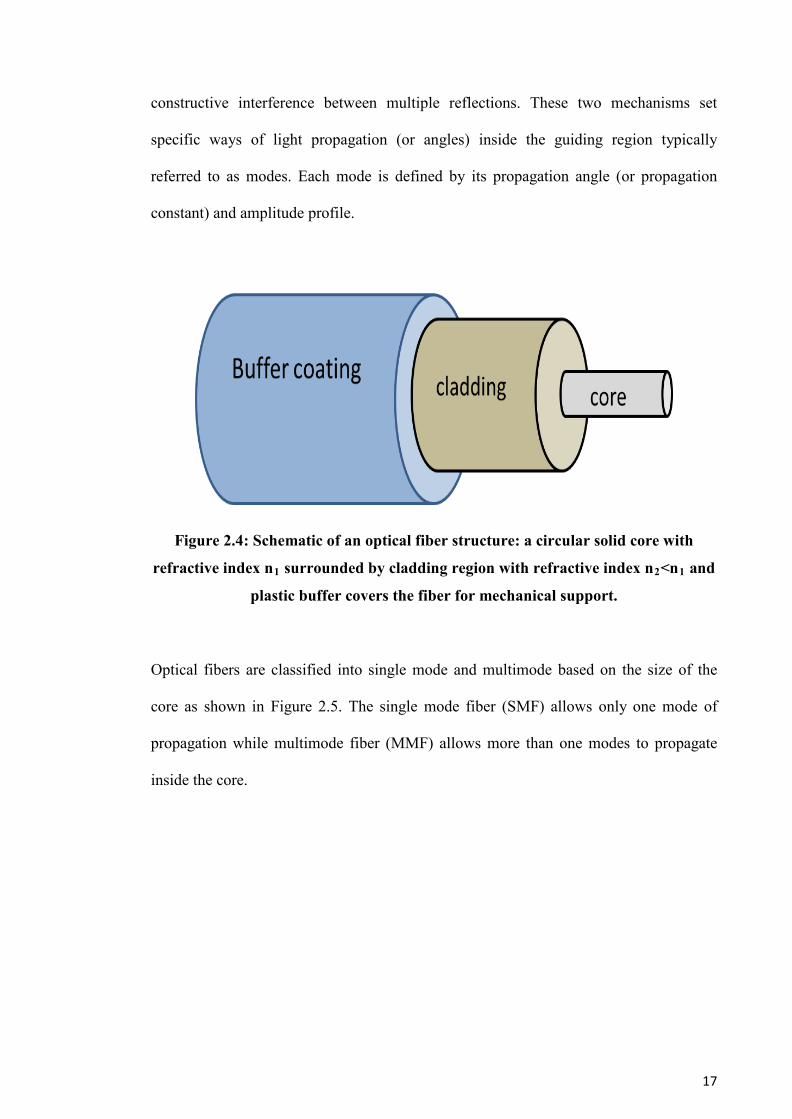
17
constructive interference between multiple reflections. These two mechanisms set
specific ways of light propagation (or angles) inside the guiding region typically
referred to as modes. Each mode is defined by its propagation angle (or propagation
constant) and amplitude profile.
Figure 2.4: Schematic of an optical fiber structure: a circular solid core with
refractive index n1 surrounded by cladding region with refractive index n2<n1 and
plastic buffer covers the fiber for mechanical support.
Optical fibers are classified into single mode and multimode based on the size of the
core as shown in Figure 2.5. The single mode fiber (SMF) allows only one mode of
propagation while multimode fiber (MMF) allows more than one modes to propagate
inside the core.
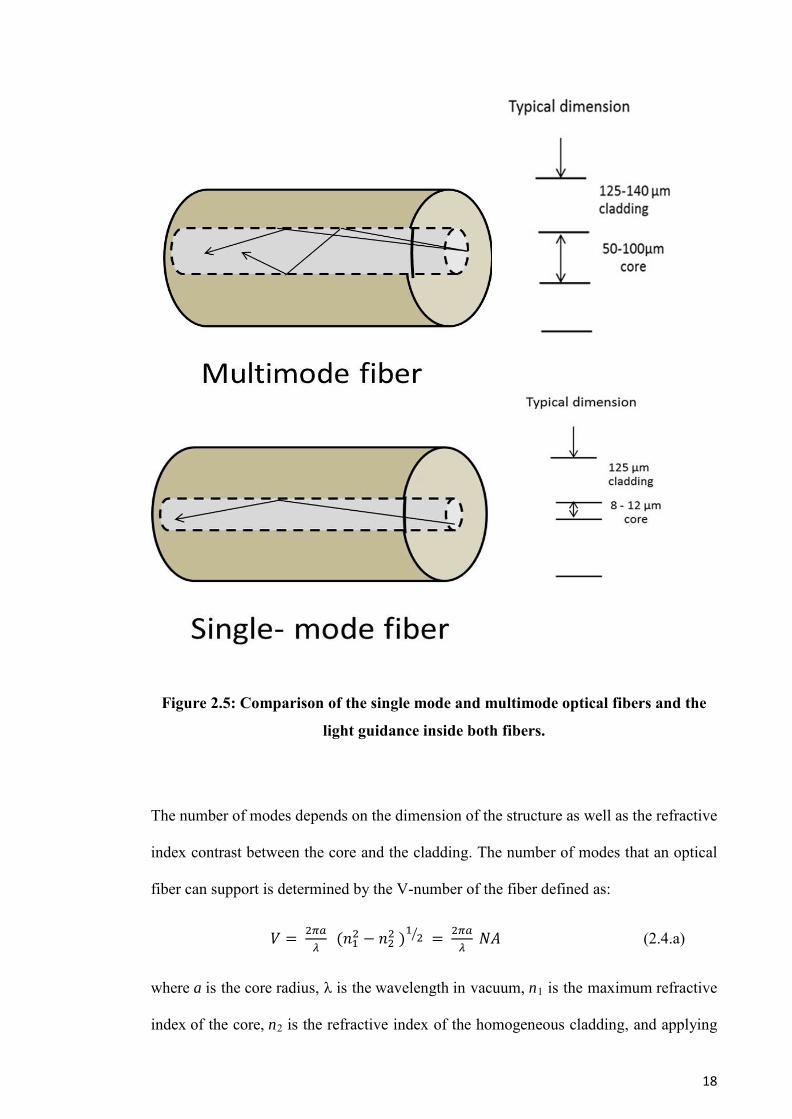
18
Figure 2.5: Comparison of the single mode and multimode optical fibers and the
light guidance inside both fibers.
The number of modes depends on the dimension of the structure as well as the refractive
index contrast between the core and the cladding. The number of modes that an optical
fiber can support is determined by the V-number of the fiber defined as:
𝑉 = 2𝜋𝑎𝜆
(𝑛12 − 𝑛22 )1 2� = 2𝜋𝑎𝜆
𝑁𝐴 (2.4.a)
where a is the core radius, λ is the wavelength in vacuum, n1 is the maximum refractive
index of the core, n2 is the refractive index of the homogeneous cladding, and applying
19
the usual definition of the numerical aperture NA. For a value less than 2.405, the fiber
supports only one mode. It is then called single mode fiber (SMF). Multimode optical
fiber (MMF) has higher value of V number. For a very large value of the V number, the
approximate total number of modes is (Keiser,2010):
M ≈ 12
(2𝜋𝑎𝜆
)2(𝑛12 − 𝑛22) = 𝑉2
2 (2.4.b)
Smaller core radius and lower index contrast reduce the number of modes and pushes
the fiber towards single mode case. MMF has a larger core radius, which makes it easier
to launch optical power into the fiber. The large mode profile of the MMF reduces light
intensity inside the fiber and hence allows high power transmission due to the reduction
of the material non-linearity. The larger core size also allows an easier coupling from
light emitting diode (LED) source. The coupling is usually difficult for SMF since the
core diameter is very small. However, most of the commercial laser diode sources are
typically pigtailed with SMF (Azadeh, 2009).
There are several applications for both SMF and MMF. SMF is widely used in
optical telecommunication, networking and sensing devices (Lim et al., 2012). Having a
single mode operation makes SMF as a suitable medium to form optical resonators,
where a phase matching condition is necessary. Resonators are very sensitive to the
surrounding changes, and hence they are very suitable for sensing applications (Wang et
al.,1994).Sustaining a single mode of propagation also minimizes fiber dispersion and
allows for long distance optical communication (Lim et al., 2012). SMF can also be
integrated with other optical technology to make new devices. However, this type of
device is more difficult to be manufactured as well as to properly work because of the
reduced allowable mechanical tolerance (Skoog et al., 2003). On the other hand, MMF
gives rise to modal dispersion. This restrains its application to short distance
communication (less than 500 m), which typically referred to as the last mile. However,
20
MMF are relatively easier to be fabricated as compared to SMF. Because of the larger
core diameter, it is easier to work especially for optical antenna application in this
present work.
2.2.1 Polymer optical fiber(POF)
Beside silica fibers, there is also polymer or plastic optical fiber (POF), which
was introduced in the past few decades. However, it was not received much attention in
communication and scientific applications because of its high attenuation. It was not
until 1990 when graded – index plastic fiber was developed and in 1996 low attenuation
perfluorinated fiber was achieved (Zubia, & Arrue, 2001). The first and the most
popular POF with poly methyl methacrylate (PMMA) core was developed at 1960,
which then became very well-known material with wide range of applications (Nihei et
al., 1997;Grattan & Sun, 2000). Recently POF is replacing progressively copper cables.
They are also used as complement for glass MMF in short–line communication link
(Zubia& Arrue, 2001). The POF are recognized for their large core diameter which
makes them easy to handle, highly flexible, resistant to vibration, low in cost and have
higher coupling light from light source to fiber (Zubia, & Arrue, 2001). Installation and
alignment of POFs are easier compared to glass MMF (Beres et. al., 2011). It can be
used at a wide wavelength range from 650-nm to 1300 nm (Golnabi, & Azimi,2008).
Figure 2.6 shows the schematic diagram of typical POF with PMMA core. As shown in
the figure, the POF has a core region covered by a plastic buffer which acts as a
cladding.
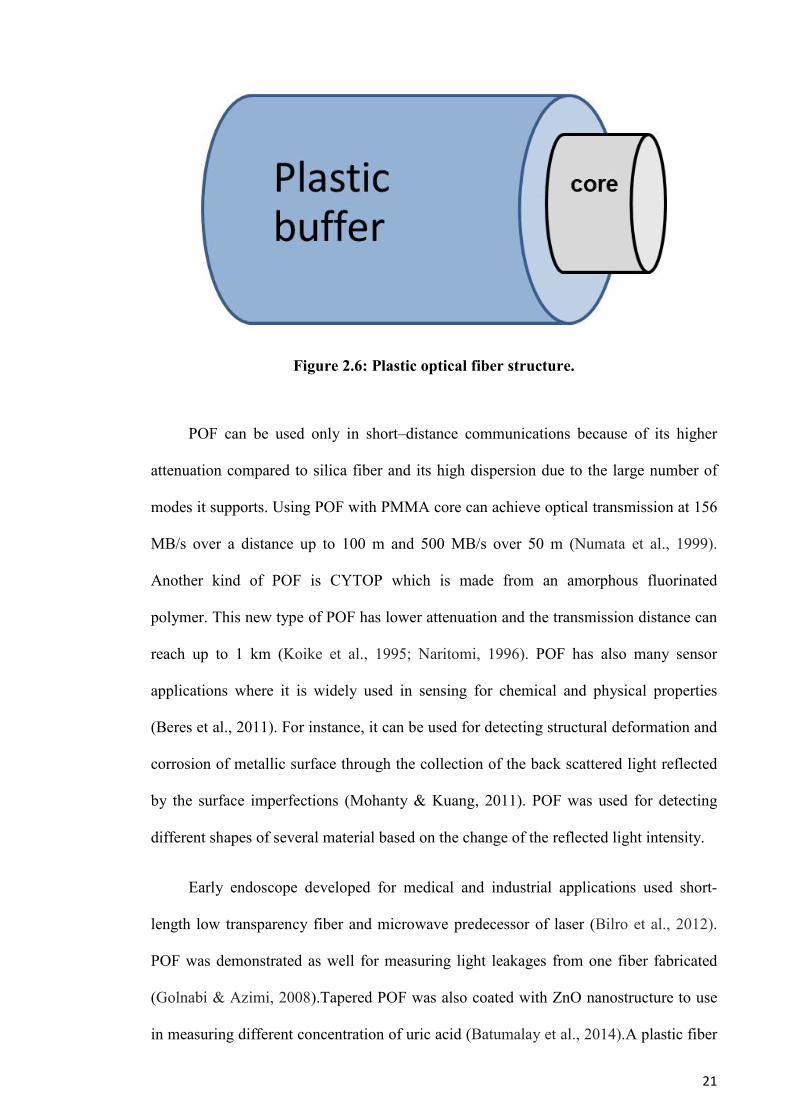
21
Figure 2.6: Plastic optical fiber structure.
POF can be used only in short–distance communications because of its higher
attenuation compared to silica fiber and its high dispersion due to the large number of
modes it supports. Using POF with PMMA core can achieve optical transmission at 156
MB/s over a distance up to 100 m and 500 MB/s over 50 m (Numata et al., 1999).
Another kind of POF is CYTOP which is made from an amorphous fluorinated
polymer. This new type of POF has lower attenuation and the transmission distance can
reach up to 1 km (Koike et al., 1995; Naritomi, 1996). POF has also many sensor
applications where it is widely used in sensing for chemical and physical properties
(Beres et al., 2011). For instance, it can be used for detecting structural deformation and
corrosion of metallic surface through the collection of the back scattered light reflected
by the surface imperfections (Mohanty & Kuang, 2011). POF was used for detecting
different shapes of several material based on the change of the reflected light intensity.
Early endoscope developed for medical and industrial applications used short-
length low transparency fiber and microwave predecessor of laser (Bilro et al., 2012).
POF was demonstrated as well for measuring light leakages from one fiber fabricated
(Golnabi & Azimi, 2008).Tapered POF was also coated with ZnO nanostructure to use
in measuring different concentration of uric acid (Batumalay et al., 2014).A plastic fiber
22
can also be used as aerosol chemical sensor where it is coated with a thin film of
tetraethylorthosilan (TEOS) by using sol-gel technique to increase its sensitivity. The
sensing mechanism depends on the change of the refractive index of the medium
surrounding the POF and the thin film coating (Kulkarni et. al., 2010).
2.3 Recent progress on the application of ZnO nanostructure
The rapid development of optoelectronic components and fibers industries has helped
the expansion of guided wave technology for sensing applications (Grassini et al.,
2015). For instance, tapered glass MMF is well known in applications for chemical
sensing such as gas detection sensor and spectroscopy (Beres et al 2011). This is due to
the large extension of the evanescent wave into the sensing region. Structuring the top
surface of the waveguide allows more light to leak to the sensing region and hence it
enhances the device sensitivity to the changes of the environment. ZnO nanostructure
especially nanorods are also good candidates for sensor applications due to their
attractive properties. Near cylindrical geometry and large refractive index (~2) allows
ZnO nanowires /nanorods to be used as optical waveguides by themselves (Zhiyong &
Jia, 2005). High sensitivity of ZnO to chemical environment due to its oxygen vacancies
on the surface that effect the electronics properties of ZnO gives a wide range of
applications in sensing devices as well. Also, it enhances the adsorption and
dissociation of small molecule such as methanol and water (Danwittayakul et al., 2014).
In literature, scattering of light due to ZnO NR’s grown on the side of optical fibers
have been used for humidity sensing (Liu et al., 2012). Photo current gas sensor made of
Ru-sensitized ZnO nanoparticles, has also been shown to be highly influenced by the
gas molecules adsorbed at the surface (Schidt-Mende & MacManus –Driscoll, 2007).
23
Bao et al, (2006) fabricated single nanowire light emitting diode which used Si as
substrate and ZnO nano-wires spread on the substrate and then PMMA thin film, which
was spin coated on the substrate. ZnO homojunction light emitting diode (LED) in the
crystal GaAs substrate by ultrasonic assisted spray pyrolysis is another examples of the
application of ZnO nanostructures(Schidt-Mende, & MacManus –Driscoll,2007 ; Du et
al ., 2006).
Mechanically polished D-shaped fiber was used to enhance the interaction
between the evanescent beam and the nanorods grown on flat surfaces for ammonia
detection (Dikovska et al., 2010). Combining the side polishing technique and long
period gratings, ethanol vapor sensor were fabricated utilizing ZnO NR’s grown on
optical fibers (Konstantaki et al., 2012). Presence of gas alters the modal properties and
hence the spectral resonances. Mechanical polishing was avoided by thinning the optical
fiber through thermal tapering prior to ZnO nanorod growth, which allowed for larger
evanescent tail in the ambient (Batumalay et al., 2014). Enhancing the interaction
between the fiber core and external medium to increase the sensitivity of LPG technique
for biosensor because of lower refractive index, small size of molecule and thickness of
cladding, cladding mode reduced by using side polished methods (Jang et al., 2009).
In all the systems explained above, light was launched from one end of the fiber
while signal was collected at the other end. And the efficiency of this process depend on
evanescent field coupling between the cladding mode and surrounding refractive index
(Chen et al.,2007In this work the main focus is to use ZnO nano-rods to scatter light,
which is launched from the side of the fiber inside the guiding region.
24
2.4 Recent progress on wide field of View (FOV) antenna for communication application
Achieving wide field of view optical communication system is challenging. In optical
wireless communication (OWC) system free space optical link is used to send
information to single or multiple detectors. The orientation of the detector should have
minimal effect on the quality of the received signal in ideal situation. There are some
studies to overcome this problem by utilizing bulk lens system such as fish eye lens
system (Deng, et al., 2012), and hemispherical based imaging receiver (Wang et al.,
2012).These systems are bulky and provide a field of view up to 120o, but still at large
angles the response degrades dramatically. In order to solve this issue angle diversity
design of detector was proposed and used (Carruther & Kahn, 2000; Jeong et al., 2001).
Although, using angle diversity FOV up to 180o can be achieved, this approach needs
precise arrangement of multiple small FOV detectors. Figure 2.7 shows the use of bulky
and the improved angle diversity designed in optical communication system to improve
wide FOV.
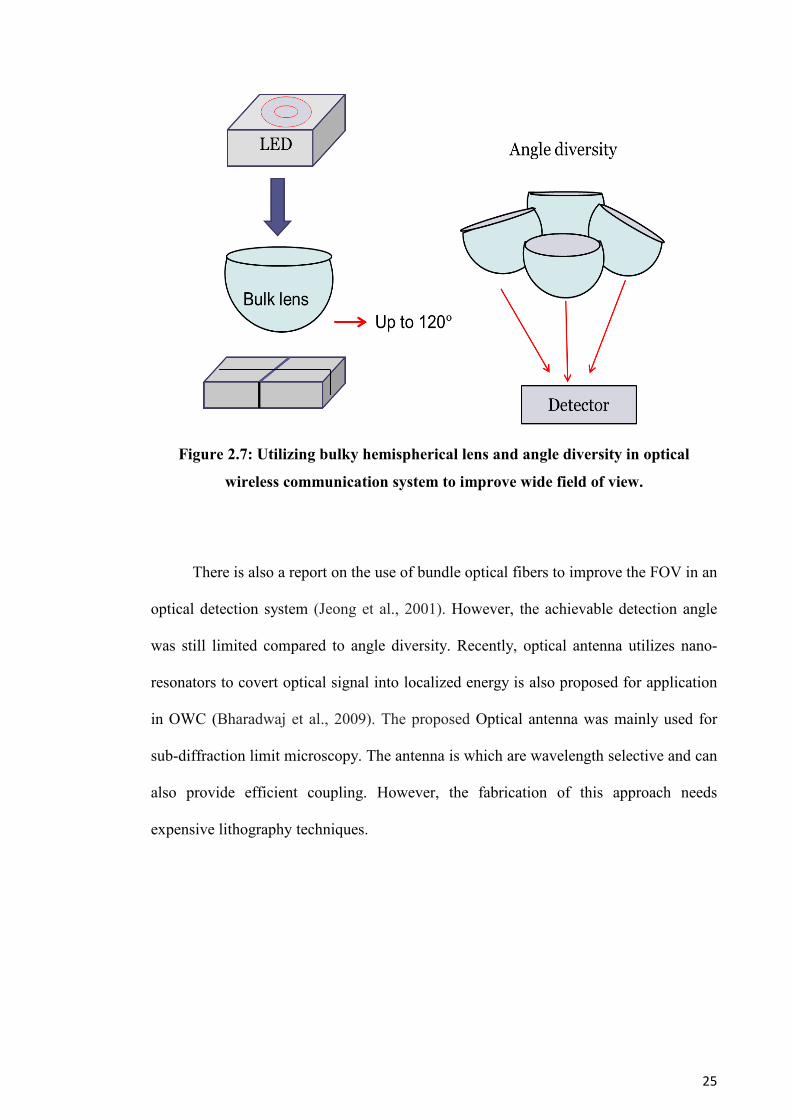
25
Figure 2.7: Utilizing bulky hemispherical lens and angle diversity in optical
wireless communication system to improve wide field of view.
There is also a report on the use of bundle optical fibers to improve the FOV in an
optical detection system (Jeong et al., 2001). However, the achievable detection angle
was still limited compared to angle diversity. Recently, optical antenna utilizes nano-
resonators to covert optical signal into localized energy is also proposed for application
in OWC (Bharadwaj et al., 2009). The proposed Optical antenna was mainly used for
sub-diffraction limit microscopy. The antenna is which are wavelength selective and can
also provide efficient coupling. However, the fabrication of this approach needs
expensive lithography techniques.
26
CHAPTER 3
GROWTH OF ZINC OXIDE NANORODS ON OPTICAL
FIBER
3.1 Introduction
Zinc oxide (ZnO) nanostructures such as nanowires and nanorods have been
recognized as extremely important materials in a broad range of high technology
applications (Chen et al., 2004; Thankappan et al., 2011; Tena-Zaera et al., 2008). For
instance, ZnO has a higher refractive index compared to silica fiber and, ZnO NR’s
directly grown on cladding of optical fibers allow light coupling into nanorod
waveguides (Voss et al., 2007). Nanorod arrays are also very favorable for sensing
applications as they have a larger surface to volume ratio. Utilizing ZnO grown on long
period gratings (Konstantaki et al., 2012) and side polished fibers (Dikovska et al.,
2007;. Dikovska et al., 2010) are common examples of its sensor applications. Optical
coupling between the optical fibers and nanorods grown on them are potentially
promising for various novel optical sensing applications such as humidity (Liu et al.,
2012).
Up to date, many works have been reported on growing nanorods structure on
different flat surfaces such as glass (Umar et al., 2009), silicon (Choy et al., 2003), and
sapphire (Hong-Yuan et al., 2007). However, there was less attention given to grown
ZnO structure on curved surfaces such as optical fiber and waveguides (Wang, 2004;
Liu et al., 2012). The growth of ZnO structure on round optical fiber is expected to find
new applications due to their optical quality and diversity of fabrication scheme
(Konstantaki et al., 2012; Batumalay et al., 2014). In this chapter, the growth of ZnO
27
NR’s on both silica and plastic optical fibers are demonstrated. ZnO NR’s are chosen in
this work to grow on the optical fiber due to their unique properties compared to other
nanostructures. For instance, scattering properties of ZnO NR’s cause light to couple to
the cladding and core regions. High alignment of ZnO NR’s is expected to maximize the
coupling efficiency. Hydrothermal method is selected in this work since it is a well-
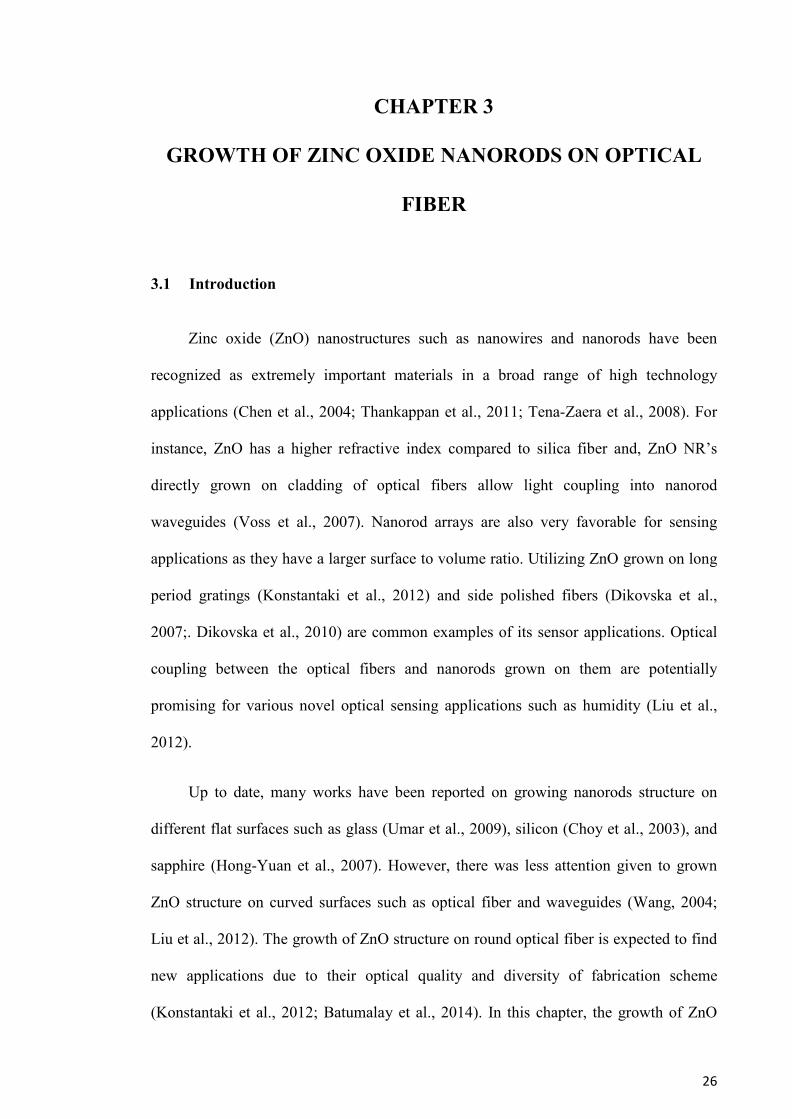
known which can provide a highly uniform growth. The growth technique is optimized
to improve the rod’s length and increase density. In Figure3.1 is shown methodology of
hydrothermal growth of ZnO NR’s on optical fibers.
Figure 3.1: Hydrothermal growth of ZnO NR’s on optical fibers.
28
3.2 Growth of ZnO NR’s on silica multimode fiber
In this section, we discuss on the growth of ZnO NR’s on silica multimode optical
fiber as a substrate. In the experiment, the fiber used is a standard multimode optical
fiber (MMF, Thorlab FG105LCA) with core and cladding diameters of 105 and 125 μm,
respectively. The MMF has a low loss transmission in a wide wavelength region
ranging from visible to IR (400 - 2400 nm). A maximum attenuation of 12 dB/km is
obtained at 850nm. At first, the plastic buffer of the MMF was stripped using acetone in
an ultrasonic bath. In this process the fiber was dipped in acetone for 15 minutes before
it was cleansed with ethanol and washed with deionized water. ZnO NR’s were grown
using a modified method suggested by ( Sugunan et al., 2006). That started with seeding
a substrate with ZnO nanocrystals, followed by a controlled hydrothermal growth
process (Baruah & Dutta , 2009).
A zinc acetate (ZnC4H6O4, Merk, 99% purity) solution prepared in ethanol
(C2H6O, Carlo Erba, 99.7% purity) was used to grow the seeding layer of ZnO
nanoparticles. This layer serves as the nucleation site for the hydrothermal growth of the
ZnO NR’s. Zinc acetate dehydrate concentration was varied from 1mM to 6 mM in
order to study the effect of the seeding layer on the nanorods formation on the fiber. In
order to deposit the seeding layer, the cleansed fiber was placed on a hot plate while
maintaining the temperature at 60 °C. Then 100 µl of the zinc acetate solution was
dropped on the fiber before the solvent was slowly dried at atmosphere. The dropping
process was repeated 7 times and at the end of process the fiber was annealed at 350°C
for 1 hour under the hood.
In this work, the ZnO NR’s’ growth is investigated for two different
hydrothermal processes; using microwave and oven. ZnO NR’s were grown on a seeded
29
silica fiber substrate by using hydrothermal process where an aqueous solution
containing 10 mM zinc nitrate hexahydrate (Zn (NO3)2, 6H2O, Aldrich, 99%), and 10
mM hexamethylenetetramine or HMT (CH12N4 , Carlo Erba, 99.5% ) was used as
precursor solution in the beaker and heated up at 95°C for 3 h in a microwave oven and
later heated to 90°C in normal oven. The hydrothermal reaction time was varied from 5
h to 20 h and in order to maintain a constant growth rate of the nanorods the old
precursor solution was replenished with new solution every 5 h untill the end of
hydrothermal process (Baruah & Dutta, 2009). Finally the ZnO NR’s coated fiber was
retracted from the precursor solution and rinsed thoroughly with DI water several times,
followed by drying in oven at 90 °C. The obtained ZnO nanorords coated substrates
were then characterized by scanning electron microscopy (SEM; model: JEOLJSM-
6301F) and x-ray diffraction spectroscopy (XRD; model: JEOLJDX-3530 with Cu K α
radiation).
Figures 3.2 and 3.3shows the SEM micrographs of ZnO NR’s grown on the
surface of silica optical fiber by microwave and oven respectively. It is observed in
Figure 3.2 that the growth of nanorods by microwave is really not uniform. However,
the uniformity is significantly improved by using a normal oven as shown in Figure 3.3.
Therefore, for rest of experiments in this work and also for plastic optical fiber substrate
normal oven was used to grow ZnO NR’s.
30
Figure 3.2: (a) Low magnification scanning electron microscope (SEM) images of
the fiber coated with ZnO NR's by microwave technique, (b) Higher magnification
of the nanorods.
Figure 3.3: (a) Top and (b) Cross sectional SEM images of ZnO NR's grown on the
surface of silica MMF using oven.
As shown on Figure 3.3 (a), the diameters of the nanorods were found to be in the
range 100-130 nm. The average length of the nanorods was found to be around 1.8 µm
determined from cross sectional SEM micrograph of the nanorods coated fiber as shown
in Figure 3.3 (b). The XRD pattern of Figure 3.4 shows Wurtzite structure verified from
the power diffraction standards (JCPDS) no. 36-1451. The maximum XRD peak
intensity was found at twice of the diffraction angle(2θ) of 34.42° corresponding to the
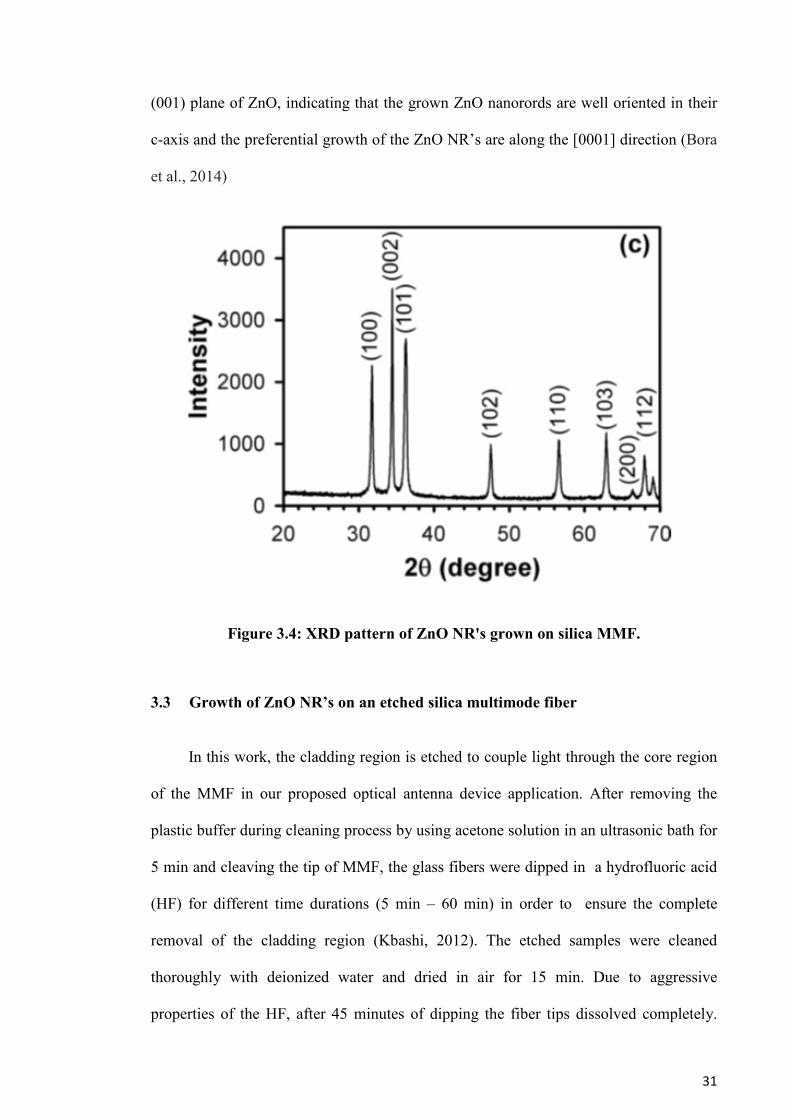
31
(001) plane of ZnO, indicating that the grown ZnO nanorords are well oriented in their
c-axis and the preferential growth of the ZnO NR’s are along the [0001] direction (Bora
et al., 2014)
Figure 3.4: XRD pattern of ZnO NR's grown on silica MMF.
3.3 Growth of ZnO NR’s on an etched silica multimode fiber
In this work, the cladding region is etched to couple light through the core region
of the MMF in our proposed optical antenna device application. After removing the
plastic buffer during cleaning process by using acetone solution in an ultrasonic bath for
5 min and cleaving the tip of MMF, the glass fibers were dipped in a hydrofluoric acid
(HF) for different time durations (5 min – 60 min) in order to ensure the complete
removal of the cladding region (Kbashi, 2012). The etched samples were cleaned
thoroughly with deionized water and dried in air for 15 min. Due to aggressive
properties of the HF, after 45 minutes of dipping the fiber tips dissolved completely.
32
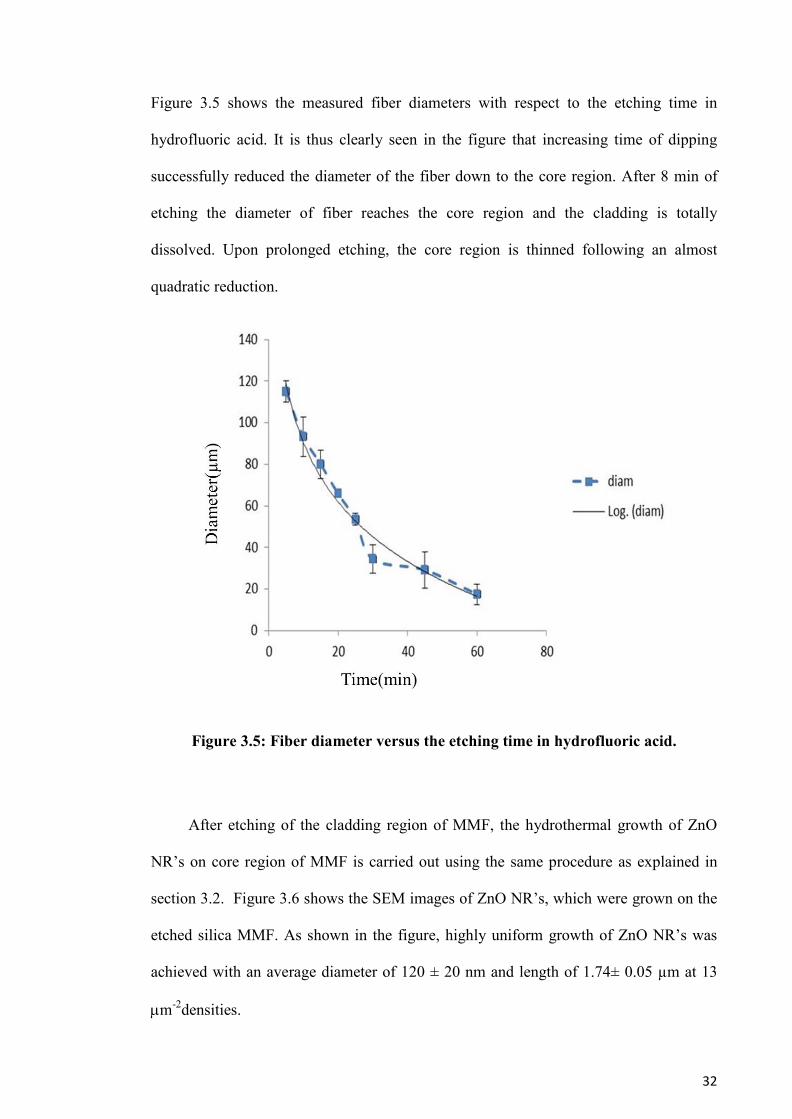
Figure 3.5 shows the measured fiber diameters with respect to the etching time in
hydrofluoric acid. It is thus clearly seen in the figure that increasing time of dipping
successfully reduced the diameter of the fiber down to the core region. After 8 min of
etching the diameter of fiber reaches the core region and the cladding is totally
dissolved. Upon prolonged etching, the core region is thinned following an almost
quadratic reduction.
Figure 3.5: Fiber diameter versus the etching time in hydrofluoric acid.
After etching of the cladding region of MMF, the hydrothermal growth of ZnO
NR’s on core region of MMF is carried out using the same procedure as explained in
section 3.2. Figure 3.6 shows the SEM images of ZnO NR’s, which were grown on the
etched silica MMF. As shown in the figure, highly uniform growth of ZnO NR’s was
achieved with an average diameter of 120 ± 20 nm and length of 1.74± 0.05 µm at 13
µm-2densities.
33
.
Figure 3.6: SEM images of (a) Uniform growth of ZnO NR's on the core region of
silica MMF, (b) Cross sectional view of the MMF showing the growth thickness, (c)
High magnification top view of the rods showing the profile and density,(d) Side
view ofthe rods on the optical fiber showing the growth directionality.
3.4 Growth of ZnO NR’s on a plastic fiber
The deposition of the seeding layer on the POF substrate is different to silica
optical fibers and glass substrates. After cleaning POF samples, they were treated with
several different methods in order to achieve optimum results. In growing ZnO NR’s on
the POF fiber, at first, we followed the optimum growth condition for silica MMF
(1mM Zinc acetate and 8 h growth time). However, the POF substrate is made of Poly
(methyl) methacrylate (PMMA). Therefore, we cannot achieve a proper nanorods
growth on POF with the optimum growth condition of silica fiber. This is attributed to
the fact that attachment of rods on the POF was not strong. Figure 3.7 shows the SEM
image of the POF coated with ZnO NR’s with same condition as the previous silica
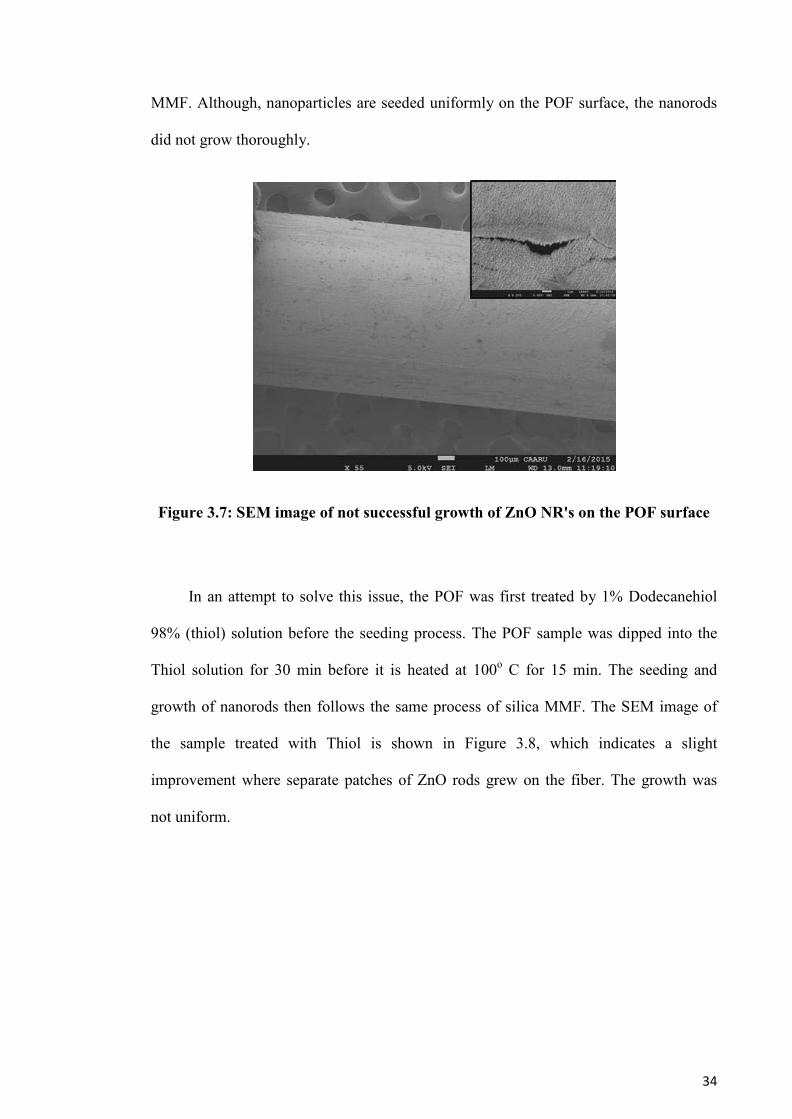
34
MMF. Although, nanoparticles are seeded uniformly on the POF surface, the nanorods
did not grow thoroughly.
Figure 3.7: SEM image of not successful growth of ZnO NR's on the POF surface
In an attempt to solve this issue, the POF was first treated by 1% Dodecanehiol
98% (thiol) solution before the seeding process. The POF sample was dipped into the
Thiol solution for 30 min before it is heated at 100o C for 15 min. The seeding and
growth of nanorods then follows the same process of silica MMF. The SEM image of
the sample treated with Thiol is shown in Figure 3.8, which indicates a slight
improvement where separate patches of ZnO rods grew on the fiber. The growth was
not uniform.
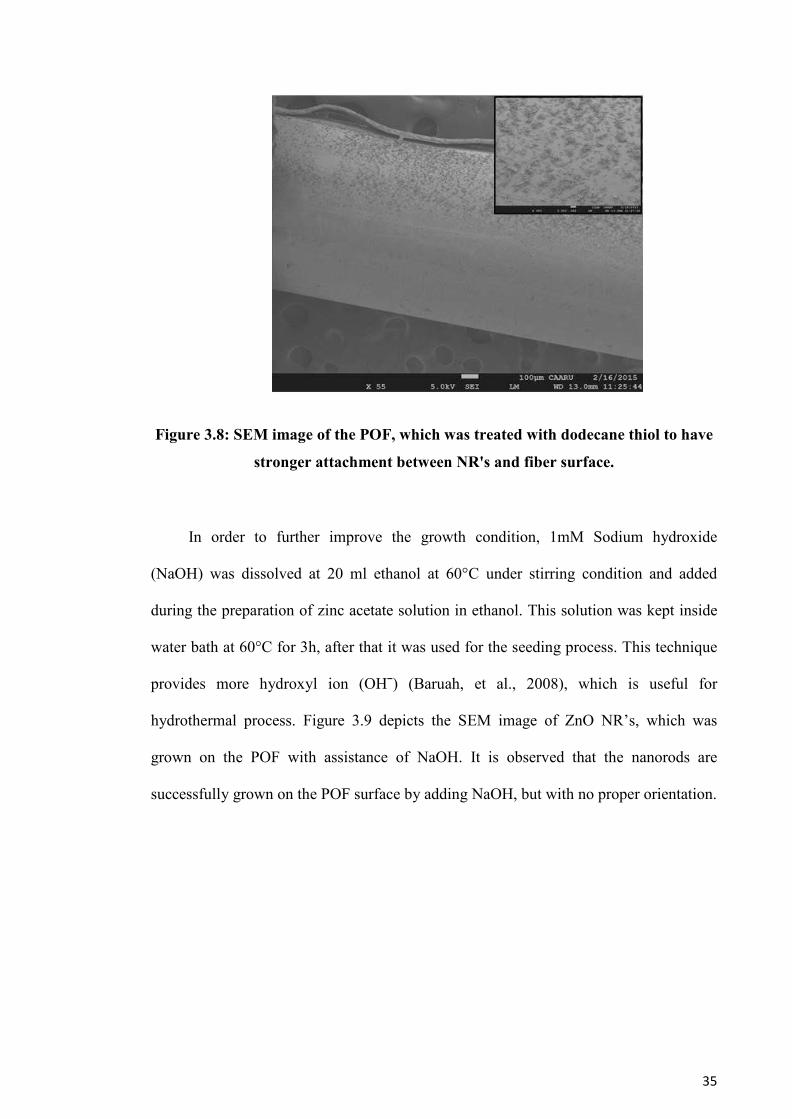
35
Figure 3.8: SEM image of the POF, which was treated with dodecane thiol to have
stronger attachment between NR's and fiber surface.
In order to further improve the growth condition, 1mM Sodium hydroxide
(NaOH) was dissolved at 20 ml ethanol at 60°C under stirring condition and added
during the preparation of zinc acetate solution in ethanol. This solution was kept inside
water bath at 60°C for 3h, after that it was used for the seeding process. This technique
provides more hydroxyl ion (OHˉ) (Baruah, et al., 2008), which is useful for
hydrothermal process. Figure 3.9 depicts the SEM image of ZnO NR’s, which was
grown on the POF with assistance of NaOH. It is observed that the nanorods are
successfully grown on the POF surface by adding NaOH, but with no proper orientation.
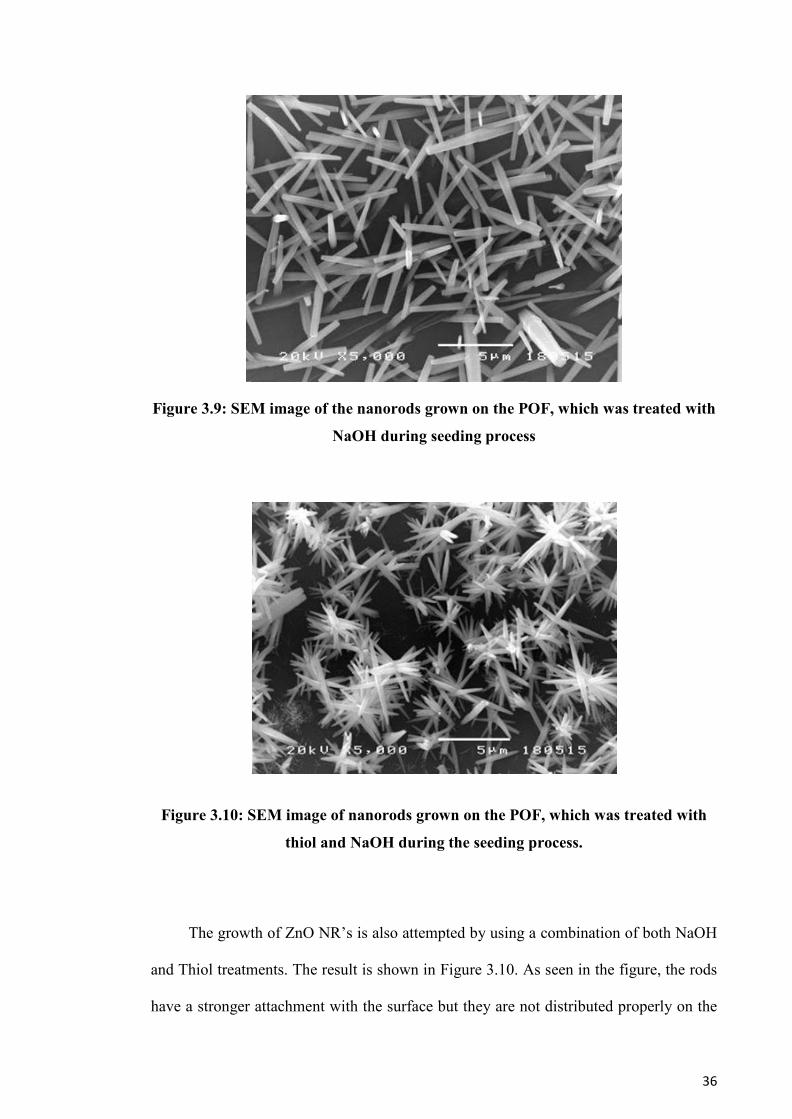
36
Figure 3.9: SEM image of the nanorods grown on the POF, which was treated with
NaOH during seeding process
Figure 3.10: SEM image of nanorods grown on the POF, which was treated with
thiol and NaOH during the seeding process.
The growth of ZnO NR’s is also attempted by using a combination of both NaOH
and Thiol treatments. The result is shown in Figure 3.10. As seen in the figure, the rods
have a stronger attachment with the surface but they are not distributed properly on the
37
POF.Finally, Polyoxyethylene (20) sorbitan monooleate ((Tween 80, C32 H60
O10),which is nonionic surfactant that contains hydrophilic group to treat the POF is
used. The structure of tween 80 is depicted in Figure 3.11.
As is shown, the (OH) group can help to provide more OHion during
hydrothermal process. In the experiment, 1 ml of Tween 80 is dissolved in 10 ml
deionized (DI) water, and then POF sample is dipped into this solution for 10 min at
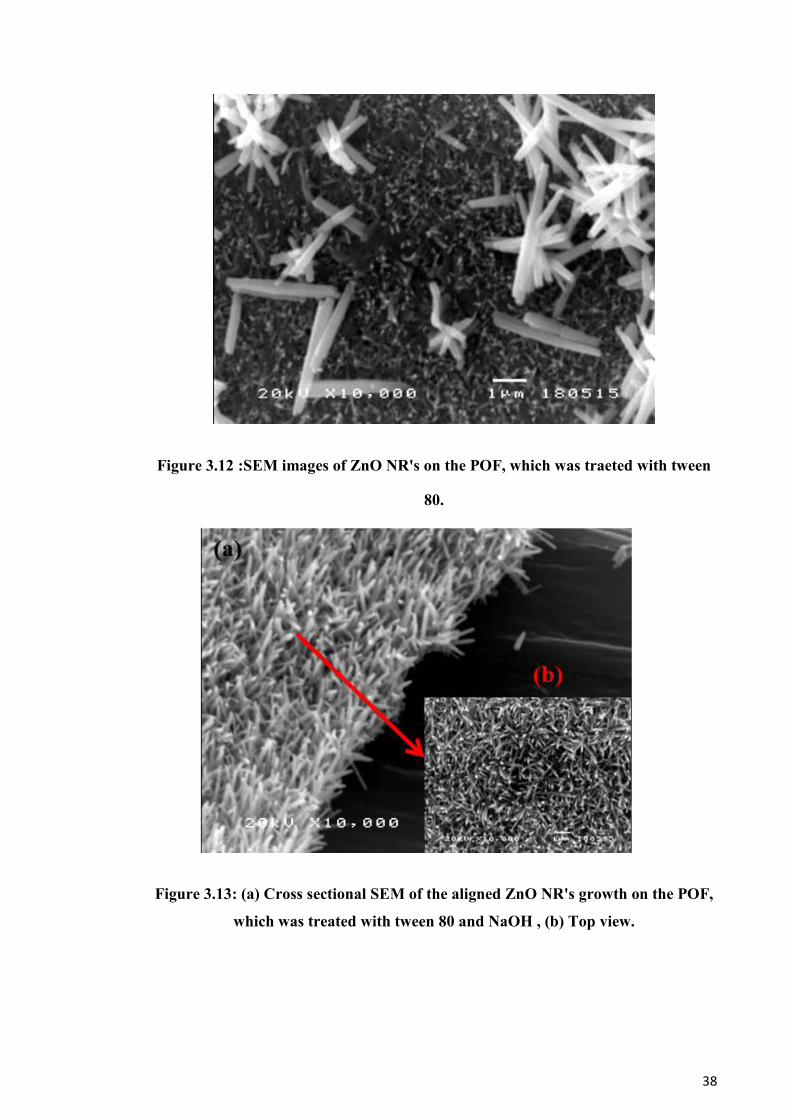
45° C. The sample was dried at air. Figure 3.12 shows the SEM image of the POF,
which was treated with Tween 80. Although the rods are grown on POF with strong
attachment, there are not as homogenous as desired. Patches of larger rods arepresented
among the nanorods.
Figure 3.11: Struture of polysorbate 80 (tween 80) with hydrophilic group.
38
Figure 3.12 :SEM images of ZnO NR's on the POF, which was traeted with tween
80.
Figure 3.13: (a) Cross sectional SEM of the aligned ZnO NR's growth on the POF,
which was treated with tween 80 and NaOH , (b) Top view.
39
Based on the previous SEM images, NaOH was added into Zinc acetate solution after
using Tween 80 during the seeding process. The SEM image of this combination is
shown in Figure 3.13. The images show that the nanorods are grown with more
uniformity and better radius distribution on the POF surface.
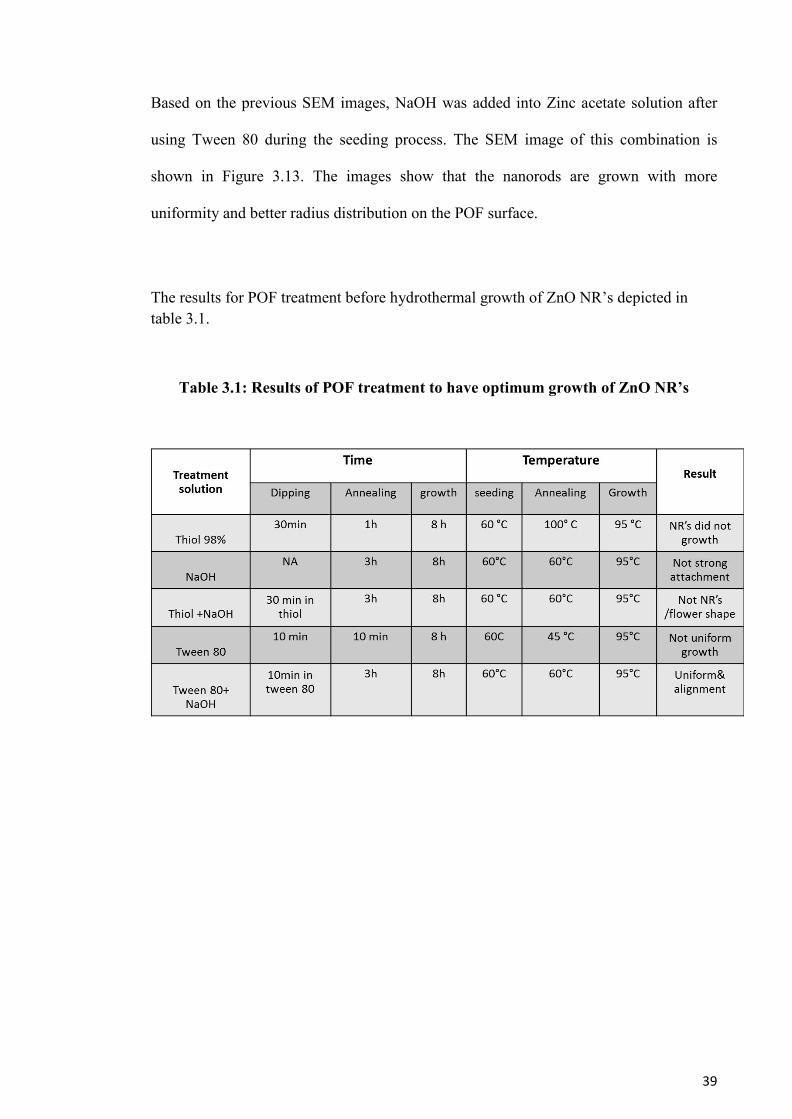
The results for POF treatment before hydrothermal growth of ZnO NR’s depicted in table 3.1.
Table 3.1: Results of POF treatment to have optimum growth of ZnO NR’s
40
3.5 Summary
Hydrothermal growth of ZnO NR’swas applied on two different kinds of optical
fibers; silica and plastic MMF. Compared to the conventional approach with
microwave, the use of oven at growth temperature of 95° C produced more uniform and
highly aligned ZnO rods. It is found that the 8 hours growth time and the use of 1 mM
Zinc acetate are the optimum condition for the hydrothermal process to produce ZnO
NR’s with highly uniform, dense and excellent directivity on the fiber surface. The same
conditions were used to grow ZnO NR’s on cladding surface of both fibers. The ZnO
NR’sgrowth was also successfully demonstrated onto the core surface of the silica fiber,
which was etched using HF acid. It is also found that the ZnO hydrothermal growth on
PMMA surface is more complicated compared to silica surface. Therefore, some pre-
treatments have to be carried out on the POF to obtain uniform and well-oriented
nanorods.
41
CHAPTER 4
OPTIMIZATION OF GROWTH CONDITION FOR
MAXIMUM SIDE COUPLING
4.1 Introduction
Scattering properties of ZnO NR’s coated on multimode fiber controls light
guidance inside the fiber from outside leakage. Light scattering of the nanorods is
governed by rods’ shape, density and refractive index contrast between the rods and the
environment. The effect of the hydrothermal growth condition of the nanorods on these
factors and their influence on light scattering and guidance are experimentally
investigated. The optimum results for coupling light to cladding and core modes are
obtained through sample characterization. Characterization and growth optimization are
demonstrated in this chapter.
4.2 Scattering properties of ZnO nanorods on optical fiber
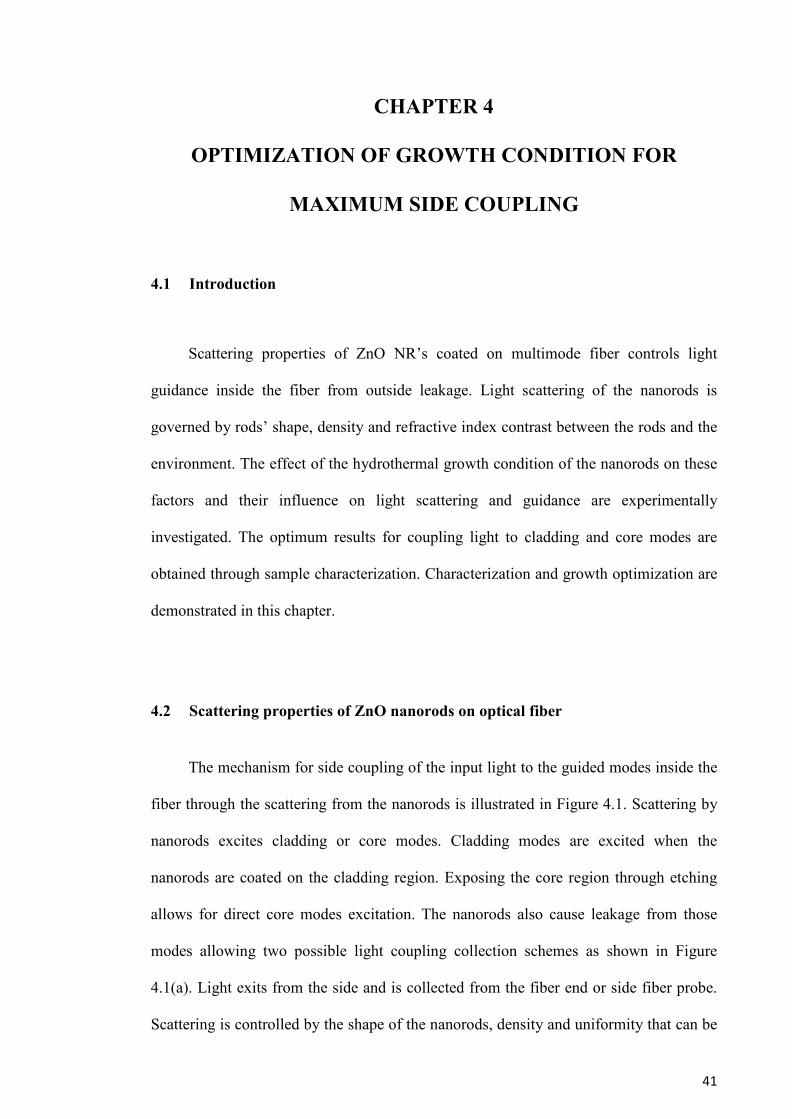
The mechanism for side coupling of the input light to the guided modes inside the
fiber through the scattering from the nanorods is illustrated in Figure 4.1. Scattering by
nanorods excites cladding or core modes. Cladding modes are excited when the
nanorods are coated on the cladding region. Exposing the core region through etching
allows for direct core modes excitation. The nanorods also cause leakage from those
modes allowing two possible light coupling collection schemes as shown in Figure
4.1(a). Light exits from the side and is collected from the fiber end or side fiber probe.
Scattering is controlled by the shape of the nanorods, density and uniformity that can be
42
designed by optimizing growth conditions (Baruah & Dutta, 2009). ZnO NR’s scatter
the incident light inside the fiber at angles greater than the critical angle. That excites
the guided modes of the fiber and light is coupled.
Figure 4.1: Schematic representation of two possible configuration of side coupling
(collection from the end of fiber or collection of light from the leakage from the
side of the fiber) to cladding modes with guided and leakage intensity responses of
light paths in the side-coupling configuration
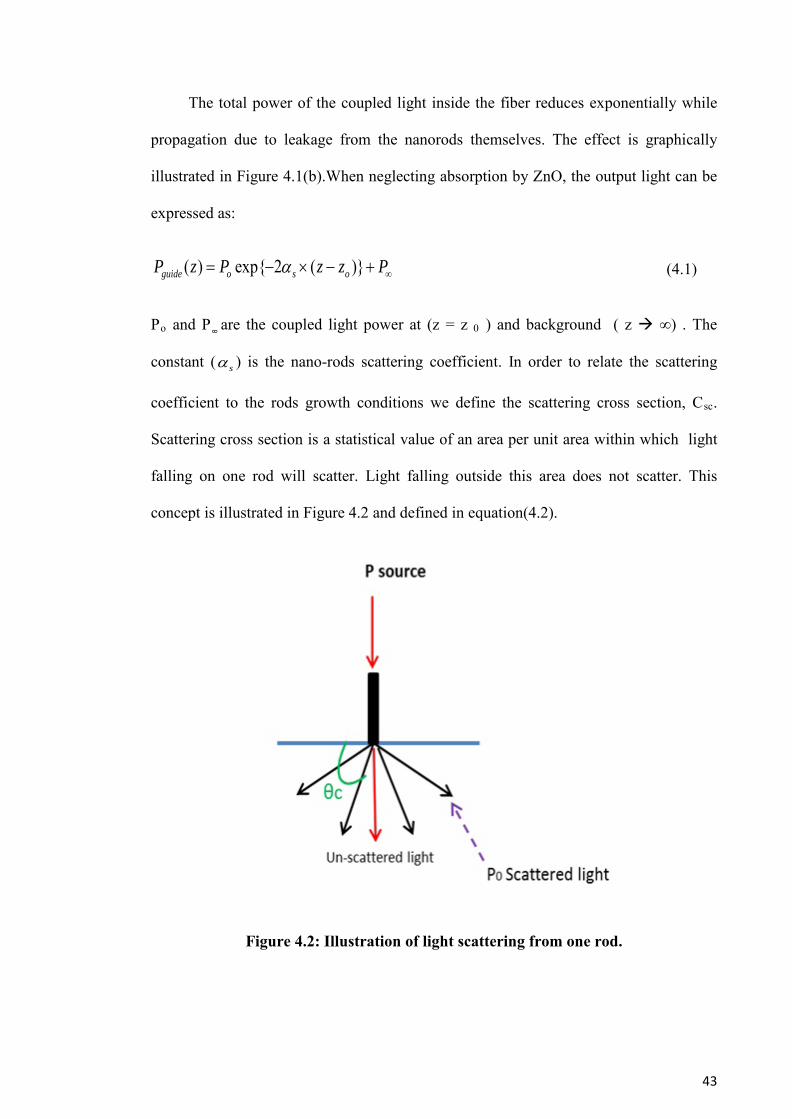
43
The total power of the coupled light inside the fiber reduces exponentially while
propagation due to leakage from the nanorods themselves. The effect is graphically
illustrated in Figure 4.1(b).When neglecting absorption by ZnO, the output light can be
expressed as:
( ) exp{ 2 ( )}guide o s oP z P z z Pα ∞= − × − + (4.1)
Po and P ͚ are the coupled light power at (z = z 0 ) and background ( z ∞) . The
constant ( sα ) is the nano-rods scattering coefficient. In order to relate the scattering
coefficient to the rods growth conditions we define the scattering cross section, Csc.
Scattering cross section is a statistical value of an area per unit area within which light
falling on one rod will scatter. Light falling outside this area does not scatter. This
concept is illustrated in Figure 4.2 and defined in equation(4.2).
Figure 4.2: Illustration of light scattering from one rod.
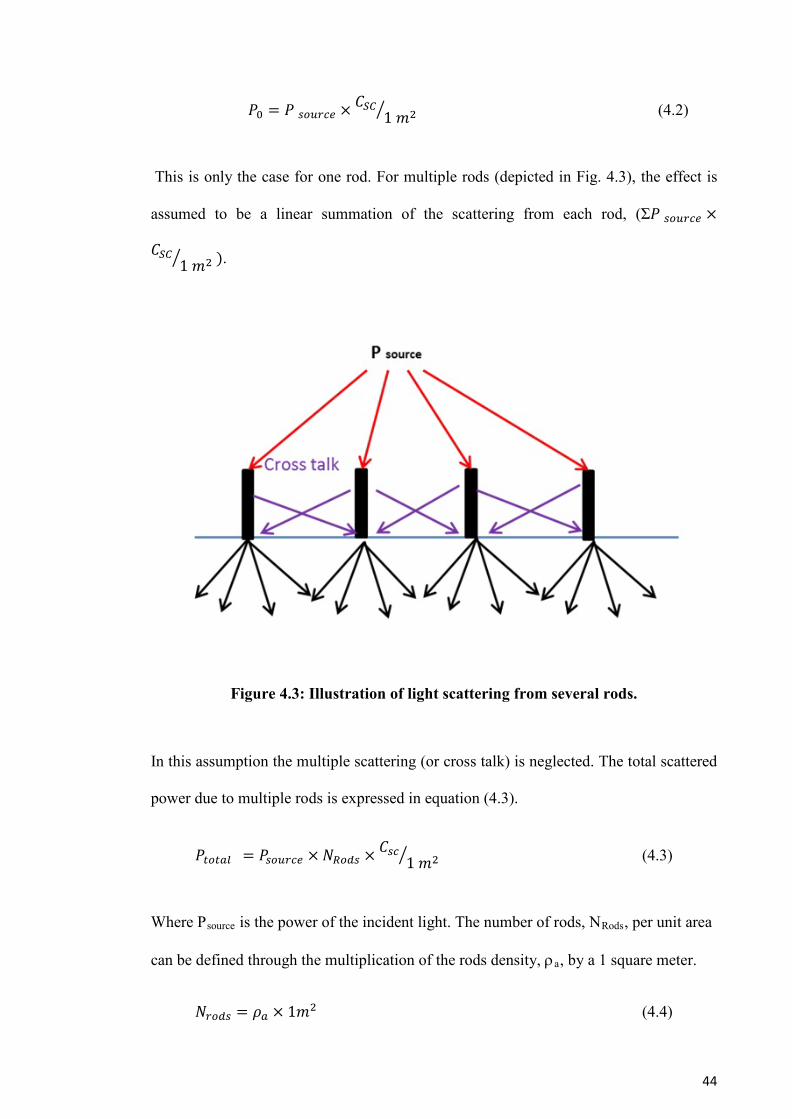
44
𝑃0 = 𝑃 𝑠𝑜𝑢𝑟𝑐𝑒 × 𝐶𝑆𝐶1 𝑚2� (4.2)
This is only the case for one rod. For multiple rods (depicted in Fig. 4.3), the effect is
assumed to be a linear summation of the scattering from each rod, (Ʃ𝑃 𝑠𝑜𝑢𝑟𝑐𝑒 ×
𝐶𝑆𝐶1 𝑚2� ).
Figure 4.3: Illustration of light scattering from several rods.
In this assumption the multiple scattering (or cross talk) is neglected. The total scattered
power due to multiple rods is expressed in equation (4.3).
𝑃𝑡𝑜𝑡𝑎𝑙 = 𝑃𝑠𝑜𝑢𝑟𝑐𝑒 × 𝑁𝑅𝑜𝑑𝑠 × 𝐶𝑠𝑐1 𝑚2� (4.3)
Where Psource is the power of the incident light. The number of rods, NRods, per unit area
can be defined through the multiplication of the rods density, ρa, by a 1 square meter.
𝑁𝑟𝑜𝑑𝑠 = 𝜌𝑎 × 1𝑚2 (4.4)
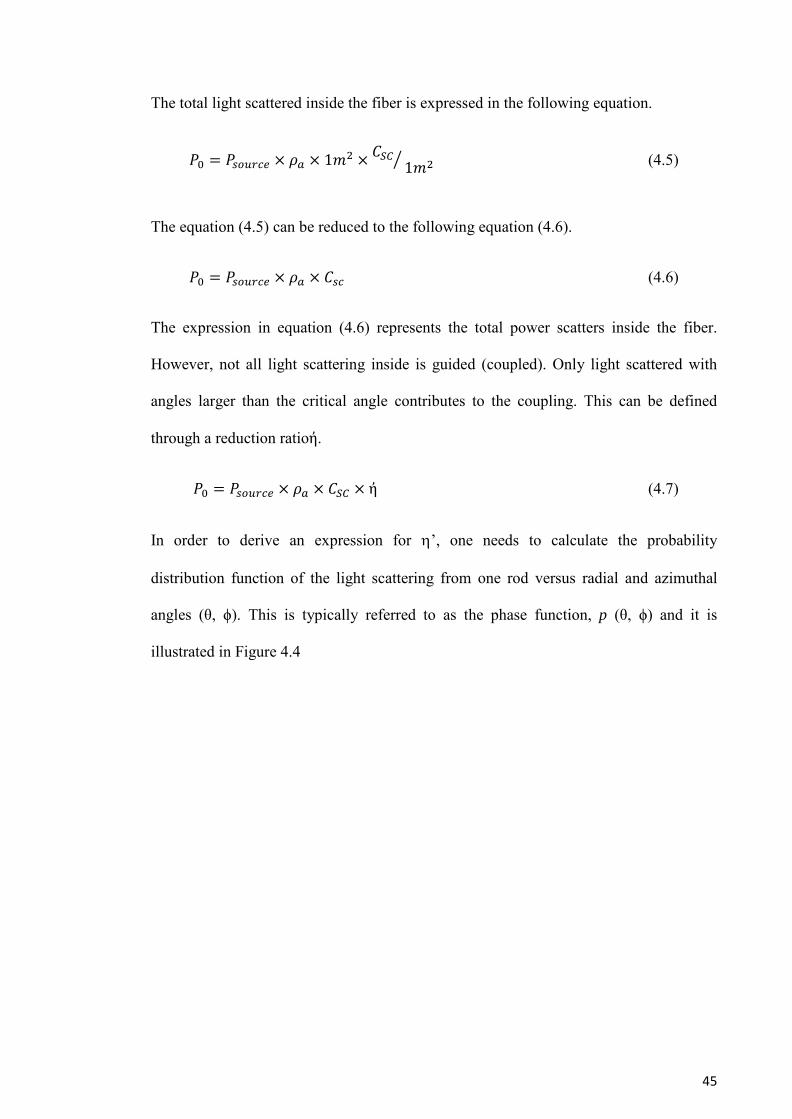
45
The total light scattered inside the fiber is expressed in the following equation.
𝑃0 = 𝑃𝑠𝑜𝑢𝑟𝑐𝑒 × 𝜌𝑎 × 1𝑚2 × 𝐶𝑆𝐶 1𝑚2� (4.5)
The equation (4.5) can be reduced to the following equation (4.6).
𝑃0 = 𝑃𝑠𝑜𝑢𝑟𝑐𝑒 × 𝜌𝑎 × 𝐶𝑠𝑐 (4.6)
The expression in equation (4.6) represents the total power scatters inside the fiber.
However, not all light scattering inside is guided (coupled). Only light scattered with
angles larger than the critical angle contributes to the coupling. This can be defined
through a reduction ratioἠ.
𝑃0 = 𝑃𝑠𝑜𝑢𝑟𝑐𝑒 × 𝜌𝑎 × 𝐶𝑆𝐶 × ἠ (4.7)
In order to derive an expression for η’, one needs to calculate the probability
distribution function of the light scattering from one rod versus radial and azimuthal
angles (θ, ϕ). This is typically referred to as the phase function, p (θ, ϕ) and it is
illustrated in Figure 4.4
46
Figure 4.4: (a) Definition of the polar coordinated and (b) Measured polar plot for
the ZnO NR'S grown on coated fibers, considering symmetry along the θ direction
.
As p(θ, ϕ) is a probability distribution function, the integration over all angles should be unity.
∫ ∫ 𝑝(𝜃,𝜙)𝑠𝑖𝑛𝜃 𝑑𝜃 𝑑𝜙2𝜋0
2𝜋0 = 1 (4.8)
The pattern is assumed to be symmetric along the azimuthal angle, the expression in
equation (4.8) is reduced to:.
∫ 𝑝(𝜃)𝑠𝑖𝑛𝜃𝑑𝜃 = 12𝜋0 (4.9)
Only light scattered at angles large than critical angles contributes to the guidance inside
fiber as demonstrated in Figure 4.2. The fraction of scattered light that is guided can be
written as:
ἠ = 2 × 2𝜋 ∫ 𝑝(𝜃)𝑠𝑖𝑛𝜃𝑑𝜃 𝜋𝜃𝑐 (4.10)
47
Hence, P0 can be expressed:
𝑃0 = 2 × 𝑃𝑠𝑜𝑢𝑟𝑐𝑒 × 2𝜋 × 𝜌𝑎 × 𝐶𝑆𝐶 ∫ 𝑝(𝜃)𝑠𝑖𝑛𝜃𝑑𝜃𝜋𝜃 (4.11)
It is worth mentioning, that P0 is the total power coupled into the fiber assuming an
excitation from one point. The effect of finite beam extension will be explained in the
next chapter.
To characterize the scattering properties of the NR’s, and hence the coupling
efficiency, two approaches were explored in this work. In the first approach, the incident
light is scanned along the longitudinal axes of the fibers coated with ZnO NR’s and the
output power is measured. The measurements are then fitted to equation(4.1) to extract
the coupling efficiency and P0. In the second approach, ZnO NR’s were grown on flat
glass substrate and the phase function is measured using a nephelometer. P0 was
estimated from equation (4.11) where the rods density and shape were extracted from
the SEM images of the grown rods.
The next section explains the longitudinal scanning approach and shows the
optimization results. In section 4.3, phase function measurement is explained. In the first
approach microwave hydrothermal method was used, while oven was used in the second
one. Microwave was originally used due to its faster growth rate. However, as
mentioned in the previous section, it resulted in non-uniform growth and hence in the
second approach (and for the rest of the thesis work) oven was used.
4.3 Extraction of scattering coefficient using longitudinal scanning approach
In this approach the fiber coated with NR’s is considered as a black box, where
the output power is measured versus different input locations along the fiber axes. To
48
prove the concept introduced in the previous section, the growth time was fixed while
controlling the molarity of the seeding layer. Different concentrations of zinc acetate
were utilized during the seeding process: 1, 2, 3, 4, 5 and 6 mM, and for each
concentration several samples were prepared and tested.
Optical characterization was performed by measuring the output power while
scanning a focused white LED source along the fiber. The output is recorded using a
charge-coupled device (CCD camera) with 10x objective lens imaging the fiber end.
Still images captured by the camera were processed to extract the tip region and the
pixel values of that region were averaged and recorded with respect to the z location.
The optical set up which was used to characterize the samples is depicted in Figure 4.5.
The setup is designed to measure the coupled light versus incident location along the
fiber axes. It comprises of CCD camera, detector, sample holder, automatic translation
stage, beam splitter and LED light source. The end of the sample is placed. at the focal
point of the output objective lens. The light collected into the objective is divided
through a beam splitter to be partially read by a detector and for an image of the tip to
be recorded in the camera. The output of the camera and the detector are synchronized
using a computer unit which records a sequence of images and power readings while
moving the stage parallel to the fiber. The scattering coefficient can then be directly
extracted from measurements.
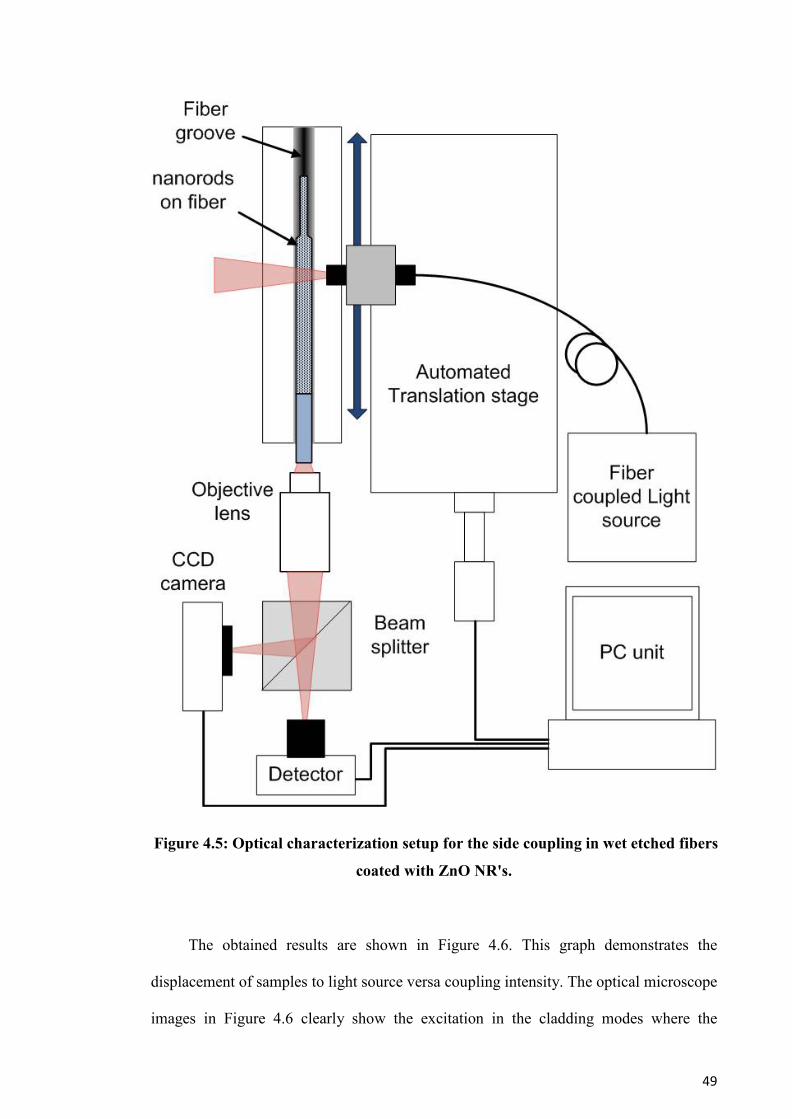
49
Figure 4.5: Optical characterization setup for the side coupling in wet etched fibers
coated with ZnO NR's.
The obtained results are shown in Figure 4.6. This graph demonstrates the
displacement of samples to light source versa coupling intensity. The optical microscope
images in Figure 4.6 clearly show the excitation in the cladding modes where the
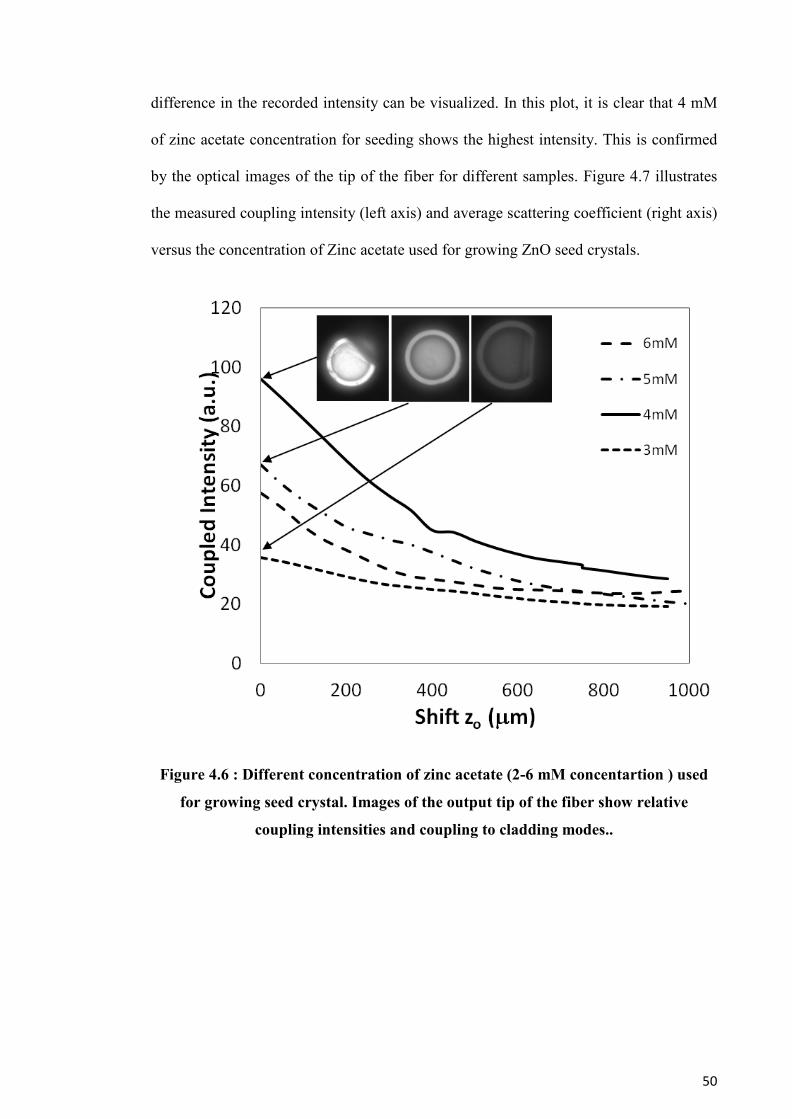
50
difference in the recorded intensity can be visualized. In this plot, it is clear that 4 mM
of zinc acetate concentration for seeding shows the highest intensity. This is confirmed
by the optical images of the tip of the fiber for different samples. Figure 4.7 illustrates
the measured coupling intensity (left axis) and average scattering coefficient (right axis)
versus the concentration of Zinc acetate used for growing ZnO seed crystals.
Figure 4.6 : Different concentration of zinc acetate (2-6 mM concentartion ) used
for growing seed crystal. Images of the output tip of the fiber show relative
coupling intensities and coupling to cladding modes..
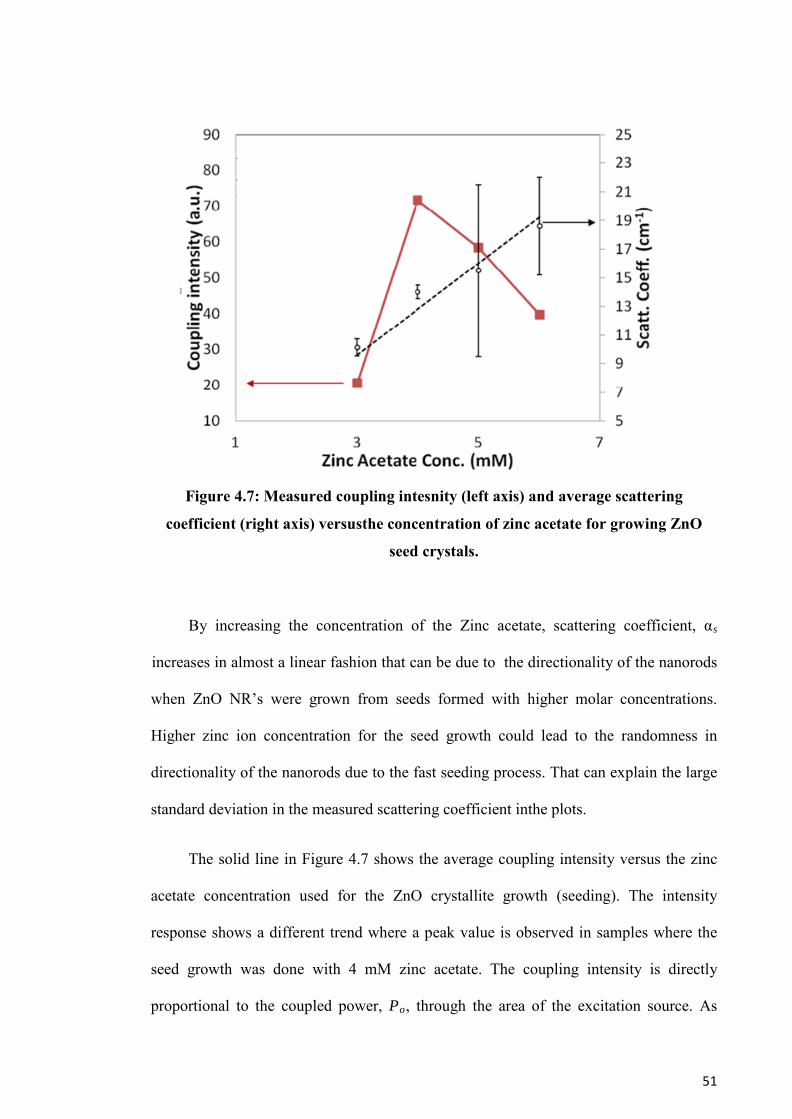
51
Figure 4.7: Measured coupling intesnity (left axis) and average scattering
coefficient (right axis) versusthe concentration of zinc acetate for growing ZnO
seed crystals.
By increasing the concentration of the Zinc acetate, scattering coefficient, αs
increases in almost a linear fashion that can be due to the directionality of the nanorods
when ZnO NR’s were grown from seeds formed with higher molar concentrations.
Higher zinc ion concentration for the seed growth could lead to the randomness in
directionality of the nanorods due to the fast seeding process. That can explain the large
standard deviation in the measured scattering coefficient inthe plots.
The solid line in Figure 4.7 shows the average coupling intensity versus the zinc
acetate concentration used for the ZnO crystallite growth (seeding). The intensity
response shows a different trend where a peak value is observed in samples where the
seed growth was done with 4 mM zinc acetate. The coupling intensity is directly
proportional to the coupled power, Po, through the area of the excitation source. As
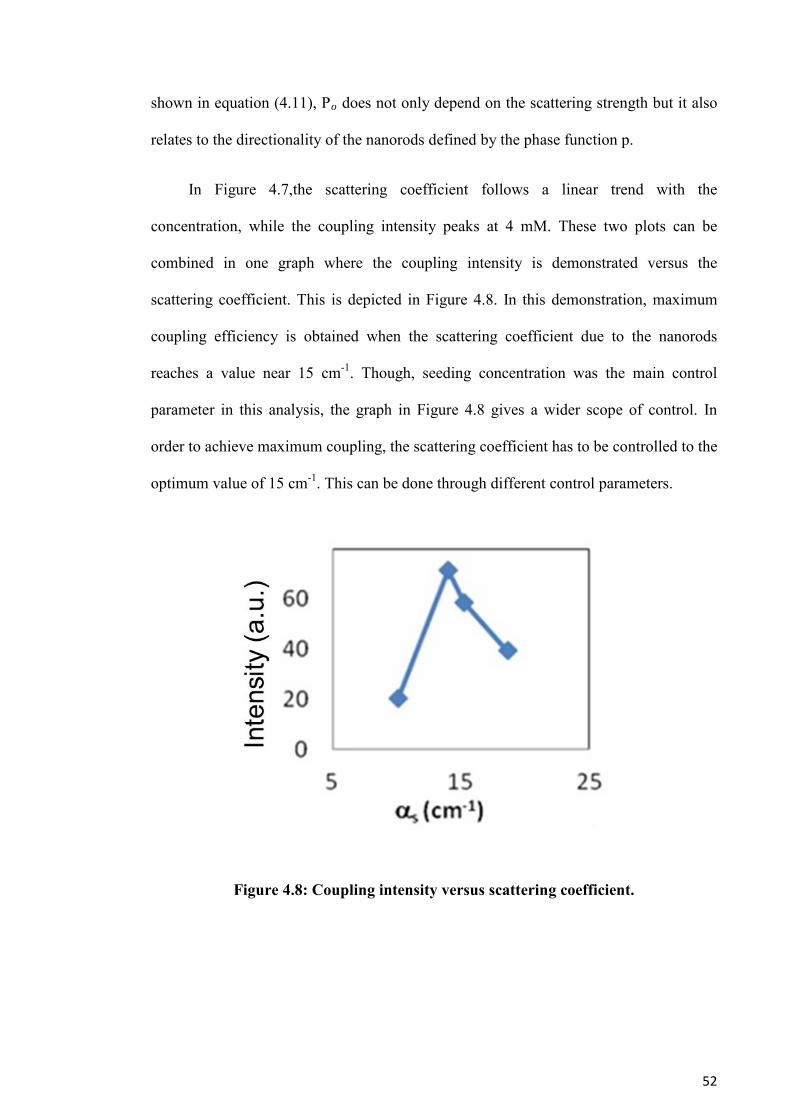
52
shown in equation (4.11), Po does not only depend on the scattering strength but it also
relates to the directionality of the nanorods defined by the phase function p.
In Figure 4.7,the scattering coefficient follows a linear trend with the
concentration, while the coupling intensity peaks at 4 mM. These two plots can be
combined in one graph where the coupling intensity is demonstrated versus the
scattering coefficient. This is depicted in Figure 4.8. In this demonstration, maximum
coupling efficiency is obtained when the scattering coefficient due to the nanorods
reaches a value near 15 cm-1. Though, seeding concentration was the main control
parameter in this analysis, the graph in Figure 4.8 gives a wider scope of control. In
order to achieve maximum coupling, the scattering coefficient has to be controlled to the
optimum value of 15 cm-1. This can be done through different control parameters.
Figure 4.8: Coupling intensity versus scattering coefficient.
53
4.4 Scattering parameters extraction using nephelometer
In this section, a nephelometry method is used to characterize the scattering
properties of the nanorods scattering parameters such as cross section and maximum
power coupling are directly extracted from the direct measurement of the phase function
and rods geometry (dimensions and density). Phase function is measured using a
homemade nephelometer, which required the ZnO NR’s to be grown on flat surface in
order to reach optimum conditions. In this work, the nanorods were grown on flat glass
substrate based on hydrothermal technique using an oven to ensure a uniform growth.
This technique also allows a better control of ZnO NR’s properties.
Direct measuring of the phase function for ZnO NR’s coated on optical fiber is a
challenging process due to the geometrical effect of the fiber cross section. That works
as a cylindrical lens and hence affects the angular spectrum of the scattering process.
Also, light interacts with the rods layer at multiple locations due to the roundness of the
fiber. That makes it extremely difficult to extract the effect of one layer of the coated
rods. One way to avoid this difficulty is to measure the scattering properties of ZnO
NR’s grown on a flat surface. Then using the optical condition obtained as initial
conditions for the fiber growth. Fine tuning is then applied on the fiber case for
maximum coupling efficiency.
In the following section, direct measurements of the phase function and growth
optimization on flat surface are studied. This is followed by optimization on the fiber
surface.
54
4.4.1 Direct angular spectrum measurement
The presence of the ZnO NR’s on flat substrate or optical fiber causes the
incident light to scatter angles larger than the incident one. The angular spectrum
distribution of the scattered light depends strongly on the rods shape and density.
Optical scattering is characterized through scattering cross section, Csc, and phase
function p (ϕ,θ). Cross section is the ratio of the total scattered field to the incident light
represented as an area normalized to unit area. Phase function is a probability
distribution function of the light scattering at radial and azimuthal angles θ and ϕ. To
evaluate Csc and p of the grown ZnO NR’s on glass substrate, an optical nephalometer
was used. Figure 4.9 shows the schematic setup for the homemade nephelometer.
In the experiment, a collimated fiber coupled white light LED source is used to
shine light on the sample. An optical detector is placed at the end of a rotating arm to
measure the optical power as a function of the azimuthal angle θ (radial symmetry is
assumes as the direction of the rods are along the direction of light incidence.) The
average scattering cross section for one rod, Csc, is estimated from the measured ratio of
the total scattered power to the incidence divided by the rods density (number of rods
per unit area, 𝜌Ra.) This density is measured from the SEM images. Knowing Csc and 𝜌a,
the scattering coefficient (defined as the scattering loss per unit length of propagation)
as /s sc aC Lα ρ= × , where L is the average length of the rods measured from the SEM
images. This quantity is important especially when dealing with optical fiber which will
be explained in the results and analysis section.
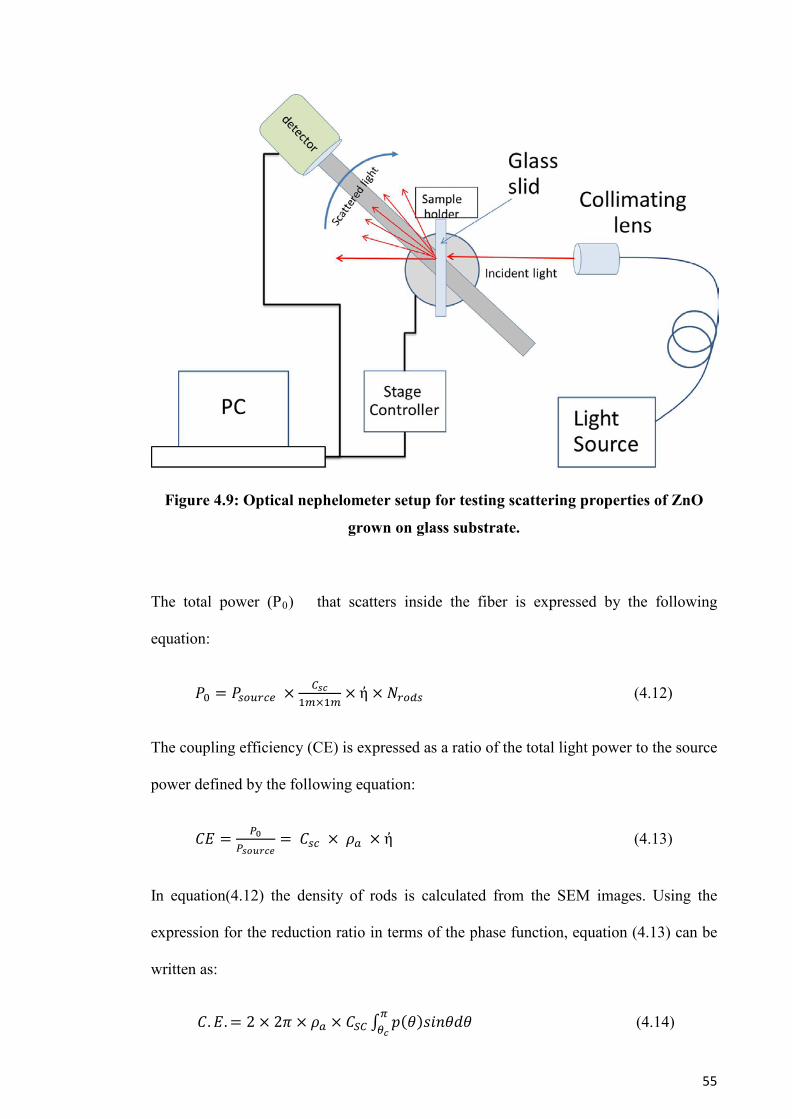
55
Figure 4.9: Optical nephelometer setup for testing scattering properties of ZnO
grown on glass substrate.
The total power (P0) that scatters inside the fiber is expressed by the following
equation:
𝑃0 = 𝑃𝑠𝑜𝑢𝑟𝑐𝑒 × 𝐶𝑠𝑐1𝑚×1𝑚
× ἠ × 𝑁𝑟𝑜𝑑𝑠 (4.12)
The coupling efficiency (CE) is expressed as a ratio of the total light power to the source
power defined by the following equation:
𝐶𝐸 = 𝑃0𝑃𝑠𝑜𝑢𝑟𝑐𝑒
= 𝐶𝑠𝑐 × 𝜌𝑎 × ἠ (4.13)
In equation(4.12) the density of rods is calculated from the SEM images. Using the
expression for the reduction ratio in terms of the phase function, equation (4.13) can be
written as:
𝐶.𝐸. = 2 × 2𝜋 × 𝜌𝑎 × 𝐶𝑆𝐶 ∫ 𝑝(𝜃)𝑠𝑖𝑛𝜃𝑑𝜃𝜋𝜃𝑐
(4.14)
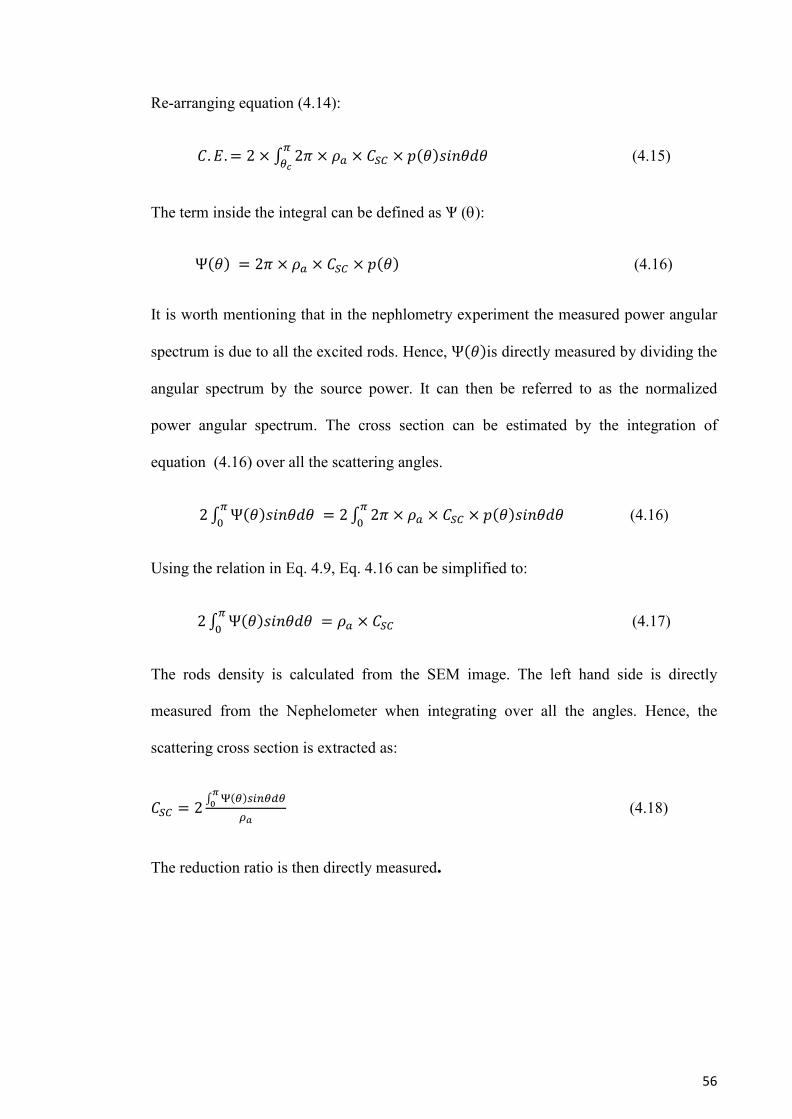
56
Re-arranging equation (4.14):
𝐶.𝐸. = 2 × ∫ 2𝜋 × 𝜌𝑎 × 𝐶𝑆𝐶 × 𝑝(𝜃)𝑠𝑖𝑛𝜃𝑑𝜃𝜋𝜃𝑐
(4.15)
The term inside the integral can be defined as Ѱ (θ):
Ψ(𝜃) = 2𝜋 × 𝜌𝑎 × 𝐶𝑆𝐶 × 𝑝(𝜃) (4.16)
It is worth mentioning that in the nephlometry experiment the measured power angular
spectrum is due to all the excited rods. Hence, Ψ(𝜃)is directly measured by dividing the
angular spectrum by the source power. It can then be referred to as the normalized
power angular spectrum. The cross section can be estimated by the integration of
equation (4.16) over all the scattering angles.
2∫ Ψ(𝜃)𝑠𝑖𝑛𝜃𝑑𝜃𝜋0 = 2∫ 2𝜋 × 𝜌𝑎 × 𝐶𝑆𝐶 × 𝑝(𝜃)𝑠𝑖𝑛𝜃𝑑𝜃𝜋
0 (4.16)
Using the relation in Eq. 4.9, Eq. 4.16 can be simplified to:
2∫ Ψ(𝜃)𝑠𝑖𝑛𝜃𝑑𝜃𝜋0 = 𝜌𝑎 × 𝐶𝑆𝐶 (4.17)
The rods density is calculated from the SEM image. The left hand side is directly
measured from the Nephelometer when integrating over all the angles. Hence, the
scattering cross section is extracted as:
𝐶𝑆𝐶 = 2 ∫ Ψ(𝜃)𝑠𝑖𝑛𝜃𝑑𝜃𝜋0
𝜌𝑎 (4.18)
The reduction ratio is then directly measured.
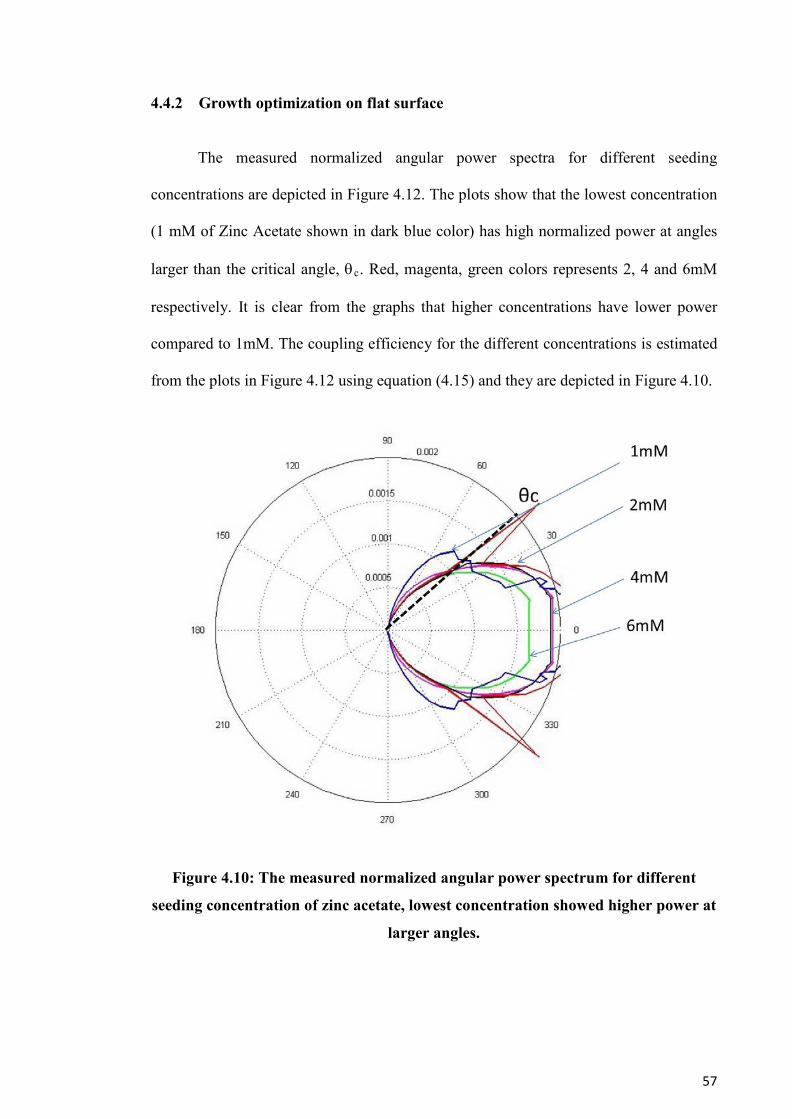
57
4.4.2 Growth optimization on flat surface
The measured normalized angular power spectra for different seeding
concentrations are depicted in Figure 4.12. The plots show that the lowest concentration
(1 mM of Zinc Acetate shown in dark blue color) has high normalized power at angles
larger than the critical angle, θc. Red, magenta, green colors represents 2, 4 and 6mM
respectively. It is clear from the graphs that higher concentrations have lower power
compared to 1mM. The coupling efficiency for the different concentrations is estimated
from the plots in Figure 4.12 using equation (4.15) and they are depicted in Figure 4.10.
Figure 4.10: The measured normalized angular power spectrum for different
seeding concentration of zinc acetate, lowest concentration showed higher power at
larger angles.
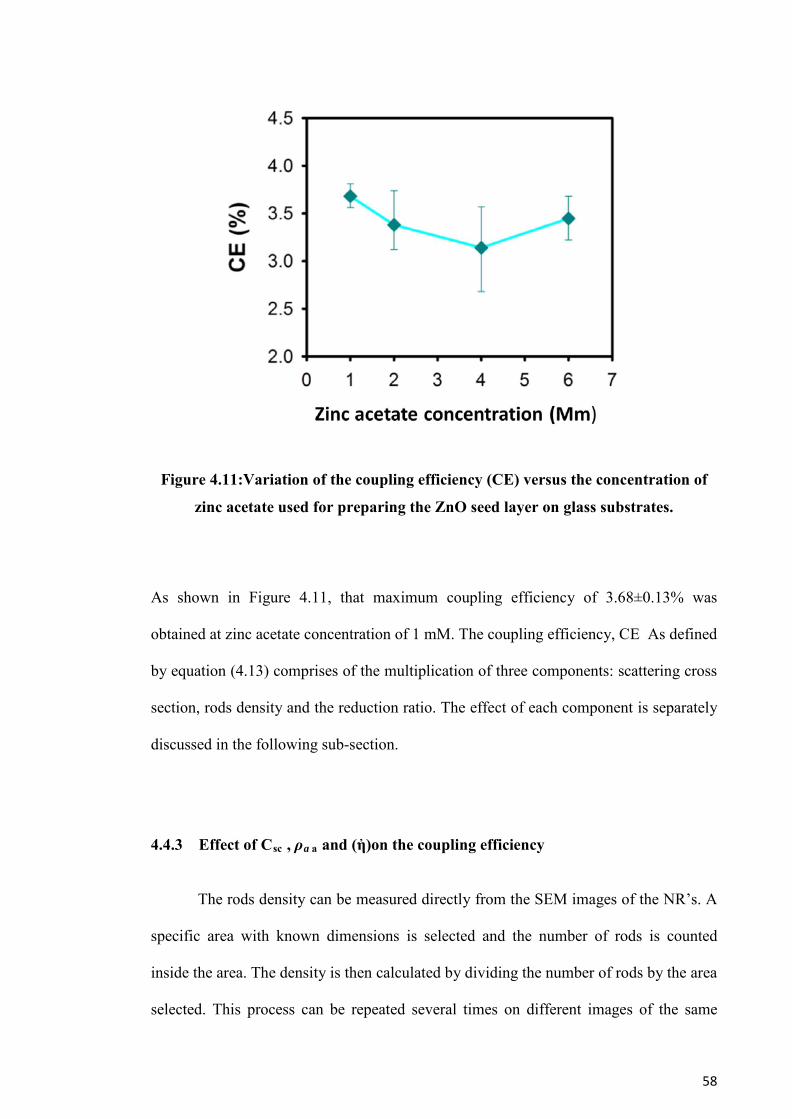
58
Figure 4.11:Variation of the coupling efficiency (CE) versus the concentration of
zinc acetate used for preparing the ZnO seed layer on glass substrates.
As shown in Figure 4.11, that maximum coupling efficiency of 3.68±0.13% was
obtained at zinc acetate concentration of 1 mM. The coupling efficiency, CE As defined
by equation (4.13) comprises of the multiplication of three components: scattering cross
section, rods density and the reduction ratio. The effect of each component is separately
discussed in the following sub-section.
4.4.3 Effect of Csc , ρa a and (ἠ)on the coupling efficiency
The rods density can be measured directly from the SEM images of the NR’s. A
specific area with known dimensions is selected and the number of rods is counted
inside the area. The density is then calculated by dividing the number of rods by the area
selected. This process can be repeated several times on different images of the same
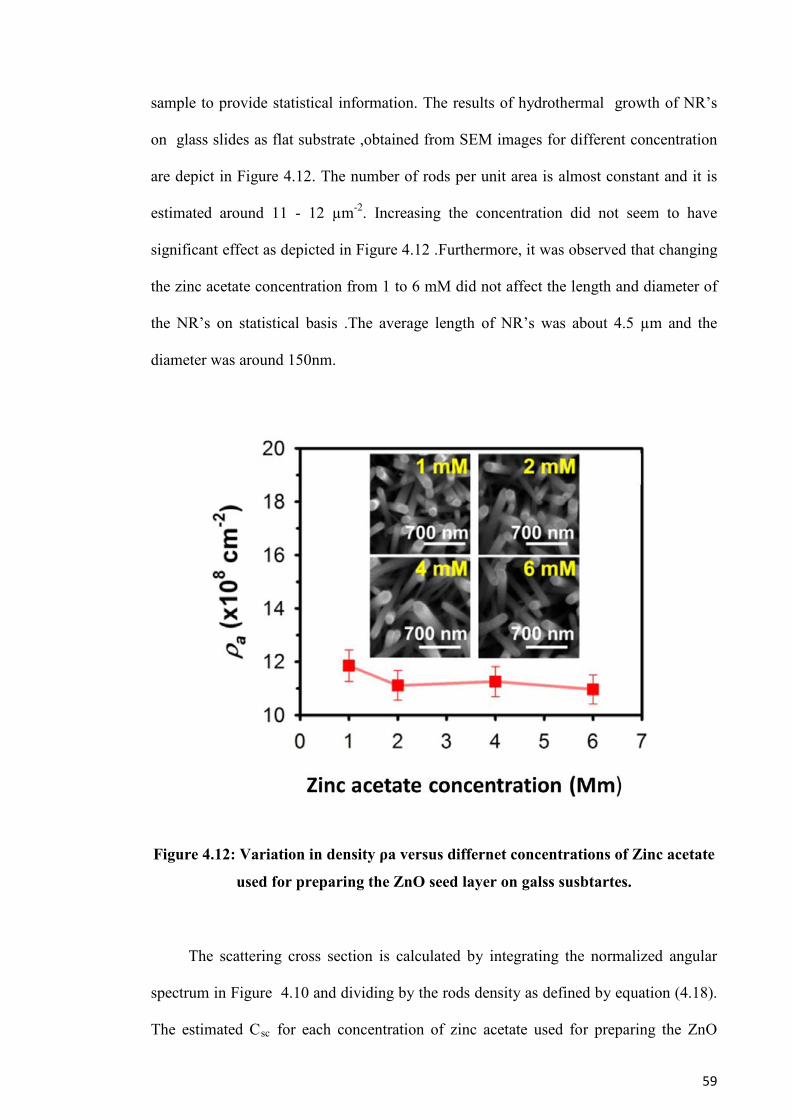
59
sample to provide statistical information. The results of hydrothermal growth of NR’s
on glass slides as flat substrate ,obtained from SEM images for different concentration
are depict in Figure 4.12. The number of rods per unit area is almost constant and it is
estimated around 11 - 12 µm-2. Increasing the concentration did not seem to have
significant effect as depicted in Figure 4.12 .Furthermore, it was observed that changing
the zinc acetate concentration from 1 to 6 mM did not affect the length and diameter of
the NR’s on statistical basis .The average length of NR’s was about 4.5 µm and the
diameter was around 150nm.
Figure 4.12: Variation in density ρa versus differnet concentrations of Zinc acetate
used for preparing the ZnO seed layer on galss susbtartes.
The scattering cross section is calculated by integrating the normalized angular
spectrum in Figure 4.10 and dividing by the rods density as defined by equation (4.18).
The estimated Csc for each concentration of zinc acetate used for preparing the ZnO
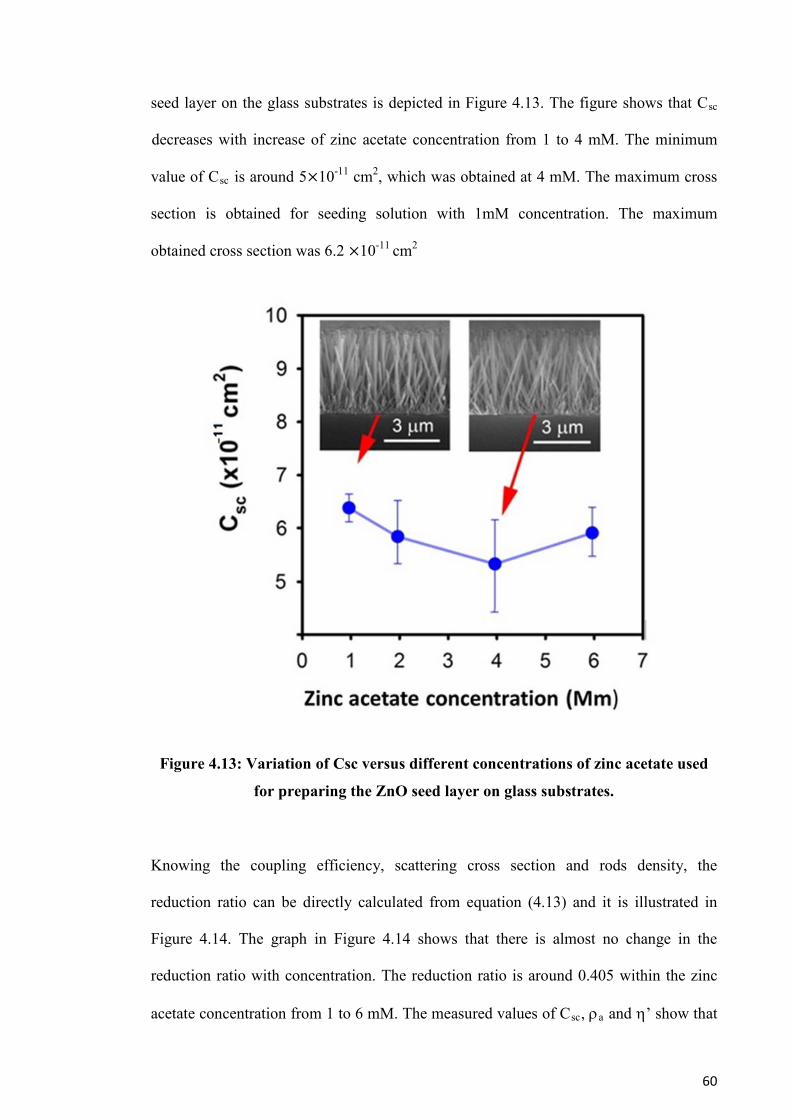
60
seed layer on the glass substrates is depicted in Figure 4.13. The figure shows that Csc
decreases with increase of zinc acetate concentration from 1 to 4 mM. The minimum
value of Csc is around 5×10-11 cm2, which was obtained at 4 mM. The maximum cross
section is obtained for seeding solution with 1mM concentration. The maximum
obtained cross section was 6.2 ×10⁻¹¹ cm2
Figure 4.13: Variation of Csc versus different concentrations of zinc acetate used
for preparing the ZnO seed layer on glass substrates.
Knowing the coupling efficiency, scattering cross section and rods density, the
reduction ratio can be directly calculated from equation (4.13) and it is illustrated in
Figure 4.14. The graph in Figure 4.14 shows that there is almost no change in the
reduction ratio with concentration. The reduction ratio is around 0.405 within the zinc
acetate concentration from 1 to 6 mM. The measured values of Csc, ρa and η’ show that
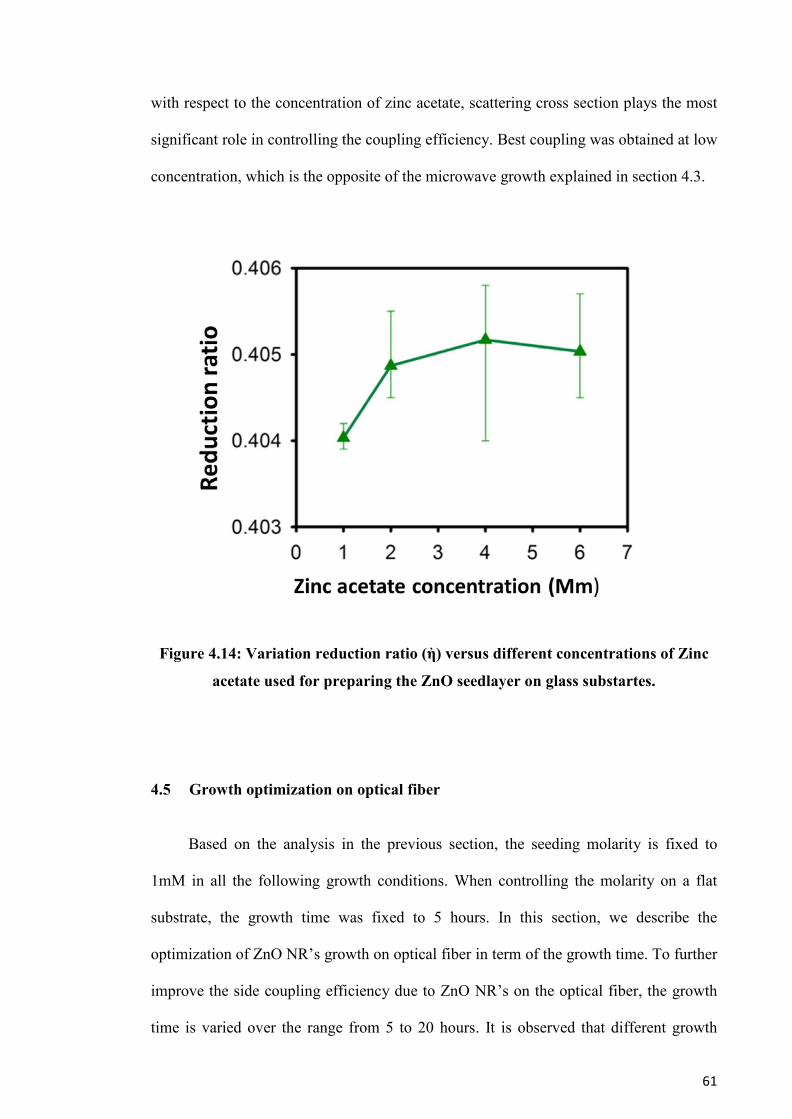
61
with respect to the concentration of zinc acetate, scattering cross section plays the most
significant role in controlling the coupling efficiency. Best coupling was obtained at low
concentration, which is the opposite of the microwave growth explained in section 4.3.
Figure 4.14: Variation reduction ratio (ἠ) versus different concentrations of Zinc
acetate used for preparing the ZnO seedlayer on glass substartes.
4.5 Growth optimization on optical fiber
Based on the analysis in the previous section, the seeding molarity is fixed to
1mM in all the following growth conditions. When controlling the molarity on a flat
substrate, the growth time was fixed to 5 hours. In this section, we describe the
optimization of ZnO NR’s growth on optical fiber in term of the growth time. To further
improve the side coupling efficiency due to ZnO NR’s on the optical fiber, the growth
time is varied over the range from 5 to 20 hours. It is observed that different growth
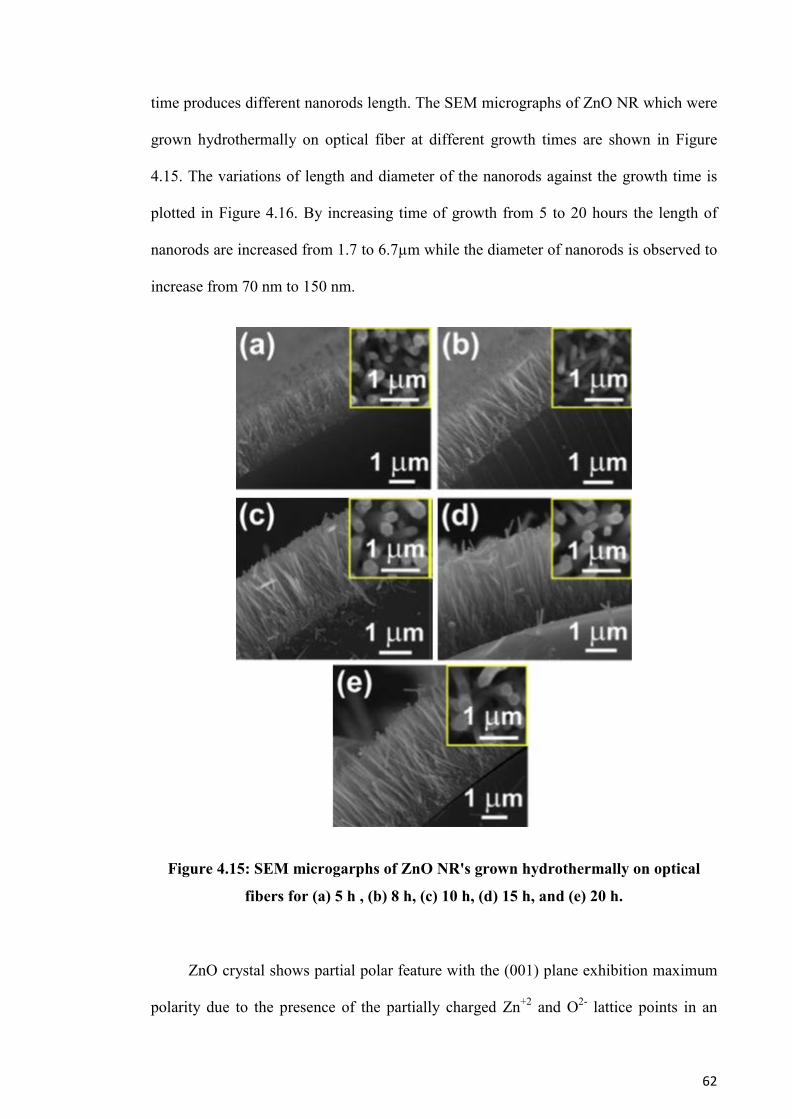
62
time produces different nanorods length. The SEM micrographs of ZnO NR which were
grown hydrothermally on optical fiber at different growth times are shown in Figure
4.15. The variations of length and diameter of the nanorods against the growth time is
plotted in Figure 4.16. By increasing time of growth from 5 to 20 hours the length of
nanorods are increased from 1.7 to 6.7µm while the diameter of nanorods is observed to
increase from 70 nm to 150 nm.
Figure 4.15: SEM microgarphs of ZnO NR's grown hydrothermally on optical
fibers for (a) 5 h , (b) 8 h, (c) 10 h, (d) 15 h, and (e) 20 h.
ZnO crystal shows partial polar feature with the (001) plane exhibition maximum
polarity due to the presence of the partially charged Zn+2 and O2- lattice points in an
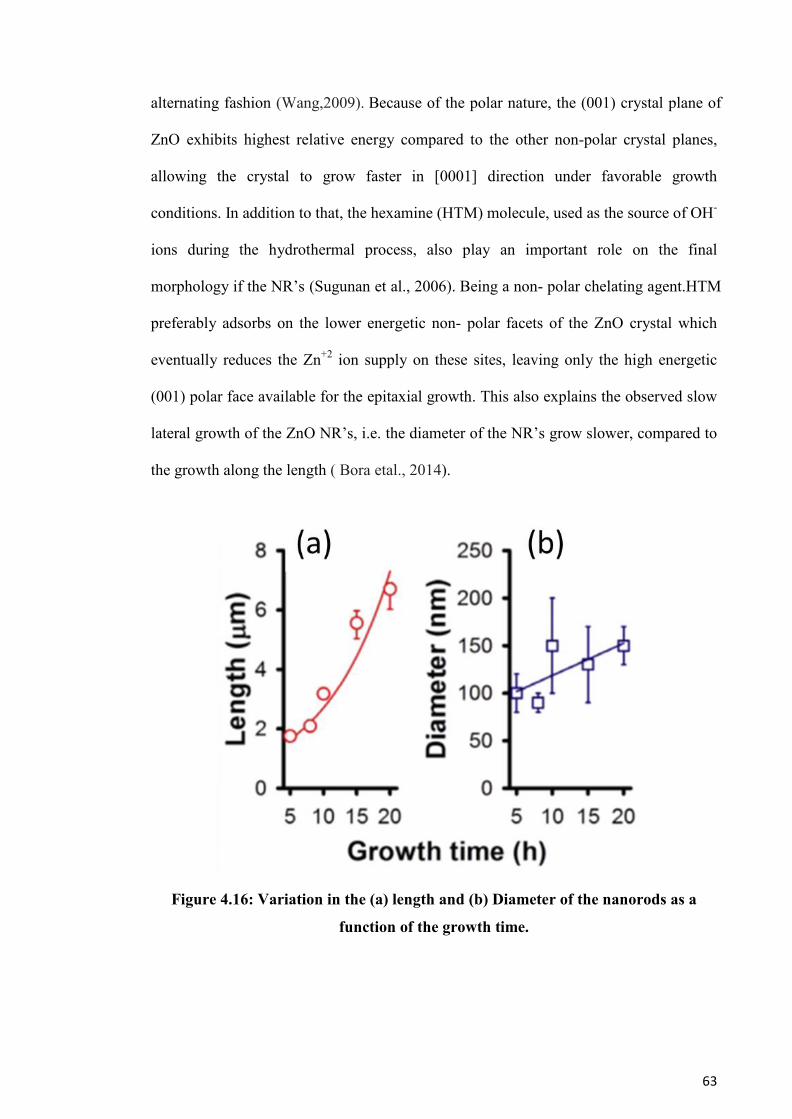
63
alternating fashion (Wang,2009). Because of the polar nature, the (001) crystal plane of
ZnO exhibits highest relative energy compared to the other non-polar crystal planes,
allowing the crystal to grow faster in [0001] direction under favorable growth
conditions. In addition to that, the hexamine (HTM) molecule, used as the source of OH-
ions during the hydrothermal process, also play an important role on the final
morphology if the NR’s (Sugunan et al., 2006). Being a non- polar chelating agent.HTM
preferably adsorbs on the lower energetic non- polar facets of the ZnO crystal which
eventually reduces the Zn+2 ion supply on these sites, leaving only the high energetic
(001) polar face available for the epitaxial growth. This also explains the observed slow
lateral growth of the ZnO NR’s, i.e. the diameter of the NR’s grow slower, compared to
the growth along the length ( Bora etal., 2014).
Figure 4.16: Variation in the (a) length and (b) Diameter of the nanorods as a
function of the growth time.
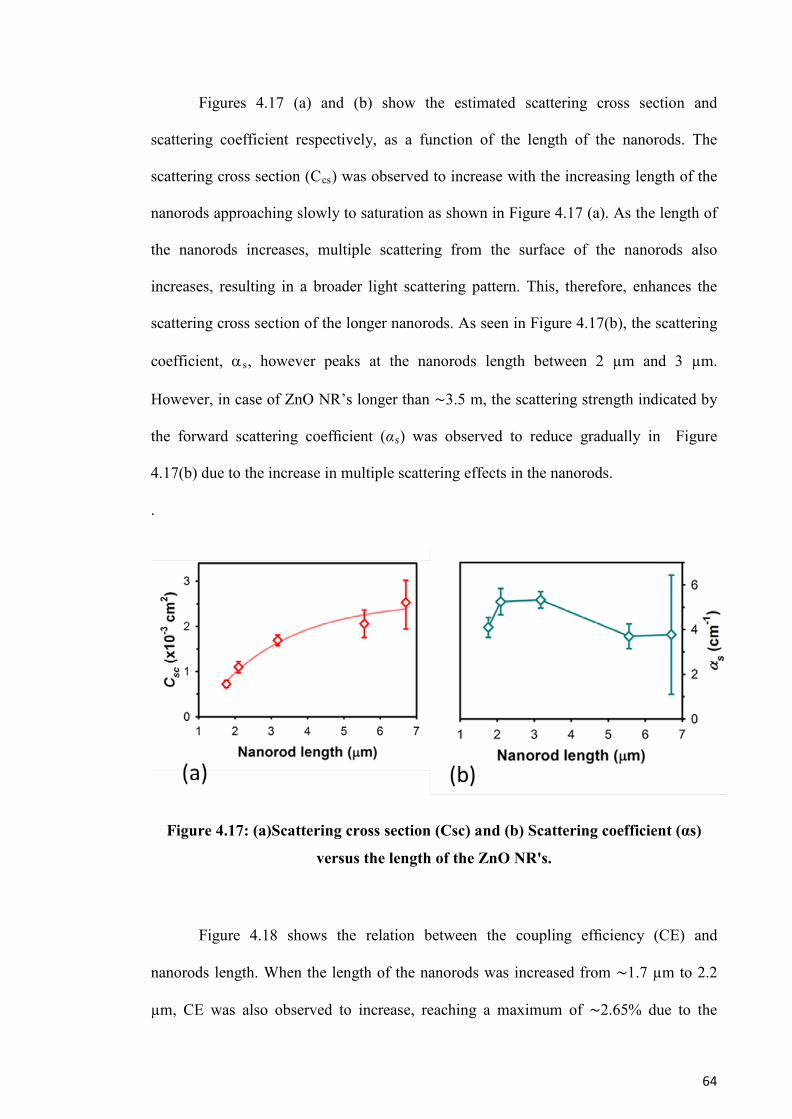
64
Figures 4.17 (a) and (b) show the estimated scattering cross section and
scattering coefficient respectively, as a function of the length of the nanorods. The
scattering cross section (Ccs) was observed to increase with the increasing length of the
nanorods approaching slowly to saturation as shown in Figure 4.17 (a). As the length of
the nanorods increases, multiple scattering from the surface of the nanorods also
increases, resulting in a broader light scattering pattern. This, therefore, enhances the
scattering cross section of the longer nanorods. As seen in Figure 4.17(b), the scattering
coefficient, αs, however peaks at the nanorods length between 2 µm and 3 µm.
However, in case of ZnO NR’s longer than ∼3.5 m, the scattering strength indicated by
the forward scattering coefficient (αs) was observed to reduce gradually in Figure
4.17(b) due to the increase in multiple scattering effects in the nanorods.
.
Figure 4.17: (a)Scattering cross section (Csc) and (b) Scattering coefficient (αs)
versus the length of the ZnO NR's.
Figure 4.18 shows the relation between the coupling efficiency (CE) and
nanorods length. When the length of the nanorods was increased from ∼1.7 µm to 2.2
µm, CE was also observed to increase, reaching a maximum of ∼2.65% due to the
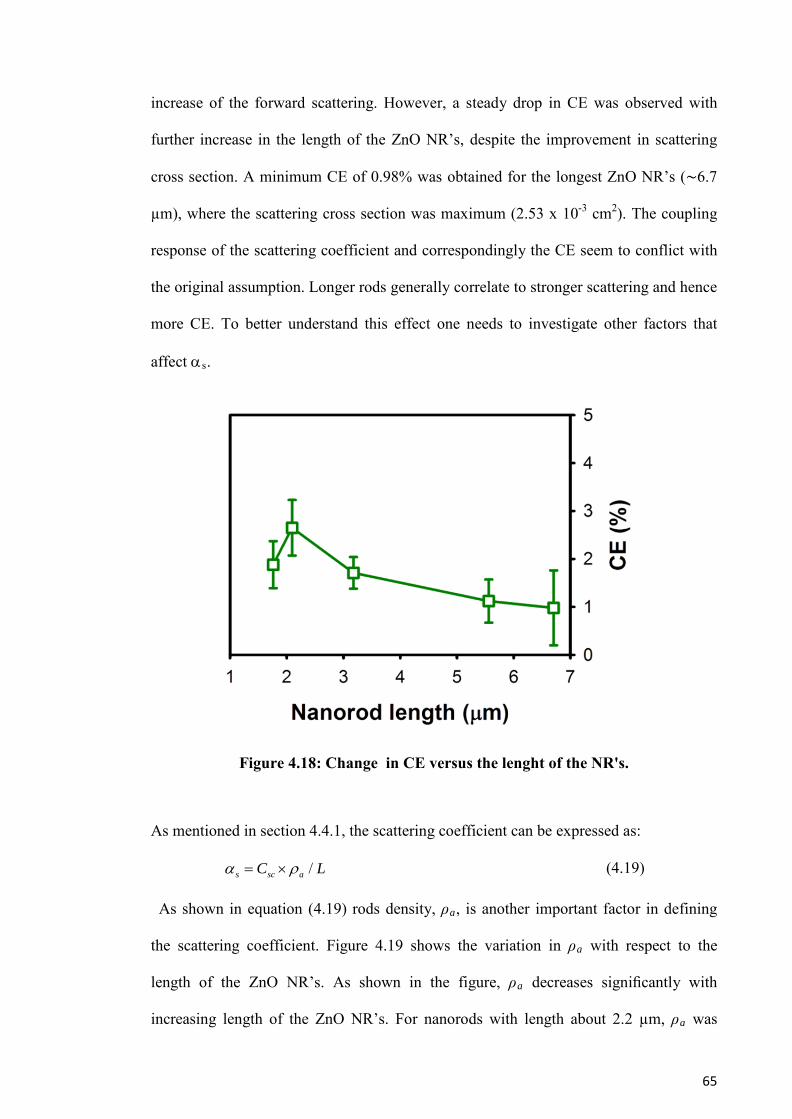
65
increase of the forward scattering. However, a steady drop in CE was observed with
further increase in the length of the ZnO NR’s, despite the improvement in scattering
cross section. A minimum CE of 0.98% was obtained for the longest ZnO NR’s (∼6.7
µm), where the scattering cross section was maximum (2.53 x 10⁻³ cm2). The coupling
response of the scattering coefficient and correspondingly the CE seem to conflict with
the original assumption. Longer rods generally correlate to stronger scattering and hence
more CE. To better understand this effect one needs to investigate other factors that
affect αs.
Figure 4.18: Change in CE versus the lenght of the NR's.
As mentioned in section 4.4.1, the scattering coefficient can be expressed as:
/s sc aC Lα ρ= × (4.19)
As shown in equation (4.19) rods density, ρa, is another important factor in defining
the scattering coefficient. Figure 4.19 shows the variation in ρa with respect to the
length of the ZnO NR’s. As shown in the figure, ρa decreases significantly with
increasing length of the ZnO NR’s. For nanorods with length about 2.2 µm, ρa was
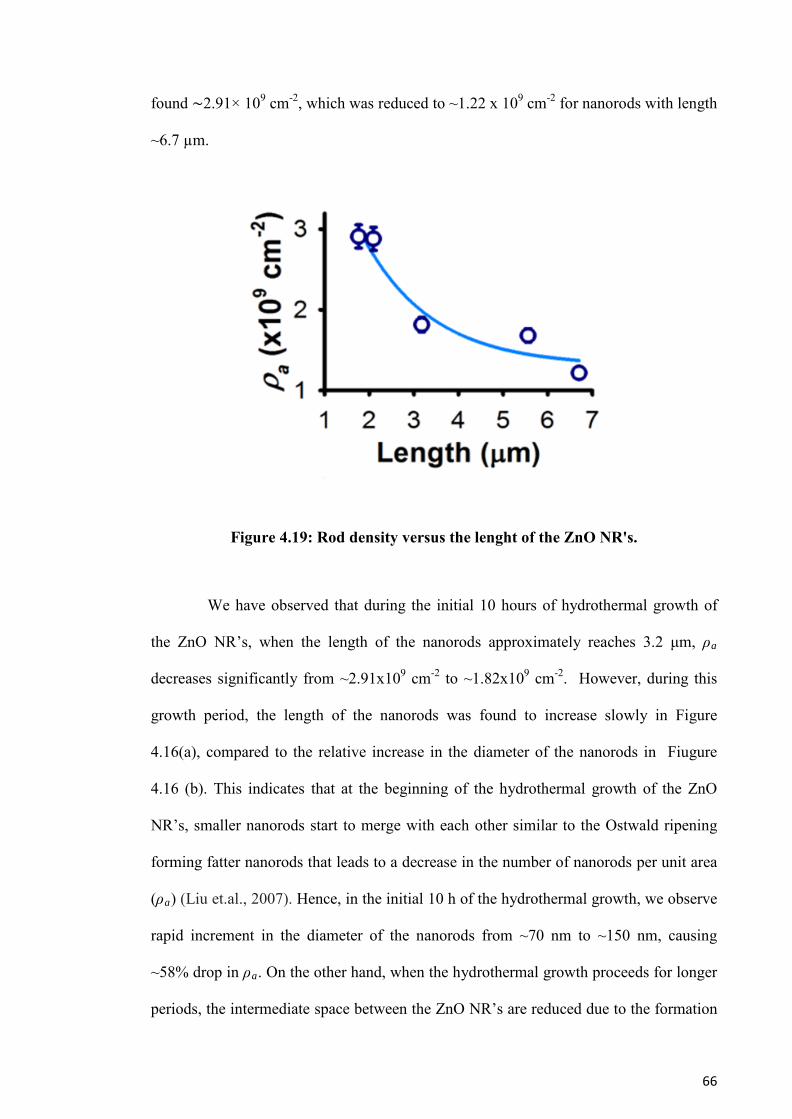
66
found ∼2.91× 109 cm-2, which was reduced to ~1.22 x 109 cm-2 for nanorods with length
~6.7 µm.
Figure 4.19: Rod density versus the lenght of the ZnO NR's.
We have observed that during the initial 10 hours of hydrothermal growth of
the ZnO NR’s, when the length of the nanorods approximately reaches 3.2 μm, ρa
decreases significantly from ~2.91x109 cm-2 to ~1.82x109 cm-2. However, during this
growth period, the length of the nanorods was found to increase slowly in Figure
4.16(a), compared to the relative increase in the diameter of the nanorods in Fiugure
4.16 (b). This indicates that at the beginning of the hydrothermal growth of the ZnO
NR’s, smaller nanorods start to merge with each other similar to the Ostwald ripening
forming fatter nanorods that leads to a decrease in the number of nanorods per unit area
(ρa) (Liu et.al., 2007). Hence, in the initial 10 h of the hydrothermal growth, we observe
rapid increment in the diameter of the nanorods from ~70 nm to ~150 nm, causing
~58% drop in ρa. On the other hand, when the hydrothermal growth proceeds for longer
periods, the intermediate space between the ZnO NR’s are reduced due to the formation
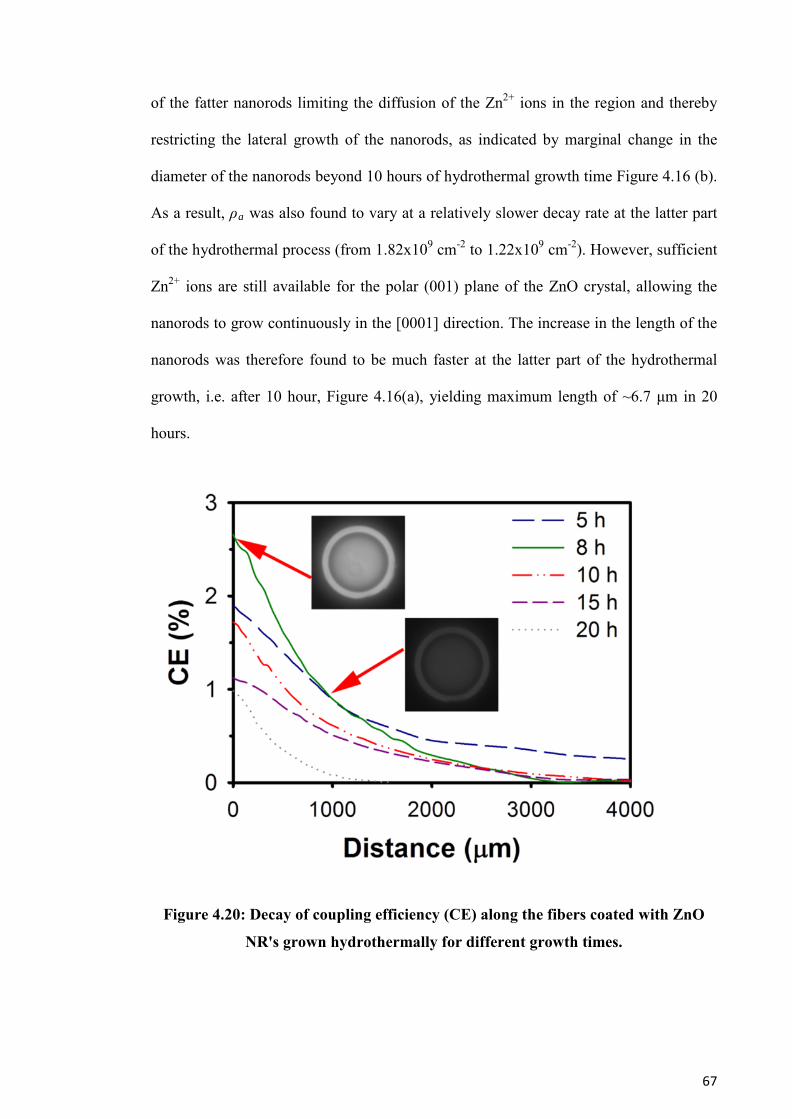
67
of the fatter nanorods limiting the diffusion of the Zn2+ ions in the region and thereby
restricting the lateral growth of the nanorods, as indicated by marginal change in the
diameter of the nanorods beyond 10 hours of hydrothermal growth time Figure 4.16 (b).
As a result, ρa was also found to vary at a relatively slower decay rate at the latter part
of the hydrothermal process (from 1.82x109 cm-2 to 1.22x109 cm-2). However, sufficient
Zn2+ ions are still available for the polar (001) plane of the ZnO crystal, allowing the
nanorods to grow continuously in the [0001] direction. The increase in the length of the
nanorods was therefore found to be much faster at the latter part of the hydrothermal
growth, i.e. after 10 hour, Figure 4.16(a), yielding maximum length of ~6.7 μm in 20
hours.
Figure 4.20: Decay of coupling efficiency (CE) along the fibers coated with ZnO
NR's grown hydrothermally for different growth times.
68
Figure 4.20 shows the CE of 1mM zinc acetate sample along the fiber coated
with ZnO NR’s of different lengths obtained by hydrothermal growth for different time
periods. In the experiment, the growth time varied from 5 to 20 hours. As shown in the
figure, the CE is exponentially decaying with the distance. The inset of Figure 4.20
shows the optical microscope images in the tip of a nanorods coated optical fiber at two
different distances, where the changes in the light intensity in the cladding mode can be
clearly visualized. It is found that the sample with 8 h growth time has the highest CE,
the optical images for this sample also proves this result. Hence, the 8 h growth time is
chosen to be the optimum time for hydrothermal growth of ZnO NR’s on the optical
fiber.
4.6 Summary
The present study demonstrates controlled light scattering and efficient light
coupling into the cladding mode of ZnO nanorod coated multimode silica fibers. The
concentration of the zinc acetate solution used for the ZnO seeding process prior to the
hydrothermal growth of the nanorods was found to play an important role in the light
scattering from the nanorods. At higher zinc acetate concentrations, typically more than
1 mM, the randomness in the nanorods directionality was observed to increase due to
the clustering of the seeds leading to higher multiple scattering and backscattering,
which finally resulted in more than 10% reduction in coupled light. The hydrothermal
growth time of the ZnO NR’s were also found to be as important in the light coupling
efficiency. Increase in the hydrothermal growth time from 5 to 20 h resulted in ZnO
NR’s with length from ∼1.7µm to ∼6.7 µm respectively, consequently improving the
scattering cross section (Csc) of the nanorods. However, the number of nanorods per
unit area (ρa) was observed to decrease almost exponentially from ∼2.91 × 109 cm−2to

69
∼1.22 × 109 cm−2 with increasing growth time. Since the coupling efficiency is directly
proportional to Csc and ρa, the competition between the scattering cross-section and
density of nanorods resulted in a maximum average coupling efficiency of ∼2.65% for
ZnO NR’s of length ∼2.2 µm obtained by hydrothermal growth for 8 h.
70
CHAPTER 5
EXCITATION OF CORE MODES THROUGH SIDE
COUPLING TO MULTIMODE OPTICAL FIBER BY ZINC
OXIDE NANORODS FOR WIDE ANGLE OPTICAL
RECEPTION
5.1 Introduction
In optical wireless communication (OWC), where free space optical link is used to
send information to single or multiple detectors, achieving high field of view (FOV) is
always a major challenge. In an idealistic link, the orientation of the detector should
have minimal effect on the quality of the received signal. Several approaches to improve
the signal have been reported, like the utilization of bulk lens system such as fish eye
lens system (Denget al., 2012) and the usage of hemispherical imaging receivers
(Wanget al., 2012) Both systems are bulky but provide a field of view up to 120°. The
response of the systems however degrades drastically at large angles. This drawback can
be solved using angle diversity approach (Carrutheret al., 2000; Jeong et al., 2001)
whereby FOV up to 180° can be achieved. This however requires precise arrangement
of multiple numbers of small FOV detectors. In another approach, a bundle of optical
fibers were used to improve the FOV of the optical detection system (Hahn et al., 2010),
however the detection angles were limited, compared to angle diversity.
Several schemes for free-space to optical fiber side coupling, such as utilizing 45°
mirror (Qiu et al., 2011) and using surface grating (Antelius et al., 2011) have been
presented in the literature. Though the coupling efficiency of those schemes are higher,
71
both are however limited to small field of view. For instance, the 45° mirror incident
angles are limited to incidence between 90° and 90°-θc, where θc is the critical angle.
This advantage of large angle collection in the proposed system makes it suitable for
large FOV optical detection in indoor OWC system applications. In indoor OWC
systems, the illuminating light is used as a source for transmitting information.
Typically, spot lights and LED light bulbs are fixed on the ceiling (average ceiling
height is 3 meters). That sets a requirement on the distance from the source to the
detector, which is generally a hand held device, to be within an approximate range of
1.5 meter. Also, as the detector is held or placed on a person who moves around
transmission zone, having a wide angle of detection becomes a necessity for such
applications (Ghassemlooy et al.,2013).
Optical communication systems typically require that the transmission link is not
affected by the environment to minimize the noise. Excitation to cladding modes, as it
was done in the previous chapter, does not satisfy this criteria. Cladding modes are very
sensitive to the change of the environment (e.g. thermal fluctuation and refractive index
change). This affect can only be minimized when core modes are excited. In this
chapter, side coupling to core modes through Zinc Oxide (ZnO) nanorods grown around
the fiber is demonstrated. The scheme utilizes wet etching to remove a cladding region
of part of the fiber followed by hydrothermal growth of the nanorods on both tapered
and untapered region. The combination of nanostructures and optical fiber system is
then used to demonstrate a simple wide FOV optical receiver. Core modes are excited
by the light scattered at the region where the fiber core is exposed. The performance of
the FOV optical receiver is investigated for both multimode silica and plastic optical
fiber system.
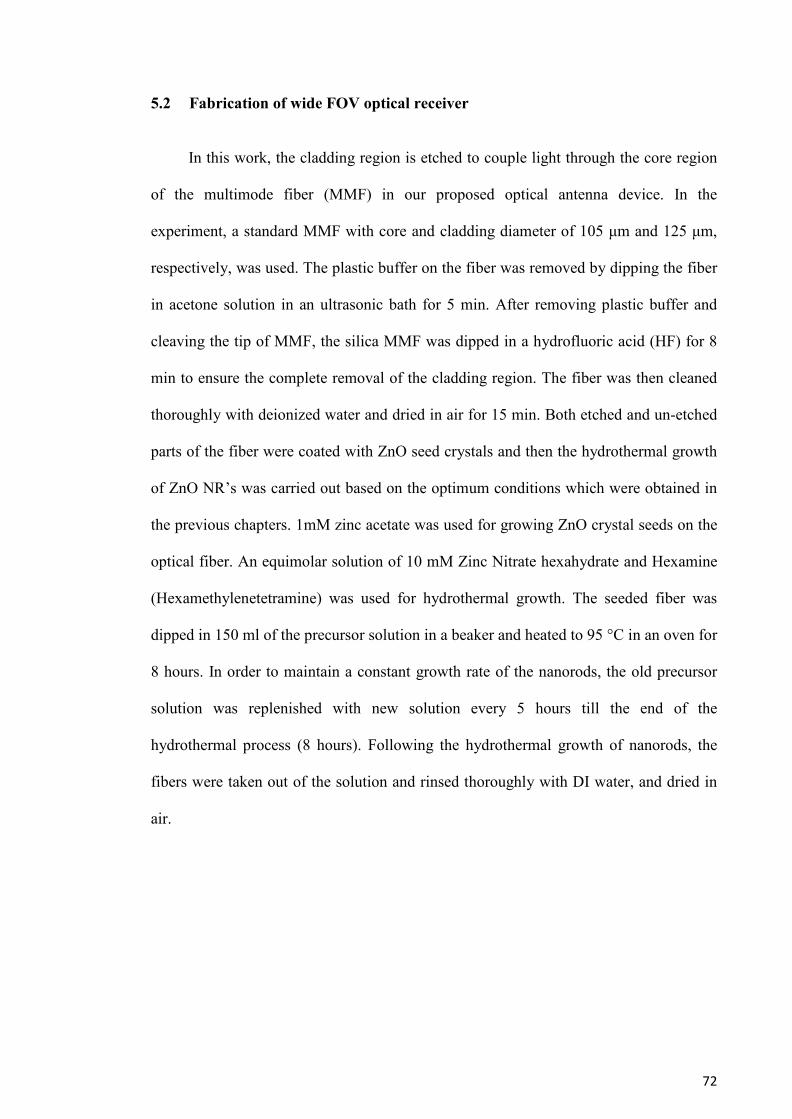
72
5.2 Fabrication of wide FOV optical receiver
In this work, the cladding region is etched to couple light through the core region
of the multimode fiber (MMF) in our proposed optical antenna device. In the
experiment, a standard MMF with core and cladding diameter of 105 μm and 125 μm,
respectively, was used. The plastic buffer on the fiber was removed by dipping the fiber
in acetone solution in an ultrasonic bath for 5 min. After removing plastic buffer and
cleaving the tip of MMF, the silica MMF was dipped in a hydrofluoric acid (HF) for 8
min to ensure the complete removal of the cladding region. The fiber was then cleaned
thoroughly with deionized water and dried in air for 15 min. Both etched and un-etched
parts of the fiber were coated with ZnO seed crystals and then the hydrothermal growth
of ZnO NR’s was carried out based on the optimum conditions which were obtained in
the previous chapters. 1mM zinc acetate was used for growing ZnO crystal seeds on the
optical fiber. An equimolar solution of 10 mM Zinc Nitrate hexahydrate and Hexamine
(Hexamethylenetetramine) was used for hydrothermal growth. The seeded fiber was
dipped in 150 ml of the precursor solution in a beaker and heated to 95 °C in an oven for
8 hours. In order to maintain a constant growth rate of the nanorods, the old precursor
solution was replenished with new solution every 5 hours till the end of the
hydrothermal process (8 hours). Following the hydrothermal growth of nanorods, the
fibers were taken out of the solution and rinsed thoroughly with DI water, and dried in
air.
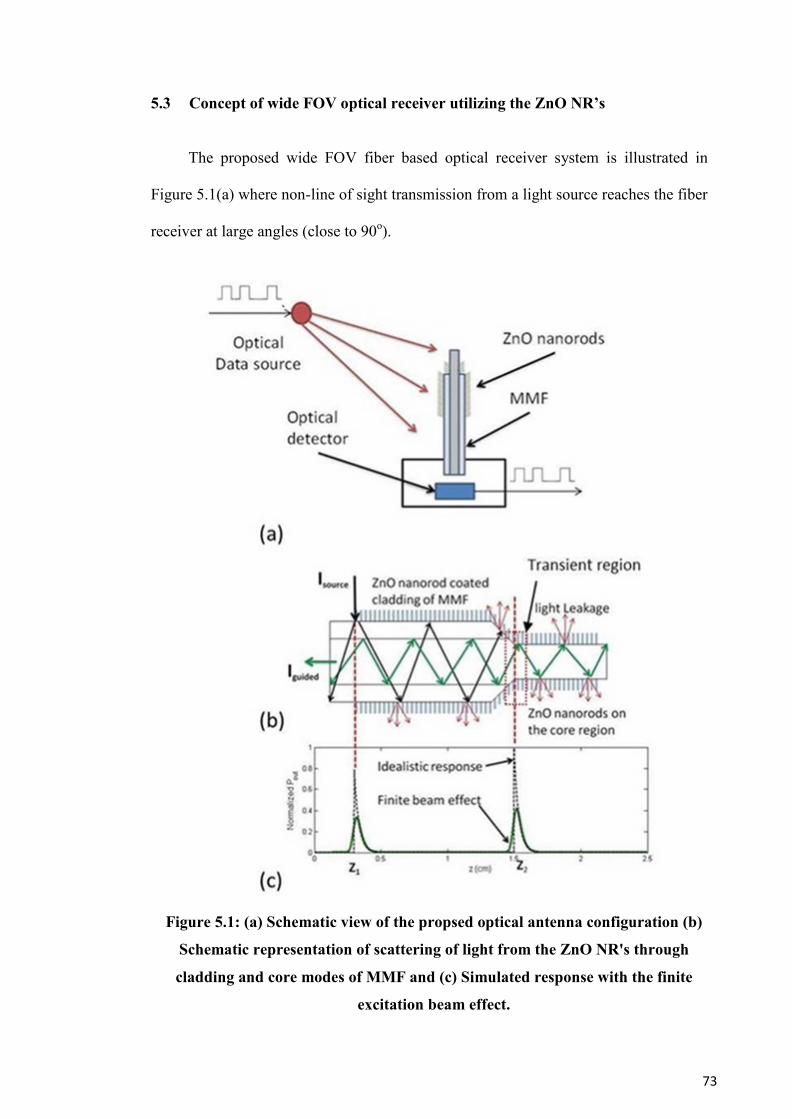
73
5.3 Concept of wide FOV optical receiver utilizing the ZnO NR’s
The proposed wide FOV fiber based optical receiver system is illustrated in
Figure 5.1(a) where non-line of sight transmission from a light source reaches the fiber
receiver at large angles (close to 90o).
Figure 5.1: (a) Schematic view of the propsed optical antenna configuration (b)
Schematic representation of scattering of light from the ZnO NR's through
cladding and core modes of MMF and (c) Simulated response with the finite
excitation beam effect.
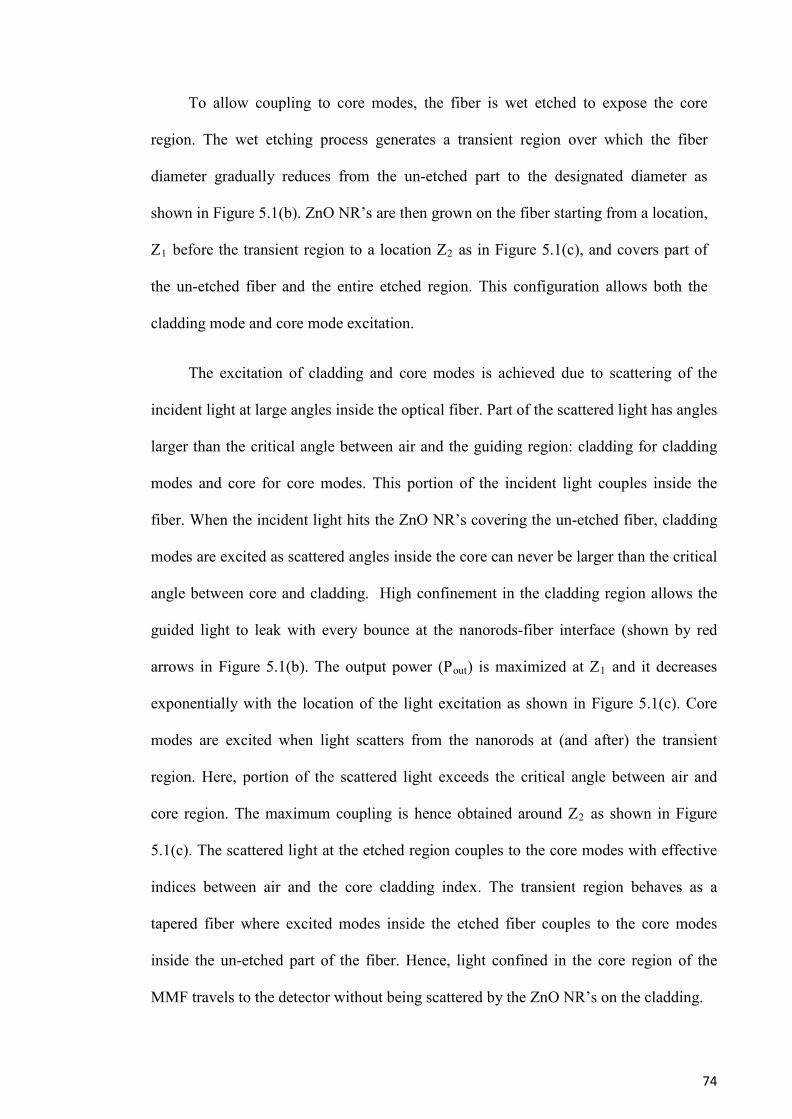
74
To allow coupling to core modes, the fiber is wet etched to expose the core
region. The wet etching process generates a transient region over which the fiber
diameter gradually reduces from the un-etched part to the designated diameter as
shown in Figure 5.1(b). ZnO NR’s are then grown on the fiber starting from a location,
Z1 before the transient region to a location Z2 as in Figure 5.1(c), and covers part of
the un-etched fiber and the entire etched region. This configuration allows both the
cladding mode and core mode excitation.
The excitation of cladding and core modes is achieved due to scattering of the
incident light at large angles inside the optical fiber. Part of the scattered light has angles
larger than the critical angle between air and the guiding region: cladding for cladding
modes and core for core modes. This portion of the incident light couples inside the
fiber. When the incident light hits the ZnO NR’s covering the un-etched fiber, cladding
modes are excited as scattered angles inside the core can never be larger than the critical
angle between core and cladding. High confinement in the cladding region allows the
guided light to leak with every bounce at the nanorods-fiber interface (shown by red
arrows in Figure 5.1(b). The output power (Pout) is maximized at Z1 and it decreases
exponentially with the location of the light excitation as shown in Figure 5.1(c). Core
modes are excited when light scatters from the nanorods at (and after) the transient
region. Here, portion of the scattered light exceeds the critical angle between air and
core region. The maximum coupling is hence obtained around Z2 as shown in Figure
5.1(c). The scattered light at the etched region couples to the core modes with effective
indices between air and the core cladding index. The transient region behaves as a
tapered fiber where excited modes inside the etched fiber couples to the core modes
inside the un-etched part of the fiber. Hence, light confined in the core region of the
MMF travels to the detector without being scattered by the ZnO NR’s on the cladding.
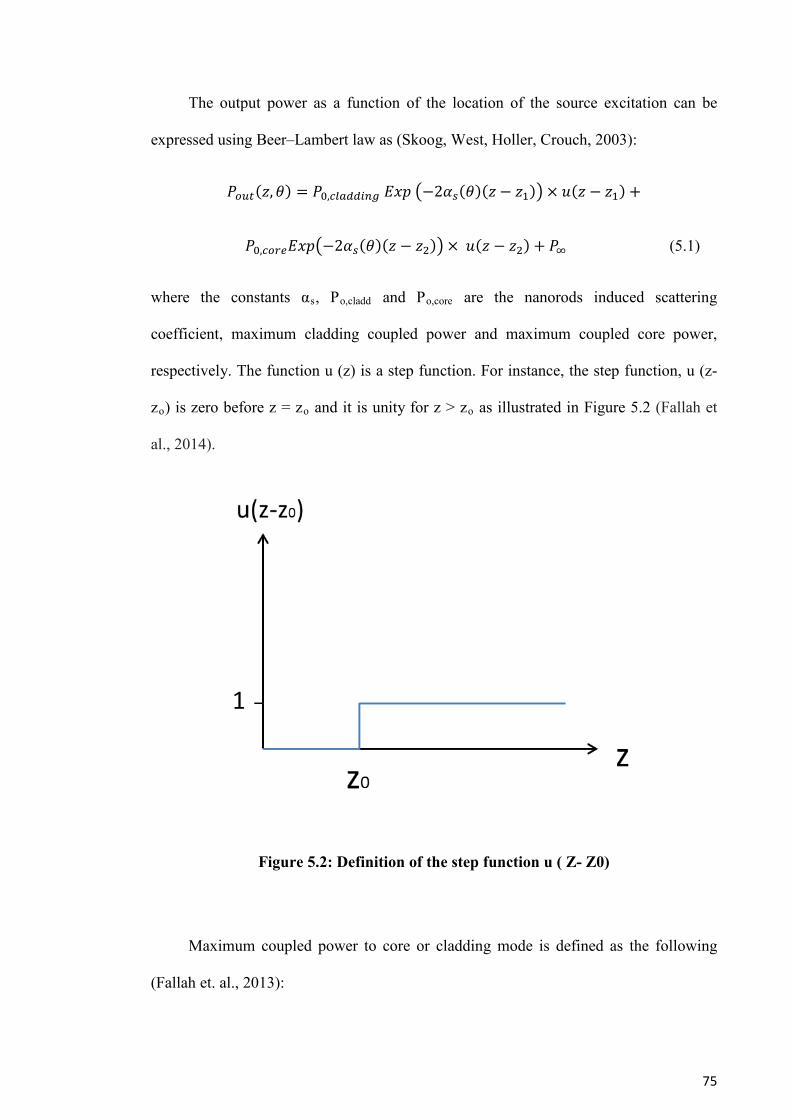
75
The output power as a function of the location of the source excitation can be
expressed using Beer–Lambert law as (Skoog, West, Holler, Crouch, 2003):
𝑃𝑜𝑢𝑡(𝑧,𝜃) = 𝑃0,𝑐𝑙𝑎𝑑𝑑𝑖𝑛𝑔 𝐸𝑥𝑝 �−2𝛼𝑠(𝜃)(𝑧 − 𝑧1)� × 𝑢(𝑧 − 𝑧1) +
𝑃0,𝑐𝑜𝑟𝑒𝐸𝑥𝑝�−2𝛼𝑠(𝜃)(𝑧 − 𝑧2)� × 𝑢(𝑧 − 𝑧2) + 𝑃∞ (5.1)
where the constants αs, Po,cladd and Po,core are the nanorods induced scattering
coefficient, maximum cladding coupled power and maximum coupled core power,
respectively. The function u (z) is a step function. For instance, the step function, u (z-
zo) is zero before z = zo and it is unity for z > zo as illustrated in Figure 5.2 (Fallah et
al., 2014).
Figure 5.2: Definition of the step function u ( Z- Z0)
Maximum coupled power to core or cladding mode is defined as the following
(Fallah et. al., 2013):
76
𝑃0 = 2𝜋𝑃𝑠𝑜𝑢𝑟𝑐𝑒𝐶𝑠𝑐𝜌𝑎 ∫ 𝑃𝜋𝜃𝑐
( 𝜃 − 𝜃𝑖𝑛𝑐)𝑆𝑖𝑛𝜃𝑑𝜃 (5.2)
Where Psource, Csc, αa and p are the source power, scattering cross section of one
nanorod, density of nanorods per unit area and the phase function, respectively. The
coefficient P∞ is the background power and θinc is the angle of incidence of the source
light. The scattering constant ∝s can be defined as:
𝑎𝑠 = 𝐶𝑠𝑐𝜌𝑎/𝐿𝑟𝑜𝑑 (5.3)
WhereLrodis the average length of one rod. In this simplified model, the difference
between the core and cladding excitation is due to different critical angle between air-
core interface and air-cladding interface. The core has higher refractive index and hence
the critical angle (θc) is smaller than the cladding. According to equation(5.2), higher
maximum power is expected for core excitation compared to cladding. This concept is
depicted (dashed line plot) in Figure 5.1(c) where two exponential peaks are predicted at
both locations Z1 and Z2 when scanning the excitation light along the side of the fiber.
It is important to mention here that the relation in equation (5.2) is based on the
approximation that the MMF has a large number of modes such that any scattering angle
larger than the critical angle is coupled back into the fiber cladding or core modes. This
however can lead to error in the estimation since etched fiber results in smaller fiber
diameter where less number of modes would be available. That could reduce the
coupling efficiency.
5.3.1 Finite beam effect
The expression in equation (5.1) assumes that the incident light propagates in a
form of Dirac-delta function (Luckhurst &Veracin,1989). In practice, light sources have
77
always a finite beam width and hence the equation needs to be modified to take this
effect in consideration. Collimated light incident on the fiber can be assumed to be
Gaussian with a finite beam waist of σ (Ding, & Liu, 1999)which causes the peaks to
broaden. Mathematically, peak broadening can be represented as a convolution between
a Gaussian beam and the expression in equation (5.1). Using this assumption, the total
output power can then be expressed as:
𝑃𝑜𝑢𝑡(𝑧,𝜃) = 𝑃1 + 𝑃2 + 𝑃∞ (5.4)
In equation (5.4), P1, P2 and P∞ are the coupled power to the cladding, core and
background respectively. This power can be expressed by a convolution between the
finite beam effect and the ideal exponential decay:
𝑃𝑖(𝑧) = 𝑃�𝑖(𝑧) ⊛ℎ(𝑧), 𝑖 = 1,2 (5.5)
The ideal response, 𝑃�𝒊, is defined for cladding and core regions as:
𝑃�1 = 𝑃0,𝑐𝑎𝑙𝑑𝑑𝑖𝑛𝑔 . 𝑒−2𝛼𝑠(𝑧 − 𝑧1) × 𝑢(𝑧 − 𝑧1) (5.6)
𝑃�2 = 𝑃0,𝑐𝑜𝑟𝑒 . 𝑒−2𝛼𝑠(𝑧 − 𝑧2) × 𝑢 (𝑧 − 𝑧2 ) (5.7)
Where Po,1=Po,cladd and Po,2= Po,core. The finite beam is assumed to be Gaussian and
hence the finite response function, h(z), can be expressed as:
ℎ(𝑧) =1
𝜎√𝜋𝑒−𝑧2
𝜎2
Using the definition of convolution, the power coupled to the cladding is defined as:
𝑃1(𝑧) = ∫ 𝑃�1 . 𝑒−(𝑧−𝑧,)2
𝜎2∞−∞ . 𝑑𝑧 , (5.8)
Using the expression in section 5.6 equation(5.8) can be written as:

78
𝑃1(𝑧) = 1𝜎√𝜋
𝑃0,𝑐𝑙𝑎𝑑𝑑𝑖𝑛𝑔 ∫ 𝑒−2𝛼𝑠(𝑧 ,−𝑧1). 𝑒−(𝑧−𝑧,) 2
𝜎2∞𝑍1
.𝑑𝑧 , (5.9)
𝑃1(𝑧) = 1
𝜎√𝜋𝑃0𝑐𝑎𝑙𝑑𝑑𝑖𝑛𝑔 . 𝑒2𝛼𝑠𝑧1 � 𝑒−2𝛼𝑠𝑧 , . 𝑒−(𝑧2−2𝑧𝑧,+𝑧,2 )/𝜎2
∞
𝑧1 .𝑑𝑧 ,
Taking the terms which are not function of z’outside the integration sign:
𝑃1(𝑧) = 1𝜎√𝜋
𝑃0𝑐𝑙𝑎𝑑𝑑𝑖𝑛𝑔 . 𝑒−2𝛼𝑠𝑧1 . 𝑒−�𝑧𝜎 �
2
∫ 𝑒−2(𝛼𝑠 −𝑧𝜎2
)𝑧 ,∞𝑧1
𝑒−�𝑧,
𝜎 �2
.𝑑𝑧 , (5.10)
The exponent of the first term under the integration can be re-arranged as:
𝑃1(𝑧) = 1𝜎√𝜋
𝑃0𝑐𝑙𝑎𝑑𝑑𝑖𝑛𝑔 . 𝑒−2𝛼𝑠𝑧1 . 𝑒−�𝑧𝜎 �
2
∫ 𝑒−2𝑧,
𝜎�𝜎𝛼𝑠−𝑧𝜎� . 𝑒−�
𝑧,
𝜎 �2
. 𝑑𝑧 ,∞𝑧1
(5.11)
From Eq5.6, one can define a new term
𝛾 = 𝑧𝜎− 𝜎𝛼𝑠 (5.12)
Using the definition in the equation above equation (5.11) is reduced to:
𝑃1(𝑧) = 1𝜎√𝜋
𝑃0𝑐𝑙𝑎𝑑𝑑𝑖𝑛𝑔 . 𝑒−2𝛼𝑠𝑧1 . 𝑒−�𝑧𝜎 �
2
.∫ 𝑒2𝑧,
𝜎 .𝛾 ∞𝑧1
. 𝑒−𝑧2
𝜎2 .𝑑𝑧 , (5.13)
Completing the square for the exponents in the terms inside the integration, the above
equation can be re-written as:
𝑃1(𝑧) = 1𝜎√𝜋
𝑃0𝑐𝑙𝑎𝑑𝑑𝑖𝑛𝑔 . 𝑒−2𝛼𝑠𝑧1 . 𝑒−�𝑧𝜎 �
2
.∫ 𝑒( �𝑧,
𝜎�−2𝛾 .�𝑧,
𝜎�+𝛾2−𝛾2)∞
𝑧1.𝑑𝑧 , (5.14)
This can be further reduced to:
𝑃1(𝑧) = 1√𝜋𝜎
𝑃0𝑐𝑙𝑎𝑑𝑑𝑖𝑛𝑔 . 𝑒2𝛼𝑠𝑧1 . 𝑒−𝑧,
𝜎2 . 𝑒𝛾2 ∫ 𝑒−(𝑧,
𝜎−𝛾)2 𝑑𝑧 , (5.15)

79
The integration in equation (5.8) can be solved by considering the definition of the
complementary error function:
𝑒𝑟𝑓𝑐 (𝑧) = 2√𝜋∫ 𝑒−𝑡2∞𝑡1
𝑑𝑡 (5.16)
The integration term
∫ 𝑒−(𝑧,
𝜎−𝛾)2∞𝑡1
𝑑𝑧 , (5.17)
Can be re-arranged by defining the following:
𝑡 = 𝑧,
𝜎− 𝛾 (5.18)
𝑑𝑡 = 𝑑𝑧,
𝜎 (5.19)
𝑡1 = 𝑧1𝜎− 𝛾 (5.20)
These results in
𝑧√𝜋∫ 𝑒−𝑡2∞𝑡1
𝑑𝑡 × 𝜎 × √𝜋2
(5.21)
Hence,
∫ 𝑒−(𝑧,
𝜎−𝛾)2∞𝑡1
𝑑𝑧 , = 𝜎√𝜋2
. 𝑒𝑟𝑓𝑐 (𝑧1𝜎− 𝛾) (5.22)
Using the result in equation (5.8), the expression for the power in the cladding region
can be written as:
𝑃1 = 𝑃0𝑐𝑙𝑎𝑑𝑑𝑖𝑛𝑔 𝜎√𝜋2
. 1𝜎√𝜋
. 𝑒𝑟𝑓𝑐 �𝑧1𝜎− 𝛾 � . 𝑒−𝛾2𝑒−�
𝑧𝜎 �
2
. 𝑒2𝛼𝑠 𝑧1 (5.23)
Which is further reduced to:
𝑃1 = 12𝑃0𝑐𝑙𝑎𝑑𝑑𝑖𝑛𝑔 𝑒
−𝑧2
𝜎2 . 𝑒2𝛼𝑠 𝑧1 . 𝑒(𝑧𝜎−𝛼𝑠𝜎)2 𝑒𝑟𝑓𝑐 �𝑧1𝜎− 𝛾 � (5.24)
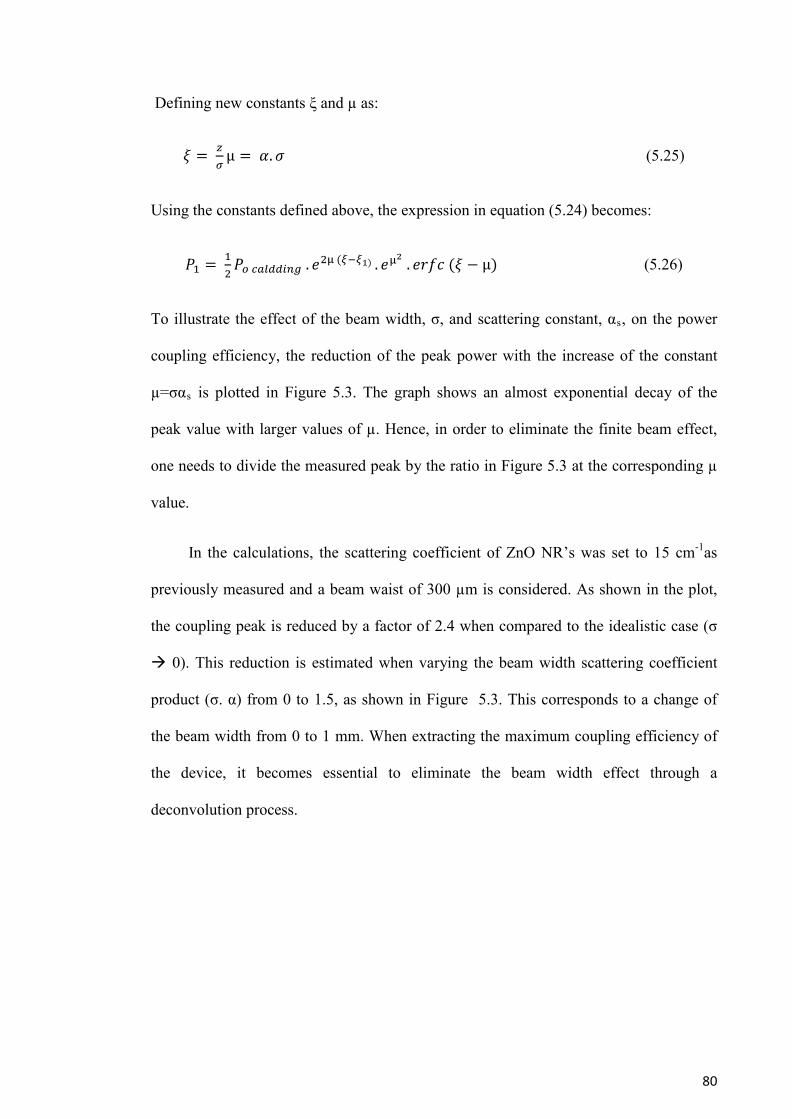
80
Defining new constants ξ and µ as:
𝜉 = 𝑧𝜎µ = 𝛼.𝜎 (5.25)
Using the constants defined above, the expression in equation (5.24) becomes:
𝑃1 = 12𝑃𝑜 𝑐𝑎𝑙𝑑𝑑𝑖𝑛𝑔 . 𝑒2µ (𝜉−𝜉1) . 𝑒µ2 . 𝑒𝑟𝑓𝑐 (𝜉 − µ) (5.26)
To illustrate the effect of the beam width, σ, and scattering constant, αs, on the power
coupling efficiency, the reduction of the peak power with the increase of the constant
µ=σαs is plotted in Figure 5.3. The graph shows an almost exponential decay of the
peak value with larger values of µ. Hence, in order to eliminate the finite beam effect,
one needs to divide the measured peak by the ratio in Figure 5.3 at the corresponding µ
value.
In the calculations, the scattering coefficient of ZnO NR’s was set to 15 cm-1as
previously measured and a beam waist of 300 µm is considered. As shown in the plot,
the coupling peak is reduced by a factor of 2.4 when compared to the idealistic case (σ
0). This reduction is estimated when varying the beam width scattering coefficient
product (σ. α) from 0 to 1.5, as shown in Figure 5.3. This corresponds to a change of
the beam width from 0 to 1 mm. When extracting the maximum coupling efficiency of
the device, it becomes essential to eliminate the beam width effect through a
deconvolution process.
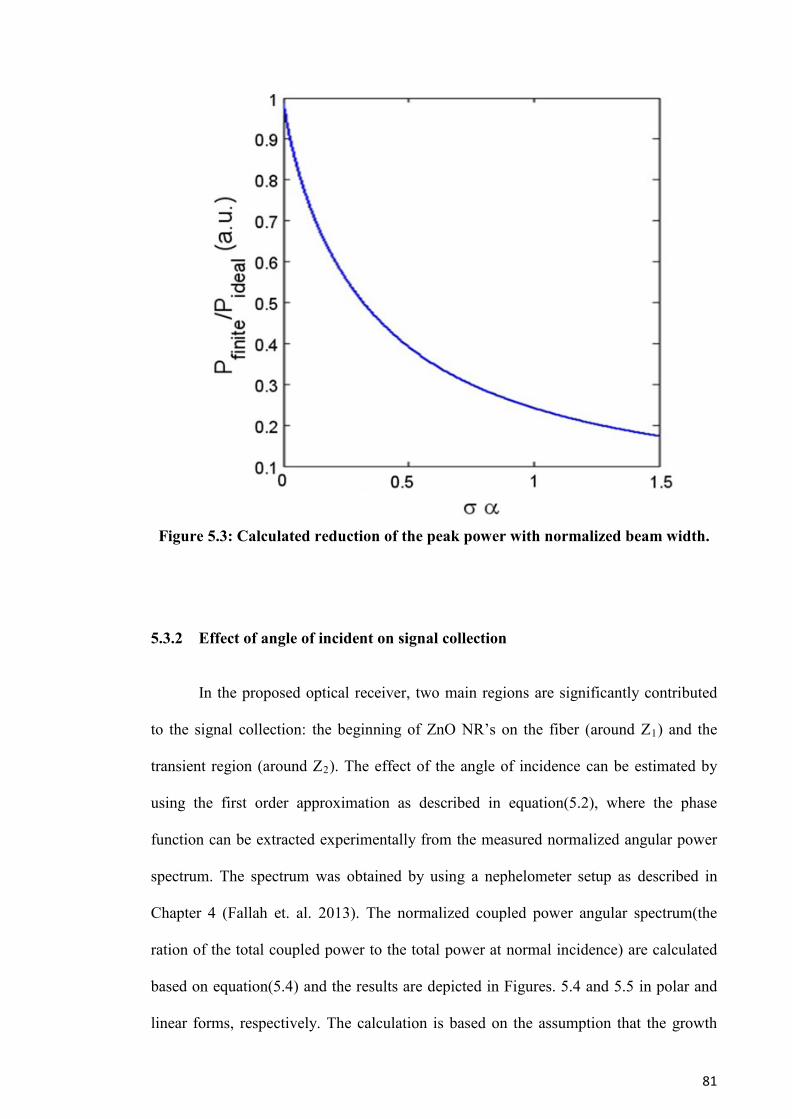
81
Figure 5.3: Calculated reduction of the peak power with normalized beam width.
5.3.2 Effect of angle of incident on signal collection
In the proposed optical receiver, two main regions are significantly contributed
to the signal collection: the beginning of ZnO NR’s on the fiber (around Z1) and the
transient region (around Z2). The effect of the angle of incidence can be estimated by
using the first order approximation as described in equation(5.2), where the phase
function can be extracted experimentally from the measured normalized angular power
spectrum. The spectrum was obtained by using a nephelometer setup as described in
Chapter 4 (Fallah et. al. 2013). The normalized coupled power angular spectrum(the
ration of the total coupled power to the total power at normal incidence) are calculated
based on equation(5.4) and the results are depicted in Figures. 5.4 and 5.5 in polar and
linear forms, respectively. The calculation is based on the assumption that the growth
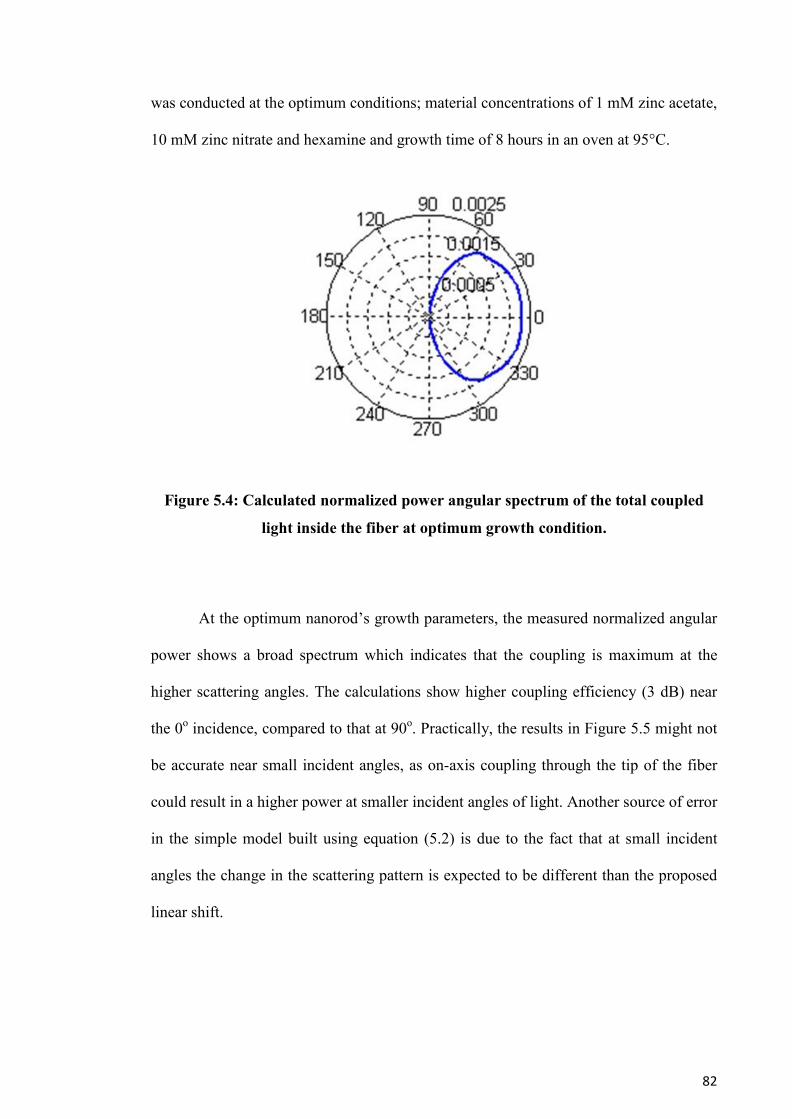
82
was conducted at the optimum conditions; material concentrations of 1 mM zinc acetate,
10 mM zinc nitrate and hexamine and growth time of 8 hours in an oven at 95°C.
Figure 5.4: Calculated normalized power angular spectrum of the total coupled
light inside the fiber at optimum growth condition.
At the optimum nanorod’s growth parameters, the measured normalized angular
power shows a broad spectrum which indicates that the coupling is maximum at the
higher scattering angles. The calculations show higher coupling efficiency (3 dB) near
the 0o incidence, compared to that at 90o. Practically, the results in Figure 5.5 might not
be accurate near small incident angles, as on-axis coupling through the tip of the fiber
could result in a higher power at smaller incident angles of light. Another source of error
in the simple model built using equation (5.2) is due to the fact that at small incident
angles the change in the scattering pattern is expected to be different than the proposed
linear shift.
83
Figure 5.5: Calculated change of the coupled power with incident angle.
To realize the proposed wide FOV optical receiver, the optimum parameters
obtained from previous chapter (section 4.5) was used to examine the excitation of core
modes through hydrothermal growth of ZnO NR’s on optical fiber. Core mode
excitation is realized through the optimization of the removal of the cladding region
(and part of the core) to allow the scattered light to guide into the core region to achieve
maximum coupling efficiency. The following sections describe the optical
characterization of the proposed antenna.
5.4 Optical characterization of the proposed wide FOV receiver on MMF
To characterize the fabricated samples, the coupling power as a function of the
incident location was first investigated by scanning a fiber coupled laser source along
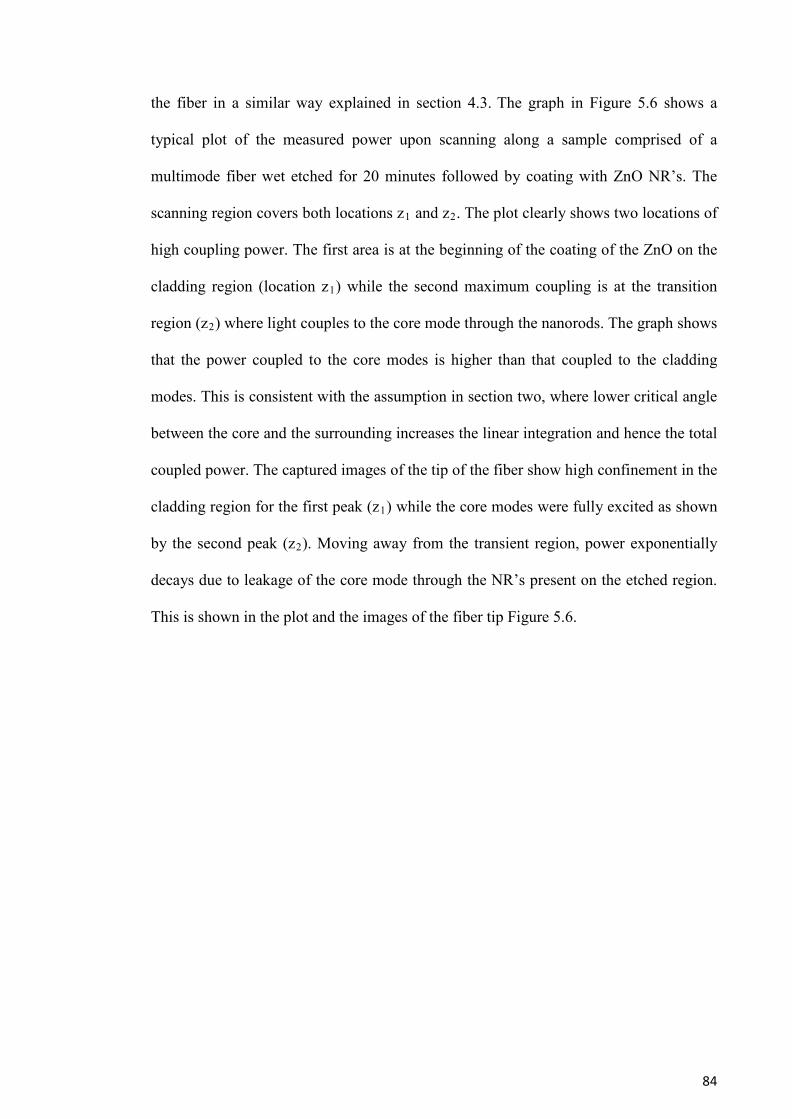
84
the fiber in a similar way explained in section 4.3. The graph in Figure 5.6 shows a
typical plot of the measured power upon scanning along a sample comprised of a
multimode fiber wet etched for 20 minutes followed by coating with ZnO NR’s. The
scanning region covers both locations z1 and z2. The plot clearly shows two locations of
high coupling power. The first area is at the beginning of the coating of the ZnO on the
cladding region (location z1) while the second maximum coupling is at the transition
region (z2) where light couples to the core mode through the nanorods. The graph shows
that the power coupled to the core modes is higher than that coupled to the cladding
modes. This is consistent with the assumption in section two, where lower critical angle
between the core and the surrounding increases the linear integration and hence the total
coupled power. The captured images of the tip of the fiber show high confinement in the
cladding region for the first peak (z1) while the core modes were fully excited as shown
by the second peak (z2). Moving away from the transient region, power exponentially
decays due to leakage of the core mode through the NR’s present on the etched region.
This is shown in the plot and the images of the fiber tip Figure 5.6.
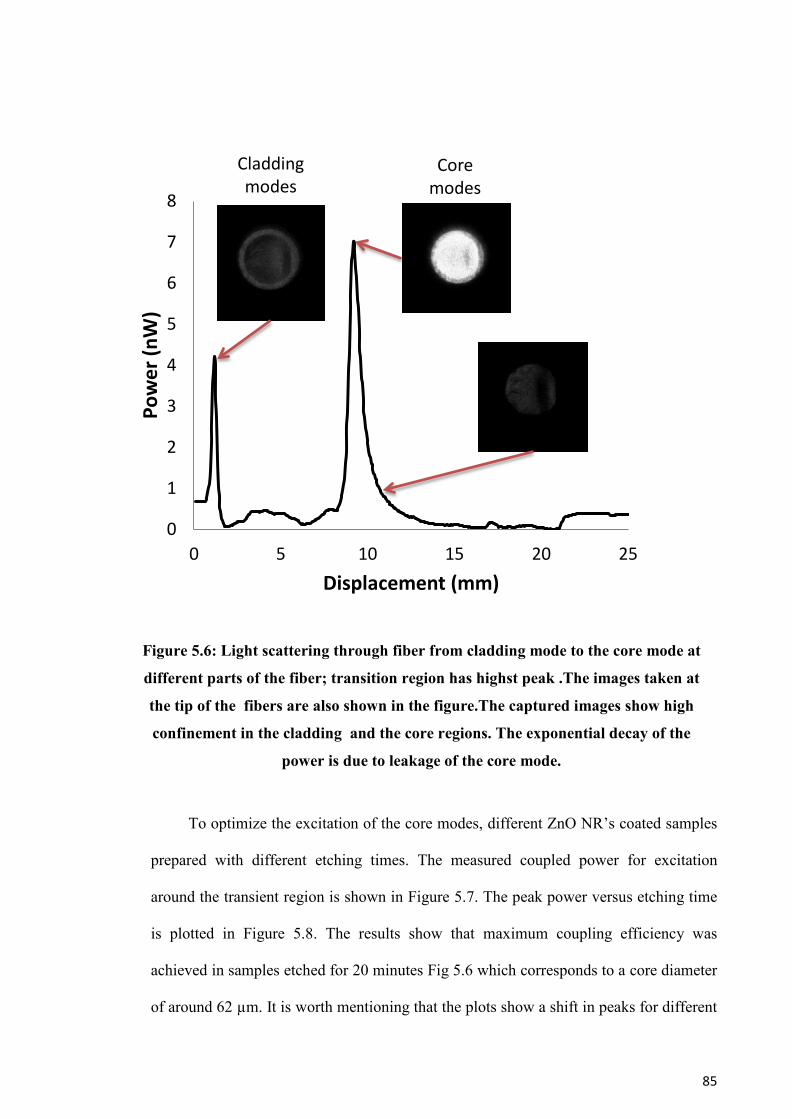
85
To optimize the excitation of the core modes, different ZnO NR’s coated samples
prepared with different etching times. The measured coupled power for excitation
around the transient region is shown in Figure 5.7. The peak power versus etching time
is plotted in Figure 5.8. The results show that maximum coupling efficiency was
achieved in samples etched for 20 minutes Fig 5.6 which corresponds to a core diameter
of around 62 µm. It is worth mentioning that the plots show a shift in peaks for different
0
1
2
3
4
5
6
7
8
0 5 10 15 20 25
Pow
er (n
W)
Displacement (mm)
Cladding modes
Coremodes
Figure 5.6: Light scattering through fiber from cladding mode to the core mode at
different parts of the fiber; transition region has highst peak .The images taken at
the tip of the fibers are also shown in the figure.The captured images show high
confinement in the cladding and the core regions. The exponential decay of the
power is due to leakage of the core mode.
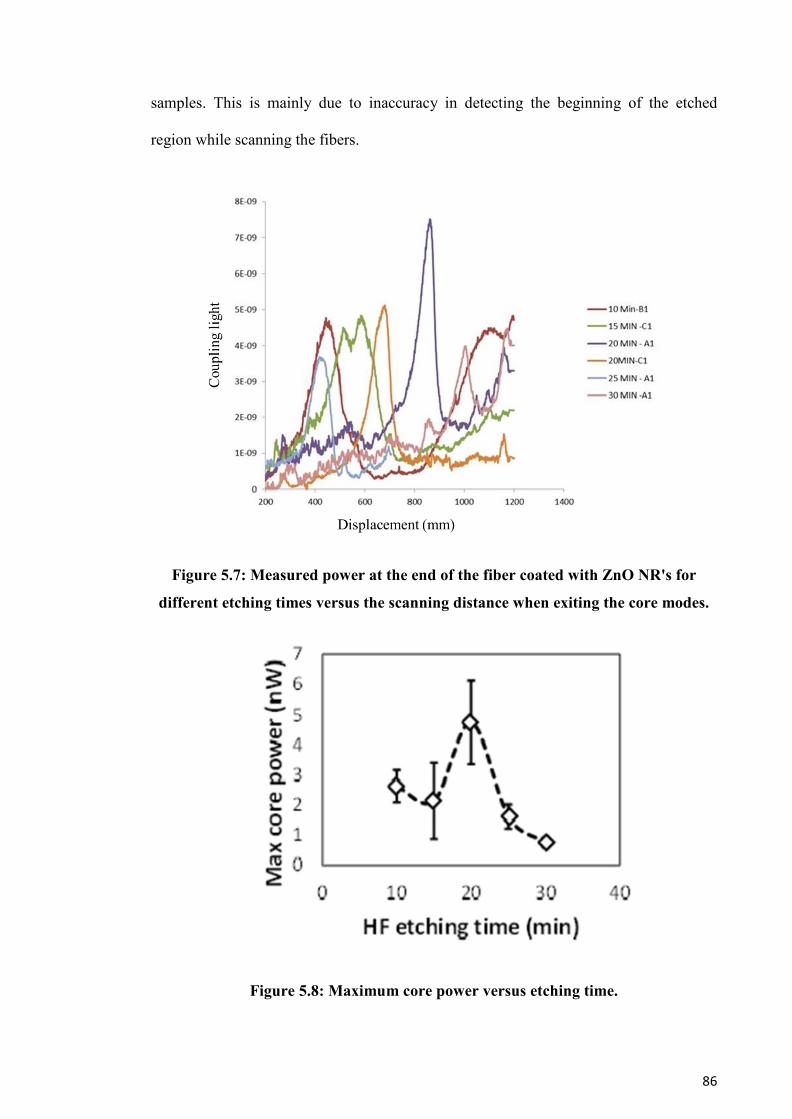
86
samples. This is mainly due to inaccuracy in detecting the beginning of the etched
region while scanning the fibers.
Figure 5.7: Measured power at the end of the fiber coated with ZnO NR's for
different etching times versus the scanning distance when exiting the core modes.
Figure 5.8: Maximum core power versus etching time.
87
In these measurements, a fiber coupled laser source with output power of 11 µW was
used and the output of the fiber was not collimated. That resulted in a finite beam of
approximately 540 µm diameter (a value of α σ around 0.78) incident on the fiber
sample. Hence, the portion of the light that excites the coupling to core and cladding
modes can be expressed as:
𝑃𝑠𝑜𝑢𝑟𝑐 = 𝑃𝐿𝑎𝑠𝑒𝑟12
𝑒𝑟𝑓(𝑟 𝜎⁄ ) (5.27)
Where r is the radius of the fiber.
From equation (5.4), the incident source power can be estimated to be around 0.61 µW.
The idealistic coupling efficiency of the device is estimated by dividing the peak power
in Figure 5.5 to the source power multiplied by the corresponding ratio from Figure 5.3
in order to eliminate the finite beam effect, as expressed in the following equation:.
Ƞ𝑖𝑑𝑒𝑎𝑙 = 𝑃𝑝𝑒𝑎𝑘
𝑃𝑠𝑜𝑢𝑟𝑐𝑒 ×(𝑃𝑓𝑖𝑛𝑖𝑡𝑒𝑃𝑖𝑑𝑒𝑎𝑙
) (5.28)
Using equation (5.6), the ideal coupling efficiency (when the incident beam waist
reaches zero) is 4.7%. Similarly, the coupling efficiency to the cladding mode is 2.7%.
This is in agreement with the previously reported value of 5% total coupling considering
both directions of propagation inside the fiber ( Fallah et al ., 2013).
It is worth mentioning that in order to ensure the proper alignment of the source
parallel to the fiber, the magnified image formed by the divergence of the laser beam
was observed on a screen placed at a distance of 6 cm away from the fiber groove. This
provides a total magnification factor of 6.5. This image was used to ensure that the fiber
is always centered with the laser beam through a rotation stage which holds the fiber
sample. The light source was aligned along the center of rotation of the stage.
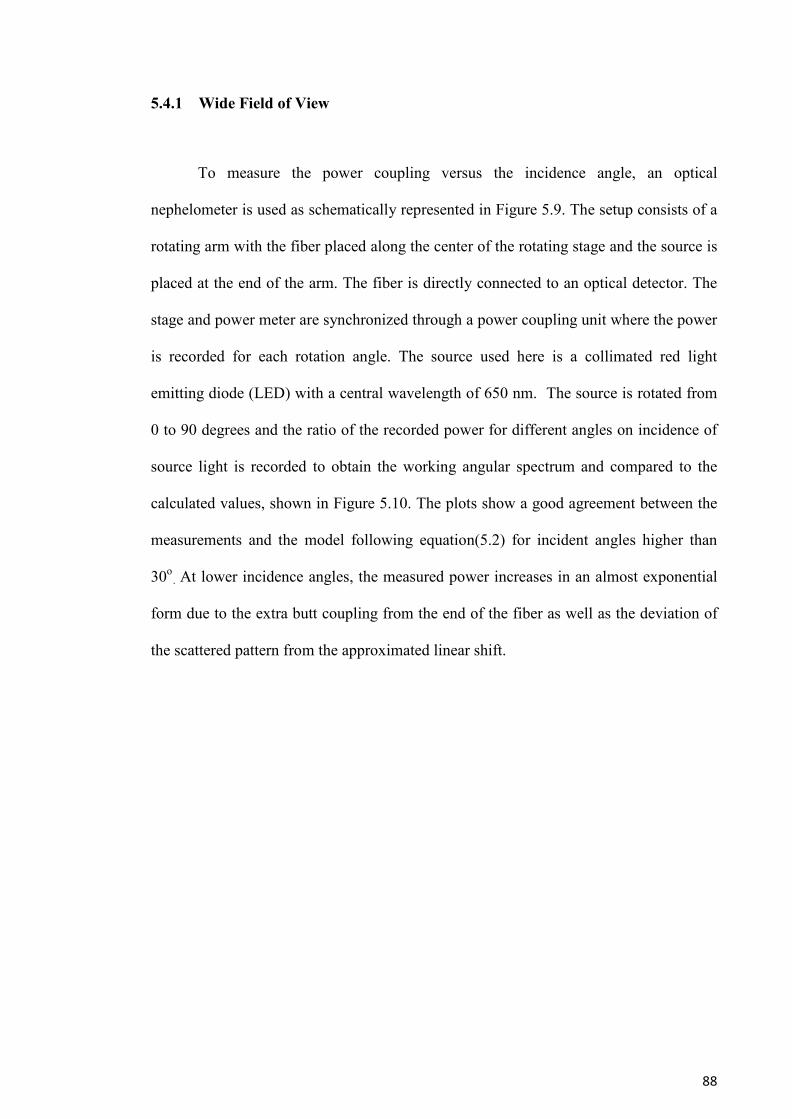
88
5.4.1 Wide Field of View
To measure the power coupling versus the incidence angle, an optical
nephelometer is used as schematically represented in Figure 5.9. The setup consists of a
rotating arm with the fiber placed along the center of the rotating stage and the source is
placed at the end of the arm. The fiber is directly connected to an optical detector. The
stage and power meter are synchronized through a power coupling unit where the power
is recorded for each rotation angle. The source used here is a collimated red light
emitting diode (LED) with a central wavelength of 650 nm. The source is rotated from
0 to 90 degrees and the ratio of the recorded power for different angles on incidence of
source light is recorded to obtain the working angular spectrum and compared to the
calculated values, shown in Figure 5.10. The plots show a good agreement between the
measurements and the model following equation(5.2) for incident angles higher than
30o. At lower incidence angles, the measured power increases in an almost exponential
form due to the extra butt coupling from the end of the fiber as well as the deviation of
the scattered pattern from the approximated linear shift.
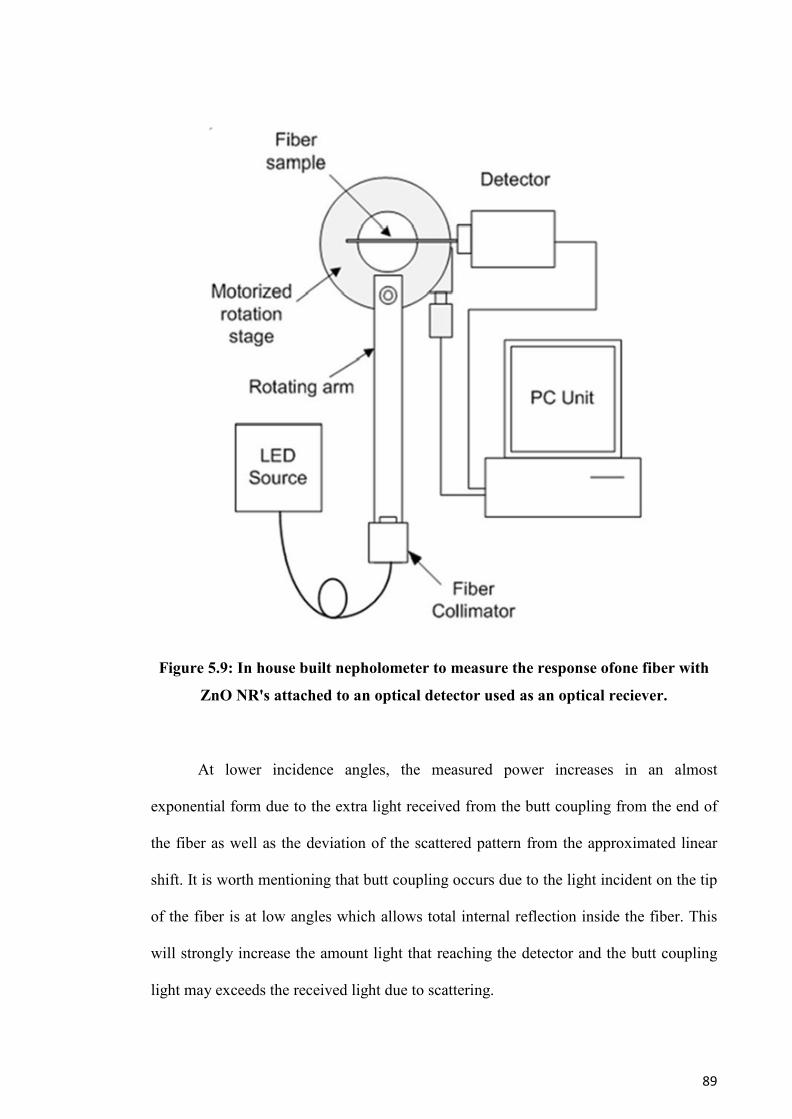
89
Figure 5.9: In house built nepholometer to measure the response ofone fiber with
ZnO NR's attached to an optical detector used as an optical reciever.
At lower incidence angles, the measured power increases in an almost
exponential form due to the extra light received from the butt coupling from the end of
the fiber as well as the deviation of the scattered pattern from the approximated linear
shift. It is worth mentioning that butt coupling occurs due to the light incident on the tip
of the fiber is at low angles which allows total internal reflection inside the fiber. This
will strongly increase the amount light that reaching the detector and the butt coupling
light may exceeds the received light due to scattering.
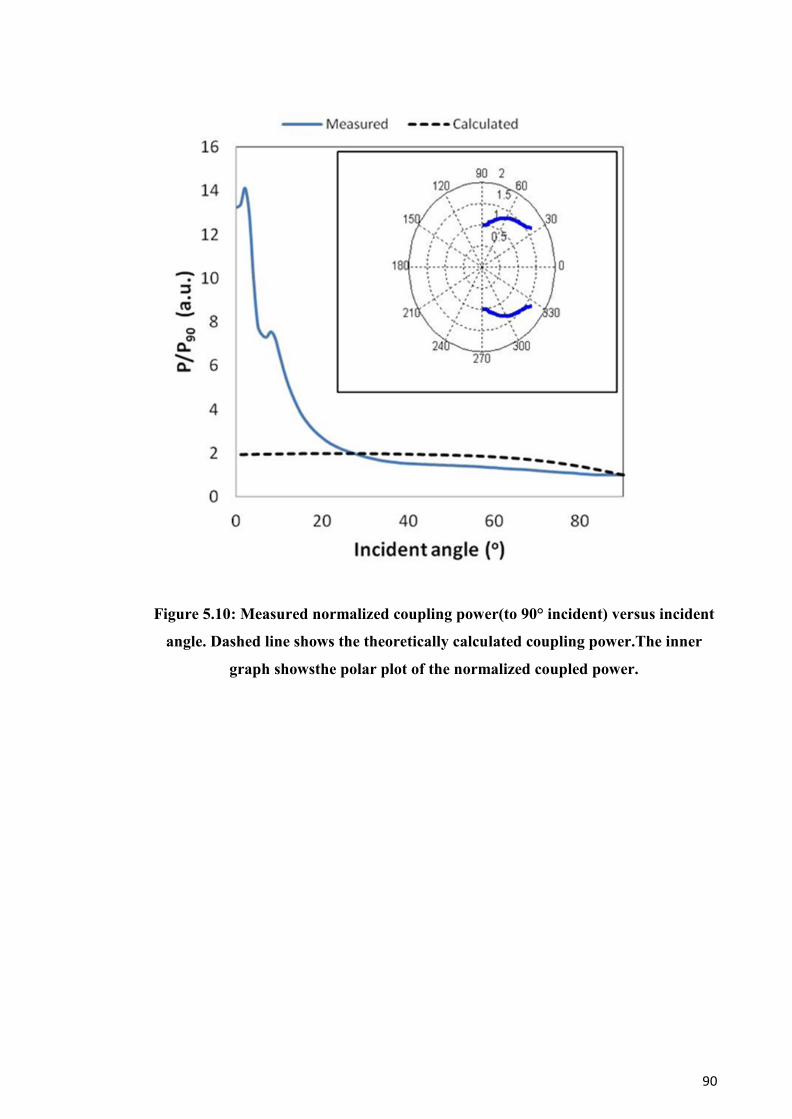
90
Figure 5.10: Measured normalized coupling power(to 90° incident) versus incident
angle. Dashed line shows the theoretically calculated coupling power.The inner
graph showsthe polar plot of the normalized coupled power.
91
5.5 Optical characterization for FOV optical receiver on POF
In the previous section, excitation to core modes through etching the cladding
region showed higher coupling efficiency due to the reduction of the critical angle
inside the core (lower index contrast). Coupling efficiency can be further improved
when increasing the exposed area through the use of larger core fiber. Large core glass
fibers do exist however they do suffer of lack of flexibility and become very fragile.
This increases the difficulty in handling them. The recent development in plastic optical
fiber especially with the extensive reduction in their absorption made them a lower cost
alternative for large core cladding less optical fiber. As explained in section 3.3.3,
uniform growth of nanorods on POF was achieved through the use of 1mM zinc acetate
in ethanol solution and 10 mM of zinc nitrate and Hexamine at 95°C inside oven for 8h.
Figure 5.11: Wide FOV optcial receiver based on plastic optcial fiber.
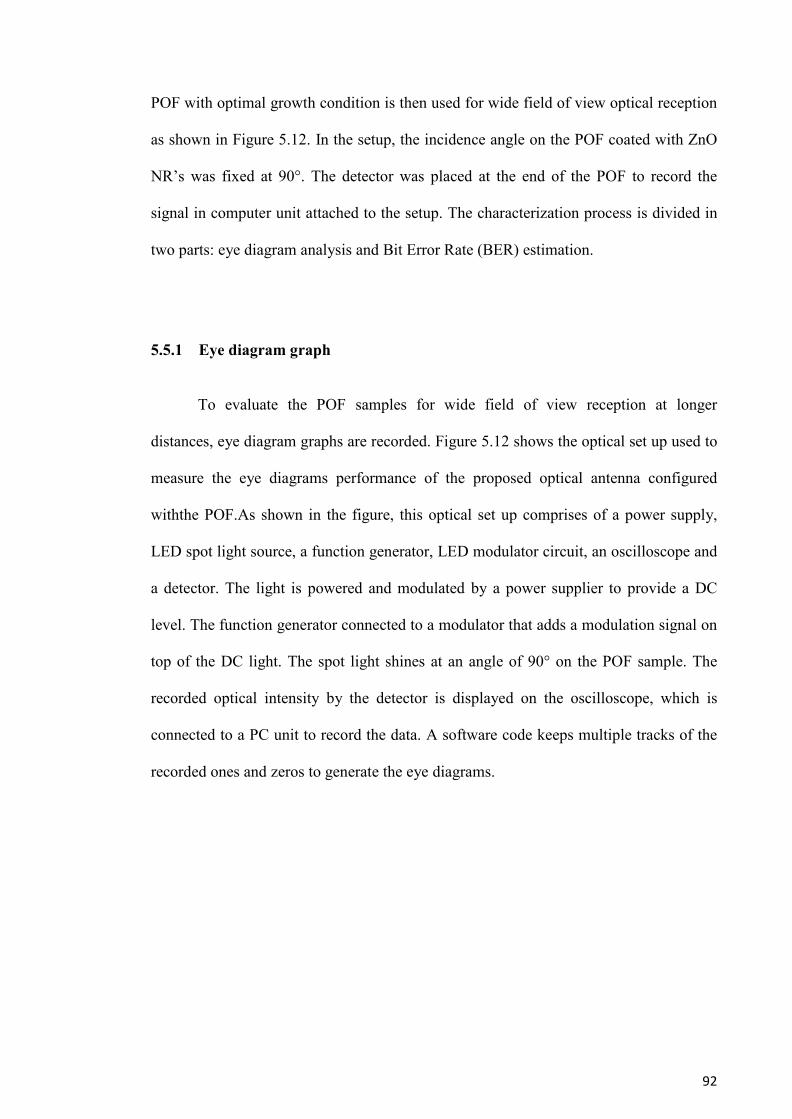
92
POF with optimal growth condition is then used for wide field of view optical reception
as shown in Figure 5.12. In the setup, the incidence angle on the POF coated with ZnO
NR’s was fixed at 90°. The detector was placed at the end of the POF to record the
signal in computer unit attached to the setup. The characterization process is divided in
two parts: eye diagram analysis and Bit Error Rate (BER) estimation.
5.5.1 Eye diagram graph
To evaluate the POF samples for wide field of view reception at longer
distances, eye diagram graphs are recorded. Figure 5.12 shows the optical set up used to
measure the eye diagrams performance of the proposed optical antenna configured
withthe POF.As shown in the figure, this optical set up comprises of a power supply,
LED spot light source, a function generator, LED modulator circuit, an oscilloscope and
a detector. The light is powered and modulated by a power supplier to provide a DC
level. The function generator connected to a modulator that adds a modulation signal on
top of the DC light. The spot light shines at an angle of 90° on the POF sample. The
recorded optical intensity by the detector is displayed on the oscilloscope, which is
connected to a PC unit to record the data. A software code keeps multiple tracks of the
recorded ones and zeros to generate the eye diagrams.
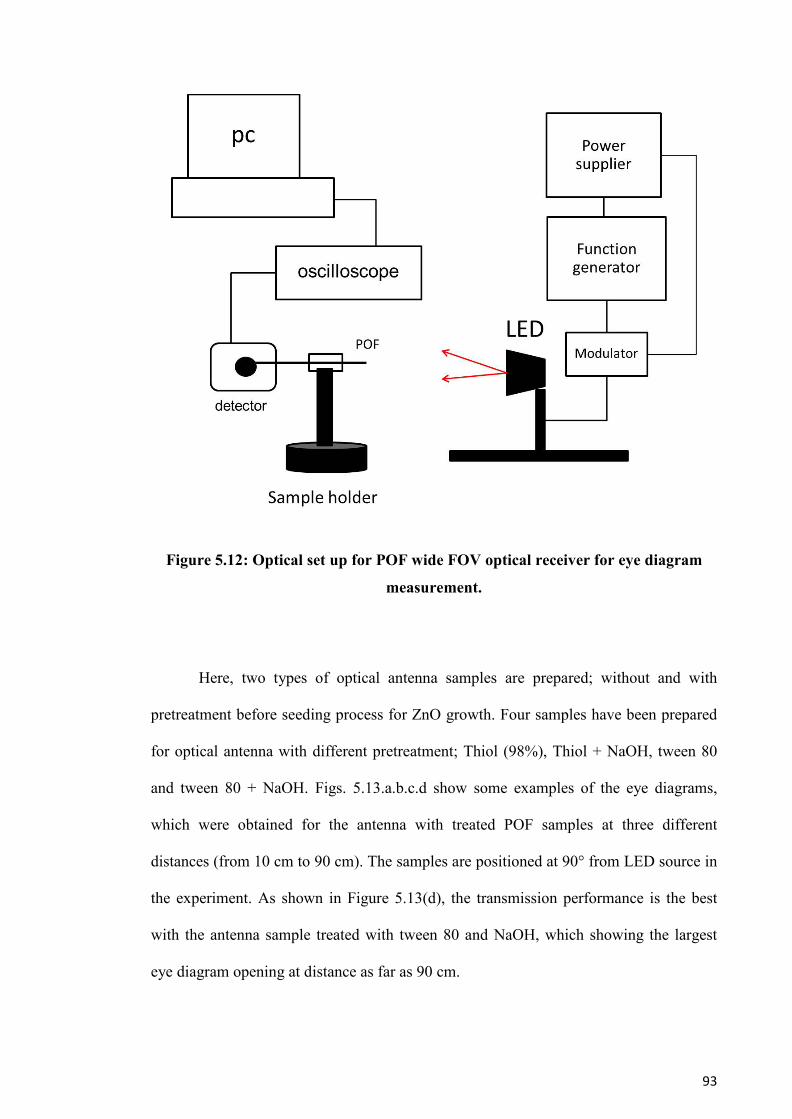
93
Figure 5.12: Optical set up for POF wide FOV optical receiver for eye diagram
measurement.
Here, two types of optical antenna samples are prepared; without and with
pretreatment before seeding process for ZnO growth. Four samples have been prepared
for optical antenna with different pretreatment; Thiol (98%), Thiol + NaOH, tween 80
and tween 80 + NaOH. Figs. 5.13.a.b.c.d show some examples of the eye diagrams,
which were obtained for the antenna with treated POF samples at three different
distances (from 10 cm to 90 cm). The samples are positioned at 90° from LED source in
the experiment. As shown in Figure 5.13(d), the transmission performance is the best
with the antenna sample treated with tween 80 and NaOH, which showing the largest
eye diagram opening at distance as far as 90 cm.
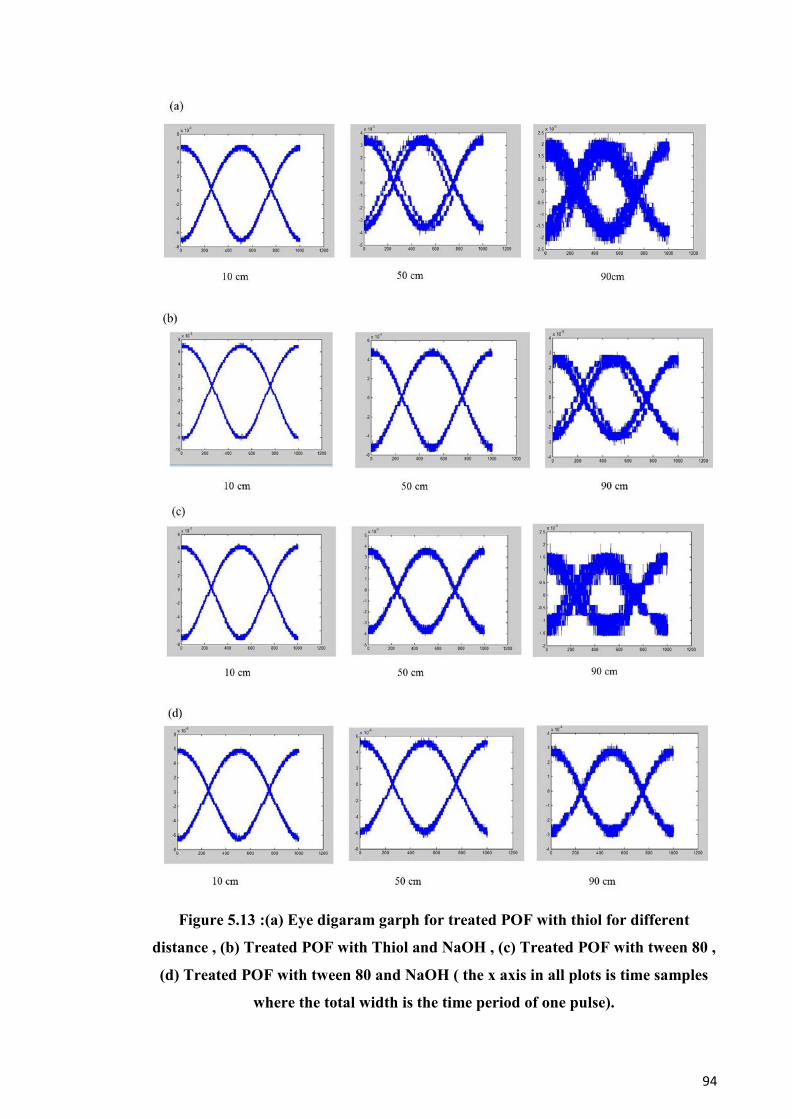
94
Figure 5.13 :(a) Eye digaram garph for treated POF with thiol for different
distance , (b) Treated POF with Thiol and NaOH , (c) Treated POF with tween 80 ,
(d) Treated POF with tween 80 and NaOH ( the x axis in all plots is time samples
where the total width is the time period of one pulse).
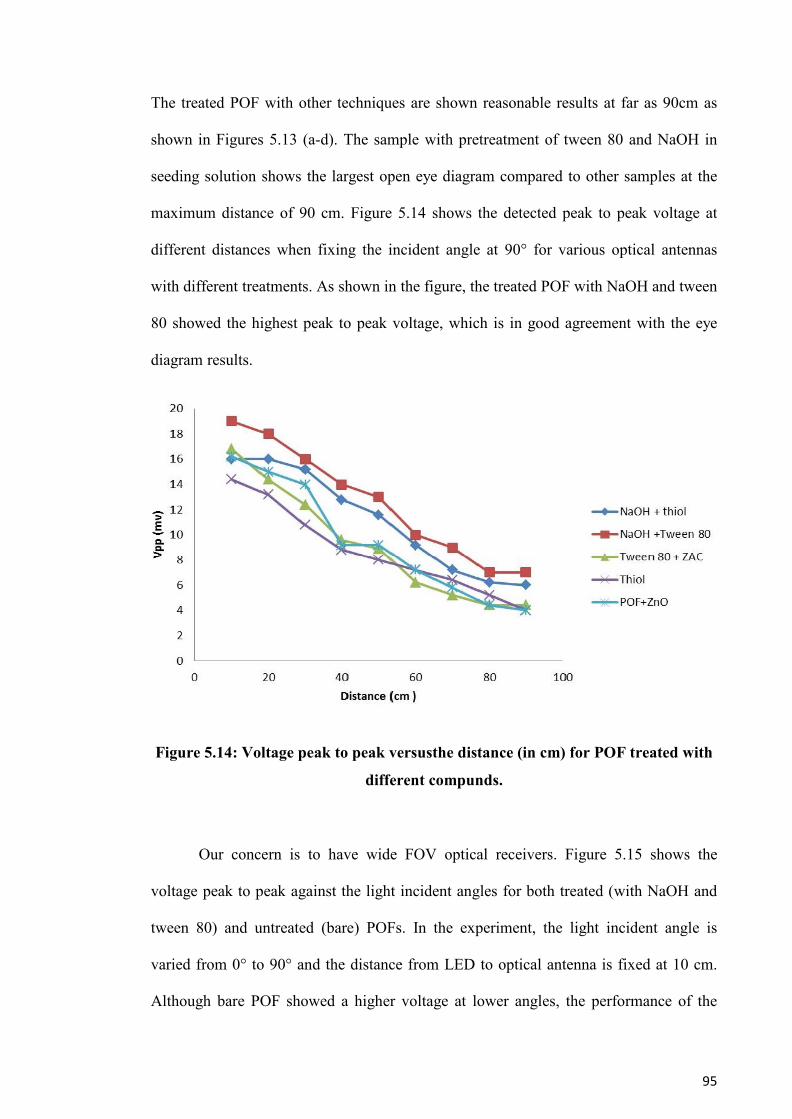
95
The treated POF with other techniques are shown reasonable results at far as 90cm as
shown in Figures 5.13 (a-d). The sample with pretreatment of tween 80 and NaOH in
seeding solution shows the largest open eye diagram compared to other samples at the
maximum distance of 90 cm. Figure 5.14 shows the detected peak to peak voltage at
different distances when fixing the incident angle at 90° for various optical antennas
with different treatments. As shown in the figure, the treated POF with NaOH and tween
80 showed the highest peak to peak voltage, which is in good agreement with the eye
diagram results.
Figure 5.14: Voltage peak to peak versusthe distance (in cm) for POF treated with
different compunds.
Our concern is to have wide FOV optical receivers. Figure 5.15 shows the
voltage peak to peak against the light incident angles for both treated (with NaOH and
tween 80) and untreated (bare) POFs. In the experiment, the light incident angle is
varied from 0° to 90° and the distance from LED to optical antenna is fixed at 10 cm.
Although bare POF showed a higher voltage at lower angles, the performance of the
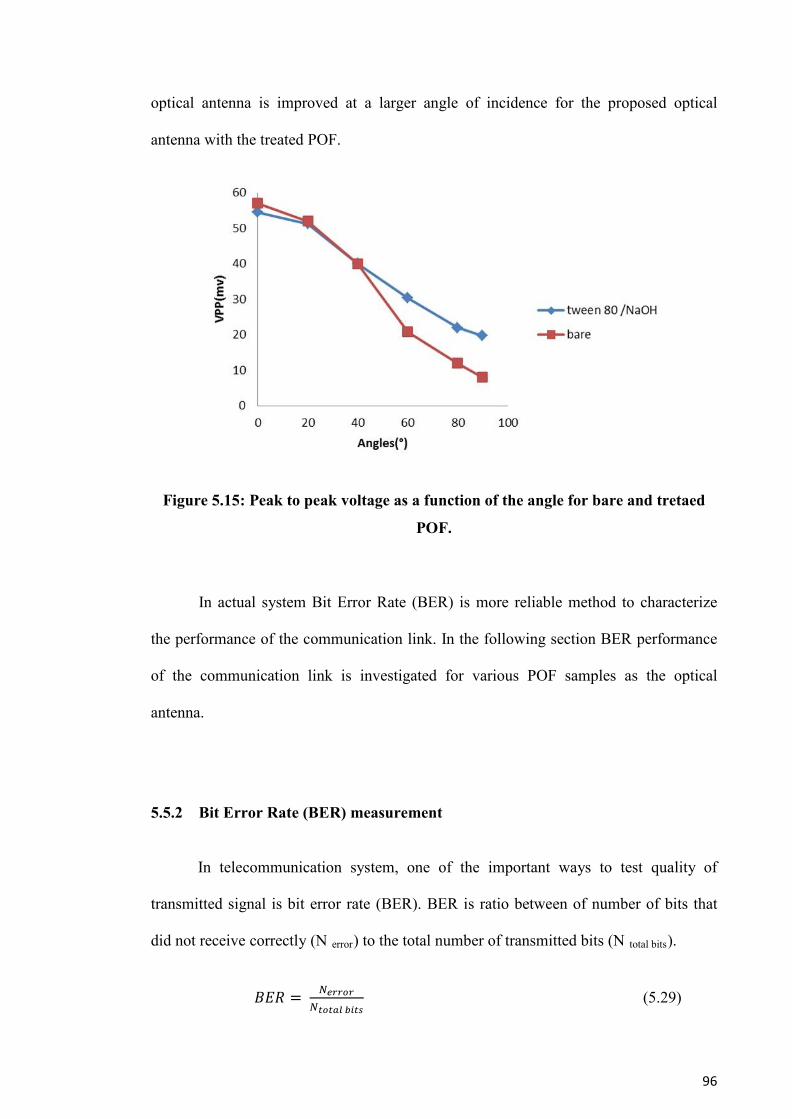
96
optical antenna is improved at a larger angle of incidence for the proposed optical
antenna with the treated POF.
Figure 5.15: Peak to peak voltage as a function of the angle for bare and tretaed
POF.
In actual system Bit Error Rate (BER) is more reliable method to characterize
the performance of the communication link. In the following section BER performance
of the communication link is investigated for various POF samples as the optical
antenna.
5.5.2 Bit Error Rate (BER) measurement
In telecommunication system, one of the important ways to test quality of
transmitted signal is bit error rate (BER). BER is ratio between of number of bits that
did not receive correctly (N error) to the total number of transmitted bits (N total bits).
𝐵𝐸𝑅 = 𝑁𝑒𝑟𝑟𝑜𝑟𝑁𝑡𝑜𝑡𝑎𝑙 𝑏𝑖𝑡𝑠
(5.29)
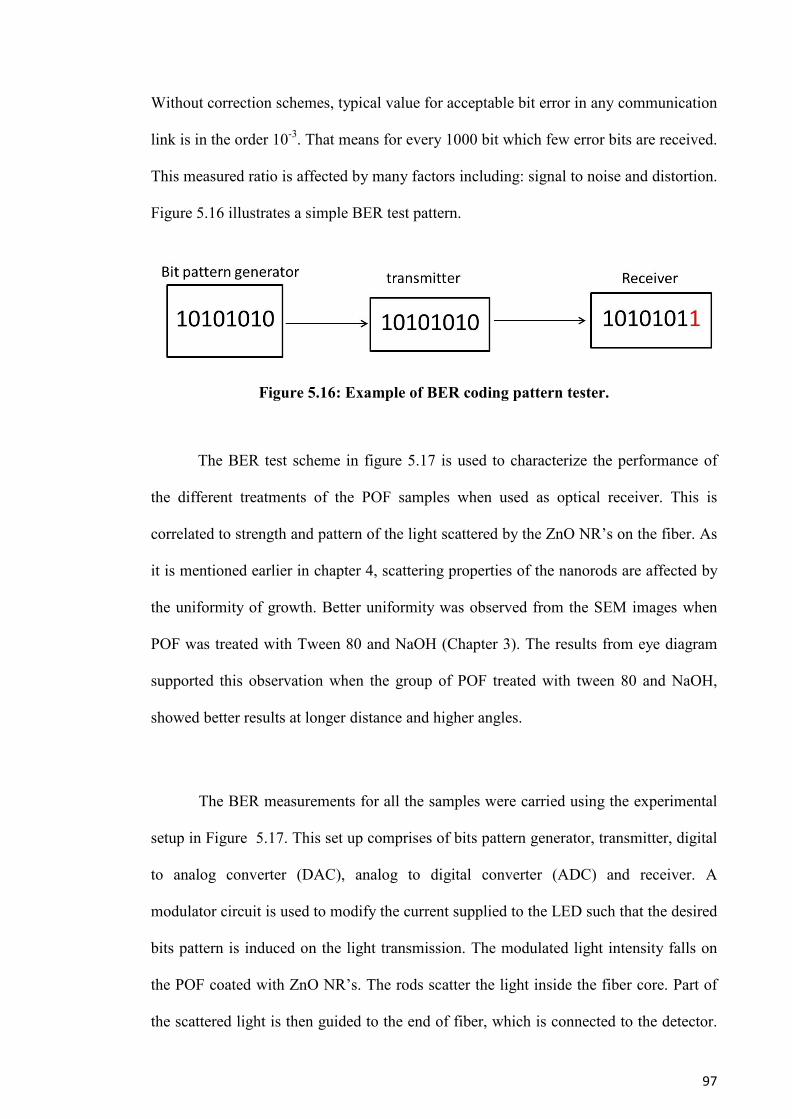
97
Without correction schemes, typical value for acceptable bit error in any communication
link is in the order 10-3. That means for every 1000 bit which few error bits are received.
This measured ratio is affected by many factors including: signal to noise and distortion.
Figure 5.16 illustrates a simple BER test pattern.
Figure 5.16: Example of BER coding pattern tester.
The BER test scheme in figure 5.17 is used to characterize the performance of
the different treatments of the POF samples when used as optical receiver. This is
correlated to strength and pattern of the light scattered by the ZnO NR’s on the fiber. As
it is mentioned earlier in chapter 4, scattering properties of the nanorods are affected by
the uniformity of growth. Better uniformity was observed from the SEM images when
POF was treated with Tween 80 and NaOH (Chapter 3). The results from eye diagram
supported this observation when the group of POF treated with tween 80 and NaOH,
showed better results at longer distance and higher angles.
The BER measurements for all the samples were carried using the experimental
setup in Figure 5.17. This set up comprises of bits pattern generator, transmitter, digital
to analog converter (DAC), analog to digital converter (ADC) and receiver. A
modulator circuit is used to modify the current supplied to the LED such that the desired
bits pattern is induced on the light transmission. The modulated light intensity falls on
the POF coated with ZnO NR’s. The rods scatter the light inside the fiber core. Part of
the scattered light is then guided to the end of fiber, which is connected to the detector.
98
The optical signal is converted to the electrical signal by the detector. The converted
signal is then shown on the oscilloscope. The detector is also connected to a DAC which
sends the digital signal to the receiver module. The receiver module compares the
received bits to the expected pattern. BER is the number of wrong bits divided by the
total transmitted bits. Here, 10 bits pattern of 1100110011 are sent 1000 times and the
bit error count is used to extract the BER. Counting the number of the error bit in the
reception over a period of time, the link bit error rate is estimated. In this case, the BER
is calculated by counting the number of wrongly received bits and dividing it by 100000
(The total number of transmitted bits). In the setup, the receiver units counts the number
of error and coversion to BER is done through division by 10000.Figure 5.18 shows bit
error rate results, which were obtained using optical receiver based on POF coated with
ZnO NR’s. The performance of BERs is compared for different pre-treatment
techniques that are used before growth. When no error correction schemes are applied,
values less than 10-3 are assumed good transmission link.
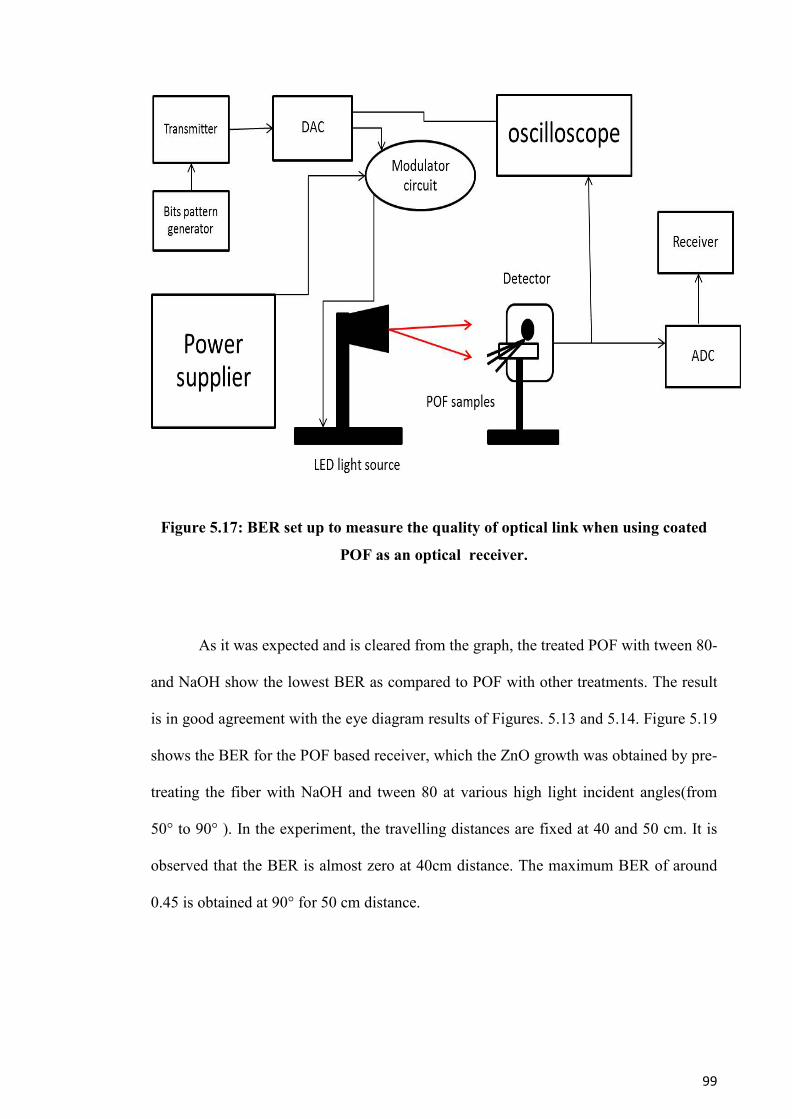
99
Figure 5.17: BER set up to measure the quality of optical link when using coated
POF as an optical receiver.
As it was expected and is cleared from the graph, the treated POF with tween 80-
and NaOH show the lowest BER as compared to POF with other treatments. The result
is in good agreement with the eye diagram results of Figures. 5.13 and 5.14. Figure 5.19
shows the BER for the POF based receiver, which the ZnO growth was obtained by pre-
treating the fiber with NaOH and tween 80 at various high light incident angles(from
50° to 90° ). In the experiment, the travelling distances are fixed at 40 and 50 cm. It is
observed that the BER is almost zero at 40cm distance. The maximum BER of around
0.45 is obtained at 90° for 50 cm distance.
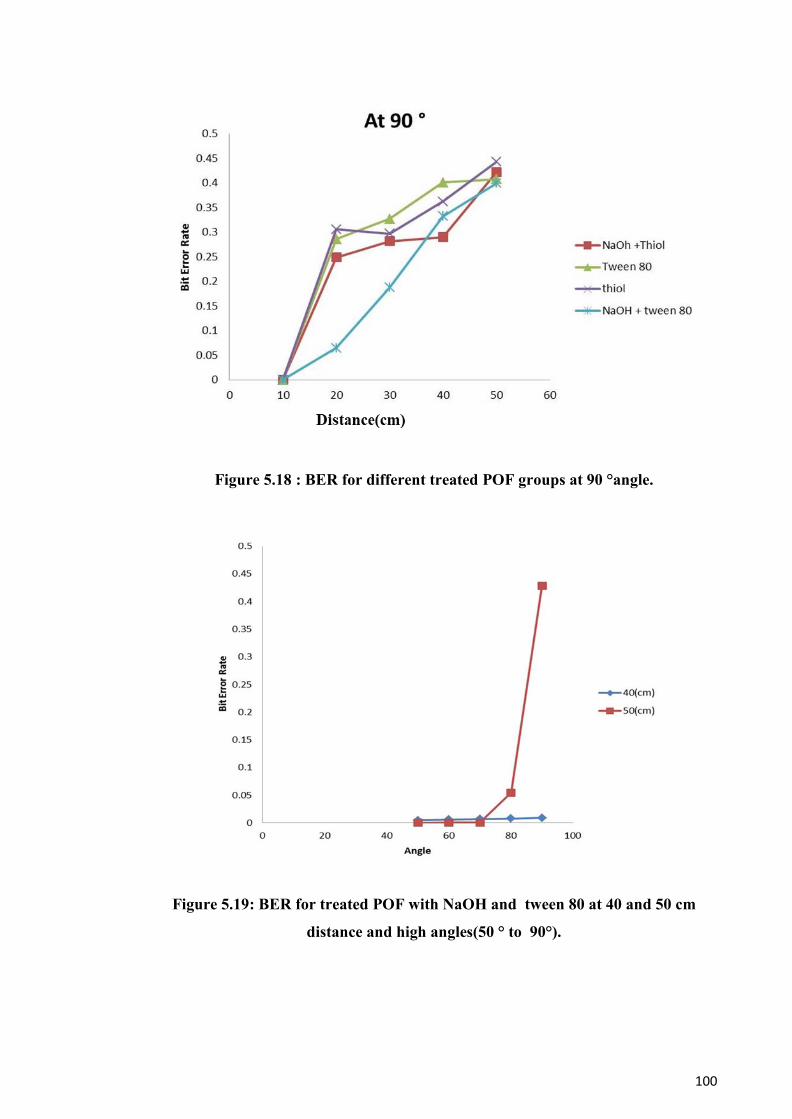
100
Figure 5.18 : BER for different treated POF groups at 90 °angle.
Figure 5.19: BER for treated POF with NaOH and tween 80 at 40 and 50 cm
distance and high angles(50 ° to 90°).
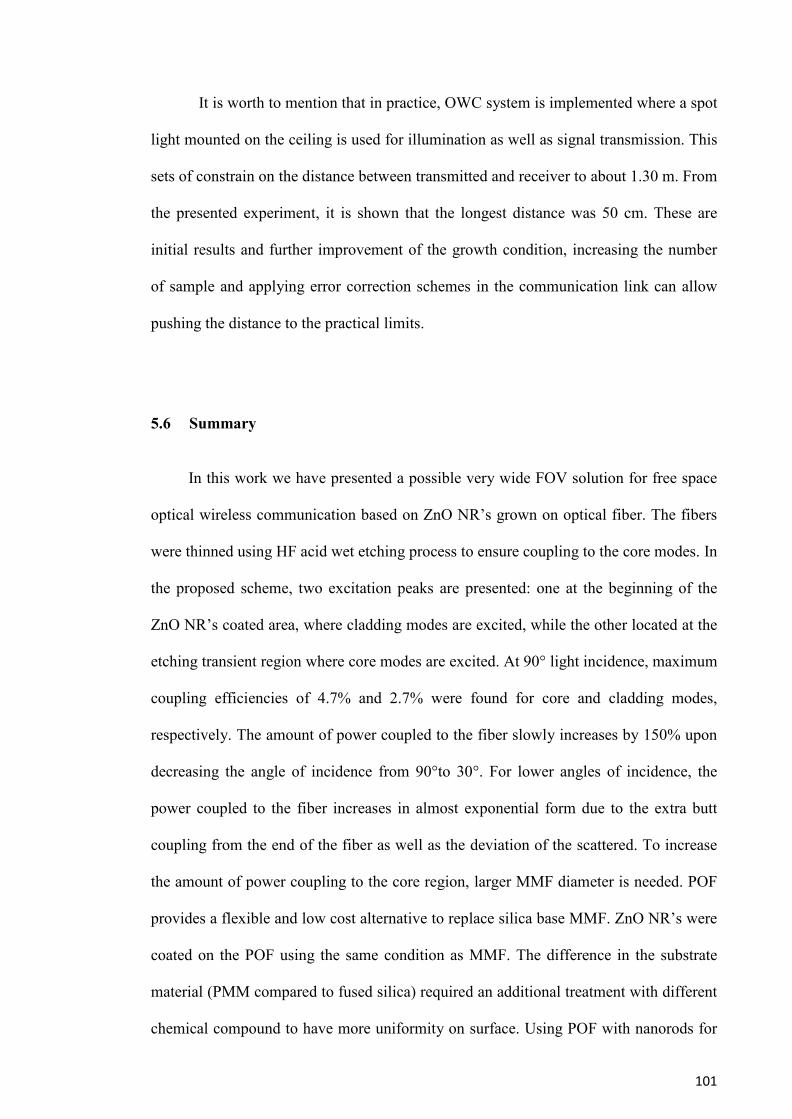
101
It is worth to mention that in practice, OWC system is implemented where a spot
light mounted on the ceiling is used for illumination as well as signal transmission. This
sets of constrain on the distance between transmitted and receiver to about 1.30 m. From
the presented experiment, it is shown that the longest distance was 50 cm. These are
initial results and further improvement of the growth condition, increasing the number
of sample and applying error correction schemes in the communication link can allow
pushing the distance to the practical limits.
5.6 Summary
In this work we have presented a possible very wide FOV solution for free space
optical wireless communication based on ZnO NR’s grown on optical fiber. The fibers
were thinned using HF acid wet etching process to ensure coupling to the core modes. In
the proposed scheme, two excitation peaks are presented: one at the beginning of the
ZnO NR’s coated area, where cladding modes are excited, while the other located at the
etching transient region where core modes are excited. At 90° light incidence, maximum
coupling efficiencies of 4.7% and 2.7% were found for core and cladding modes,
respectively. The amount of power coupled to the fiber slowly increases by 150% upon
decreasing the angle of incidence from 90°to 30°. For lower angles of incidence, the
power coupled to the fiber increases in almost exponential form due to the extra butt
coupling from the end of the fiber as well as the deviation of the scattered. To increase
the amount of power coupling to the core region, larger MMF diameter is needed. POF
provides a flexible and low cost alternative to replace silica base MMF. ZnO NR’s were
coated on the POF using the same condition as MMF. The difference in the substrate
material (PMM compared to fused silica) required an additional treatment with different
chemical compound to have more uniformity on surface. Using POF with nanorods for

102
wide FOV optical reception, the eye diagram and BER were recorded for the different
treatments at high angles and several distances.
103
CHAPTER 6
CONCLUSION AND FUTURE OUTLOOK
6.1 Introduction
In this work a new concept of side coupling to optical fiber utilizing the scattering
properties of nano structures is introduced. Here ZnO NR’s grown on the side of the
fiber are used as scattering components due to their unique properties (high refractive
index, shape controllability and ease of fabrication). ZnO rods scatter the incident light
at angles larger than the critical angle allowing portion of the light to couple to the
guided modes in the core and cladding regions. A highly ordered and dense ZnO NR’s
structure is grown on the cladding and core regions of silica glass optical fibers by
hydrothermal technique. This technique is also used to grow ZnO NR’s on plastic or
polymer optical fiber (POF). Among solution and gas phase of growth techniques,
hydrothermal method is used in this work as it does not require high temperature and
complicated vacuum system. It is as well a low cost and simple process. The
combination of nanostructures and fiber systems is used to demonstrate a simple wide
field of view (FOV) optical receiver.
Growth of ZnO NR’S on optical fiber MMF to couple light into the cladding region
There was limited number of reported work dealing with growth of nanorods on
rounded surfaces such as fiber. Hence, the effect of hydrothermal growth of ZnO NR’s
on the optical fiber to get optimum growth condition was investigated. The
concentration of zinc acetate solution used for seeding was found to play important role
104
in nanorods scattering. At higher zinc acetate concentration than 1 mM, the randomness
in nanorods directionality increased due to the clustering of seeds. That caused higher
multiple forward scattering and back scattering as well, as results; coupling efficiency
reduces almost 10 %. Another important factor was growth time.
Increasing the growth time from 5 to 20 h increased the length of nanorods from
1.7 µm to ~6.7 µm respectively. Scattering cross section (Csc) increased as a result.
Although the increase in rods length caused higher scattering cross section, the density
of nanorods decreased from ~2.91× 109 cm -2 to ~ 1.22× 109 cm -2. According to Eq
4.15, this coupling efficiency (CE) is directly related to density and scattering cross
section. The optimum growth of nanorodsis obtained when 1mM Zinc acetated
dehydrate dissolved in 20 ml ethanol is used for seeding nanoparticle and then 10 mM
zinc nitrate and hexamine are used for hydrothermal growth at 95° C inside oven for 8
hour. Maximum excitation of the cladding modes of silica multimode optical fiber
(MMF) by side coupling of light is obtained with ZnO NR’s of length ~2.2µm and
average coupling efficiency was 2.65%.
Growth of ZnO NR’S on optical fiber MMF to couple light into core region by
etching cladding
In order to grow nanorods on the core region of the optical fiber, wet etching
process was used to remove the cladding region. Hydrofluoric acid (HF 50%) was
applied to etch the cladding region of the standard MMF with core and cladding
diameters of 105µm and 125 µm respectively. The strong aggressive properties of HF
caused silica to dissolve though in it. To get the optimum time for dipping MMF
samples to reach the core diameter different dipping time were investigated. The results
105
showed that after 10 min the cladding region was removed. However, the optimum
results were for the samples with 20 min etching time.
The optical characterization of the etched samples showed two excitation peaks,
one at the beginning of the ZnO NR’s coated area where cladding modes were excited
and the other at the etching transition region where core modes were excited. Maximum
coupling efficiencies of 4.7% and 2.7% happened at 90° of incident light for core and
cladding modes respectively. The amount of power coupled to fiber could increase by
150 % upon decreasing the angle of incident from 90° to 30°. For lower angles of
incident the power coupled to the fiber increase in almost exponential form. By utilizing
a bundle of the fibers coated with ZnO NR’s the total coupled power could be enhanced
at higher angle.
Growth of ZnO NR’S POF
POF is another type of optical fiber that can be used to grow ZnO NR’s. POF
was used due to its larger core diameter which could increase the light coupling into the
core modes. Using POF provides a lower cost alternative to large core glass fiber and it
is also easier to handle. The growth of nanorods was initially applied with the optimum
conditions obtained from glass MMF. Due to the difference in the substrate, PMMA in
the case of POF, the attachment of nanorods was not stable and the rods could not grow
uniformly. To achieve better uniformity, POF samples were treated by dipping method
inside Tween 80 solution for 15 min, and lmM NaOH added into zinc acetate and
ethanol seeding solution.
106
Wide FOV optical receiver
The combination of advantageous nanostructures and fiber system open a possible
way to build a wide field of view optical receiver in optical communication system and
applications. The angular response of the receiver is tested using an in-house built
nephelometer. Light coupling efficiency is extracted by de-convolving the finite beam
extinction from the measured power. The results were compared to a first order
analytical model where the phase function is assumed to linearly shift with the incident
angle. The trend of the experimental measurements agrees with the model. 180o FOV is
verified and maximum coupling efficiency of around 2.5% for a single fiber is reported.
POF samples were also used in practical test for wireless communication system.Eye
diagram and bit error rate (BER) were measured to characterize the quality of the optical
link when using wide FOV as an optical receiver. From these results, it is concluded that
the excitation of core modes through side coupling allows for application of these
devices towards wide field of view optical receivers.
6.2 Suggestion for future works
In this final demonstration of the use of ZnO on POF as a wide FOV receiver, the
acceptable optical link was short (less than 50 cm). Though the main concept of
utilization of the nanorods for wide field of view optical reception was demonstrated,
more work is needed to improve the properties of the system to reach practical distances
larger than 1 meter. To overcome this issue, having more accurate BER tester, detector,
more powerful light emitting diode (LED) source as well as better control of the growth
condition will be required. More fibers can be used to increase signal to noise ratio.
Higher brightness LED sport light is to be used as well. With further enhancement of the

107
modulation and detector circuits a longer distance within the acceptable range of BER
can be achieved.
108
REFERENCES
Andrade, E., & Miki-Yoshida, M. (1999). Growth, structure and optical characterization of high quality ZnO thin films obtained by spray pyrolysis. Thin Solid Films, 350 (1), 192-202.
Antelius, M., Gylfason, K. B., & Sohlström, H. (2011). An apodized SOI waveguide-to-fiber surface grating coupler for single lithography silicon photonics. Optics Express, 19 (4), 3592-3598.
Azadeh, M. (2009). Fiber optics engineering (p. 379). Springer.
Bahaa E. A., Malvin C. T. (2007). Fundamental of photonics.Wiley Series in Pure and Applied Optics.
Bao, J., Zimmler, M. A., Capasso, F., Wang, X., & Ren, Z. F. (2006). Broadband ZnO single-nanowire light-emitting diode. Nano letters, 6 (8), 1719-1722.
Baruah, S., Thanachayanont, C., & Dutta, J. (2008). Growth of ZnO nanowires on nonwoven polyethylene fibers. Science and Technology of Advanced Materials, 9 (2), 025009.
Baruah, S., & Dutta, J. (2009). Hydrothermal growth of ZnO nanostructures. Science and Technology of Advanced Materials, 10 (1), 013001.
Baruah, S., & Dutta, J. (2009). Effect of seeded substrates on hydrothermally grown ZnO NR’s. Journal of sol-gel science and technology, 50 (3), 456-464.
Baruah, S., & Dutta, J.(2009). pH-dependent growth of zinc oxide nanorods. Crystal Growth, 311 (8), 2549-2554. Batumalay, M., Harith, Z., Rafaie, H. A., Ahmad, F., Khasanah, M., Harun, S. W., ... & Ahmad, H. (2014). Tapered plastic optical fiber coated with ZnO nanostructures for the measurement of uric acid concentrations and changes in relative humidity. Sensors and Actuators A: Physical, 210, 190-196. Beres, C., de Nazaré, F. V. B., de Souza, N. C. C., Miguel, M. A. L., & Werneck, M. M. (2011). Tapered plastic optical fiber-based biosensor–Tests and application. Biosensors and Bioelectronics, 30 (1), 328-332. Bharadwaj, P., Deutsch, B., & Novotny, L. (2009). Optical antennas. Advances in Optics and Photonics, 1 (3), 438-483.
109
Bilro, L., Alberto, N., Pinto, J. L., & Nogueira, R. (2012). Optical Sensors Based on Plastic Fibers. Sensors (Basel, Switzerland), 12 (9), 12184–12207. Bora, T., Fallah, H., Chaudhari, M., Apiwattanadej, T., Harun, S. W., Mohammed, W. S., & Dutta, J. (2014). Controlled side coupling of light to cladding mode of ZnO nanorod coated optical fibers and its implications for chemical vapor sensing. Sensors and Actuators B: Chemical, 202, 543-550. Cao, G. (2004). Synthesis, Properties and Applications. Imperial college press, London.
Carruther, J. B., & Kahn, J. M. (2000). Angle diversity for nondirected wireless infrared communication. Communications, IEEE Transactions on, 48 (6), 960-969.
Chen, B. J., Sun, X. W., Xu, C. X., & Tay, B. K. (2004). Growth and characterization of zinc oxide nano/micro-fibers by thermal chemical reactions and vapor transport deposition in air. Physica E: Low-dimensional Systems and Nanostructures, 21 (1), 103-107. Chen, C. Y., Chen, Q. Z., Shi, M., Zhou, F., Hua, C., & Pang, H. (2012). Nonstoichiometric Zinc Oxide Nanorod Arrays Doped Co or Ni as Effective Antimicrobial Materials. Advanced Materials Research, 518, 760-763. Chen, N. K., Lin, C. L., & Chi, S. (2007). Wideband tunable wavelength-selective coupling in asymmetric side-polished fiber coupler with dispersive interlayer. Optics Express, 15 (26), 17747-17753.
Choy, J. H., Jang, E. S., Won, J. H., Chung, J. H., Jang, D. J., & Kim, Y. W. (2003). Soft Solution Route to Directionally Grown ZnO Nanorod Arrays on Si Wafer; Room‐Temperature Ultraviolet Laser. Advanced Materials, 15 (22), 1911-1914. Dalal, S. H., Baptista, D. L., Teo, K. B. K., Lacerda, R. G., Jefferson, D. A., & Milne, W. I. (2006). Controllable growth of vertically aligned zinc oxide nanowires using vapour deposition. Nanotechnology, 17 (19), 4811.
Danwittayakul, S., Lakshman, K., Al-Harthi, S., & Dutta, J. (2014). Enhanced hydrogen selectivity via photo-engineered surface defects for methanol steam reformation using zinc oxide–copper nanocomposite catalysts. Applied Catalysis A: General, 471, 63-69.
Deng, P., Yuan, X., Kavehrad, M., Zhao, M., & Zeng, Y. (2012). Off-axis catadioptric fisheye wide field-of-view optical receiver for free space optical communications. Optical Engineering, 51 (6), 063002-1.
Desai, A. V., & Haque, M. A. (2007). Mechanical properties of ZnO nanowires. Sensors and Actuators A: Physical, 134 (1), 169-176. Dikovska, A. O., Atanasova, G. B., Nedyalkov, N. N., Stefanov, P. K., Atanasov, P. A., Karakoleva, E. I., & Andreev, A. T. (2010). Optical sensing of ammonia using ZnO
110
nanostructure grown on a side-polished optical-fiber. Sensors and Actuators B: Chemical, 146 (1), 331-336. Dikovska, A. O., Atanasov, P. A., Andreev, A. T., Zafirova, B. S., Karakoleva, E. I., & Stoyanchov, T. R. (2007). ZnO thin film on side polished optical fiber for gas sensing applications. Applied Surface Science, 254 (4), 1087-1090.
Ding, D., & Liu, X. (1999). Approximate description for Bessel, Bessel–Gauss, and Gaussian beams with finite aperture. JOSA A, 16 (6), 1286-1293.
Ding, Y., & Wang, Z. L. (2009). Structures of planar defects in ZnO nanobelts and nanowires. Micron, 40 (3), 335-342. Du, G. T., Liu, W. F., Bian, J. M., Hu, L. Z., Liang, H. W., Wang, X. S., & Yang, T. P. (2006). Room temperature defect related electroluminescence from ZnO homojunctions grown by ultrasonic spray pyrolysis. Applied physics letters, 89 (5), 052113-052113. Fallah, H., Harun, S. W., Mohammed, W. S., & Dutta, J. (2014). Excitation of core modes through side coupling to multimode optical fiber by hydrothermal growth of ZnO NR’s for wide angle optical reception. JOSA B?, 31(9), 2232-2238.
Fallah, H.,Chaudhori, M., Harun, S. W., Mohammed, W. S., & Dutta, J. (2013). Demonstration of side coupling to cladding modes through zinc oxide nanorods grown on multimode optical fiber. Optics Letters, 38 (18), 3620-3622.
Fan, H. J., Fleischer, F., Lee, W., Nielsch, K., Scholz, R., Zacharias, M., & Krost, A. (2004). Patterned growth of aligned ZnO nanowire arrays on sapphire and GaN layers. Superlattices and Microstructures, 36 (1), 95-105.
Gandhi, A. C., Hung, H. J., Shih, P. H., Cheng, C. L., Ma, Y. R., & Wu, S. Y. (2010). In situ confocal Raman mapping study of a single Ti-assisted ZnO nanowire. Nanoscale research letters, 5 (3), 581-586. Ghassemlooy, Z., Popoola, W., & Rajbhandari, S. (2012). Optical wireless communications: system and channel modelling with Matlab®. CRC Press. Golnabi, H., & Azimi, P. (2008). Design and operation of a double-fiber displacement sensor. Optics Communications, 281 (4), 614-620.
Goodman, J. W. (2005). Introduction to Fourier optics. Roberts and Company Publishers. Grassini, S., Ishtaiwi, M., Parvis, M., & Vallan, A. (2015). Design and Deployment of Low-Cost Plastic Optical Fiber Sensors for Gas Monitoring. Sensors (Basel, Switzerland), 15 (1), 485–498.
111
Grattan, K. T. V., & Sun, T. (2000). Fiber optic sensor technology: an overview. Sensors and Actuators A: Physical, 82 (1), 40-61.
Guo, L., Ji, Y. L., Xu, H., Simon, P., & Wu, Z. (2002). Regularly shaped, single-crystalline ZnO NR’s with wurtzite structure. Journal of the American Chemical Society, 124 (50), 14864-14865.
Hahn, D. V., Brown, D. M., Rolander, N. W., Sluz, J. E., & Venkat, R. (2010). Fiber optic bundle array wide field-of-view optical receiver for free space optical communications. Optics letters, 35 (21), 3559-3561. Hayat, A., Catanante, G., & Marty, J. L. (2014). Current Trends in Nanomaterial-Based Amperometric Biosensors. Sensors, 14 (12), 23439-23461.
He, J. H., Hsin, C. L., Liu, J., Chen, L. J., & Wang, Z. L. (2007). Piezoelectric gated diode of a single ZnO nanowire. Advanced Materials, 19 (6), 781-784. Hong-Yuan, W., Wei-Guo, H., Pan-Feng, Z., Xiang-Lin, L., Qin-Sheng, Z., & Zhan-Guo, W. (2007). ZnO Nanostructures Grown on AlN/Sapphire Substrates by MOCVD. Chinese Physics Letters, 24 (6), 1738. Hu, Y. H., Wang, H., & Hu, B. (2010). Thinnest Two‐Dimensional Nanomaterial—Graphene for Solar Energy. ChemSusChem, 3 (7), 782-796.
Hughes, W. L., and Wang., Z. (2005).Controlled synthesis and manipulation of ZnO nanorings and nanobows. Applied Physics Letters, 86 (4), 043106.
Jang, H. S., Park, K. N., Kim, J. P., Sim, S. J., Kwon, O. J., Han, Y. G., & Lee, K. S. (2009). Sensitive DNA biosensor based on a long-period grating formed on the side-polished fiber surface. Optics Express, 17 (5), 3855-3860. Jeong, W., Kavehrad, M., & Jivkova, S. (2001). Broadband infrared access with a multi-spot diffusing configuration: performance. International Journal of Wireless Information Networks, 8 (1), 27-36. Kbashi, H. J. (2012). Fabrication of submicron-diameter and taper fibers using chemical etching. Journal of Materials Science & Technology, 28 (4), 308-312.
Keiser. G. (2010). Optical fiber communication -4th ed. Wiley Series in Pure and Applied Optics. Kohls, M., Bonanni, M., Spanhel, L., Su, D., & Giersig, M. (2002). Green ErIII luminescence in fractal ZnO nanolattices. Applied physics letters, 81 (20), 3858-3860. Ko, Y. H., Chung, K. S., & Yu, J. S. (2012). Fabrication and Optical Property of Vertically-Aligned ZnO/Si Double Nanostructures. Journal of nanoscience and nanotechnology, 12 (6), 4570-4576.
112
Koike, Y., Ishigure, T., & Nihei, E. (1995). High-bandwidth graded-index polymer optical fiber. Lightwave Technology, Journal of, 13 (7), 1475-1489. Konstantaki, M., Klini, A., Anglos, D., & Pissadakis, S. (2012). An ethanol vapor detection probe based on a ZnO nanorod coated optical fiber long period grating. Optics Express, 20 (8), 8472-8484. Krunks M. and Mellikov E. (1995). Zinc oxide thin films by spray pyrolysis method. Thin Solid Films, 270 (3), 33-36. Kulkarni, A., Lee, J. H., Nam, J. D., & Kim, T. (2010). Thin film-coated plastic optical fiber probe for aerosol chemical sensing applications. Sensors and Actuators B: Chemical, 150 (1), 154-159.
Lagashetty, A., Havanoor, V., Basavaraja, S., Balaji, S. D., & Venkataraman, A. (2007). Microwave-assisted route for synthesis of nanosized metal oxides. Science and Technology of Advanced Materials, 8 (6), 484-493.
Leschkies, K. S., Divakar, R., Basu, J., Enache-Pommer, E., Boercker, J. E., Carter, C. B., & Aydil, E. S. (2007). Photosensitization of ZnO nanowires with CdSe quantum dots for photovoltaic devices. Nano Letters, 7 (6), 1793-1798. Lim, K. S., Harun, S.W., Arof, H., Ahmad, H. (2012). Selected topic on optical fiber technology. Chapter 17, Fabrication and application of Microfiber. ISBN 9788-953-51-0091-1, Page 680.
Liu, B., & Zeng, H. C. (2003). Hydrothermal synthesis of ZnO NR’s in the diameter regime of 50 nm. Journal of the American Chemical Society, 125 (15), 4430-4431. Liu, J., Xie, C., Dai, X., Jin, L., Zhou, W., & Lieber, C. M. (2013). Multifunctional three-dimensional macroporous nanoelectronic networks for smart materials. Proceedings of the National Academy of Sciences of the United States of America, 110 (17), 6694–6699.
Liu, J. S., Cao, J. M., Li, Z. Q., Ji, G. B., & Zheng, M. B. (2007). A simple microwave-assisted decomposing route for synthesis of ZnO NR’s in the presence of PEG400. Materials Letters, 61 (22), 4409-4411.
Liu, R., Zhang, T., Zhao, S. L., Xu, Z., Zhang, F. J., Yuan, G. C., & Xu, X. R. (2008). The preparation and characterization of 1-D orderly ZnO nanorod arrarys. Guang pu xue yu guang pu fen xi= Guang pu, 28 (10), 2249-2253.
Liu, Y., Zhang, Y., Lei, H., Song, J., Chen, H., & Li, B. (2012). Growth of well-arrayed ZnO NR’s on thinned silica fiber and application for humidity sensing. Optics Express, 20 (17), 19404-19411.
113
Liu, Y., Kathan, K., Saad, W., & Prud’homme, R. K. (2007). Ostwald ripening of β-carotene nanoparticles. Physical review letters, 98 (3), 036102.
Li, X., Hu, D., Dang, Y., Chen, H., Roco, M. C., Larson, C. A., & Chan, J. (2009). Nano Mapper: an Internet knowledge mapping system for nanotechnology development. Journal of Nanoparticle Research, 11 (3), 529–552.
Li, Z. W., & Gao, W. (2007). Growth of zinc oxide thin films and nanostructures by wet oxidation. Thin Solid Films, 515 (7), 3323-3329.
Luckhurst, G.R., Veracin, C. A. (1989). The Molecular Dynamics of Liquid Crystals. ISBN 0-7923-2809-4.
Mauter, M. S., & Elimelech, M. (2008). Environmental applications of carbon-based nanomaterials. Environmental Science & Technology, 42 (16), 5843-5859.
Mazingue, T., Escoubas, L., Spalluto, L., Flory, F., Socol, G., Ristoscu, C., ... & Vainos, N. A. (2005). Nanostructured ZnO coatings grown by pulsed laser deposition for optical gas sensing of butane. Journal of applied physics, 98 (7), 074312-074312.
Mohanty, L., & Kuang, K. S. (2011). Surface structure monitoring with plastic optical fiber. Optics and Lasers in Engineering, 49 (7), 984-987. Naritomi, M. (1996). CYTOP Amorphous Fluoropolymers for low loss POF. In POF Asia Pacific Forum (p. 23). Nihei, E., Ishigure, T., Tanio, N., & Koiky, Y. (1997). Present prospect of graded-index plastic optical fiber in telecommunication. IEICE transactions on electronics, 80 (1), 117-122. Numata, K., Furusawa, S., & Morikura, S. (1999). Transmission characteristics of 500 Mbps optical link using 650 nm RC-LED and POF. In Proc. POF (Vol. 99, pp. 74-77). Okamoto, K. (2010). Fundamentals of optical waveguides. Academic press Özgür, Ü., Alivov, Y. I., Liu, C., Teke, A., Reshchikov, M., Doğan, S., ... & Morkoc, H. (2005). A comprehensive review of ZnO materials and devices. Journal of applied physics, 98 (4), 041301. Pajnič, M., Drašler, B., Šuštar, V., Krek, J. L., Štukelj, R., Šimundić, M., ... & Kralj-Iglič, V. (2015). Effect of carbon black nanomaterial on biological membranes revealed by shape of human erythrocytes, platelets and phospholipid vesicles. Journal of nanobiotechnology, 13 (1), 28.
Park, J., Choi, H. H., Siebein, K., & Singh, R. K. (2003). Two-step evaporation process for formation of aligned zinc oxide nanowires. Journal of Crystal Growth, 258 (3), 342-348.
114
Pradhan, D., & Leung, K. T. (2008). Controlled growth of two-dimensional and one-dimensional ZnO nanostructures on indium tin oxide coated glass by direct electrodeposition. Langmuir, 24(17), 9707-9716.
Qiu, L., Goossen, K. W., Heider, D., O'Brien, D. J., & Wetzel, E. D. (2011). Free-space input and output coupling to an embedded fiber optic strain sensor: dual-ended interrogation via transmission. Optical Engineering, 50 (9), 094403-094403. Rao.C.N.R., Prof. Dr. Sood, A.k., Prof. Dr., Subrahmanyam,K.S, and Govindaraj, A. (2009). Graphene: The New Two-Dimensional Nanomaterial. Angewandte Chemie International Edition. 48 (42), 7752–7777.
Satoh, Y., Ohshio, S., & Saitoh, H. (2005). Photoluminescence spectroscopy of highly oriented Y 2 O 3: Tb crystalline whiskers. Science and Technology of Advanced Materials, 6 (2), 215-218.
Schidt-Mende, S. and MacManus–Driscoll, J.L. (2007). ZnO nanostructure defects and devices. Materials today, 10 (5) 40-48.
Schodek, D. L., Ferreira, P., & Ashby, M. F. (2009). Nanomaterials, nanotechnologies and design: an introduction for engineers and architects. Butterworth-Heinemann. Skoog, D.A., West, D.M., Holler, F.J., Crouch, S.R. (2003). Fundamentals of Analytical Chemistry- 8thed. Brooks Cole.
Sohaebuddin, S. K., Thevenot, P. T., Baker, D., Eaton, J. W., & Tang, L. (2010). Nanomaterial cytotoxicity is composition, size, and cell type dependent. Particle and fibre toxicology, 7 (1), 22.
Spanhel, L. (2006). Colloidal ZnO nanostructures and functional coatings: A survey. Journal of sol-gel science and technology, 39 (1), 7-24.
Sugunan, A., Warad, H. C., Boman, M., & Dutta, J. (2006). Zinc oxide nanowires in chemical bath on seeded substrates: role of hexamine. Journal of Sol-Gel Science and Technology, 39 (1), 49-56.
Tena-Zaera, R., Elias, J., & Lévy-Clément, C. (2008). ZnO nanowire arrays: optical scattering and sensitization to solar light. Applied Physics Letters, 93 (23), 233119.
Thankappan, A., Divya, S., Thomas, S., & Nampoori, V. P. N. (2013). Optical characterization of ZnO nanoplates embedded in polymeric matrices for optical limiting applications. Optics & Laser Technology, 52, 37-42. Umar, A., Ribeiro, C., Al-Hajry, A., Masuda, Y., & Hahn, Y. B. (2009). Growth of highly c-axis-oriented ZnO NR’s on ZnO/glass substrate: growth mechanism, structural, and optical properties. The Journal of Physical Chemistry C, 113 (33), 14715-14720.
115
Vergés, M. A., Mifsud, A., & Serna, C. J. (1990). Formation of rod-like zinc oxide microcrystals in homogeneous solutions. Journal of the Chemical Society, Faraday Transactions, 86 (6), 959-963. Voss, T., Svacha, G. T., Mazur, E., Müller, S., Ronning, C., Konjhodzic, D., & Marlow, F. (2007). High-order waveguide modes in ZnO nanowires. Nano letters, 7 (12), 3675-3680.
Wang, L., Zhang, X., Zhao, S., Zhou, G., Zhou, Y., & Qi, J. (2005). Synthesis of well-aligned ZnO nanowires by simple physical vapor deposition on c-oriented ZnO thin films without catalysts or additives. Applied Physics Letters, 86 (2), 024108-024108.
Wang, T. Q., Sekercioglu, Y. A., & Armstrong, J. (2012, December). Hemispherical lens based imaging receiver for MIMO optical wireless communications. In Globecom Workshops (GC Wkshps), 2012 IEEE (pp. 1239-1243). IEEE. Wang, W. M., Grattan, K. T., Palmer, A. W., & Boyle, W. J. O. (1994). Self-mixing interference inside a single-mode diode laser for optical sensing applications. Lightwave Technology, Journal of, 12 (9), 1577-1587.
Wang, Z. L. (2004). Zinc oxide nanostructures:growth, properties and applications. Journal of Physics: Condensed Matter, 16 (25), R829. Wang, Z. L. (2007). Novel nanostructures of ZnO for nanoscale photonics, optoelectronics, piezoelectricity, and sensing. Applied Physics A, 88 (1), 7-15. Wang, Z. L. (2009). ZnO nanowire and nanobelt platform for nanotechnology. Materials Science and Engineering: R: Reports, 64 (3), 33-71.
Wei, M., Zhi, D., & MacManus-Driscoll, J. L. (2005). Self-catalysed growth of zinc oxide nanowires. Nanotechnology, 16 (8), 1364.
Weintraub, B., Zhou, Z., Li, Y., & Deng, Y. (2010). Solution synthesis of one-dimensional ZnO nanomaterials and their applications. Nanoscale, 2 (9), 1573-1587. Wu, J., & Xue, D. (2010). Controlled etching of hexagonal ZnO architectures in an alcohol thermal process. Materials Research Bulletin, 45 (3), 295-299. Wu, J. J., & Liu, S. C. (2002). Low-temperature growth of well-aligned ZnO NR’s by chemical vapor deposition. Advanced Materials, 14 (3), 215.
116
Xu, L., Guo, Y., Liao, Q., Zhang, J., & Xu, D. (2005). Morphological control of ZnO nanostructures by electrodeposition. The Journal of Physical Chemistry B, 109 (28), 13519-13522.
Yang, P., Yan, H., Mao, S., Russo, R., Johnson, J., Saykally, R & Choi, H. J. (2002). Controlled growth of ZnO nanowires and their optical properties. Advanced Functional Materials, 12 (5), 323.
Yao, B. D., Chan, Y. F., & Wang, N. (2002). Formation of ZnO nanostructures by a simple way of thermal evaporation. Applied Physics Letters, 81 (4), 757-759. Yi, G. C., Wang, C., & Park, W. I. (2005). ZnO NR’s: synthesis, characterization and applications. Semiconductor Science and Technology, 20 (4), S22.
Yu, K., Zhang, Q., Wu, J., Li, L., Xu, Y. E., Huang, S., & Zhu, Z. (2008). Growth and optical applications of centimeter-long ZnO nanocombs. Nano Research, 1 (3), 221-228. Zhang, L., Webster, T.J (2009). Nanotechnology and nanomaterials: Promises for improved tissue regeneration. Nano Today, 4 (1), 66—80.
Zhang, Y., Yu, K., Ouyang, S., & Zhu, Z. (2006). Selective-area growth and field emission properties of Zinc oxide nanowire micropattern arrays. Physica B: Condensed Matter, 382 (1), 76-80.
Zhiyong Fan and Jia G. Lu.(2005). Zinc oxide nanostructure synthesis and properties. Nanoscience and nanotechnology, 5 (13), 1561-1573. Zhou, Q., Chen, W., Xu, L., & Peng, S. (2013). Hydrothermal Synthesis of Various Hierarchical ZnO Nanostructures and Their Methane Sensing Properties. Sensors (Basel, Switzerland), 13 (5), 6171–6182. Zhuo, R. F., Feng, H. T., Liang, Q., Liu, J. Z., Chen, J. T., Yan, D., ... & Yue, G. H. (2008). Morphology-controlled synthesis, growth mechanism, optical and microwave absorption properties of ZnO nanocombs. Journal of Physics D: Applied Physics, 41 (18), 185405.
Zubia, J., & Arrue, J. (2001). Plastic optical fibers: An introduction to their technological processes and applications. Optical Fiber Technology, 7 (2), 101-140.
117
LIST OF PUBLICATIONS
1. Bora, T., Fallah, H., Chaudhari, M., Apiwattanadej, T., Harun, S. W., Mohammed, W. S., & Dutta, J. (2014). Controlled side coupling of light to cladding mode of ZnO nanorod coated optical fibers and its implications for chemical vapor sensing. Sensors and Actuators B: Chemical, 202, 543-550.
2. Fallah, H.,Chaudhori, M., Harun, S. W., Mohammed, W. S., & Dutta, J. (2013). Demonstration of side coupling to cladding modes through zinc oxide nanorods grown on multimode optical fiber.Optics Letters ,38(18),3620-3622.
3. Fallah, H., Harun, S. W., Mohammed, W. S., & Dutta, J. (2014). Excitation of core modes through side coupling to multimode optical fiber by hydrothermal growth of ZnO NR’s for wide angle optical reception. JOSA B, 31(9),2232-2238.

1


![[TEKNIK VAKUM] Lulu Brianni Puteri 10209024 2](https://static.fdokumen.site/doc/165x107/5571fd324979599169989c95/teknik-vakum-lulu-brianni-puteri-10209024-2.jpg)