Performance Analysis of Islamic Bank Microcredit Scheme in ... · For this investment, RDS charge...
12
PROSIDING PERKEM VI, JILID 1 (2011) 61 – 72 ISSN: 2231-962X Persidangan Kebangsaan Ekonomi Malaysia ke VI (PERKEM VI), Ekonomi Berpendapatan Tinggi: Transformasi ke Arah Peningkatan Inovasi, Produktiviti dan Kualiti Hidup, Melaka Bandaraya Bersejarah, 5 – 7 Jun 2011 Performance Analysis of Islamic Bank Microcredit Scheme in Bangladesh Abul Bashar Bhuiyan ([email protected]) Chamhuri Siwar Institute for Environment and Development Universiti Kebangsaan Malaysia (UKM), Bangi, 43600, Selangor, Malaysia Abdul Ghafar Ismail ([email protected]) Research Center for Islamic Economics and Finance School of Economics Universiti Kebangsaan Malaysia Bangi, 43600 Selangor D.E., Malaysia Mamunur Rashid Graduate School of Business Universiti Kebangsaan Malaysia Bangi, 43600 Selangor D.E., Malaysia ABSTRACT Islamic Microfinance is still an emerging concept even in Bangladesh, the motherland for Microfinance. This study analyzes the allocative, socio-economic and financial performance of RDS for a sample of 14 years from 1996 until 2009. The study finds better coverage efficiency in the villages, by branches, center and employee management. Socio-economic performance is also noteworthy with the introduction of various social activities and financing of microenterprises. Financially, this study suggests evaluating operating cost, investment income and financing options of RDS in details to avoid riskiness in future. Overall, the study puts prominence on adopting modern human resource management techniques, as the Islamic Microfinance is more about dealing with poor people more closely mitigating their socio-economic needs in a spiritual way. Keywords: Islamic Microfinance, Rural Development Services, Bangladesh JEL Classification: G2, N3 INTRODUCTION Poverty is the central problem to sustainable human development. With the increasing diversity in human poverty, an increasing percentage of world population is reported under poverty line every year. While it was difficult for conventional financial institutions to extend financial help to continue the growth potentials of every human being, Microcredit ( microcredit and microfinance are hereafter used interchangeably) came with revolutionary approach by providing the poor the accessibility to the credit to increase their productivity, for reducing vulnerability, and to alleviate poverty through self- employed economic activities. Microcredit deals with the poor those were ignored by formal financial institutions because of not having assets for collateral, enough financial records, and credit history, see, (Chowdhury, 2001; Hossain, 1988; Littlefield, Morduch, & Hashemi, 2003; Mahjabeen, 2007; Morduch, 2000; Wilkins & Jennifer, 2007) Through the hands of Professor Mohammad Yunus, the concept of Microcredit is still insufficient in many aspects to reduce the overall poverty level in Bangladesh (Amin, Rai, & Topa, 2003) . On the same way Studies identified the interest rate charged by Micro-finance Institutions (MFIs’), which has a range of 15% to 20% from institutional and 33% to 120% in non-institutional cases, as one of the major impediments behind the effective financing solution for the poor Bangladesh (Amin, et al., 2003; Kabeer, 2001). In such situation, number of marginal poor people is increasing every year, from 78.2 million poor people in 1970 to 80.46 million people in 2009. (Imai & Azam, 2010; Islam, 2009). Apart from a missing holistic view in poverty reduction, the MFIs’ have not ruminated on the spiritual, moral and ethical dimensions of human-socio-economic development, which is precious in
Transcript of Performance Analysis of Islamic Bank Microcredit Scheme in ... · For this investment, RDS charge...
PROSIDING PERKEM VI, JILID 1 (2011) 61 – 72
ISSN: 2231-962X
Persidangan Kebangsaan Ekonomi Malaysia ke VI (PERKEM VI),
Ekonomi Berpendapatan Tinggi: Transformasi ke Arah Peningkatan Inovasi, Produktiviti dan Kualiti Hidup,
Melaka Bandaraya Bersejarah, 5 – 7 Jun 2011
Performance Analysis of Islamic Bank Microcredit Scheme in
Bangladesh
Abul Bashar Bhuiyan ([email protected])
Chamhuri Siwar
Institute for Environment and Development
Universiti Kebangsaan Malaysia (UKM),
Bangi, 43600, Selangor, Malaysia
Abdul Ghafar Ismail ([email protected])
Research Center for Islamic Economics and Finance
School of Economics
Universiti Kebangsaan Malaysia
Bangi, 43600 Selangor D.E., Malaysia
Mamunur Rashid
Graduate School of Business
Universiti Kebangsaan Malaysia
Bangi, 43600 Selangor D.E., Malaysia
ABSTRACT
Islamic Microfinance is still an emerging concept even in Bangladesh, the motherland for
Microfinance. This study analyzes the allocative, socio-economic and financial performance of RDS
for a sample of 14 years from 1996 until 2009. The study finds better coverage efficiency in the
villages, by branches, center and employee management. Socio-economic performance is also
noteworthy with the introduction of various social activities and financing of microenterprises.
Financially, this study suggests evaluating operating cost, investment income and financing options of
RDS in details to avoid riskiness in future. Overall, the study puts prominence on adopting modern
human resource management techniques, as the Islamic Microfinance is more about dealing with poor
people more closely mitigating their socio-economic needs in a spiritual way.
Keywords: Islamic Microfinance, Rural Development Services, Bangladesh
JEL Classification: G2, N3
INTRODUCTION
Poverty is the central problem to sustainable human development. With the increasing diversity in
human poverty, an increasing percentage of world population is reported under poverty line every year.
While it was difficult for conventional financial institutions to extend financial help to continue the
growth potentials of every human being, Microcredit (microcredit and microfinance are hereafter used
interchangeably) came with revolutionary approach by providing the poor the accessibility to the credit
to increase their productivity, for reducing vulnerability, and to alleviate poverty through self-
employed economic activities. Microcredit deals with the poor those were ignored by formal financial
institutions because of not having assets for collateral, enough financial records, and credit history, see,
(Chowdhury, 2001; Hossain, 1988; Littlefield, Morduch, & Hashemi, 2003; Mahjabeen, 2007;
Morduch, 2000; Wilkins & Jennifer, 2007)
Through the hands of Professor Mohammad Yunus, the concept of Microcredit is still
insufficient in many aspects to reduce the overall poverty level in Bangladesh (Amin, Rai, & Topa,
2003) . On the same way Studies identified the interest rate charged by Micro-finance Institutions
(MFIs’), which has a range of 15% to 20% from institutional and 33% to 120% in non-institutional
cases, as one of the major impediments behind the effective financing solution for the poor Bangladesh
(Amin, et al., 2003; Kabeer, 2001). In such situation, number of marginal poor people is increasing
every year, from 78.2 million poor people in 1970 to 80.46 million people in 2009. (Imai & Azam,
2010; Islam, 2009).
Apart from a missing holistic view in poverty reduction, the MFIs’ have not ruminated on the
spiritual, moral and ethical dimensions of human-socio-economic development, which is precious in
62 Abul Bashar Bhuiyan, Chamhuri Siwar, Abdul Ghafar Ismail, Mamunur Rashid
sustainable human development (M. Ahmed, 2006; Alam, 2009). In the era of high-growth Islamic
banking, the best-fit alternative to conventional Microcredit is Islamic Microcredit, which promises the
same benefits based on Shariah. As Islam provides the complete code of life, the religion covers
poverty reduction as one of the premier agendas. Islam considers that poverty induces other indecent
acts; therefore, poverty should be treated with much care. Among more than three thousand MFIs’ at
present working in Bangladesh, Rural Development Scheme (hereafter referred to as RDS) is the
largest Islamic Microcredit program (M. Ahmed, 2006; Alam, 2009; Habib, Haque, Mian, & Bashar,
2004; M. Mizanur Rahmana, Jafrullahb, & Islamc, 2008; Parveen, 2009; M. Rahman & Ahmad, 2010;
Uddin, 2008).
Despite of the increasing religious sympathy and higher interest rate with the counterparts,
RDS could not able to achieve significant progress in terms of outreach and socio-economic
development. Therefore, it is imperative to critically analyze the performance of RDS to examine the
way forward for better success in future. Applying performance analysis techniques, this study
analyzes the current status of Rural Development Schemes (RDS) offered by Islamic Bank Bangladesh
Limited. The focus of this study is limited of generic performance analysis, whereas the question -
“how Islamic is the RDS” - is out of scope of this study. Specific objectives of the study include
analyzing the allocative efficiency of RDS, the socio-economic contribution, and financial performance
(Risk and Return ratios) of RDS. The study has significance for both policy makers and Islamic MFIs’
(IMFIs’), in terms of setting up future goals and objectives for better Islamic Microcredit framework in
Bangladesh. Section 2 gives a synthesis of the literature review. Section 3 sheds light on Rural
Development Schemes. Section 4 highlights the data, Methodology and Analysis procedure. Section 5
concludes with the results and direction for future researches.
MICROCREDIT SCHEME OF ISLAMIC BANK BANGLADESH LIMITED
Islami Bank Bangladesh Limited started with the major objective of supporting an Islamic economy for
balanced economic growth by ensuring reduction of rural-urban disparity and equitable distribution of
income on the basis of Islamic rules and regulations. It is the largest private bank in Bangladesh and
started in 1983. The bank has been practicing group based microcredit scheme, which is known as
‘Rural Development Scheme (RDS)’. The scheme was launched in 1995 as a pilot program styled after
the Grameen Bank model except that the scheme used Islamic modes of investment based on Shariah
principles. Among many, the primary focus of RDS is to provide the financial access to poor people for
creating opportunity of income generation with a view to alleviate poverty in a sustainable manner
(IBBL, 2009; M. M. Rahman, Jafrullahb, & Islam, 2008).
Some of the objectives of RDS, IBBL are listed below:
To extend investment facilities to agricultural, other farming and off-farming activities in the
rural areas.
To finance self-employment and income generating activities of the rural people, particularly
the rural unemployed youths and the rural poor.
To alleviate rural poverty through integrated rural development approach.
To extend investment facilities for hand tube-wells and rural housing, keeping in view the
needs of safe drinking water and housing facilities of the rural poor
To provide education and Medicare facilities to the down-trodden people.
Initially it started as a pilot operation in the rural areas of several districts under the direct supervision
of the nearby branches of the Bank. At present, it is extended to all the 61 districts out of 64 districts of
the country through 139 Branches of the Bank. The metropolitan areas and three Chittagong Hill
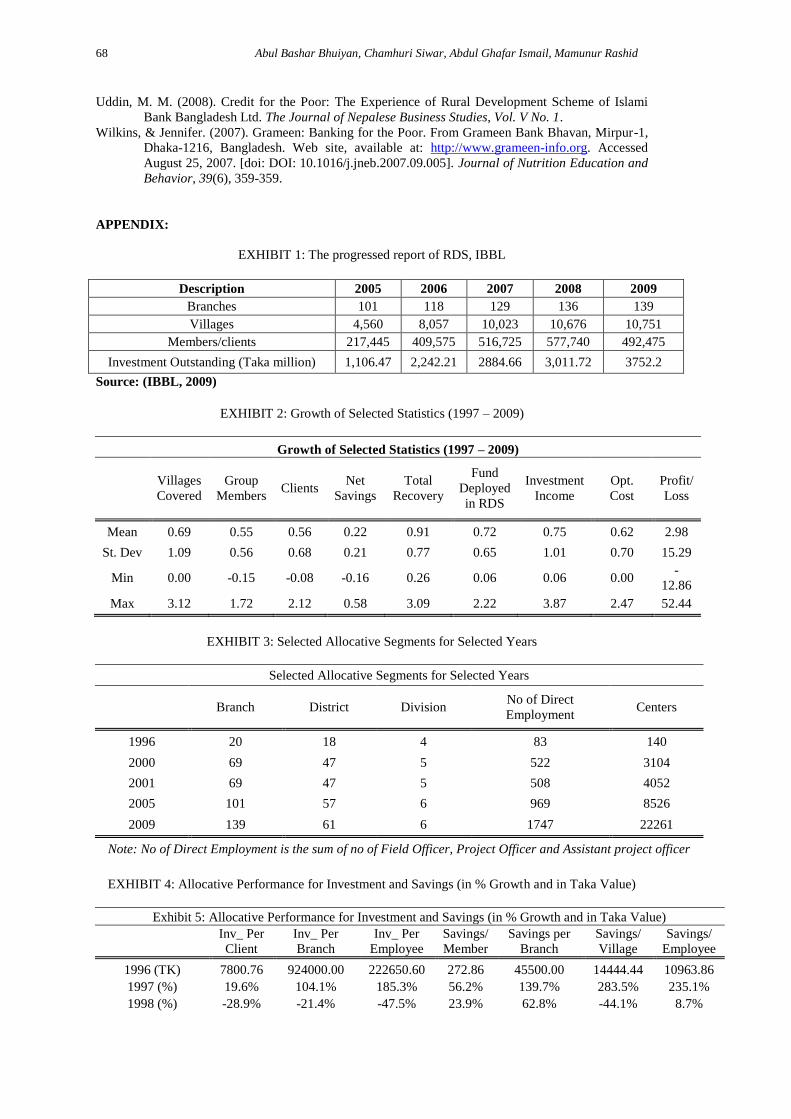
Districts are yet uncovered for strategic reason(IBBL, 2009). Exhibit 1 below provides a highlight of
RDS’s progress.
It has been practicing Murabaha and Bai-muajjal modes of investment for financing. Very
recently, RDS has started Musharaka mode as well. In all cases, the Branch must ensure strict
adherence to the banking and shariah in norms. For this investment, RDS charge only 10 percent profit
on flat rate with a rebate of 2.5 per cent for timely payment while the conventional microcredit
institutions charges 15 to 22 per cent interest for income generation. The investment recovery rate of
RDS is 99.57 per cent in 2009 (IBBL, 2009).
The above explanation shows that RDS is considered as a new paradigm in poverty alleviation
and bring about development (H. Ahmed, 2003). RDS has large positive impact, which is observed in
the case of food intake, housing, education, clothing, taking medical treatment, use of toilet, use of
Prosiding Persidangan Kebangsaan Ekonomi Malaysia Ke VI 2011 63
clear pure water, income, expenditure and as such economic, socio-economic, health and
physiochemical environment (Uddin, 2008). Parveen (2009) argues that RDS of IBBL has been treated
as a sustainable MFI in the rural development and poverty alleviation of Bangladesh with a short span
of time of its establishment. Another study has found that MFIs are based on the implicit assumptions
of social class conflict, so they tend to empower women, whereas Islamic MFIs’ intend to empower
family by ensuring joint liability of husband and wife in case of lending to family or groups of families,
which ensures a mutual liability sharing and cooperation in the family. (Mannan, 2006).
Habib et al. (2003) examine the effectiveness of RDS credit by interviewing a few randomly
selected program beneficiaries located in Sadar and Fulbaria Upazila of Mymensingh district. Most of
the beneficiaries found having required loan money within reasonable time limit during the study
period. Loan was used productively irrespective of loan holder categories. Loan repayment
performance of the beneficiaries was observed to be satisfactory. Self-consciousness and hope of
receiving future loan were observed to be the major contributing factors for good loan repayment
behavior of the beneficiaries. Small borrowers were good re-payers followed by the medium and large
borrowers.
Rahman found in 2008 that most of the clients have utilized their borrowed Money and
increseed household income and expenditure had increased significantly and clients had a positive
opinion towards the microinvestment programme as it improved their standards of living but the reality
is that not all the clients have invested their borrowed money in income generating activities. Instead,
some of them have utilised their investment in house repairing, children’s marriage ceremony and
furniture purchase etc (M. M. Rahman, et al., 2008).
METHODOLOGY
The scope of this study is to perform an appraisal of the performance of Rural Development Schemes
(RDS), the largest Islamic MFI in Bangladesh. Data were collected from Islamic Bank Bangladesh
Headquarter in Dhaka for a total period of 14 years from 1996 until 2009, yearly basis. The data mostly
include balance sheet and income statement information along with some allocative statistics regarding
the coverage, social contribution and human resource engagement. Exhibit 2 and 3 highlight the growth
of some selected statistics, which include villages covered, growth of number of group members and
clients, growth in net savings of the members, growth of recovered amount of investment, fund
deployed under RDS, growth of investment income, operating cost and profit and loss.
The study intends to highlight the performance of RDS from allocative, socio-economic and
financial (risk-return ratios) standpoints. Islamic MFIs are still at the emerging stages and conducting
allocative performance tests are timely for IMFIs. By allocative performance/ efficiency, the study
indicates the allocation of RDS operation into different operational segments by region, branches,
groups of employees, clients and number of group members. These segments can be grouped into two
major areas of concern; internal segments, which includes the branches, groups of employees, clients
and group members, and external segments that includes mainly geographic segments such as the
growth of operation by villages and districts covered. For these categories of analysis, we have also
shown the descriptive statistics (in terms of mean, minimum and maximum) to explain the existing
status of the RDS coverage.
Under the RDS program, IBBL has distributed tube-well for safe water and also have built
sanitary latrine in the remote areas. Some of the members are also given waivers from their payment of
the principal for extreme poverty cases. These issues are categorized as social contribution of RDS.
Likewise, RDS has started giving investment to micro-enterprises. These investments are especially
important for rural economy and, therefore, are considered as input to economical development by
RDS. Finally, risk and return ratios are common in performance analysis studies. To present the extent
of success and riskiness of operation, a number of risk and return ratios are calculated. Calculations and
formulas explained in Hempel and Simonson (1999) are followed for risk and return ratios. The return
and risk ratios are slightly redesigned to fit the need of the study and type of Islamic Microcredit data.
Exhibit 4 shows a highlight of the formulas for allocative and risk, and return performance analyses.
Exhibit 2 shows the growth of Islamic MFIs’ in Bangladesh. The mean growth rate of village
coverage was 69% during the sample period. Group members increased on average at 55% rate every
year, clients at 56%, and net savings of the members at 22%. Growth of recovery of the investment
stood at 91% average, which has supplemented by 72% yearly growth in fund deployed in RDS.
Investment income has grown at 75% over the years, operating cost has grown at 62%, and net average
profit growth after adjustment of cost of fund has grown approximately at 300% over the years. The
64 Abul Bashar Bhuiyan, Chamhuri Siwar, Abdul Ghafar Ismail, Mamunur Rashid
statistics clearly shows how profitable the Islamic MFIs are. However, shortly we will also observe the
riskiness in terms of volatility of income and expenses due to various factors.
Exhibit 3 shows how the operation has been allocated for selected years. RDS was offered
with only 20 branches at the beginning, which is now offered from 139 branches at the end of year
2009. These branches are scattered in 61 districts (out of 64 districts) and in six divisions. The hilly
areas in the Southeastern side of the country are largely uncovered until 2009. Total number of direct
employment, especially as field officers, has increased substantially from only 83 in the first year to
1747 at the end of 2009. Increase in no of centers has outnumbered all other segments, which was only
140 at the end of 1996 and ended up at 22261 in 2009. However, direct employee per center has
decreased drastically, which is an area of concern for member-management in a group based
Microcredit program.
DISCUSSION OF THE RESULTS
This study discusses the performance of Rural Development Schemes (RDS) of IBBL from three
different but integrated standpoints; the allocative (coverage), socio-economic contributions and the
financial performance (through risk-return ratios).
Allocative performance
Allocative performance analysis allows us to understand average coverage of certain operational
variable (such as investment or sales) into a wide variety of allocative segments (such as villages,
branches, and people). Studies conduct allocative performance analysis mostly for the emerging
institutions to examine the coverage and scope of operation. RDS started its operation in 1996 with
only 7800 Taka per client, which stood at 18800 Taka with an average year-to-year growth rate of
8.1%. Likewise, investment per branch has grown at over 40% and investment per employee grew at
32% (approximately) on average (see Exhibit 5). Recent amendments in Microcredit regulation in
Bangladesh allow the institutions to accept deposit to encourage people for saving. Exhibit 4 shows
that savings per member started at only 272.86 Taka per member, which in constant dollar term is
around $3-$3.5. In 2009, savings per member stood at 3023 Taka with an average year-year growth of
22% during 1997-2009. Branches and field officers have played active role in collecting deposit from
the members through group membership and center activities as the savings per branch grew at around
57%, saving per village and per employee grew at 33.5% and 47.8% respectively on an average. These
results indicate that group based models have their benefit within and Microcredit business largely
depends on the field workers and branch activity.
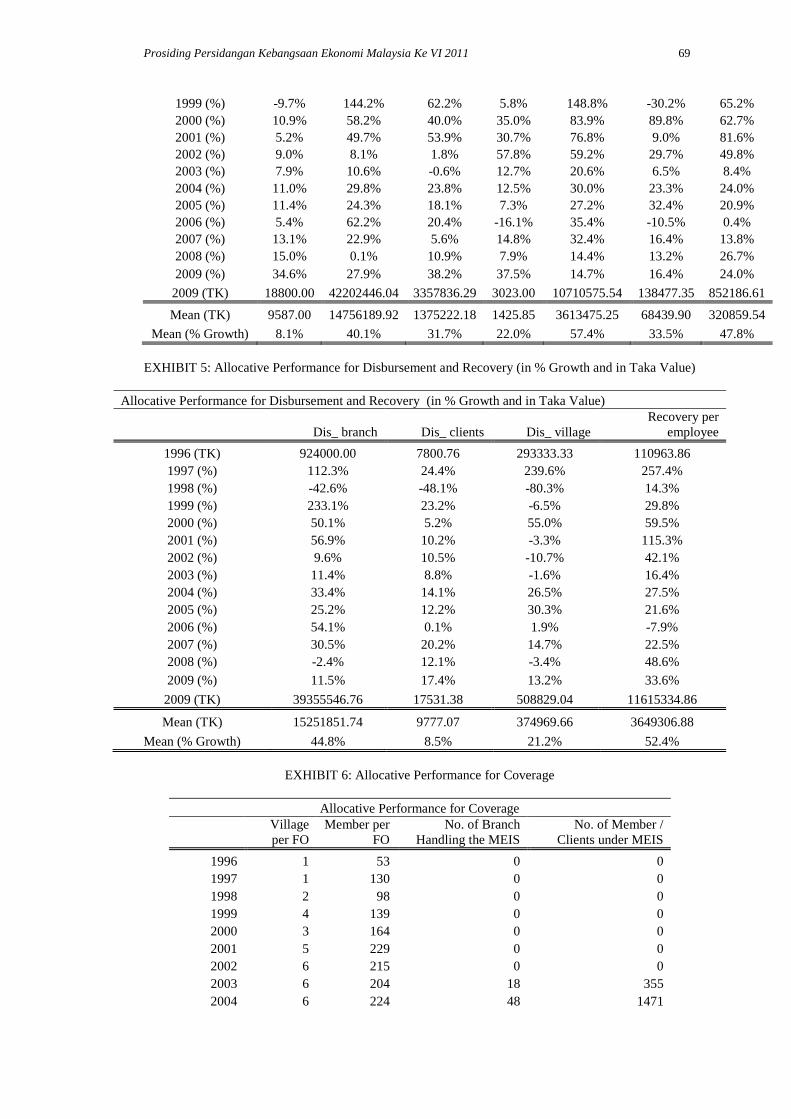
Exhibit 5 shows the percentage growth and Taka value of disbursement and recovery.
Disbursement by branch grew at around 45% every year on an average. However, per client the growth
was only 8.5%, which indicates some variation in the level of disbursement among clients. A client was
borrowing around 7800 Taka ($150 -$155) in 2009, which is more than double in 2009. This indicates
the sustainability issue of the borrower; however, due to changes in inflation rate, it cannot be clearly
related to poverty reduction. Growth of Recovery (some figures are more than 100%, since it the
growth of recovery amount, not the recovery percentage) depends on the effort of all direct employees
and activities in the center under group based microcredit operation. Exhibit 5 shows that recovery per
employee (directly engaged with RDS program both in field and in project offices) has grown over
52% over the years, on average, from 1997 to 2009.
Exhibit 6 highlights the village and members covered by each field officer (FO), no of
branches offering Microenterprise Investment Scheme (MEIS) and no of members under MEIS. The
human resource activeness seems to be the toughest job where each FO has to cover 326 members and
7 villages in the year of 2009. A better sales-force management might be necessary to crop better
result. RDS started serving the Microenterprises from the year 2003. In that year, 18 branches were
given the charge of handling the MIES services, which stood at 135 branches throughout the country
in61 districts. It is amazing to see the growth potentials of MIES as the number of members/ clients
availing the services grew almost to double from 2008 to 2009. The program started with only 355
members and became a 19069 members’ family at the end of 2009.
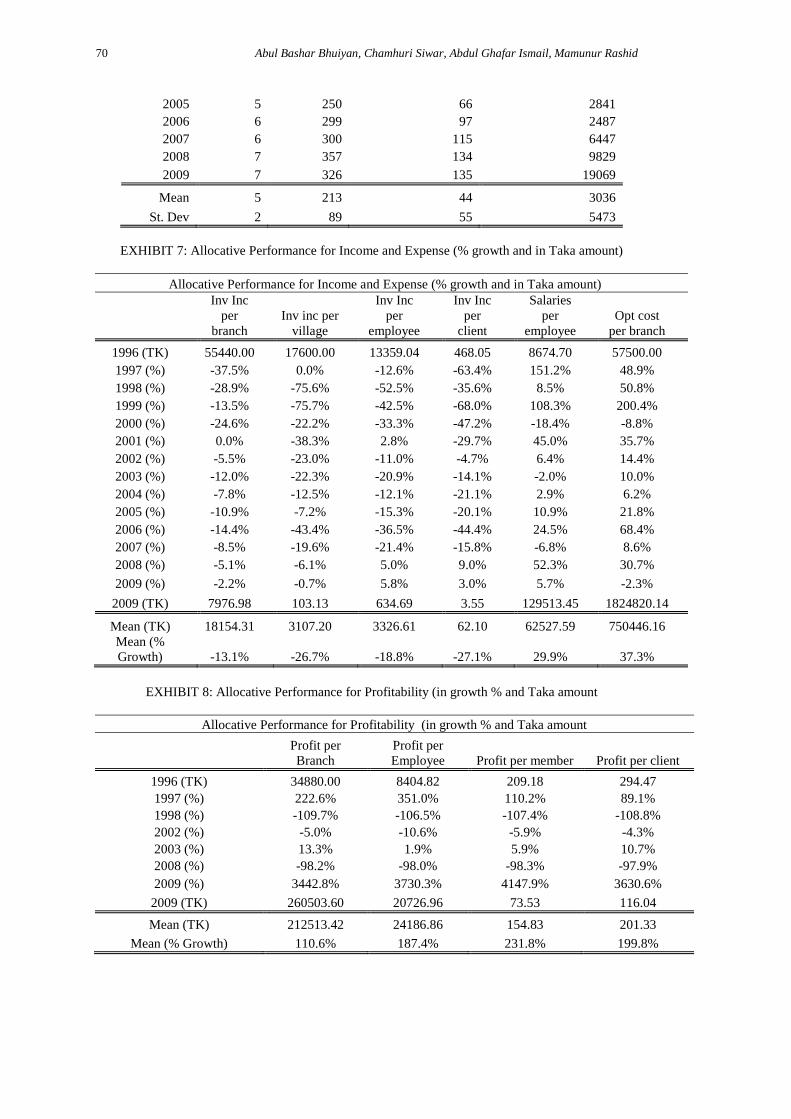
Exhibit 7 gives a picture of the investment income, salaries expenses and operating cost
grouped into various allocative segments. Even though in nominal Taka value the investment income
was positive, due to higher growth in branches (operating with RDS), villages (covered under RDS),
employee (directly working with RDS) and clients (availing investment form RDS), percentage growth
of investment income dividend into these allocative segments shows a negative results. The positive
Prosiding Persidangan Kebangsaan Ekonomi Malaysia Ke VI 2011 65
sign is there as well. Investment income per client in 2008 and 2009 became positive. Salaries per
employee show an average increase of 30% over the years. However, this increase cannot be directly
discussed in the context whether RDS pays too low or too high compared to other microcredit
programs. Operating cost per branch has also increased at around 37% per year on an average. These
are the two important area of concern since successful operation of Microcredit depends on efficient
management of human resources. Salaries expenses carry a major weight in the operating cost. Growth
of net profit has been astonishing (see exhibit 8). Average profit per branch, employee, member and
client all grew average at more than 100% over the years. Due to data shortage, we failed to indentify
the drastic reduction in the profit of 2008 in details. Consequently, the profit of 2009 was even in
1000%. However, due to comparative higher growth of allocative segments, profit per employee and
members was lower in 2009 compared to 1996. To identify the sudden change in the income and
expense statement, we suggest carrying out in-depth analyses on cost and profit efficiency of RDS.
RDS is still a part of IBBL and does not fall under microcredit authority supervising other microcredit
firms in Bangladesh. Therefore, the auditors’ statement should also be taken under consideration.
Socio-economic contribution
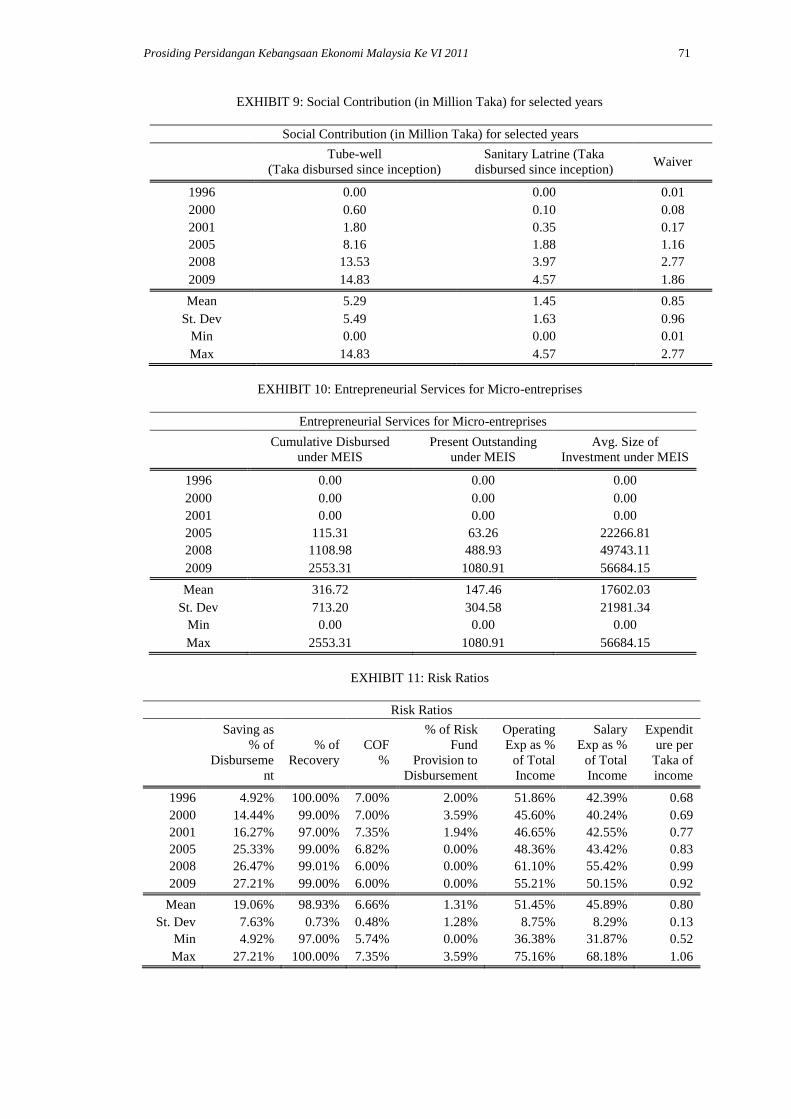
Rural Bangladesh has scarcity of pure water and lack of proper sanitation system. RDS, along with its
investment, has disbursed a huge sum of money for setting up Tube-well and sanitary latrine in the
rural areas. In the year of 2009, a total of 14.83 Million Taka was disbursed for tube-well and 4.57
Million Taka for constructing sanitary latrine in the village areas (Exhibit 10). Islamic finance follows
the principle of waiving fees and even the principal amount if the borrower cannot pay for some
difficulties that satisfy the requirement for waiver. The amount of waiver in Million Taka stood at 1.86
Million in 2009 with an overall 14-year average of 0.85 Million Taka. The maximum amount RDS
waived, 2.77 Million, was in the year of 2008 (Exhibit 10).
Exhibit 10 shows that the cumulative disbursement under MEIS program grew 10 times from
2005 to 2008 and grew more than double further during 2008 and 2009. Present outstanding during
2008-2009 under MEIS grew more than double as well. However, the ratio of disbursement to
outstanding is higher in 2009 when compared with 2008, which indicates some problem with collection
of fund under MEIS. Further analysis is need in this area, while it is significant in rural development.
Mean size of yearly-average investment under MEIS is 17.60 Million per year, which went up to Taka
56.68 Million in 2009. RDS started highlighting the MEIS from 2005. Therefore, the growth until 2009
is far-fetched.
Financial performance: risk and return ratios
Risk and return go hand in hand. Investment involving no risk or excessive risk is prohibited in Islam.
In this subsection, the study presents a number of risk and return ratios. The risk ratios present the
volatility in the amount on a year-by-year basis and for the entire sample of 14 years. These ratios are
related to lack of recovery of investment, changes in cost of fund, lower savings to investment ratio and
others on volatility of income and investment. Return ratios are related to investment income and
profitability.
Exhibit 11 gives a draft of the risk ratios of RDS program. RDS by right is neither a full
pledged bank nor a Microcredit institution. It does not directly fall under the Microcredit authority and
it works as any other department of Islami Bank Bangladesh Limited. Therefore, the savings collected
under RDS program is similar to the Islamic mode of deposit collected by the Bank. The only
difference is the deposit is collected for a number of members under the RDS program, which is of
small amount. The higher percentage of savings reduces RDS’s burden of cost due for borrowing
money for investment purposes. As of 2009, only 27.21% of the disbursement was financed from
savings, meaning the rest is financed from debt. Higher dependency on debt would make the business
for RDS difficult and risky in future. Further, institutions like RDS would help making the banking
industry more competitive as the fight for collecting deposit, especially rural deposit, will increase.
Percentage of recovery has slightly reduced to 99%, however, is still much higher than many
banks. RDS’s recovery system depends on the centers’ capability and efficiency of the field officers.
To build up strong recovery system, close tie with the rural people and understanding of their value
chain are of immense importance. Therefore, efficient field force is necessary and RDS is suggested to
work on this more strategically. RDS is borrowing mostly from the mother organization, IBBL. The
highest cost of fund was 7.35%, where as the lowest was 5.74%. The recent trend of COF is declining.
It becomes stable at 6% during 2008-2009. Since RDS largely depends on the business of IBBL, future
66 Abul Bashar Bhuiyan, Chamhuri Siwar, Abdul Ghafar Ismail, Mamunur Rashid
business trend of IBBL may hurt its COF. Therefore, RDS is suggested to diversify its financing base
to other possible Islamic sources.
Even with a higher percentage growth in disbursement, the risk fund provision as a percentage
of disbursement has not been kept during 2005 to 2009. Lack of the MFI accounting reporting system
and the limitation in data collection narrowed our explanation on why the risk fund has not been kept
or whether this has been kept centrally with IBBL. If RDS is considered as a separate entity and IBBL
has the mentality to establish it as a Microcredit wing, IBBL must report the necessary accounts
separately. Otherwise, the question of credible transparency will be raised. The operating cost to total
income ratio is stable at around 50%, which is a good sign. The operating cost to total income ratio was
as high as 75%. In 2009, the ratio stood at around 55%. This indicates a better cost management under
RDS.
Similar credit goes to salaries expense management. Even though there might be questions on
the credibility of effective compensation management compared to the industry, in generic sense,
salaries expense as a percentage of total income has reduced recently to 50% in 2009 when compared
with the highest of 68% in 1998. Total expenditure per taka of income has increased historically from
0.68 Taka in 1996 to 0.92 Taka in 2009. The average is 0.80 Taka, whereas the highest was 1.06 in
1998. Salaries expenses are still at the core of higher expenditure and expenditure management mostly
depends on how efficiently salaries expenses are managed. Obviously, the prerequisite is to manage the
employee in the most efficiently way.
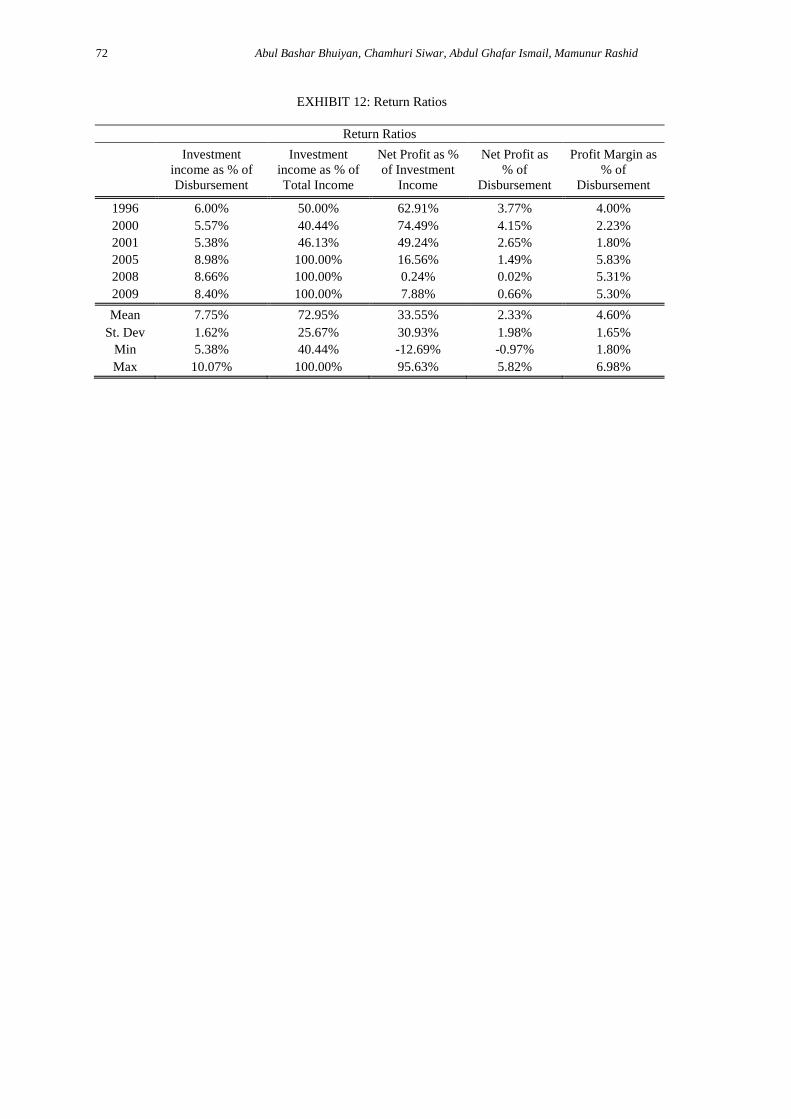
Investment income is the major income for RDS and disbursement is the real value of
investment for a given year. Therefore, a higher percentage of investment income to disbursement can
be explained as the efficient use of the investment fund. The ratio has increased from 6% in 1996 to
8.40% in 2009 with an average of 7.75% over the years. However, the maximum of this ratio was
10.07%, which indicates opportunities for RDS. Investment income became the only income from the
major income during the sample period. Until 2004, investment income was the major income.
However, from 2005 until recently, investment income is the only income for RDS. Therefore, efficient
client management at the center, recovery actions and policies at branches are expected to play major
role in increasing investment income in future.
Net profit as a percentage of investment income shows the efficiency of operating cost
management, investment management and recovery management as well. Higher the ratio better is the
performance. As the number of members, clients and employees are increasing at a higher rate than the
growth of disbursement and investment income, the ratio of net profit to investment income has
reduced to a drastic 7.88% in 2009 from around 50% in 2001. Net profit as a percentage of total
disbursement can be considered as the typical Return of Asset (ROA). Higher ROA is better for the
company. ROA is reducing every year from 3.77% in 1996 to 0.66% in 2009 with an average of 2.33%
during 1996-2009. Profit margin is calculated by deducting interest expense (cost of fund) from interest
income (investment income). Profit margin to disbursement ratio tells us about the operating efficiency
of the firm, where the profit margin can also be called as operating profit margin. Higher ratio would
signal better operating efficiency. As indicated by operating cost and salaries expenses earlier, this ratio
shows a better result with 4.0% in 1996 to an upper level of 5.30% in 2009.
CONCLUSIONS
A summary of the above results can be analyzed further for policy implications. Some of the important
issues are summarized below: First, efficient human resource is the key to success in Microcredit
success in Bangladesh. As Islamic Microfinance considers the clients and members as partners in
different models, building strong link with clients will bring better results in future. Field officers and
project officers should be trained on the process of handling with village people, the consumption need
and their business needs as well. Second, operating cost and operating risk are among the significant
issues the IMFIs’ should look into. Efficient human resources management would increase the
compensation charged by the employees. On the other hand, lack of efficient staffs would create
competitive risk in the field in collecting deposit and investment. As a result, the human resource
management should be more strategic that maximizes the value of the operation. Third, social and
Entrepreneurial contribution should be extended as much as possible with a view to develop the rural
economy. Nationalized and other private and foreign commercial banks failed to serve the rural
economy leaving the hole too wide for the Non-governmental organizations and Microcredit
institutions. Furthermore, RDS should step forwards towards socio-economic contribution because of
its religious motive of operation.
Prosiding Persidangan Kebangsaan Ekonomi Malaysia Ke VI 2011 67
Data availability is an important limitation in IMFIs. Future research may take initiative to ask
the questions on the extent of Islamic operation in Islamic microfinance, on operational efficiency of
the Islamic microfinance, on regulatory sufficiency and worldwide comparison with multi-dimensional
performance indices.
REFERENCES
Ahmed, H. (2003). Frontiers of Islamic Banking: A Synthesis of Social Role and Micro finance. The
European Journal of Management and Public Policy.
Ahmed, M. (2006). Impact of Rural Development Scheme on Poverty Alleviation: A Case Study.
Research, Planning and Development Division Islami Bank Bangladesh Limited.
Alam, M. N. (2009). Interest-Free Microfinance to Micro Entrepreneurs in Rural Bangladesh. Paper
presented at the First International Microfinance Conference on Microfinance.
Amin, S., Rai, A. S., & Topa, G. (2003). Does microcredit reach the poor and vulnerable? Evidence
from northern Bangladesh. [doi: DOI: 10.1016/S0304-3878(02)00087-1]. Journal of
Development Economics, 70(1), 59-82.
Chowdhury, A. (2001). “The Role of Micro-credit in Alleviation of Poverty: A study of the Grameen
Bank in Bangladesh”. Department of Finance and Banking, University of Dhaka, Bangladesh.
Habib, M. A., Haque, M. S., Mian, M. R. U., & Bashar, M. A. (2003). MICRO CREDIT: AN
EXPERIENCE OF ISLAMI BANK BANGLADESH LIMITED. Department of Agricultural
Finance, Bangladesh Agricultural University, Bangladesh.
Habib, M. A., Haque, M. S., Mian, M. R. U., & Bashar, M. A. (2004). Micro Credit: An Experience of
Islami Bank Bangladesh Limited. Department of Agricultural Finance Bangladesh
Agricultural University, Mymensingh-2202, Bangladesh.
Hempel, G. H., & Simonson, D. G. (1999). Bank Management: Text and Cases (5 ed.): Wiley and
Sons.
Hossain, M. (1988). Credit for the Alleviation of Rural Poverty: The Grameen Bank in Bangladesh
(No. No.55). Washington DC.
IBBL, A. R. (2009). Performance of Rural Development Scheme. Dhaka, Bangladesh: Islami Bank
Bangladesh Limited
Imai, K., & Azam, M. (2010). Does Microfinance Reduce Poverty in Bangladesh? New Evidence from
Household Panel Data. Discussion Paper Series.
Islam, N. (2009). Can Microfinance Reduce Economic Insecurity and Poverty? By How Much and
How? : Department of Economic and Social Affairs, United Nations.
Kabeer, N. (2001). Conflicts Over Credit: Re-Evaluating the Empowerment Potential of Loans to
Women in Rural Bangladesh. [doi: DOI: 10.1016/S0305-750X(00)00081-4]. World
Development, 29(1), 63-84.
Littlefield, E., Morduch, J., & Hashemi, S. (2003). Is microfinance an effective strategy to reach the
Millennium Development Goals? Focus Note, 24.
M. Mizanur Rahmana, Jafrullahb, M., & Islamc, A. T. (2008). Rural Development Scheme Bangladesh
Limited (IBBL): Assessment Challenges. IIUM Journal of Economics and Management 16,
no. 2 139-163.
Mahjabeen, R. (2007). Microfinancing in Bangladesh: Impact on households, consumption and
welfare. [doi: DOI: 10.1016/j.jpolmod.2007.12.007]. Journal of Policy Modeling, 30(6),
1083-1092.
Mannan, M. A. (2006). Innovation and Operational Experience of Risk Management of Islamic Micro-
finance Local Challenges and Global Opportunities: A Case Study Approach Paper presented
at the Seventh Harvard University Forum on Islamic Finance.
Morduch, J. (2000). The Microfinance Schism. [doi: DOI: 10.1016/S0305-750X(99)00151-5]. World
Development, 28(4), 617-629.
Parveen, J. A. (2009). Sustainability Issues Of Interest-Free Micro-Finance Institutions In Rural
Development And Poverty Alleviation. The Bangladesh Perspective. Theoretical and
Empirical Researches in Urban Management 2(11).
Rahman, M., & Ahmad, F. (2010). Impact of microfinance of IBBL on the rural poor's livelihood in
Bangladesh: an empirical study. International Journal of Islamic and Middle Eastern Finance
and Management, 3(2), 168-190.
Rahman, M. M., Jafrullahb, M., & Islam, A. T. (2008). Rural Development Scheme Bangladesh
Limited (IBBL): Assessment Challenges. IIUM Journal of Economics and Management 16,
no. 2 139-163.
68 Abul Bashar Bhuiyan, Chamhuri Siwar, Abdul Ghafar Ismail, Mamunur Rashid
Uddin, M. M. (2008). Credit for the Poor: The Experience of Rural Development Scheme of Islami
Bank Bangladesh Ltd. The Journal of Nepalese Business Studies, Vol. V No. 1.
Wilkins, & Jennifer. (2007). Grameen: Banking for the Poor. From Grameen Bank Bhavan, Mirpur-1,
Dhaka-1216, Bangladesh. Web site, available at: http://www.grameen-info.org. Accessed
August 25, 2007. [doi: DOI: 10.1016/j.jneb.2007.09.005]. Journal of Nutrition Education and
Behavior, 39(6), 359-359.
APPENDIX:
EXHIBIT 1: The progressed report of RDS, IBBL
Description 2005 2006 2007 2008 2009
Branches 101 118 129 136 139
Villages 4,560 8,057 10,023 10,676 10,751
Members/clients 217,445 409,575 516,725 577,740 492,475
Investment Outstanding (Taka million) 1,106.47 2,242.21 2884.66 3,011.72 3752.2
Source: (IBBL, 2009)
EXHIBIT 2: Growth of Selected Statistics (1997 – 2009)
Growth of Selected Statistics (1997 – 2009)
Villages
Covered
Group
Members Clients
Net
Savings
Total
Recovery
Fund
Deployed
in RDS
Investment
Income
Opt.
Cost
Profit/
Loss
Mean 0.69 0.55 0.56 0.22 0.91 0.72 0.75 0.62 2.98
St. Dev 1.09 0.56 0.68 0.21 0.77 0.65 1.01 0.70 15.29
Min 0.00 -0.15 -0.08 -0.16 0.26 0.06 0.06 0.00 -
12.86
Max 3.12 1.72 2.12 0.58 3.09 2.22 3.87 2.47 52.44
EXHIBIT 3: Selected Allocative Segments for Selected Years
Selected Allocative Segments for Selected Years
Branch District Division
No of Direct
Employment Centers
1996 20 18 4 83 140
2000 69 47 5 522 3104
2001 69 47 5 508 4052
2005 101 57 6 969 8526
2009 139 61 6 1747 22261
Note: No of Direct Employment is the sum of no of Field Officer, Project Officer and Assistant project officer
EXHIBIT 4: Allocative Performance for Investment and Savings (in % Growth and in Taka Value)
Exhibit 5: Allocative Performance for Investment and Savings (in % Growth and in Taka Value)
Inv_ Per
Client
Inv_ Per
Branch
Inv_ Per
Employee
Savings/
Member
Savings per
Branch
Savings/
Village
Savings/
Employee
1996 (TK) 7800.76 924000.00 222650.60 272.86 45500.00 14444.44 10963.86
1997 (%) 19.6% 104.1% 185.3% 56.2% 139.7% 283.5% 235.1%
1998 (%) -28.9% -21.4% -47.5% 23.9% 62.8% -44.1% 8.7%
Prosiding Persidangan Kebangsaan Ekonomi Malaysia Ke VI 2011 69
1999 (%) -9.7% 144.2% 62.2% 5.8% 148.8% -30.2% 65.2%
2000 (%) 10.9% 58.2% 40.0% 35.0% 83.9% 89.8% 62.7%
2001 (%) 5.2% 49.7% 53.9% 30.7% 76.8% 9.0% 81.6%
2002 (%) 9.0% 8.1% 1.8% 57.8% 59.2% 29.7% 49.8%
2003 (%) 7.9% 10.6% -0.6% 12.7% 20.6% 6.5% 8.4%
2004 (%) 11.0% 29.8% 23.8% 12.5% 30.0% 23.3% 24.0%
2005 (%) 11.4% 24.3% 18.1% 7.3% 27.2% 32.4% 20.9%
2006 (%) 5.4% 62.2% 20.4% -16.1% 35.4% -10.5% 0.4%
2007 (%) 13.1% 22.9% 5.6% 14.8% 32.4% 16.4% 13.8%
2008 (%) 15.0% 0.1% 10.9% 7.9% 14.4% 13.2% 26.7%
2009 (%) 34.6% 27.9% 38.2% 37.5% 14.7% 16.4% 24.0%
2009 (TK) 18800.00 42202446.04 3357836.29 3023.00 10710575.54 138477.35 852186.61
Mean (TK) 9587.00 14756189.92 1375222.18 1425.85 3613475.25 68439.90 320859.54
Mean (% Growth) 8.1% 40.1% 31.7% 22.0% 57.4% 33.5% 47.8%
EXHIBIT 5: Allocative Performance for Disbursement and Recovery (in % Growth and in Taka Value)
Allocative Performance for Disbursement and Recovery (in % Growth and in Taka Value)
Dis_ branch Dis_ clients Dis_ village
Recovery per
employee
1996 (TK) 924000.00 7800.76 293333.33 110963.86
1997 (%) 112.3% 24.4% 239.6% 257.4%
1998 (%) -42.6% -48.1% -80.3% 14.3%
1999 (%) 233.1% 23.2% -6.5% 29.8%
2000 (%) 50.1% 5.2% 55.0% 59.5%
2001 (%) 56.9% 10.2% -3.3% 115.3%
2002 (%) 9.6% 10.5% -10.7% 42.1%
2003 (%) 11.4% 8.8% -1.6% 16.4%
2004 (%) 33.4% 14.1% 26.5% 27.5%
2005 (%) 25.2% 12.2% 30.3% 21.6%
2006 (%) 54.1% 0.1% 1.9% -7.9%
2007 (%) 30.5% 20.2% 14.7% 22.5%
2008 (%) -2.4% 12.1% -3.4% 48.6%
2009 (%) 11.5% 17.4% 13.2% 33.6%
2009 (TK) 39355546.76 17531.38 508829.04 11615334.86
Mean (TK) 15251851.74 9777.07 374969.66 3649306.88
Mean (% Growth) 44.8% 8.5% 21.2% 52.4%
EXHIBIT 6: Allocative Performance for Coverage
Allocative Performance for Coverage
Village
per FO
Member per
FO
No. of Branch
Handling the MEIS
No. of Member /
Clients under MEIS
1996 1 53 0 0
1997 1 130 0 0
1998 2 98 0 0
1999 4 139 0 0
2000 3 164 0 0
2001 5 229 0 0
2002 6 215 0 0
2003 6 204 18 355
2004 6 224 48 1471
70 Abul Bashar Bhuiyan, Chamhuri Siwar, Abdul Ghafar Ismail, Mamunur Rashid
2005 5 250 66 2841
2006 6 299 97 2487
2007 6 300 115 6447
2008 7 357 134 9829
2009 7 326 135 19069
Mean 5 213 44 3036
St. Dev 2 89 55 5473
EXHIBIT 7: Allocative Performance for Income and Expense (% growth and in Taka amount)
Allocative Performance for Income and Expense (% growth and in Taka amount)
Inv Inc
per
branch
Inv inc per
village
Inv Inc
per
employee
Inv Inc
per
client
Salaries
per
employee
Opt cost
per branch
1996 (TK) 55440.00 17600.00 13359.04 468.05 8674.70 57500.00
1997 (%) -37.5% 0.0% -12.6% -63.4% 151.2% 48.9%
1998 (%) -28.9% -75.6% -52.5% -35.6% 8.5% 50.8%
1999 (%) -13.5% -75.7% -42.5% -68.0% 108.3% 200.4%
2000 (%) -24.6% -22.2% -33.3% -47.2% -18.4% -8.8%
2001 (%) 0.0% -38.3% 2.8% -29.7% 45.0% 35.7%
2002 (%) -5.5% -23.0% -11.0% -4.7% 6.4% 14.4%
2003 (%) -12.0% -22.3% -20.9% -14.1% -2.0% 10.0%
2004 (%) -7.8% -12.5% -12.1% -21.1% 2.9% 6.2%
2005 (%) -10.9% -7.2% -15.3% -20.1% 10.9% 21.8%
2006 (%) -14.4% -43.4% -36.5% -44.4% 24.5% 68.4%
2007 (%) -8.5% -19.6% -21.4% -15.8% -6.8% 8.6%
2008 (%) -5.1% -6.1% 5.0% 9.0% 52.3% 30.7%
2009 (%) -2.2% -0.7% 5.8% 3.0% 5.7% -2.3%
2009 (TK) 7976.98 103.13 634.69 3.55 129513.45 1824820.14
Mean (TK) 18154.31 3107.20 3326.61 62.10 62527.59 750446.16
Mean (%
Growth) -13.1% -26.7% -18.8% -27.1% 29.9% 37.3%
EXHIBIT 8: Allocative Performance for Profitability (in growth % and Taka amount
Allocative Performance for Profitability (in growth % and Taka amount
Profit per
Branch
Profit per
Employee Profit per member Profit per client
1996 (TK) 34880.00 8404.82 209.18 294.47
1997 (%) 222.6% 351.0% 110.2% 89.1%
1998 (%) -109.7% -106.5% -107.4% -108.8%
2002 (%) -5.0% -10.6% -5.9% -4.3%
2003 (%) 13.3% 1.9% 5.9% 10.7%
2008 (%) -98.2% -98.0% -98.3% -97.9%
2009 (%) 3442.8% 3730.3% 4147.9% 3630.6%
2009 (TK) 260503.60 20726.96 73.53 116.04
Mean (TK) 212513.42 24186.86 154.83 201.33
Mean (% Growth) 110.6% 187.4% 231.8% 199.8%
Prosiding Persidangan Kebangsaan Ekonomi Malaysia Ke VI 2011 71
EXHIBIT 9: Social Contribution (in Million Taka) for selected years
Social Contribution (in Million Taka) for selected years
Tube-well
(Taka disbursed since inception)
Sanitary Latrine (Taka
disbursed since inception) Waiver
1996 0.00 0.00 0.01
2000 0.60 0.10 0.08
2001 1.80 0.35 0.17
2005 8.16 1.88 1.16
2008 13.53 3.97 2.77
2009 14.83 4.57 1.86
Mean 5.29 1.45 0.85
St. Dev 5.49 1.63 0.96
Min 0.00 0.00 0.01
Max 14.83 4.57 2.77
EXHIBIT 10: Entrepreneurial Services for Micro-entreprises
Entrepreneurial Services for Micro-entreprises
Cumulative Disbursed
under MEIS
Present Outstanding
under MEIS
Avg. Size of
Investment under MEIS
1996 0.00 0.00 0.00
2000 0.00 0.00 0.00
2001 0.00 0.00 0.00
2005 115.31 63.26 22266.81
2008 1108.98 488.93 49743.11
2009 2553.31 1080.91 56684.15
Mean 316.72 147.46 17602.03
St. Dev 713.20 304.58 21981.34
Min 0.00 0.00 0.00
Max 2553.31 1080.91 56684.15
EXHIBIT 11: Risk Ratios
Risk Ratios
Saving as
% of
Disburseme
nt
% of
Recovery
COF
%
% of Risk
Fund
Provision to
Disbursement
Operating
Exp as %
of Total
Income
Salary
Exp as %
of Total
Income
Expendit
ure per
Taka of
income
1996 4.92% 100.00% 7.00% 2.00% 51.86% 42.39% 0.68
2000 14.44% 99.00% 7.00% 3.59% 45.60% 40.24% 0.69
2001 16.27% 97.00% 7.35% 1.94% 46.65% 42.55% 0.77
2005 25.33% 99.00% 6.82% 0.00% 48.36% 43.42% 0.83
2008 26.47% 99.01% 6.00% 0.00% 61.10% 55.42% 0.99
2009 27.21% 99.00% 6.00% 0.00% 55.21% 50.15% 0.92
Mean 19.06% 98.93% 6.66% 1.31% 51.45% 45.89% 0.80
St. Dev 7.63% 0.73% 0.48% 1.28% 8.75% 8.29% 0.13
Min 4.92% 97.00% 5.74% 0.00% 36.38% 31.87% 0.52
Max 27.21% 100.00% 7.35% 3.59% 75.16% 68.18% 1.06
72 Abul Bashar Bhuiyan, Chamhuri Siwar, Abdul Ghafar Ismail, Mamunur Rashid
EXHIBIT 12: Return Ratios
Return Ratios
Investment
income as % of
Disbursement
Investment
income as % of
Total Income
Net Profit as %
of Investment
Income
Net Profit as
% of
Disbursement
Profit Margin as
% of
Disbursement
1996 6.00% 50.00% 62.91% 3.77% 4.00%
2000 5.57% 40.44% 74.49% 4.15% 2.23%
2001 5.38% 46.13% 49.24% 2.65% 1.80%
2005 8.98% 100.00% 16.56% 1.49% 5.83%
2008 8.66% 100.00% 0.24% 0.02% 5.31%
2009 8.40% 100.00% 7.88% 0.66% 5.30%
Mean 7.75% 72.95% 33.55% 2.33% 4.60%
St. Dev 1.62% 25.67% 30.93% 1.98% 1.65%
Min 5.38% 40.44% -12.69% -0.97% 1.80%
Max 10.07% 100.00% 95.63% 5.82% 6.98%