Development of Tourism Industry Its Impact Langkawi Island ... · Jurnal Ekonorni Mctktysia 48(2)...
12
Jurnal Ekonorni Mctktysia 48(2) 2014 7l - 82 Development of Tourism Industry and Its Impact on Langkawi Island Community (Pembangunan Industri Pelancongan dan Kesan kepada Komuniti kmpatan di Langkawi) Norlida Hanim Mohd Salleh Redzuan Othman Siti Hajar Mohd Idris Sharina Abdul Halim MD Shafiin Shukor Ishak Yussof Mohd Samsudin u,i,".,itrilf,#g:ilTru'ur,,u ABSTRACT Langkawi Island is one of the most popular tourist destinations in Malaysia among both domestic and international tourists. The development of the tourism industry on this island has brought direct and indirect impact to the local communities. The objective of the present study is to analyze the impact of tourism development on the local communilt of Langkawi. This study is based on the perspectives of 493 local residents selected using multistage cluster sampling. Questionnaires qre used as an instrument to collect data via a face to face interview in predetermined locations which are in proximity to tourist destination areas. Based on the social exchange theory $er), 24 variables are examined. Statistical techniques used to analyze data in this study include mean analysis, exploratory factor analysis (zr,l) and regression analysis. The results for the mean analysis show thatfive variables that have the highest mean score qre; increasing the provision of appropriate employment opportunities (4.15); encouraging tourists to come and spend their money in Langkawi (a.|a); increasing communityb pride in their own culture G 09); providing employment opportunity for the local residents (a.09); and attracting investors to Langkawi (4.07). Exploratory factor analysis (oru) is conducted resulting in all the 24 variables grouped into 4 constructs namely economic, social, cultural and environmental factors. However, only social, cultural and economic factors are statistically significant in influencing the overall perceptions on tourism development impact on the island based on a multiple regression analysis. Although environmental factor is not significant in the regression model, based on the mean analysis this sndy concludes that there is a slight environmental degradation due to tourism development on this island. The mean analysis also shows that in general, the community perceived that tourism development brings positive impact. Hence, local community b active participation in the industry is encouraged. Stakeholders in the tourism industry in Langkawi such as the federal and state governments; and private agencies, must engage in more proactive initiatives to ensure continuous participation from the local community which consequently will result in a long run sustainable development of the tourism industry on the island. Keywords: Community; Langkawi Island; tourism development; tourism impacts ABSTMK Pulau Langkawi adalah antara destinasi pelancong domestik dan antarqbangsd yang paling popular di Malaysia. Pembangunan industri pelancongan telah banyak membawa kesan langsung dan tidak langsung kepada komuniti tempdtan. Objektif kajian ini untuk menganalisis kesan pembangunan pelancongan kepada komuniti tempatan di Langkawi. Kajian ini berdasarkan kepada perspektif493 komuniti tempaton dipilih berdasarkan persampelan klustur berperingkat. Kajian adalah berdasarkan Teori Pertukaran Sosial (Social Exchane Theory - SEr). Soal selidik digunakan sebagai instrumen untuk menguntpul maklumat melalui temubual bersemuka di beberapa lokasi yang dipilih di kawasan pelancongan. Teknik statistik yang digunakan untuk menganalisis data ialah anolisis min, analisis.faktor penerokaan (wl) dan analisis regresi berbilang. Sejumlah 24 pemboleh ubah dianalisis dalam teori SET. Dapatan daripada analisis min mendapati lima pembolehubah yang memperoleh skor min tertinggi adalah; meningkatkan penyediaan peluang pekerjaan yang sesuai (4 15), menggalakkan pelancong untuk datang clan membelcrnjakan wang mereka di Langkawi (4.14); weningkatkan kebcmggaan ntasltarakot dalam budaya mereka (4,09), menltsiiol{on pelttang pekerjaan kepada pencluduk tenxpatan G.09); dcm mencu'ik pelctbur ke Langkawi (4.07). Daripada analisis.faktor penerokaan (t,r,,l) kesennta 24 pentboleh uboh ini clikelotnpokkart ke dalant 4 konstruk iaittt faktor ekonomi, sosial, bttclaya dan alant
Transcript of Development of Tourism Industry Its Impact Langkawi Island ... · Jurnal Ekonorni Mctktysia 48(2)...

Jurnal Ekonorni Mctktysia 48(2) 2014 7l - 82
Development of Tourism Industry and Its Impact on Langkawi Island Community
(Pembangunan Industri Pelancongan dan Kesan kepada Komuniti kmpatan di Langkawi)
Norlida Hanim Mohd SallehRedzuan Othman
Siti Hajar Mohd IdrisSharina Abdul HalimMD Shafiin Shukor
Ishak YussofMohd Samsudin
u,i,".,itrilf,#g:ilTru'ur,,u
ABSTRACT
Langkawi Island is one of the most popular tourist destinations in Malaysia among both domestic and internationaltourists. The development of the tourism industry on this island has brought direct and indirect impact to the localcommunities. The objective of the present study is to analyze the impact of tourism development on the local communiltof Langkawi. This study is based on the perspectives of 493 local residents selected using multistage cluster sampling.
Questionnaires qre used as an instrument to collect data via a face to face interview in predetermined locations whichare in proximity to tourist destination areas. Based on the social exchange theory $er), 24 variables are examined.
Statistical techniques used to analyze data in this study include mean analysis, exploratory factor analysis (zr,l) andregression analysis. The results for the mean analysis show thatfive variables that have the highest mean score qre;
increasing the provision of appropriate employment opportunities (4.15); encouraging tourists to come and spend
their money in Langkawi (a.|a); increasing communityb pride in their own culture G 09); providing employment
opportunity for the local residents (a.09); and attracting investors to Langkawi (4.07). Exploratory factor analysis(oru) is conducted resulting in all the 24 variables grouped into 4 constructs namely economic, social, cultural andenvironmental factors. However, only social, cultural and economic factors are statistically significant in influencingthe overall perceptions on tourism development impact on the island based on a multiple regression analysis. Althoughenvironmental factor is not significant in the regression model, based on the mean analysis this sndy concludes thatthere is a slight environmental degradation due to tourism development on this island. The mean analysis also showsthat in general, the community perceived that tourism development brings positive impact. Hence, local community b
active participation in the industry is encouraged. Stakeholders in the tourism industry in Langkawi such as the
federal and state governments; and private agencies, must engage in more proactive initiatives to ensure continuousparticipation from the local community which consequently will result in a long run sustainable development of the
tourism industry on the island.
Keywords: Community; Langkawi Island; tourism development; tourism impacts
ABSTMK
Pulau Langkawi adalah antara destinasi pelancong domestik dan antarqbangsd yang paling popular di Malaysia.Pembangunan industri pelancongan telah banyak membawa kesan langsung dan tidak langsung kepada komunititempdtan. Objektif kajian ini untuk menganalisis kesan pembangunan pelancongan kepada komuniti tempatan diLangkawi. Kajian ini berdasarkan kepada perspektif493 komuniti tempaton dipilih berdasarkan persampelan klusturberperingkat. Kajian adalah berdasarkan Teori Pertukaran Sosial (Social Exchane Theory - SEr). Soal selidik digunakansebagai instrumen untuk menguntpul maklumat melalui temubual bersemuka di beberapa lokasi yang dipilih di kawasanpelancongan. Teknik statistik yang digunakan untuk menganalisis data ialah anolisis min, analisis.faktor penerokaan(wl) dan analisis regresi berbilang. Sejumlah 24 pemboleh ubah dianalisis dalam teori SET. Dapatan daripada analisismin mendapati lima pembolehubah yang memperoleh skor min tertinggi adalah; meningkatkan penyediaan peluangpekerjaan yang sesuai (4 15), menggalakkan pelancong untuk datang clan membelcrnjakan wang mereka di Langkawi(4.14); weningkatkan kebcmggaan ntasltarakot dalam budaya mereka (4,09), menltsiiol{on pelttang pekerjaan kepadapencluduk tenxpatan G.09); dcm mencu'ik pelctbur ke Langkawi (4.07). Daripada analisis.faktor penerokaan (t,r,,l)
kesennta 24 pentboleh uboh ini clikelotnpokkart ke dalant 4 konstruk iaittt faktor ekonomi, sosial, bttclaya dan alant
72 Jtu'nol Ekonomi Malaysia 48(2)
dalam mempengarLthi persepsi menyelunth terhadap kesan pembctngunon pelancongan di Langkawi. lVahupunfaktoralam sekitor tidakpenting dalam analisis regresi, tetapi melalui analisis min terdapat sedikit kemerosoton alam sekitar
akibat pembangunan pelancongan di pulau ini. Analisis min jugct menunjukkan bahawa secara umumnya, komuniti
berpandangan bahawa pelancongan membawa kesan keseluruhan yang positif. Oleh itu, penyertaan aktif komuniti
tempatan di dalam industri pelancongan digalakkan. Pihak berkepentingan clalam industri pelancongan di Langkawi
seperti Kerajaqn Persekutuan/Negeri/Tempatan dan agensi-agensi swasta, mesti melibatkan diri secara aktif dan lebih
proaktif untuk memastikan penyertaon berterusan dari komuniti setempat. Ini membolehkan pembangunan lestarijangka panjang industri pelancongan di Langkawi.
Kata kunci; Komuniti; Pulau Langkawi; pembangunan pelancongan; impakpelancongan; teori pertukaran sosial
INTRODUCTION
Langkawi Island is one of the most popular touristdestinations in Malaysia. Overall, Langkawi has an area
(including the surrounding islands) of about 478.48 km2.
Of these islands, only three are inhabited: LangkawiIsland, Dayang Bunting Island and Tuba Island. LangkawiIsland is covered by forested mountains, hills and nativeplants, and surrounded with limestone structures. It islocated approximately 30 km from Kuala Perlis; 51.5 kmfrom Kuala Kedah; and 109 km from Penang.
Langkawi's natural and man-made tourism products
transformed this island into a famous tourist destinationespecially after it was declared a duty-free islandby the Malaysian government in 1981 . Economicdevelopment in Langkawi was further boosted followingthe establishment of Langkawi Development Board(reoa) in 1990. LADA is responsible for planning and
implementing development in Langkawi. However,both public and private agencies are actively involvedin tourism related programs and activities to expedite
tourism development on this island and consequently
contribute to overall national development (Yussof &Omar 2007).
Before Langkawi became a popular touristdestination, the main source of income for the localcommunity was from agricultural and fishery activities.Most were either small-scale farmers or traditionaloffshore fishermen. However, tourism developmentsin this island have gradually transformed the economic
activities of the local community. Business and service
sectors which are mostly tourism based provide neweconomic opportunities for the local community togarner income.
This island is often associated with legends thathave fugher increase the island's appeal to tourist. The
most well-known of the legend is the tale of Mahsuriand her cursed that lasted for seven generations on the
island. Hence, besides the town of Kuah, locations that
are associated to these legends such as Beras Terbakaq
Padang Masirat, Pasir Hitam beach, Perigi Tujuh,Dayang Bunting Island and Mahsuri mausoleum have
been developed for tourism purposes. Since the islandis also endowed with beautiful beaches. beach-related
tourism has been explored especially in Chenang and
Tengah beaches.
To capture demand from both domestic andinternational tourist, various programs have beenundertaken to improve the image of Langkawi since
1 99 1 . This includes organizing internationally recognized
events such as Langkawi International Maritime and
Aerospace Exhibition (I-Irvte) on a bi-annual basis,Le Tour de Langkawi, Langkawi Ironman Triathlon,International Paintball and the Langkawi InternationalRegatta. Langkawi Island was also declared by uNrscoas the first Geopark in South East Asia in 2007. Therecognition ofthis Geopark at a global level will bring inmore visitors, researchers and nature enthusiasts.
Due to these intemational events, the number ofbothdomestic and international tourist arrivals to Langkawihas been increasing significantly. ln 2000, Langkawi was
visited by I ,81 0,460 tourists, and increased to 2.3 millionin 2008 arrd2.4 million in 2010. The increase in touristarrivals has spurred a corresponding increase in demand
within the tourism service industry. The govemment,private sectors andlocal communities have experienced a
considerable amount of economic development as a resultof the booming tourism industry in Langkawi Island.
The developments that are taking place on the Islandhave brought socio-economic changes to the island'spopulation. The changes act as a catalyst for rapidtourism growth on the Island. To further sustain growthand developments of this industry the involvement ofthe local communities is deemed critical (Anand & Sen
2000). The marginalization of the local communitiesfrom the tourism planning and development stages willreduce the chances ofits success. Such marginalizationcould worsen the livelihood of the local community byincreasing socio-economic disparities.
The present study analyzes the impact of tourismdevelopment on local communities on Langkawi Island.
The evaluation and analysis ofthe positive and negative
tourism development impact on the island are basedprimarily on the perspective of the local community.Specifically, this study aims to:
Analyze tourism impacts from four different aspects
which are economic, social, cultural and environmentalIdentify significant variables that affect the economic,
social, cultural and environtnental irnpacts ori LangkawiIsland.
The discussion of this papel is stntctured as follows,the introduction to the developnrent of tourism industty

Development of Tourism Industt'v and lts Impact on Longkawi Island Community
in Langkawi Island, a literature sllrvey/reviews on the
impact of tourism development, an outline of the scope
and methodology used presentation and discussion ofthefindings. The final section presents the conclusion and
implications of the present study.
LITERATURE REVIEW
Extensive empirical studies conclude that tourism affects
local communities positively and negatively. If the localpopulation perceives tourism as benefitting them, they
will embrace and actively participate in the industry (Liuand Wall 2006;Kayat 2008). However, the converse is
also true.In general, researchers find that tourism development
brings changes to local communities.This developmentis able to spur positive socio-economic changes andtransform economic activities of the local community(Garegnani 1970). However, for these changes to occur,the local community must be included and must alsoparticipate actively in the development process as toachieve sustainable development at the tourist destination
area (Anand & Sen 2000). The locals must be givenpriority in terms ofjob opportunities in tourism-relatedbusinesses. If the industry is unable to provide jobopportunities, the traditional economic activities willremain and no economic progress will occur (Todaro
1995), which causes them to remain in poverty (Ranis,
Stewart & Ramirez 2000). The failure to bring aboutpositive changes will then result in a negative perception
towards tourism development among the locals and thusthe future success oftourism development activities may
be hampered (Andriotis 2005).Studies in the literature also examine the impacts
oftourism development from various perspectives. Forinstance, Andereck et al. (2005) Sirakaya et al. (2001);Jurowski et al. (1997); and Pearce (1991) findthattourismdevelopment impact is evaluated by the locals in terms
of quality of life; or the three forms of sustainability:economic, socio-cultural (culture and social) andenvironmental (physical environment). According toKang et al. (2008), tourism development not only changes
the physical landscape ofa given tourist destination, butalso results in social changes within the community.Social changes may occur through various ways (Eshliki& Kaboudi 2012), parlicularly in the attitude and behaviorof the locals (Lawton 2005).
Meanwhile, results from a study among theindigenous people in Malaysia by ZwiattnfadzliahSahdan et al. (2009) finds that high tourist arrivals, whichwas taken as a proxy for tourism development, influences
cultural aspects of a community, including clothing, food,
handicrafts and language. Tourism development also
injects positive values into their traditional way of life,family relationship and individual behavior and on the
cornrnunity itself (Zuriatunfadzliah Sahdan et al. 2009).
However, negative tourism impacts are mostly related tosocial problems, such as criminal cases, robbery snatchthief, sex and drugs.
Tourism development also has a direct effect on theenvironment of a given tourist destination area. The effecton the physical environment includes effect on the naturalelements that initially had attracted tourists to visit.However, irresponsible attitudes and poor managementtowards the environment by a community obsessed withrapid development can negatively affect the physicalenvironment. The deterioration in the environment willinclude pollution, noise, and loss of habitat, erosionand sedimentation. An influx of tourists that exceedsthe carrying capacity of a given destination will resultin the environmental deterioration of the destination(Jahi et al. 2009). Other environmental impacts includethe impact of tourism on air qualiry originating fromthe release of smoke containing carbon monoxide andsulphur dioxide gases. Unfortunately, air pollution are
apparently inevitable during the development phase ofa tourism industry because the development has a directgrowth effect on the public transport sectol such as buses
and taxis. Emission from the increase volume of traffics inthese destinations will consequently lower the air quality.
Hence, before any development is undertaken inorder to enhance tourism expansion and economicsgrowth (Siti Shuhadaetal.20l3, Othman & Salleh 2010),it is crucial for a comprehensive study to be made on theeffects of tourism development to the local economy,socio-culture and environment. The effects analyzeshould include direct and indirect effects, be it in the shortrun or the long run. The concept of sustainability mustbe made an important objective in tourism developmentas it includes important environmental processes to be
considered in safeguarding the daily lives of the localpopulations (Schmandt & Bloomberg 1969).
METHODOLOGY
This study uses both secondary and primary datato analyze tourism impacts in Langkawi Island.Secondary data is collected to give a better overviewand understanding of the issue under study and these
are gathered from various state and district publications.Primary data was collected after a few field visits toensure proper procedure was executed in the samplingand data collection processes.
Discussion on this section will focus on thetheoretical framework, location and sampling method,research instrument and the statistical analysis used inthis study.
THEORETICAL FRAMEWORK
The present study is prerrised upon the social exchangetheory (ser) as developed by Latane and Wolf (1981).
73

sET is one of the frameworks that are often used byresearchers to examine the attitudes of members of a
community (Byrd et aL.2009; Gursoy et al. 2010) and
explains the reaction of such individuals as the results
of development project and policy being implemented(Nunkoo & Ramkissoon 2011). As a result, the sEr is
applied in a variety of disciplines, including psychology;politics and administration; and law (Husbands 1998;
Madrigal 1993;Lankford & Howard 1994;Ritchie 1984).
Srt is also used to investigate community responses and
perceptions oftourism events that affect them individuallyor as a community in the aspects of economic, social,
cultural and environmental. Common statistical analyses
employed in SET frameworks include regression analysis
and structural equation modeling (snu).
STIJDY LOCATION AND SAMPLINGMETHOD "
A multistage cluster sampling technique was used inthis study. Langkawi Island is divided into six clusters
represented by the regional districts in the island.Each cluster was then divided into sub clusters whichencompasses smaller zones in each district. All touristdestination areas were subsequently identified in each
sub cluster. Since the study focuses on tourism impact on
local community, data collection was done in the selected
sub cluster tourism areas which included Kuah Town,Padang Mat Sirat, Ayer Hangat, Ulu Melaka, Kedawang,
Chenang and Bahor.Data collection was done by face to face
interviews. The interviews were conducted at locationspredetermined by the sampling procedure and werein proximity to tourist destination areas. A total of439 respondents comprising of local residents weresuccessfully interviewed.
RESEARCH INSTRUMENT
A questionnaire is used as a research instrumentto facilitate data collection during field work. Thequestionnaire is in Bahasa Melayu segmented into twoparts. The first part ofthe questionnaire gathers socio-
demographic information on the respondents. Six closed
ended questions are included pertaining to the profile ofthe respondents, including gender, race, religion, maritalstatus, age and educational level.
The second part of the questionnaire examinestourism development impacts on Langkawi Island. Atotal of 24 variables are examined in the present study.
All of the variables examined are selected upon the
completion of a thorough literature review which is
based on the SET. The variables are then developed intonine constructs to meet the objectives of this study. A11
of the questions are answered according to a five pointLikert scale, ranging from 1 "Highly disagree" to 5
"Highly agree" (lgbaria et al. 1995; Fornell et al. 1996;
McCool & Martin 1994).
Jurnal Ekononti Malaysia 48(2)
STUDYANALYSIS
The development impact of the tourism industry on the
local community oflangkawi Island in this study is based
on its community perceptions. Three statistical analyses
are perform which are i) mean analysis; ii) exploratoryfactor analysis (rre); and iii) regression analysis.
Mean analysis is conducted in order to make a
ranking analysis of the 24 variables and determiningwhich variables have the highest or lowest tourismdevelopment impact on the community based ontheir perceptions. A mean comparison analysis is also
conducted to determine whether there exist differences
in perceptions between different demographic groups
using the ANoVA analysis.Then, the rrzl analysis (Byne 2001) is performed
in order to condense and classify the 24 variables intoits appropriate constructs. The validity tests ofthe EFA,
which consists of the Kaiser-Meyer-Olkin (xuo) test
and Bartlett's Test of Sphericity, must also be satisfied.The Kaiser-Meyer-Olkin (nao) tests whether the
variables are adequate for factor analysis. The sufficientcondition for KMo is a value greater than 0.5. Bartlett'sTest of sphericity hypothesizes that all variables are
uncorrelated in the population when the correlationmatrix is an identify matrix. If the significance value forthis test is less than the alpha level 0.001 (Kaiser 1974),
then the null hypothesis is rejected. Rejecting the nullhypothesis indicates that correlations exist in the data
set which concludes that factor analysis is appropriate.
Validity tests perform in grouping the variablesinto its appropriate constructs include varimax rotation(eigenvalues, percentage of variance and cumulativevariance explained) and the reliability test of Cronbach'sAlpha. Eigen value is an indication of the number ofconstructs that can be developed. If the eigenvalue is
less than I then the construct should be eliminated. (Hairet al. I 998). Factor loading for each variable is considered
similarly, however the value must be greater than 0.4.
The percentage of variance explained and thecumulative variance explained are used to ensure thatthe data is in a good fit. The value of the cumulativevariance should provide adequate value or explain more
than 50 percent ofthe total variance (Fornell & Larcker1981; Hair et al. 1998).
The Cronbach Alpha reliability test is a crucial test
that assumes each variable is considered as an equivalenttest and all correlations between items that are measured
are the same in each construct. A Cronbach Alpha (ce)value of 0.6 is considered to be an acceptable value, a
CA value between 0.6 and 0.7 is moderate; a CA value
between 0.7 and 0.8 is good; a cA value between 0.8 and
0.9 is very good; and a CA value above 0.9 is considered
excellent (Hair et al.2007).The present study then proceeds to perforrn a
mtrltiple reglession analysis (Gefen et aI.2000 and Sakar
20l 1). The rnultiple regression analysis is used to estirnate
Development of Tourism Industry and lts Impact on Langkawi Island Communiqv* 75
the strength of the relationship between a dependant
and independant variables. In this study, 2 models were
developed as in Equations (1) and (2). The first modelestimates the relationship between the dependant variablewhich is the overall respondents perception of the impactand the independant variables which are the constructs
that was previously developed using the EFa as defined inTable 1. The second model estimates the same dependant
variable against all of the24variables that are used in the
study. The models specification are thus represented as in:
Y: a + frXr+ frlr+ f{r+ f{o+ e,--- (1)
Y: a + f{r,+ f{r,+ f{r,+ fd^+ e,--- (2)
The definition of variables in Equations (1) and (2)is elaborated in Table l.
TABLE 1. Definition of variables
Variables Definitions and items measured
Overall respondents perception ofthe impact
The environmental impact
The economic impact
The social impact
The culture impact
All of the items in the environmental construct
All of the items in the economics construct
A1l of the items in the social construct
All of the items in the culture construct
Nole: Mean values are used in the estimation.
EMPIRICAL RESULTS
The discussion on the empirical results proceeds as
follows. First, this paper presents a discussion on the
demographic profile of the respondents, followed byan examination on the perceived impacts of tourismdevelopment on the population of Langkawi Island and
finally the results of the multiple regression analysis thatwas performed.
DEMOGRAPHIC PROFILE OF RESPONDENTS
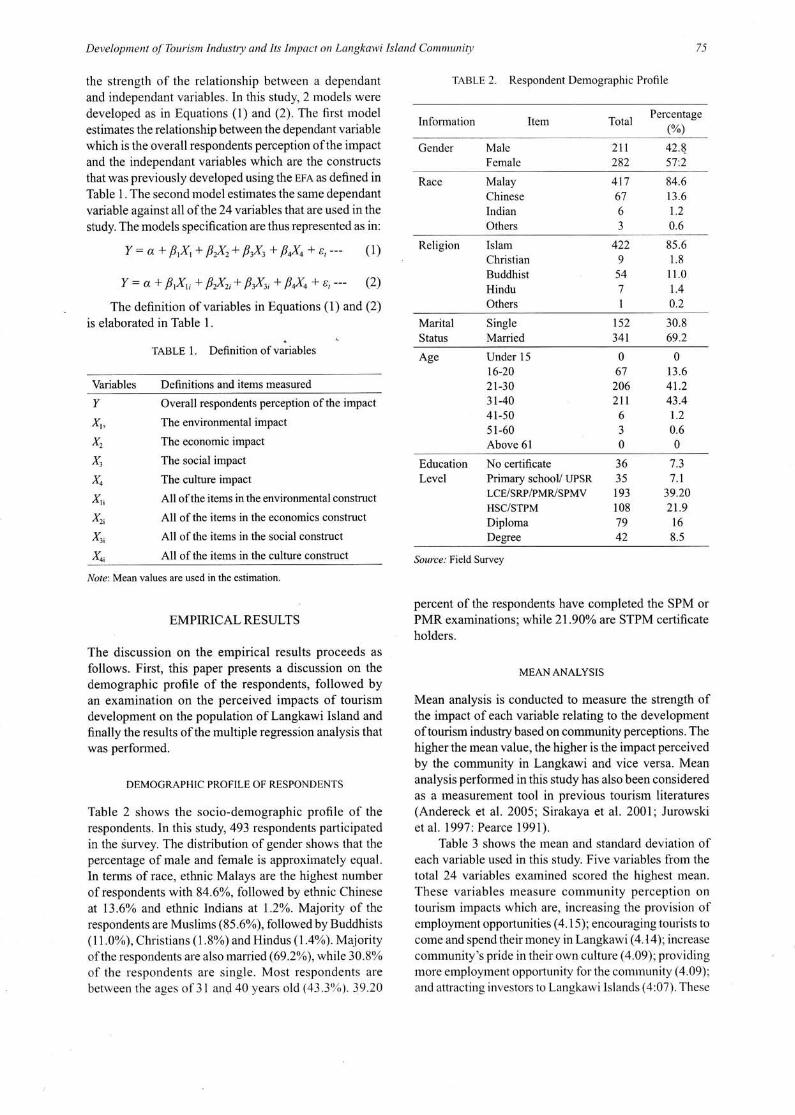
Table 2 shows the socio-demographic profile of the
respondents. ln this study,493 respondents participatedin the survey. The distribution of gender shows that thepercentage of male and female is approximately equal.In terms of race, ethnic Malays are the highest numberof respondents with 84.6o/0, followed by ethnic Chinese
at 13.6oh and ethnic Indians at l.2o/o. Majority of the
respondents are Muslims (85.6%), followed by Buddhists(11.0%), Christians (1.8%) and Hindus (1.4%). Majorityof the respondents are also married 169.2%), while 30.8%
of the respondents are single. Most respondents are
betrveen the ages of 31 and 40 years old (43.3%). 39.20
TABLE 2. Respondent Demographic Profile
Information rotar n"i:;;"*'ltem
Gender N{aleFemale
2tt 42.8_
282 s7"2
Race MalayChinese
IndianOthers
417
67
6
-)
84.6
13.6
1.2
0.6
Religion IslamChristianBuddhistHinduOthers
422
9
54
7
1
85.61.8
11.0
1.4
0.2
MaritalStatus
SingleMarried
30.8
69.2
152341
Y
X,,
x2
X,
x4
X,,
X,,
X,,
xo,
Age
EducationLevel
No certificatePrimary schooli UPSR
LCEi SRP/PMR/SPMVHSC/STPM
DiplomaDegree
36 7.3
35 7.1
193 39.20
108 21.9
79 16
42 8.5
Sozrce: Field Survey
percent ofthe respondents have completed the SPM orPMR examinations; while 21 .90o/o are STPM certificateholders.
MEANANALYSIS
Mean analysis is conducted to measure the strength ofthe impact of each variable relating to the developmentof tourism industry based on community perceptions. Thehigher the mean value, the higher is the impact perceived
by the community in Langkawi and vice versa. Meananalysis performed in this study has also been consideredas a measurement tool in previous tourism literatures(Andereck et al. 2005; Sirakaya et al. 2001; Jurowskiet al. 1997 : Pearce 1991).
Table 3 shows the mean and standard deviation ofeach variable used in this study. Five variables from the
total 24 variables examined scored the highest mean.These variables measure community perception ontourism impacts which are, increasing the provision ofemployment opportunities (a. I 5); encouraging tourists to
come and spend their money in Langkawi (4.14); increase
community's pride in their own culture (a.09);providingmore employment opportunity for the community (a.09);
and attracting investors to Langkawi lslands (4:07). These
Under 15
t6-2021-3031-40
4l-505 l-60Above 6l
0
67
206211
6
J
0
0
13.6
41.243.4
1.2
0.60

76 Jtrrnal Ekonomi Malaysia 48(2)
TABLE 3. Mean analysis of variables
Variables/indicators Meanstd.
Deviation
l. Provide suitablejob
2. Encourage more tourists to come and spend their money
3. Causing community to proud with their own culture
4. Provide more employment opportunities
5. Encourage more outside investors
6. Increase the community income
7. Do not cause any congestion (traffic)
8. Surrounding arealenvironment is getting clean
9. Do not increase the noise levels
10. Increase the family economic standard
I l. Do not affect water quality
12. Solid wastes are managed efficiently
13. Increase yourdaily expenses
1 4. Increase the housing prices / land / housing rental
15. Do not produce a lot of garbage
16. Increase your interest to meet/interact with more tourists
I 7. Your livelihood are getting better
I 8, The Langkawi residents are getting better in term of their knowledge about others socio-
cultural and their life
19. Change the way of life
20. Do not cause any congestion at the recreational area
21 . Do not increase in accidents among residents
22. Itcrease in flnancial expenses/spending of the government due to the construction of tourist
facilities
23. Do not damage the public property
24. Do not increase the number of criminal cases
4.15
4.14
4.09
4.09
4.07
4.06
4.04
4.01
4.01
3.96
3.96
3.94
3.93
3.92
3.91
3.91
3.83
3.71
3.57
3.32
3.09
2.95
2.83
2.80
0.843
0.819
0.85 r
0.833
0.830
0.866
0.784
0.742
0.762
0.872
0.773
0.783
1.034
1.023
0.782
0.889
0.797
0.968
1.112
1.192
1.126
2.203
1.155
1.170
five aforementioned variables are all positive impacts as
perceived by the community as a result of the tourismdevelopment industry in Langkawi.
Meanwhile, the five (5) variables recording the
lowest mean scores are as follows: does not increasethe number of criminal cases (2.80); does not resultin damage to public property (2.83); increases thefinancial expenditures of the government due to theconstruction of tourist facilities (2.95); does not cause
congestion near recreational areas (3.32); and does notincrease the number of road accidents (vehicles) amongresidentS (3.09). The low mean scores indicate thattourism development in Langkawi Island does not bringsignificant undesirable physical, social and environmental
effects to the local community.The above analysis is prirnarily based on the
mean value of the respondents'perceptions. However,these perceptions rnay vary between different socio-demographic backgrounds, such as age, level ofeducation and gender. Thus, the analysis of mean
comparison for each variable is performed to detelrnine
ifthe difference in perceptions exist in between groups.
The hypotheses for the mean comparison for eachvariable are as follows:
Ho : no mean difference exists between age groupsH" : a mean difference exists between age groups
Hu : no mean difference exists between educationgroups
Hu : ? mean difference exists between education groups
H,, : no mean difference exists between genders
Ho : & mean difference exists between genders
The results for the mean comparisons are presented
in Table 4 and a result summary of important variables are
shown in Table 5. Table 5 indicates that seven variablesexhibit mean differences in relation to education, ten
(10) variables exhibit mean differences in relation to
age and two (2) variables exhibit rnean differences inrelation to gender.

oI3o
=d
E.:rtJ)
+
+
\oo._
*
ci
+c..l+
C.l
+
Oioq
r+
+
ooc.lq
c.lq
c.l
+
oo
+
+
c.l+
o
o
o
o
3
o.
x
EEobo
U
+al
F-q
+oq
oo+qal
oo\
di
+c?
a.ln
o\n
9
\
e.loo
c.l9
F-oq
oo\
\o
di
r-!'l
r-I
!,etrr69
rdo-ed6:boI=rOoo00.oa(eD
c9o=
o=o'< bo>E
.C€ O-:l -aot6CJ -\Zlf .--A
-id
ooan
O
d
oq
Gi
c.l\
oo
+
\o0q
oq
+
\ooo
e.l\
ooo9
+
q
09
+
o
E
Ido
o()E
9)o
oo?
.ial
(\q
*\o00nc..t
+di
@
..1
n
cl
.:
d;
n
n
o\cl
v?
oocl
r-qc'l
e.lqN
o
o
oooi)
ooo
o
a
I
o_.N
+.1
F-Gi
fi
o\..i
o.ln
@cl
r;
6t
d;
a{cl
qc.t
c..l
oq
u]
di
F-
d;
6i
;
e.l..!
o-o
oh0
E
oood
ooo
o:ol
c.!
vl
di
+oo
6i
\oqC!
c.lvl
vl
+v.l
r:
*
ri
F-oq
q
\o\q
\on
qa.l
$n
,a
o
aoo
(i
+n
+oooi
ai
r-n
00na-t
N
d;
c1
a'.1ooc.i
ooc.i
o\oo
c\|
o\
^i
d;
+6i
Ia.l
a\6l
ooh0
obo9)
o
o
i
+c!
oo6i
F-r-6i
t-oo
c.i
.+na.l
\o6i
c.lq(\
di
\ca.l
*\ooo
..i
.')
o\oo6i
+0qc.l
\c-l
6i
oonN
oo(0
o
o.oE
o
bo
oo
r
€oi
aoi
-i
c-.1vlo.l
F-F-c.i
qc.t
qc.t
\o\e.l
oq
sft-...i
o\oo
^i
o\qe.l
ao.i
o\na.I
r-nN
>'Eo
o-oo-o
obodE
o;
-i
o\\
Oioq
oo-i
=f+
+
o\
di
;c.loq
oc
+
o\?
q
C.log
\ooq
c.)
+a)@FO
oo_d
o0H
;9Q,(HaaqCootr6o=oC
=O.Ioc
.E,cF
..o,,C
OLL9ta_11
ra;
\o
-oo
r;
+
@<tv?
\oq
oo
+
+
oq
$_.
qs
00oc
q
q
o\9
F.
r;
ooo
o
oo
oo
o
ooo
=
+na-t
+
ooq
*o\o\nc\l
oooe
F-
+
o\q
$cl.+
c.l+
oo
+
F-
+
c.!+
+
r-q
+
o0)o.xo
ooo
f;
+r-d
F-
d;
+r;
*c-.t
qa.)
a.lv1
oe
\o
r;
+
\oq
o\\
o\oq
6lc]+
\oq
q
o\a
c.l
r;
(3-o
0E
aoo
E
o
oa9a
ci
+t--o
.+q
F-09
6lo\A
oocl+
+
r-r;
F-
+
ar
+
\o6o\O
+
<+
+
€+
+
6l+
r-q
()
o
o
Eobo
co=rj
-i
.-
+r;
+q
c.i
ooc..l+
F-c-.1
+
F-q
+
sfc.l+
oo.+.l
+
ooN+
cl+
\o
+
r-+
+()
o
-o
aooo.oo
Eo_
i:D
r,r =
@
c.lIr-
q+
q
*oooo.j
q
c.l6.
arq
F-
+
q+
00
oo
+
+
N
+
+
o\oq
a.lq
oEo
x
EEoo
ooa
+
\
og
*o\c.!
*+
+
t'-oq
00
+
!f,6l.+
=t
+
r-+
+
o\
+
+
.+
o
o.a.
0Exo-Eoo
Eo€
€
+
-i
oo
d;
+
\o
-\o
+
00
\oq
o\q
ooq
*e.l
+
+
s+
+
F-09
++
<fq
o
oo
ooo
oE
otIoo
t/)
r
+oi
+
oo
di
*F-na.l
ooe.l+
F-
+
clri
\o
+
00q
*
(..i
...1
=t
q
$q
\o
{r-.1+
r-q
oh0
ooc
>.qJ
o
.dO
o;
a.t
F-
ri
*d;
+n
+
a-l
+
cooq
+
O,oq
a.t
n
@
+
+
o\q
oq
t--
+
s;
o
c)o,a
,a;
J
*r;
F-oq
oo\o9
+a.l+
+
a-e
lt*e
@oc
*++
alq
o\\
e.loq
t--oc
n+
t-+
oh0
oo
doo
a.
a+
c.l
O
=tq
+q
+d;
\o
+
+
oo\
$q
r-r;
*
fi
+
.d"qm
\ooq
o\oq
++
oc
ooEaoobo(g
dEoC6
o
za.;
o\q
+
ri
oooc
c!+
o.l
+
q
F-
+
q
00o\(..i
+
q
+r;
00q
r-+
oo
+
ooo
6)
ooo
oci
-i
F-
oo
\
o.l+
09o
oo\
oo\
oooq
\or-J
o\\q
o\oq
&oq
og
.+
r-9
oosao
oboo
o
-i
(lsol-C)srsrluuv s^ouv
ue[ro A
UUI I
(rsorC)srsfleuY sAouv
69-09
69-0s
6n-0n
6e-0e
6Z-02
(tset-g)srs{13uv sAouY
aerSa(
suroldrc
WdIS/]SH
A]^IdS
/e{Wd/d[S/43'I
usdo/looq3s,fteuu4
elecuruec oN
o
o
oho
6o()
oo-]
a
X
o
o€6
L
oO
oz
x
0)
F
+F.lJ
F
78 Jurnal Ekonomi Malaysia 48(2)
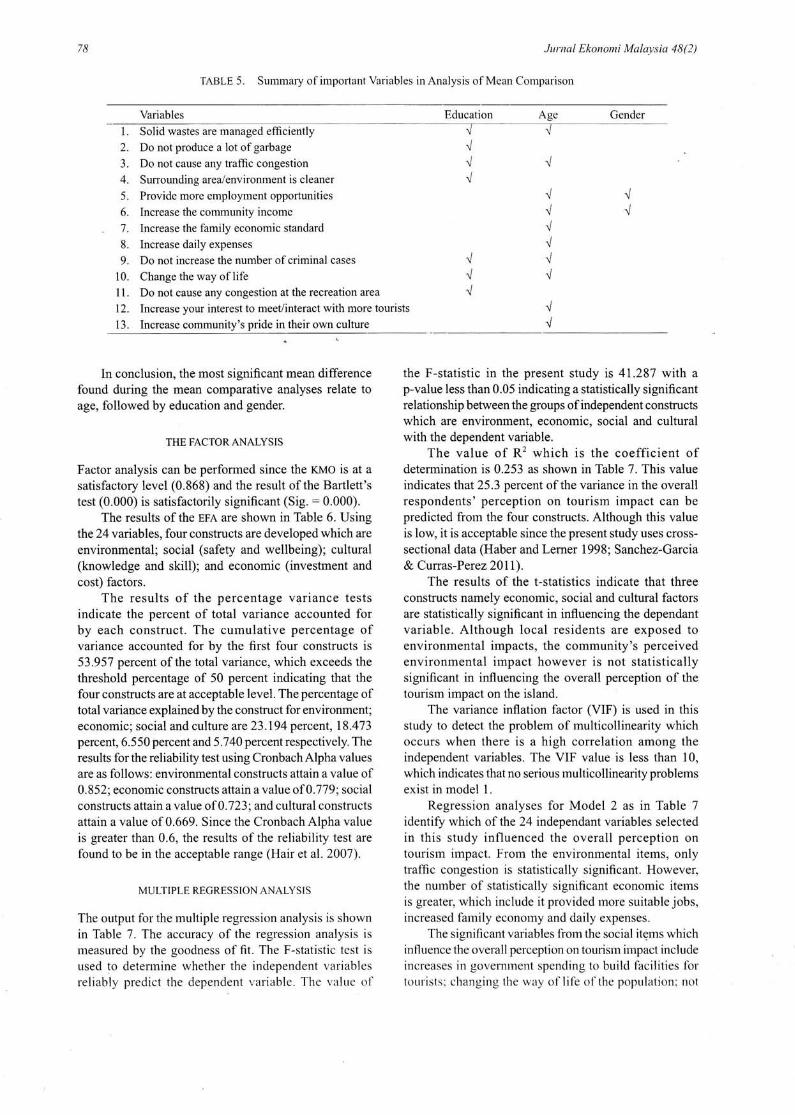
TABLE 5. Summary of impofiant Variables in Analysis of Mean Comparison
Variables Education Age Gender
l. Solid wastes are managed efficiently2. Do not produce a lot of garbage
3. Do not cause any trafific congestion
4. Surrounding arealenvironment is cleaner
5. Provide more employment opportunities
6. Increase the community income
7. Increase the family economic standard
8. Increase daily expenses
9. Do not increase the number of criminal cases
10. Change the way of life11. Do not cause any congestion at the recreation area
12. Increase your interest to meet/interact with more tourists
13. Increase community's pride in their own culture
In conclusion, the most significant mean differencefound during the mean comparative analyses relate toage, followed by education and gender.
THE FACTORANALYSIS
Factor analysis can be performed since the KMo is at asatisfactory level (0.868) and the result of the Bartlett'stest (0.000) is satisfactorily significant (Sig. : 0.000).
The results of the sre are shown in Table 6. Usingthe24vaiables, four constructs are developed which are
environmental; social (safety and wellbeing); cultural(knowledge and skill); and economic (investment and
cost) factors.The results of the percentage variance tests
indicate the percent of total variance accounted forby each construct. The cumulative percentage ofvariance accounted for by the first four constructs is
53.951 percent of the total variance, which exceeds thethreshold percentage of 50 percent indicating that thefour constructs are at acceptable level. The percentage oftotal variance explainedby the construct for environment;economic; social and culture are23.l94 percent, 18.473
percent, 6. 5 5 0 percent and 5 .7 40 percent respectively. Theresults for the reliability test using Cronbach Alpha values
are as follows: environmental constructs attain a value of0.852; economic constructs attain a value of 0.779; socialconstructs attain avalue of 0.723; and cultural constructsattain a value of 0.669. Since the Cronbach Alpha valueis greater than 0.6, the results of the reliability test are
found to be in the acceptable range (Hair et al.2007).
MULTIPLE REGRESSION ANALYSIS
The output for the multiple regression analysis is shownin Table 7. The accuracy of the regression analysis is
measured by the goodness of fit. The F-statistic test isused to deterrrine whether the independent variablesreliably predict the dependent variable. The value of
the F-statistic in the present study is 41 .287 with a
p-value less than 0.05 indicating a statistically sigaificantrelationship between the groups of independent constructswhich are environment, economic, social and culturalwith the dependent variable.
The value of R2 which is the coefficient ofdetermination is 0.253 as shown in Table 7. This valueindicates lhat 25 .3 percent of the variance in the overallrespondents' perception on tourism impact can bepredicted from the four constructs. Although this valueis low, it is acceptable since the present study uses cross-sectional data (Haber and Lerner 1998; Sanchez-Garcia& Curras-Perez20ll).
The results of the t-statistics indicate that threeconstructs namely economic, social and cultural factorsare statistically significant in influencing the dependantvariable. Although local residents are exposed toenvironmental impacts, the community's perceivedenvironmental impact however is not statisticallysignificant in influencing the overall perception of thetourism impact on the island.
The variance inflation factor (VIF) is used in thisstudy to detect the problem of multicollinearity whichoccurs when there is a high correlation among theindependent variables. The VIF value is less than 10,
which indicates that no serious multicollinearity problemsexist in model l.
Regression analyses for Model 2 as in Table 7
identify which of the 24 independant variables selectedin this study influenced the overall perception ontourism impact. From the environmental items, onlytraffic congestion is statistically significant. However,the number of statistically significant economic itemsis greater, which include it provided more suitable jobs,increased family economy and daily expenses.
The signiflcant variables from the social items whichinfluence the overall perception on tourisrn impact includeincreases in governrnent spending to build facilities fortourists: changing the way of lil-e of the population: not

Development oJ Tourism Industry and Its Impact ort Lcutgkawi Island Community
TABLE 6. Exploratory FactorAnalysis (EFa)
79
Reliabilitr
Const ructs/l ndicators/Variab les Explanatory FactorAnalysis -EFA
(Varimax Rotation).o
d)=
!9do
Qo
o
() <(
!{oOa
= .E-o E^tr:o=>,Lvc_ 2.= tr
boe:+xt! o\ !:.1 O
'o(foocc'=
dx> rrl
Environment:l. You livelihood are getting better2. Do not increase the noise levels
3. Solid wastes are managed efficiently4. Do not produce a lot of garbage
5. Do not affect water quality6. Do not cause any congestion (traffic)7. Sunounding arealenvironment is cleaner
5.556 23.194 23.194 0.852 3.96480.820
0.820
0.814
0.804
0.776
0.4840.451
Economic: 4.4341. Provide more employment opportunities2. Increase the community income
3. Provide suitable jobs
4. Encourage more tourists to come and spend their money
5. Encourage more outside investors
6. Increase the family economic standard
7. Increase your daily expenses
8. Increase the housing prices/land,housing rental9. Increase in financial expenses/spending ofthe government
due to the construction oftourist facilities
18.473 41.667 0.779 3.9047
0.805
0.781
0.7600.679
0.660
0.6250.7930.784
Social:L Do not damage public property2. Do not increase the number of criminal cases
3. Your livelihood are getting better4. Change the way of life5. Do not increase in accidents among residents
6. Do not cause any congestion at the recreational area
1.572 6.550 48.217 0.723 3.09330.725
0.710
0.5810.560
0.5540.s 13
Culture: 1.378
l. Increase your interest to meet/interact with more tourists2. The Langkawi residents are getting better in term of their
knowledge about others socio-cultural and their life3. Increase community's pride in their own culture
5.740 53.957 0.669 3.0156
0.7820.678
o.602
Kaiser-Meyer-Olkin (KMO): 0.868 dan Bartlett's Test of Sphericity: 0.000
causing damage to public property; and not increasingthe number of road accidents among residents.
A11 three cultural items are found to be significantwhich are increasing interest to meet/interact withtourists; increase community's knowledge on socio-cultural practices of people outside of the community,and increase the community's pride in their own culture.
CONCLUSION AND IMPLICAT1ONS
The present study attempts to evaluate the perceptionof local community concerning the irnpact of thedevelopn-rent of tourisrn industry on Langkawi lsland.
For this purpose, a survey using questionnaires as an
instrument was administered between November and
December of 2011. A total of 24 variables were selectedto measure 4 constructs namely economic, social, culturaland environmental factors.
The empirical results indicate that most of the
respondents whom are residents of Langkawi Islandagreed that the development of the tourism industrybrought various positive effects to the local community,especially in terms of social, economic and culturalimpacts. However, this study finds that environmentalfactors as a construct does not influence the comrnunity'sperception on overall tourism impact on the island.
The stakeholders ofthe tourism indr-rstry on Langkau,i

80 Jurnal Ekonomi Malaysia 48(2)
TABLE 7. Findings of Regression Analysis
Model 2
xl:a;i .9
.=a;d()a
ooto
'trooo
6
6at
Model I
I
F
VIF0o
0O
Variables /indicators
(Constant) 1.272 0.231 5.500*
Environment 0-061 0.046 1.322 1.130
1. You livelihood are getting better2. Do not increase the noise levels
3. Solid wastes are managed efficiently4. Do not produce a lot ofgarbage5. Do not affected surrounding water quality6. Do not cause any congestion (traffic)7. Surrounding area./environment of you is
getting clean
0.035 0.832
0.074 1.480
-0.009 -0.1890.034 4.694-0.051 -1.0420.870 L880**0.035 0.778
Economic 0.297 0.047 6.301* 1.377
1. Provide more employment opporhrnities2. Increase the community income
3. Provide suitablejob4. Encourage more tourists to come and
spend their money5. Encourage more outsideinvestors
6. Increase the family economy7. Increase your daily expenses
8. Increase the housing prices/land,4rousing
rental
0.082 1.640
-0.012 -0.2890.097 1.985**
0.009 0.226
0.028 0.7160.111 2.982*0.075 2.309**-0.004 -0.127
Social 0.078 0.027 2.845* 1.056 l. Do not damage the public property2. Do not increasing the number of criminal
cases
3. Increase in financial expenses/spending ofthe govemment due to the construction oftourist facilities
4. Change the way of life5. Do not increase in accidents among
residents
6. Do not cause any congestion at therecreation area
-0.085 -2.530**-0.035 -1.012
0.057 4.168*
0.089 3.404*0.056 1.758**
0.036 1.189
Culture .0.213 0.039 5.469* 1.3t7
l. Increase your interest to meeVinteract withmore tourists
2. The Langkawi residents are getting betterin term oftheir knowledge about otherssocio-cultural and their life
3. Increase community's pride in their ownculture
0.204 5.948*
0.081 2.601**
0.065 1.841***
R Square 0.253
Adjusted R Square 0.247
Std. Ertor of the Estimate 0.52891
F-test 41.287*
Durbin Watson 1.886*+
*** Significant at the a - 0.01** Significant at the c:0.05.* Significant at the 0 - 0.10.

Development of Tbttrism Industrlt and lts Impact on Langkawi Island Comntuni6,
lsland, including the federal, state and local governments,must take more proactive initiatives to provide facilitiesthat will encourage the locals to participate in the tourismindustry, especially in small scale business ventures.This can be seen in table 7 where most economic itemsare significant in influencing the overall perception ontourism impact. Thus exploiting all economic possibilitiesthat will benefit the community positively is deemed
crucial. These ventures will ensure active participationfrom the local community which consequently willresult in long run sustainable development of the tourismindustry on the island.
Tourism related assistance needs to be providedto the community of Langkawi Island, particularly inrelation to financial investment, consultation, marketing,counseling, motivation, courses and workshops; andmonitoring activities. The private and governmentalsectors need to collaborate to ensure that all proposedplans and programs can be implemented effectively.
ACKNOWLEDGEMENT
This research is supported by the National Universityof Malaysia through FRGS GRANT (FRGS/I/2011/SSruKM/03/ I 7) and University Grant (PIP-20 1 3 -00 I ).
REFERENCES
Anand, S., & Sen, A. 2000 Human development and economicsustainability. World D evelopment 28(12): 20292049.
Andereck, K. L., Valentine, K. M., Knopf, R. C., & Vogt, C.
A. 2005. Residents' perceptions of community tourismimpacts. Annals of Tourism Res earch 32{4): 1056-107 6.
Andereck, K.L., Valentine, K.M., Knopf, R,C., & Vogt, C.A.2005. Residents' perceptions of community Impacts.Annals ofTourism Research 32(4): 1056-1076.
Anderson, M., Bourgeron, P., Bryer, M. T,, Crawford R.,Engelking L., Faber-Langendoen D., Gallyoun, K., GoodinM., Grossman D.H., Landaal S., Metzler, K., Patterson,
K.D, Pyne, M., Reid, M., Sneddon, L., & Weakley,A.S. 1998. International classification of ecologicalcommunities: terrestrial vegetation of the United States.
Volume IL The National Vegetation Classiflcation System:list of types. The Nature Conservancy, Arlington, Virginia,
USA,
Andriotis, K. 2005. Community groups' perceptions of andpreferences for tourism development: Evidence fromCrete. Journal o/'Hospilality & Tourism Research 29(l):67-90.
Andriotis, K. 2005. Community Groups' Perceptions of andPreferences to Tourism Development. Evidence fromCrete. Jotrrnal oJ Hospitality and Tourism Research29(t):67-90.
Black, K., Shalat, S. L., Freeman, N. C. G., Jimenez, M.,Donnelly, K. C., Calvin, J. A. 2005. Children's rnouthingand food-handling behavior in an agricultural communityon the US/Mexico border.,-IExpo Anal Entiron Epidetnioll5 244-251.
Byrd, E. T., Bosley, H. E., & Dronberger, M. C. 2009.Cornparison of stakeholder perceptions of tourisrr rnrprcts
in rural eastem North Carolina. TourismManagement 30693-703.
Byrne, B. M. 2011. Stnrctural equation modeling with AMOS,EQS, and LISREL: Comparative approaches to testingfor the factorial validity of a measuring instrument.International Journal ofTesting 1(I): 55-86.
Chandra, R. K. 1999. Nutrition and immune responses: What dowe know. Military Strategiesfor Sustainment of Nutritionand Immtme Function in the Field,205-217 .
Gefen, D., Straub, W & Boudreau, M. 2000. Structural equation
modeling techniques and regression: Guidelines forresearch practice. Communications of AIS 4(7): 1-7 9.
Eshliki, S. A., & Kaboudi, M.2012. Community Perceptionof Tourism Impacts and Their Participation in TourismPlanning: A case study of Ramsar, ban. Procedia-Socialand Behavioral Sciences 36l.333 341.
Eshliki, S. A., & Kaboudi, M. 2012. Community perceptionof tourism impacts and their participation in tourismplanning: A case study of Ramsar, lran. Procedia Socialand Behavioral Sciences 2012 36l.333 341.
Fornell, C, & Larcker, D. 1981. Evaluating structural equationmodels with unobserved variable and measurement error.Journal ofMarketing Research 18: 39-50.
Fornell, C., Johnson, M. D., Anderson, E. W., Cha, J., & Bryant,B. E. 1996. The American. customer satisfaction index:nature, purpose, and flndings. The Journal of Marketing'.7-1 8.
Gujarati, D. N. & Dawn, C. P.7999. Essentials of Econometrics.
3'd edition. McGraw Hill Irwin.Gursoy, D., Chi, C. G., & Dyer, P.2010. Local's aititudes toward
mass and altemative tourism: The case of Sunshine Coast,Australia. Journal of Tiavel Research 49: 381-394.
Haber, S. & Lemer, M. 1999. Correlates of tourist satisfaction.Annals of tourism Res earch 26(l): 197 201.
Hair, J. F., Anderson, R. E., Tatham, R. L., & Black, W C.1998. Multivariate Data Analysis. NJ: Prentice Ha 1lIntemational, Inc.
Hair, J., Money, A., Page, M., & Samouel,P.2007. ResearchMethods for Business. England: John Wiley & Son Ltd.
Husbands, W 1998. Social status and perception of tourisminZambia, Annals of Tourism Research 16{2):237J53.
Igbaria, M., Guimaraes, T., Davis, G.B. 1995. Determinantsof microcomputer usage via a structural equation model,Journal of Management InformationSystem I l(4):87-114.
Jahi, J. M. 2009. Pembangunan pelancongan dan impaknyaterhadap persekitaran fizikal pinggir pantai. MalaysianJournal of Environmental Management 10(2): 7 1-87 .
Jahi, J. M., Aiyub, K., Arifin, K., & Awang, A.2009.Development, environmental degradation andenvironmental management in Malaysia. EuropeanJournal of Socictl Sciences 9(2): 257 -264.
Jurowski, C., Uysal, M., & Williams, D. R. 1997. A theoreticalanalysis of host community resident reactions to tourism.Journal of Travel Res earch 36(2): 3-ll.
Kaiser, H. F. 1974. An index of factorial simplicity.Psltchometriku 39(l): 3l 36.
Kayat, K. 2008. Stakeholders' perspectives toward a
cornmunity-based rural tourism development. EuropeanJotrrnal of Tourism Research l(2):94-111. .
Lankford, S. V & Howard, D. R. 1994. Developing a tourisrnimpact attitude scale. Annals o.f Totu'ism Research 2l(l):2t 39.
8t

B2
Latane, B., and Wolf, S. 1981. The social impact of majoritiesand minorities. Psychological Review 88(5): 438 453.
Lawton, J. L. 2005. Resident Perceptions of TouristAttractionson the Gold Coast ofAustralia , Journal ofTravel Research44(2):188 200.
Liu, A, and Wall, G. 2000. Planning tourism employment: a
developing country perspective. Tourism Management27(t):159-t70.
M.S., Komoo, I, Latiff, A. and Salleh, H (eds) LembanganKilim: lf/arisan Budaya dan Sumber Asli Langkawi('Lembangan Kilim: Cultural and Natural ResourcesHeritage, Langkawi'), Bangi: LESTARI UI(M: 53-79.
Madrigal, R. 1993. A Tale of Tourism in Two Ctttes, Annalsof Tourism Research: A Social Sciences Journal 20(2)'.
336 353,1993.McCool, S. F., & Martin, S. T. 1994. Community attachment
and attitudes toward tourism development. Journal ofTr av e I Res e arc h 32(3) : 29 -3 4.
Nunkoo, R. & Ramkissoon ,H.2}11Deve16ping a conlmunitysupport model for tourism. Annals of Tourism Research
38: 964-988.Nunkoo, R., & Ramkissoon, H. 201 l. Developing a community
support model for tourism. Annals of Tourism Research
38(3): 964-988.Nuntsu, N., Tassiopoulos, D., & Haydam, N. 2004. The bed
and breakfast market of Buffalo City (BC), South Africa:present status, constraints and success factors. Tburism
Management 25(4): 515 522.
Nunnally, l. C. 1978. Psychometric Theory. New York, NYMcGraw-Hill.
Park, K. S., Reisinger, Y., & Kang, H. J. 2008. Visitors'motivation for attending the South Beach wine and foodfestival, Miami beach, Florida. Journal of Travel &Tourism Marketing 25(2): 1 61-1 8 1.
Pearce, P. L. Analysing TouristAttractions. Journal ofTourismStudies 199 I 2(1): 46-55.
Ranis, G., Stewart. F. & Ramirez, 2000. A. Economic growthand human development. World Development 28(2)'.197-219.
Ritchie, J. R. B. 1984. Assessing the impact of hallmarkevents government of Canada: Prosperity throughcompetitiveness, minis- conceptual and research issues.
Journal of Travel Research 23: 2-ll.Othman, R. & Salleh, N.H.M. 2010. Analisis hubungan
embangunan industri pelancongan dan pertumbuhanekonomi : Perbandingan pasaran antar abangsa. Jurna IEkonomi Malaysia 44:93 100.
Sahdan, 2., Rose, R. A. C., & Ahmad, H. 2009. Perubahan
budaya orang bateq dalam situasi ekopelancongan diTaman Negara. e-Bangi 4(1): ll.
Sakar, E., Keskin, S. & Unver, H. 201 l. Using of factor analysis
scores in multiple linear regression model for predictionof keimel weight in ankara walnuts. The Journal of Animal& Plant Sciences 21(2):182-185.
Salleh, N.H.M., Othman, R., Sarmidi, T., & Darawi, Z.20ll.Livelihood Sustainability of Local Communities at Two
Jurnal Ekonomi Malaysia 48(2)
Malaysian Marine Parks: A Comparison. Jonrnal of AsiaPacific Business Innovation & Technology Managementl:86-97.
Sinchez Garcia, I., & Curr6s-P6rez, R. 2001. Effects ofDissatisfaction in Tourist Services: The role of anger andregret. Tburism Management 32(6): 1397 1406.
Schmandt, H. J., & Bloomberg Jr, W. 1969. The quality ofurbanlife, urban afflars annual reviews, Beverly Hills 1969 (3).
Schmandt, H. J., & Bloomberg, W., eds. 1969. The Quality ofUrban Life. Sage Publications Inc.
Sirakaya, E., Jamal, T. B. & Choi, S. S. 2001. Developingindicators for destination sustainability. The Encyclopediaof Ecotourism,4ll432.
Siti Shuhada, M.K., Normaz Wana, I. & Shivee, R. K. 2013.Determinants of international tourism in Malaysia:Evidence from gravity model. Jurnal Ekonomi Malaysia47(l):131-138.
Todaro, M.P., & Smith, S.C. 1995. Economic Development.llthedition. Addison-Wesley, PEARSON.
Yusoff, I & Omaq M. 2005. 'Pembangunan Langkawi danmobiliti pekerjaan penduduk di Lembangan Kilim'('Langkawi development and employment mobility in thelocal community in Kilim') in Leman,
Zluriafunfadzliah Sahdan, RosnizaAznie Che Rose & HabibahAhmad. 2009. Cultural changes of Bateq people in thesituation of ecotourism in National Park. e-Bangi 4:159 169.
Norlida Hanim Mohd Salleh*Redzuan OthmanSiti Halar Mohd IdrisMD Shaflin ShukorIshak YussofMustafa OmarPusat Pengajian EkonomiFakulti Ekonomi dan PengurusanUniversiti Kebangsaan Malaysia43600 UKM Bangi, Selangor D. E.MALAYSIA
Sharina Abdul HalimInstitut Alam Sekitar & Pembangunan (LESTARI)
Universiti Kebangsaan Malaysia43600 UKM Bangi, Selangor D. E.MALAYSIA
Mohd SamsudinPusat Pengajian Sejarah, Politik & StrategiFakulti Sains Sosial & KemanusiaanUniversiti Kebangsaan Malaysia43600 UKM Bangi, Selangor D. E.
MALAYSIA