Malaysia Market Research
23
Chase.Lee, Erica Joo 2016.05.03 MY Market Overview
Transcript of Malaysia Market Research
Chase.Lee, Erica Joo
2016.05.03
MY Market Overview
Malaysia Overview
Cell phone Market Analysis
Tablet Market Analysis
Outline
Malaysia Overview 1. Population
2. Economy and Income
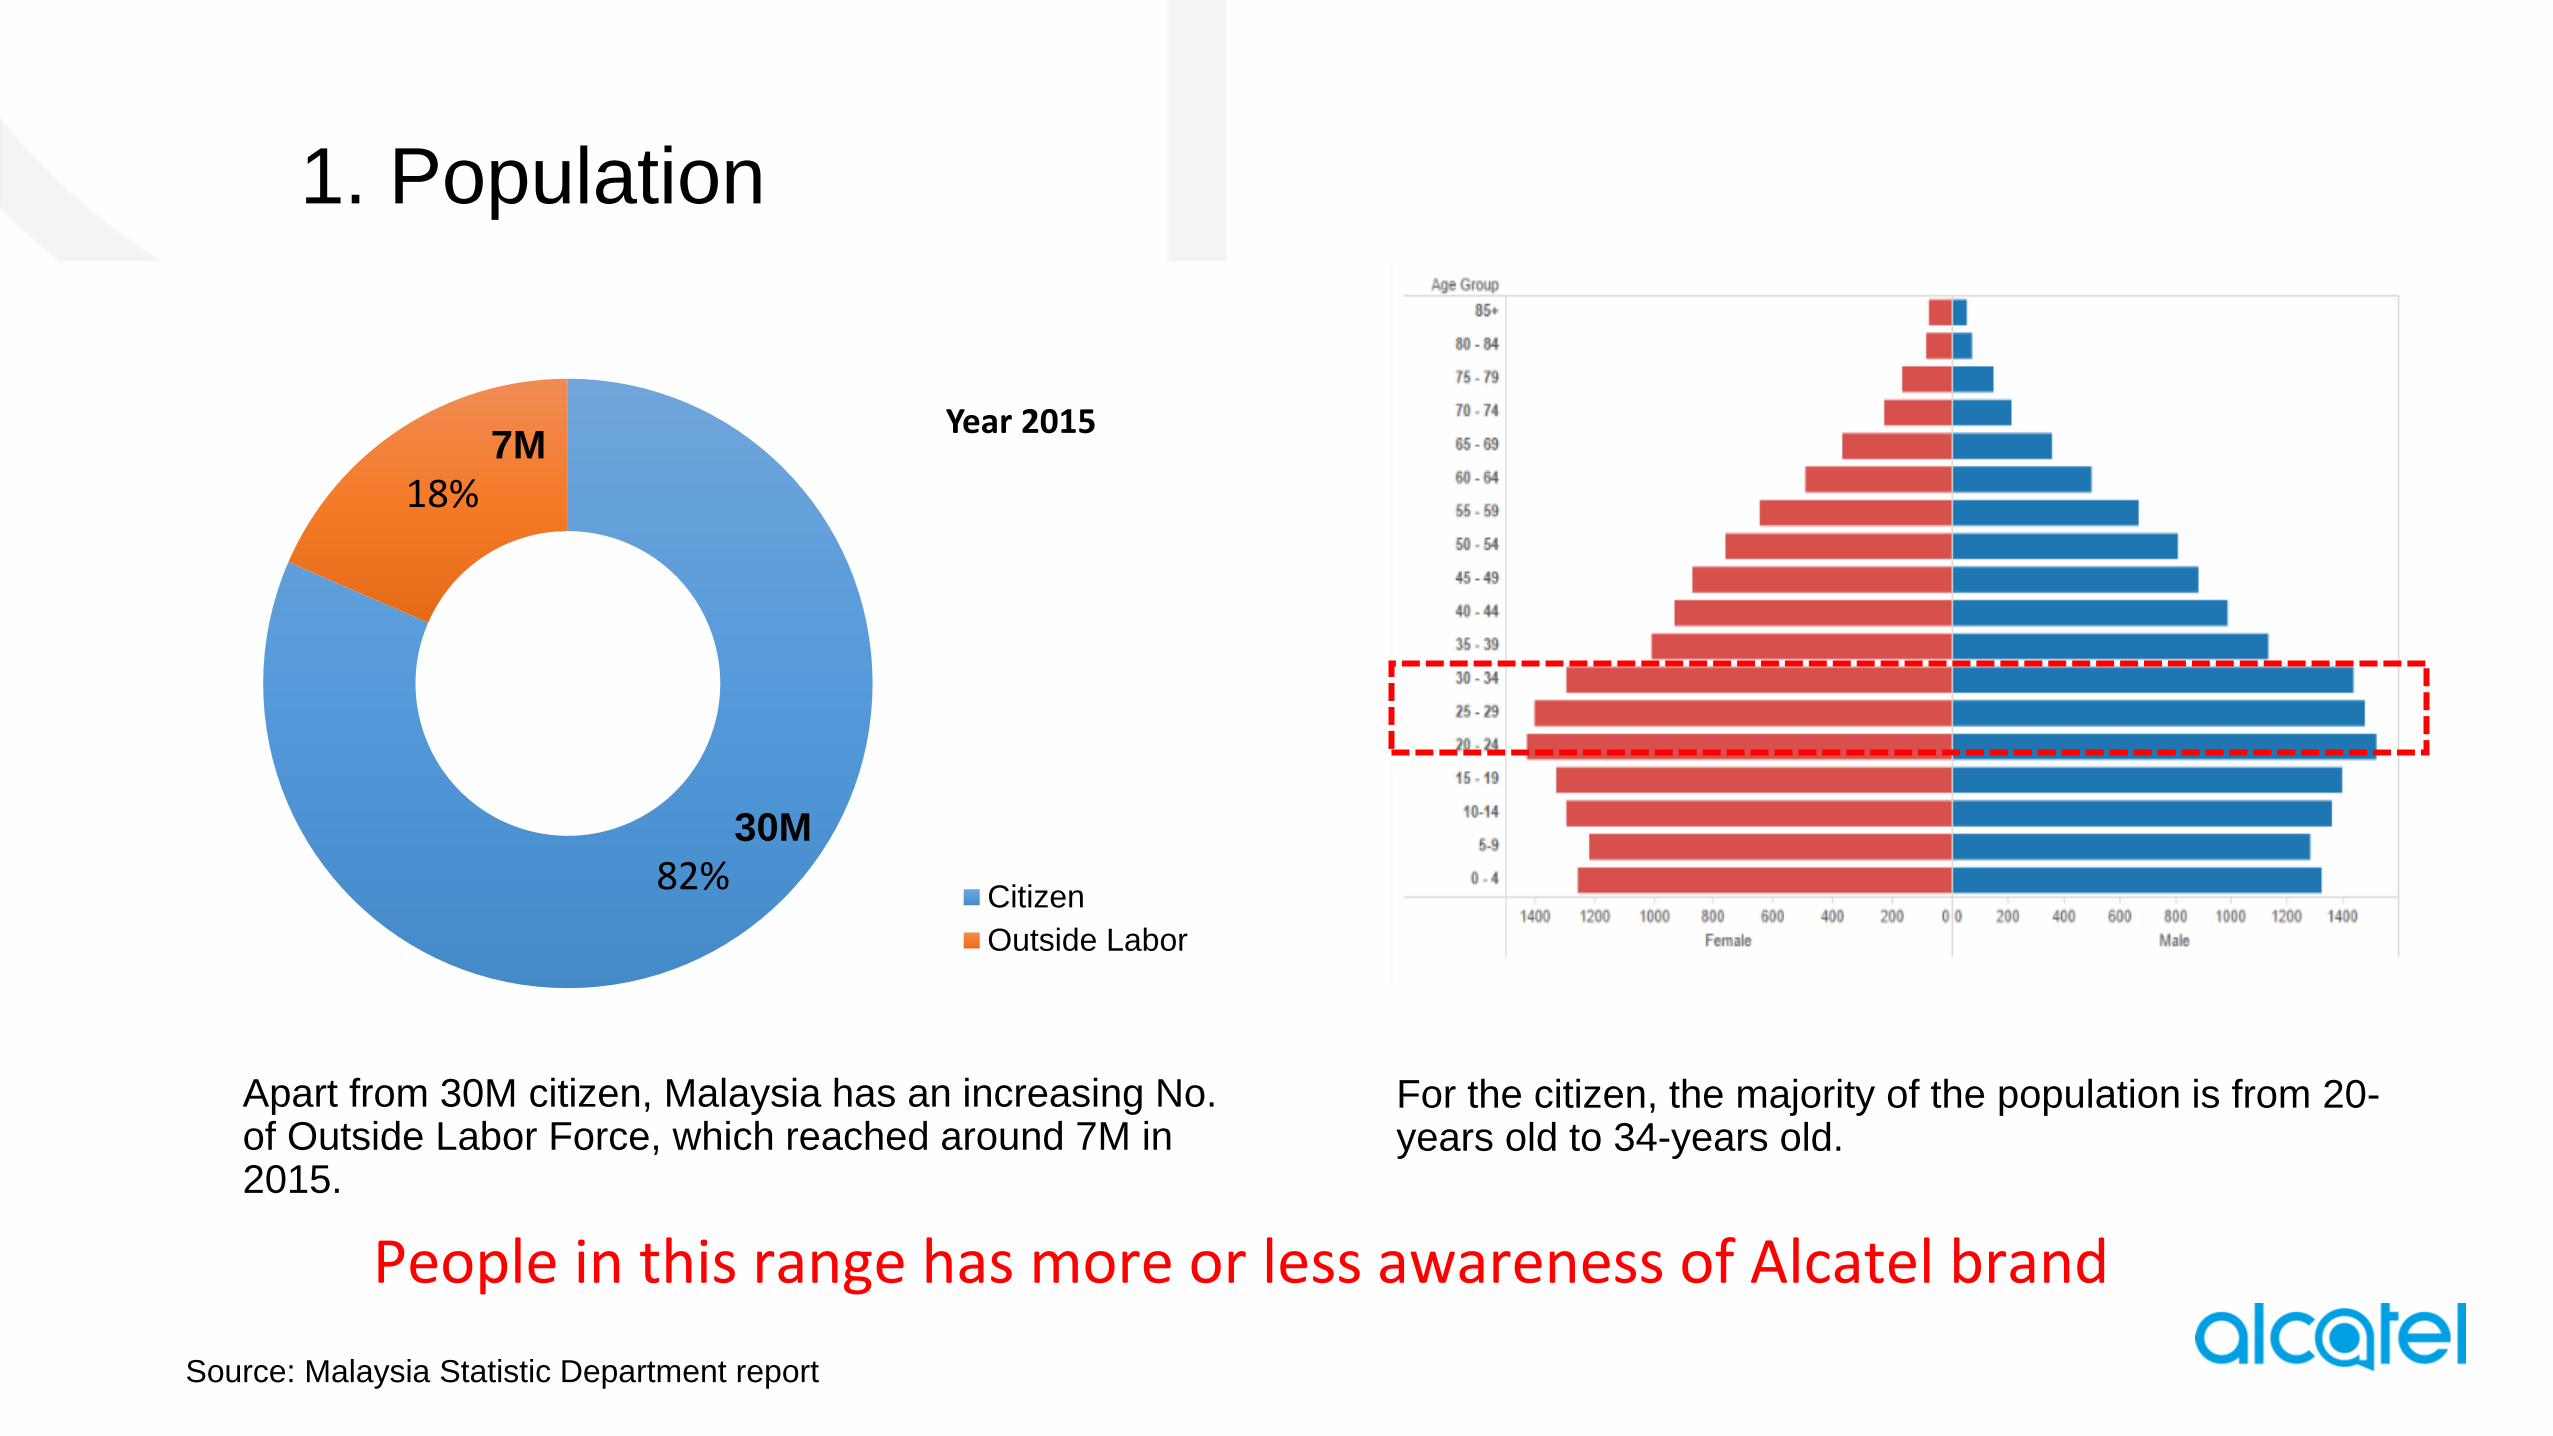
Apart from 30M citizen, Malaysia has an increasing No. of Outside Labor Force, which reached around 7M in 2015.
1. Population
Source: Malaysia Statistic Department report
82%
18%
Year 2015
Citizen
Outside Labor
7M
30M
For the citizen, the majority of the population is from 20-years old to 34-years old.
People in this range has more or less awareness of Alcatel brand
2. Economy and Income
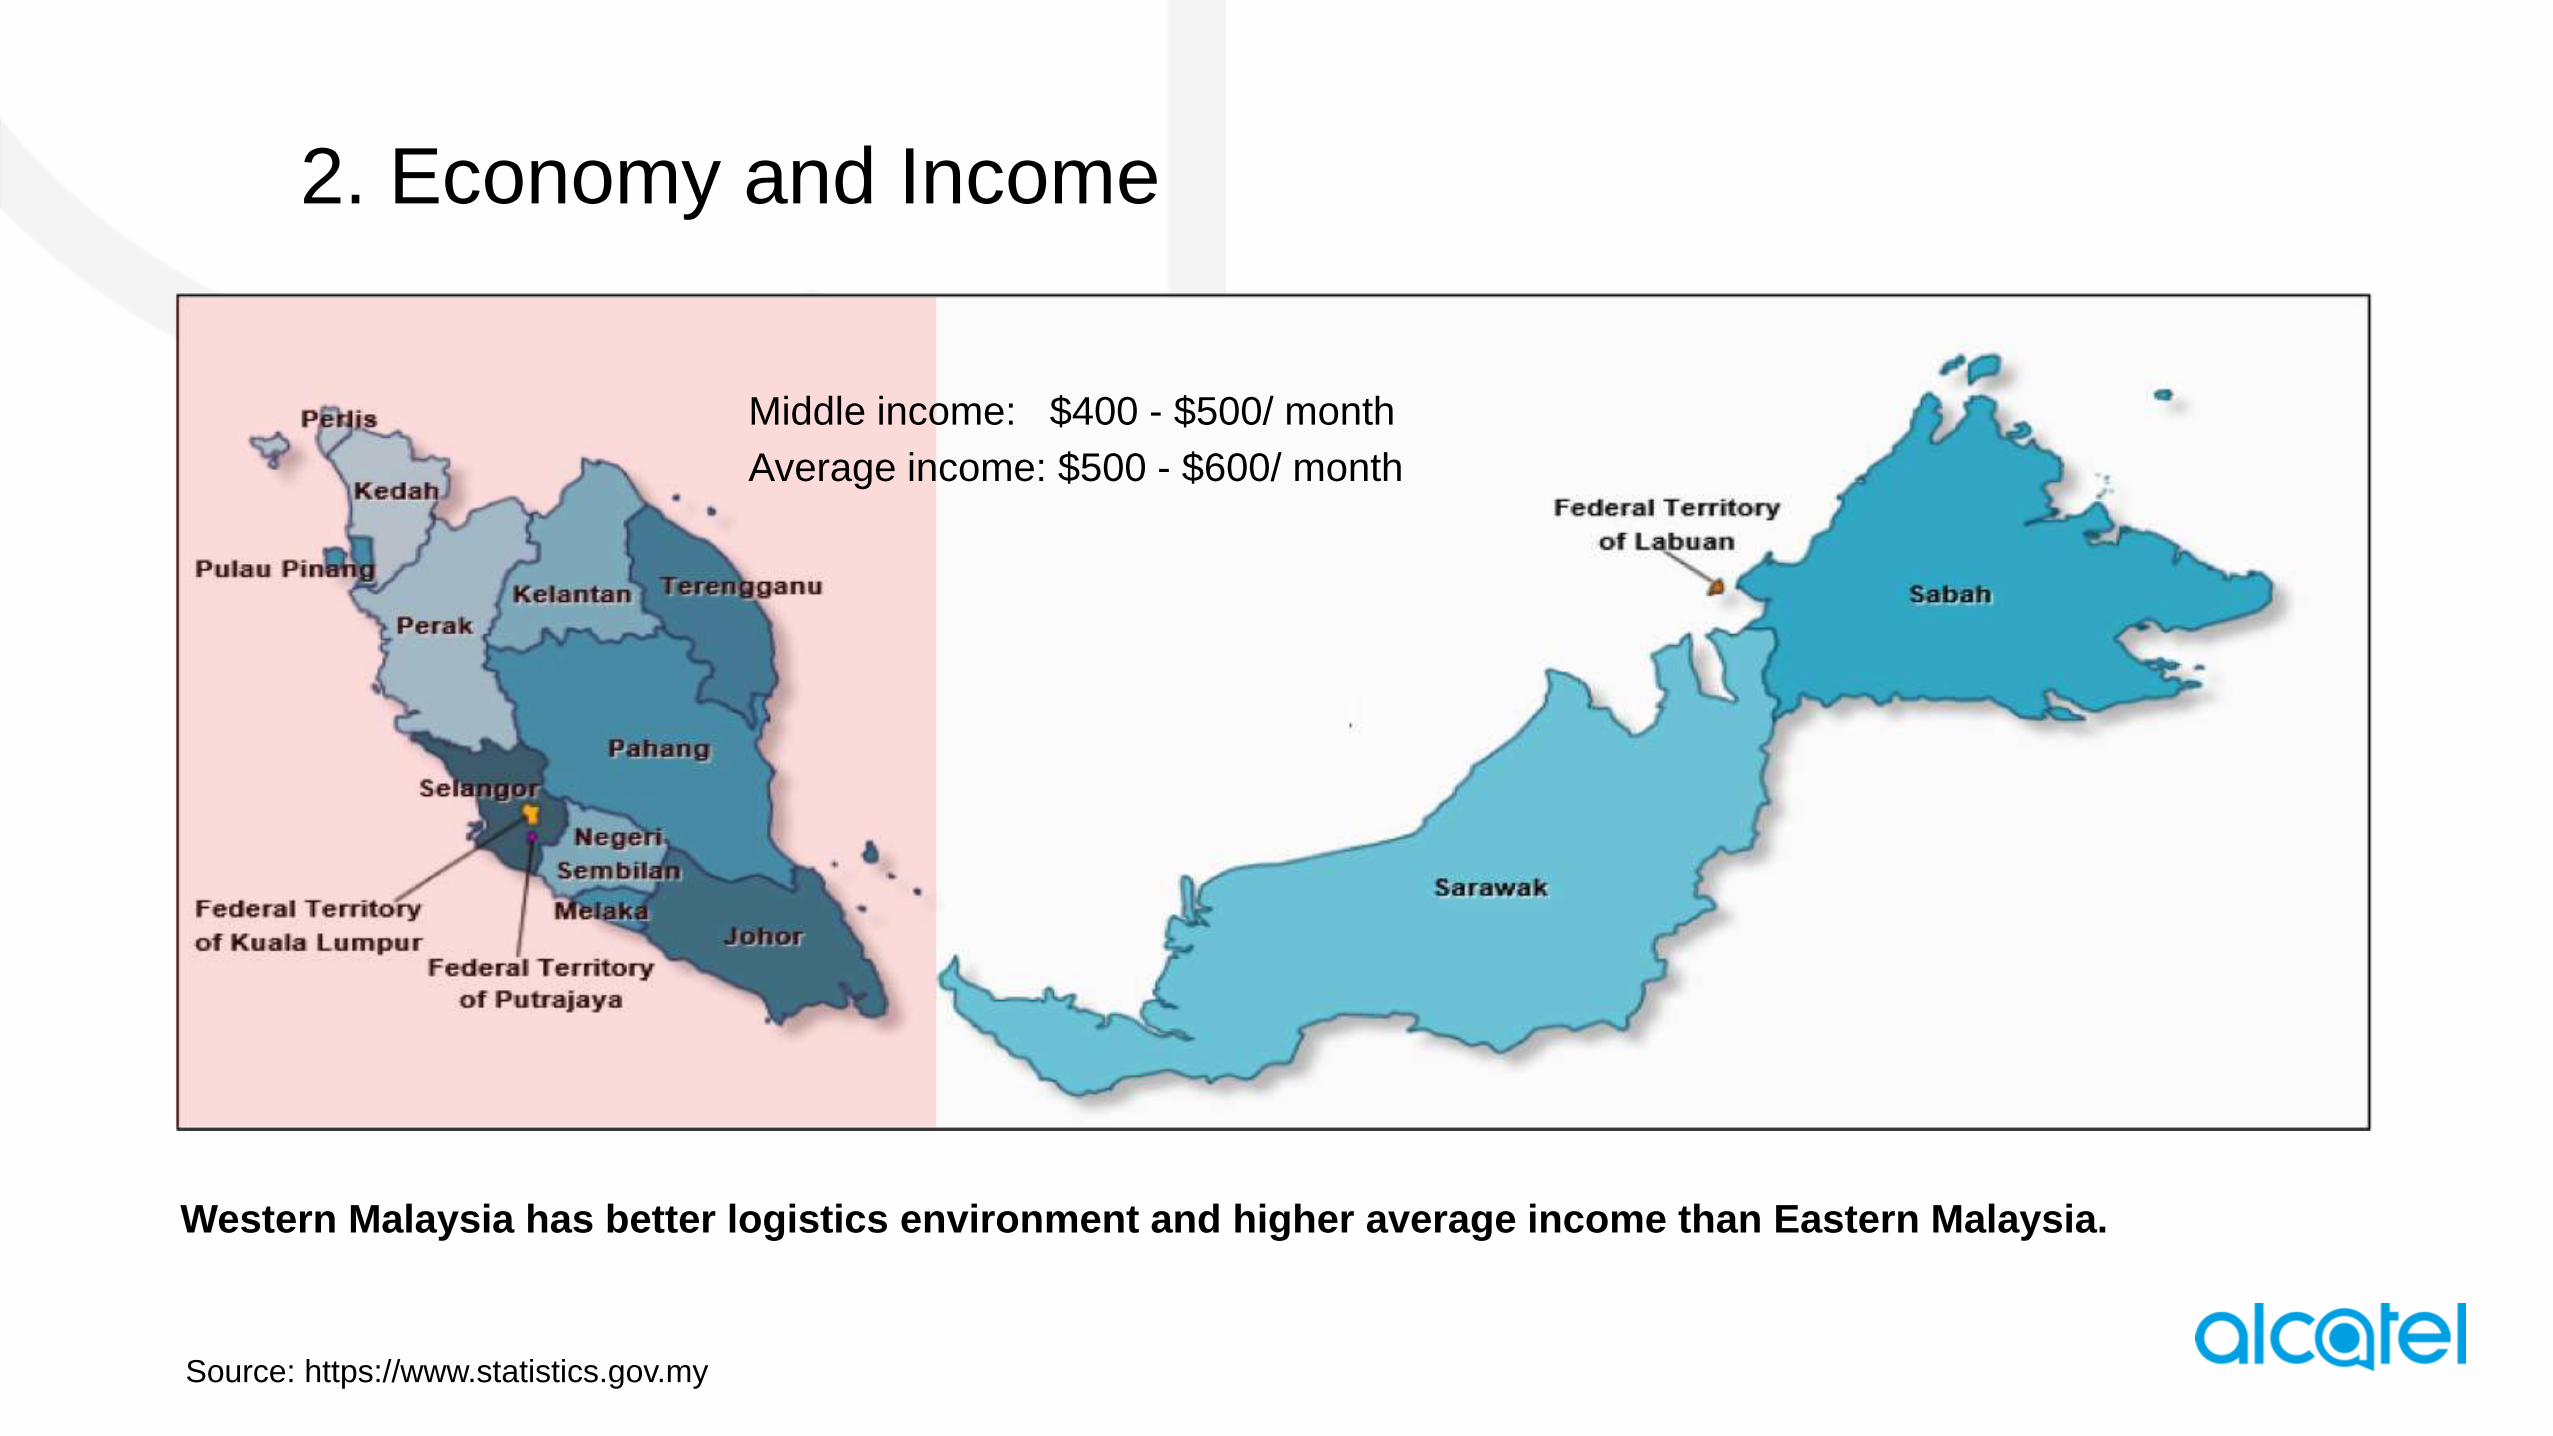
Western Malaysia has better logistics environment and higher average income than Eastern Malaysia.
Middle income: $400 - $500/ month
Average income: $500 - $600/ month
Source: https://www.statistics.gov.my
Mobile Phone
Market Analysis
1. Mobile Phone Market Overview
2. Smart Phone and Phablet
3. Feature Phone
Billion USD -
1,000.00
2,000.00
3,000.00
2016 2017
2013 2014 2015 Forcast
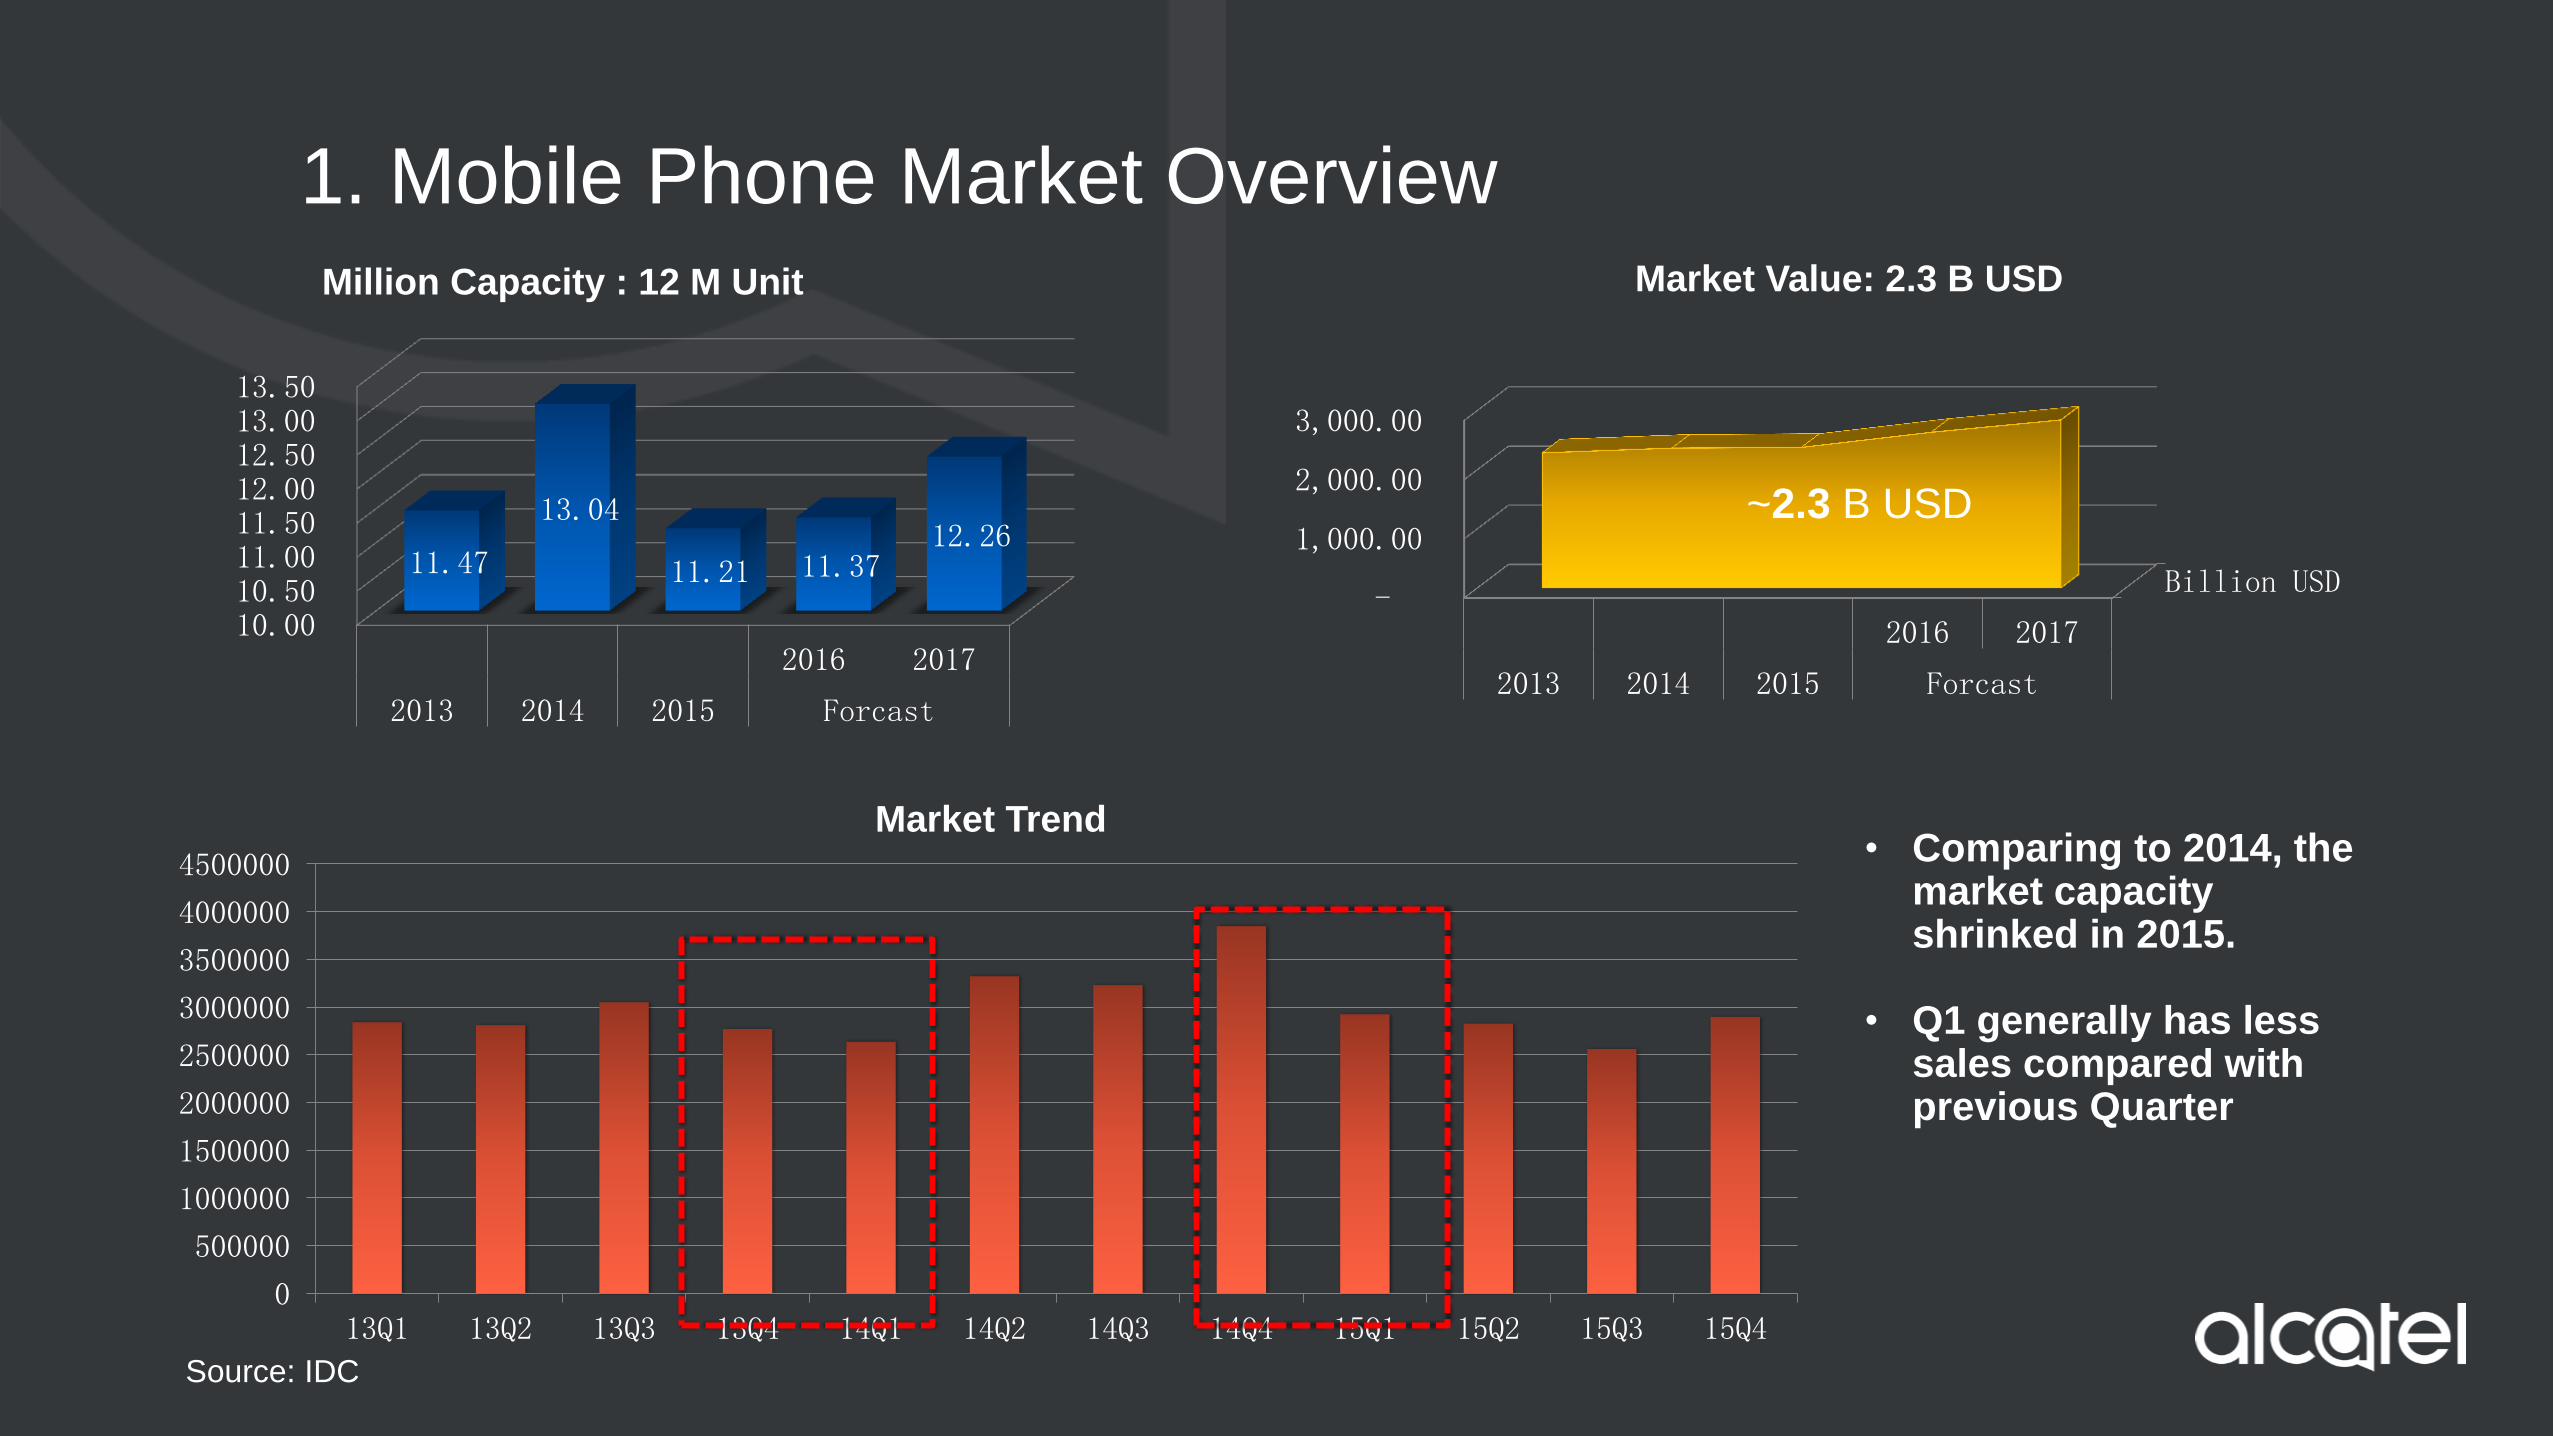
Market Value: 2.3 B USD
1. Mobile Phone Market Overview
10.00 10.50 11.00 11.50 12.00 12.50 13.00 13.50
2016 2017
2013 2014 2015 Forcast
11.47
13.04
11.21 11.37 12.26
Million Capacity : 12 M Unit
0
500000
1000000
1500000
2000000
2500000
3000000
3500000
4000000
4500000
13Q1 13Q2 13Q3 13Q4 14Q1 14Q2 14Q3 14Q4 15Q1 15Q2 15Q3 15Q4
Market Trend
~2.3 B USD
• Comparing to 2014, the market capacity shrinked in 2015.
• Q1 generally has less sales compared with previous Quarter
Source: IDC
2016 2017
2013 2014 2015 Forcast
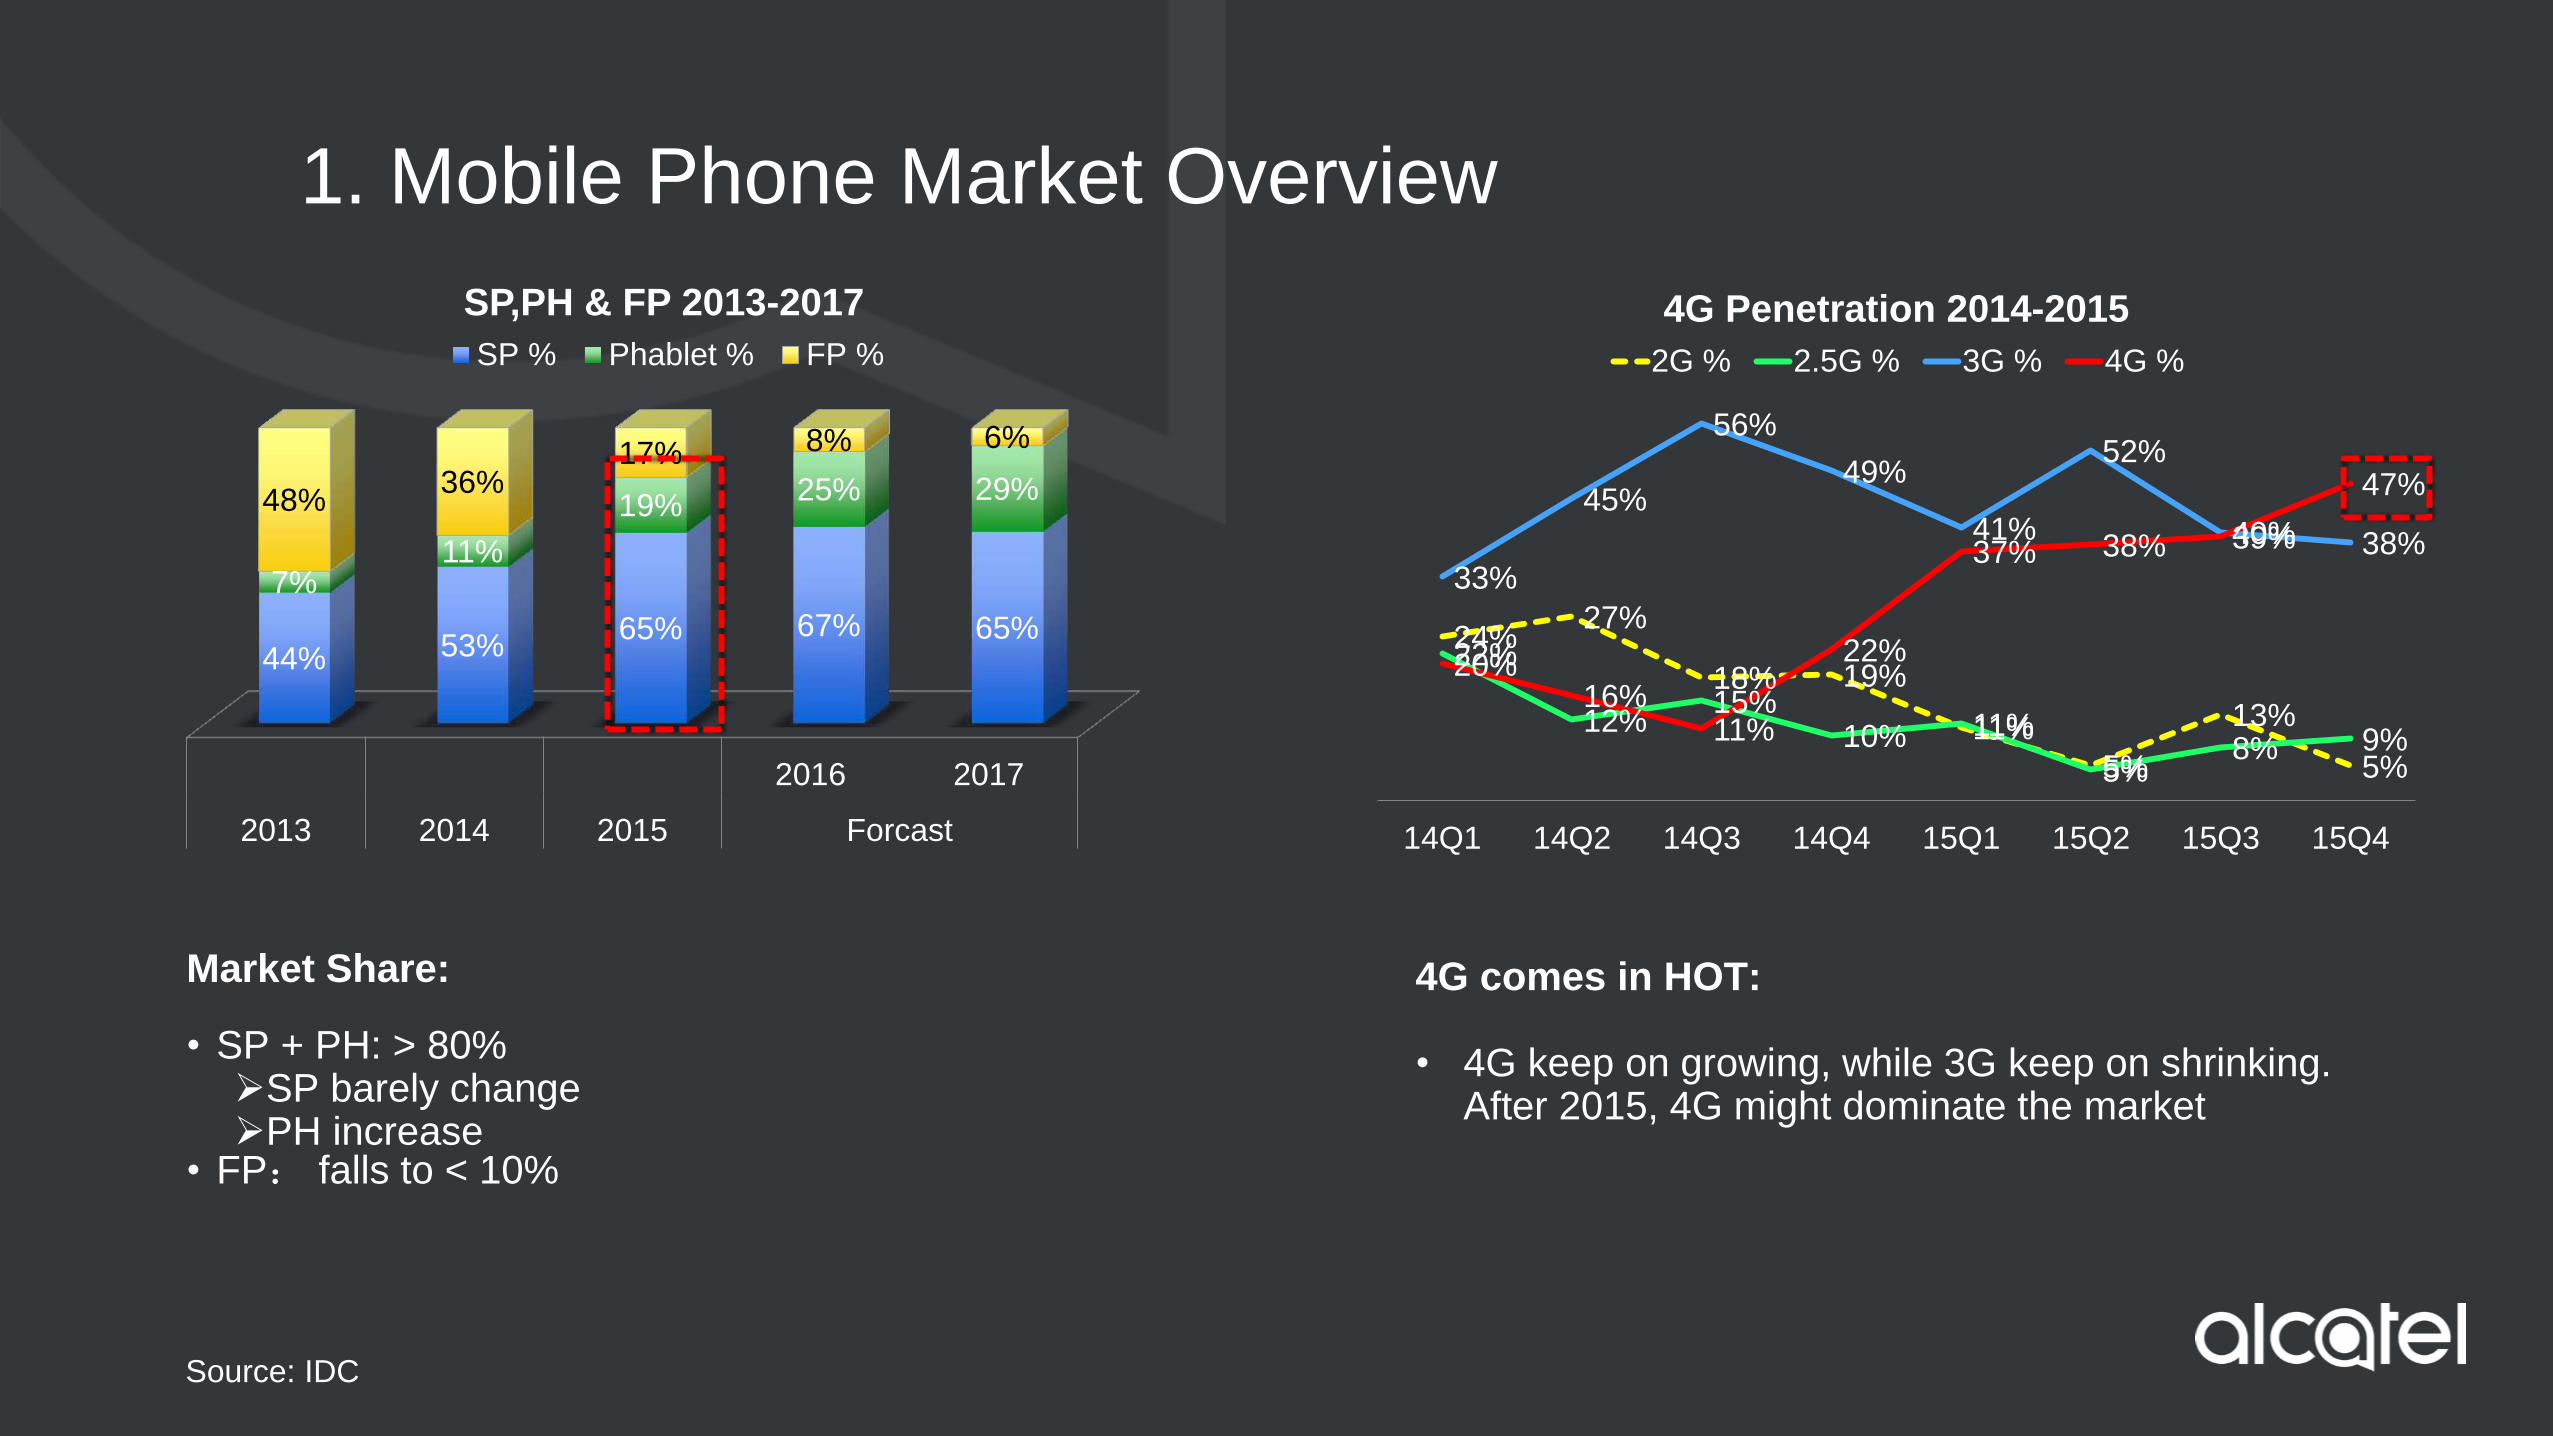
44% 53% 65% 67% 65%
7% 11%
19% 25% 29% 48%
36% 17% 8% 6%
SP,PH & FP 2013-2017
SP % Phablet % FP %
Market Share: • SP + PH: > 80% SP barely change PH increase
• FP: falls to < 10%
4G comes in HOT:
• 4G keep on growing, while 3G keep on shrinking. After 2015, 4G might dominate the market
1. Mobile Phone Market Overview
24% 27%
18% 19%
11%
5%
13%
5%
22%
12% 15%
10% 11%
5% 8% 9%
33%
45%
56%
49%
41%
52%
40% 38%
20% 16%
11%
22%
37% 38% 39%
47%
14Q1 14Q2 14Q3 14Q4 15Q1 15Q2 15Q3 15Q4
4G Penetration 2014-2015
2G % 2.5G % 3G % 4G %
Source: IDC
1. Mobile Phone Market Overview- Conclusion
Malaysia Cell Phone Market - Due to the recession of the economy: • Total Market Capacity: 12 M units(Barely Change);
• Total Market Value: 2.3 B USD(Barely Change);
Market Trend: • Seasonal Trend: Q1 tends to have lower sales than previous quarter;
Other Trends: • PH will have a boost in the 2016 and SP + PH will dominate the market;
• 4G will gradually replace 3G phones in the market;
2. Smart Phone and Phablet
Source: IDC
-
1,000,000.00
2,000,000.00
3,000,000.00
4,000,000.00
5,000,000.00
6,000,000.00
7,000,000.00
8,000,000.00
9,000,000.00
10,000,000.00
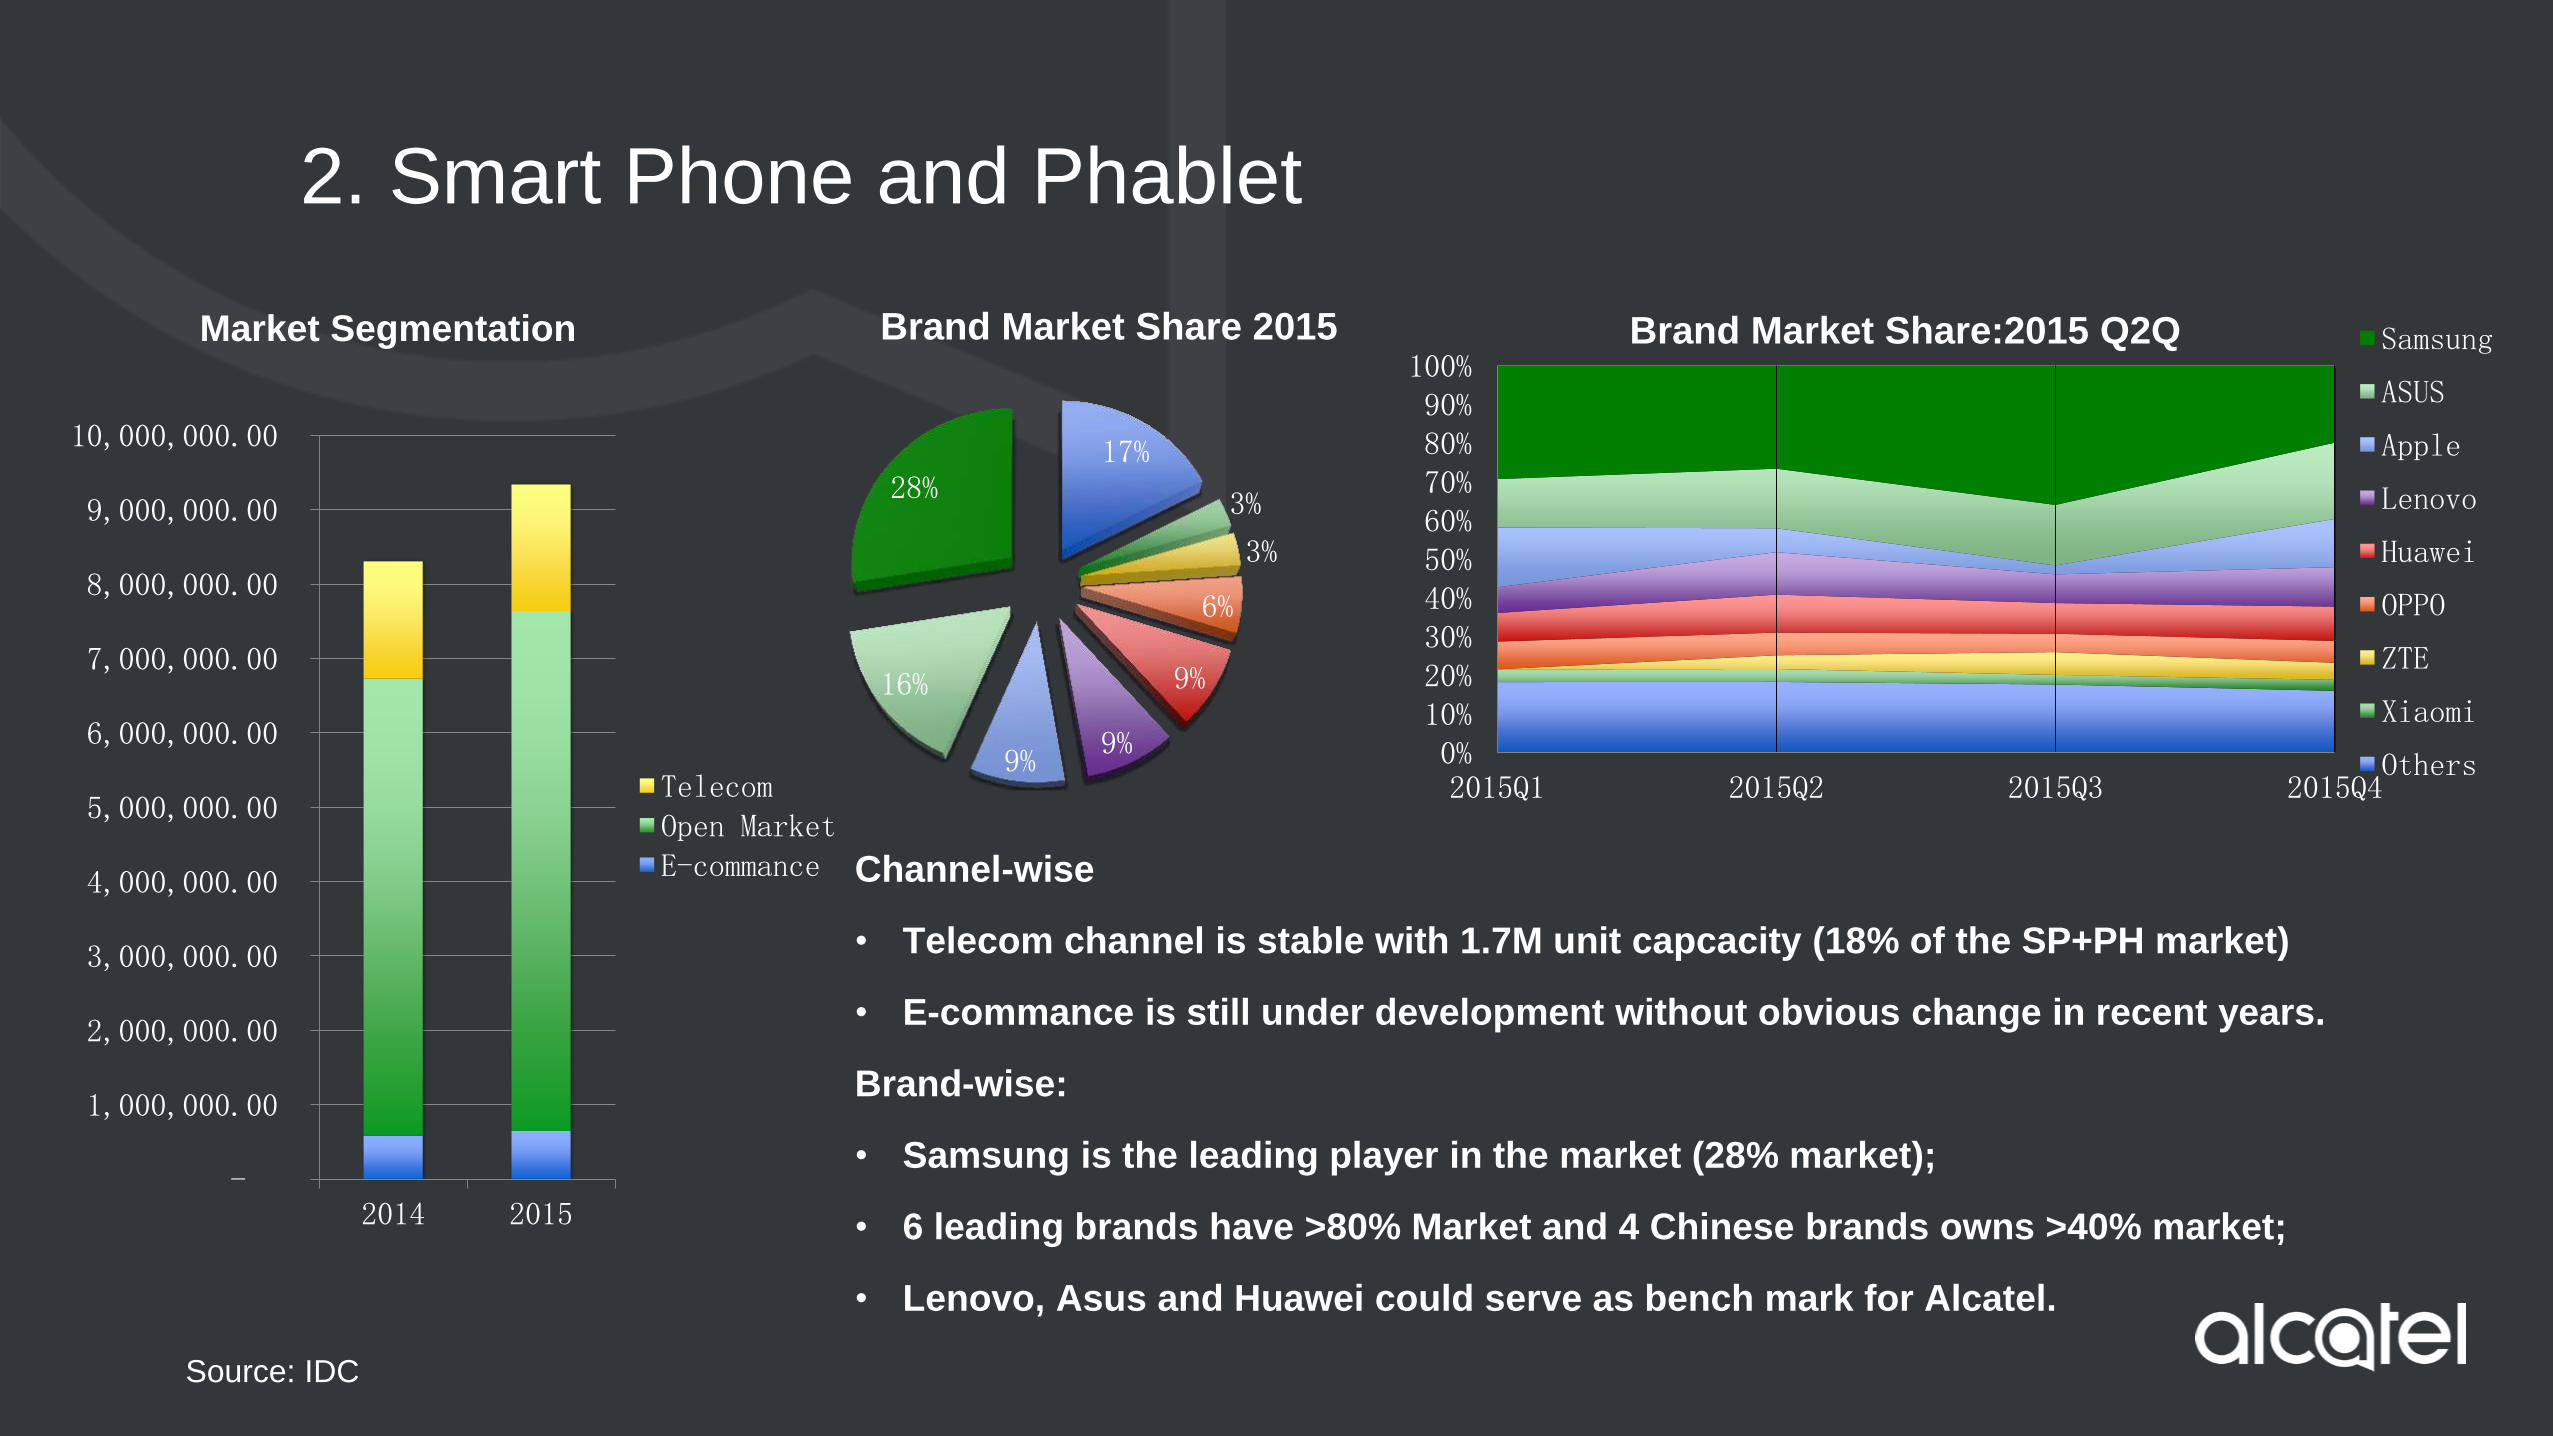
2014 2015
TelecomOpen MarketE-commance
17%
3%
3%
6%
9%
9% 9%
16%
28%
Brand Market Share 2015
0%10%20%30%40%50%60%70%80%90%100%
2015Q1 2015Q2 2015Q3 2015Q4
Brand Market Share:2015 Q2Q Samsung
ASUS
Apple
Lenovo
Huawei
OPPO
ZTE
Xiaomi
Others
Channel-wise • Telecom channel is stable with 1.7M unit capcacity (18% of the SP+PH market)
• E-commance is still under development without obvious change in recent years.
Brand-wise: • Samsung is the leading player in the market (28% market);
• 6 leading brands have >80% Market and 4 Chinese brands owns >40% market;
• Lenovo, Asus and Huawei could serve as bench mark for Alcatel.
Market Segmentation
2. Smart Phone and Phablet
Source: IDC
0%
10%
20%
30%
40%
50%
60%
16Q1 16Q2 16Q3 16Q4
15Q1 15Q2 15Q3 15Q4 Forcast
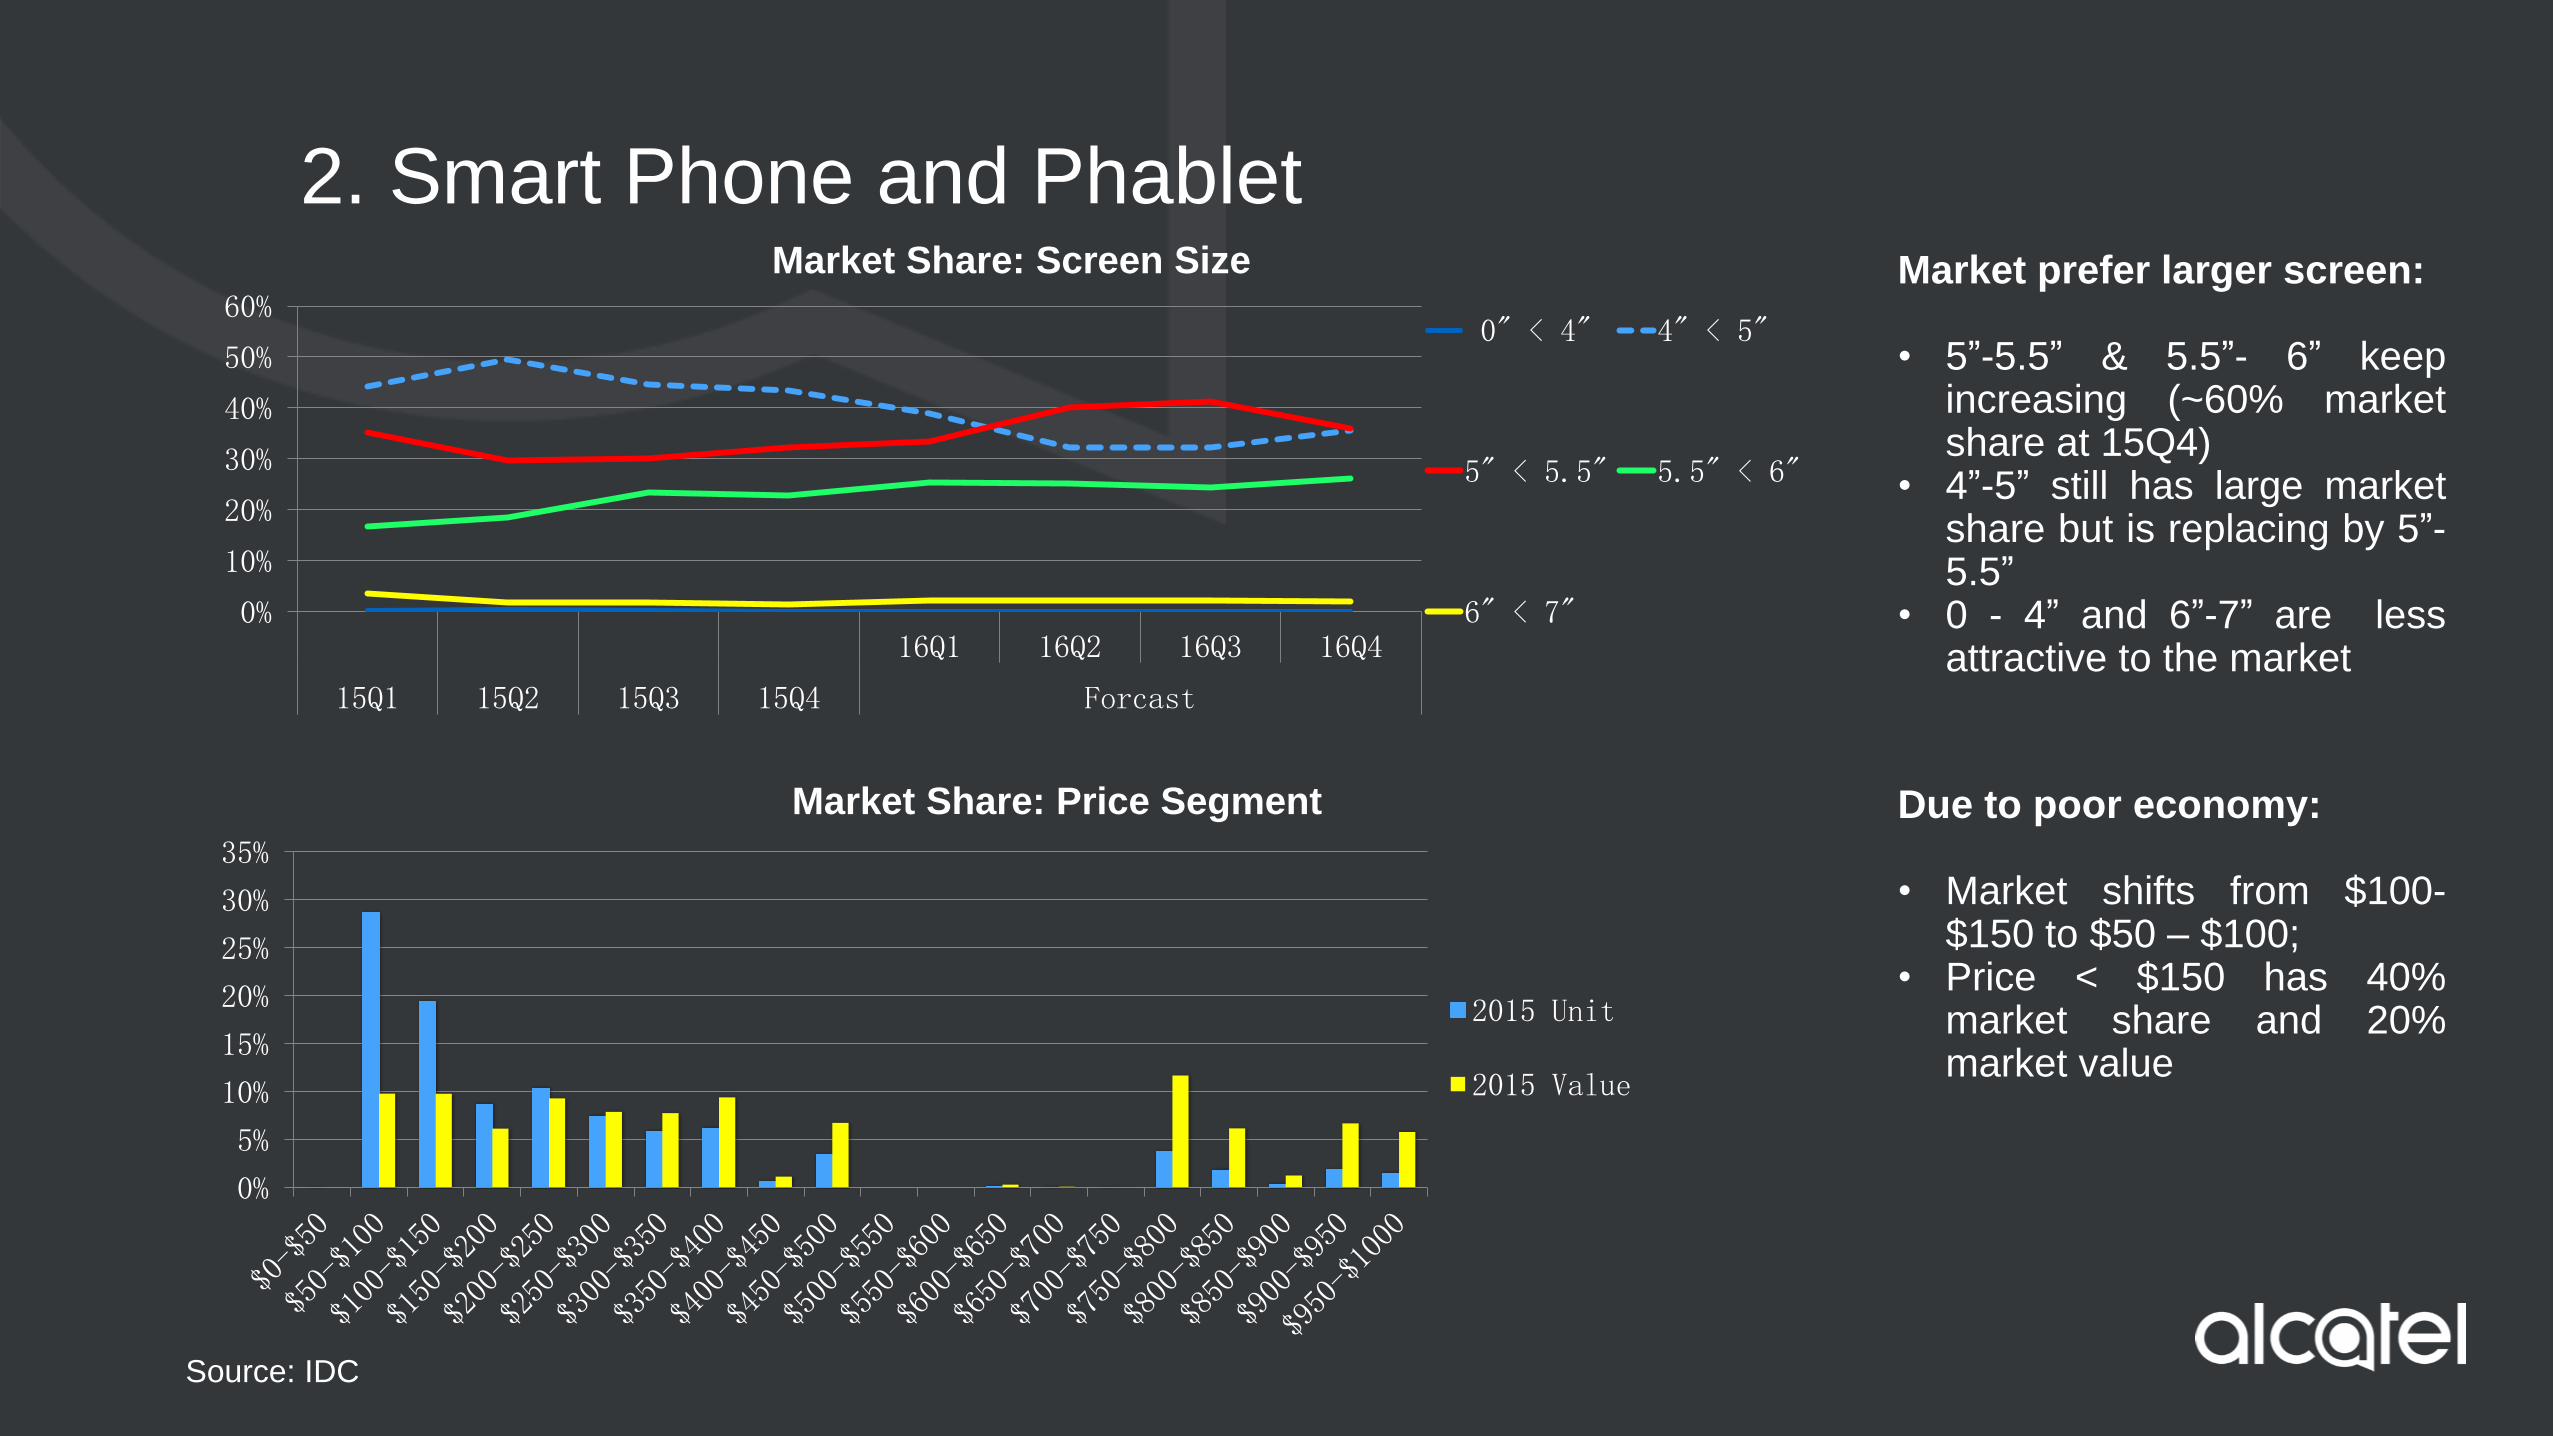
Market Share: Screen Size
0" < 4" 4" < 5"
5" < 5.5" 5.5" < 6"
6" < 7"
0%
5%
10%
15%
20%
25%
30%
35%
2015 Unit
2015 Value
Market Share: Price Segment Due to poor economy: • Market shifts from $100-
$150 to $50 – $100; • Price < $150 has 40%
market share and 20% market value
Market prefer larger screen: • 5”-5.5” & 5.5”- 6” keep
increasing (~60% market share at 15Q4)
• 4”-5” still has large market share but is replacing by 5”-5.5”
• 0 - 4” and 6”-7” are less attractive to the market
2. Smart Phone and Phablet- Conclusion
Source: IDC
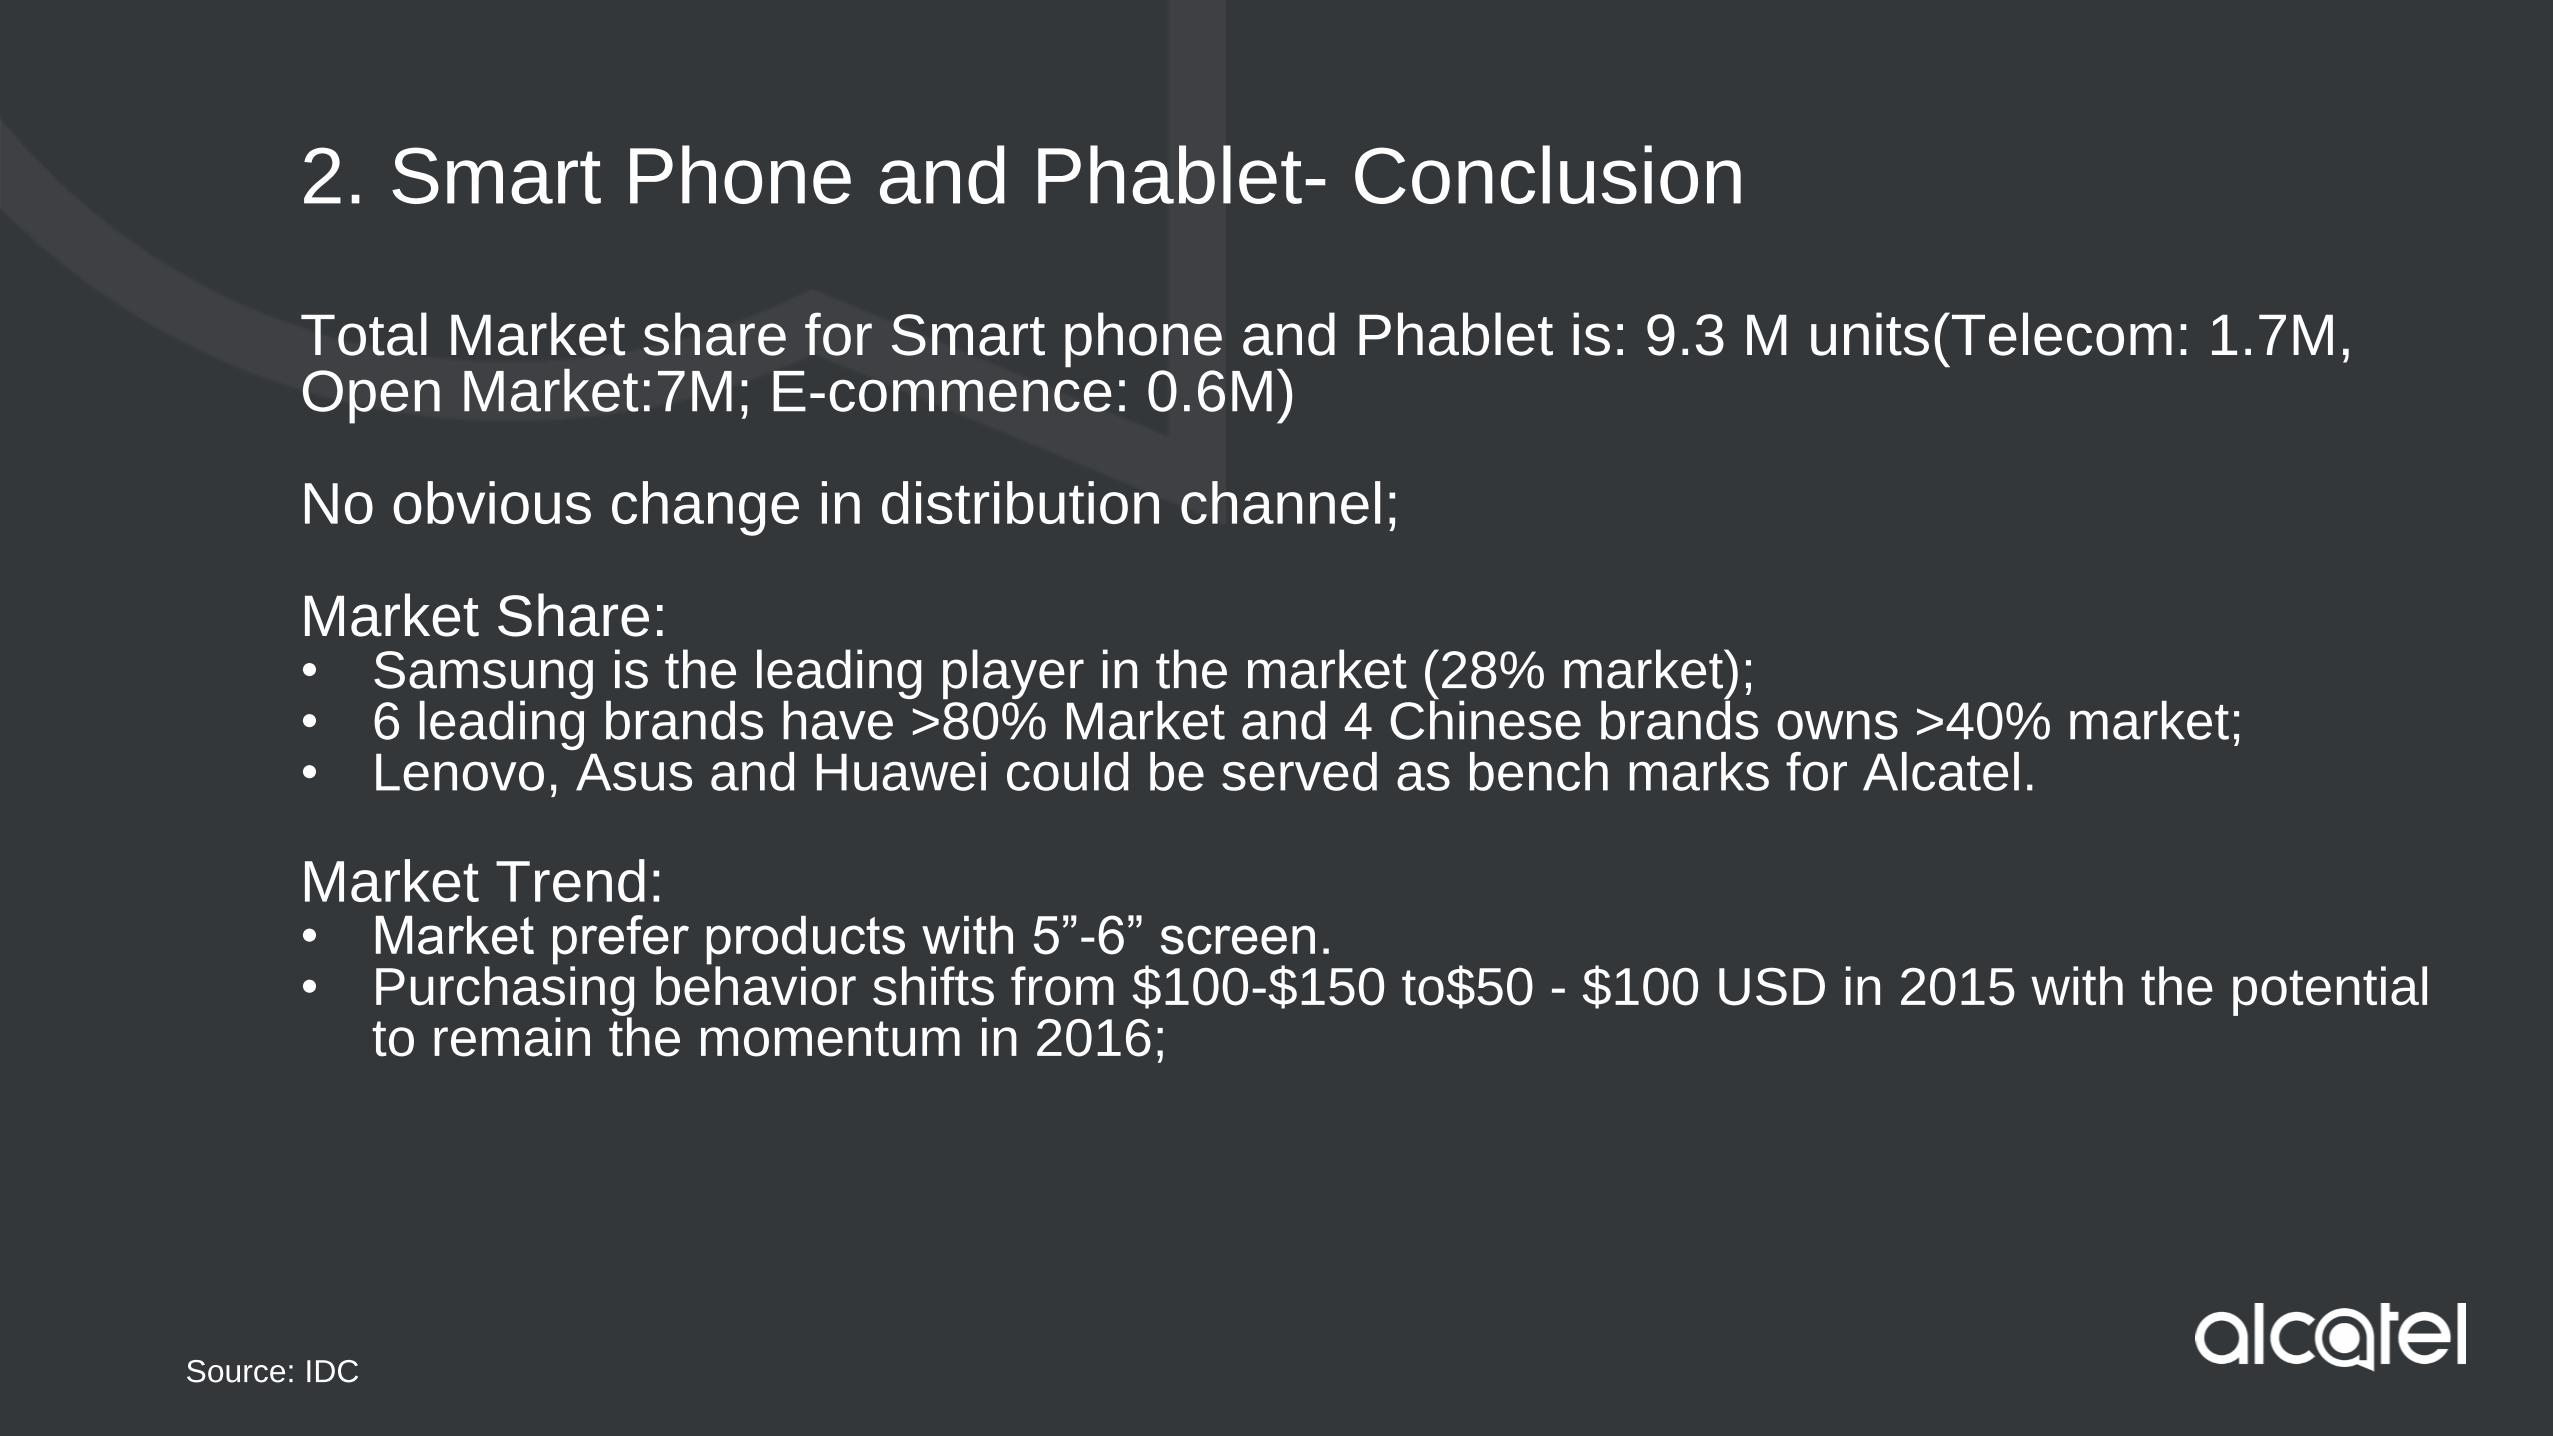
Total Market share for Smart phone and Phablet is: 9.3 M units(Telecom: 1.7M, Open Market:7M; E-commence: 0.6M) No obvious change in distribution channel; Market Share: • Samsung is the leading player in the market (28% market); • 6 leading brands have >80% Market and 4 Chinese brands owns >40% market; • Lenovo, Asus and Huawei could be served as bench marks for Alcatel.
Market Trend: • Market prefer products with 5”-6” screen. • Purchasing behavior shifts from $100-$150 to$50 - $100 USD in 2015 with the potential
to remain the momentum in 2016;
3. Feature Phone
Source: IDC
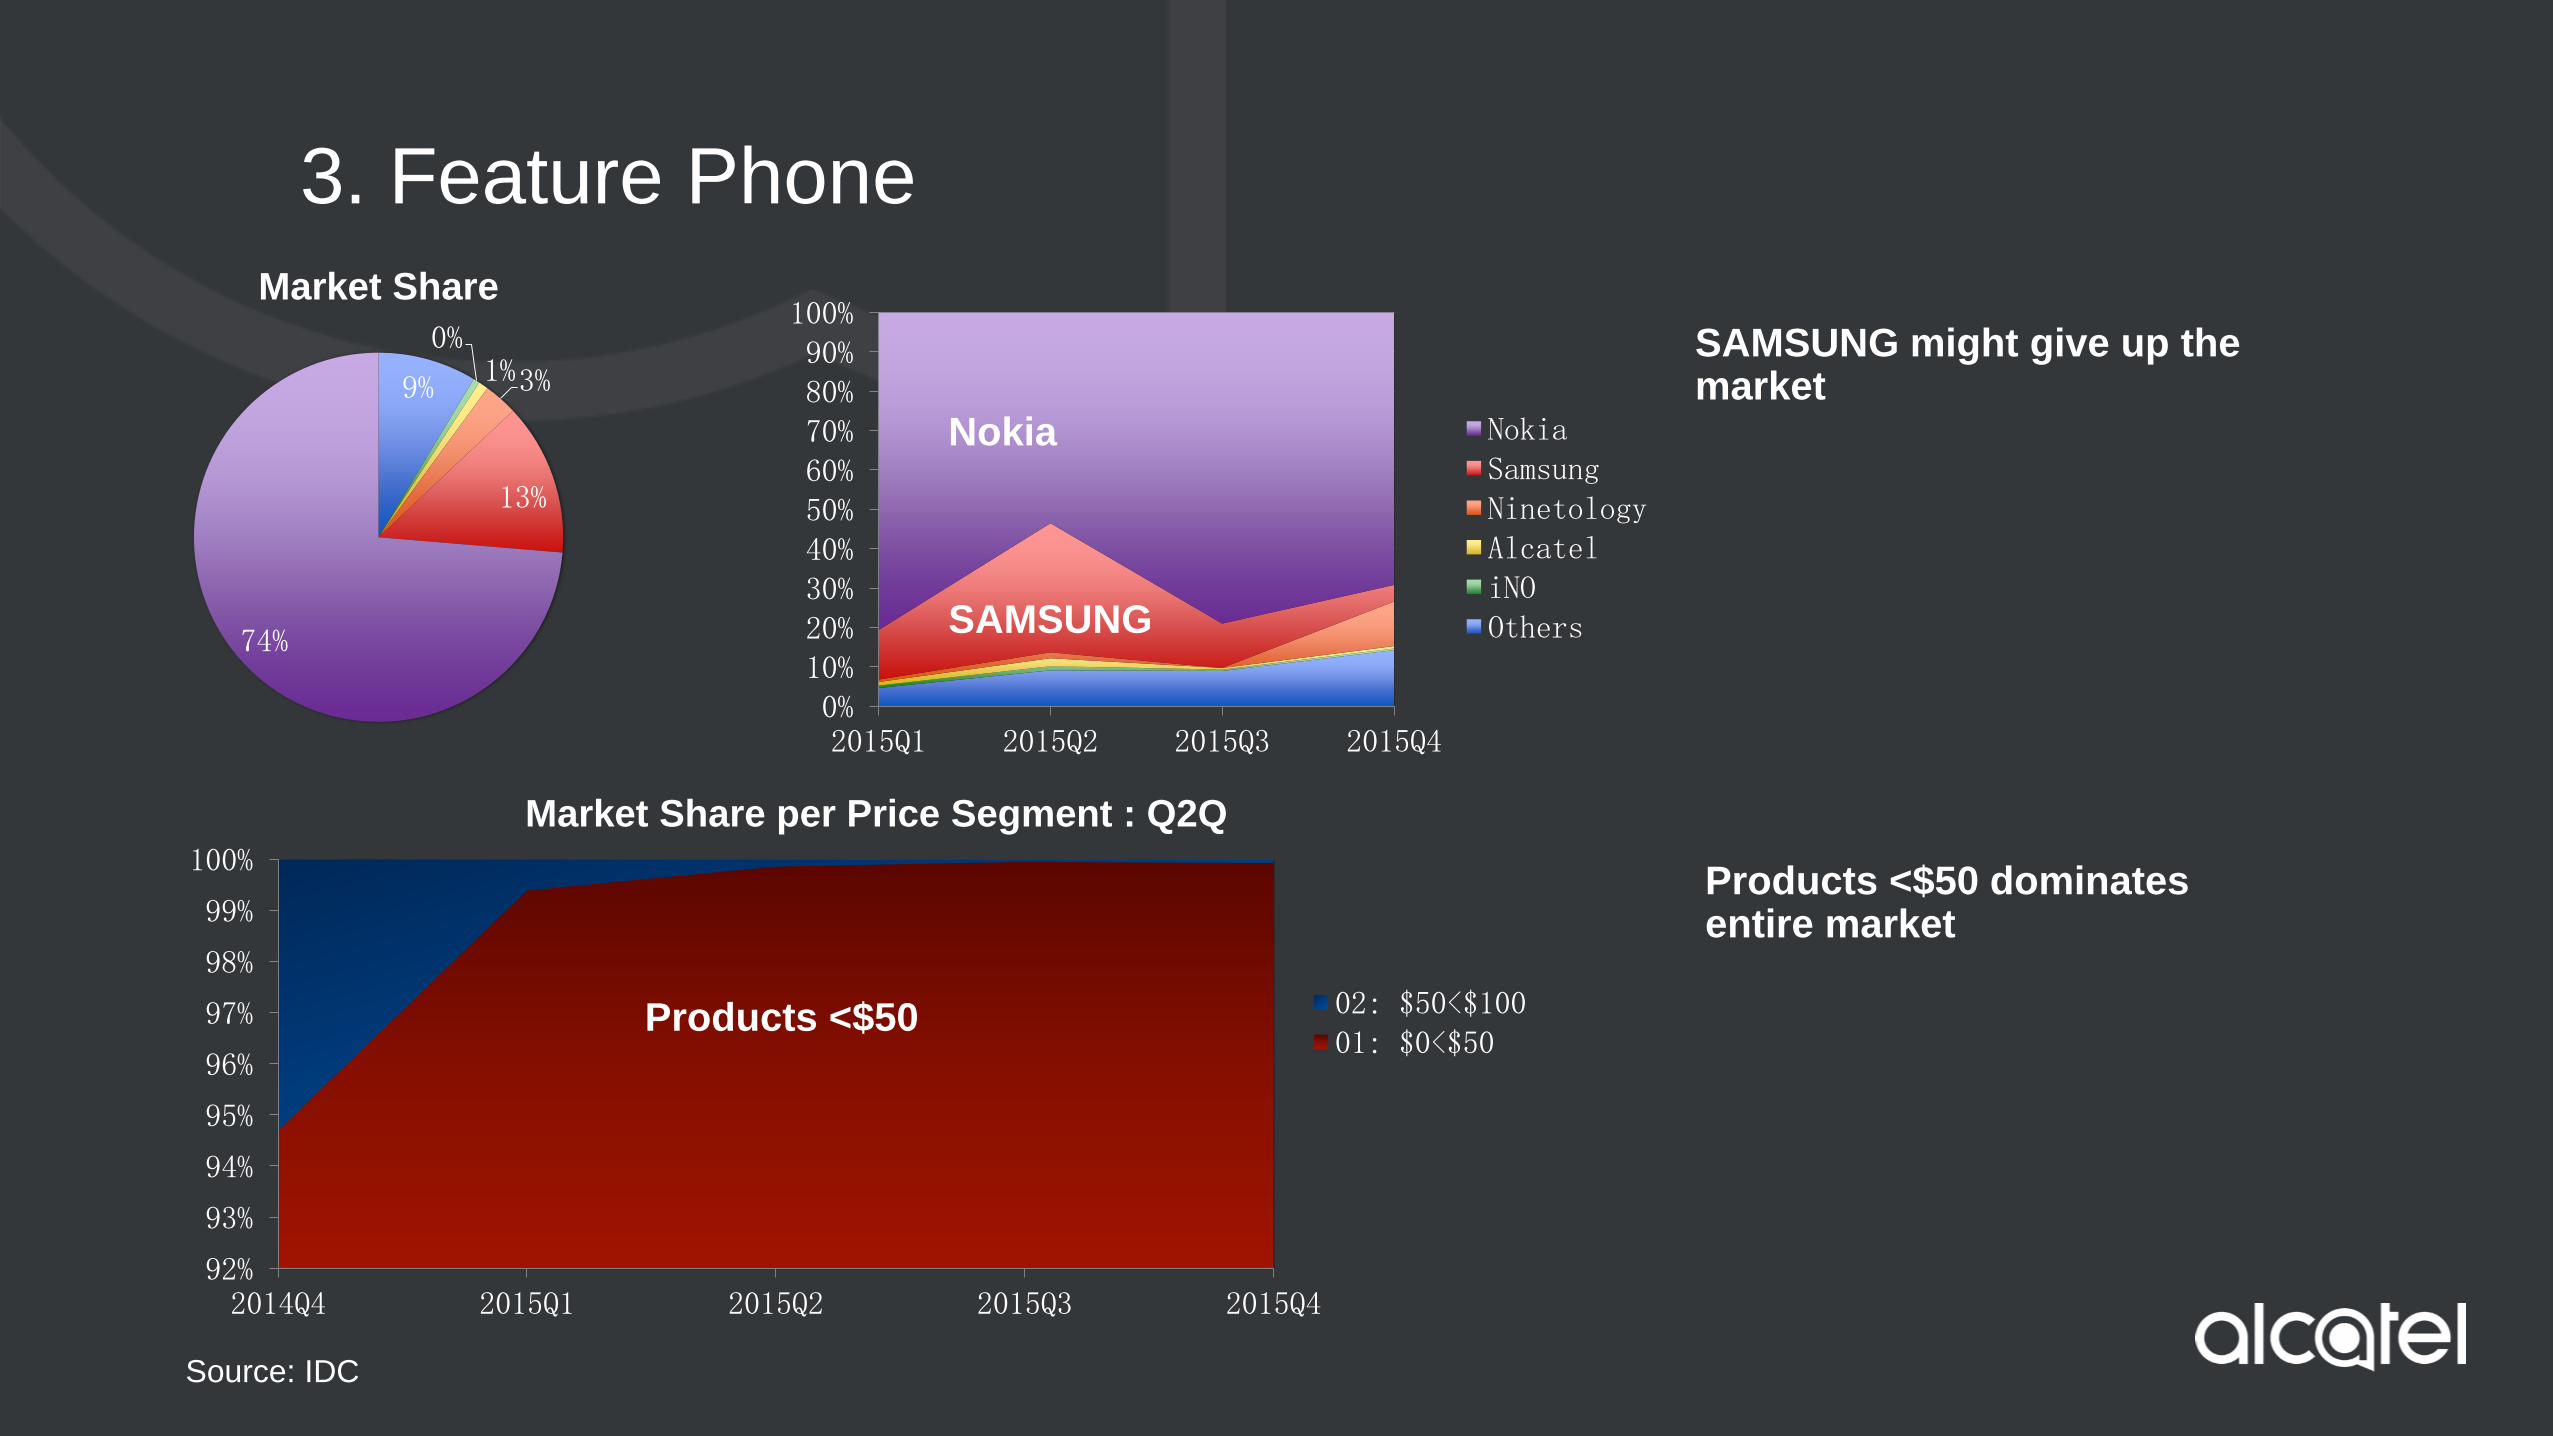
Products <$50 dominates entire market
SAMSUNG might give up the market 9%
0% 1% 3%
13%
74%
Market Share
0%10%20%30%40%50%60%70%80%90%100%
2015Q1 2015Q2 2015Q3 2015Q4
NokiaSamsungNinetologyAlcateliNOOthers
92%
93%
94%
95%
96%
97%
98%
99%
100%
2014Q4 2015Q1 2015Q2 2015Q3 2015Q4
Market Share per Price Segment : Q2Q
02: $50<$10001: $0<$50
Products <$50
SAMSUNG
Nokia
3. Feature Phone- Conclusion
Source: IDC
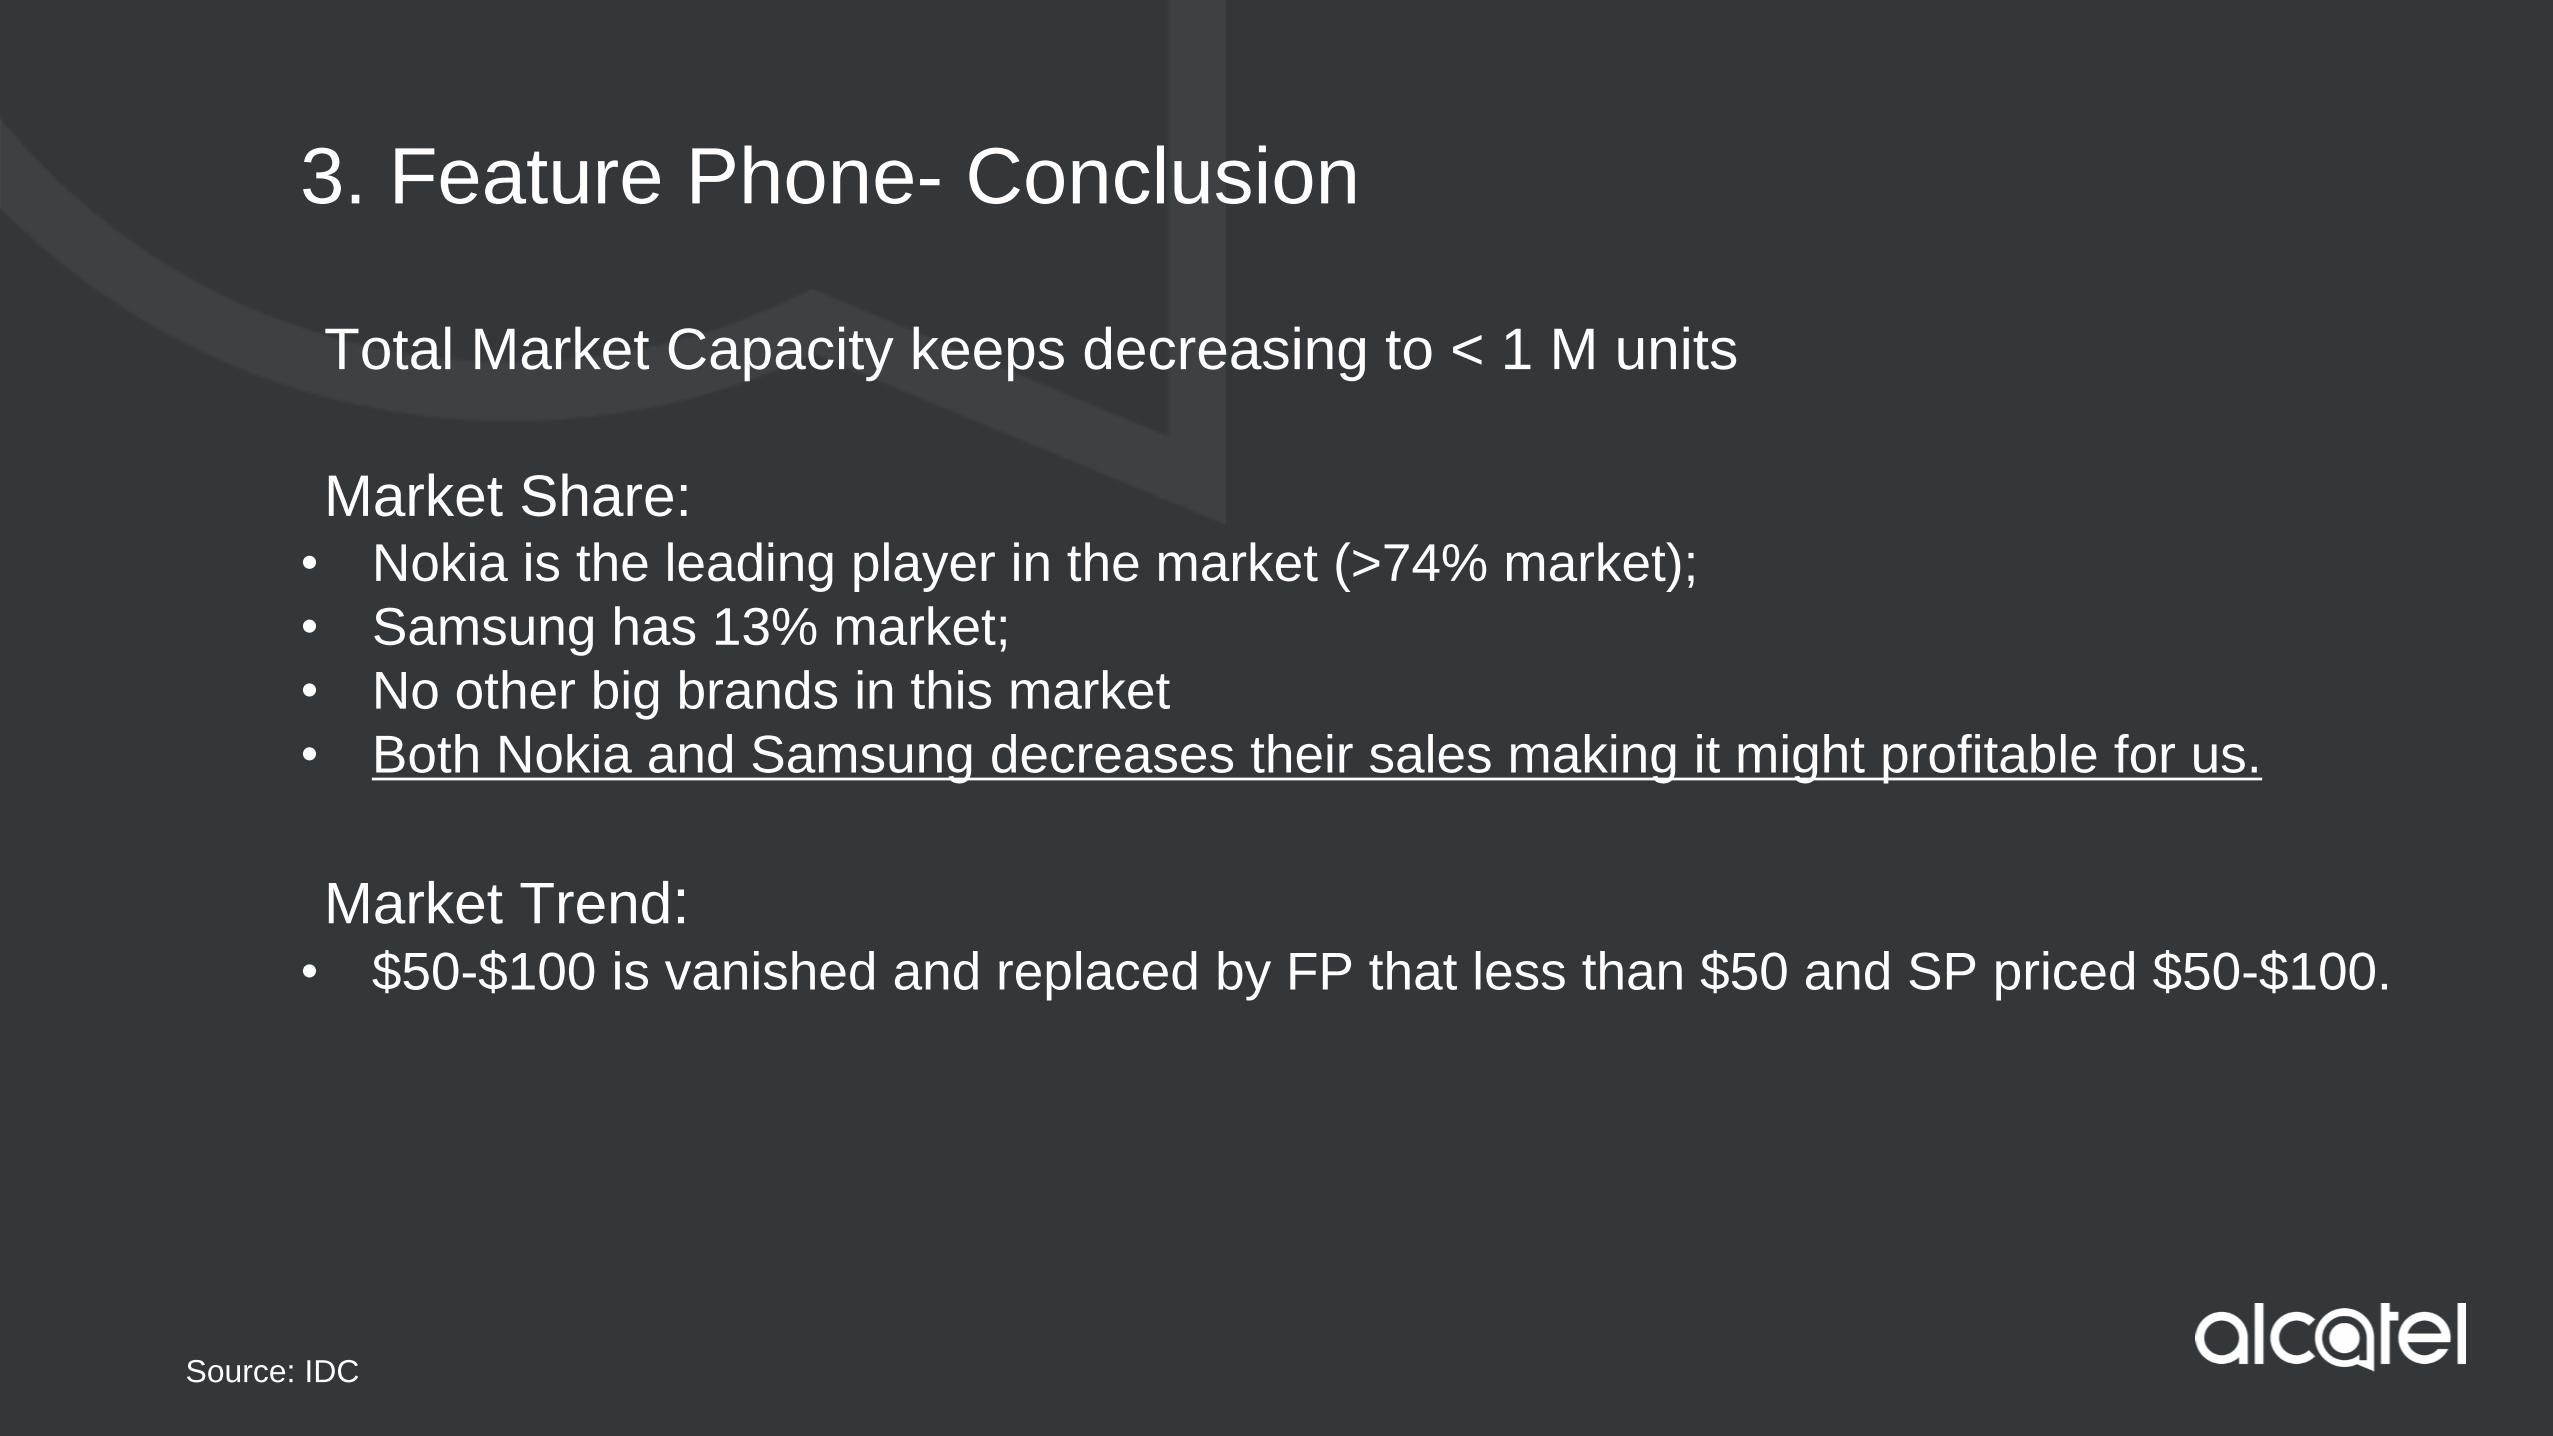
Total Market Capacity keeps decreasing to < 1 M units
Market Share:
• Nokia is the leading player in the market (>74% market);
• Samsung has 13% market;
• No other big brands in this market
• Both Nokia and Samsung decreases their sales making it might profitable for us.
Market Trend: • $50-$100 is vanished and replaced by FP that less than $50 and SP priced $50-$100.
Tablet Market
Analysis 1. Market Share
2. Slate Tablet
3. Detachable Tablet
1. Market Share
Source: IDC
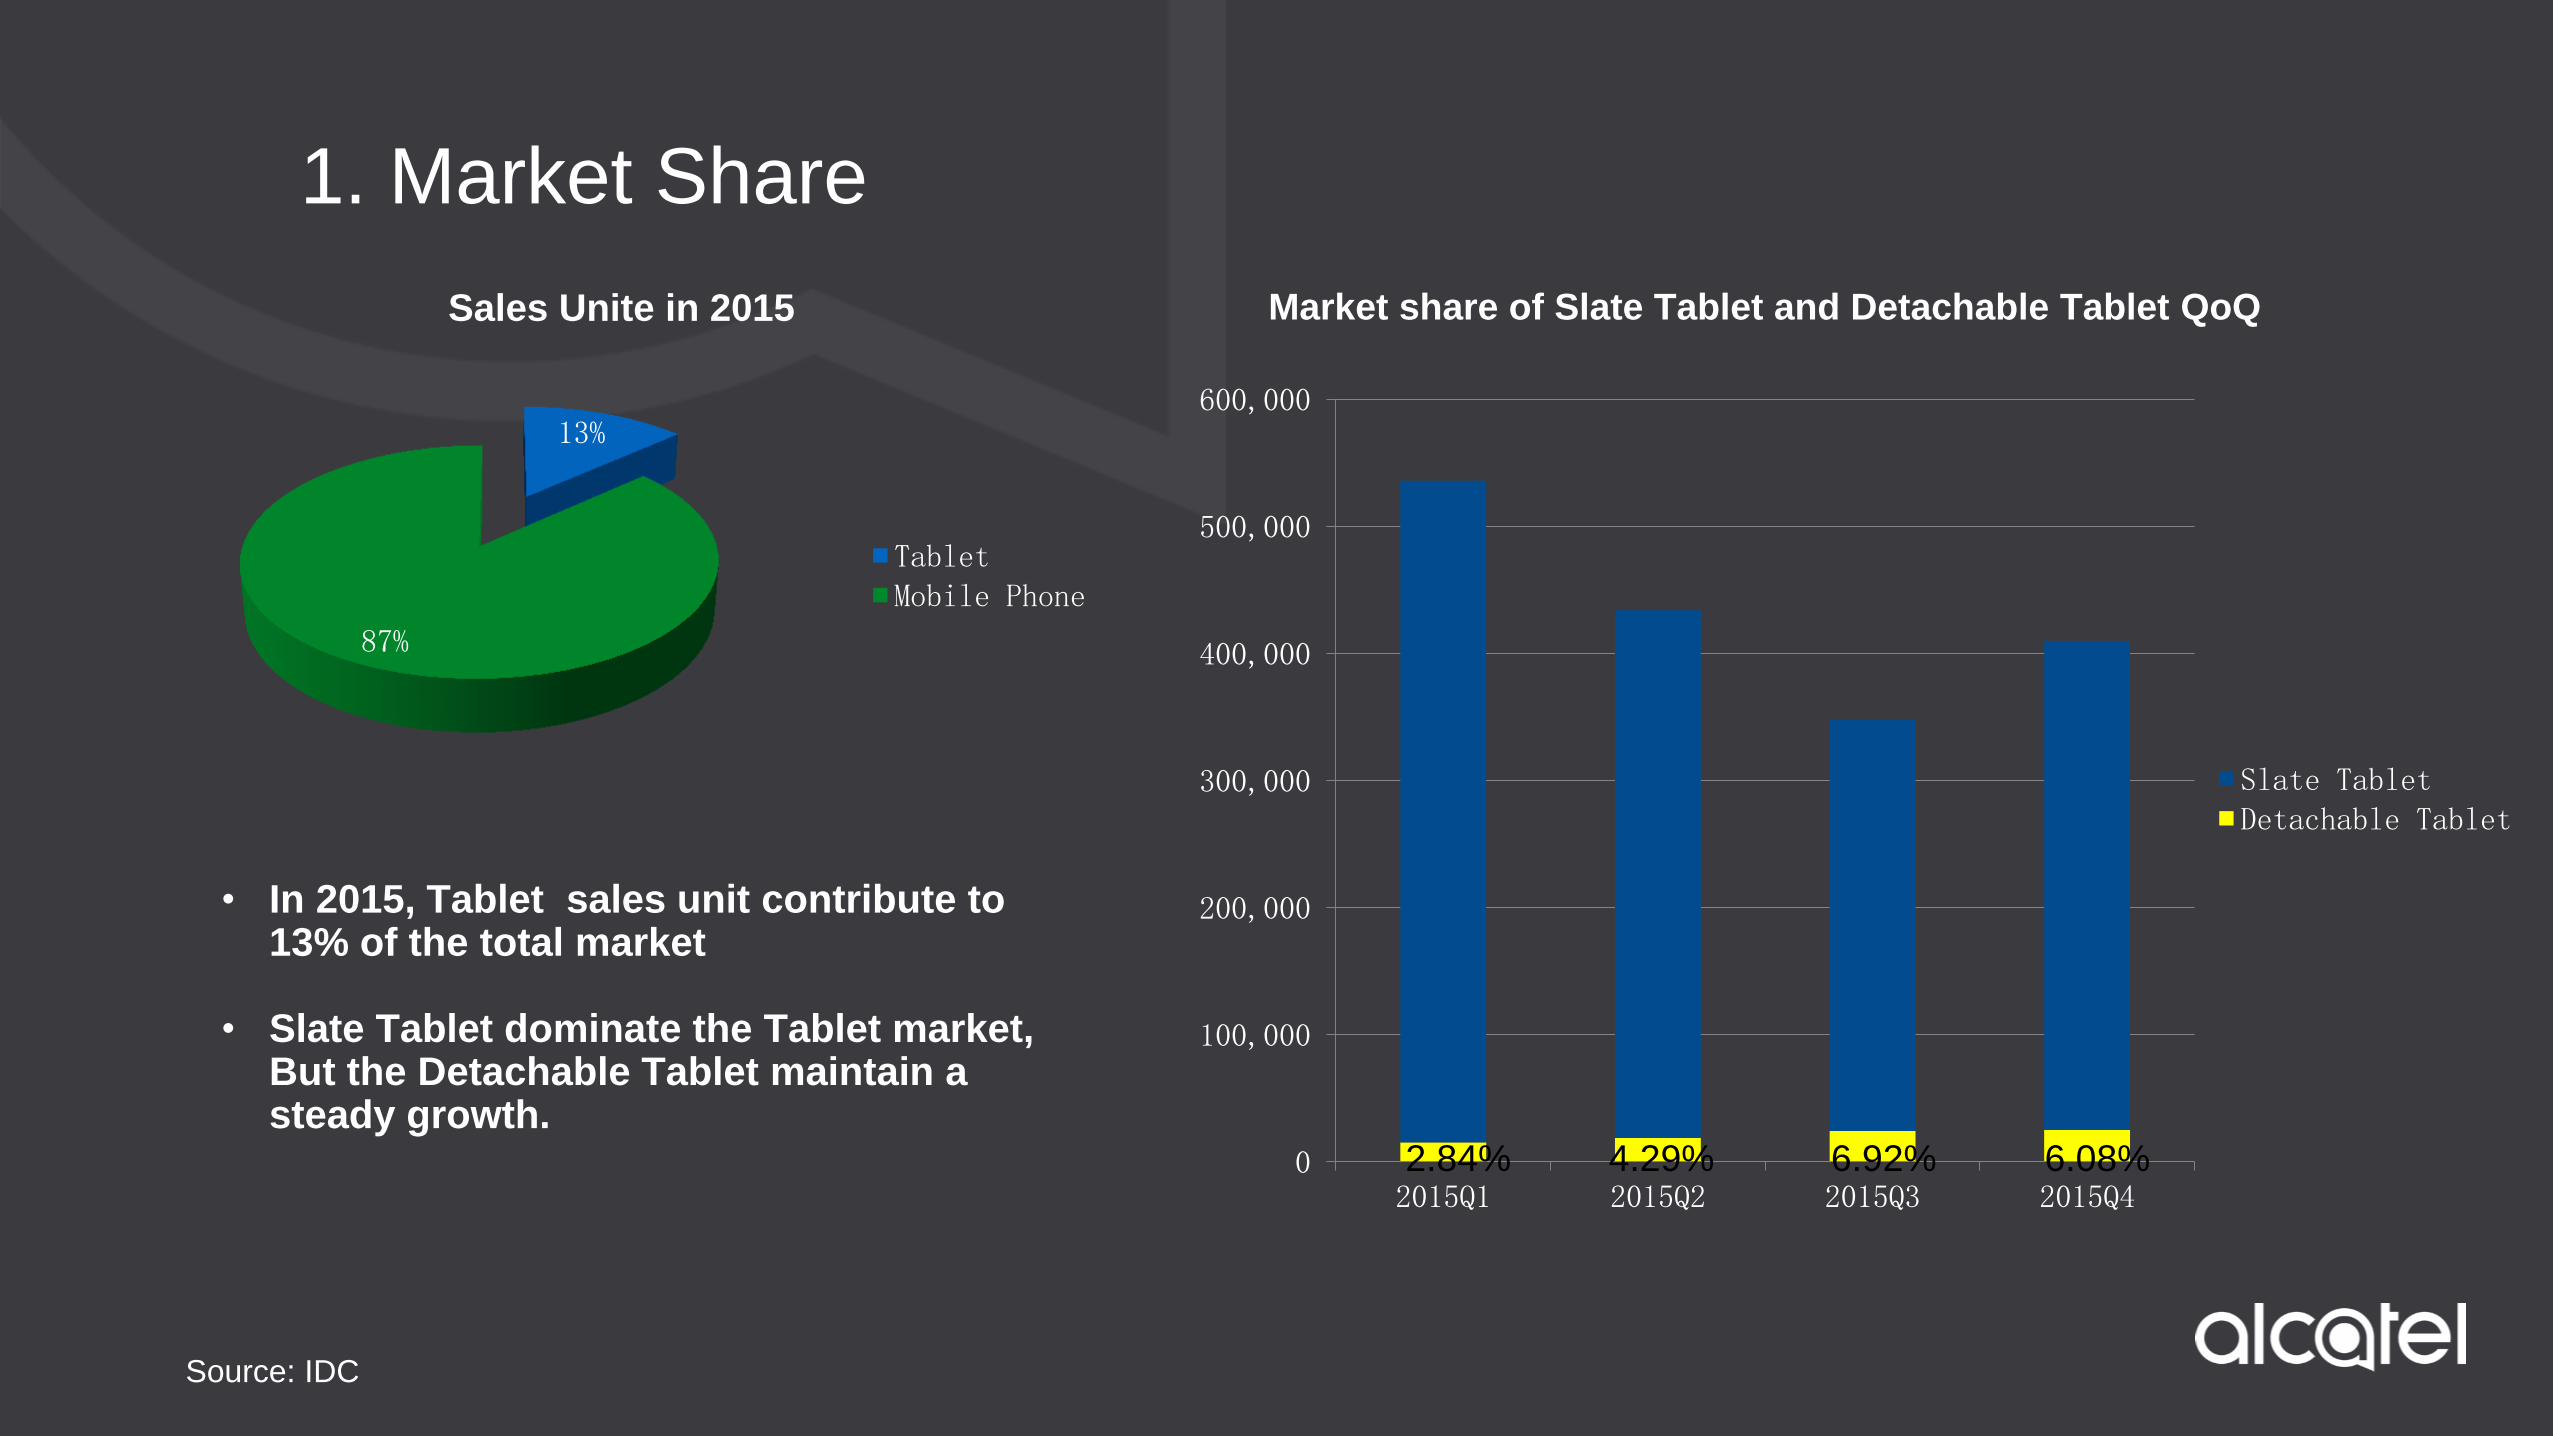
• In 2015, Tablet sales unit contribute to 13% of the total market
• Slate Tablet dominate the Tablet market, But the Detachable Tablet maintain a steady growth.
13%
87%
Sales Unite in 2015
TabletMobile Phone
0
100,000
200,000
300,000
400,000
500,000
600,000
2015Q1 2015Q2 2015Q3 2015Q4
Slate TabletDetachable Tablet
2.84% 4.29% 6.92% 6.08%
Market share of Slate Tablet and Detachable Tablet QoQ
2. Slate Tablet
Apple Apple
Apple Apple
Lenovo
Lenovo Lenovo Lenovo
Samsung Samsung
Samsung Samsung
0
0.2
0.4
0.6
0.8
1
1.2
2015Q1 2015Q2 2015Q3 2015Q4
XiaomiTeclastSonySamsungOthersLenovoJOIiProHuaweiHTCHP IncDellCubeASUSAppleAcer Group
Acer Group 2%
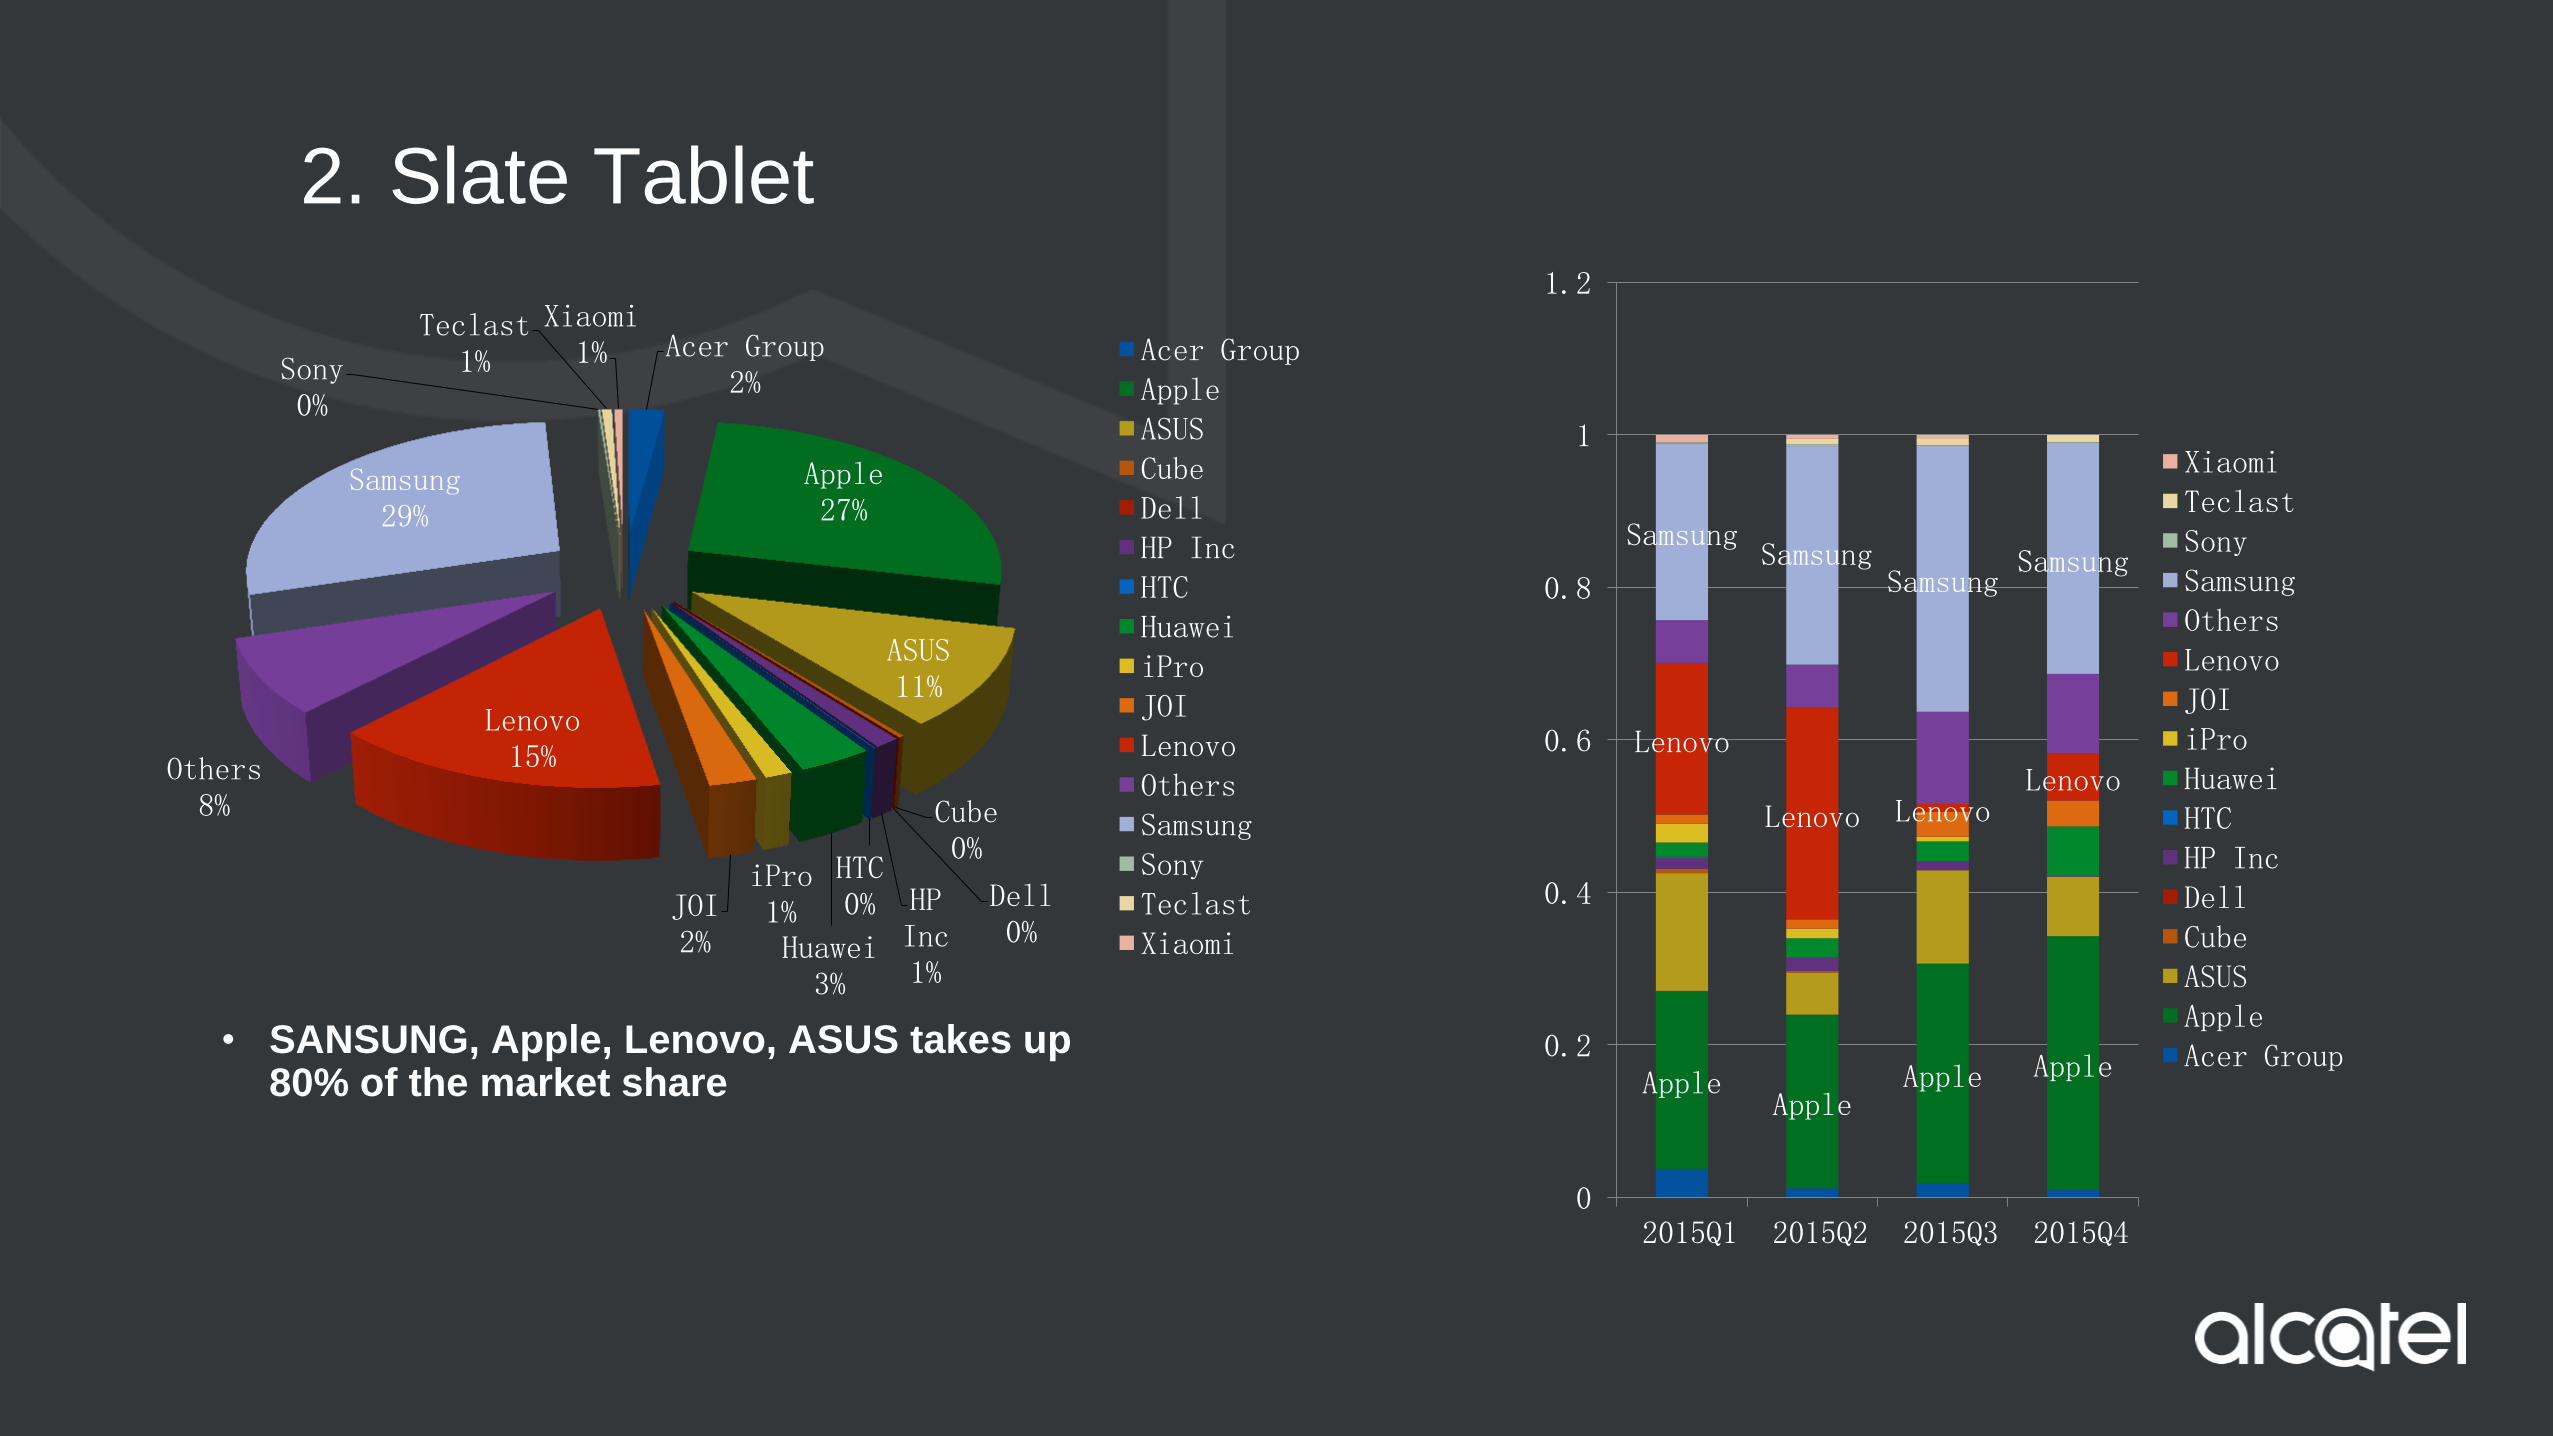
Apple 27%
ASUS 11%
Cube 0%
Dell 0%
HP Inc 1%
HTC 0%
Huawei 3%
iPro 1% JOI
2%
Lenovo 15% Others
8%
Samsung 29%
Sony 0%
Teclast 1%
Xiaomi 1% Acer Group
AppleASUSCubeDellHP IncHTCHuaweiiProJOILenovoOthersSamsungSonyTeclastXiaomi
• SANSUNG, Apple, Lenovo, ASUS takes up 80% of the market share
2. Slate Tablet
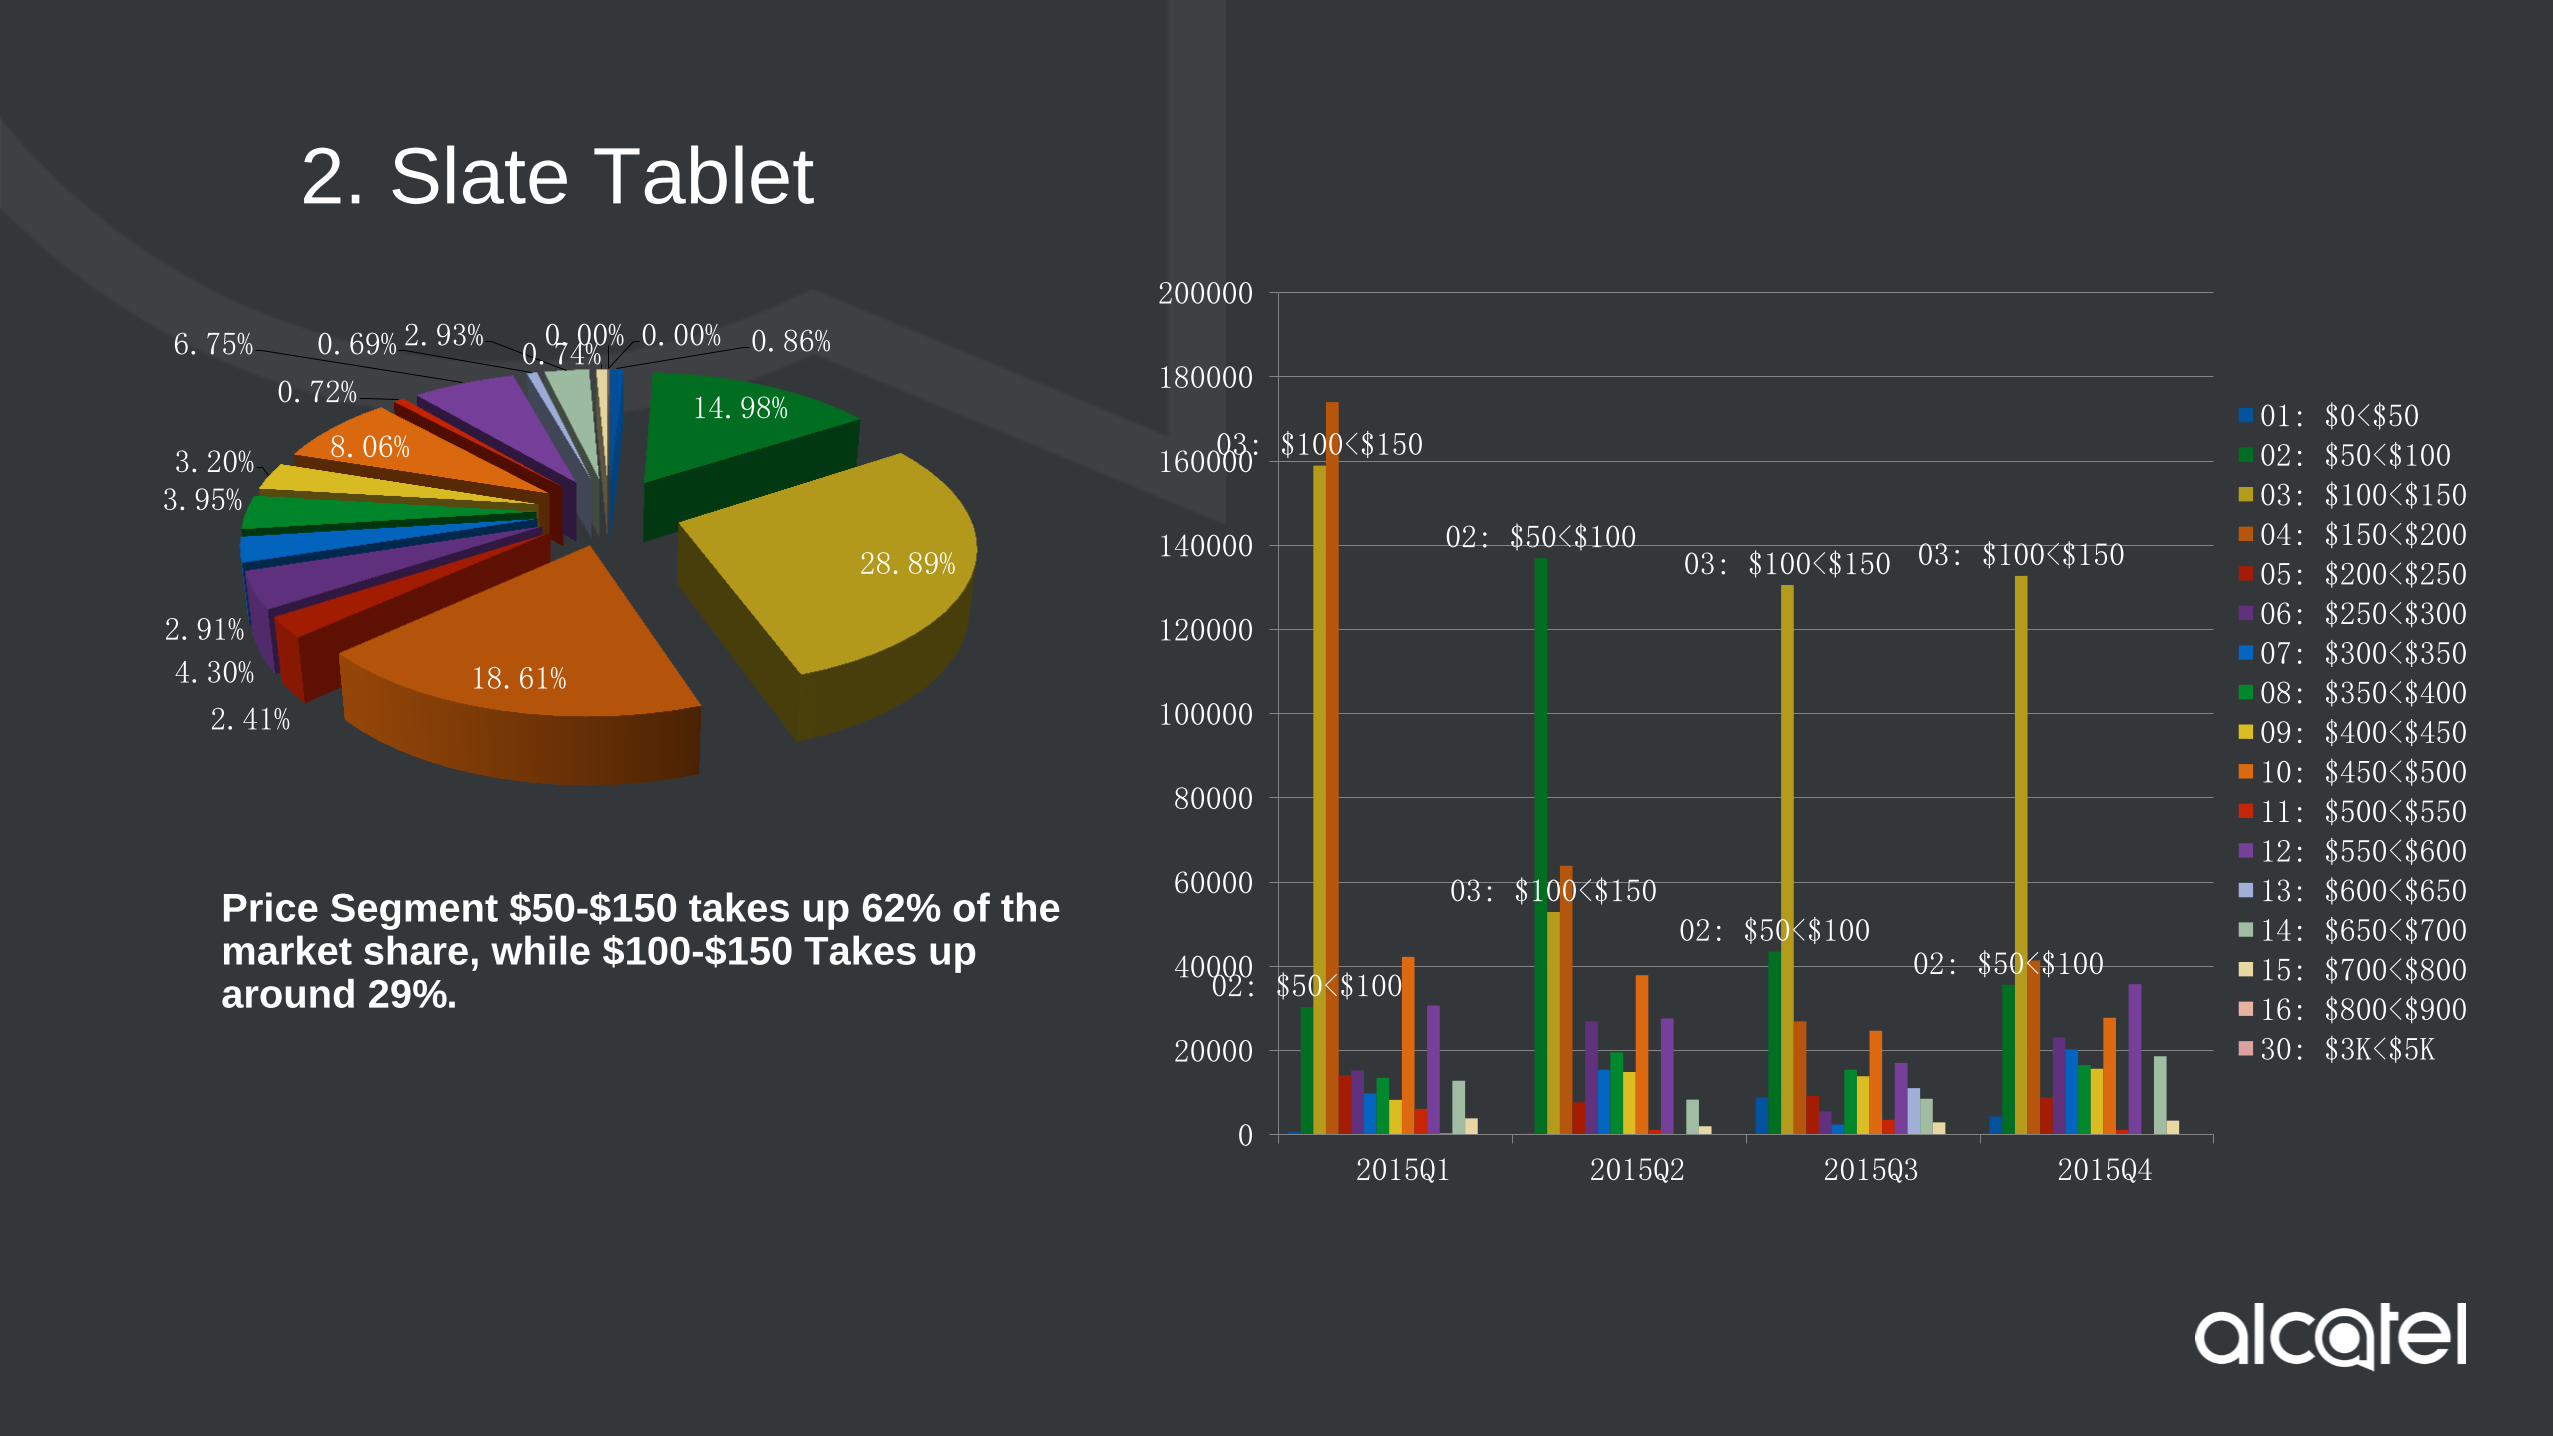
Price Segment $50-$150 takes up 62% of the market share, while $100-$150 Takes up around 29%.
0.86%
14.98%
28.89%
18.61%
2.41%
4.30%
2.91%
3.95% 3.20% 8.06%
0.72%
6.75% 0.69% 2.93% 0.74% 0.00% 0.00%
02: $50<$100
02: $50<$100
02: $50<$100 02: $50<$100
03: $100<$150
03: $100<$150
03: $100<$150 03: $100<$150
0
20000
40000
60000
80000
100000
120000
140000
160000
180000
200000
2015Q1 2015Q2 2015Q3 2015Q4
01: $0<$5002: $50<$10003: $100<$15004: $150<$20005: $200<$25006: $250<$30007: $300<$35008: $350<$40009: $400<$45010: $450<$50011: $500<$55012: $550<$60013: $600<$65014: $650<$70015: $700<$80016: $800<$90030: $3K<$5K
2. Slate Tablet- Conclusion
Source: IDC
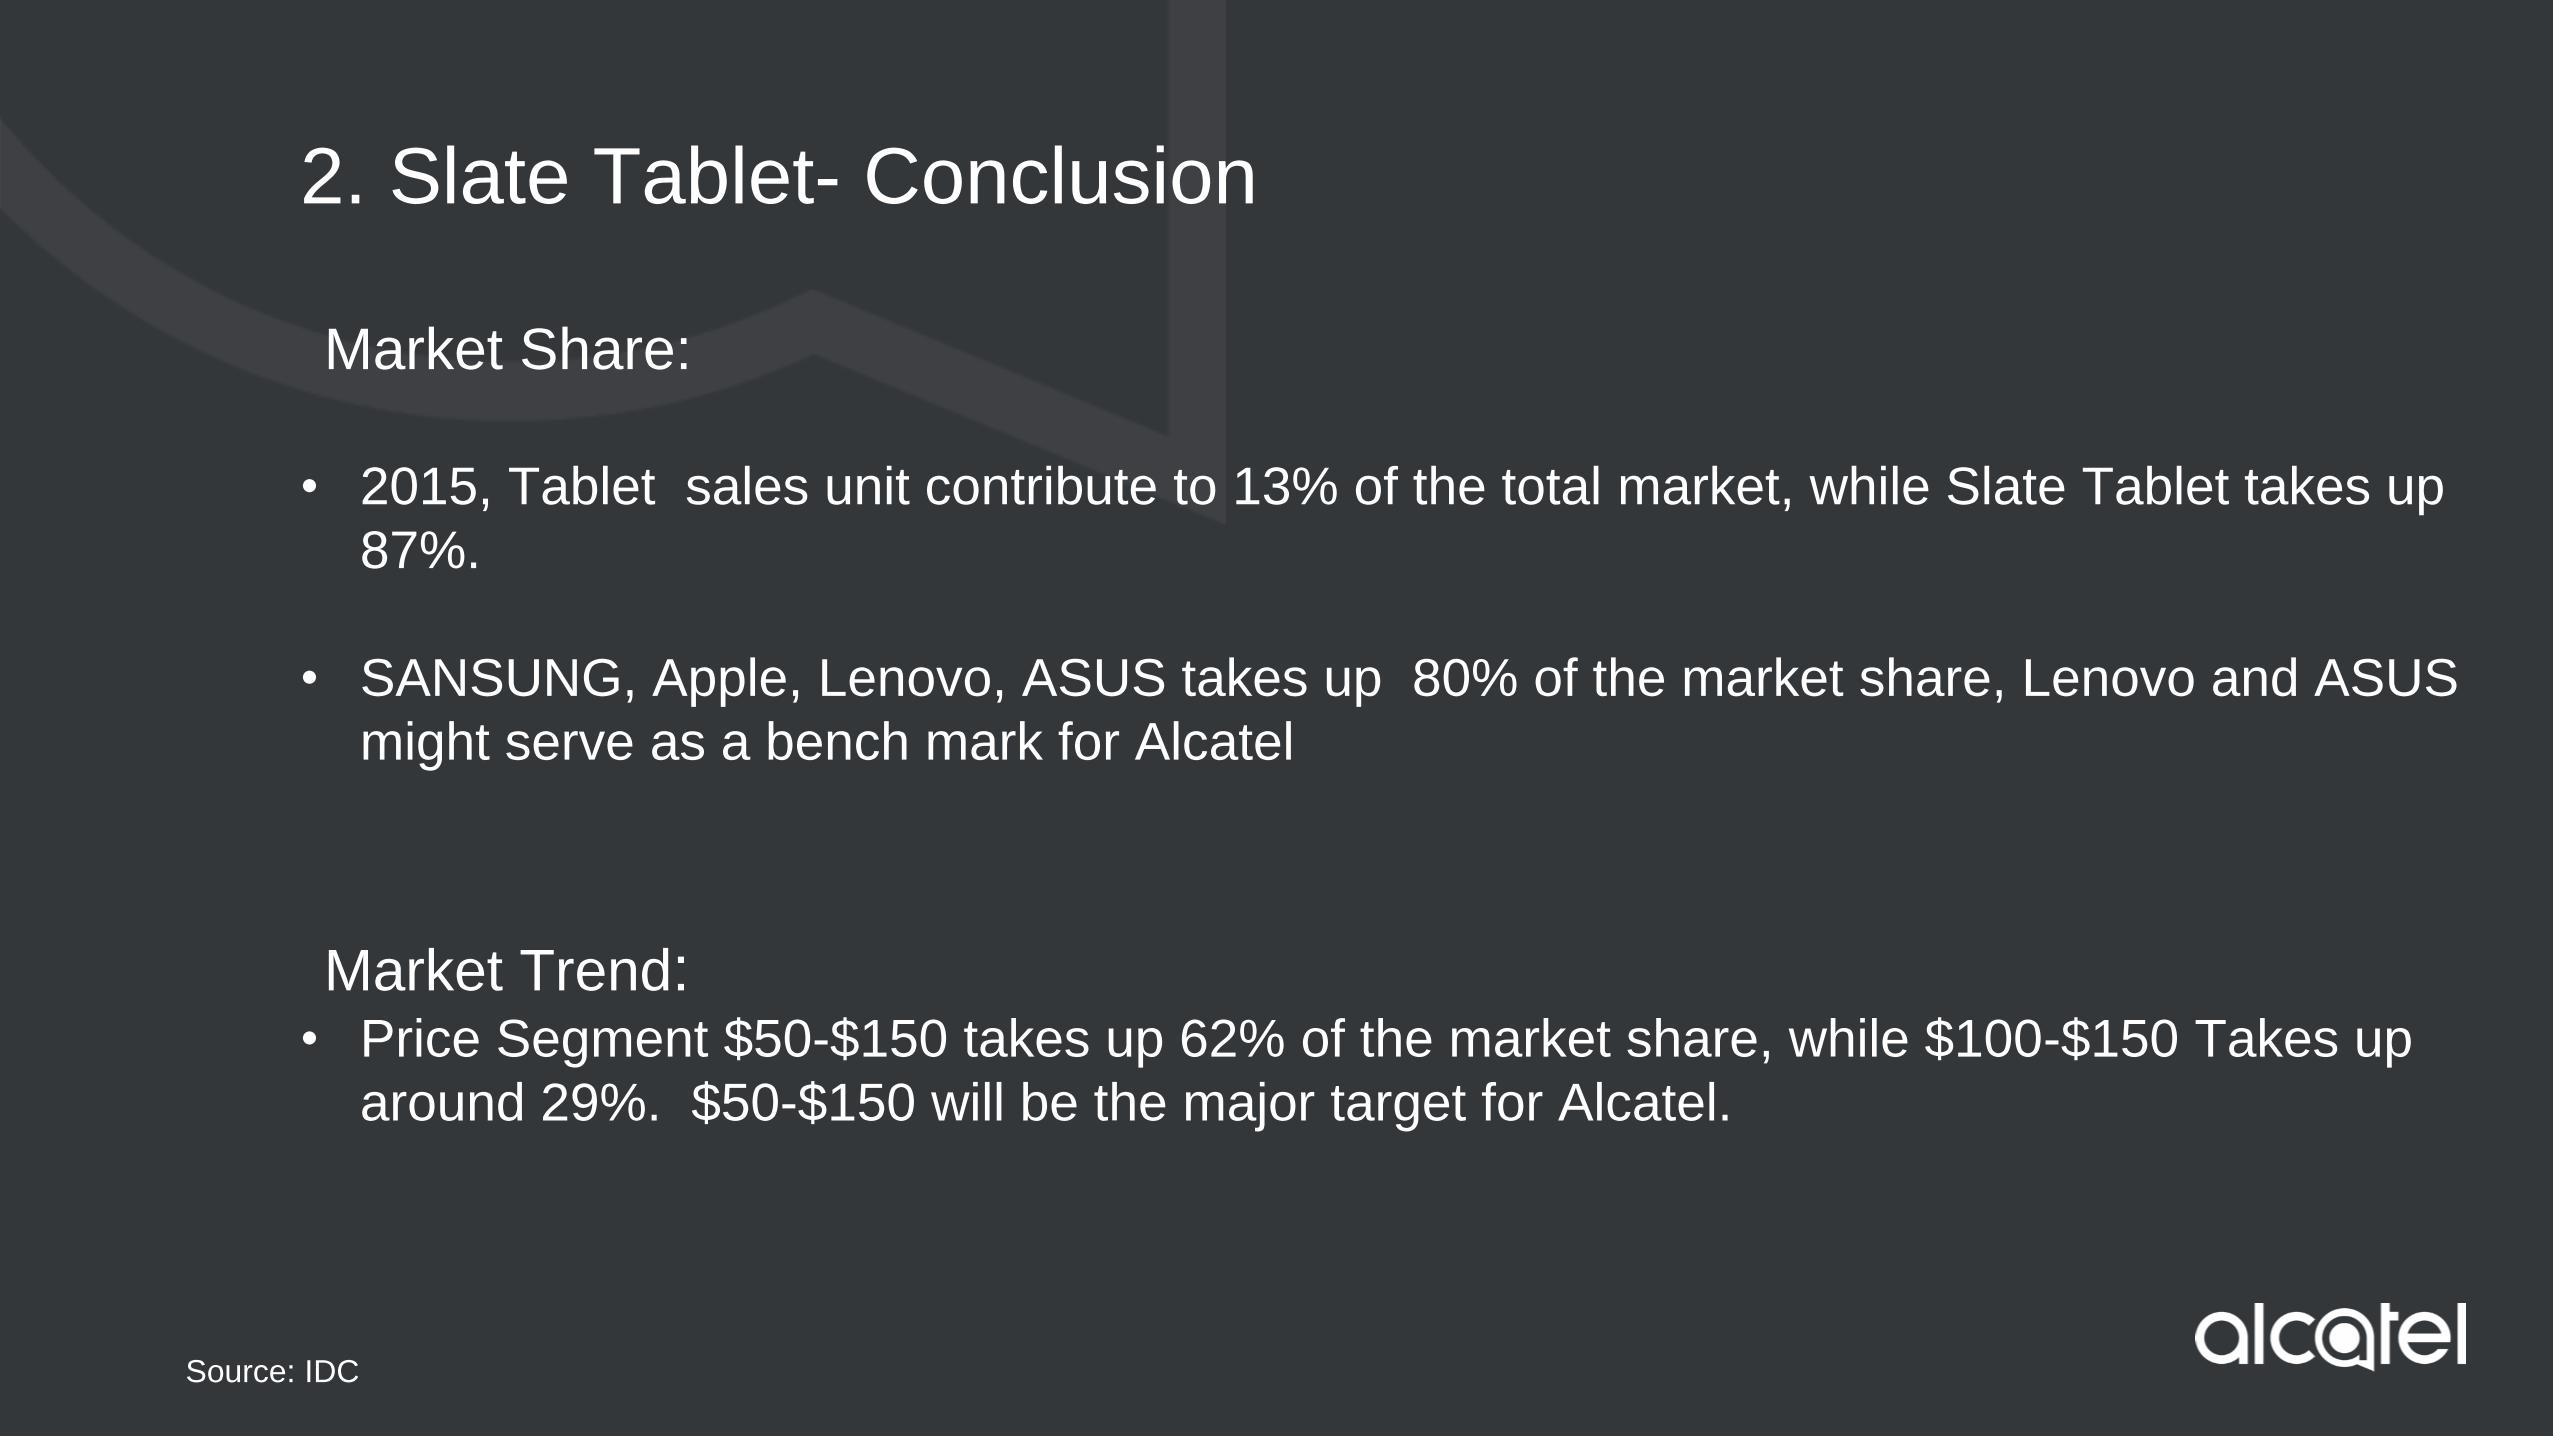
Market Share:
• 2015, Tablet sales unit contribute to 13% of the total market, while Slate Tablet takes up
87%.
• SANSUNG, Apple, Lenovo, ASUS takes up 80% of the market share, Lenovo and ASUS
might serve as a bench mark for Alcatel
Market Trend: • Price Segment $50-$150 takes up 62% of the market share, while $100-$150 Takes up
around 29%. $50-$150 will be the major target for Alcatel.
Source: IDC
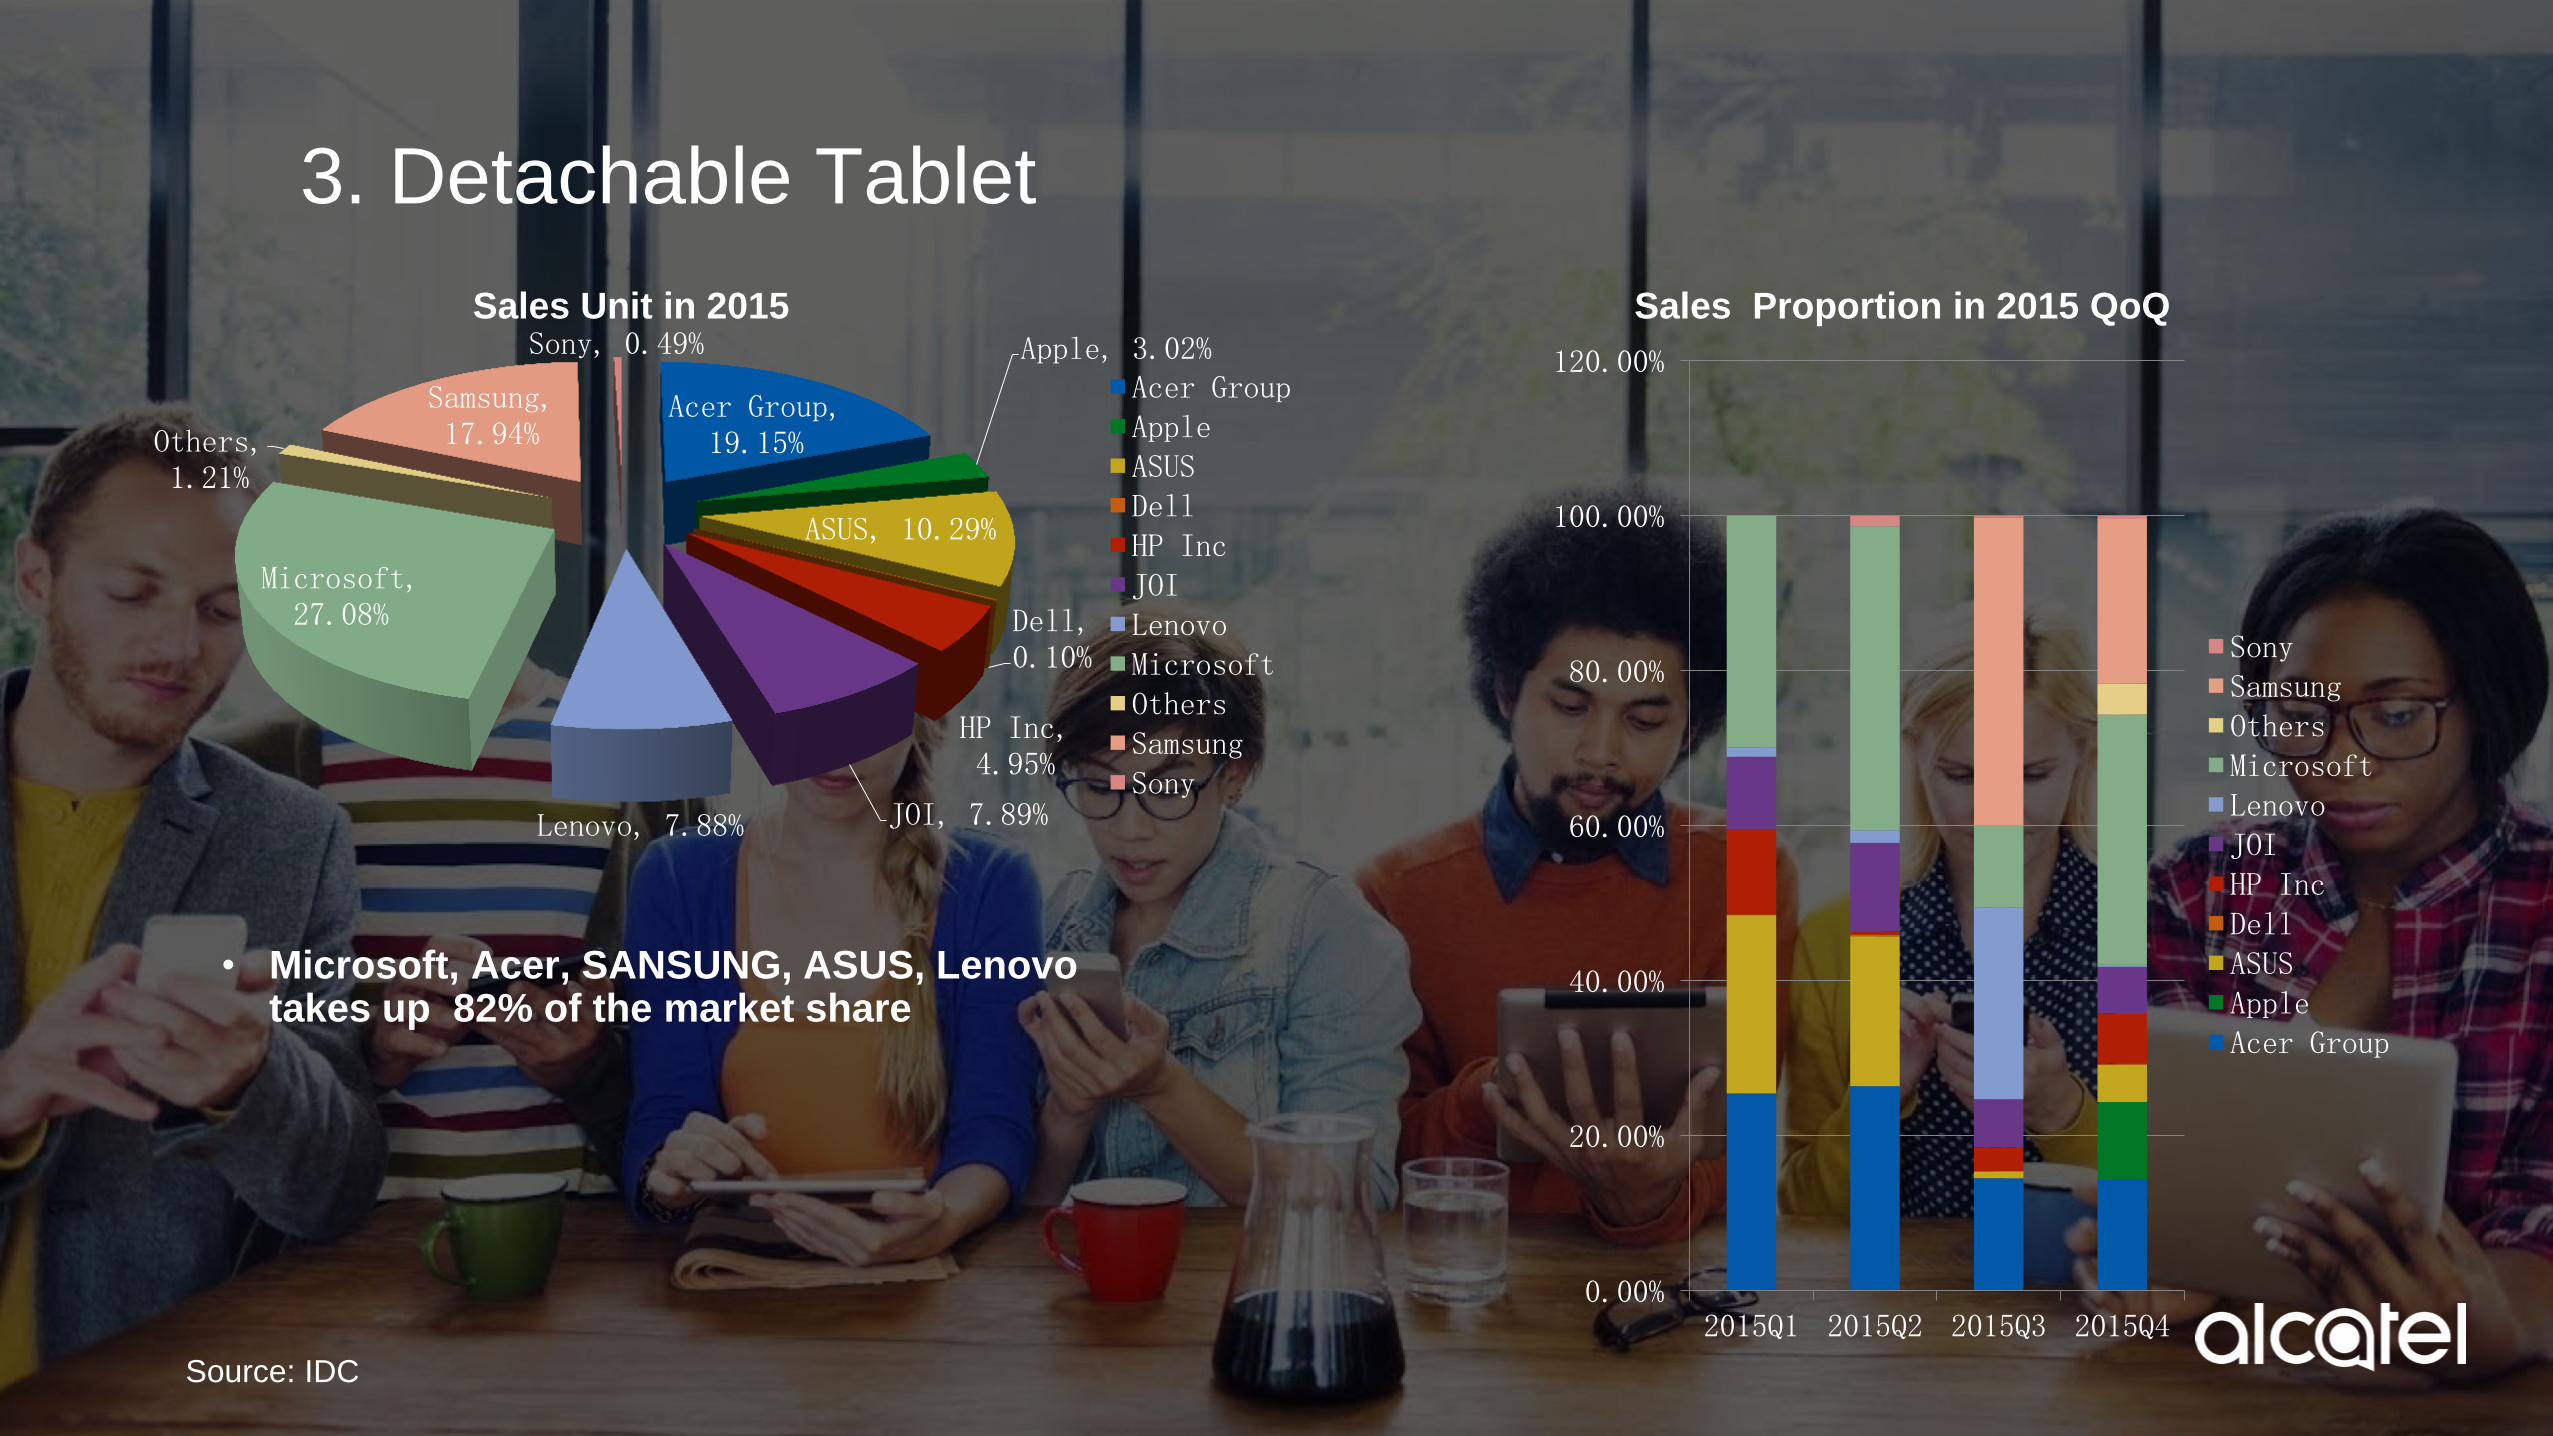
3. Detachable Tablet
Acer Group, 19.15%
Apple, 3.02%
ASUS, 10.29%
Dell, 0.10%
HP Inc, 4.95%
JOI, 7.89% Lenovo, 7.88%
Microsoft, 27.08%
Others, 1.21%
Samsung, 17.94%
Sony, 0.49%
Acer GroupAppleASUSDellHP IncJOILenovoMicrosoftOthersSamsungSony
Sales Unit in 2015
0.00%
20.00%
40.00%
60.00%
80.00%
100.00%
120.00%
2015Q1 2015Q2 2015Q3 2015Q4
SonySamsungOthersMicrosoftLenovoJOIHP IncDellASUSAppleAcer Group
Sales Proportion in 2015 QoQ
• Microsoft, Acer, SANSUNG, ASUS, Lenovo
takes up 82% of the market share
Source: IDC
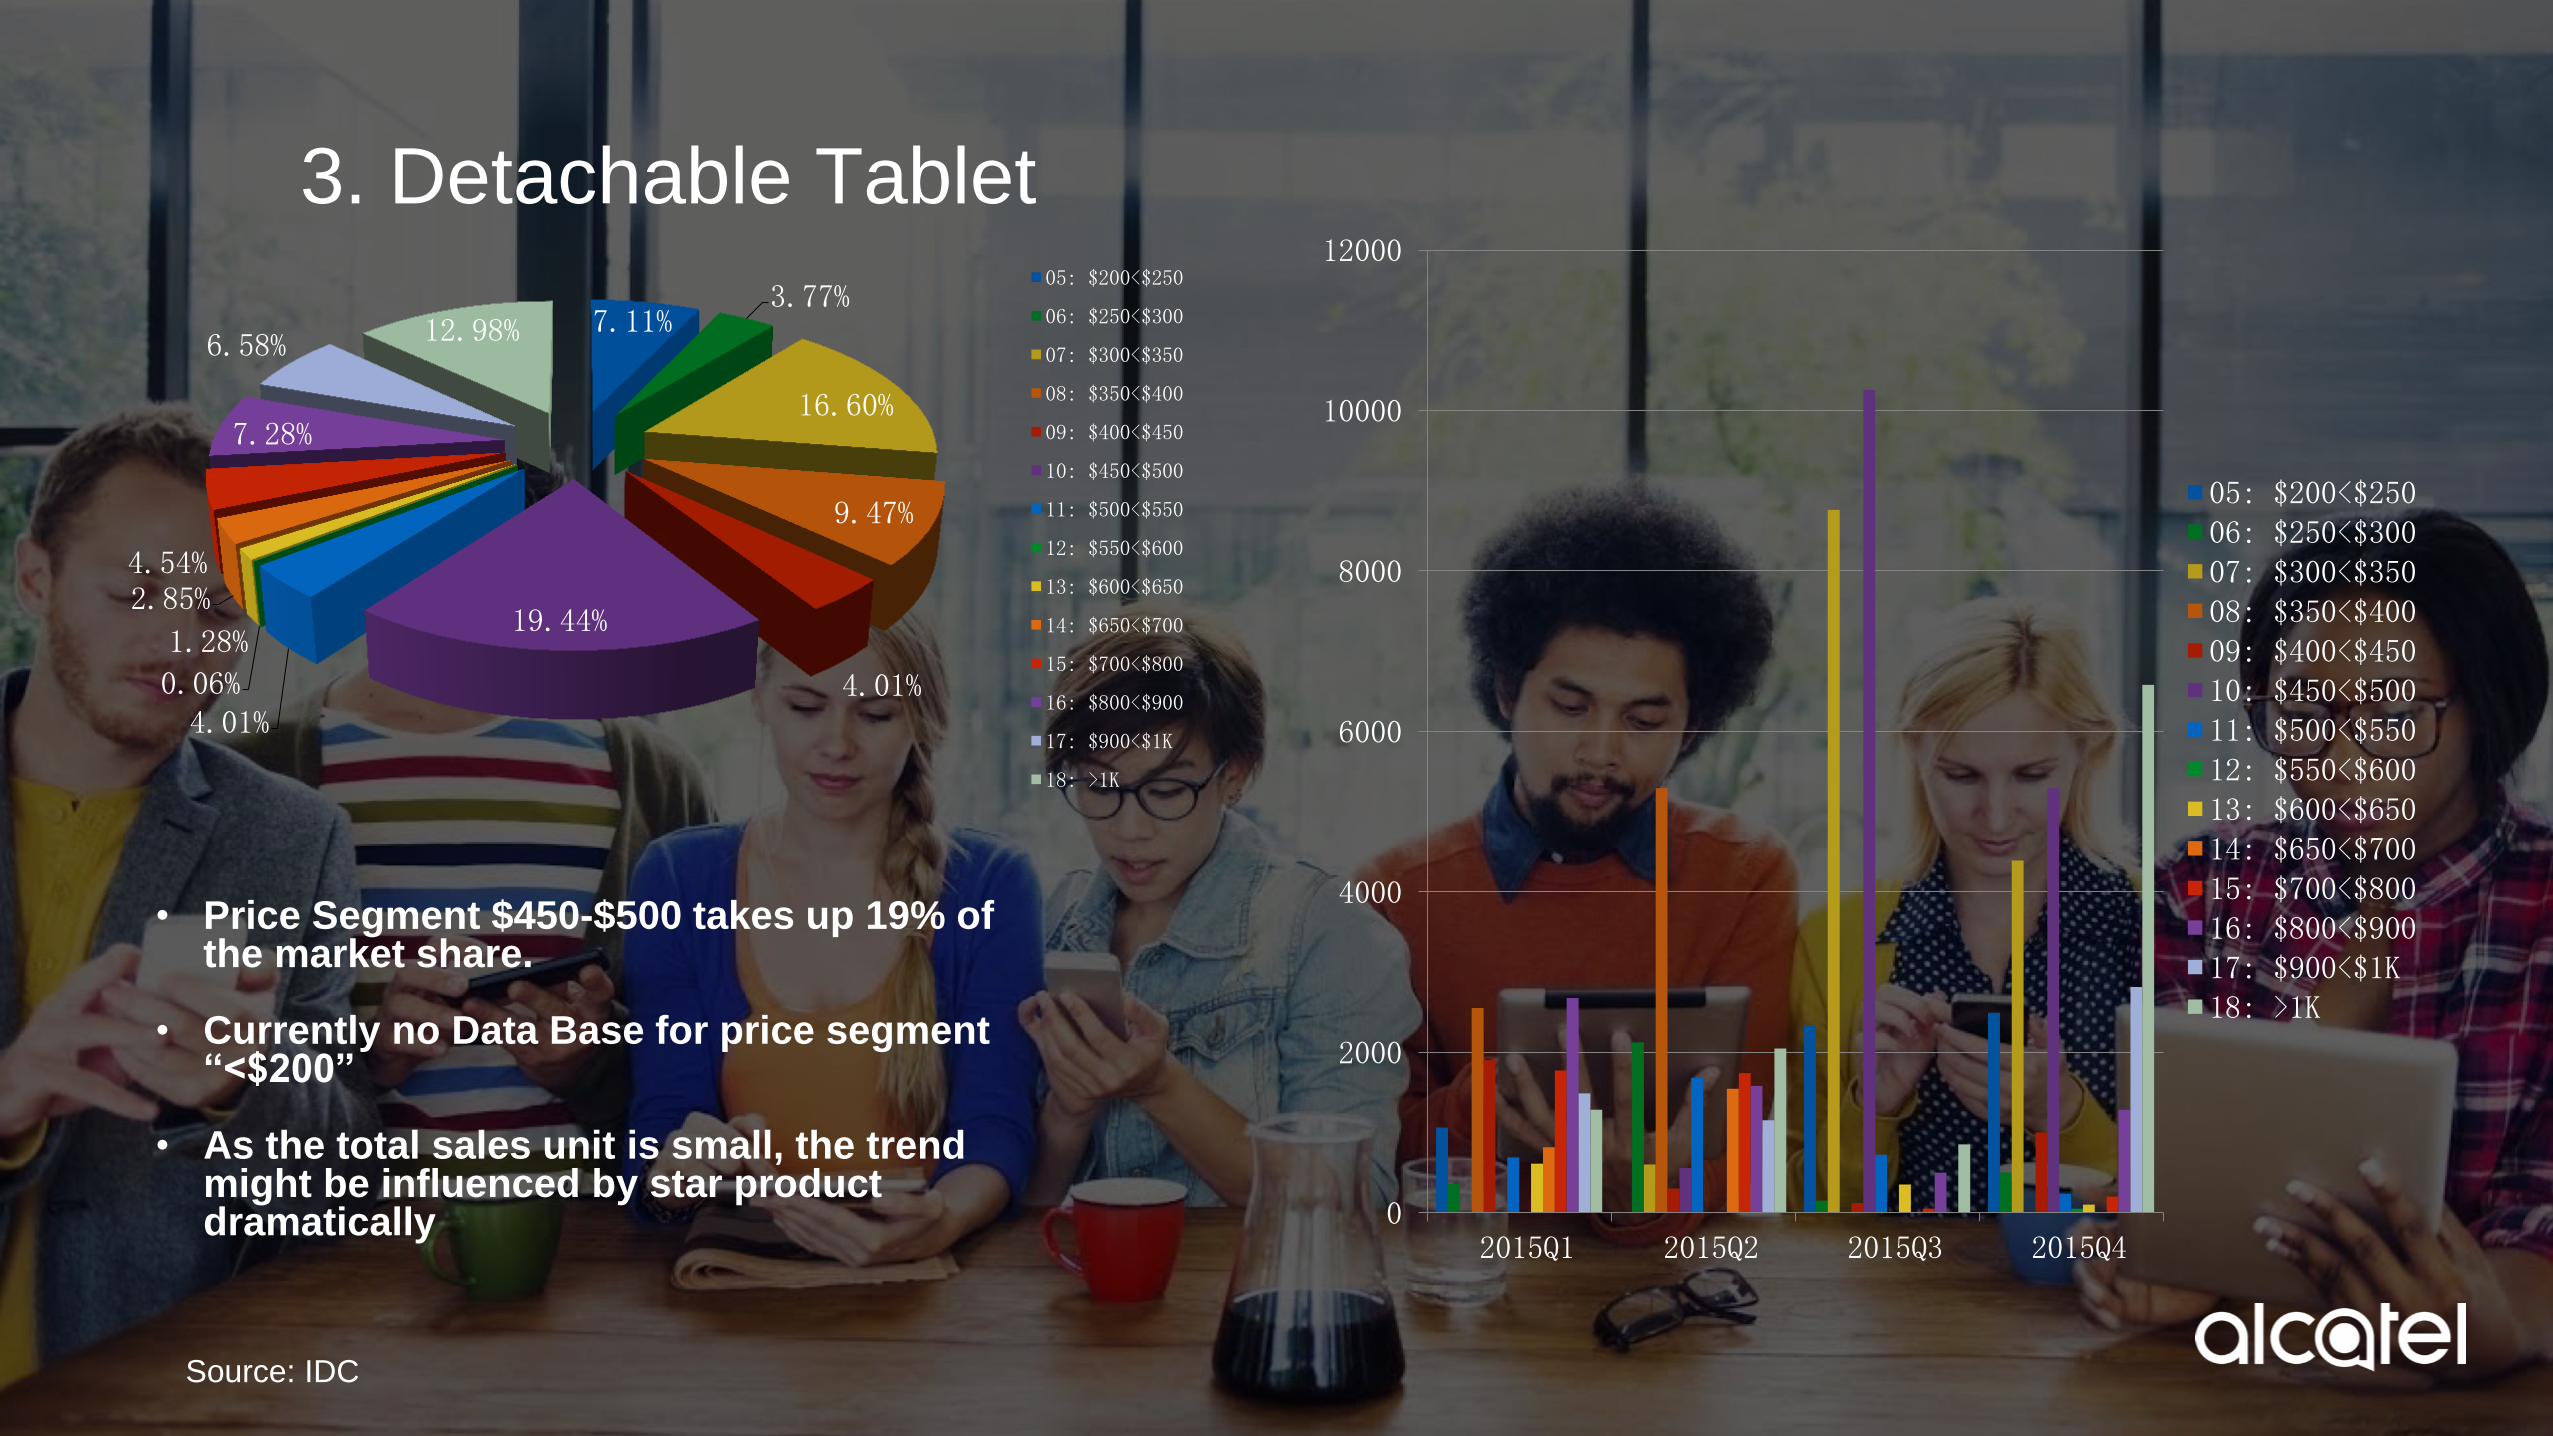
3. Detachable Tablet
• Price Segment $450-$500 takes up 19% of the market share.
• Currently no Data Base for price segment “<$200”
• As the total sales unit is small, the trend might be influenced by star product dramatically
7.11% 3.77%
16.60%
9.47%
4.01%
19.44%
4.01% 0.06%
1.28%
2.85% 4.54%
7.28%
6.58% 12.98%
05: $200<$250
06: $250<$300
07: $300<$350
08: $350<$400
09: $400<$450
10: $450<$500
11: $500<$550
12: $550<$600
13: $600<$650
14: $650<$700
15: $700<$800
16: $800<$900
17: $900<$1K
18: >1K
0
2000
4000
6000
8000
10000
12000
2015Q1 2015Q2 2015Q3 2015Q4
05: $200<$25006: $250<$30007: $300<$35008: $350<$40009: $400<$45010: $450<$50011: $500<$55012: $550<$60013: $600<$65014: $650<$70015: $700<$80016: $800<$90017: $900<$1K18: >1K
3. Detachable Tablet- Conclusion
Market Share: • Slate Tablet dominate the Tablet market, But the Detachable Tablet maintain a steady
growth. Microsoft, Acer, SANSUNG, ASUS, Lenovo takes up 82% of the Detachable
Tablet market share. Lenovo might serve as the bench mark for Alcatel.
• Microsoft, Acer, SANSUNG, ASUS, Lenovo takes up 82% of the market share
Market Share: • Currently no Data Base for price segment “<$200”
• As the total sales unit is small, the trend might be influenced by star product
dramatically

End