OPERATIONAL CARBON FOOTPRINT OF LIGHT RAIL … 23 No.1 2015/operational_carbon... · GREATER...
26
OPERATIONAL CARBON FOOTPRINT OF LIGHT RAIL TRANSIT SERVICE IN THE GREATER KL/KLANG VALLEY METROPOLIS Chen Sau Soon, Muhammad Zuhayr Dzul Haimi and Anuar Nordin Environmental Technology Research Centre, SIRIM Berhad, No. 1, Persiaran Dato’ Menteri, Seksyen 2, 40700 Shah Alam, Selangor, Malaysia ([email protected]) RINGKASAN: Sektor pengangkutan merupakan salah satu punca utama gas rumah hijau (ghg) untuk kebanyakkan negara, termasuk Malaysia. Perkhidmatan pengangkutan rel semakin diterima sebagai kaedah pengangkutan yang dapat menyumbang ke arah ekonomi karbon rendah. Perkhidmatan transit aliran ringan (LRT) mula diperkenalkan di Malaysia melalui Laluan Kelana Jaya yang telah menjadi kaedah utama berulang-alik di Kuala Lumpur/Lembah Klang sejak mula beroperasi pada tahun 1998. Aliran Kelana Jaya telah digunakan sebagai kajian kes untuk menentu jejak karbon (CFP) bagi perkhidmatan LRT. Fungsi LRT telah ditakrifkan sebagai penyediaan pengangkutan berbumbung dengan menggunakan 2-gerabak atau 4-gerabak untuk membawa penumpang di sepanjang landasan kereta api yang tertentu. Unit fungsi CFP pula diukur dari segi impak yang berkaitan dengan setiap penumpang bagi setiap km untuk sempadan sistem produk yang meliputi seluruh kitar hayat perkhidmatan LRT. Berdasarkan jangka panjang hayat sesuatu gerabak adalah 30 tahun serta penggunaan data sekunder untuk menghitung penggunaan elektrik, profil ghg bagi fasa pengeluaran dan fasa penggunaan adalah 2,645 g CO2equiv dan 388,601 g CO2equiv masing-masing. Secara keseluruhan, sumber terbesar pelepasan ghg untuk CFP perkhidmatan LRT adalah elektrik untuk perejangan dan pengudaraan gerabak yang menyumbangkan sebanyak 99 % daripada profil kitar hayat ghg. Jejak karbon bagi pengangkutan LRT berdasarkan Aliran Kelana Jaya telah dikira sebagai 0.091 g CO2equiv /penumpang.km dengan merujuk kepada bilangan penumpang tahun 2011. ABSTRACT: The transport sector is one of the major sources of greenhouse gas of many countries, including Malaysia. Rail transit service is increasingly accepted as the mode of mobility that contributes towards a low carbon economy. Malaysia introduced the light rail transit (LRT) service beginning with the Kelana Jaya Line which has become the primary means of commuting in Greater KL/Klang Valley since its operation in 1998. The Kelana Jaya Line was used as the case study to establish the carbon footprint (CFP) of the LRT service. The function of the LRT was defined as providing fully covered transportation using 2-cars or 4-cars trains for commuting passengers along the specific track line. The functional unit of the CFP is measured as per passenger per km for a product system boundary covering cradle to grave descriptions. Based entirely on secondary data for electricity consumption, the ghg profiles for production phase and use phase of a rolling stock or car-train of 30 years life-span are 2,645 g CO2equiv and 388,601 g CO2equiv, respectively. Overall, the largest source of ghg emission for the CFP of LRT service is electricity for propulsion and ventilation of the rolling stock accounting for more than 99% of the life cycle ghg profile. The CFP of LRT transportation based on the Kelana Jaya line was calculated as 0.091 g CO2equiv /passenger.km based on the ridership of year 2011. Keywords: Light rail transit, carbon footprint, greenhouse gas, Greater KL/Klang Valley
Transcript of OPERATIONAL CARBON FOOTPRINT OF LIGHT RAIL … 23 No.1 2015/operational_carbon... · GREATER...
OPERATIONAL CARBON FOOTPRINT OF LIGHT RAIL TRANSIT SERVICE IN THE
GREATER KL/KLANG VALLEY METROPOLIS
Chen Sau Soon, Muhammad Zuhayr Dzul Haimi and Anuar Nordin
Environmental Technology Research Centre, SIRIM Berhad, No. 1, Persiaran Dato’ Menteri, Seksyen 2,
40700 Shah Alam, Selangor, Malaysia
RINGKASAN: Sektor pengangkutan merupakan salah satu punca utama gas rumah hijau (ghg) untuk
kebanyakkan negara, termasuk Malaysia. Perkhidmatan pengangkutan rel semakin diterima sebagai kaedah
pengangkutan yang dapat menyumbang ke arah ekonomi karbon rendah. Perkhidmatan transit aliran ringan
(LRT) mula diperkenalkan di Malaysia melalui Laluan Kelana Jaya yang telah menjadi kaedah utama
berulang-alik di Kuala Lumpur/Lembah Klang sejak mula beroperasi pada tahun 1998.
Aliran Kelana Jaya telah digunakan sebagai kajian kes untuk menentu jejak karbon (CFP) bagi
perkhidmatan LRT. Fungsi LRT telah ditakrifkan sebagai penyediaan pengangkutan berbumbung dengan
menggunakan 2-gerabak atau 4-gerabak untuk membawa penumpang di sepanjang landasan kereta api yang
tertentu. Unit fungsi CFP pula diukur dari segi impak yang berkaitan dengan setiap penumpang bagi setiap
km untuk sempadan sistem produk yang meliputi seluruh kitar hayat perkhidmatan LRT.
Berdasarkan jangka panjang hayat sesuatu gerabak adalah 30 tahun serta penggunaan data sekunder untuk
menghitung penggunaan elektrik, profil ghg bagi fasa pengeluaran dan fasa penggunaan adalah 2,645 g
CO2equiv dan 388,601 g CO2equiv masing-masing. Secara keseluruhan, sumber terbesar pelepasan ghg untuk
CFP perkhidmatan LRT adalah elektrik untuk perejangan dan pengudaraan gerabak yang menyumbangkan
sebanyak 99 % daripada profil kitar hayat ghg. Jejak karbon bagi pengangkutan LRT berdasarkan Aliran
Kelana Jaya telah dikira sebagai 0.091 g CO2equiv /penumpang.km dengan merujuk kepada bilangan
penumpang tahun 2011.
ABSTRACT: The transport sector is one of the major sources of greenhouse gas of many countries,
including Malaysia. Rail transit service is increasingly accepted as the mode of mobility that contributes
towards a low carbon economy. Malaysia introduced the light rail transit (LRT) service beginning with the
Kelana Jaya Line which has become the primary means of commuting in Greater KL/Klang Valley since
its operation in 1998.
The Kelana Jaya Line was used as the case study to establish the carbon footprint (CFP) of the LRT service.
The function of the LRT was defined as providing fully covered transportation using 2-cars or 4-cars trains
for commuting passengers along the specific track line. The functional unit of the CFP is measured as per
passenger per km for a product system boundary covering cradle to grave descriptions.
Based entirely on secondary data for electricity consumption, the ghg profiles for production phase and use
phase of a rolling stock or car-train of 30 years life-span are 2,645 g CO2equiv and 388,601 g CO2equiv,
respectively. Overall, the largest source of ghg emission for the CFP of LRT service is electricity for
propulsion and ventilation of the rolling stock accounting for more than 99% of the life cycle ghg profile.
The CFP of LRT transportation based on the Kelana Jaya line was calculated as 0.091 g CO2equiv
/passenger.km based on the ridership of year 2011.
Keywords: Light rail transit, carbon footprint, greenhouse gas, Greater KL/Klang Valley
INTRODUCTION
Climate change is one of the major challenges of the 21st century affecting almost every strata of society in
both the developed and developing economies in diverse forms ranging from extreme weather to new
diseases to increase in natural disasters. There is also increasing acceptance that climate change is the result
of excessive emission of greenhouse gas (ghg) from anthropogenic activities. As a result, climate change is
now regarded as an environmental responsibility of the entire society, including governments, industries
and individual consumers.
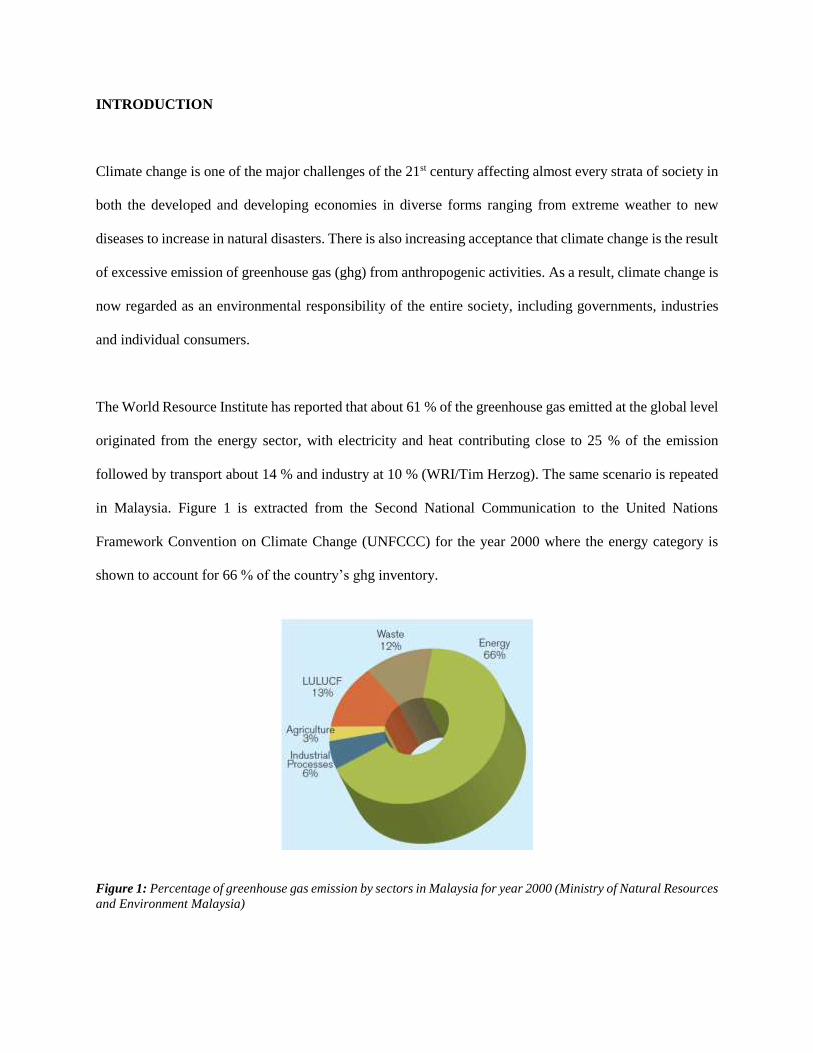
The World Resource Institute has reported that about 61 % of the greenhouse gas emitted at the global level
originated from the energy sector, with electricity and heat contributing close to 25 % of the emission
followed by transport about 14 % and industry at 10 % (WRI/Tim Herzog). The same scenario is repeated
in Malaysia. Figure 1 is extracted from the Second National Communication to the United Nations
Framework Convention on Climate Change (UNFCCC) for the year 2000 where the energy category is
shown to account for 66 % of the country’s ghg inventory.
Figure 1: Percentage of greenhouse gas emission by sectors in Malaysia for year 2000 (Ministry of Natural Resources
and Environment Malaysia)
The Energy category cover energy industries such as electricity generation, oil and gas exploration and
processing, transport, manufacturing, construction, residential and commercial, agriculture and others. As
in the global scenario, the energy industries and transport both account for the highest ghg emission.
In Malaysia, our electricity is produced from the combustion of fossil fuels consisting of about 95% natural
gas and coal. From a life cycle perspective, ghg emission that occurs at the power plants has to be accounted
for across all sectors that utilize electricity to power systems, equipment and processes. The transport sector
is among these sectors.
As at 31 December 2012, the total number of registered vehicles on Malaysian roads has surpassed 22.7
million units (Ministry of Transport,2011). Since 2003, the Government was already predicting there will
be rapid vehicle growth rate of 8 % per annum and had embarked on major developments in land transport
planned for a period of over 20 years (Mohamad, 2003). One of these developments has seen the
implementation of a new rail-based transport system like the Light Rail Transit (LRT). LRT can be defined
as an electric railway with a 'light volume' traffic capacity compared to heavy rail (APTA Glossary of
Transit Terminology, 1994).
The Kelana Jaya Line is a rapid transit system, which is one of the three rail transit lines in the Kuala
Lumpur Rail Transit System operated by RapidKL Rail network. RapidKL is a government-owned
company which was formed in 2004 as part of the restructuring of the public transport system in Kuala
Lumpur. The Kelana Jaya Line was formerly known as PUTRA LRT. "PUTRA" stands for Projek
Usahasama Transit Ringan Automatik Sdn. Bhd., the company which developed and operated it. Following
a restructuring of ownership and management, the line is currently owned by Syarikat Prasarana Negara
Berhad and operated by Rapid KL. The other rail transit is the Ampang Line and Monorail Line (railway-
technology.com).
These rail transit lines cut across the Greater KL/Klang Valley National Key Economic Area which has
been identified as the engine of nation’s economic growth in which 20 percent of the national population
contributing to 30 percent of the nation’s Gross National Income (GNI) resides (Ministry of Federal
Territories). To move its ranks up the liveability index, infrastructure such as ease of transportation within
an urban setting will be a priority.
It is generally accepted in the transportation sector that the rail industry delivers mobility that has lower
direct emission per passenger kilometer than many other transport modes, notably air and car travel thus
making rail travel an important role in the move towards a low carbon economy. Unlike the conventional
trains that run on diesel and coal (for trains from older generation), LRT trains runs on electricity. In
principle, an electric train should have a greener emission profile compared to those that run on fossil fuel.
However based on the life cycle approach of evaluating the ghg gas emission performance of a product or
service, the emissions at different stages of the life cycle of the LRT trains have to be accounted. This
cumulative amount of ghgs, expressed in kilogram CO2 equivalents (CO2equiv) released to the atmosphere,
represents the carbon footprint (CFP) for a product or service.
The objective of this study is to establish the operational CFP of the LRT service based on the life cycle
operational component of a LRT train using the Kelana Jaya Line rapid transit system as the case study.
The Kelana Jaya Line has become the primary means of commuting for the masses in Greater KL/Klang
Valley since its operation 15 years ago when it first entered service for the 1998 Commonwealth Games in
Kuala Lumpur. Based on the paper by Chester and Hovarth (2009) the ghg emission of infrastructure
construction and operation resulted in total energy requirements about twice that of the operation of the
rolling stocks. Hence it is important to clarify at the onset of the study that the carbon footprint that will be
calculated will only cover the operational component of the light rail transit service. In other words, only
the operational CFP will be determined.
The ghg value calculated in this study is not intended to be used for comparative claims between different
types of transport services. The result however can be used as guidance for potential improvement of this
mode of transport, and an interesting piece of environmental information for the commuters.
MATERIALS AND METHOD
Product Description
The product system of this study is the rolling stock of the LRT. The rolling stock (also refer to as ‘car’)
comprises all powered and unpowered vehicles that run on railway e.g. the locomotive or engine that
provides the motive power for the train, and the car trains. The rolling stock used in the LRT-Kelana Jaya
line is the INNOVIA ART 200 Advanced Rapid Transit (INNOVIA ART) train with related equipment and
services (Bombardier). Currently the LRT-Kelana Jaya line operates with 61 sets of car trains; 35 sets of
two-car trains and 26 sets of four-car trains at 2.37 minutes peak hour headway. The INNOVIA ART travels
along a 29 km rail length which stops at 24 stations, of which 5 stations are located underground. The trains
operate at an average speed of 60 km/h (railway-technology.com).
The INNOVIA ART 200 trains utilise two linear induction motors per rolling stock and draws power from
a third rail located at the side of the steel rails. Power is provided through 14 sub-stations with 750 V DC
supplied to a live third rail (Hirahara, 2012). Each motor consists of a rated power of 160 kW that provides
adhesion-independent transmission of acceleration and brake forces through plating located in between the
running rails (Vollenwyder, 2005). The reaction plate is semi-magnetized, which pulls the train along as
well as helps it to slow down. The third rail supplies direct current electricity through a semi-conductor
rigid conductor placed alongside of the railway track. Each individual rolling stock of the INNOVIA ART
comes with two built-in air conditioning units of 13.2 kW cooling capacity. The INNOVIA ART is
essentially driverless and is automated to travel along lines and stop at designated stations for a limited
amount of time. A manual override control panels are provided at each end of the trains for use in an event
of an emergency.
The product system of this case study covers the cradle to grave stages in the life cycle of a rolling stock
operating in the Kelana Jaya ART for a thirty-year life span.
Function of Product System
The rolling stock of the Kelana Jaya ART transport passengers between stations in the Kelana Jaya Line,
which consists of a single line from Kelana Jaya to Gombak that primarily serves the Petaling Jaya region
to the south; southwest and central Kuala Lumpur, and Kuala Lumpur City Centre to the centre; and also
various low density residential areas further north in Kuala Lumpur spanning a distance of 29 km rail track.
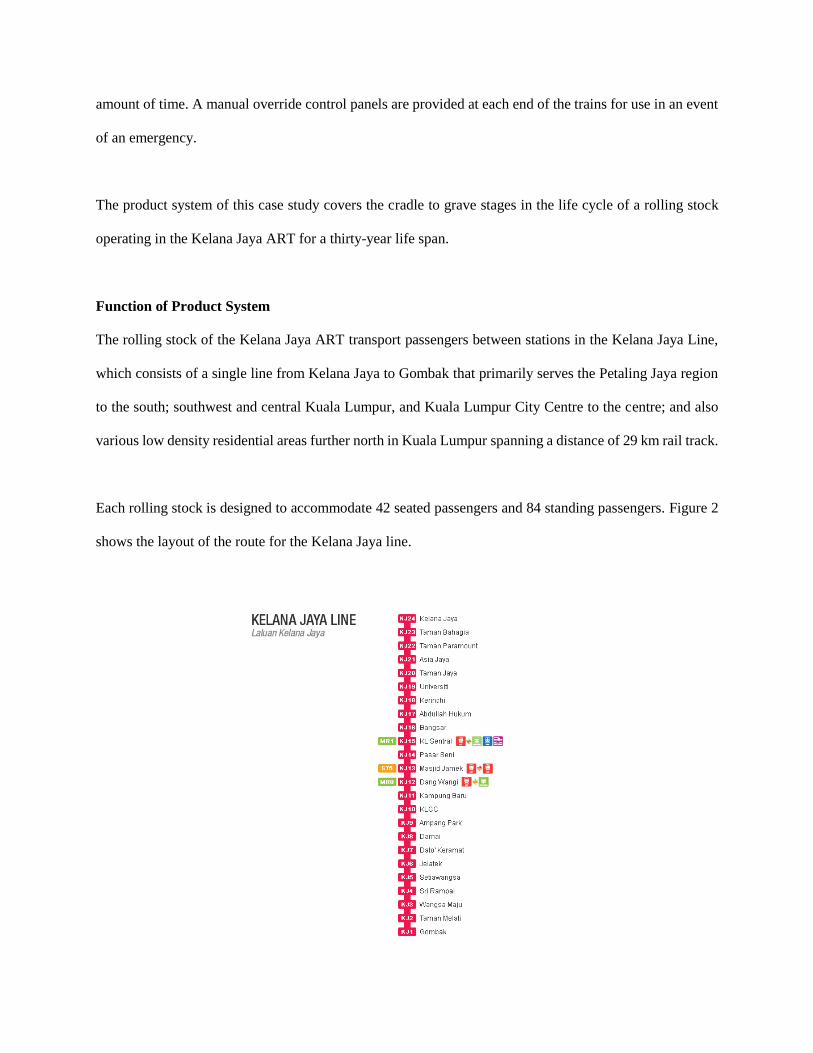
Each rolling stock is designed to accommodate 42 seated passengers and 84 standing passengers. Figure 2
shows the layout of the route for the Kelana Jaya line.
Figure 2: LRT routes for the Kelana Jaya Line (MYrapid)
Functional Unit
A functional unit is the quantified performance of a product system for use as a reference unit (ISO
14040:2006). The functional unit (FU) chosen for this study will enable the comparability of results related
to the function of transporting passengers over a known distance. The rolling stock of specific capacity is
also described as a ‘transporter’ or ‘car’. The FU has been worded as “A fully covered air-conditioned
transporter or car for commuting a single passenger per km”. The operational CFP value is calculated as kg
CO2equiv/ passenger.km commuting in a fully covered air-conditioned transporter of the LRT.
System boundary
The system boundary adopted to establish the CFP of LRT service in Malaysia covers the cradle-to-grave
stages of a fully covered air-conditioned transporter of sufficient capacity to commute 126 passengers along
the Kelana Jaya LRT line. In this “cradle-to-grave” approach, the upstream processes (production of the
vehicle) were considered alongside with the core processes of the use stage (transportation and maintenance
of the vehicle and electrical usage). The dismantling and recycling of the vehicle is also taken into count as
the downstream processes of the life cycle.
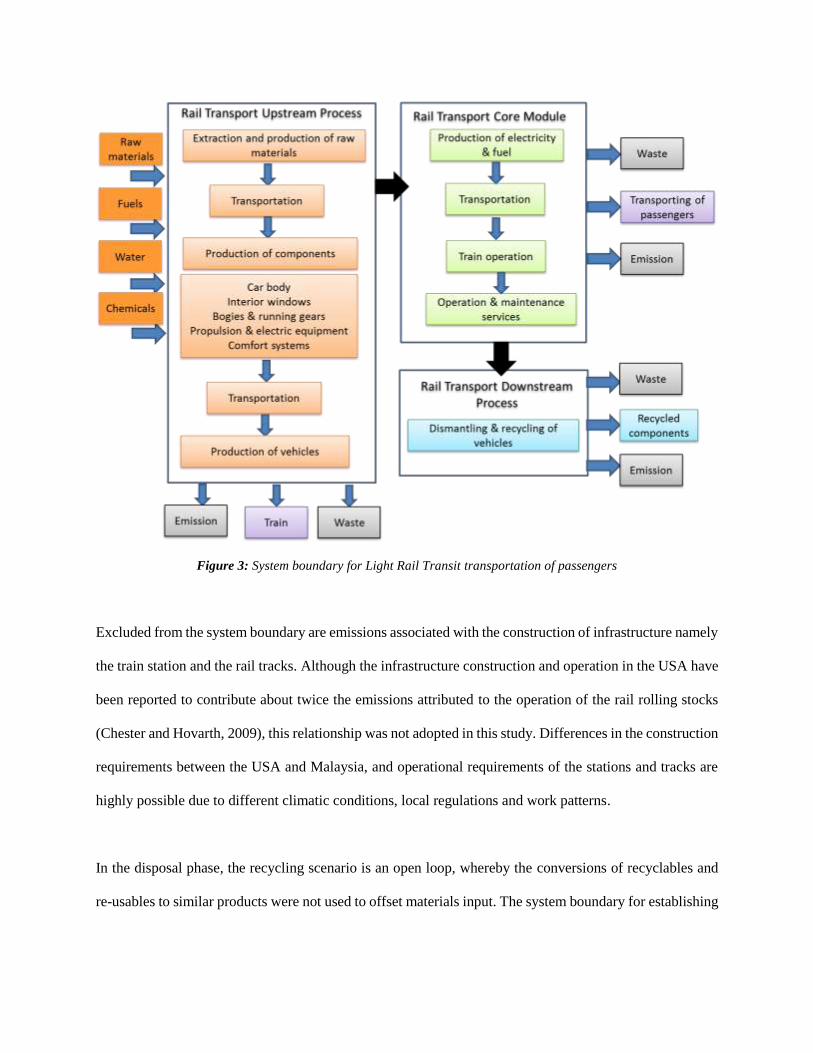
Figure 3: System boundary for Light Rail Transit transportation of passengers
Excluded from the system boundary are emissions associated with the construction of infrastructure namely
the train station and the rail tracks. Although the infrastructure construction and operation in the USA have
been reported to contribute about twice the emissions attributed to the operation of the rail rolling stocks
(Chester and Hovarth, 2009), this relationship was not adopted in this study. Differences in the construction
requirements between the USA and Malaysia, and operational requirements of the stations and tracks are
highly possible due to different climatic conditions, local regulations and work patterns.
In the disposal phase, the recycling scenario is an open loop, whereby the conversions of recyclables and
re-usables to similar products were not used to offset materials input. The system boundary for establishing
the ghg emission or CFP for commuting a fixed number of passengers in a transporter over its entire life
cycle is summarized in Figure 3.
Cut-off criteria
The cut off criteria is applied to determine which input can be excluded from the study in calculating the
CFP. The utilities requirement during production of the rolling stock (production phase) and the disposal
rate of about 4 % of the body weight (Bombardier INNOVIA ART 200) have been excluded in this study as
their contributions would have been insignificant when spread over the time frame of the use phase of 30
years.
Data input
The background data associated with production and potential recyclability/recoverability at end-of-life of
the rolling stock were adapted from Bombardier INNOVIA ART 200 Environmental Product Declaration
(EPD) for a 2-car train (Bombardier INNOVIA ART 200). Other background data such as emission factors
associated with the production of raw materials and utilities namely electricity was obtained from various
databases, primarily from MYLCID Database (SIRIM, 2010). The foreground data of energy consumption
was also extracted from the said EPD. In the use phase, the annual number of passengers commuting the
Kelana Jaya LRT line was taken from the Transport Statistics of Malaysia (Ministry of Transport, 2011)
while the train frequency was extracted from MYRapid website.
The use phase of the LRT service, in particular the commuting pattern was modelled based on statistics
reported for passengers recorded for the year and the frequency of train service at the starting point of the
Kelana Jaya Line i.e. Kelana Jaya station.
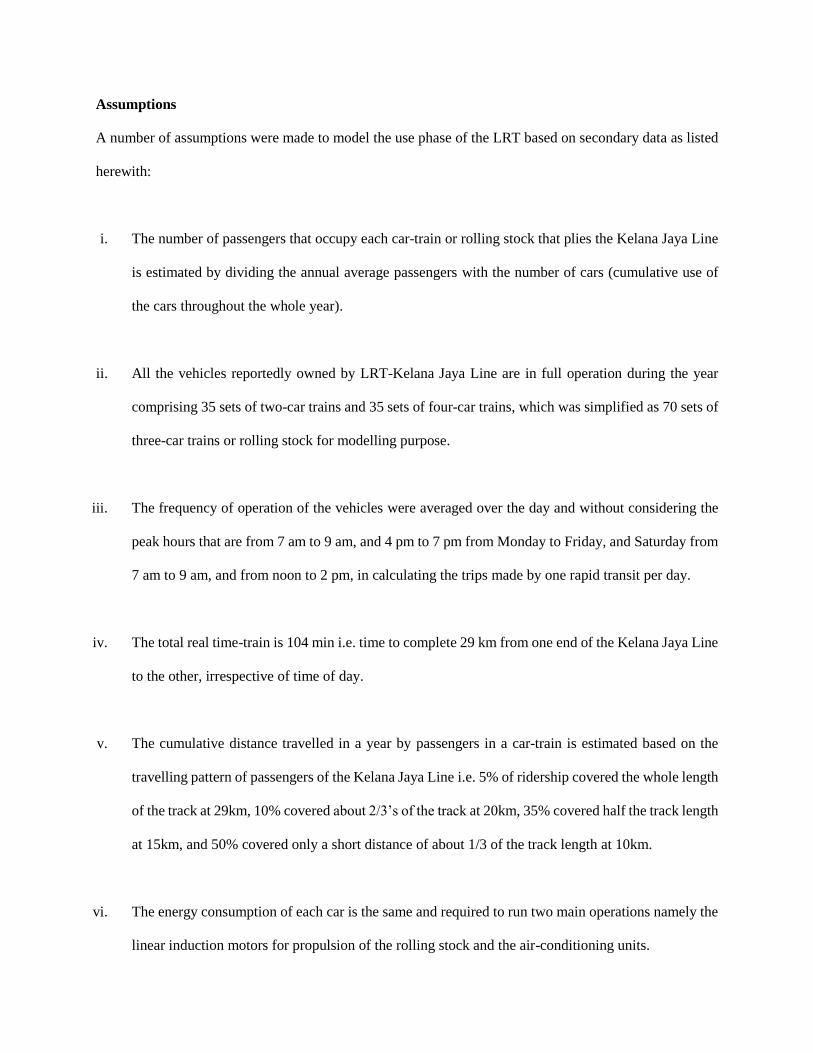
Assumptions
A number of assumptions were made to model the use phase of the LRT based on secondary data as listed
herewith:
i. The number of passengers that occupy each car-train or rolling stock that plies the Kelana Jaya Line
is estimated by dividing the annual average passengers with the number of cars (cumulative use of
the cars throughout the whole year).
ii. All the vehicles reportedly owned by LRT-Kelana Jaya Line are in full operation during the year
comprising 35 sets of two-car trains and 35 sets of four-car trains, which was simplified as 70 sets of
three-car trains or rolling stock for modelling purpose.
iii. The frequency of operation of the vehicles were averaged over the day and without considering the
peak hours that are from 7 am to 9 am, and 4 pm to 7 pm from Monday to Friday, and Saturday from
7 am to 9 am, and from noon to 2 pm, in calculating the trips made by one rapid transit per day.
iv. The total real time-train is 104 min i.e. time to complete 29 km from one end of the Kelana Jaya Line
to the other, irrespective of time of day.
v. The cumulative distance travelled in a year by passengers in a car-train is estimated based on the
travelling pattern of passengers of the Kelana Jaya Line i.e. 5% of ridership covered the whole length
of the track at 29km, 10% covered about 2/3’s of the track at 20km, 35% covered half the track length
at 15km, and 50% covered only a short distance of about 1/3 of the track length at 10km.
vi. The energy consumption of each car is the same and required to run two main operations namely the
linear induction motors for propulsion of the rolling stock and the air-conditioning units.
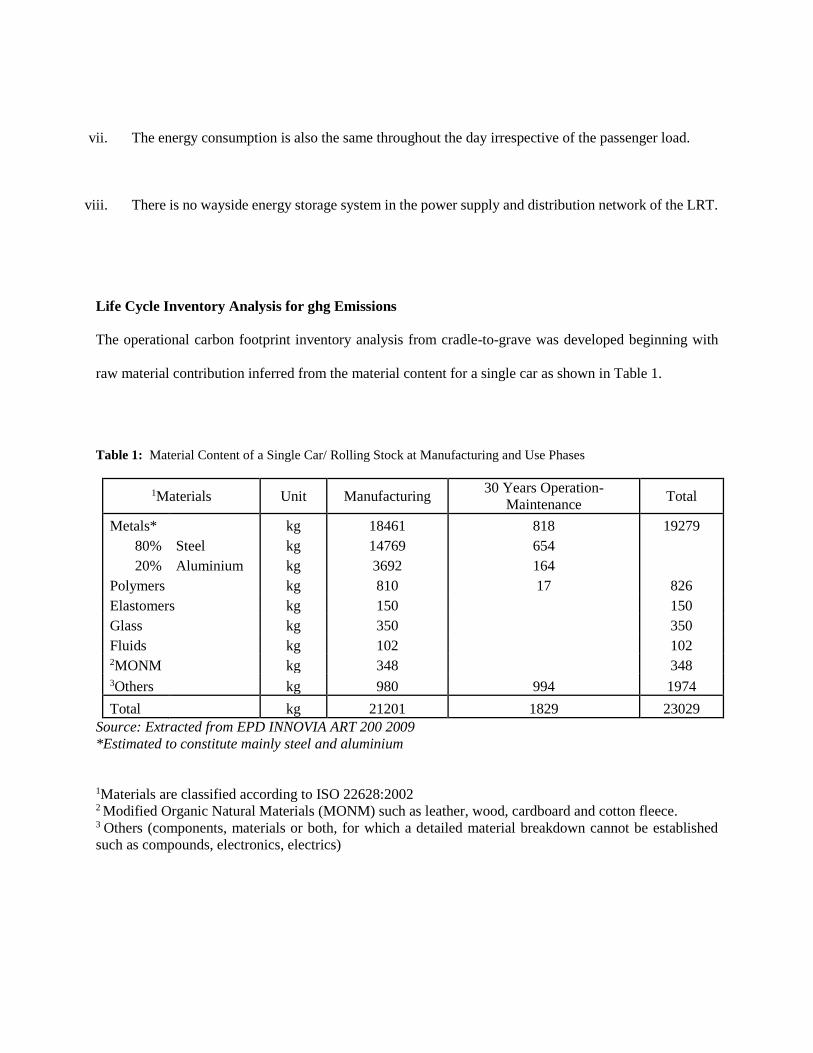
vii. The energy consumption is also the same throughout the day irrespective of the passenger load.
viii. There is no wayside energy storage system in the power supply and distribution network of the LRT.
Life Cycle Inventory Analysis for ghg Emissions
The operational carbon footprint inventory analysis from cradle-to-grave was developed beginning with
raw material contribution inferred from the material content for a single car as shown in Table 1.
Table 1: Material Content of a Single Car/ Rolling Stock at Manufacturing and Use Phases
1Materials Unit Manufacturing 30 Years Operation-
Maintenance Total
Metals* kg 18461 818 19279
80% Steel kg 14769 654
20% Aluminium kg 3692 164
Polymers kg 810 17 826
Elastomers kg 150 150
Glass kg 350 350
Fluids kg 102 102 2MONM kg 348 348 3Others kg 980 994 1974
Total kg 21201 1829 23029
Source: Extracted from EPD INNOVIA ART 200 2009
*Estimated to constitute mainly steel and aluminium
1Materials are classified according to ISO 22628:2002 2 Modified Organic Natural Materials (MONM) such as leather, wood, cardboard and cotton fleece. 3 Others (components, materials or both, for which a detailed material breakdown cannot be established
such as compounds, electronics, electrics)
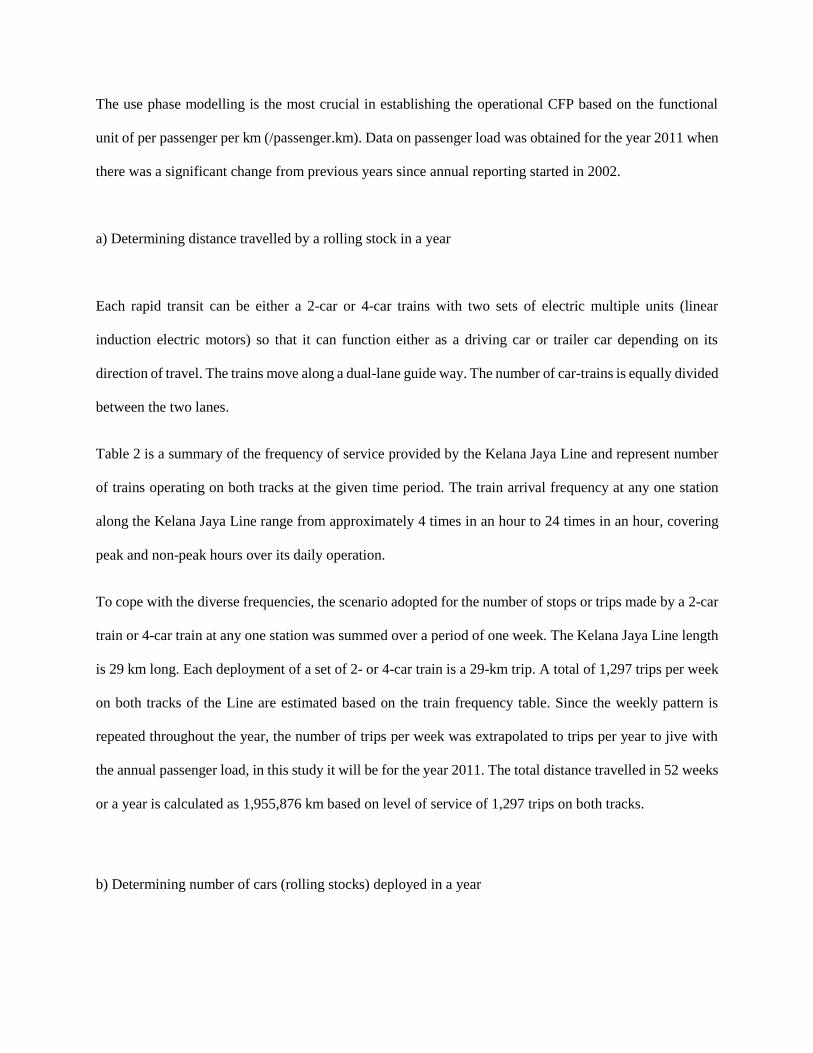
The use phase modelling is the most crucial in establishing the operational CFP based on the functional
unit of per passenger per km (/passenger.km). Data on passenger load was obtained for the year 2011 when
there was a significant change from previous years since annual reporting started in 2002.
a) Determining distance travelled by a rolling stock in a year
Each rapid transit can be either a 2-car or 4-car trains with two sets of electric multiple units (linear
induction electric motors) so that it can function either as a driving car or trailer car depending on its
direction of travel. The trains move along a dual-lane guide way. The number of car-trains is equally divided
between the two lanes.
Table 2 is a summary of the frequency of service provided by the Kelana Jaya Line and represent number
of trains operating on both tracks at the given time period. The train arrival frequency at any one station
along the Kelana Jaya Line range from approximately 4 times in an hour to 24 times in an hour, covering
peak and non-peak hours over its daily operation.
To cope with the diverse frequencies, the scenario adopted for the number of stops or trips made by a 2-car
train or 4-car train at any one station was summed over a period of one week. The Kelana Jaya Line length
is 29 km long. Each deployment of a set of 2- or 4-car train is a 29-km trip. A total of 1,297 trips per week
on both tracks of the Line are estimated based on the train frequency table. Since the weekly pattern is
repeated throughout the year, the number of trips per week was extrapolated to trips per year to jive with
the annual passenger load, in this study it will be for the year 2011. The total distance travelled in 52 weeks
or a year is calculated as 1,955,876 km based on level of service of 1,297 trips on both tracks.
b) Determining number of cars (rolling stocks) deployed in a year
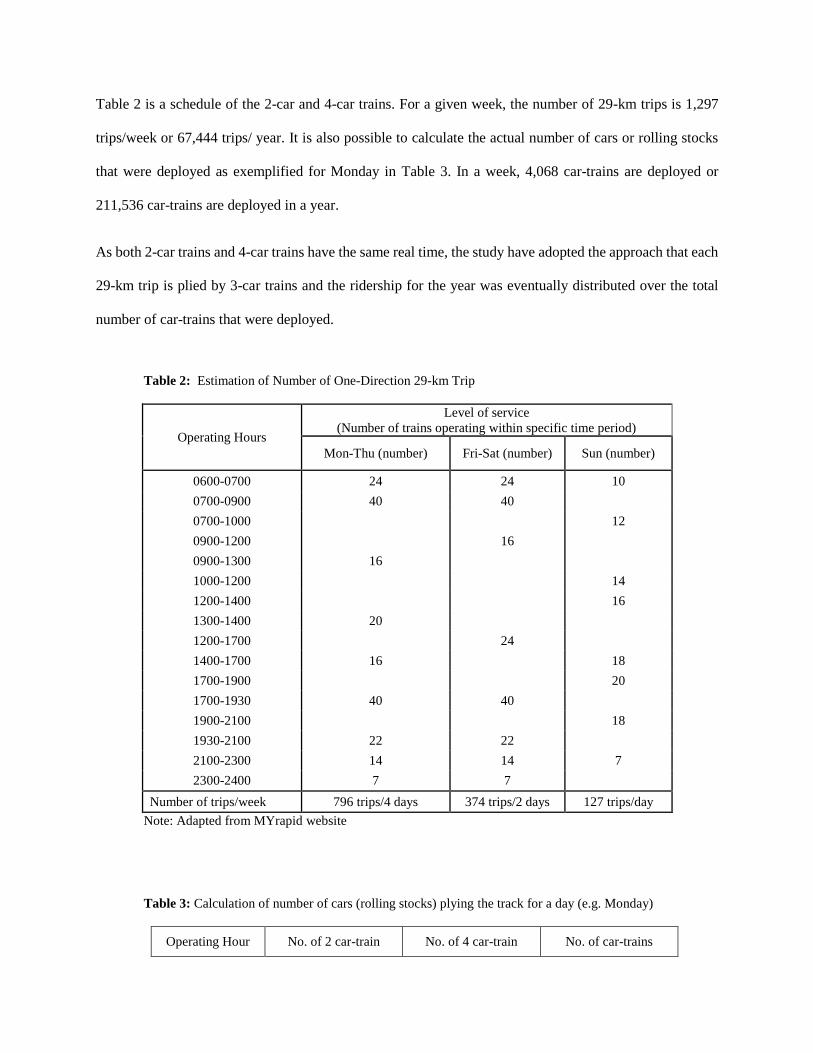
Table 2 is a schedule of the 2-car and 4-car trains. For a given week, the number of 29-km trips is 1,297
trips/week or 67,444 trips/ year. It is also possible to calculate the actual number of cars or rolling stocks
that were deployed as exemplified for Monday in Table 3. In a week, 4,068 car-trains are deployed or
211,536 car-trains are deployed in a year.
As both 2-car trains and 4-car trains have the same real time, the study have adopted the approach that each
29-km trip is plied by 3-car trains and the ridership for the year was eventually distributed over the total
number of car-trains that were deployed.
Table 2: Estimation of Number of One-Direction 29-km Trip
Operating Hours
Level of service
(Number of trains operating within specific time period)
Mon-Thu (number) Fri-Sat (number) Sun (number)
0600-0700 24 24 10
0700-0900 40 40
0700-1000 12
0900-1200 16
0900-1300 16
1000-1200 14
1200-1400 16
1300-1400 20
1200-1700 24
1400-1700 16 18
1700-1900 20
1700-1930 40 40
1900-2100 18
1930-2100 22 22
2100-2300 14 14 7
2300-2400 7 7
Number of trips/week 796 trips/4 days 374 trips/2 days 127 trips/day
Note: Adapted from MYrapid website
Table 3: Calculation of number of cars (rolling stocks) plying the track for a day (e.g. Monday)
Operating Hour No. of 2 car-train No. of 4 car-train No. of car-trains
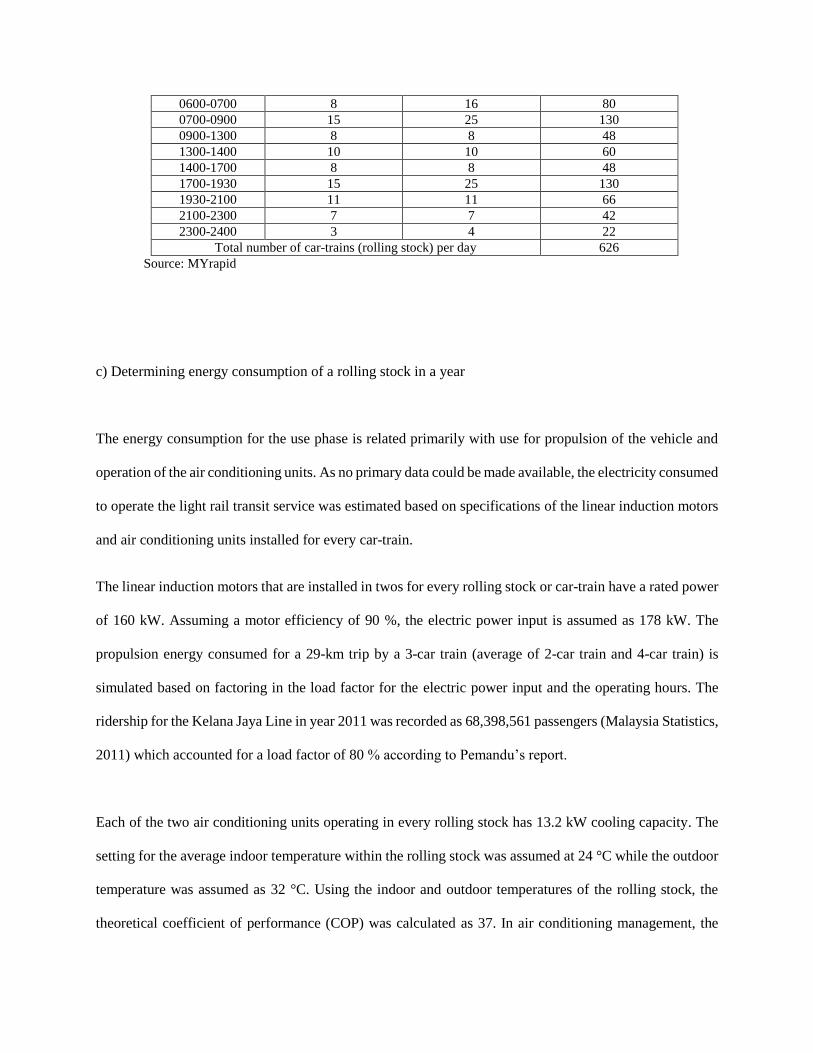
0600-0700 8 16 80
0700-0900 15 25 130
0900-1300 8 8 48
1300-1400 10 10 60
1400-1700 8 8 48
1700-1930 15 25 130
1930-2100 11 11 66
2100-2300 7 7 42
2300-2400 3 4 22
Total number of car-trains (rolling stock) per day 626
Source: MYrapid
c) Determining energy consumption of a rolling stock in a year
The energy consumption for the use phase is related primarily with use for propulsion of the vehicle and
operation of the air conditioning units. As no primary data could be made available, the electricity consumed
to operate the light rail transit service was estimated based on specifications of the linear induction motors
and air conditioning units installed for every car-train.
The linear induction motors that are installed in twos for every rolling stock or car-train have a rated power
of 160 kW. Assuming a motor efficiency of 90 %, the electric power input is assumed as 178 kW. The
propulsion energy consumed for a 29-km trip by a 3-car train (average of 2-car train and 4-car train) is
simulated based on factoring in the load factor for the electric power input and the operating hours. The
ridership for the Kelana Jaya Line in year 2011 was recorded as 68,398,561 passengers (Malaysia Statistics,
2011) which accounted for a load factor of 80 % according to Pemandu’s report.
Each of the two air conditioning units operating in every rolling stock has 13.2 kW cooling capacity. The
setting for the average indoor temperature within the rolling stock was assumed at 24 °C while the outdoor
temperature was assumed as 32 °C. Using the indoor and outdoor temperatures of the rolling stock, the
theoretical coefficient of performance (COP) was calculated as 37. In air conditioning management, the
COP is related to the Energy Efficiency Ratio (EER) by direct multiplication with the value of 3.41. Based
on this estimation, EER was taken as ten (10) which is about ten times smaller than the theoretical COP.
The EER is also the ratio of the total cooling capacity to the input electrical energy. With this, the input
electrical energy which is the power consumed to operate each air conditioning unit is estimated based on
a rating power of 4.50 kW, or 9 kW for two air conditioning units in each rolling stock. The final energy
consumption is based on the full load factor.
Although the use of cooling capacity may overestimate the energy consumption for operating the air
conditioning units, this assumption was the closest available in the absence of any other forms of activity
data available. The power consumption for other electricity-operated auxiliary systems such as the lighting
equipment, display indicators and automatic doors have not been included in the estimation of energy
consumption during operation of a 3-car train for a particular trip.
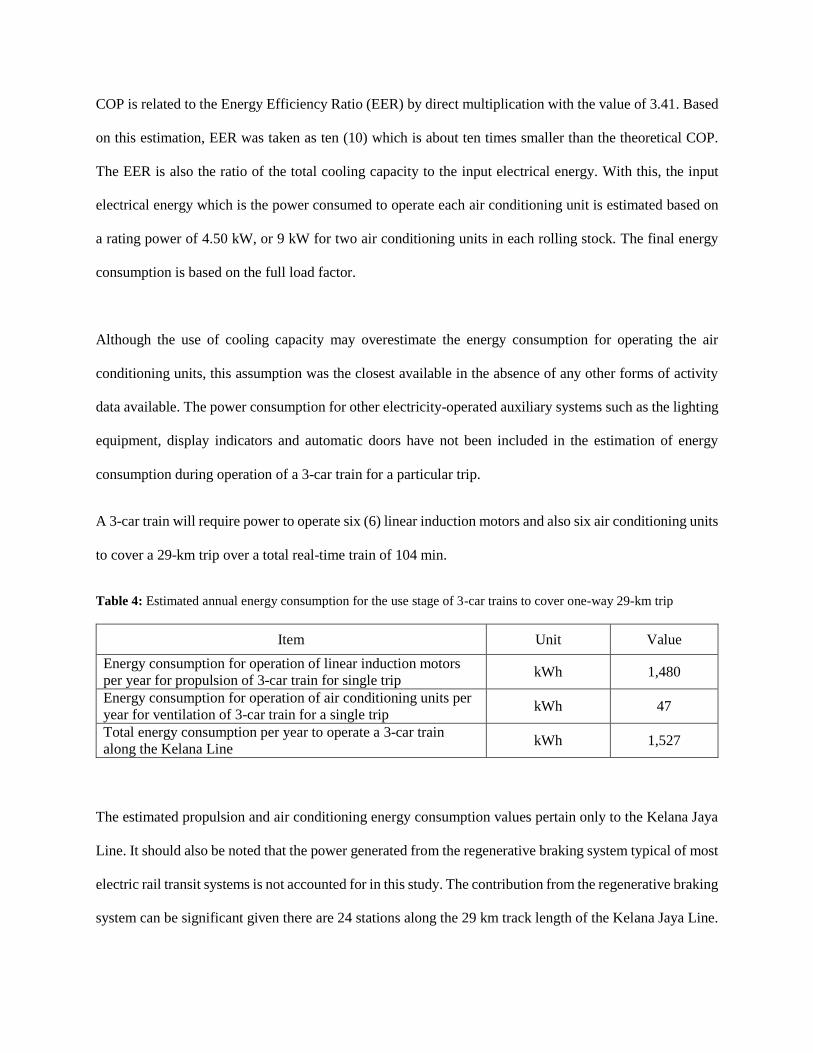
A 3-car train will require power to operate six (6) linear induction motors and also six air conditioning units
to cover a 29-km trip over a total real-time train of 104 min.
Table 4: Estimated annual energy consumption for the use stage of 3-car trains to cover one-way 29-km trip
Item Unit Value
Energy consumption for operation of linear induction motors
per year for propulsion of 3-car train for single trip kWh 1,480
Energy consumption for operation of air conditioning units per
year for ventilation of 3-car train for a single trip kWh 47
Total energy consumption per year to operate a 3-car train
along the Kelana Line kWh 1,527
The estimated propulsion and air conditioning energy consumption values pertain only to the Kelana Jaya
Line. It should also be noted that the power generated from the regenerative braking system typical of most
electric rail transit systems is not accounted for in this study. The contribution from the regenerative braking
system can be significant given there are 24 stations along the 29 km track length of the Kelana Jaya Line.
The approach of estimating the energy consumption for the use phase did not adopt the values presented in
the Bombardier Innovia ART 200 Environmental Product Declaration such as the auxiliary energy
consumption as it was specifically mentioned the values provided apply only to the Vancouver Millennium
Line and not applicable elsewhere.
The end-of-life stage will occur after 30 years operation. The Environmental Product Declaration for the
INNOVIA ART 200 has indicated <4% of the entire train (3-car train) will be disposed. The rest of the
materials are recycled or used as fuel for energy recovery. The open loop recycling is considered to have
taken place and the material gain is not offset at the raw material input. The ghg gas emission during
dismantling and recycling of the vehicle would have been divided by 30 years in similar treatment to the
ghg emission during material input. No data on energy consumption required to dismantle the rolling stock
is available for inclusion in the inventory but the contribution is expected to be small.
Carbon Footprint Calculation
The emissions of the use stage over thirty years will differ according to the fuel mix for power generation
for the year of study. In Malaysia, the fuel mix for the year 2010 is shown in Figure 4.
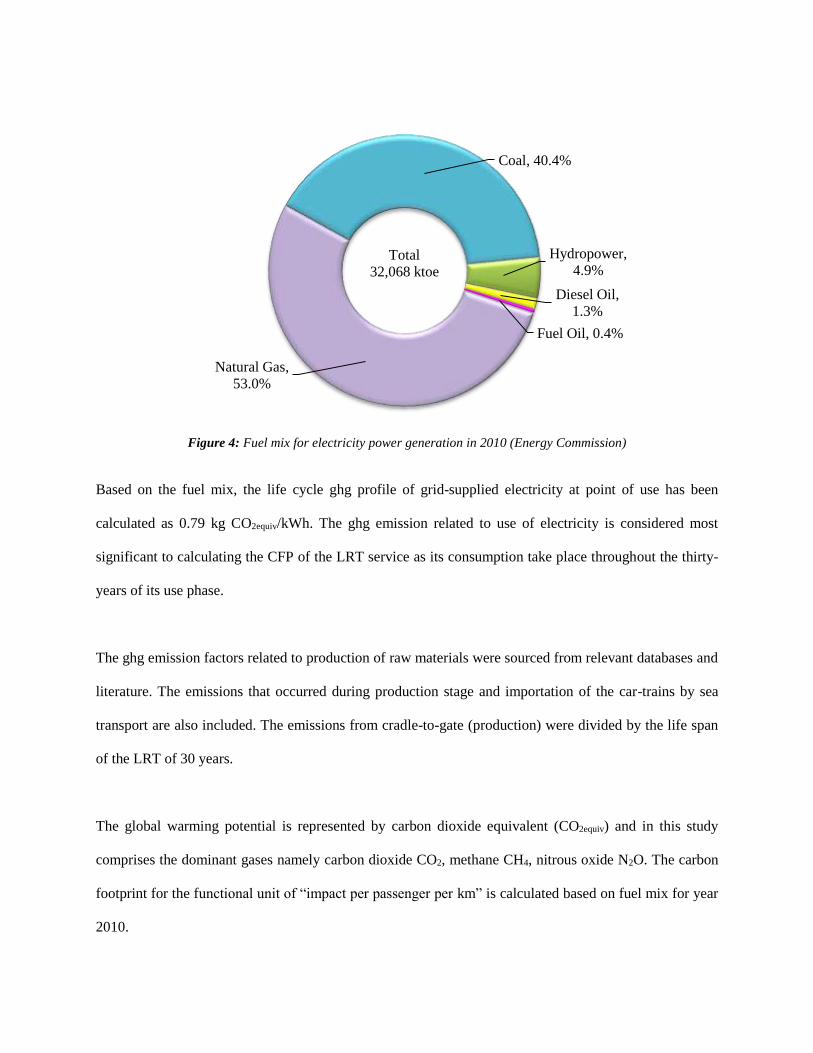
Figure 4: Fuel mix for electricity power generation in 2010 (Energy Commission)
Based on the fuel mix, the life cycle ghg profile of grid-supplied electricity at point of use has been
calculated as 0.79 kg CO2equiv/kWh. The ghg emission related to use of electricity is considered most
significant to calculating the CFP of the LRT service as its consumption take place throughout the thirty-
years of its use phase.
The ghg emission factors related to production of raw materials were sourced from relevant databases and
literature. The emissions that occurred during production stage and importation of the car-trains by sea
transport are also included. The emissions from cradle-to-gate (production) were divided by the life span
of the LRT of 30 years.
The global warming potential is represented by carbon dioxide equivalent (CO2equiv) and in this study
comprises the dominant gases namely carbon dioxide CO2, methane CH4, nitrous oxide N2O. The carbon
footprint for the functional unit of “impact per passenger per km” is calculated based on fuel mix for year
2010.
Natural Gas,
53.0%
Coal, 40.4%
Hydropower,
4.9%
Diesel Oil,
1.3%
Fuel Oil, 0.4%
Total
32,068 ktoe
The data for raw material consumption, and transportation was unitised to every rolling stock produced.
However, the data of use phase was unitised to a fixed distanced travelled within one year together with the
average ridership, which is in accordance to the functional unit used in this study. The calculation of the
cradle-to-use ghg profile or carbon footprint has been carried out using relevant conversion factors from
databases and literature.
RESULTS AND DISCUSSION
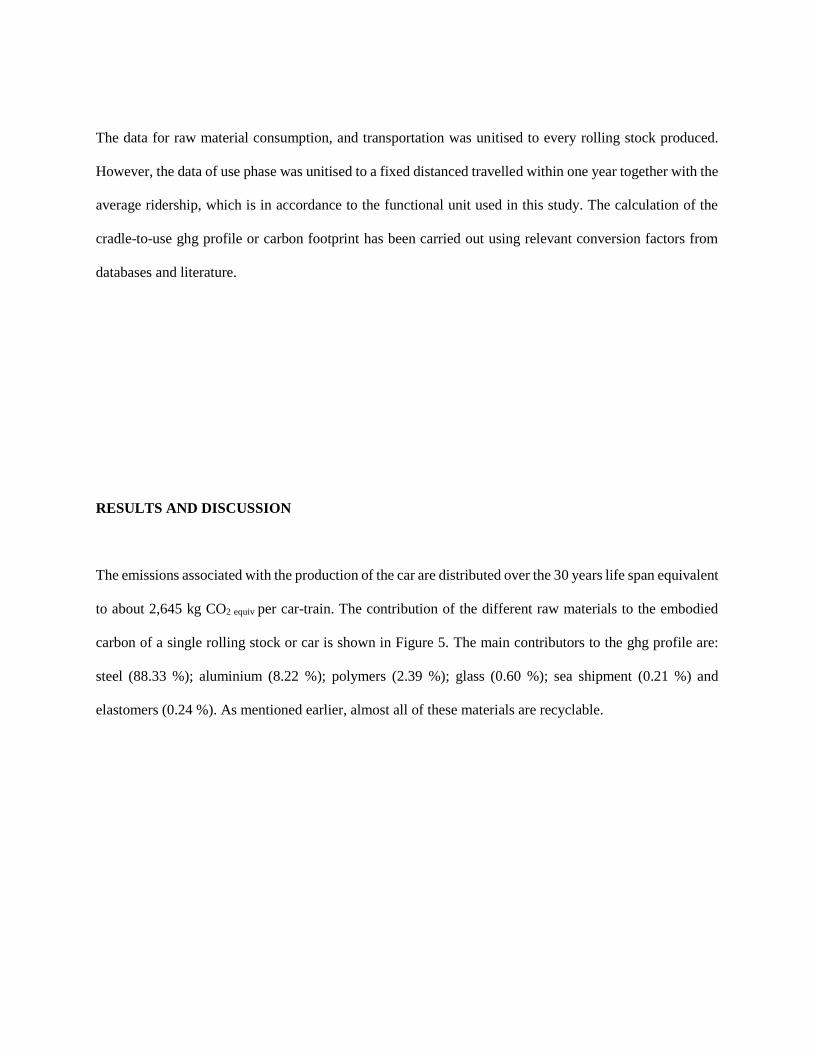
The emissions associated with the production of the car are distributed over the 30 years life span equivalent
to about 2,645 kg CO2 equiv per car-train. The contribution of the different raw materials to the embodied
carbon of a single rolling stock or car is shown in Figure 5. The main contributors to the ghg profile are:
steel (88.33 %); aluminium (8.22 %); polymers (2.39 %); glass (0.60 %); sea shipment (0.21 %) and
elastomers (0.24 %). As mentioned earlier, almost all of these materials are recyclable.
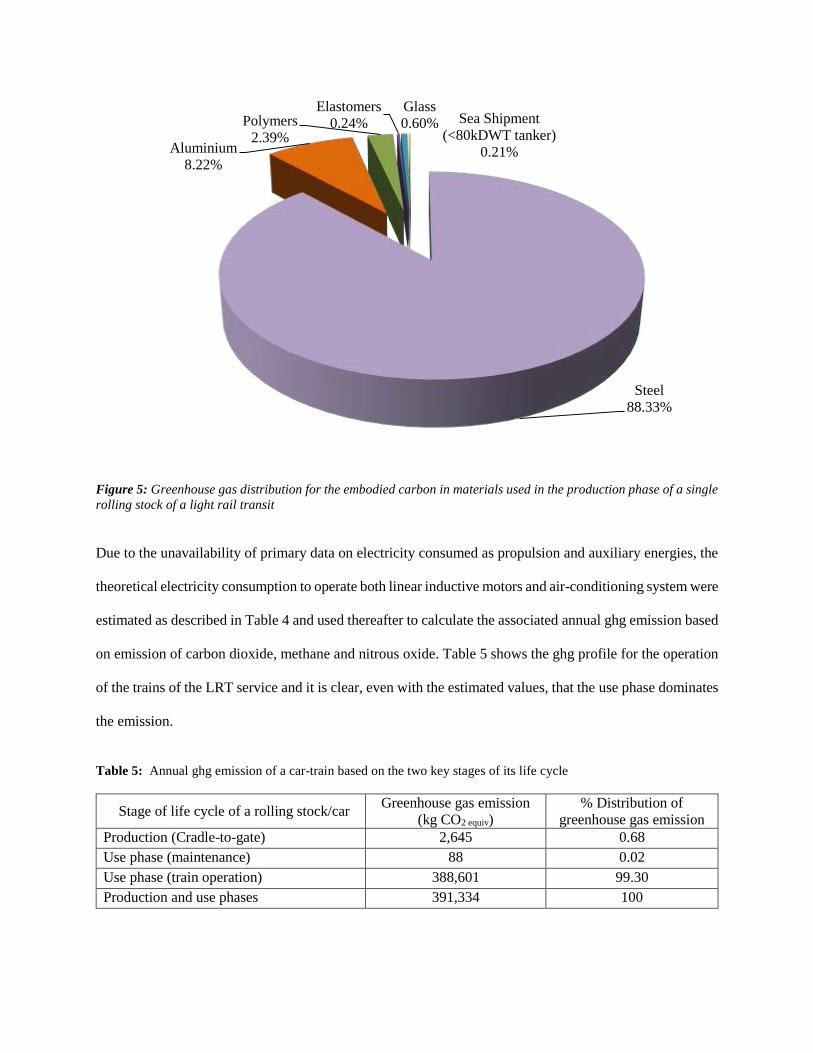
Figure 5: Greenhouse gas distribution for the embodied carbon in materials used in the production phase of a single
rolling stock of a light rail transit
Due to the unavailability of primary data on electricity consumed as propulsion and auxiliary energies, the
theoretical electricity consumption to operate both linear inductive motors and air-conditioning system were
estimated as described in Table 4 and used thereafter to calculate the associated annual ghg emission based
on emission of carbon dioxide, methane and nitrous oxide. Table 5 shows the ghg profile for the operation
of the trains of the LRT service and it is clear, even with the estimated values, that the use phase dominates
the emission.
Table 5: Annual ghg emission of a car-train based on the two key stages of its life cycle
Stage of life cycle of a rolling stock/car Greenhouse gas emission
(kg CO2 equiv)
% Distribution of
greenhouse gas emission
Production (Cradle-to-gate) 2,645 0.68
Use phase (maintenance) 88 0.02
Use phase (train operation) 388,601 99.30
Production and use phases 391,334 100
Steel
88.33%
Aluminium
8.22%
Polymers
2.39%
Elastomers
0.24%
Glass
0.60% Sea Shipment
(<80kDWT tanker)
0.21%
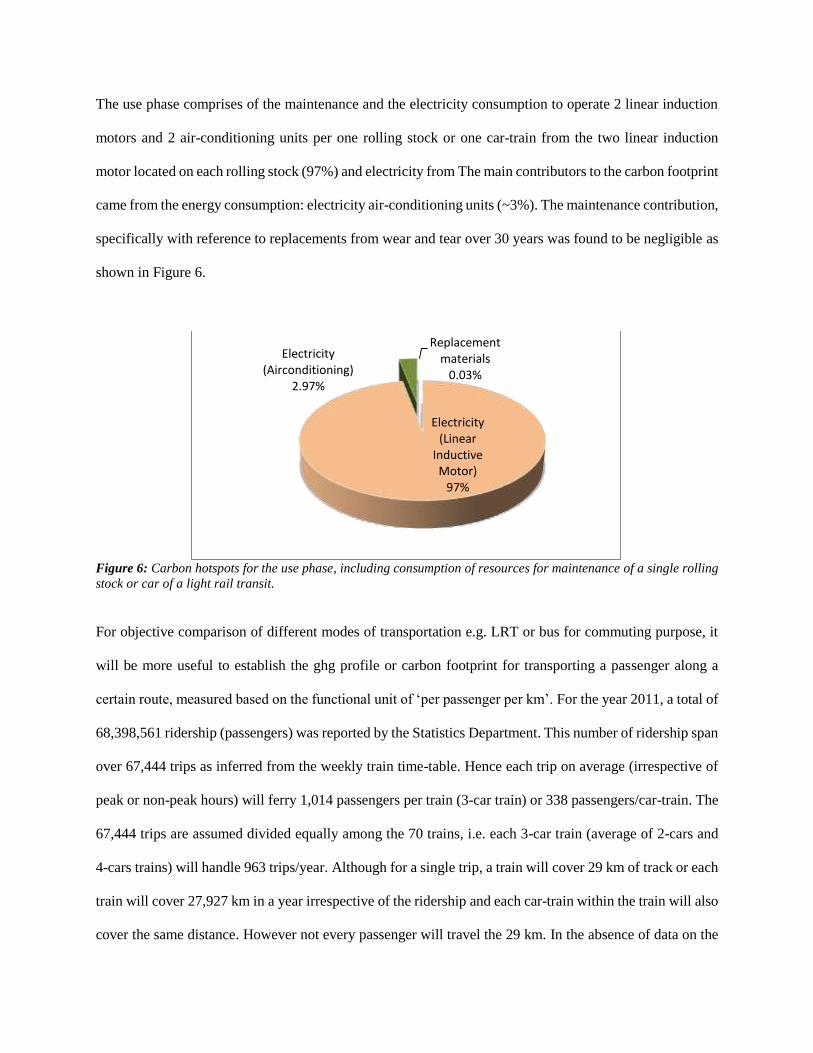
The use phase comprises of the maintenance and the electricity consumption to operate 2 linear induction
motors and 2 air-conditioning units per one rolling stock or one car-train from the two linear induction
motor located on each rolling stock (97%) and electricity from The main contributors to the carbon footprint
came from the energy consumption: electricity air-conditioning units (~3%). The maintenance contribution,
specifically with reference to replacements from wear and tear over 30 years was found to be negligible as
shown in Figure 6.
Figure 6: Carbon hotspots for the use phase, including consumption of resources for maintenance of a single rolling
stock or car of a light rail transit.
For objective comparison of different modes of transportation e.g. LRT or bus for commuting purpose, it
will be more useful to establish the ghg profile or carbon footprint for transporting a passenger along a
certain route, measured based on the functional unit of ‘per passenger per km’. For the year 2011, a total of
68,398,561 ridership (passengers) was reported by the Statistics Department. This number of ridership span
over 67,444 trips as inferred from the weekly train time-table. Hence each trip on average (irrespective of
peak or non-peak hours) will ferry 1,014 passengers per train (3-car train) or 338 passengers/car-train. The
67,444 trips are assumed divided equally among the 70 trains, i.e. each 3-car train (average of 2-cars and
4-cars trains) will handle 963 trips/year. Although for a single trip, a train will cover 29 km of track or each
train will cover 27,927 km in a year irrespective of the ridership and each car-train within the train will also
cover the same distance. However not every passenger will travel the 29 km. In the absence of data on the
Replacement materials
0.03%
Electricity (Linear
Inductive Motor)
97%
Electricity (Airconditioning)
2.97%
commuting pattern of the Kelana Jaya ridership, an arbitrary distribution based the following assumption
is made: 5% of ridership covered the whole length of the track at 29 km, 10 % covered about 2/3’s of the
track at 20km, 35 % covered half the track length at 15 km, and 50 % covered only a short distance of about
1/3 of the track length at 10 km.
It has been estimated that the annual ghg emission of a 1-car train is 391,334 kg CO2equiv/year. The ghg
emission associated with a single passenger using the LRT service is estimated by proportioning the
ridership according to the distance travelled above. The total distance travelled by the passengers in a given
year within a single car-train over 963 trips is about 5000 million km. The operational carbon footprint is
then estimated by dividing the annual ghg emission by the number of passengers and their associated
travelling distances. The life cycle carbon footprint for the LRT commuting service serving the Kelana Jaya
line, covering 24 stations and 29 km long was calculated as 0.091 g CO2equi/passenger.km based on an
operational lifetime of 30 years.
Bombardier who is the manufacturer of the INNOVIA ART 200 used for the Kelana Jaya Line, has issued
an Environmental Product Declaration (EPD) of their INNOVIA ART 200 based on the operation pattern
of the Vancouver Millennium Line. The carbon footprint of a passenger travelling for one kilometer on the
INNOVIA ART 200 is declared as 8.7g CO2equiv/passenger.km (Bombardier).
The EPD of the INNOVIA ART 200 was clear in declaring that the energy consumption values were valid
only to the Vancouver Millennium Line. The INNOVIA ART 200 reported for the Vancouver line should in
principle be the same as the INNOVIA ART 200 used for the Kelana Jaya Line. However it is uncertain if
the features that enable high energy efficiency operations reported in the EPD are applicable to the Kelana
Jaya Line INNOVIA ART 200. Although not of the exact similar system boundary and accounting criteria,
the carbon footprint values based on the same functional unit reported by Bombardier and as calculated by
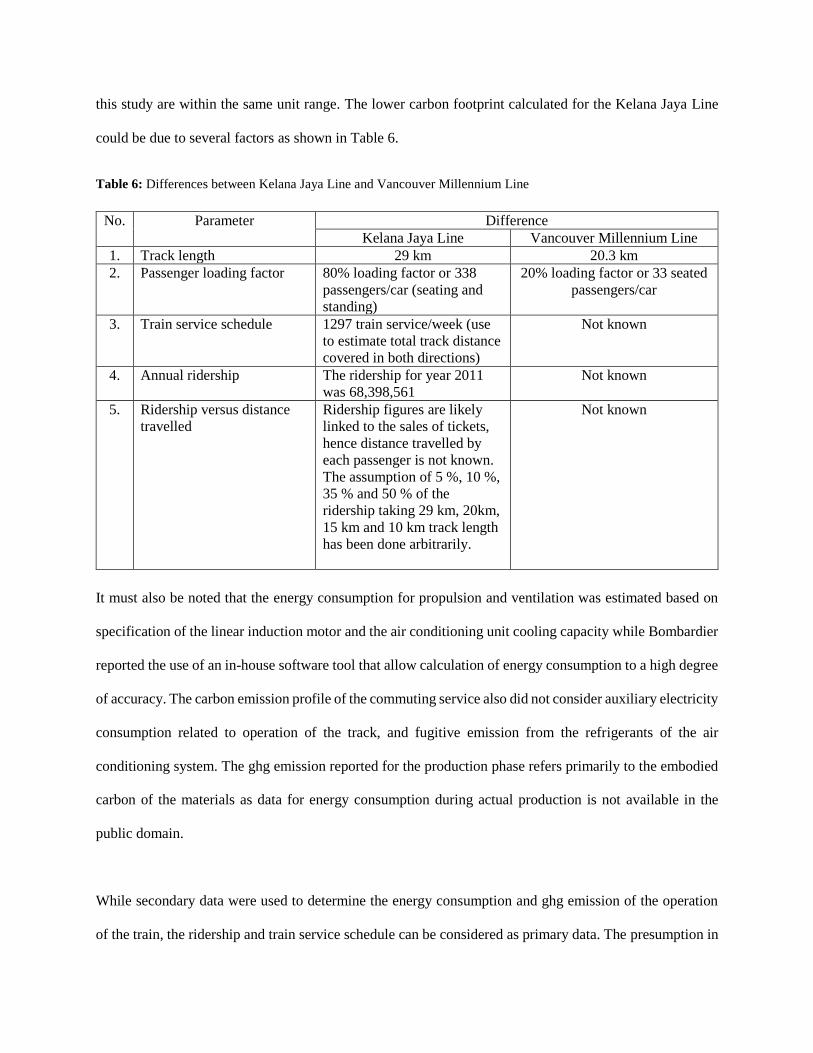
this study are within the same unit range. The lower carbon footprint calculated for the Kelana Jaya Line
could be due to several factors as shown in Table 6.
Table 6: Differences between Kelana Jaya Line and Vancouver Millennium Line
No. Parameter Difference
Kelana Jaya Line Vancouver Millennium Line
1. Track length 29 km 20.3 km
2. Passenger loading factor 80% loading factor or 338
passengers/car (seating and
standing)
20% loading factor or 33 seated
passengers/car
3. Train service schedule 1297 train service/week (use
to estimate total track distance
covered in both directions)
Not known
4. Annual ridership The ridership for year 2011
was 68,398,561
Not known
5. Ridership versus distance
travelled
Ridership figures are likely
linked to the sales of tickets,
hence distance travelled by
each passenger is not known.
The assumption of 5 %, 10 %,
35 % and 50 % of the
ridership taking 29 km, 20km,
15 km and 10 km track length
has been done arbitrarily.
Not known
It must also be noted that the energy consumption for propulsion and ventilation was estimated based on
specification of the linear induction motor and the air conditioning unit cooling capacity while Bombardier
reported the use of an in-house software tool that allow calculation of energy consumption to a high degree
of accuracy. The carbon emission profile of the commuting service also did not consider auxiliary electricity
consumption related to operation of the track, and fugitive emission from the refrigerants of the air
conditioning system. The ghg emission reported for the production phase refers primarily to the embodied
carbon of the materials as data for energy consumption during actual production is not available in the
public domain.
While secondary data were used to determine the energy consumption and ghg emission of the operation
of the train, the ridership and train service schedule can be considered as primary data. The presumption in
the modelling is to link the ghg emission of a single car-train that ferry a passenger load that was divided
into four track length, which is expected to be far more complex in the real world. A more accurate approach
would have been to separate the tickets according to destination and develop a better representative
travelling pattern and distance travelled.
Nevertheless, the paper shows a logical sequence of steps that can be taken to develop the operational
carbon footprint of the light rail transit service in a metropolis setting, namely the Greater KL/Klang Valley
Metropolis. A more accurate footprint can be developed if data related to the energy consumption of the
rolling stock or train operations, as well as construction and operation of associated infrastructure can be
made available.
CONCLUSION
The operational life cycle greenhouse gas emission associated with the LRT commuting service that serves
the Klang Valley metropolitan along the Kelana Jaya route, covering 29 km and 24 stations is 0.091 g CO2
equiv/passenger.km for an average carrying capacity of 338 passengers/ car based on eight assumptions
mentioned under the ‘Assumption’ heading. The contributions from infrastructure construction and
operation have been excluded in the system boundary.
The largest single source of ghg emission of the LRT service is electricity consumed during the use phase,
accounting for more than 99 % of the life cycle emission assuming the life span of each rolling stock or car
used to transport passengers is 30 years. The electricity consumptions were calculated for the the two major
activities namely electricity for propulsion of the train in the form of operation of the linear induction motors
and the air conditioning system.
Of the materials used to produce the car, steel contributed close to 90 % of the ghg profile for the production
phase.It is assumed the disposal phase will produce recycled materials i.e. materials that can be reused again
for other purposes, contributed by 87 % of the rolling stock is made from recyclable materials like steel,
aluminium and glass. Thus, the recycling scenario is an open loop in which the products (rolling stock parts)
are used as resource to manufacture other products and contribution from offset is not included in the system
boundary.
ACKNOWLEDGEMENT
The authors wish to thank Mr. Mohd Zufri Bin Mahmud from Rapid KL for his support in providing insights
and clarification on some technical and operational aspects of the LRT operation.
REFERENCES
American Public Transportation Association Glossary of Transportation (1994).
http://www.apta.com/resources/statistics/Pages/glossary.aspx
Bombardier ART II Vancouver.http://greg-vassilakos.com/traindwg/lg-bombardier-artii-vancouver.gif
Bombardier Innovia ART – Kuala Lumpur, Malaysia www.bombardier.com/en/transportation/projects
Bombardier (2009), Innova ART 200 Environmental Product Declaration
Chester M.V. and Horvath A. (2009) Environmental assessment of passenger transportation should
include infrastructure and supply chains. Environ. Res. Lett. 4 024008 doi:10.1088/1748-
9326/4/2/024008
Energy Commission (2010), National Energy Balance 2010
Hirahara, K. (2012). Malaysia Kelana Jaya Line Power Supply System. Mieden Review, Series No. 156
Horvath, A. (2007). Environmental life-cycle Assessment of Passenger Transportation. Report to the
University of California Transportation Centre
ISO 14040 (2006). Environmental management – Life cycle assessment – Principles and framework.
ISO 14067 (2012). Carbon footprint of products – Requirements and guidelines for quantification and
communication.
ISO 22628 (2002). Road vehicles – Recyclability and recovery – Calculation method
Kelana Jaya Line. http://en.wikipedia.org/wiki/Kelana_Jaya_Line
Kurt Vollenwyder , Linear Motor Propulsion for Urban Transport. http://greg-
vassilakos.com/traindwg/lg-bombardier-artii-vancouver.gif
Ministry of Federal Territories, Official Website of Greater Kuala Lumpur/Klang Valley.
http://app.kwpkb.gov.my/greaterklkv/overview/
Ministry of Natural Resources and Environment Malaysia, NCS (2000), nc2.nre.gov.my
Ministry of Transport, Malaysia, www.mot.my
Mohamad, H. (2003). Rail Transportation in Kuala Lumpur. Japan Railway & Transport Review, No. 35
(pp. 21-27).
Myrapid Operating Hours. http://www.myrapid.com.my/rail/operating-hours
Myrapid Train Frequency. http://www.myrapid.com.my/rail/train-frequency
Pemandu Report
Port distance. http://www.searates.com/reference/portdistance/
Railway-technology.com, http://www.railway-technology.com/projects/kuala-lumpur-driverless-metro/
Reimann, K. (2012). Environmental Product Declarations at Bombardier Transportation
Simonsen, M. (2009). Energy Requirements and CO2 Emissions from Manufacturing and Maintenance of
Locomotives and Trains
SIRIM (2010), MYLCID Database. www.mylcid.sirim.my/sirimlca/
Stripple, H. (2010). Life Cycle Assessment of Railways and Rail Transport. Application in environmental
product declarations (EPDs) for the Bothnia Line
The Guide to PAS 2050:2011 (2011). How to carbon footprint your products, identify hotspots and
reduce emissions in your supply chain.
Transport Statistics Malaysia, Ministry of Transport Malaysia (2011)
Vollenwyder, K. (2005). Linear Motor Propulsion for Urban Transit. Bombardier Transportation
WRI/Tim Herzog, maps.grida.no/go/graphic/world-greenhouse-gas-emissions-by-sector


![PERSARAAN FAEDAH PERSARAAN - SABAH.gov Perkhidmatan-Pencen...Microsoft PowerPoint - BahagianPasca Perkhidmatan-Pencen [Compatibility Mode] Author: dzul Created Date: 12/16/2011 4:15:39](https://static.fdokumen.site/doc/165x107/5ae0a4c77f8b9af05b8de96c/persaraan-faedah-persaraan-sabah-perkhidmatan-pencenmicrosoft-powerpoint-.jpg)