Projek Jawab Untuk Jaya 2010 Biology
207
1 MODUL JUJ PROJEK JAWAB UNTUK JAYA (JUJ) NEGERI PAHANG TAHUN 2010 BIOLOGI
Transcript of Projek Jawab Untuk Jaya 2010 Biology
1
MODUL JUJ
PROJEK JAWAB UNTUK JAYA (JUJ) NEGERI PAHANG
TAHUN 2010
BIOLOGI
2
Page
1.1 Contents 2
1.2 Format 3 - 4
1.3 Analysis 5 - 10
1.4 Tips 11 -18
1.5 Questions - SPM 2009 Question paper (paper 2 & 3) 19 - 47
1.6 Marking scheme 48 - 74
1.7 Example of student’s answer 75 -115
1.8 Practice Module 116 - 165
1.9 Marking Skill 165 - 208
3
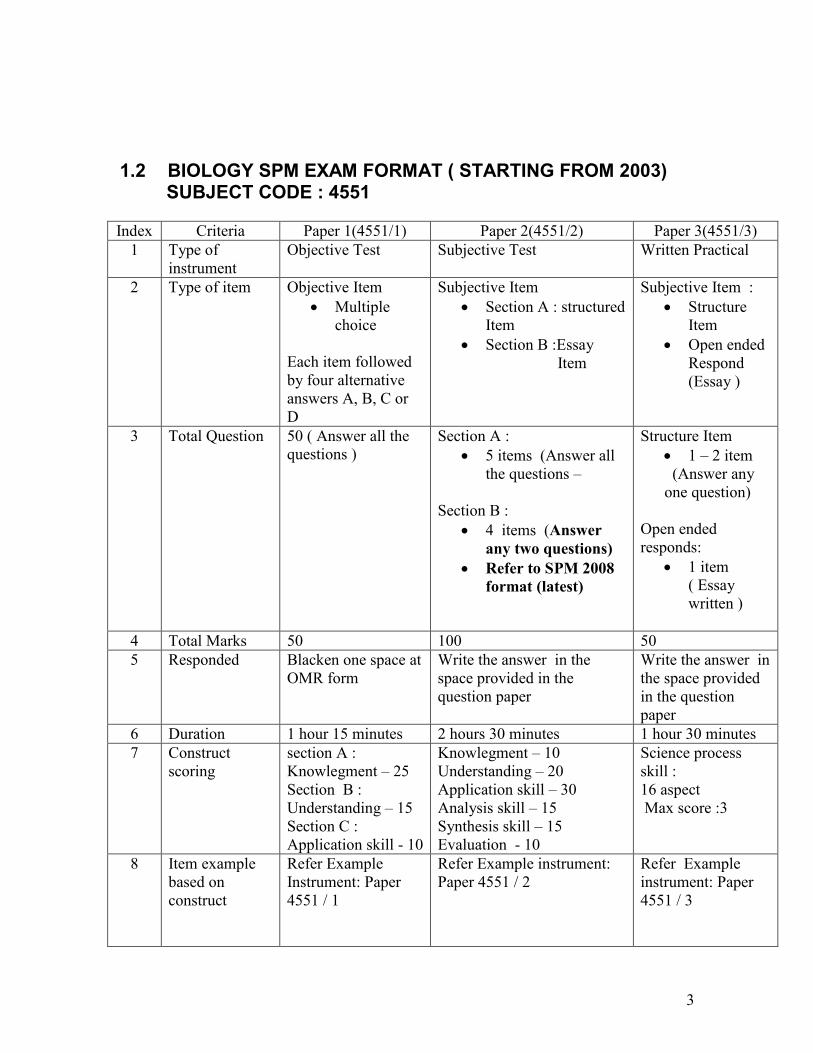
1.2 BIOLOGY SPM EXAM FORMAT ( STARTING FROM 2003) SUBJECT CODE : 4551 Index Criteria Paper 1(4551/1) Paper 2(4551/2) Paper 3(4551/3)
1 Type of instrument
Objective Test Subjective Test Written Practical
2 Type of item Objective Item Multiple
choice Each item followed by four alternative answers A, B, C or D
Subjective Item Section A : structured
Item Section B :Essay
Item
Subjective Item : Structure
Item Open ended
Respond (Essay )
3 Total Question 50 ( Answer all the questions )
Section A : 5 items (Answer all
the questions –
Section B : 4 items (Answer
any two questions) Refer to SPM 2008
format (latest)
Structure Item 1 – 2 item (Answer any one question)
Open ended responds:
1 item ( Essay written )
4 Total Marks 50 100 50 5 Responded Blacken one space at
OMR form Write the answer in the space provided in the question paper
Write the answer in the space provided in the question paper
6 Duration 1 hour 15 minutes 2 hours 30 minutes 1 hour 30 minutes 7 Construct
scoring section A : Knowlegment – 25 Section B : Understanding – 15 Section C : Application skill - 10
Knowlegment – 10 Understanding – 20 Application skill – 30 Analysis skill – 15 Synthesis skill – 15 Evaluation - 10
Science process skill : 16 aspect Max score :3
8 Item example based on construct
Refer Example Instrument: Paper 4551 / 1
Refer Example instrument: Paper 4551 / 2
Refer Example instrument: Paper 4551 / 3
4
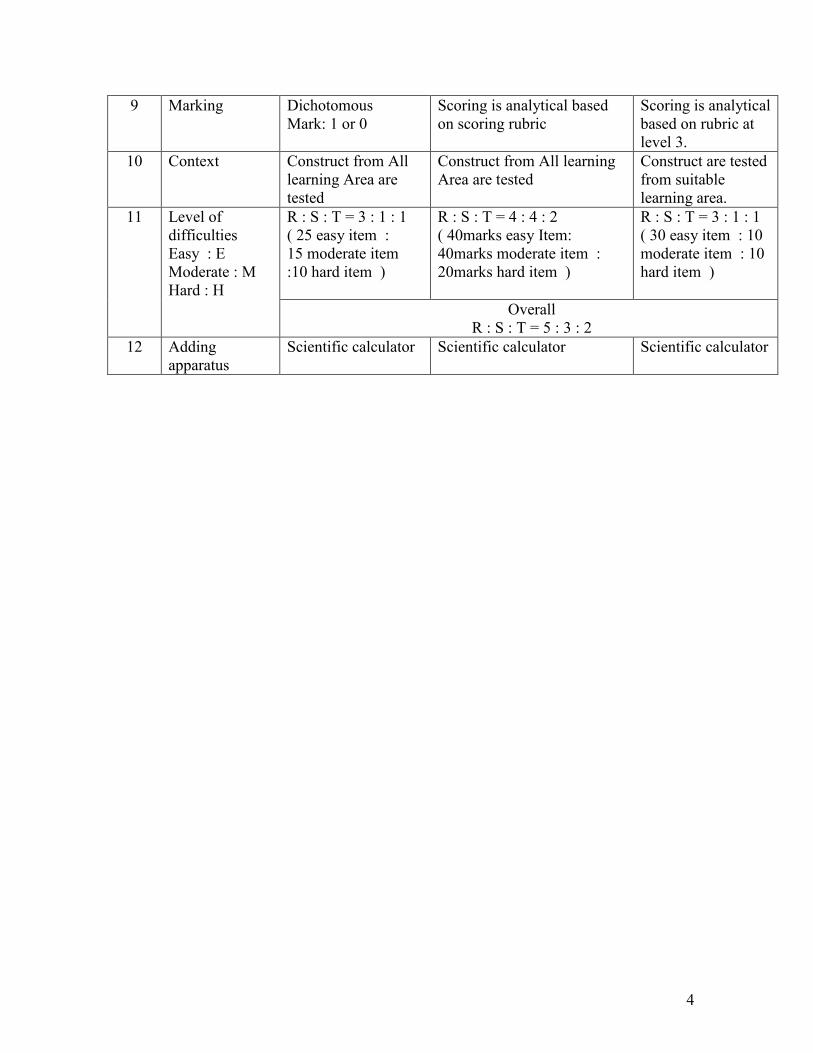
9 Marking Dichotomous Mark: 1 or 0
Scoring is analytical based on scoring rubric
Scoring is analytical based on rubric at level 3.
10 Context Construct from All learning Area are tested
Construct from All learning Area are tested
Construct are tested from suitable learning area.
11 Level of difficulties Easy : E Moderate : M Hard : H
R : S : T = 3 : 1 : 1 ( 25 easy item : 15 moderate item :10 hard item )
R : S : T = 4 : 4 : 2 ( 40marks easy Item: 40marks moderate item : 20marks hard item )
R : S : T = 3 : 1 : 1 ( 30 easy item : 10 moderate item : 10 hard item )
Overall R : S : T = 5 : 3 : 2
12 Adding apparatus
Scientific calculator Scientific calculator Scientific calculator
5
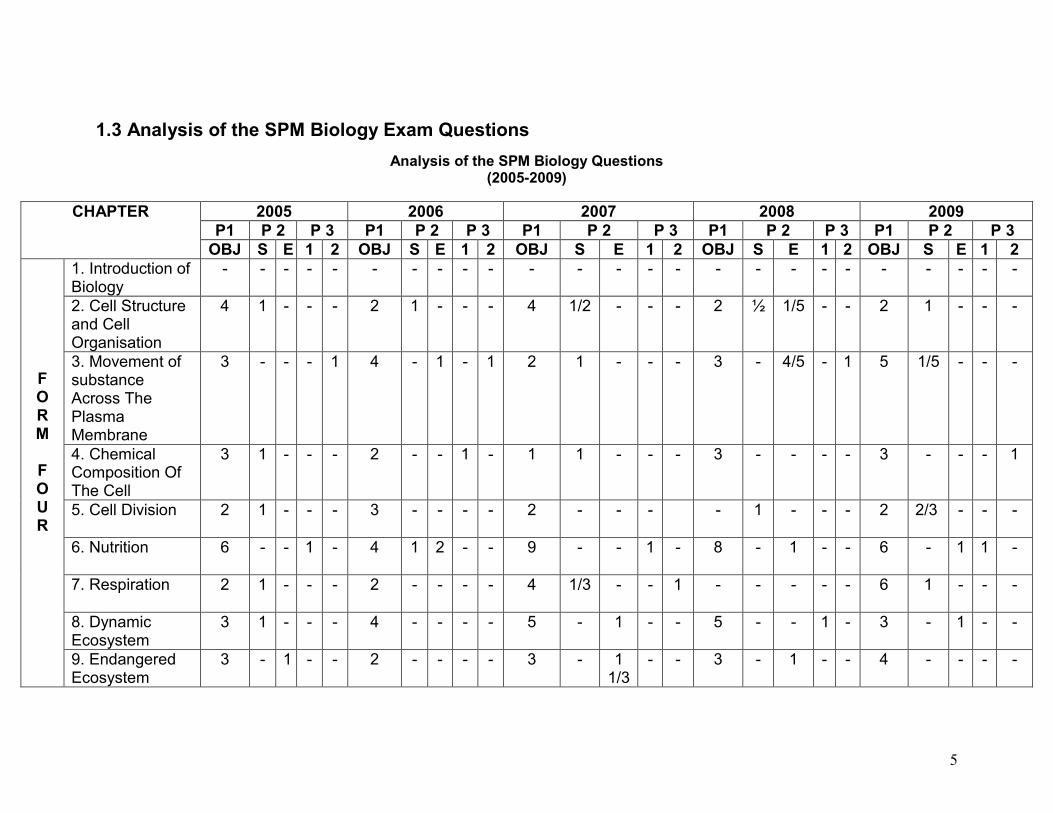
1.3 Analysis of the SPM Biology Exam Questions
Analysis of the SPM Biology Questions (2005-2009)
CHAPTER 2005 2006 2007 2008 2009 P1 P 2 P 3 P1 P 2 P 3 P1 P 2 P 3 P1 P 2 P 3 P1 P 2 P 3
OBJ S E 1 2 OBJ S E 1 2 OBJ S E 1 2 OBJ S E 1 2 OBJ S E 1 2
F O R M
F O U R
1. Introduction of Biology
- - - - - - - - - - - - - - - - - - - - - - - - -
2. Cell Structure and Cell Organisation
4 1 - - - 2 1 - - - 4 1/2 - - - 2 ½ 1/5 - - 2 1 - - -
3. Movement of substance Across The Plasma Membrane
3 - - - 1 4 - 1 - 1 2 1 - - - 3 - 4/5 - 1 5 1/5 - - -
4. Chemical Composition Of The Cell
3 1 - - - 2 - - 1 - 1 1 - - - 3 - - - - 3 - - - 1
5. Cell Division
2 1 - - - 3 - - - - 2 - - - - 1 - - - 2 2/3 - - -
6. Nutrition
6 - - 1 - 4 1 2 - - 9 - - 1 - 8 - 1 - - 6 - 1 1 -
7. Respiration
2 1 - - - 2 - - - - 4 1/3 - - 1 - - - - - 6 1 - - -
8. Dynamic Ecosystem
3 1 - - - 4 - - - - 5 - 1 - - 5 - - 1 - 3 - 1 - -
9. Endangered Ecosystem
3 - 1 - - 2 - - - - 3 - 1 1/3
- - 3 - 1 - - 4 - - - -
6
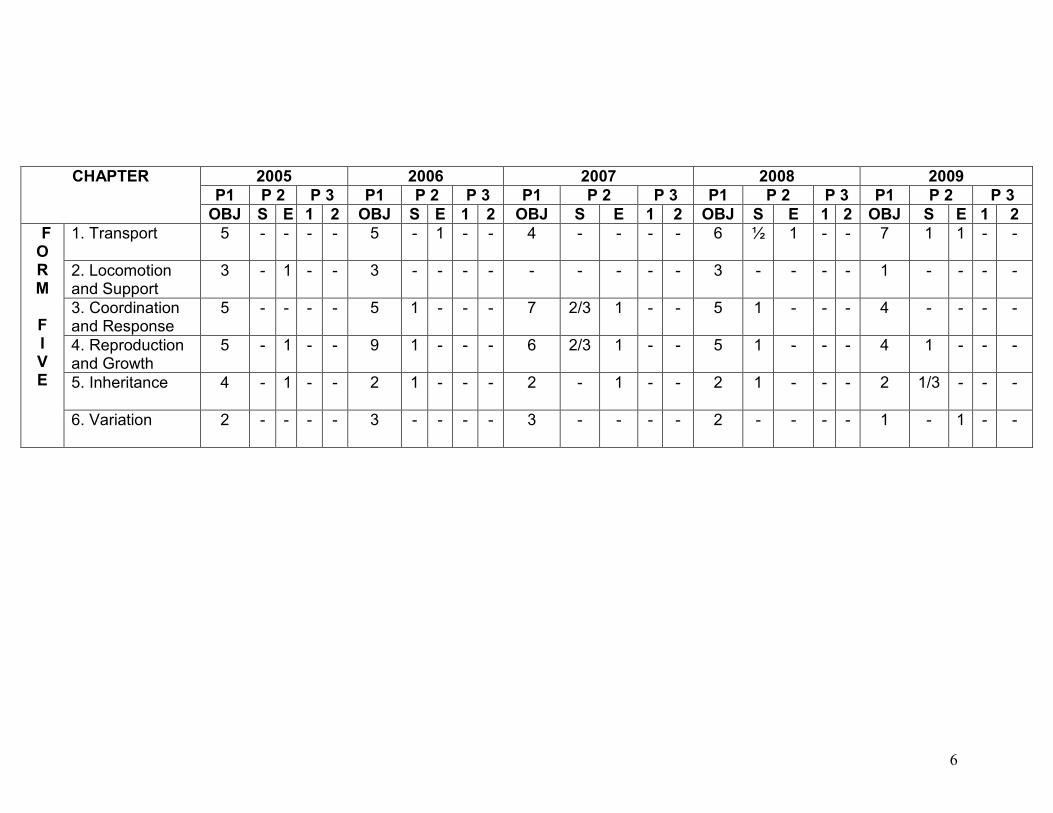
CHAPTER 2005 2006 2007 2008 2009 P1 P 2 P 3 P1 P 2 P 3 P1 P 2 P 3 P1 P 2 P 3 P1 P 2 P 3
OBJ S E 1 2 OBJ S E 1 2 OBJ S E 1 2 OBJ S E 1 2 OBJ S E 1 2 F O R M
F I V
E
1. Transport 5 - - - - 5 - 1 - - 4 - - - - 6 ½ 1 - - 7 1 1 - -
2. Locomotion and Support
3 - 1 - - 3 - - - - - - - - - 3 - - - - 1 - - - -
3. Coordination and Response
5 - - - - 5 1 - - - 7 2/3 1 - - 5 1 - - - 4 - - - -
4. Reproduction and Growth
5 - 1 - - 9 1 - - - 6 2/3 1 - - 5 1 - - - 4 1 - - -
5. Inheritance
4 - 1 - - 2 1 - - - 2 - 1 - - 2 1 - - - 2 1/3 - - -
6. Variation
2 - - - - 3 - - - - 3 - - - - 2 - - - - 1 - 1 - -
7
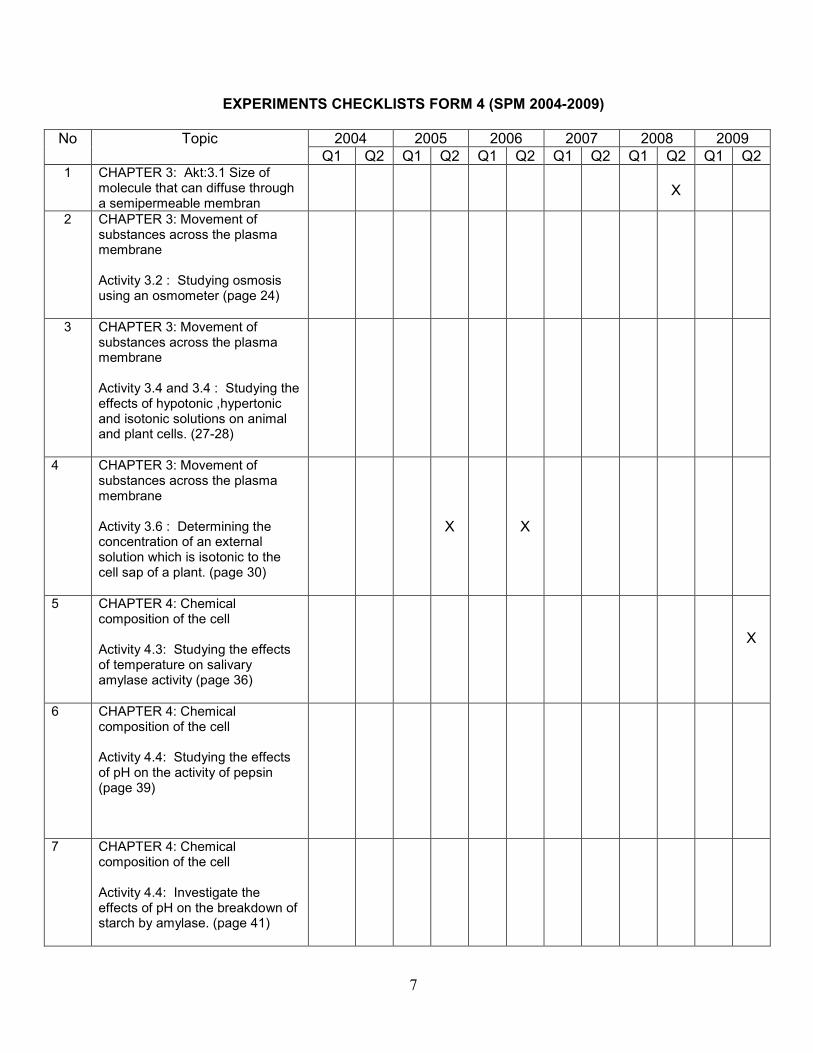
EXPERIMENTS CHECKLISTS FORM 4 (SPM 2004-2009)
No Topic 2004 2005 2006 2007 2008 2009 Q1 Q2 Q1 Q2 Q1 Q2 Q1 Q2 Q1 Q2 Q1 Q2
1 CHAPTER 3: Akt:3.1 Size of molecule that can diffuse through a semipermeable membran
X
2 CHAPTER 3: Movement of substances across the plasma membrane Activity 3.2 : Studying osmosis using an osmometer (page 24)
3 CHAPTER 3: Movement of substances across the plasma membrane Activity 3.4 and 3.4 : Studying the effects of hypotonic ,hypertonic and isotonic solutions on animal and plant cells. (27-28)
4 CHAPTER 3: Movement of substances across the plasma membrane Activity 3.6 : Determining the concentration of an external solution which is isotonic to the cell sap of a plant. (page 30)
X X
5 CHAPTER 4: Chemical composition of the cell Activity 4.3: Studying the effects of temperature on salivary amylase activity (page 36)
X
6 CHAPTER 4: Chemical composition of the cell Activity 4.4: Studying the effects of pH on the activity of pepsin (page 39)
7 CHAPTER 4: Chemical composition of the cell Activity 4.4: Investigate the effects of pH on the breakdown of starch by amylase. (page 41)
8
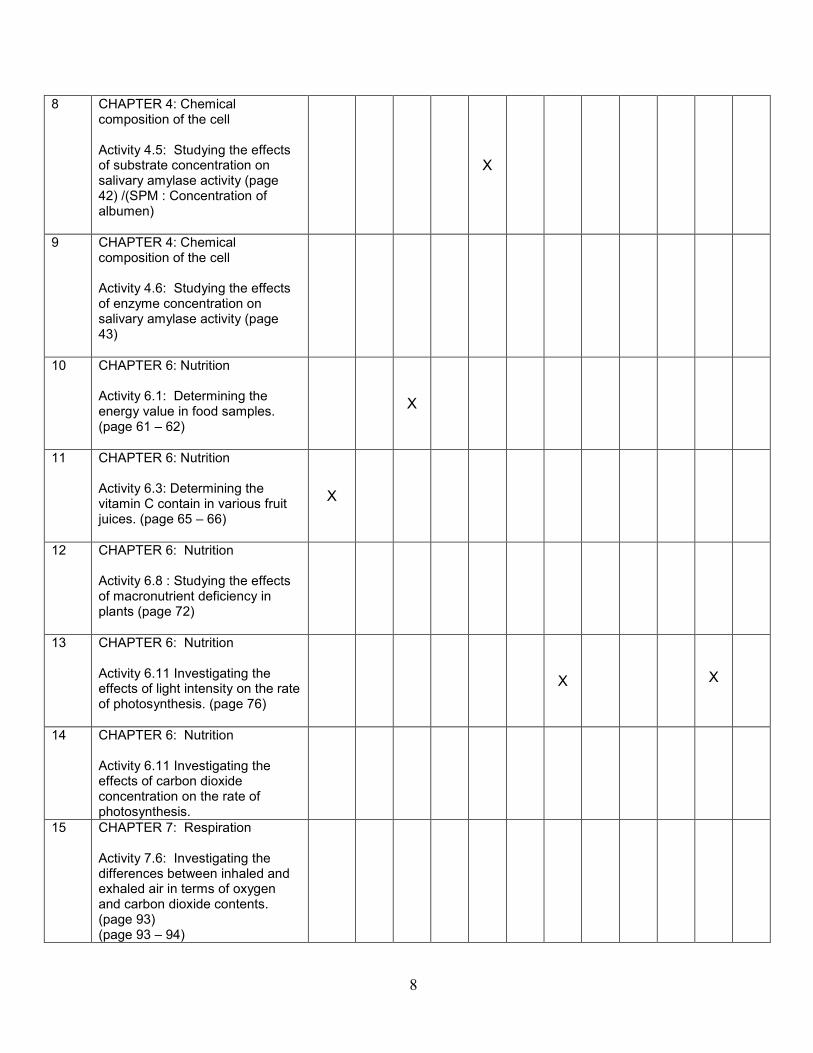
8 CHAPTER 4: Chemical composition of the cell Activity 4.5: Studying the effects of substrate concentration on salivary amylase activity (page 42) /(SPM : Concentration of albumen)
X
9 CHAPTER 4: Chemical composition of the cell Activity 4.6: Studying the effects of enzyme concentration on salivary amylase activity (page 43)
10 CHAPTER 6: Nutrition Activity 6.1: Determining the energy value in food samples. (page 61 – 62)
X
11 CHAPTER 6: Nutrition Activity 6.3: Determining the vitamin C contain in various fruit juices. (page 65 – 66)
X
12 CHAPTER 6: Nutrition Activity 6.8 : Studying the effects of macronutrient deficiency in plants (page 72)
13 CHAPTER 6: Nutrition Activity 6.11 Investigating the effects of light intensity on the rate of photosynthesis. (page 76)
X
X
14 CHAPTER 6: Nutrition Activity 6.11 Investigating the effects of carbon dioxide concentration on the rate of photosynthesis.
15 CHAPTER 7: Respiration Activity 7.6: Investigating the differences between inhaled and exhaled air in terms of oxygen and carbon dioxide contents. (page 93) (page 93 – 94)
9
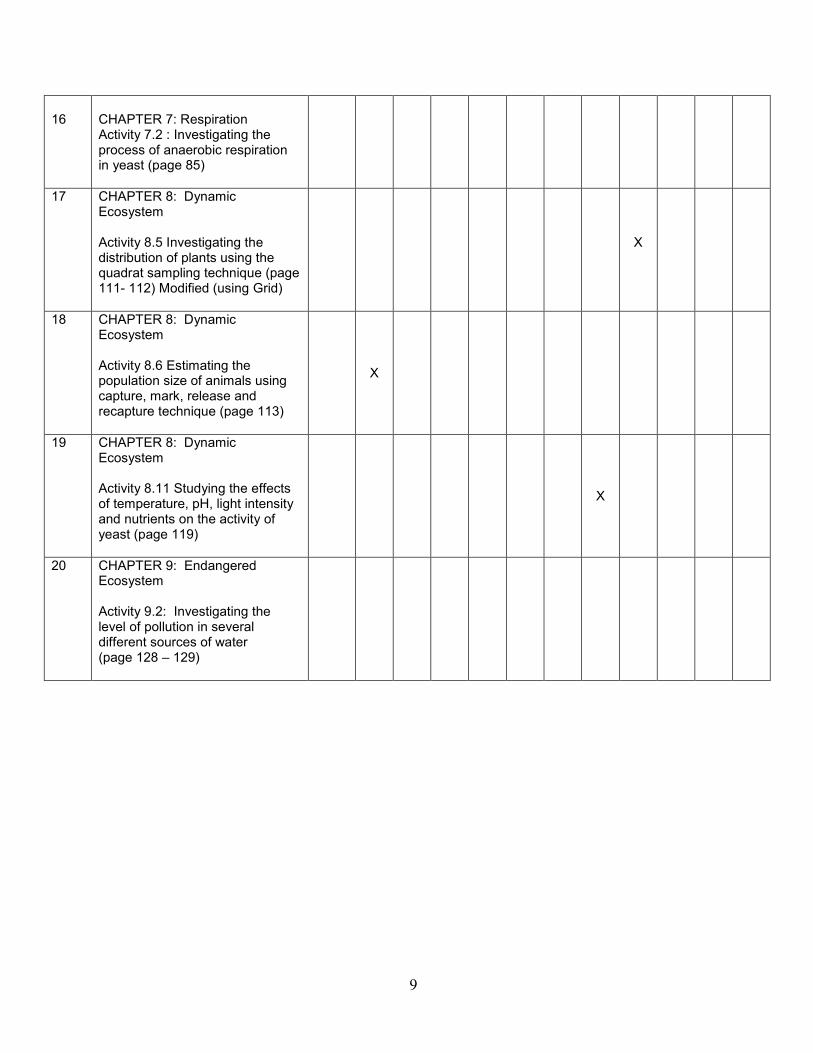
16
CHAPTER 7: Respiration Activity 7.2 : Investigating the process of anaerobic respiration in yeast (page 85)
17 CHAPTER 8: Dynamic Ecosystem Activity 8.5 Investigating the distribution of plants using the quadrat sampling technique (page 111- 112) Modified (using Grid)
X
18 CHAPTER 8: Dynamic Ecosystem Activity 8.6 Estimating the population size of animals using capture, mark, release and recapture technique (page 113)
X
19 CHAPTER 8: Dynamic Ecosystem Activity 8.11 Studying the effects of temperature, pH, light intensity and nutrients on the activity of yeast (page 119)
X
20 CHAPTER 9: Endangered Ecosystem Activity 9.2: Investigating the level of pollution in several different sources of water (page 128 – 129)
10
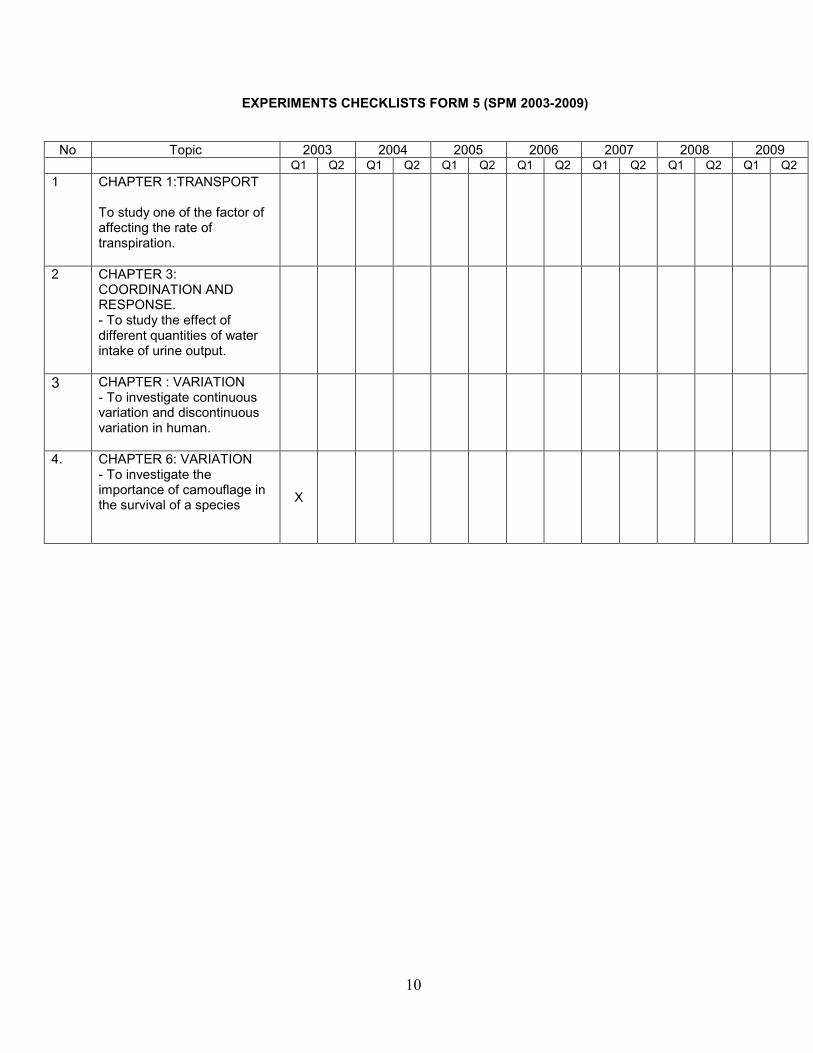
EXPERIMENTS CHECKLISTS FORM 5 (SPM 2003-2009)
No Topic 2003 2004 2005 2006 2007 2008 2009
Q1 Q2 Q1 Q2 Q1 Q2 Q1 Q2 Q1 Q2 Q1 Q2 Q1 Q2 1 CHAPTER 1:TRANSPORT
To study one of the factor of affecting the rate of transpiration.
2
CHAPTER 3: COORDINATION AND RESPONSE. - To study the effect of different quantities of water intake of urine output.
3 CHAPTER : VARIATION - To investigate continuous variation and discontinuous variation in human.
4. CHAPTER 6: VARIATION - To investigate the importance of camouflage in the survival of a species
X
11
1.4 TIPS FOR EXAM 1.4.1 Objective Question – Paper1
i. Try to answer easy questions first, followed by moderate questions and students
have enough time to answer difficult questions.
ii. Don’t take more than 11/2 minutes for each question to make sure enough time for all questions.
iii. Read the question carefully for three times to you understand what are the
questions ask.
iv. More information for each question can get from graph, table, and diagram that given.
v. Make ( / ) for true statement, reject all destructor and guess the best answer
when you are not sure the best answer.
vi. Make sure answer all the questions and remark all the answer and make sure:
* One question only one answer.
* Deleted wrong answer completely * Used 2B pencil. Vii Examples of questions form for paper 1 * Remember the fact * Making conclusion * Application * Observation * Knowlegment * Comparisons * Identify the problem * Calculation
12
1.4.2 Subjective Question
Encourage the students to review the essay question first (Part B Paper2 ),before
answer the structure question, this because students will have enough time to think some facts or explaination.
Almost structure questions based on diagram, table, data, flow chart, graph that suitable with fact, experiment or investigation. Understand all the information given.
Time suggestion to answer Paper 2: Part A ( 90 minutes ), Part B ( 60 minutes ), for
Paper 3 : Question 1 ( 50 minutes ) and Question 2 ( 40 minutes )
Answer in one word, one number or one simple sentence
Don’t combine the right fact with the wrong fact
Follow the instruction like : Give two examples of……., so students should give only two examples, the third example will not get the mark.
No need write in long sentence or copy again part of the question.
Answer can be in equations form, diagram, table or graph. Calculation must be
show.
Space for write the answers and mark at end of the essays or structure questions are given will show how long the answer must be write.
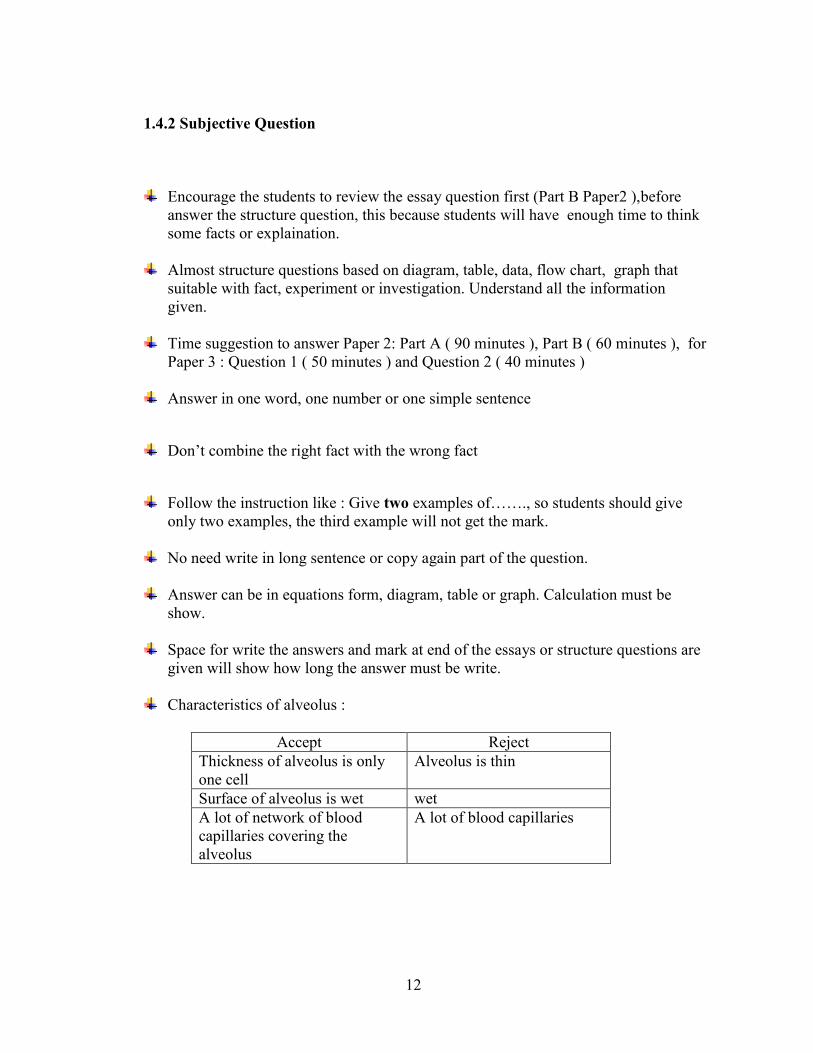
Characteristics of alveolus :
Accept Reject
Thickness of alveolus is only one cell
Alveolus is thin
Surface of alveolus is wet wet A lot of network of blood capillaries covering the alveolus
A lot of blood capillaries
13
Instruction verb like justification, evaluation, give your opinion, Students must state like ‘ I agree / I accept / I’m not agree / I’m not accept that
statement given ( 1 mark ) and followed by opinion
Draw a diagram
* No artistic
* Big (suitable size), clear, * Label the diagram correctly and line for label can’t be cross together * Neat and without broken lines
Draw a enzyme structure: Size and shape of the enzyme must same with the original
Comparison - Must have similarities and differences
- One characteristic must compare between two subject in one sentence - Separate sentence between similarities and differences - If answer in table, must write in full sentence
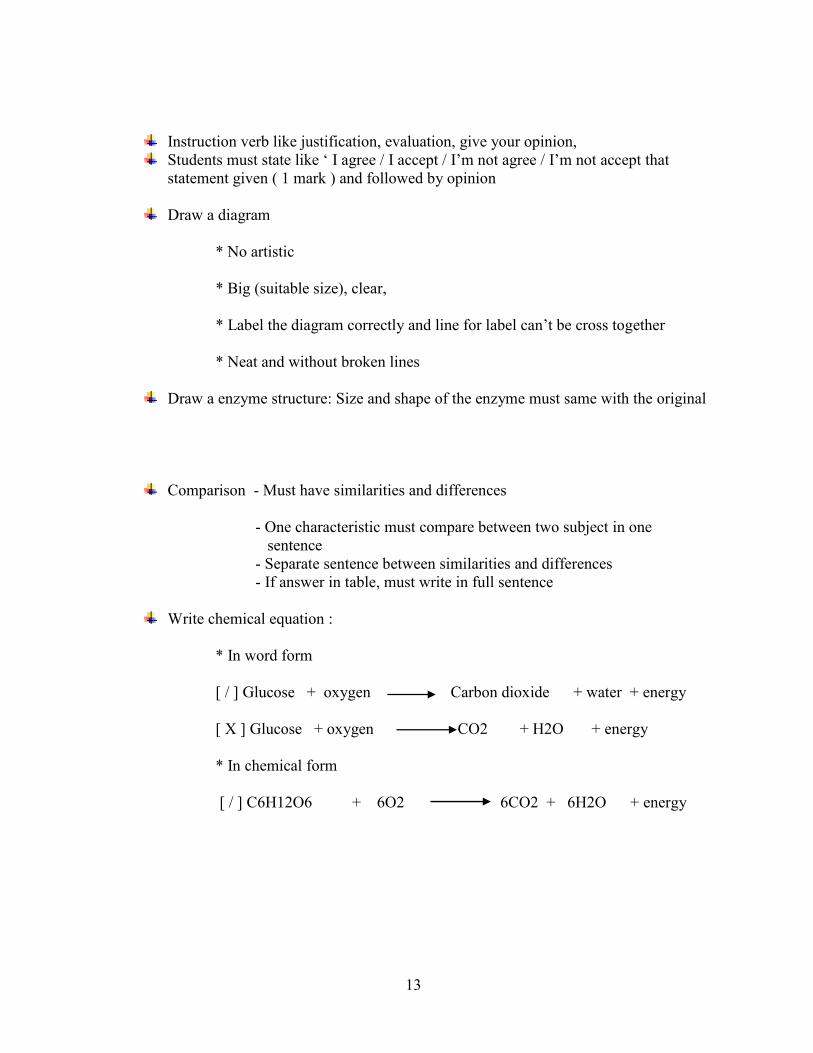
Write chemical equation :
* In word form [ / ] Glucose + oxygen Carbon dioxide + water + energy [ X ] Glucose + oxygen CO2 + H2O + energy * In chemical form [ / ] C6H12O6 + 6O2 6CO2 + 6H2O + energy
14
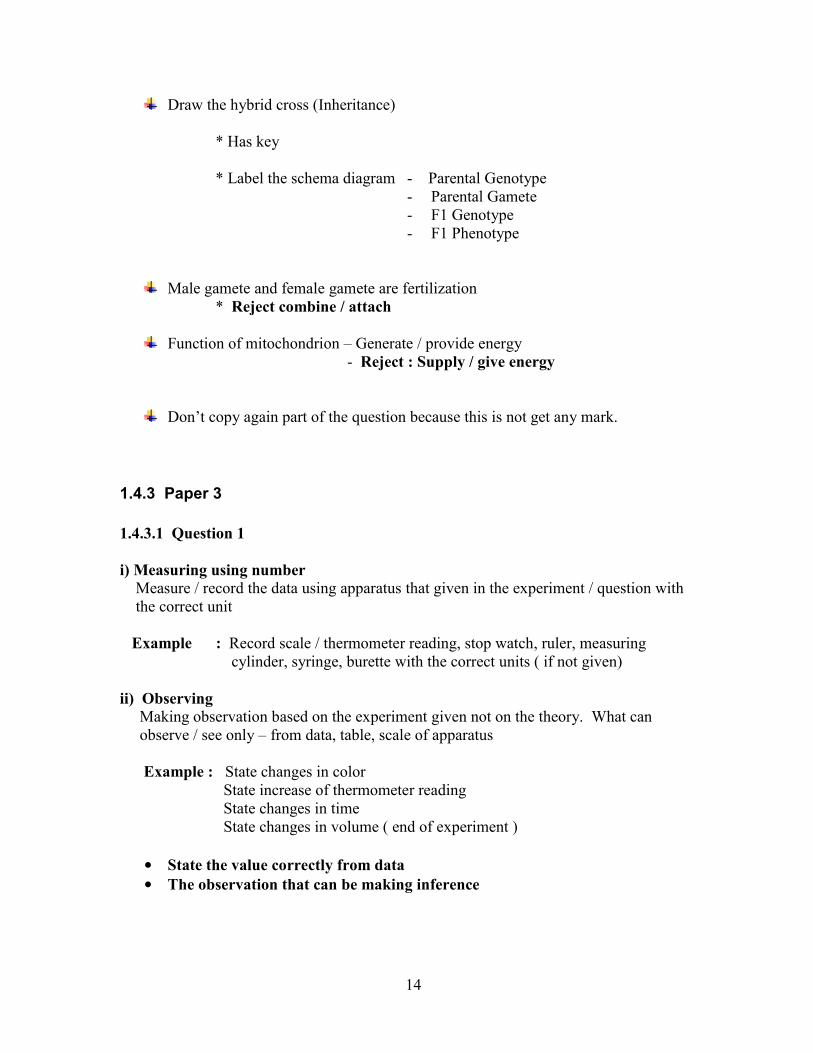
Draw the hybrid cross (Inheritance)
* Has key * Label the schema diagram - Parental Genotype
- Parental Gamete - F1 Genotype - F1 Phenotype
Male gamete and female gamete are fertilization * Reject combine / attach
Function of mitochondrion – Generate / provide energy
- Reject : Supply / give energy
Don’t copy again part of the question because this is not get any mark.
1.4.3 Paper 3 1.4.3.1 Question 1 i) Measuring using number Measure / record the data using apparatus that given in the experiment / question with the correct unit Example : Record scale / thermometer reading, stop watch, ruler, measuring cylinder, syringe, burette with the correct units ( if not given) ii) Observing Making observation based on the experiment given not on the theory. What can observe / see only – from data, table, scale of apparatus Example : State changes in color State increase of thermometer reading State changes in time State changes in volume ( end of experiment )
• State the value correctly from data • The observation that can be making inference
15
iii) Making Inferences - Making initial conclusion / cause based on observation - Inferences must be correspond with the observation ( inference (i) correspond with
observation (i) , inference (ii) correspond with observation (ii)
If wrong / reject observation automatic inference will reject / wrong iv) Controlling Variables
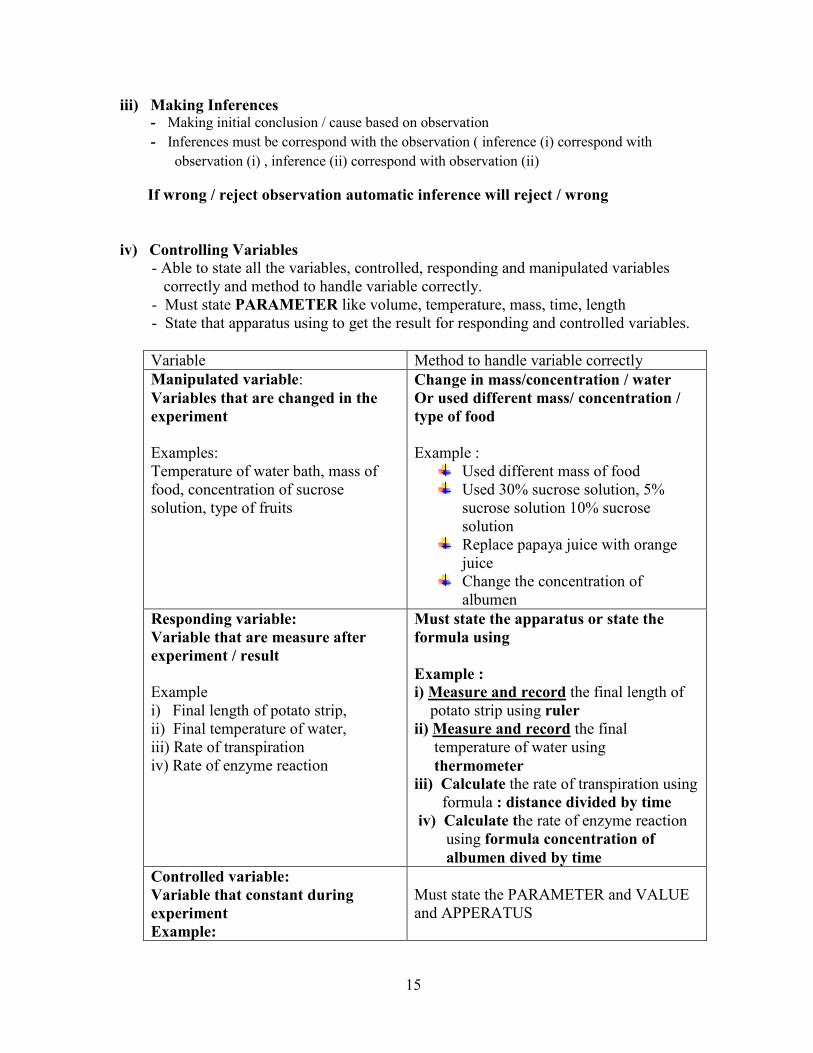
- Able to state all the variables, controlled, responding and manipulated variables correctly and method to handle variable correctly. - Must state PARAMETER like volume, temperature, mass, time, length - State that apparatus using to get the result for responding and controlled variables.
Variable Method to handle variable correctly Manipulated variable: Variables that are changed in the experiment Examples: Temperature of water bath, mass of food, concentration of sucrose solution, type of fruits
Change in mass/concentration / water Or used different mass/ concentration / type of food Example :
Used different mass of food Used 30% sucrose solution, 5%
sucrose solution 10% sucrose solution
Replace papaya juice with orange juice
Change the concentration of albumen
Responding variable: Variable that are measure after experiment / result Example i) Final length of potato strip, ii) Final temperature of water, iii) Rate of transpiration iv) Rate of enzyme reaction
Must state the apparatus or state the formula using Example : i) Measure and record the final length of potato strip using ruler ii) Measure and record the final temperature of water using thermometer iii) Calculate the rate of transpiration using formula : distance divided by time iv) Calculate the rate of enzyme reaction using formula concentration of albumen dived by time
Controlled variable: Variable that constant during experiment Example:
Must state the PARAMETER and VALUE and APPERATUS
16
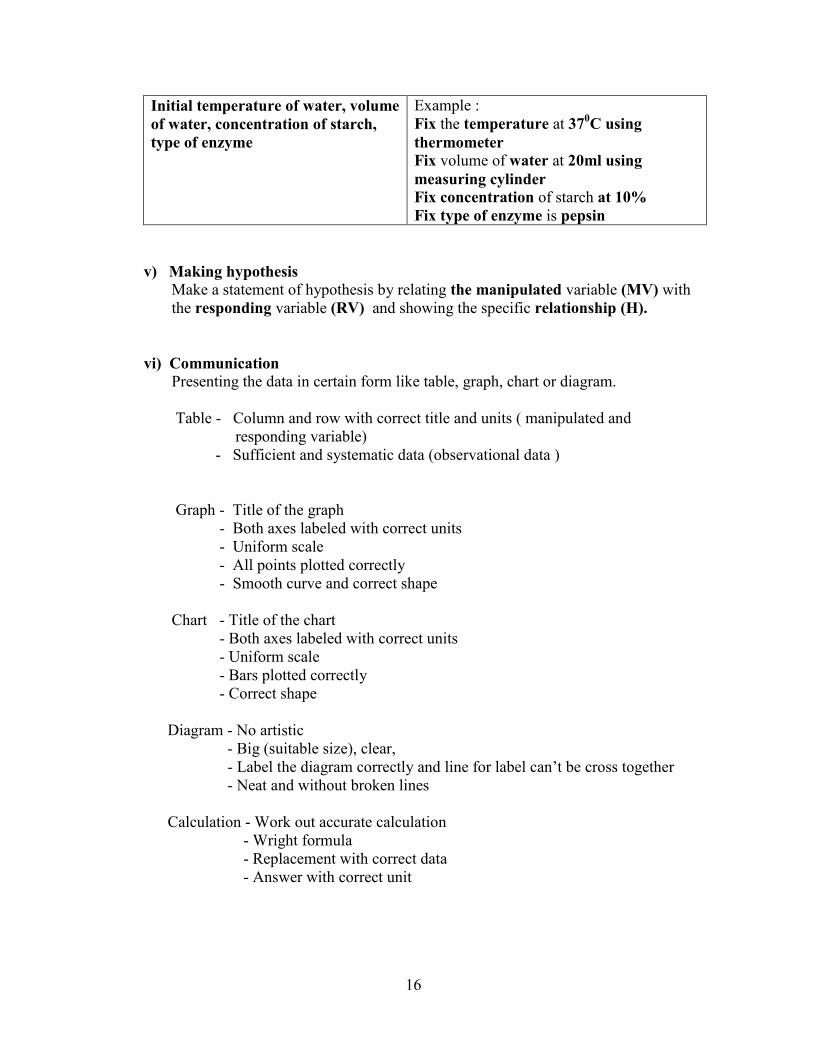
Initial temperature of water, volume of water, concentration of starch, type of enzyme
Example : Fix the temperature at 370C using thermometer Fix volume of water at 20ml using measuring cylinder Fix concentration of starch at 10% Fix type of enzyme is pepsin
v) Making hypothesis Make a statement of hypothesis by relating the manipulated variable (MV) with the responding variable (RV) and showing the specific relationship (H).
vi) Communication
Presenting the data in certain form like table, graph, chart or diagram. Table - Column and row with correct title and units ( manipulated and responding variable) - Sufficient and systematic data (observational data ) Graph - Title of the graph - Both axes labeled with correct units - Uniform scale - All points plotted correctly - Smooth curve and correct shape Chart - Title of the chart - Both axes labeled with correct units - Uniform scale - Bars plotted correctly - Correct shape
Diagram - No artistic - Big (suitable size), clear, - Label the diagram correctly and line for label can’t be cross together - Neat and without broken lines Calculation - Work out accurate calculation - Wright formula - Replacement with correct data - Answer with correct unit
17
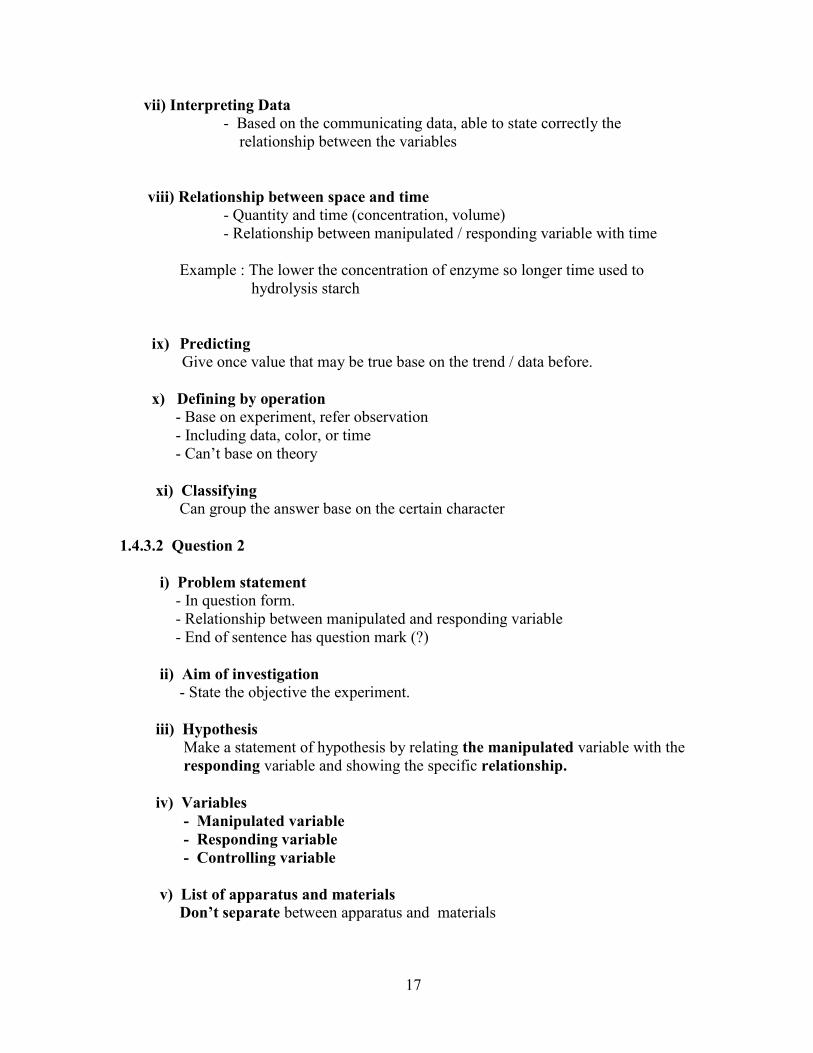
vii) Interpreting Data - Based on the communicating data, able to state correctly the relationship between the variables
viii) Relationship between space and time - Quantity and time (concentration, volume) - Relationship between manipulated / responding variable with time Example : The lower the concentration of enzyme so longer time used to hydrolysis starch
ix) Predicting Give once value that may be true base on the trend / data before.
x) Defining by operation - Base on experiment, refer observation - Including data, color, or time - Can’t base on theory
xi) Classifying
Can group the answer base on the certain character 1.4.3.2 Question 2
i) Problem statement - In question form. - Relationship between manipulated and responding variable - End of sentence has question mark (?) ii) Aim of investigation - State the objective the experiment. iii) Hypothesis
Make a statement of hypothesis by relating the manipulated variable with the responding variable and showing the specific relationship. iv) Variables - Manipulated variable - Responding variable - Controlling variable v) List of apparatus and materials Don’t separate between apparatus and materials
18
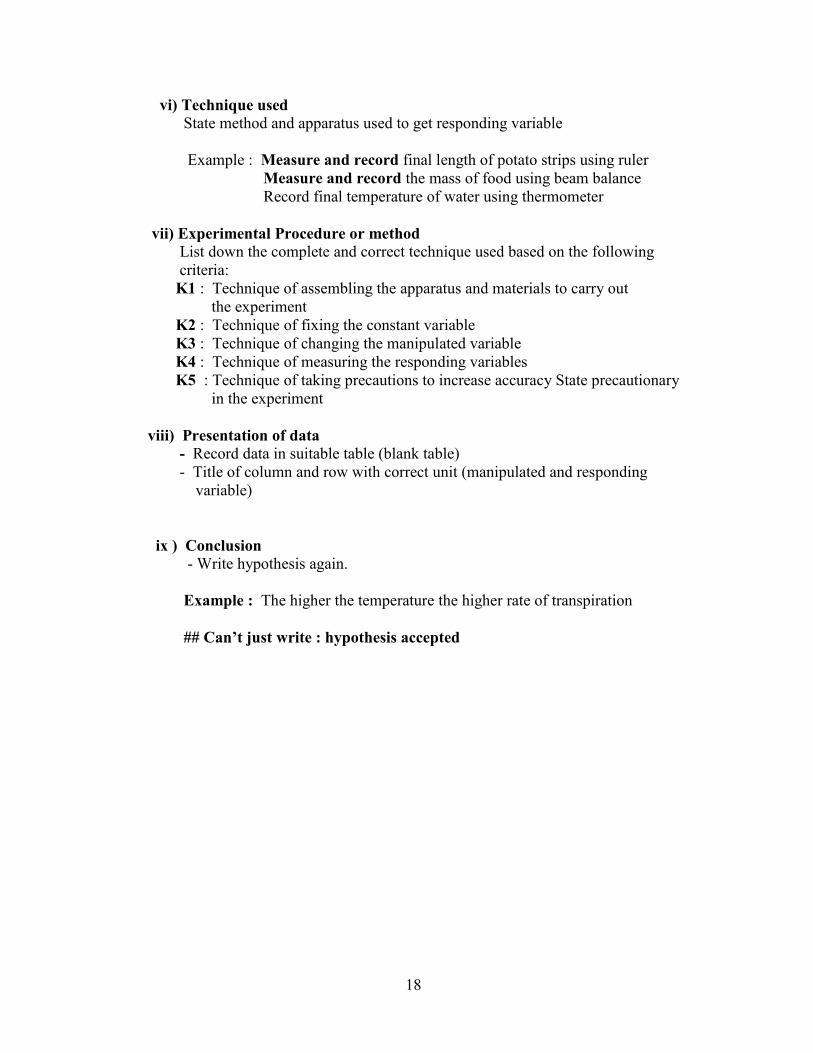
vi) Technique used State method and apparatus used to get responding variable Example : Measure and record final length of potato strips using ruler Measure and record the mass of food using beam balance Record final temperature of water using thermometer vii) Experimental Procedure or method List down the complete and correct technique used based on the following criteria:
K1 : Technique of assembling the apparatus and materials to carry out the experiment K2 : Technique of fixing the constant variable K3 : Technique of changing the manipulated variable K4 : Technique of measuring the responding variables K5 : Technique of taking precautions to increase accuracy State precautionary in the experiment viii) Presentation of data - Record data in suitable table (blank table) - Title of column and row with correct unit (manipulated and responding variable) ix ) Conclusion - Write hypothesis again. Example : The higher the temperature the higher rate of transpiration ## Can’t just write : hypothesis accepted
19
1.5 PAPER 2 – SPM 2009
Section A
[60 marks]
Answer all questions in this section
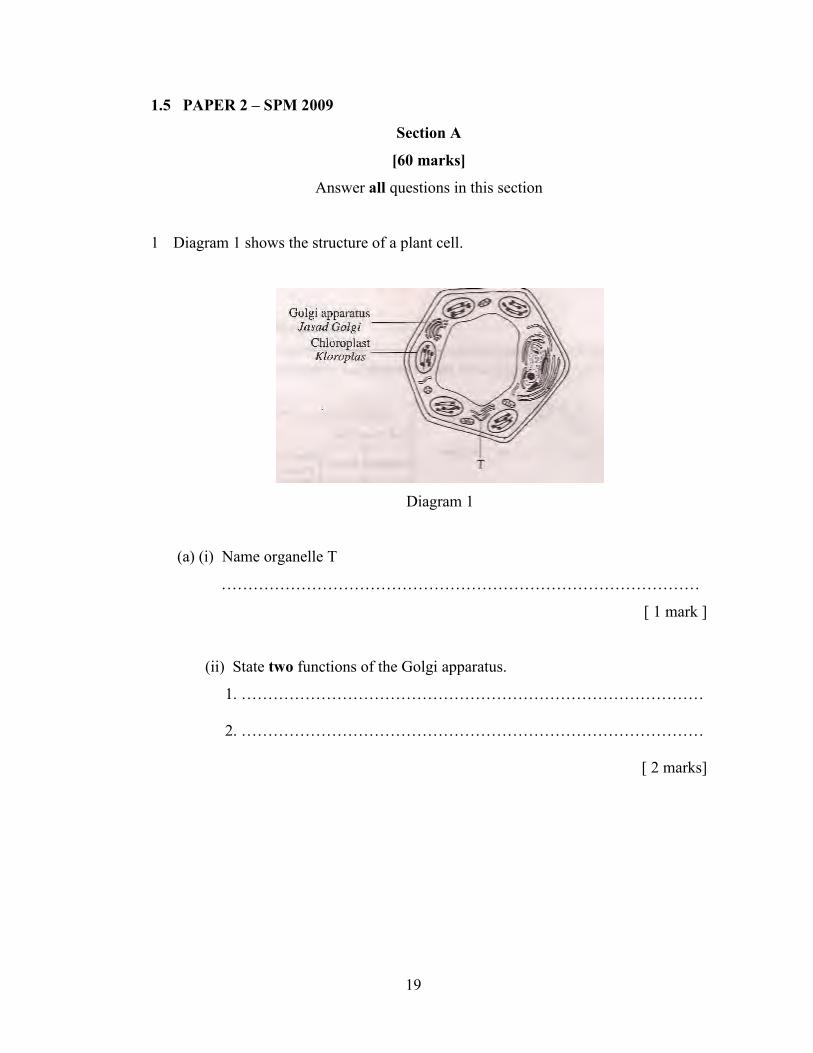
1 Diagram 1 shows the structure of a plant cell.
Diagram 1
(a) (i) Name organelle T
………………………………………………………………………………
[ 1 mark ]
(ii) State two functions of the Golgi apparatus.
1. ……………………………………………………………………………
2. ……………………………………………………………………………
[ 2 marks]
20
(b) (i) Name the structure in the chloroplast which is involve in the light
reaction of photosynthesis.
………………………………………………………………………….
[ 1 mark ]
(ii) Describe briefly the function of chloroplast in photosynthesis.
…………………………………………………………………………
…………………………………………………………………………
…………………………………………………………………………
[ 2 marks ]
( c) A housewife decided to make salted cabbage. She immersed the cabbage
in concentrated salt solution for a certain period of time.
(i) Draw a labeled diagram of the condition of one of the cabbage cells
after being immersed in the concentrated salt solution.
[ 2 marks ]
21
(iii) What has happened to the cell in the concentrated salt solution?
Explain how this happened.
…………………………………..………………………………………
………………………………..…………………………………………
…………………………………..………………………………………
………………………………..…………………………………………
…………………………………..………………………………………
[ 4 marks ]
22
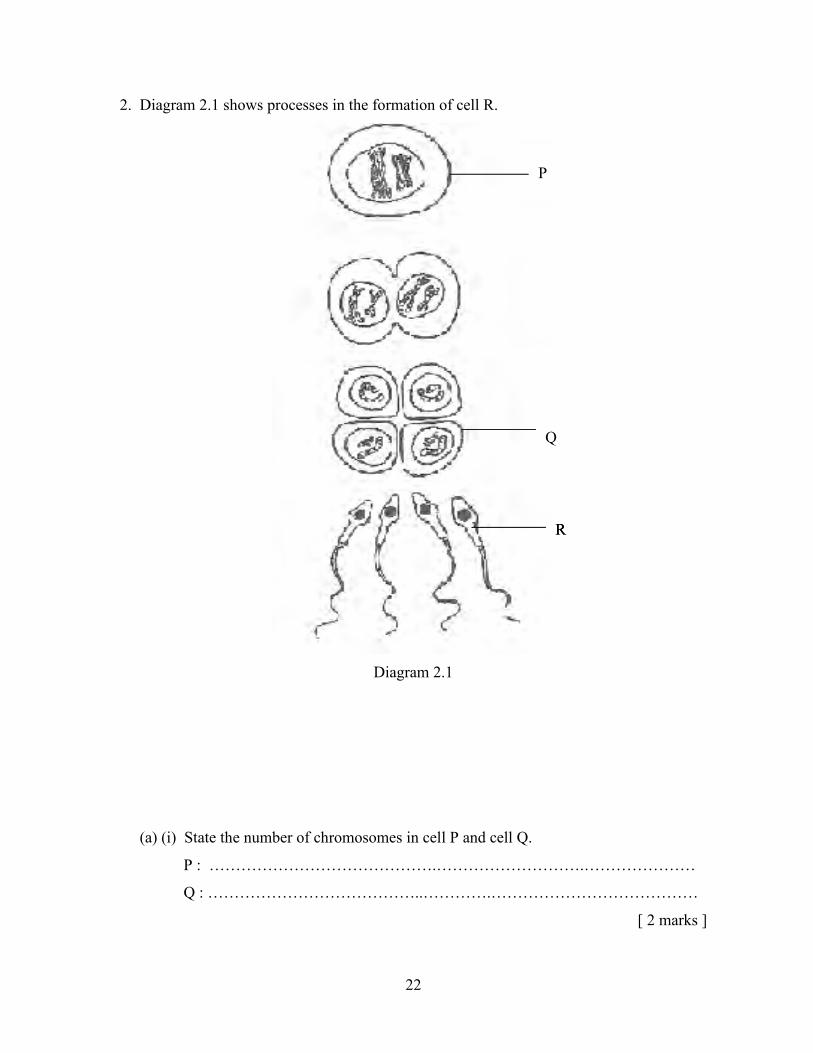
2. Diagram 2.1 shows processes in the formation of cell R.
Diagram 2.1
(a) (i) State the number of chromosomes in cell P and cell Q.
P : …………………………………….……………………….…………………
Q : …………………………………..………….…………………………………
[ 2 marks ]
R
P
Q
R
23
(ii) Explain what has happened to cause the difference in chromosome number
between cell P and cell Q.
………………………….………..…….…..………………………………………
……………………….………………….…………………………………………
………………………….…………………..………………………………………
[ 2 mark ]
(b) (i) In which organ does cell R is formed?
………………………….…………………..………………………………………
[ 1 mark ]
(ii) Name the process of the formation of cell R.
………………………….…………………..………………………………………
[ 1 mark ]
24
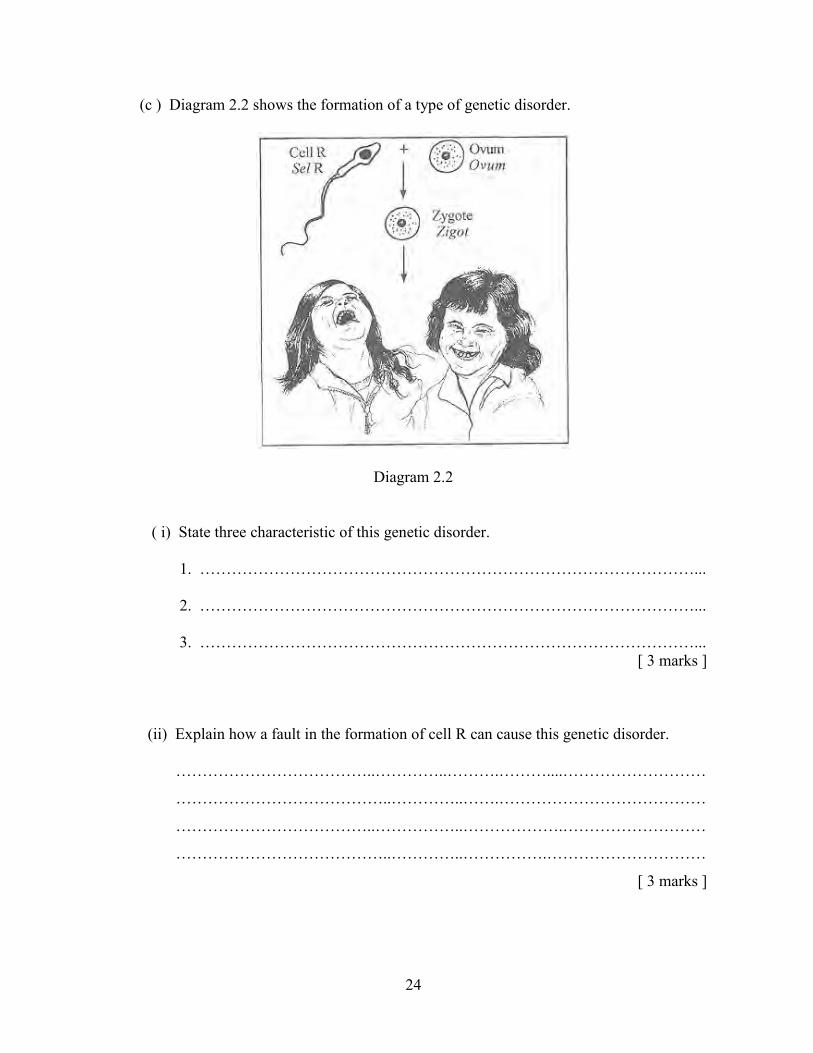
(c ) Diagram 2.2 shows the formation of a type of genetic disorder.
Diagram 2.2 ( i) State three characteristic of this genetic disorder. 1. …………………………………………………………………………………... 2. …………………………………………………………………………………... 3. …………………………………………………………………………………...
[ 3 marks ]
(ii) Explain how a fault in the formation of cell R can cause this genetic disorder. ………………………………..…………..……….………....………………………
…………………………………..…………..…….…………………………………
………………………………..……………..……………….………………………
…………………………………..…………..…………….…………………………
[ 3 marks ]
25
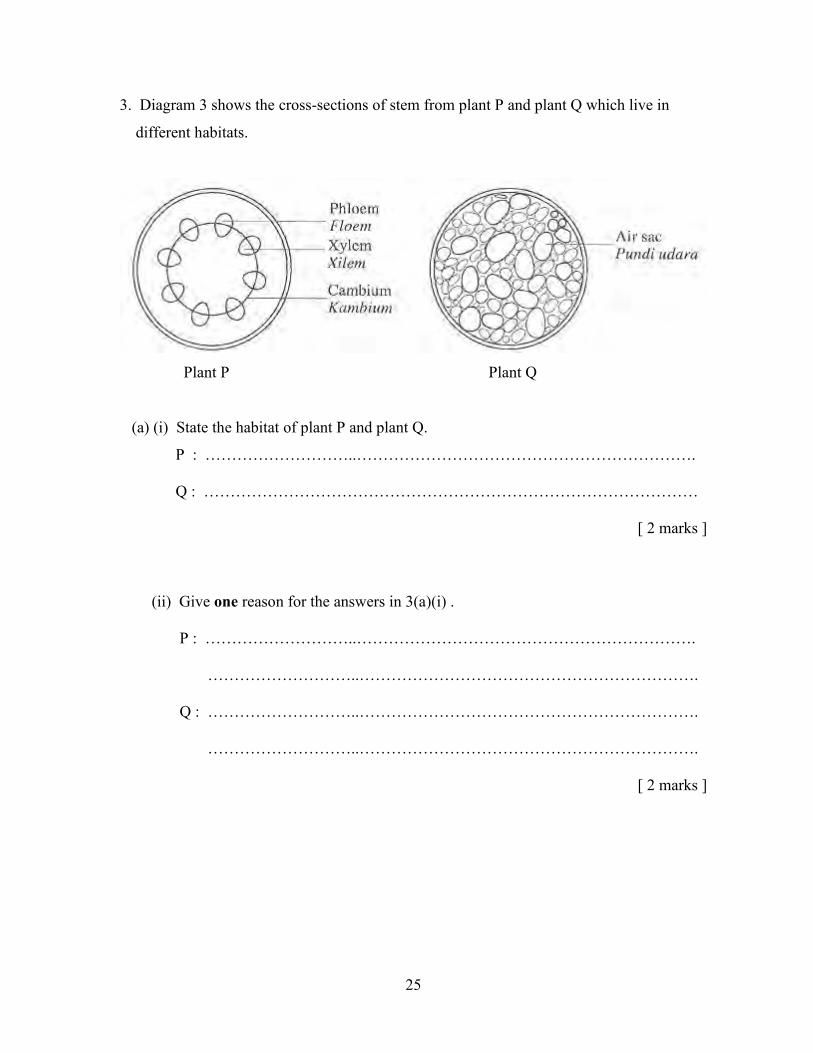
3. Diagram 3 shows the cross-sections of stem from plant P and plant Q which live in
different habitats.
Plant P Plant Q
(a) (i) State the habitat of plant P and plant Q.
P : ………………………..……………………………………………………….
Q : …………………………………………………………………………………
[ 2 marks ]
(ii) Give one reason for the answers in 3(a)(i) .
P : ………………………..……………………………………………………….
………………………..……………………………………………………….
Q : ………………………..……………………………………………………….
………………………..……………………………………………………….
[ 2 marks ]
26
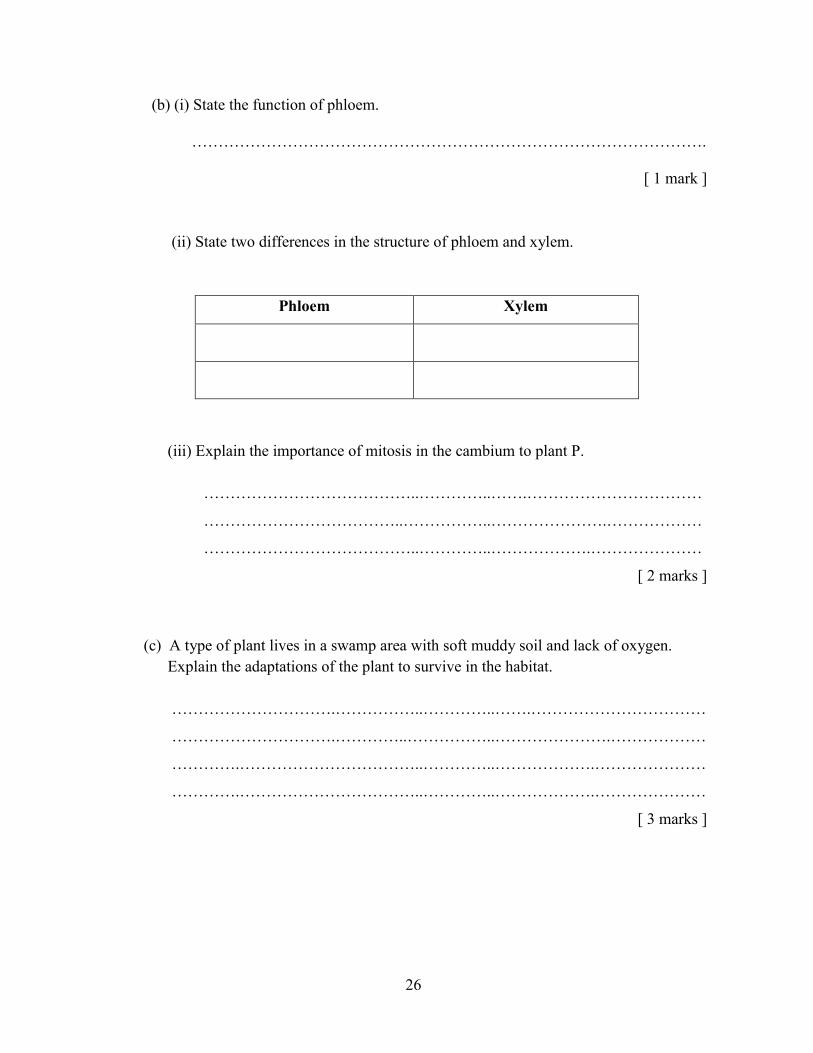
(b) (i) State the function of phloem.
…………………………………………………………………………………….
[ 1 mark ]
(ii) State two differences in the structure of phloem and xylem.
Phloem Xylem
(iii) Explain the importance of mitosis in the cambium to plant P. …………………………………..…………..…….……………………………
………………………………..……………..………………….………………
…………………………………..…………..……………….…………………
[ 2 marks ]
(c) A type of plant lives in a swamp area with soft muddy soil and lack of oxygen. Explain the adaptations of the plant to survive in the habitat. ………………………….……………..…………..…….……………………………
………………………….…………..……………..………………….………………
………….……………………………..…………..……………….…………………
………….……………………………..…………..……………….…………………
[ 3 marks ]
27
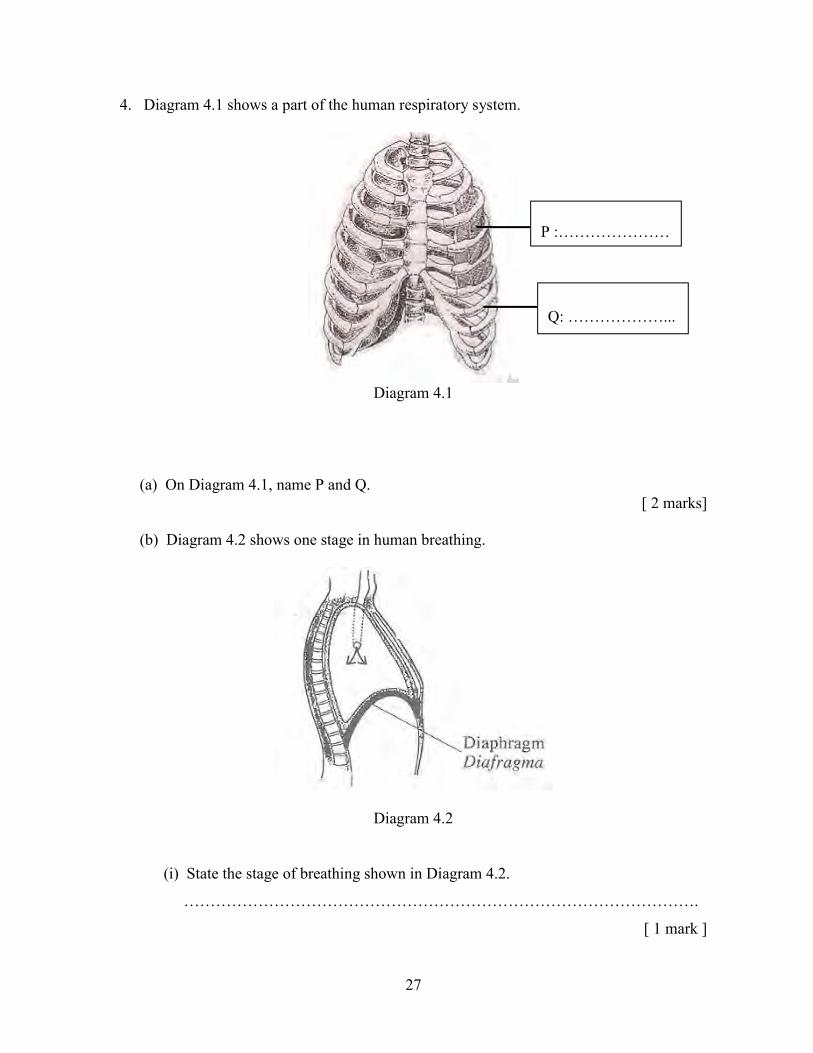
4. Diagram 4.1 shows a part of the human respiratory system.
Diagram 4.1
(a) On Diagram 4.1, name P and Q.
[ 2 marks]
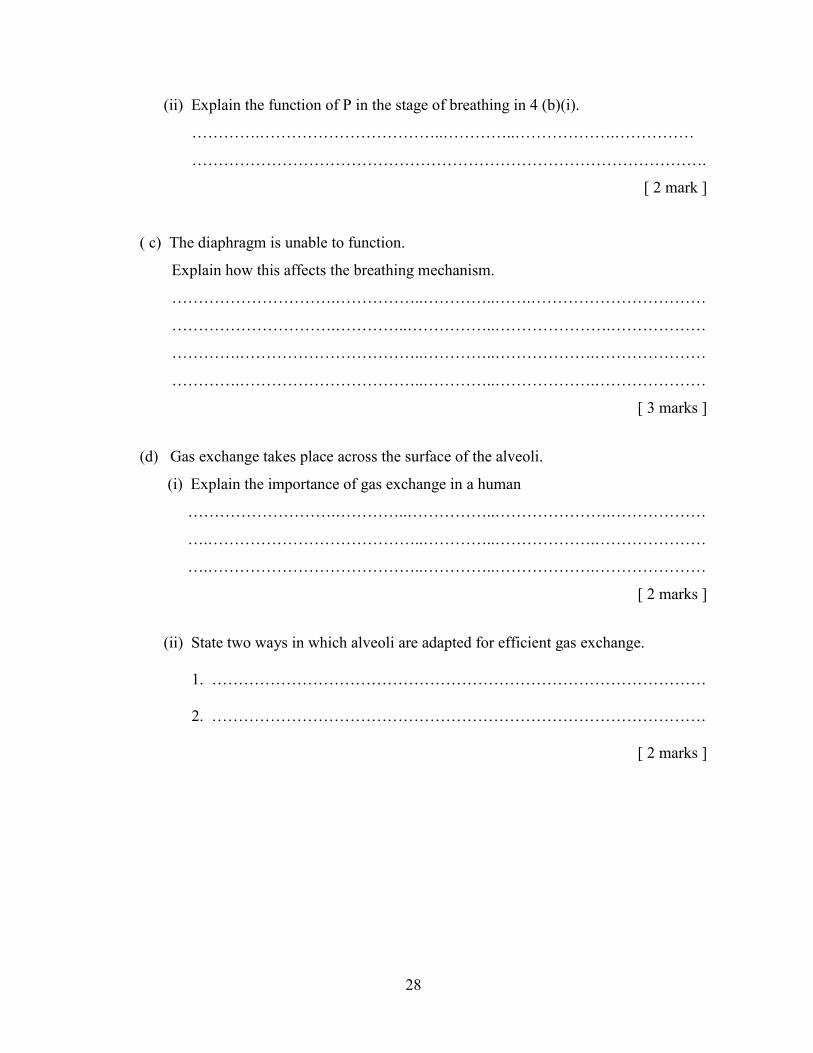
(b) Diagram 4.2 shows one stage in human breathing.
Diagram 4.2 (i) State the stage of breathing shown in Diagram 4.2.
…………………………………………………………………………………….
[ 1 mark ]
P :…………………
Q: ………………...
28
(ii) Explain the function of P in the stage of breathing in 4 (b)(i).
………….……………………………..…………..……………….……………
…………………………………………………………………………………….
[ 2 mark ]
( c) The diaphragm is unable to function.
Explain how this affects the breathing mechanism.
………………………….……………..…………..…….……………………………
………………………….…………..……………..………………….………………
………….……………………………..…………..……………….…………………
………….……………………………..…………..……………….…………………
[ 3 marks ]
(d) Gas exchange takes place across the surface of the alveoli.
(i) Explain the importance of gas exchange in a human
……………………….…………..……………..………………….………………
….…………………………………..…………..……………….…………………
….…………………………………..…………..……………….…………………
[ 2 marks ]
(ii) State two ways in which alveoli are adapted for efficient gas exchange.
1. …………………………………………………………………………………
2. …………………………………………………………………………………
[ 2 marks ]
29
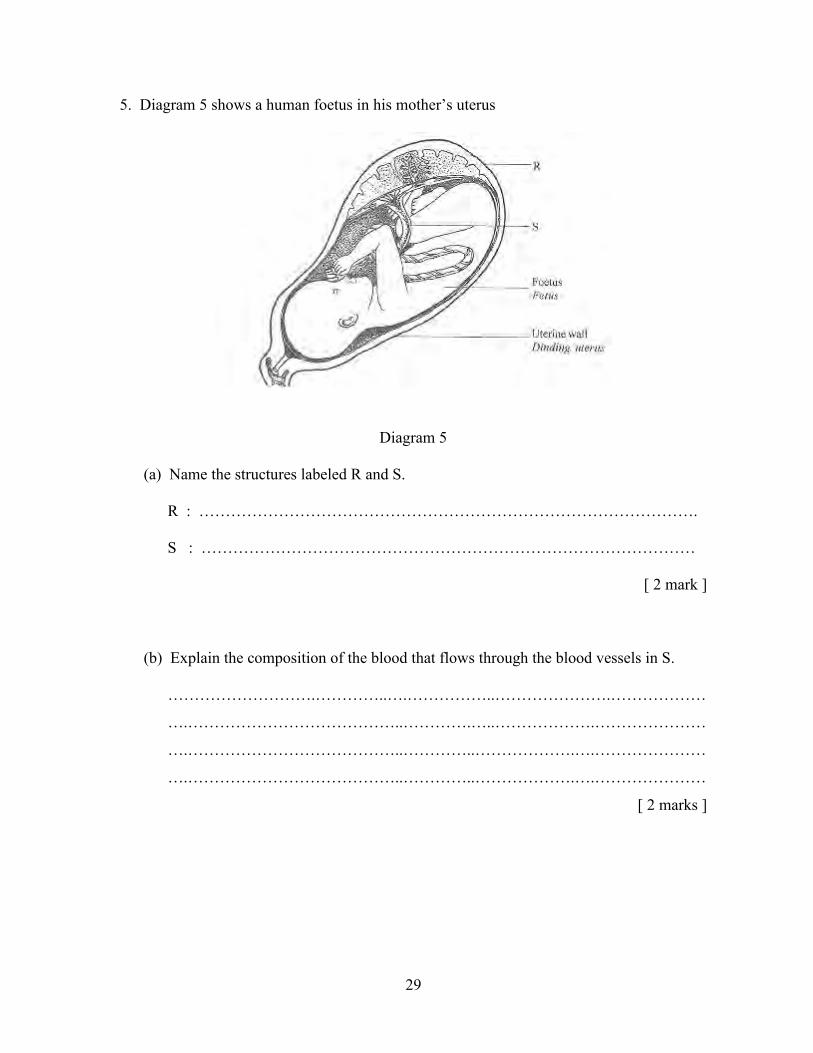
5. Diagram 5 shows a human foetus in his mother’s uterus
Diagram 5
(a) Name the structures labeled R and S. R : ………………………………………………………………………………….
S : …………………………………………………………………………………
[ 2 mark ]
(b) Explain the composition of the blood that flows through the blood vessels in S.
……………………….…………..….……………..………………….………………
….…………………………………..………….…..……………….…………………
….…………………………………..…………..……………….….…………………
….…………………………………..…………..……………….….…………………
[ 2 marks ]
30
(c ) The structure R is needed to maintain the thickness of the uterine wall. Explain this statement.
….…………………………………..………….…..……………….………………
….…………………………………..…………..……………….….………………
….……………………………………...…………..……………….….……………
[ 2 marks ]
(d) (i) State the type of immunity the foetus gets from his mother.
……….……………………………………………………………………………
[ 1 mark ] (ii) Explain the importance of structure R to body defence of the foetus.
………………………….……………..…………..…….………………………
………………………….…………..………………..………………….………
………….……………………………..…………..……………….……………
………….………………………………..…………..……………….…………
[ 3 marks ]
(e) Explain why the foetus has s separate blood circulatory system from his mother.
….…………………………………..………….…..……………….……….………
….…………………………………..…………..……………….….….……………
….……………………………………...…………..……………….….……………
[ 2 marks ]
31
Section B
Answer any two questions from this section
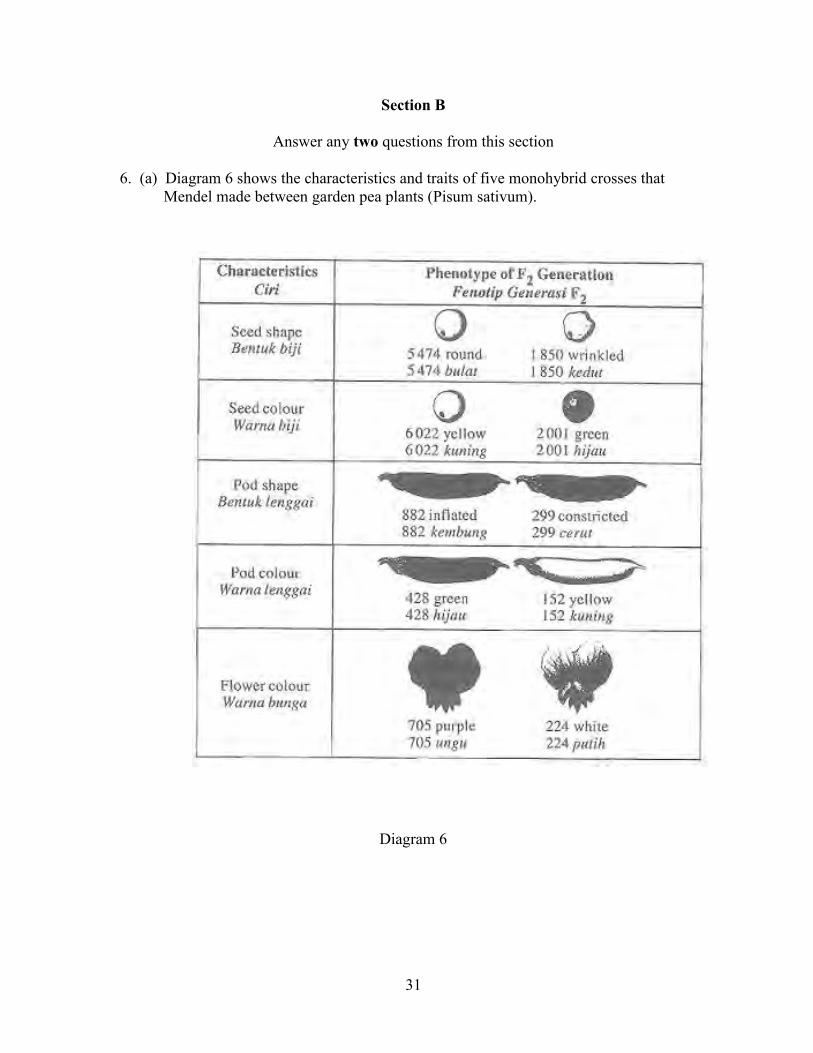
6. (a) Diagram 6 shows the characteristics and traits of five monohybrid crosses that Mendel made between garden pea plants (Pisum sativum).
Diagram 6
32
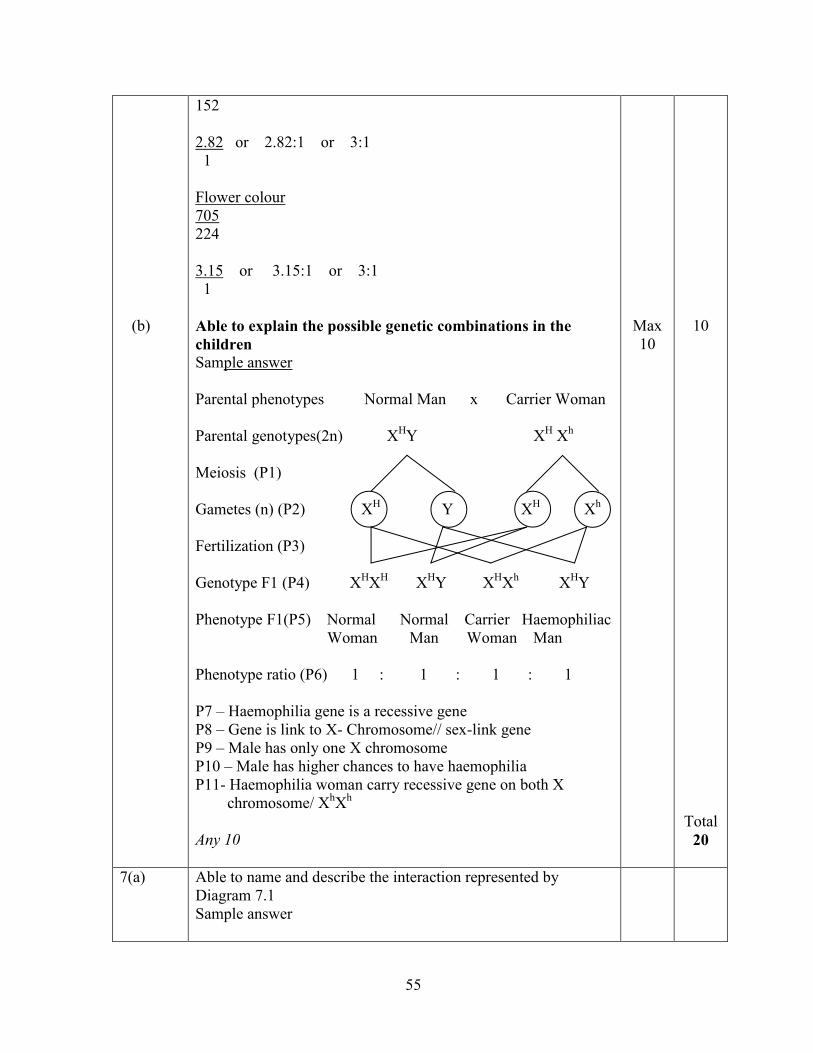
Based on Diagram 6, (i) identify and name the characteristics and traits studied, [ 4 marks ] (ii) calculate the ratio phenotype dominant to phenotype recessive for any three of the characteristics shown. [ 6 marks ] (b) A normal man ( XHY ) has a wife (XHXh) who a carried of haemophilia. Using a schematic diagram, explain the possible genetic combinations in their children. [ 10 marks ]
33
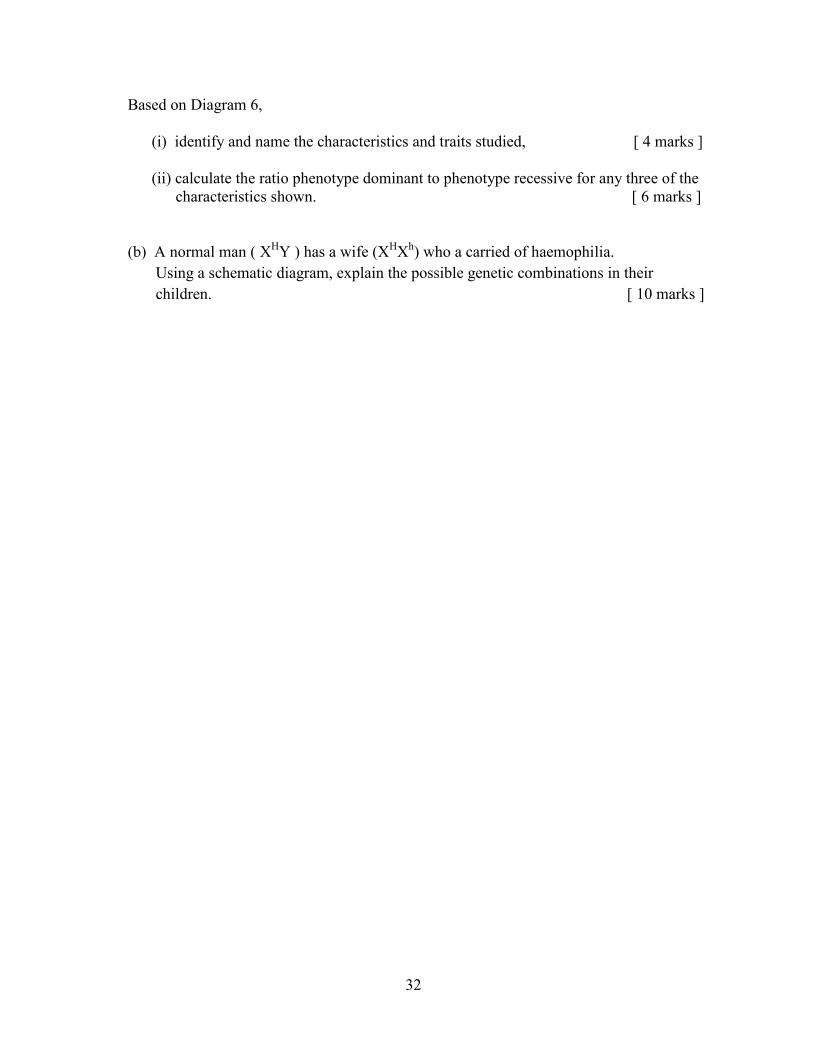
7. (a) Diagram 7.1 shows a type of interaction between organisms.
Diagram 7.1
Name and describe the interaction shown in Diagram 7.1. [ 4 marks ] (b) A farmer found that when the number of mice increases, the yield of palm fruits decreases. Suggest how the farmer can control the population of mice without use of pesticides. Explain how the method works. [ 5 marks ]
34
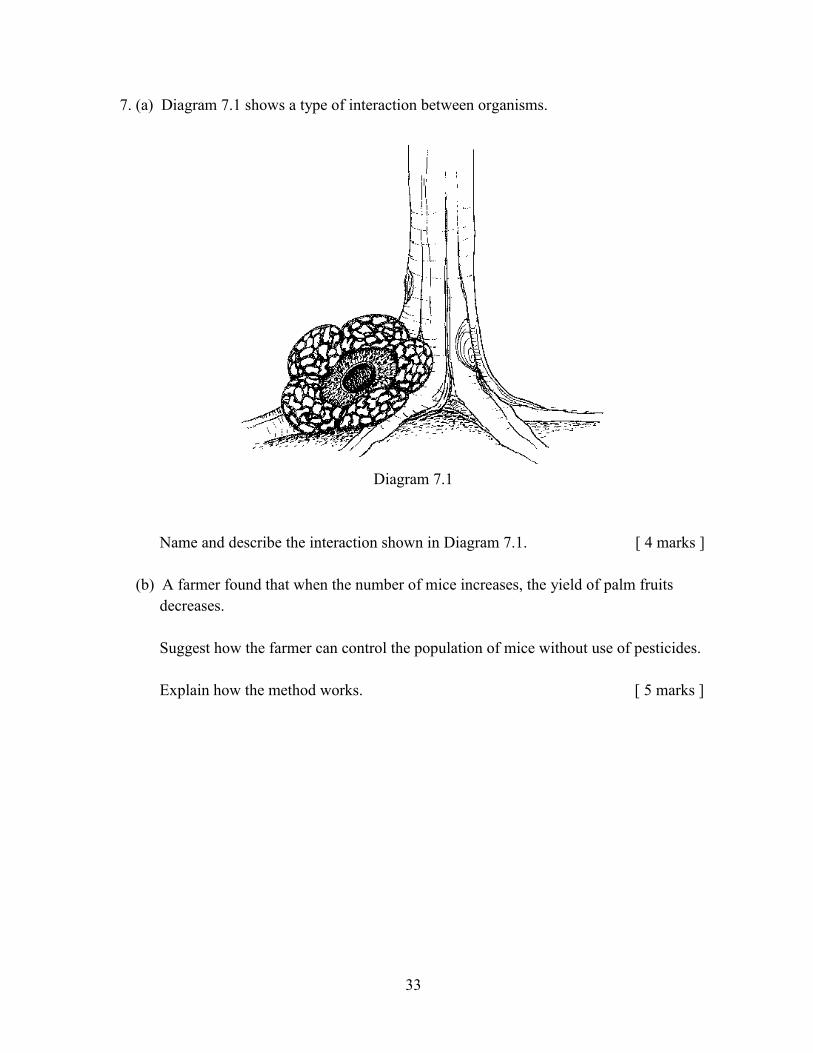
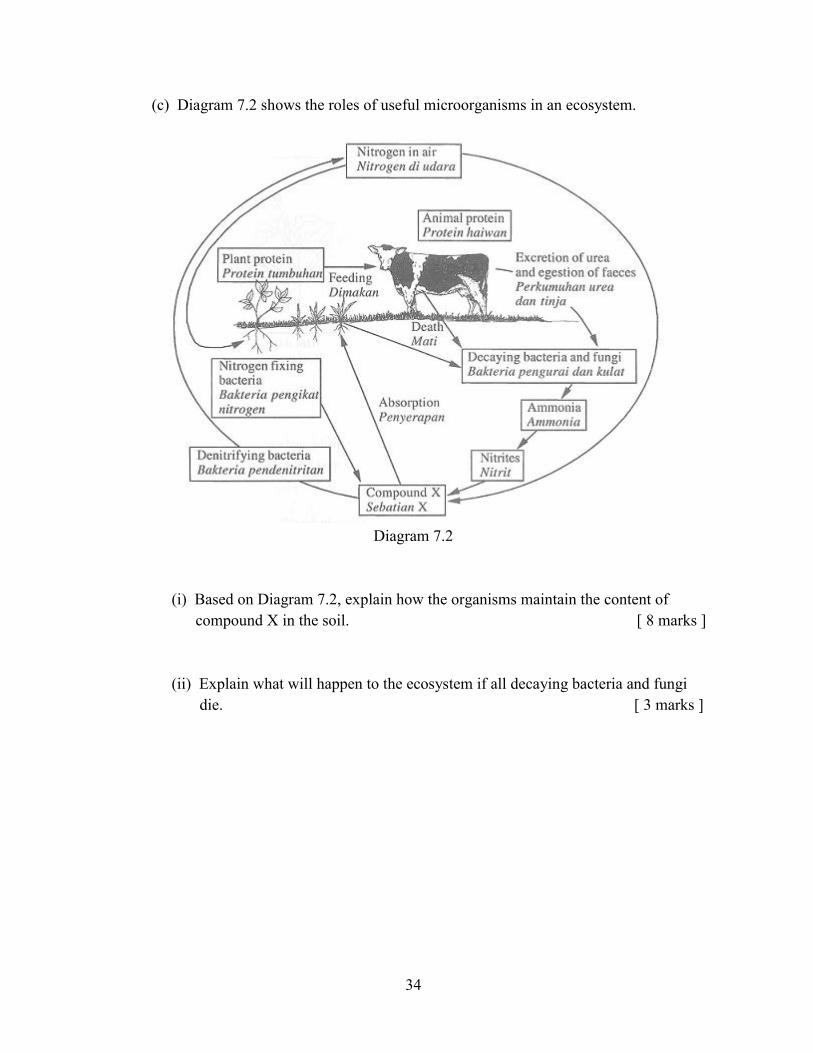
(c) Diagram 7.2 shows the roles of useful microorganisms in an ecosystem.
Diagram 7.2
(i) Based on Diagram 7.2, explain how the organisms maintain the content of compound X in the soil. [ 8 marks ] (ii) Explain what will happen to the ecosystem if all decaying bacteria and fungi die. [ 3 marks ]
35
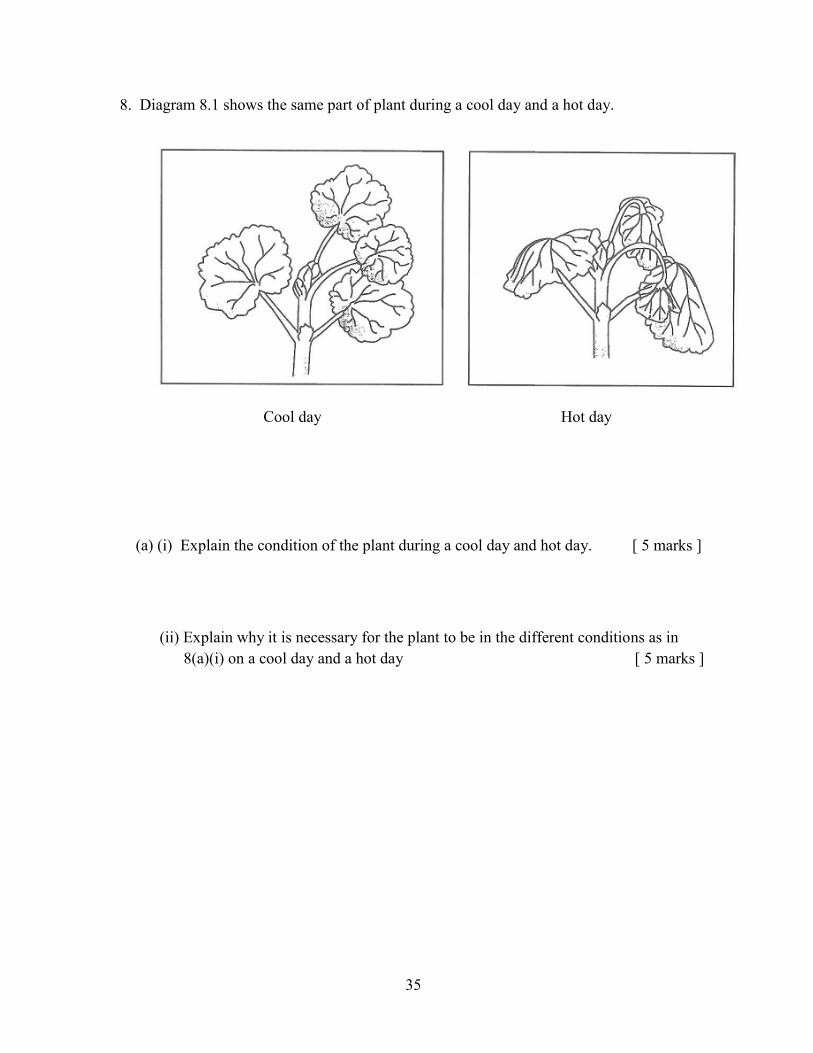
8. Diagram 8.1 shows the same part of plant during a cool day and a hot day.
Cool day Hot day (a) (i) Explain the condition of the plant during a cool day and hot day. [ 5 marks ] (ii) Explain why it is necessary for the plant to be in the different conditions as in 8(a)(i) on a cool day and a hot day [ 5 marks ]
36
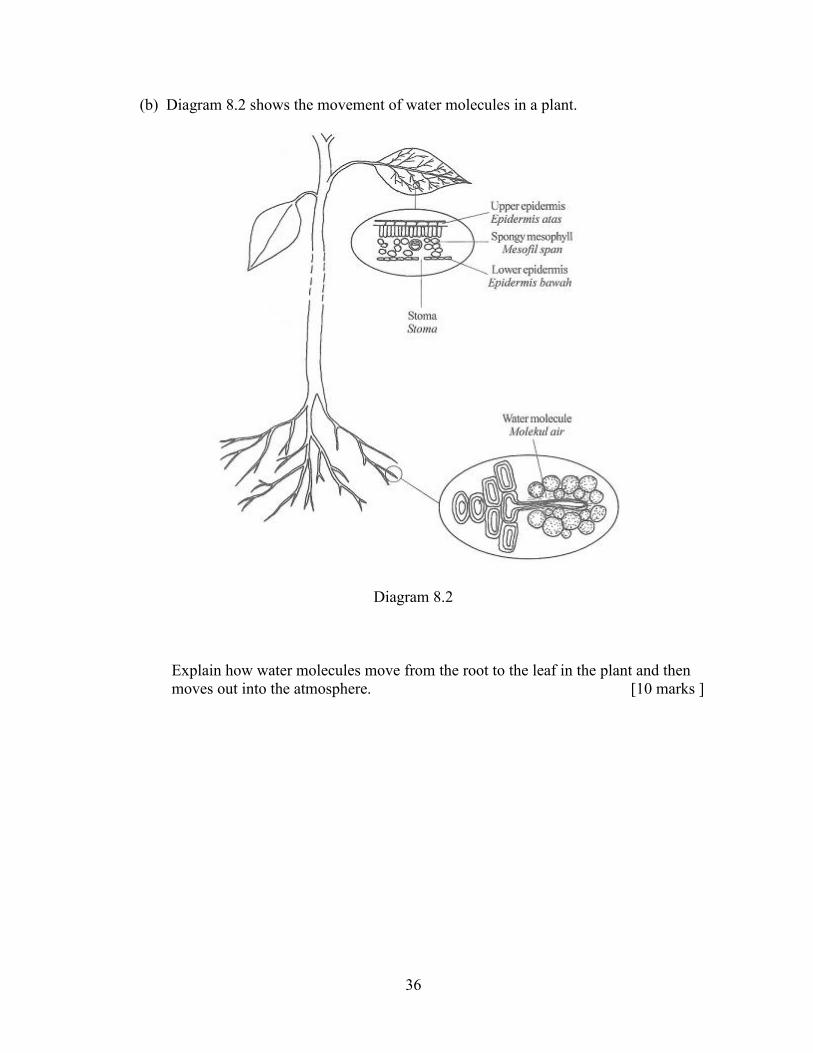
(b) Diagram 8.2 shows the movement of water molecules in a plant.
Diagram 8.2 Explain how water molecules move from the root to the leaf in the plant and then moves out into the atmosphere. [10 marks ]
37
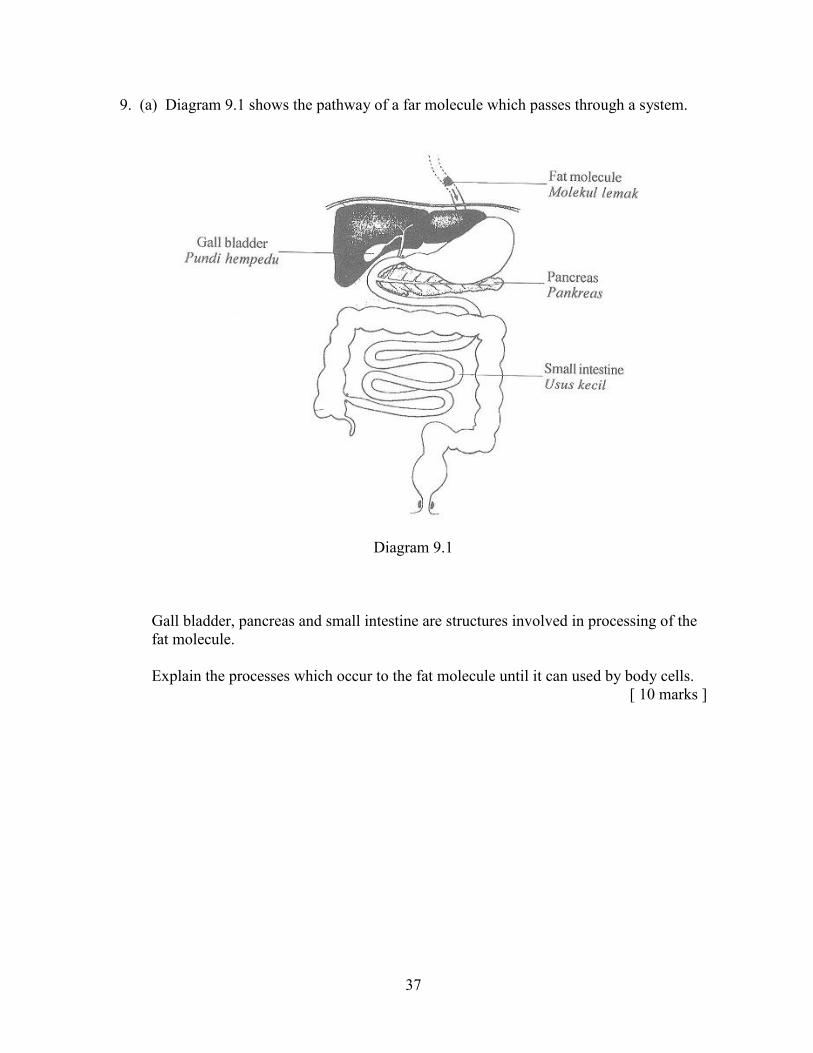
9. (a) Diagram 9.1 shows the pathway of a far molecule which passes through a system.
Diagram 9.1
Gall bladder, pancreas and small intestine are structures involved in processing of the fat molecule. Explain the processes which occur to the fat molecule until it can used by body cells.
[ 10 marks ]
38
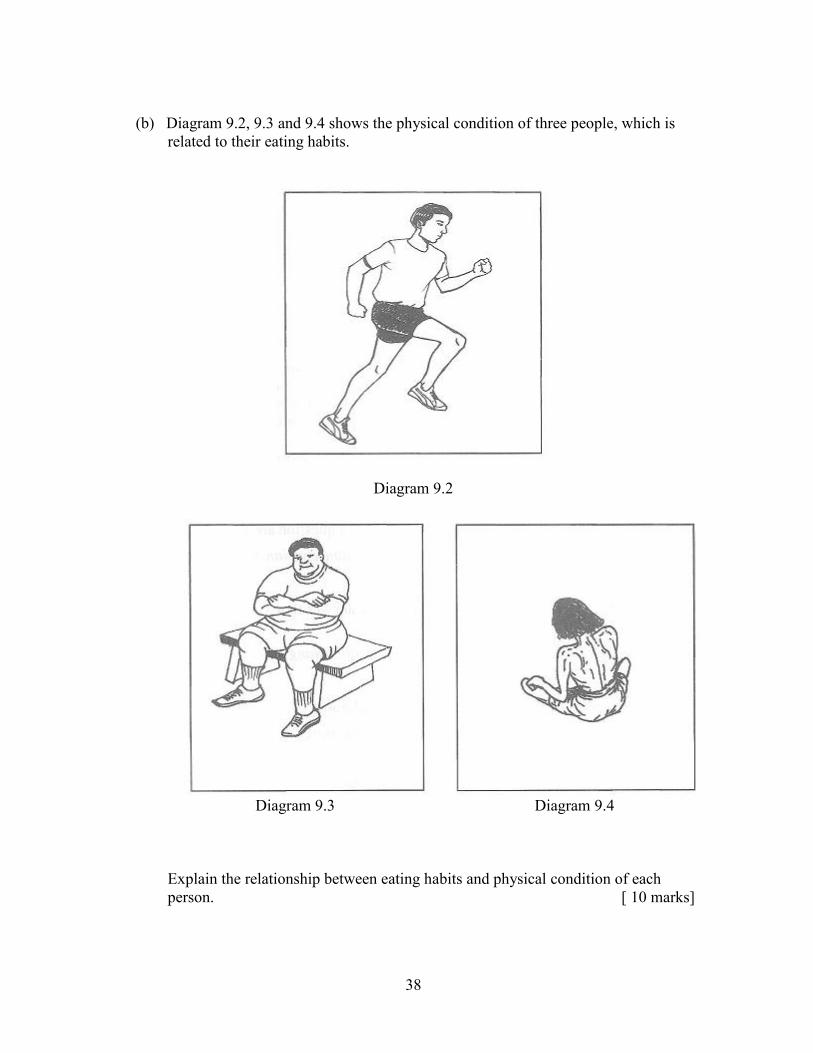
(b) Diagram 9.2, 9.3 and 9.4 shows the physical condition of three people, which is related to their eating habits.
Diagram 9.2
Diagram 9.3 Diagram 9.4 Explain the relationship between eating habits and physical condition of each person. [ 10 marks]
39
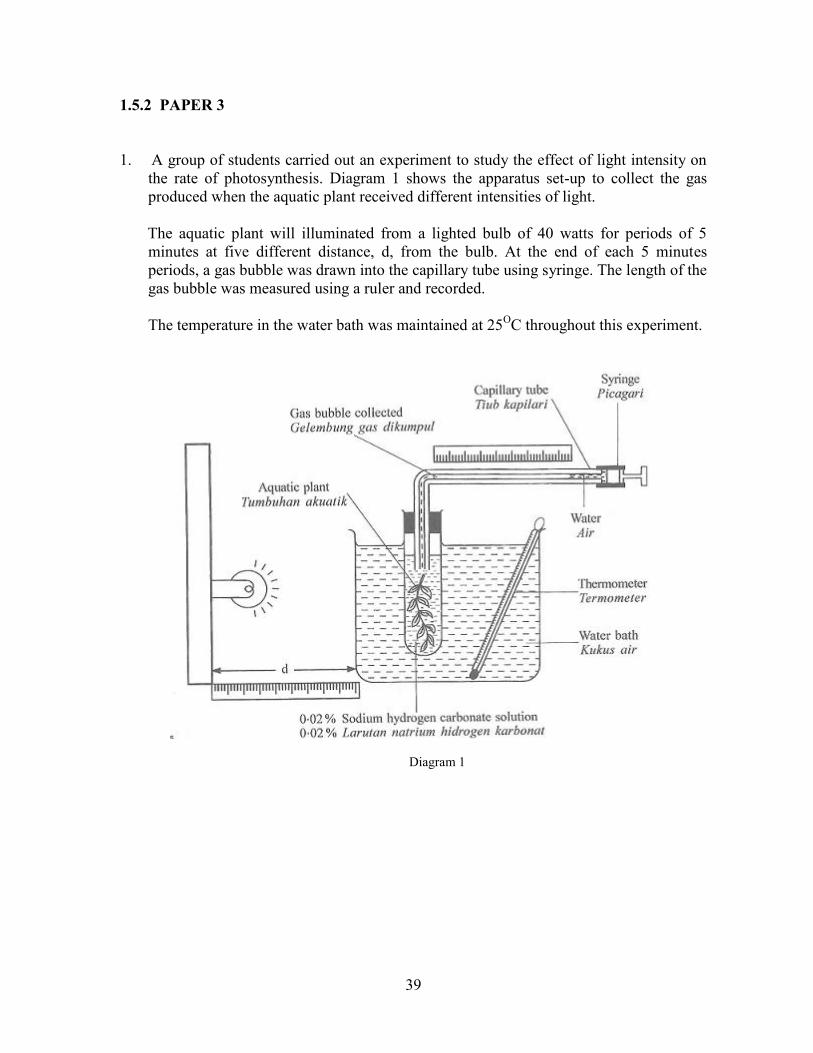
1.5.2 PAPER 3 1. A group of students carried out an experiment to study the effect of light intensity on
the rate of photosynthesis. Diagram 1 shows the apparatus set-up to collect the gas produced when the aquatic plant received different intensities of light.
The aquatic plant will illuminated from a lighted bulb of 40 watts for periods of 5
minutes at five different distance, d, from the bulb. At the end of each 5 minutes periods, a gas bubble was drawn into the capillary tube using syringe. The length of the gas bubble was measured using a ruler and recorded.
The temperature in the water bath was maintained at 25OC throughout this experiment.
Diagram 1
40
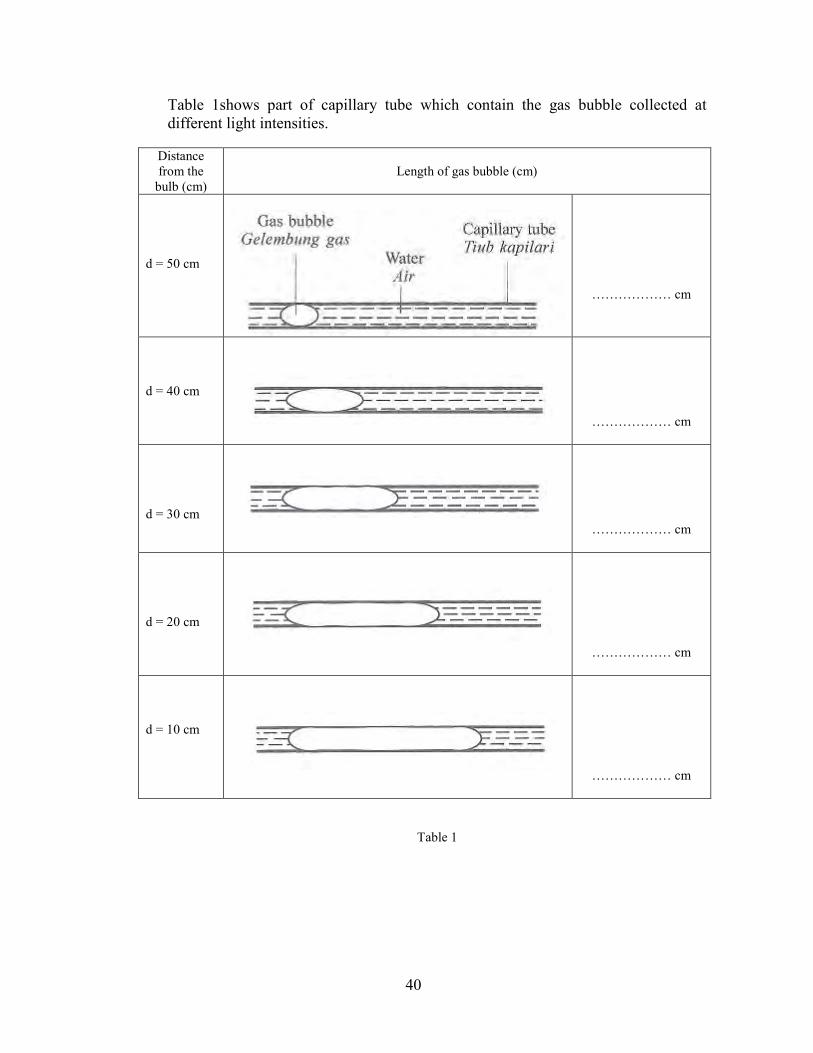
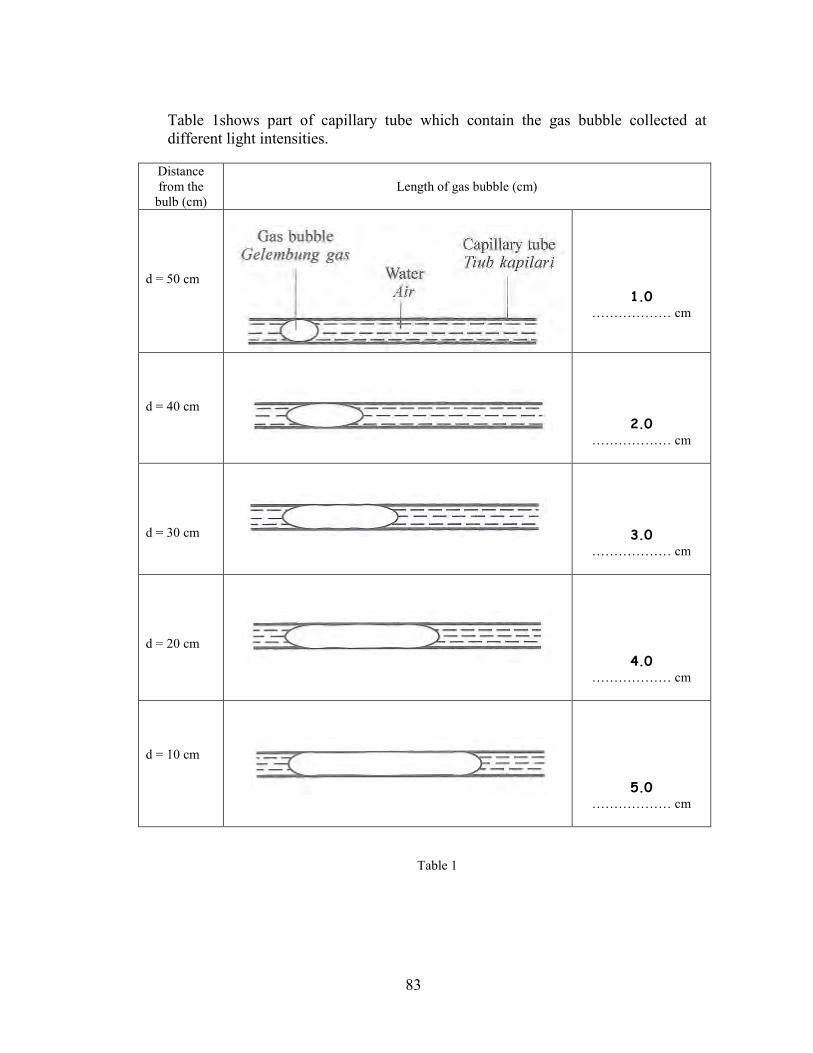
Table 1shows part of capillary tube which contain the gas bubble collected at different light intensities.
Distance from the
bulb (cm) Length of gas bubble (cm)
d = 50 cm
……………… cm
d = 40 cm
……………… cm
d = 30 cm
……………… cm
d = 20 cm
……………… cm
d = 10 cm
……………… cm
Table 1
41
(a) Using the ruler provided on page 3, measure accurately the lengths of the gas
bubbles for the different light intensities. Record the readings in the spaces provided in Table 1.
[3 marks]
1(a)
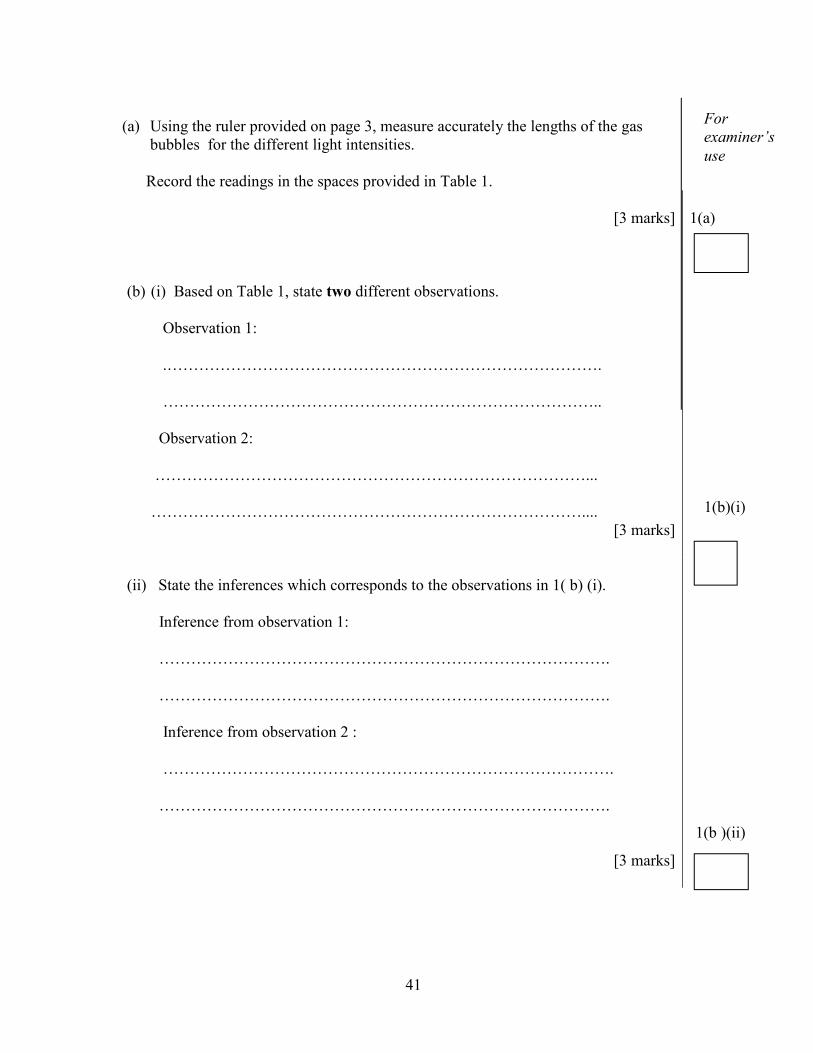
(b) (i) Based on Table 1, state two different observations. Observation 1: .………………………………………………………………………. ……………………………………………………………………….. Observation 2: ………………………………………………………………………... ………………………………………………………………………....
[3 marks]
(ii) State the inferences which corresponds to the observations in 1( b) (i). Inference from observation 1: …………………………………………………………………………. …………………………………………………………………………. Inference from observation 2 : …………………………………………………………………………. ………………………………………………………………………….
[3 marks]
1(b )(ii)
For examiner’s use
1(b)(i)
42
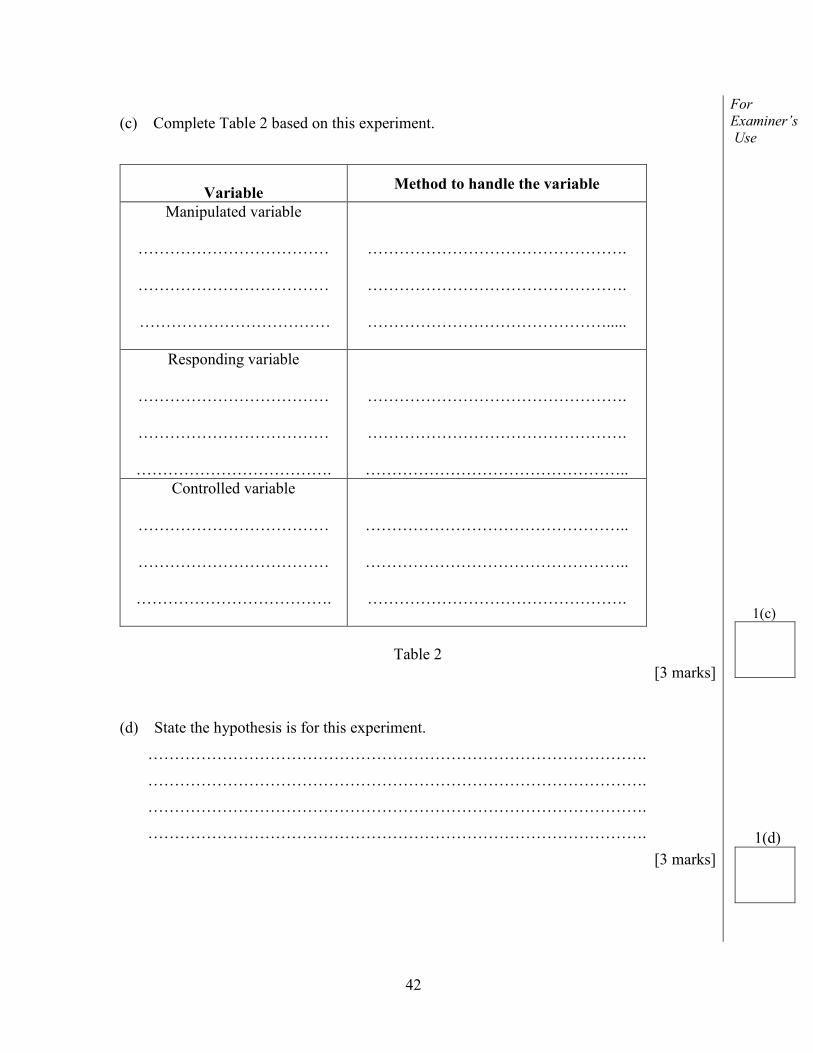
(c) Complete Table 2 based on this experiment.
For Examiner’s Use
Variable Method to handle the variable
Manipulated variable
………………………………
……………………………… ………………………………
………………………………………….
………………………………………….
……………………………………….....
Responding variable
………………………………
………………………………
……………………………….
………………………………………….
………………………………………….
………………………………………….. Controlled variable
………………………………
………………………………
……………………………….
…………………………………………..
…………………………………………..
………………………………………….
Table 2
[3 marks]
1(c)
(d) State the hypothesis is for this experiment.
………………………………………………………………………………….
………………………………………………………………………………….
………………………………………………………………………………….
………………………………………………………………………………….
[3 marks]
1(d)
43
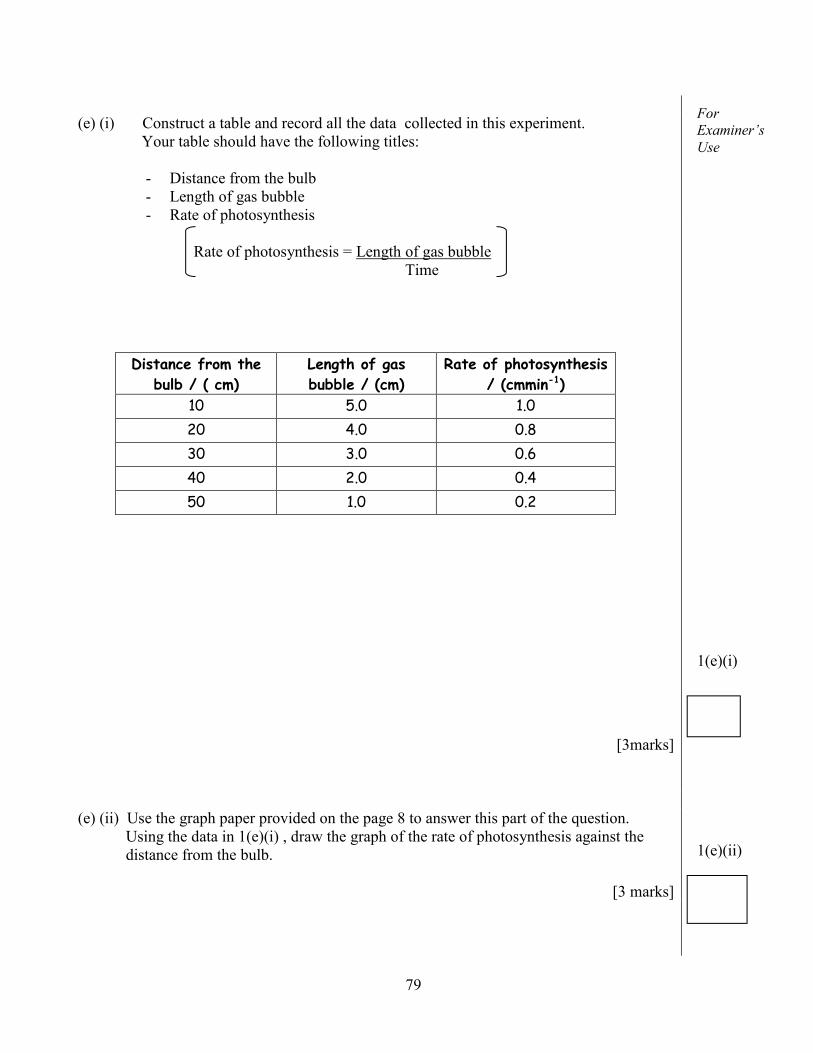
(e) (i) Construct a table and record all the data collected in this experiment. Your table should have the following titles:
- Distance from the bulb - Length of gas bubble - Rate of photosynthesis
Rate of photosynthesis = Length of gas bubble Time
[3marks]
(e) (ii) Use the graph paper provided on the page 8 to answer this part of the question. Using the data in 1(e)(i) , draw the graph of the rate of photosynthesis against the distance from the bulb.
[3 marks]
1(e)(ii)
For Examiner’s Use
1(e)(i)
44
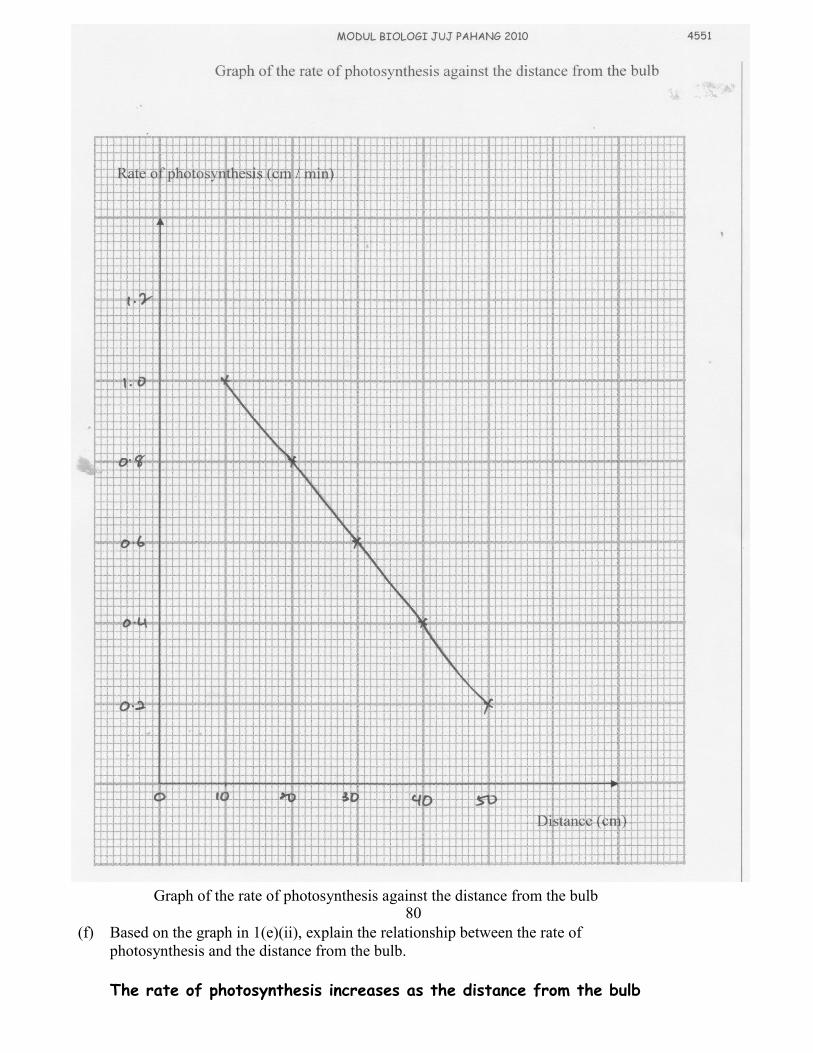
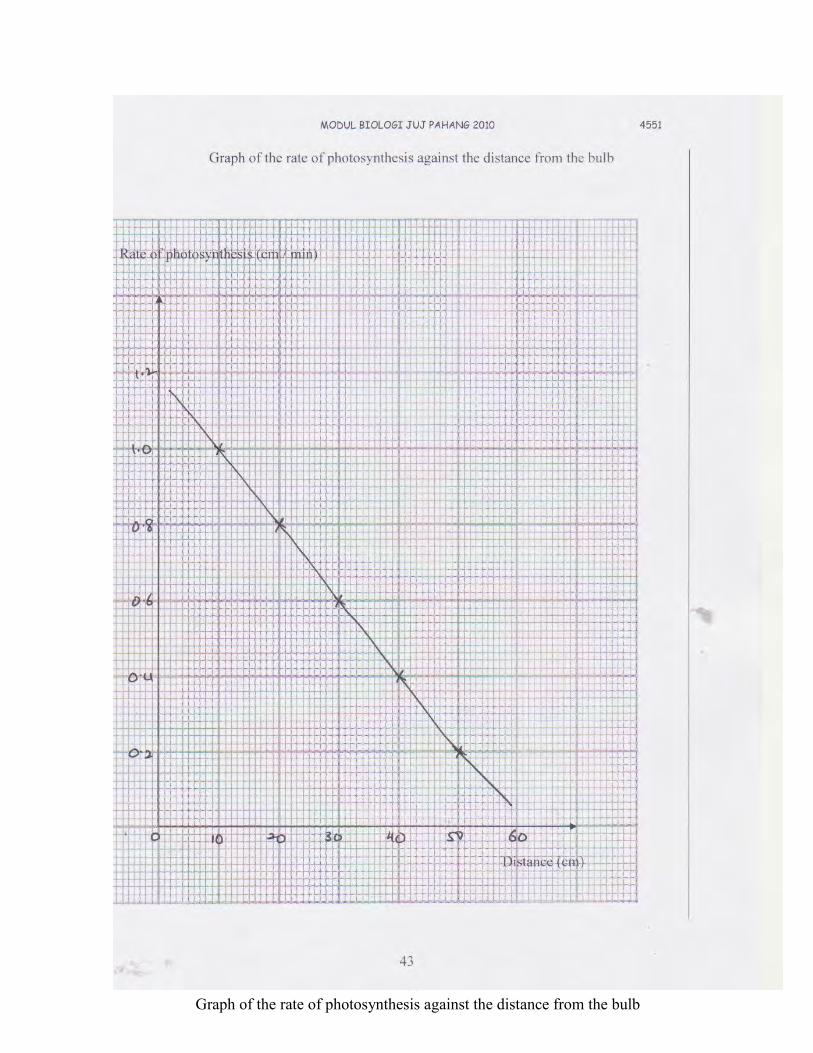
Graph of the rate of photosynthesis against the distance from the bulb
Rate of photosynthesis (cm / min)
Distance (cm)
45
(f) Based on the graph in 1(e)(ii), explain the relationship between the rate of photosynthesis and the distance from the bulb. ……………………………………………………………………………..…………… …………………………………………………………………………...………….….. …………………………………………………………………………………………..
[3 marks]
(g) Base on the result of this experiment, state the operational definition for the process of photosynthesis. ……………………………………………………………………………………..….. ……………………………………………………………………………………..….. ……………………………………………………………………………………..…..
[3 marks]
(h) Another group of students carried out the same experiment. The aquatic plant was exposed to a similar lighted bulb at a distance of 30 cm using 0.05% sodium hydrogen carbonate solution.
Predict the outcome of this experiment. Explain your prediction.
……………………………………………………………….………………………….. …………………………………………………………….…………………………….. ………………………………………………………….………………………………..
[3 marks]
1(f) 1(h)
For Examiner’s Use
1(g)
1(g)
1(i)
46
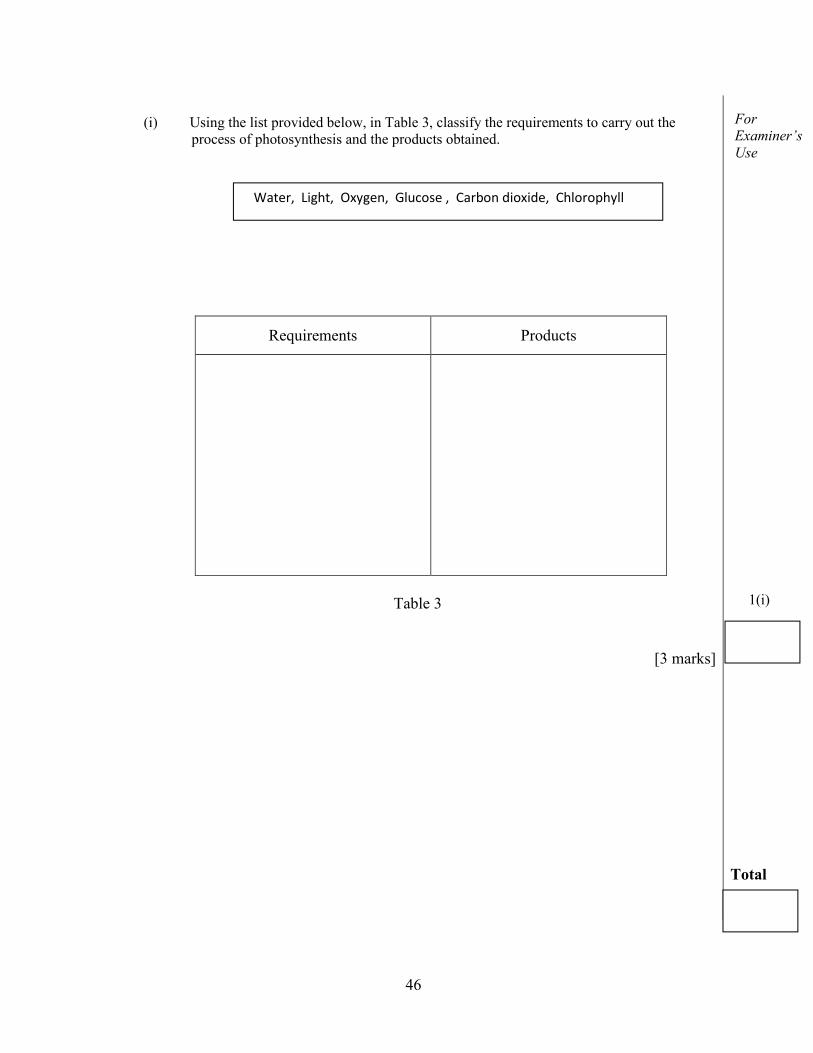
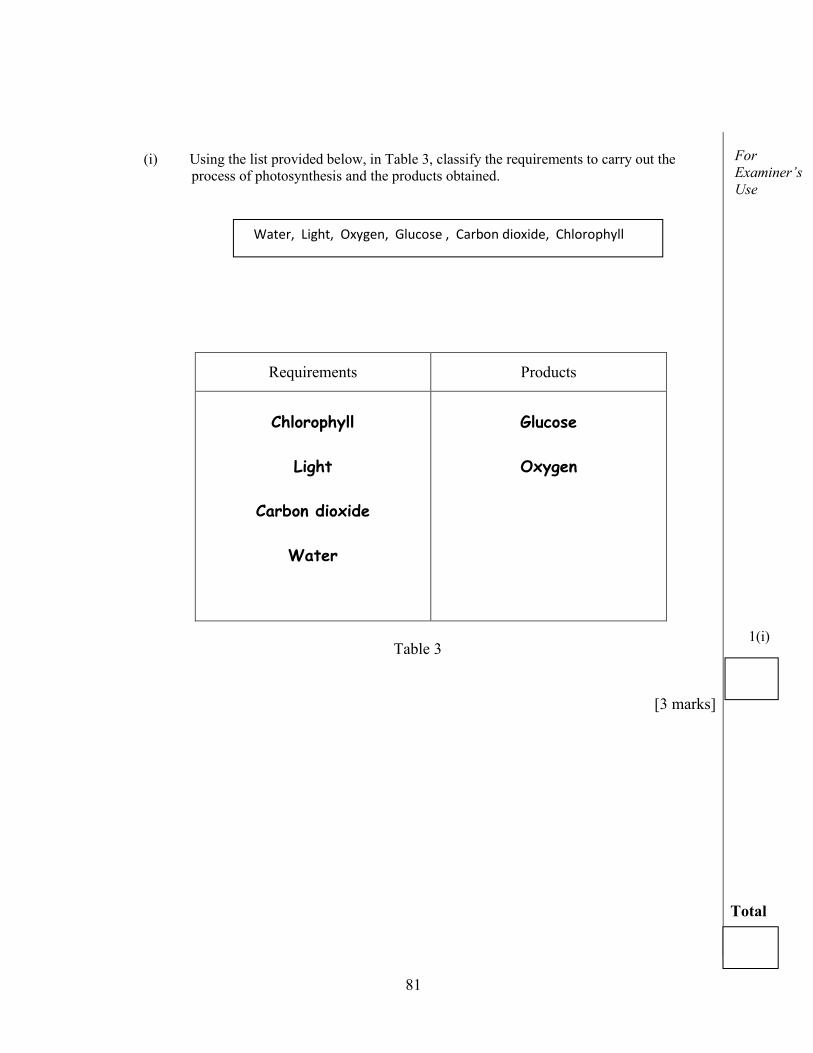
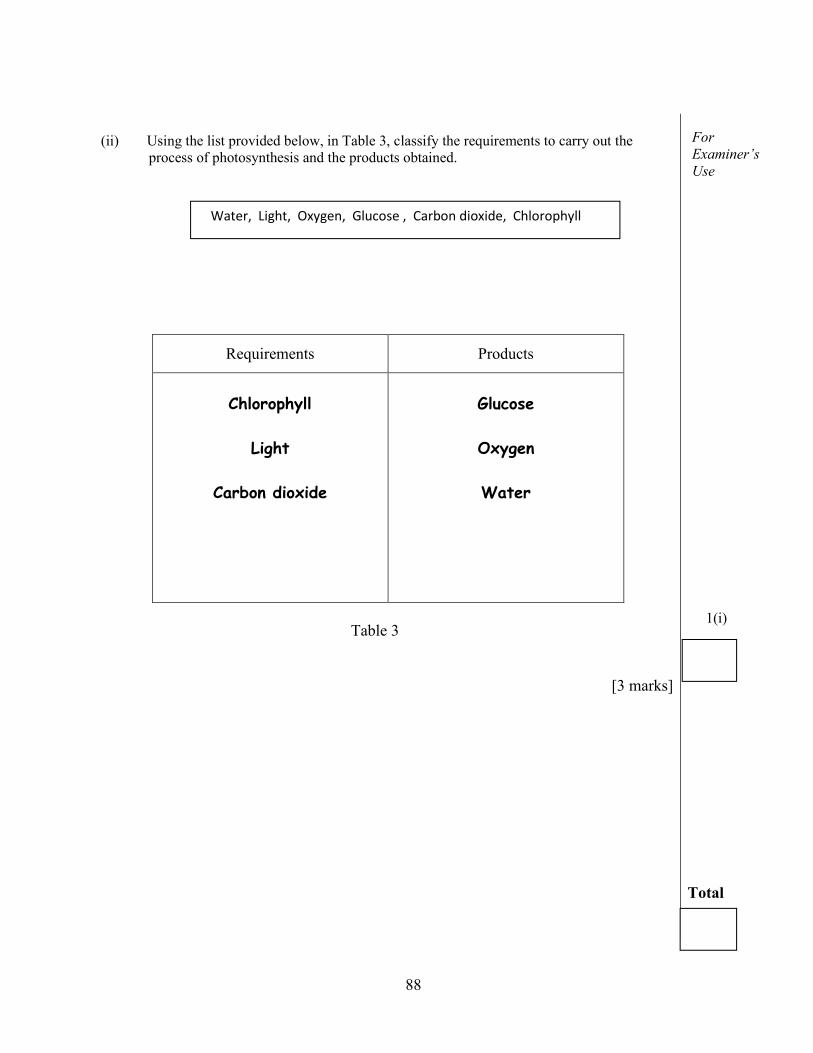
(i) Using the list provided below, in Table 3, classify the requirements to carry out the
process of photosynthesis and the products obtained.
Requirements Products
Table 3
[3 marks]
1(i) Total
For Examiner’s Use
1(g)
Water, Light, Oxygen, Glucose , Carbon dioxide, Chlorophyll
47
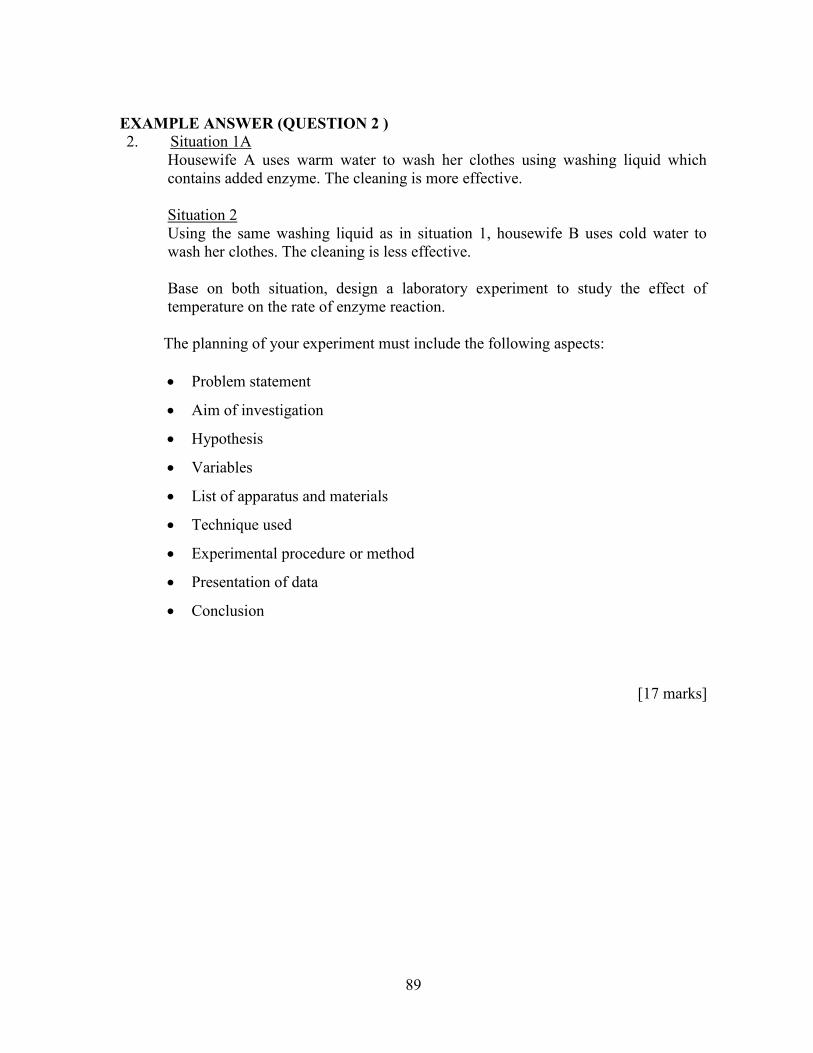
2. Situation 1A
Housewife A uses warm water to wash her clothes using washing liquid which contains added enzyme. The cleaning is more effective. Situation 2 Using the same washing liquid as in situation 1, housewife B uses cold water to wash her clothes. The cleaning is less effective. Base on both situation, design a laboratory experiment to study the effect of temperature on the rate of enzyme reaction.
The planning of your experiment must include the following aspects:
Problem statement
Aim of investigation
Hypothesis
Variables
List of apparatus and materials
Technique used
Experimental procedure or method
Presentation of data
Conclusion
[17 marks]
END OF QUESTION PAPER
48
MARK SCHEAM PAPER 2 : SPM 2009 MARKING SCHEME FOR BIOLOGY PAPER 2
SPM 2009 Question Mark Scheme Sub
Mark Total Mark
1(a)(i) (ii) (b)(i) (ii) (c)(i) (ii)
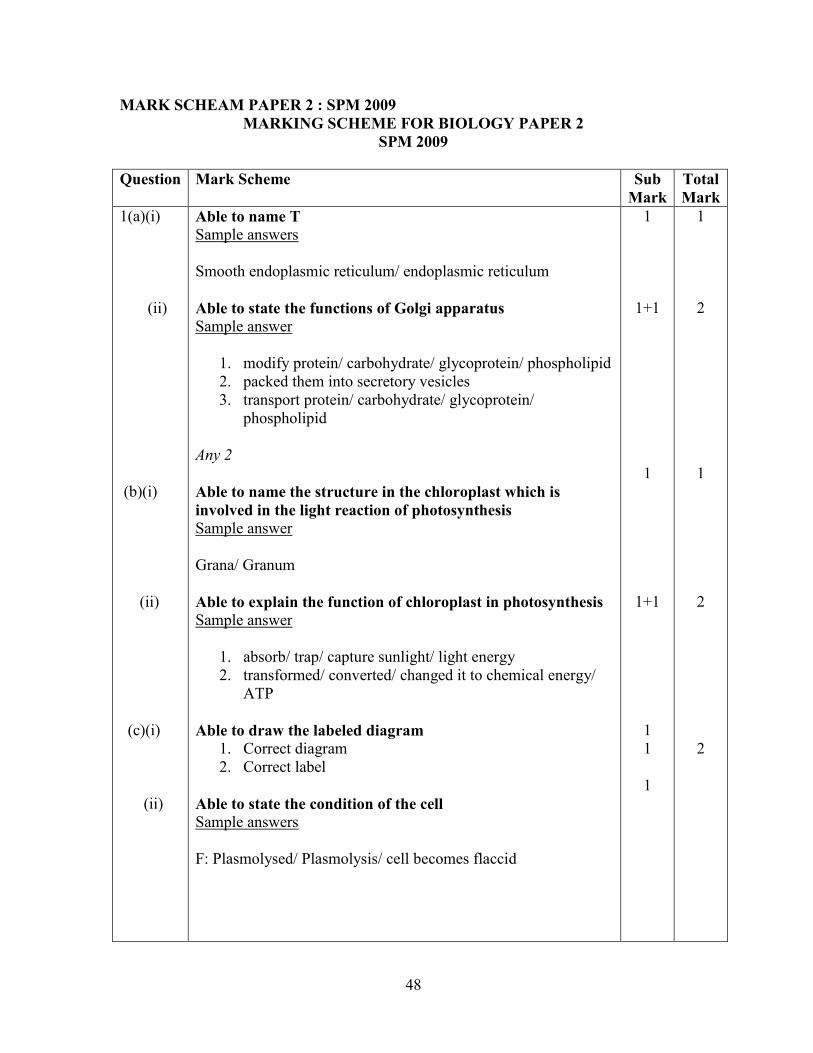
Able to name T Sample answers Smooth endoplasmic reticulum/ endoplasmic reticulum Able to state the functions of Golgi apparatus Sample answer
1. modify protein/ carbohydrate/ glycoprotein/ phospholipid 2. packed them into secretory vesicles 3. transport protein/ carbohydrate/ glycoprotein/
phospholipid Any 2 Able to name the structure in the chloroplast which is involved in the light reaction of photosynthesis Sample answer Grana/ Granum Able to explain the function of chloroplast in photosynthesis Sample answer
1. absorb/ trap/ capture sunlight/ light energy 2. transformed/ converted/ changed it to chemical energy/
ATP Able to draw the labeled diagram
1. Correct diagram 2. Correct label
Able to state the condition of the cell Sample answers F: Plasmolysed/ Plasmolysis/ cell becomes flaccid
1
1+1 1
1+1 1 1 1
1 2 1 2 2
49
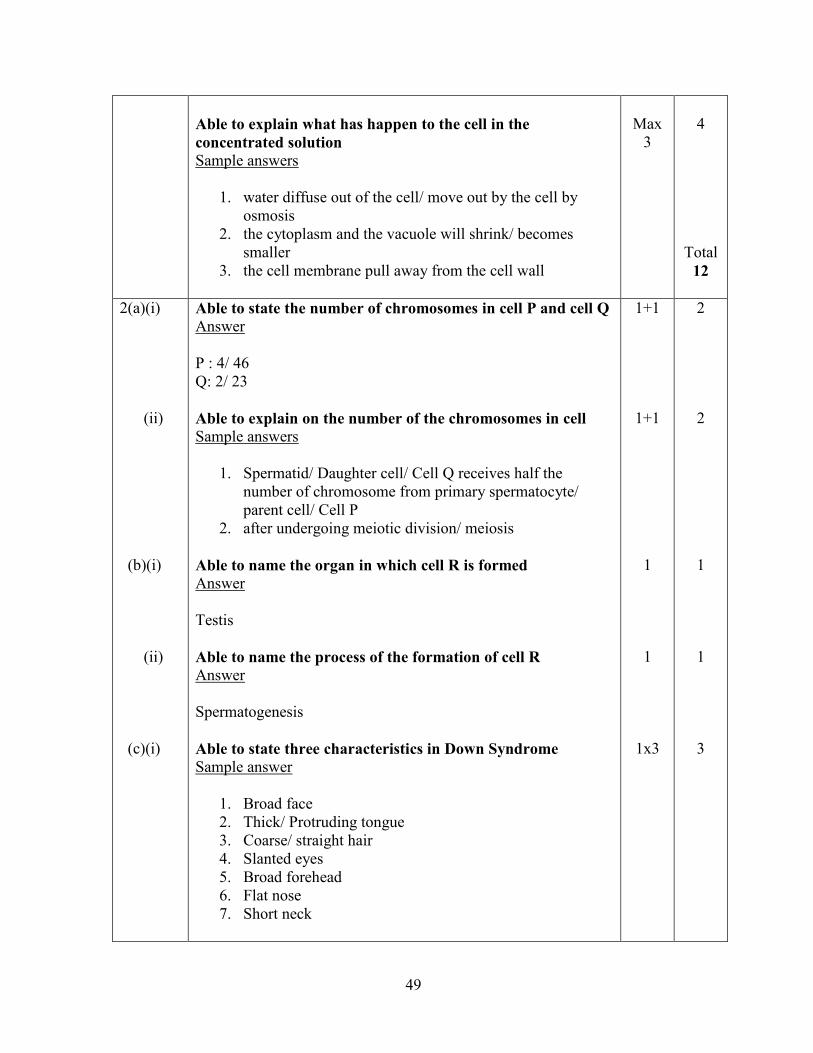
Able to explain what has happen to the cell in the concentrated solution Sample answers
1. water diffuse out of the cell/ move out by the cell by osmosis
2. the cytoplasm and the vacuole will shrink/ becomes smaller
3. the cell membrane pull away from the cell wall
Max
3
4
Total 12
2(a)(i) (ii) (b)(i) (ii) (c)(i)
Able to state the number of chromosomes in cell P and cell Q Answer P : 4/ 46 Q: 2/ 23 Able to explain on the number of the chromosomes in cell Sample answers
1. Spermatid/ Daughter cell/ Cell Q receives half the number of chromosome from primary spermatocyte/ parent cell/ Cell P
2. after undergoing meiotic division/ meiosis Able to name the organ in which cell R is formed Answer Testis Able to name the process of the formation of cell R Answer Spermatogenesis Able to state three characteristics in Down Syndrome Sample answer
1. Broad face 2. Thick/ Protruding tongue 3. Coarse/ straight hair 4. Slanted eyes 5. Broad forehead 6. Flat nose 7. Short neck
1+1
1+1 1 1
1x3
2 2 1 1 3
50
(ii)
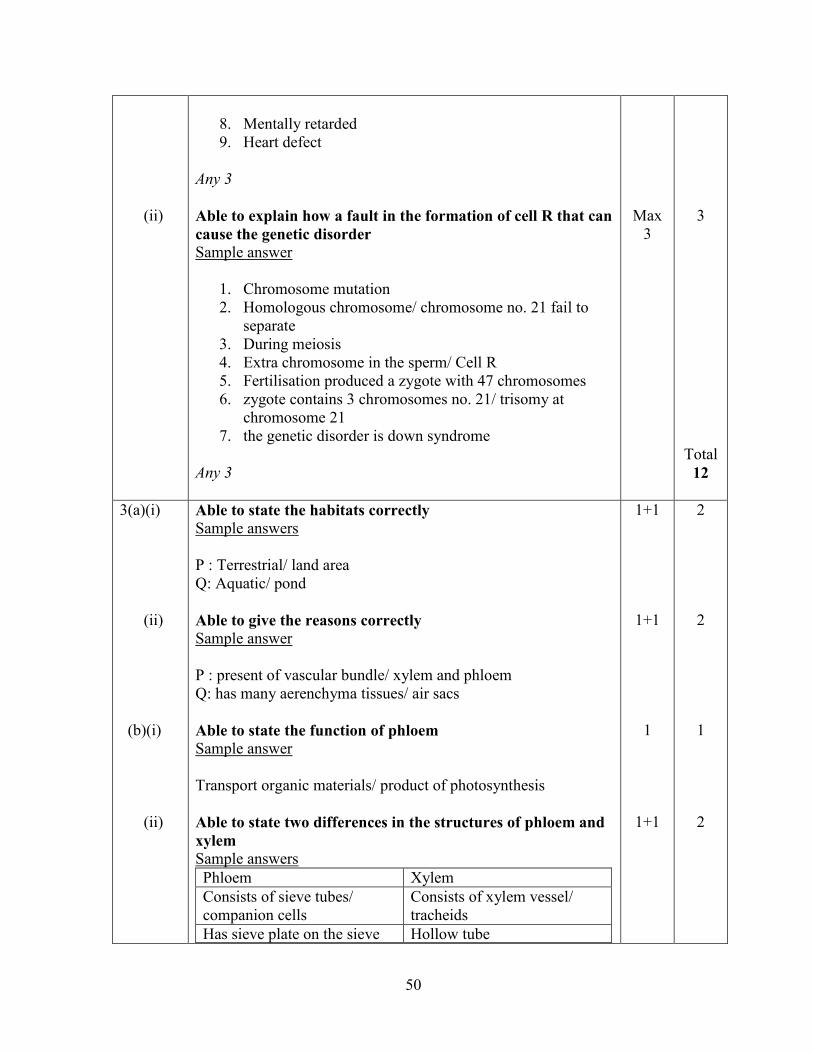
8. Mentally retarded 9. Heart defect
Any 3 Able to explain how a fault in the formation of cell R that can cause the genetic disorder Sample answer
1. Chromosome mutation 2. Homologous chromosome/ chromosome no. 21 fail to
separate 3. During meiosis 4. Extra chromosome in the sperm/ Cell R 5. Fertilisation produced a zygote with 47 chromosomes 6. zygote contains 3 chromosomes no. 21/ trisomy at
chromosome 21 7. the genetic disorder is down syndrome
Any 3
Max 3
3
Total 12
3(a)(i) (ii) (b)(i) (ii)
Able to state the habitats correctly Sample answers P : Terrestrial/ land area Q: Aquatic/ pond Able to give the reasons correctly Sample answer P : present of vascular bundle/ xylem and phloem Q: has many aerenchyma tissues/ air sacs Able to state the function of phloem Sample answer Transport organic materials/ product of photosynthesis Able to state two differences in the structures of phloem and xylem Sample answers Phloem Xylem Consists of sieve tubes/ companion cells
Consists of xylem vessel/ tracheids
Has sieve plate on the sieve Hollow tube
1+1
1+1 1
1+1
2 2 1 2
51
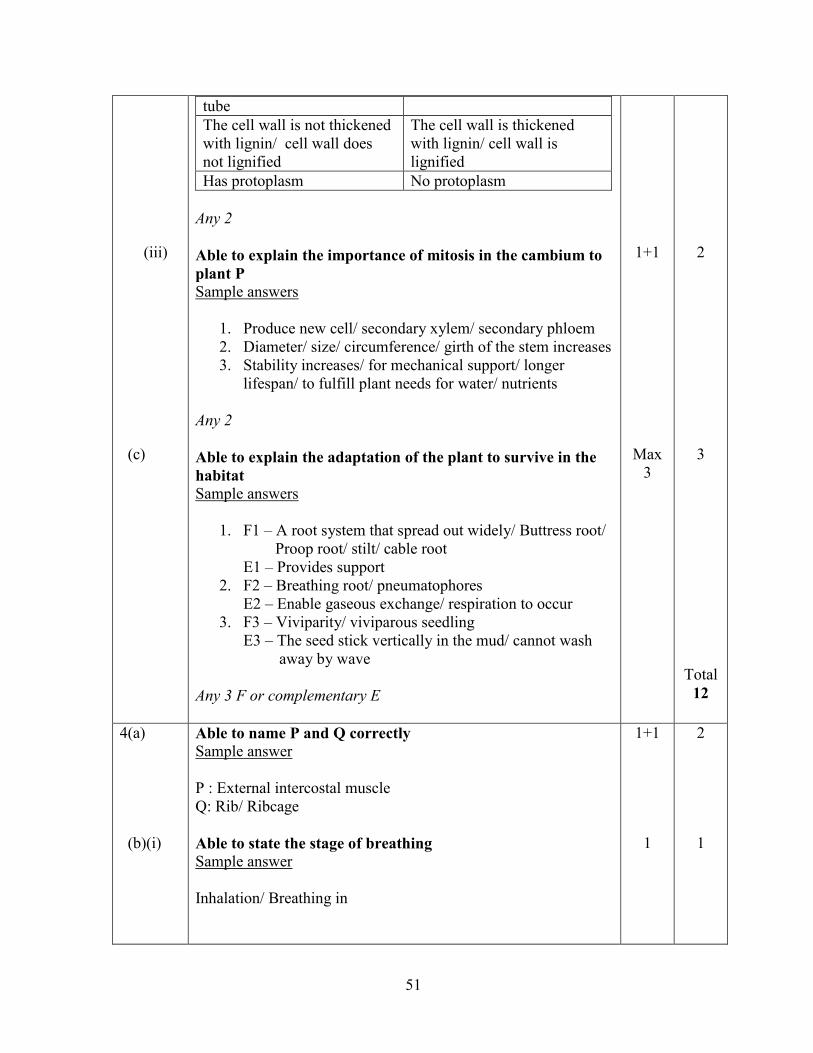
(iii) (c)
tube The cell wall is not thickened with lignin/ cell wall does not lignified
The cell wall is thickened with lignin/ cell wall is lignified
Has protoplasm No protoplasm Any 2 Able to explain the importance of mitosis in the cambium to plant P Sample answers
1. Produce new cell/ secondary xylem/ secondary phloem 2. Diameter/ size/ circumference/ girth of the stem increases 3. Stability increases/ for mechanical support/ longer
lifespan/ to fulfill plant needs for water/ nutrients Any 2 Able to explain the adaptation of the plant to survive in the habitat Sample answers
1. F1 – A root system that spread out widely/ Buttress root/ Proop root/ stilt/ cable root E1 – Provides support 2. F2 – Breathing root/ pneumatophores
E2 – Enable gaseous exchange/ respiration to occur 3. F3 – Viviparity/ viviparous seedling
E3 – The seed stick vertically in the mud/ cannot wash away by wave
Any 3 F or complementary E
1+1
Max 3
2 3
Total 12
4(a) (b)(i)
Able to name P and Q correctly Sample answer P : External intercostal muscle Q: Rib/ Ribcage Able to state the stage of breathing Sample answer Inhalation/ Breathing in
1+1 1
2 1
52
(ii) (c) (d)(i) (ii)
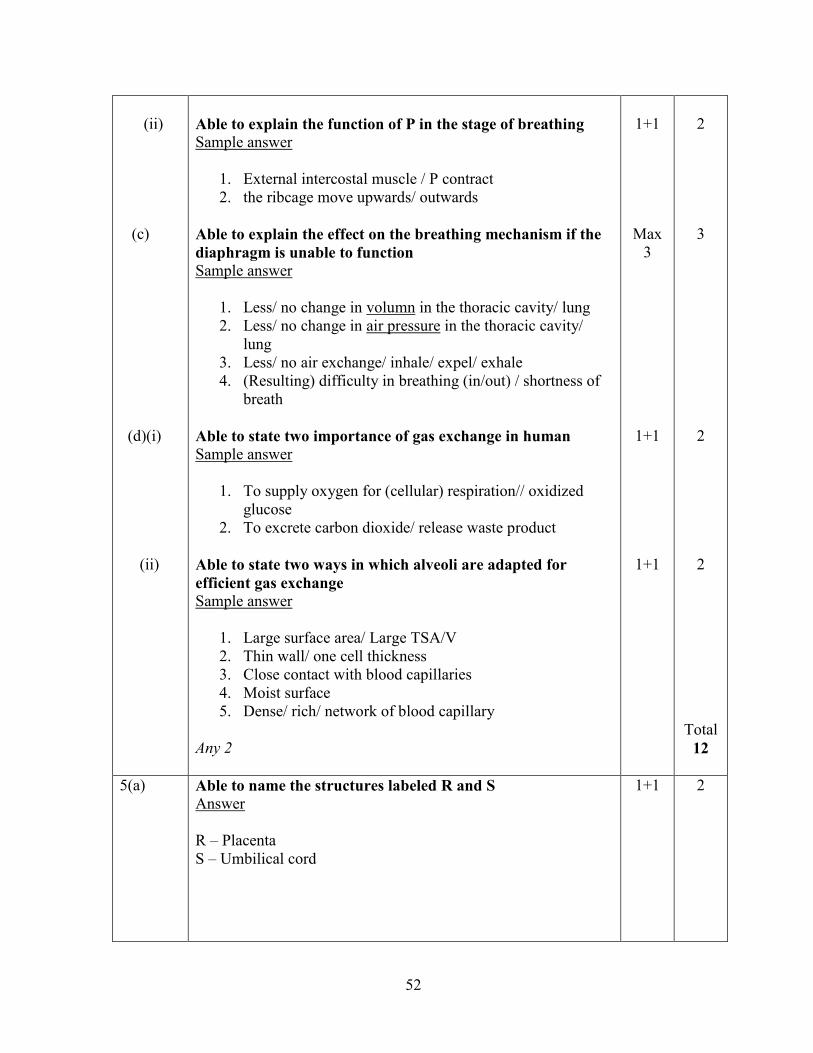
Able to explain the function of P in the stage of breathing Sample answer
1. External intercostal muscle / P contract 2. the ribcage move upwards/ outwards
Able to explain the effect on the breathing mechanism if the diaphragm is unable to function Sample answer
1. Less/ no change in volumn in the thoracic cavity/ lung 2. Less/ no change in air pressure in the thoracic cavity/
lung 3. Less/ no air exchange/ inhale/ expel/ exhale 4. (Resulting) difficulty in breathing (in/out) / shortness of
breath Able to state two importance of gas exchange in human Sample answer
1. To supply oxygen for (cellular) respiration// oxidized glucose
2. To excrete carbon dioxide/ release waste product Able to state two ways in which alveoli are adapted for efficient gas exchange Sample answer
1. Large surface area/ Large TSA/V 2. Thin wall/ one cell thickness 3. Close contact with blood capillaries 4. Moist surface 5. Dense/ rich/ network of blood capillary
Any 2
1+1
Max 3
1+1
1+1
2 3 2 2
Total 12
5(a)
Able to name the structures labeled R and S Answer R – Placenta S – Umbilical cord
1+1
2
53
(b) (c) (d)(i) (ii) (e)
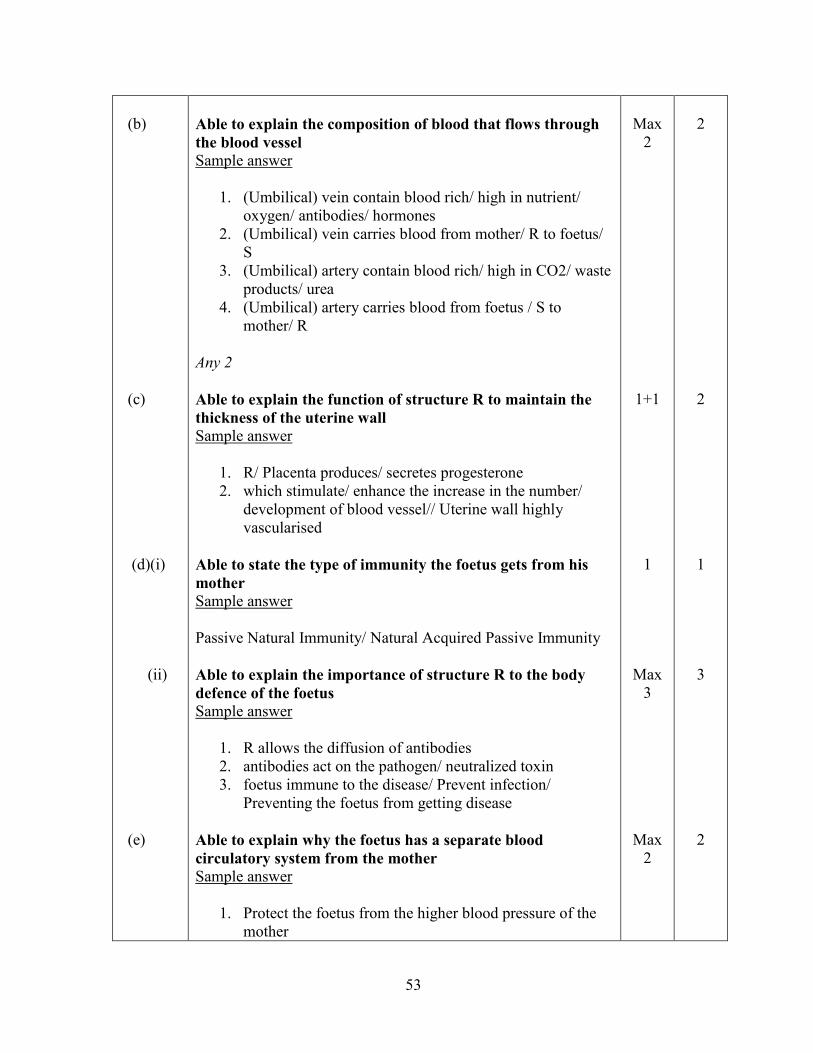
Able to explain the composition of blood that flows through the blood vessel Sample answer
1. (Umbilical) vein contain blood rich/ high in nutrient/ oxygen/ antibodies/ hormones
2. (Umbilical) vein carries blood from mother/ R to foetus/ S
3. (Umbilical) artery contain blood rich/ high in CO2/ waste products/ urea
4. (Umbilical) artery carries blood from foetus / S to mother/ R
Any 2 Able to explain the function of structure R to maintain the thickness of the uterine wall Sample answer
1. R/ Placenta produces/ secretes progesterone 2. which stimulate/ enhance the increase in the number/
development of blood vessel// Uterine wall highly vascularised
Able to state the type of immunity the foetus gets from his mother Sample answer Passive Natural Immunity/ Natural Acquired Passive Immunity Able to explain the importance of structure R to the body defence of the foetus Sample answer
1. R allows the diffusion of antibodies 2. antibodies act on the pathogen/ neutralized toxin 3. foetus immune to the disease/ Prevent infection/
Preventing the foetus from getting disease Able to explain why the foetus has a separate blood circulatory system from the mother Sample answer
1. Protect the foetus from the higher blood pressure of the mother
Max
2
1+1 1
Max 3
Max 2
2 2 1 3 2
54
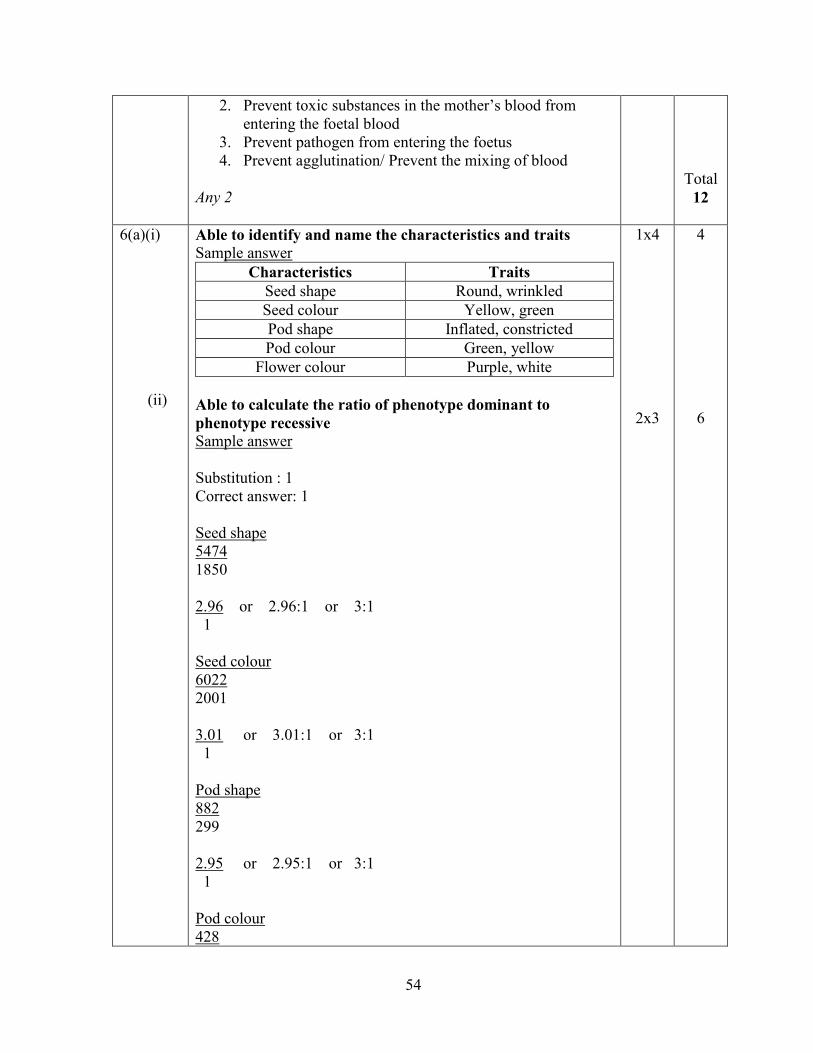
2. Prevent toxic substances in the mother’s blood from entering the foetal blood
3. Prevent pathogen from entering the foetus 4. Prevent agglutination/ Prevent the mixing of blood
Any 2
Total 12
6(a)(i) (ii)
Able to identify and name the characteristics and traits Sample answer
Characteristics Traits Seed shape Round, wrinkled Seed colour Yellow, green Pod shape Inflated, constricted Pod colour Green, yellow
Flower colour Purple, white Able to calculate the ratio of phenotype dominant to phenotype recessive Sample answer Substitution : 1 Correct answer: 1 Seed shape 5474 1850 2.96 or 2.96:1 or 3:1 1 Seed colour 6022 2001 3.01 or 3.01:1 or 3:1 1 Pod shape 882 299 2.95 or 2.95:1 or 3:1 1 Pod colour 428
1x4
2x3
4 6
55
(b)
152 2.82 or 2.82:1 or 3:1 1 Flower colour 705 224 3.15 or 3.15:1 or 3:1 1 Able to explain the possible genetic combinations in the children Sample answer Parental phenotypes Normal Man x Carrier Woman Parental genotypes(2n) XHY XH Xh Meiosis (P1) Gametes (n) (P2) XH Y XH Xh Fertilization (P3) Genotype F1 (P4) XHXH XHY XHXh XHY Phenotype F1(P5) Normal Normal Carrier Haemophiliac Woman Man Woman Man Phenotype ratio (P6) 1 : 1 : 1 : 1 P7 – Haemophilia gene is a recessive gene P8 – Gene is link to X- Chromosome// sex-link gene P9 – Male has only one X chromosome P10 – Male has higher chances to have haemophilia P11- Haemophilia woman carry recessive gene on both X chromosome/ XhXh Any 10
Max 10
10
Total 20
7(a)
Able to name and describe the interaction represented by Diagram 7.1 Sample answer
56
(b) (c)(i)
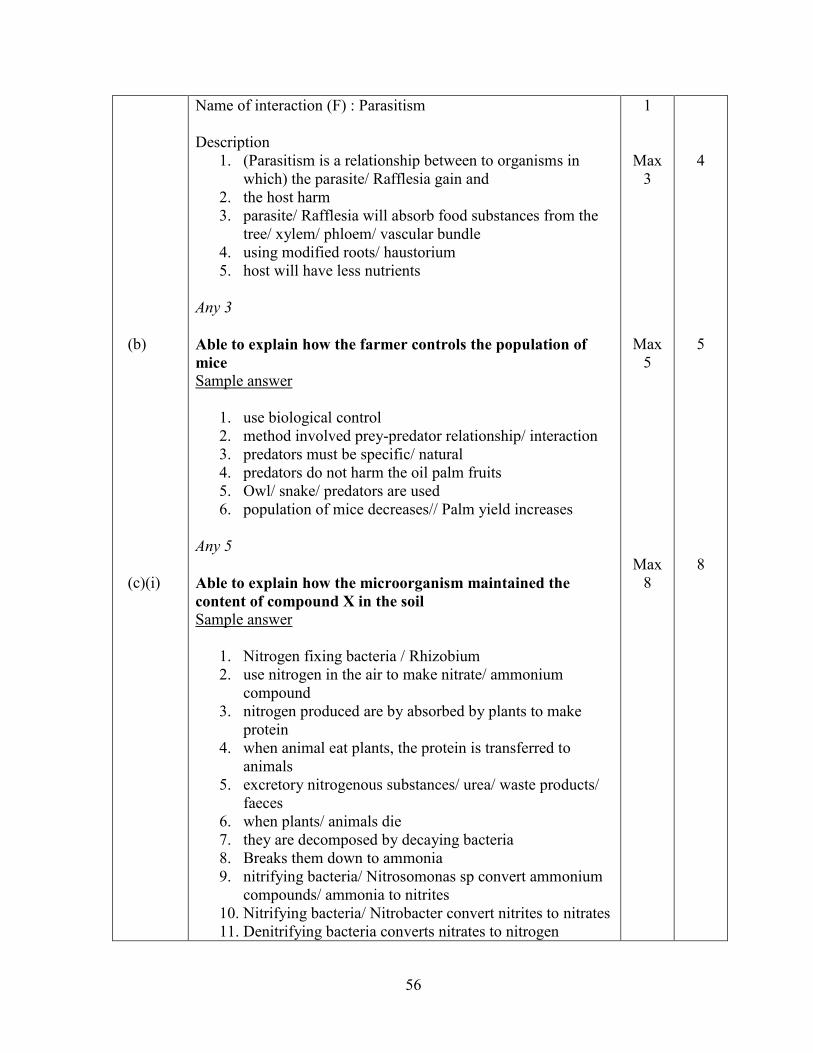
Name of interaction (F) : Parasitism Description
1. (Parasitism is a relationship between to organisms in which) the parasite/ Rafflesia gain and
2. the host harm 3. parasite/ Rafflesia will absorb food substances from the
tree/ xylem/ phloem/ vascular bundle 4. using modified roots/ haustorium 5. host will have less nutrients
Any 3 Able to explain how the farmer controls the population of mice Sample answer
1. use biological control 2. method involved prey-predator relationship/ interaction 3. predators must be specific/ natural 4. predators do not harm the oil palm fruits 5. Owl/ snake/ predators are used 6. population of mice decreases// Palm yield increases
Any 5 Able to explain how the microorganism maintained the content of compound X in the soil Sample answer
1. Nitrogen fixing bacteria / Rhizobium 2. use nitrogen in the air to make nitrate/ ammonium
compound 3. nitrogen produced are by absorbed by plants to make
protein 4. when animal eat plants, the protein is transferred to
animals 5. excretory nitrogenous substances/ urea/ waste products/
faeces 6. when plants/ animals die 7. they are decomposed by decaying bacteria 8. Breaks them down to ammonia 9. nitrifying bacteria/ Nitrosomonas sp convert ammonium
compounds/ ammonia to nitrites 10. Nitrifying bacteria/ Nitrobacter convert nitrites to nitrates 11. Denitrifying bacteria converts nitrates to nitrogen
1
Max 3
Max 5
Max 8
4 5 8
57
(ii)
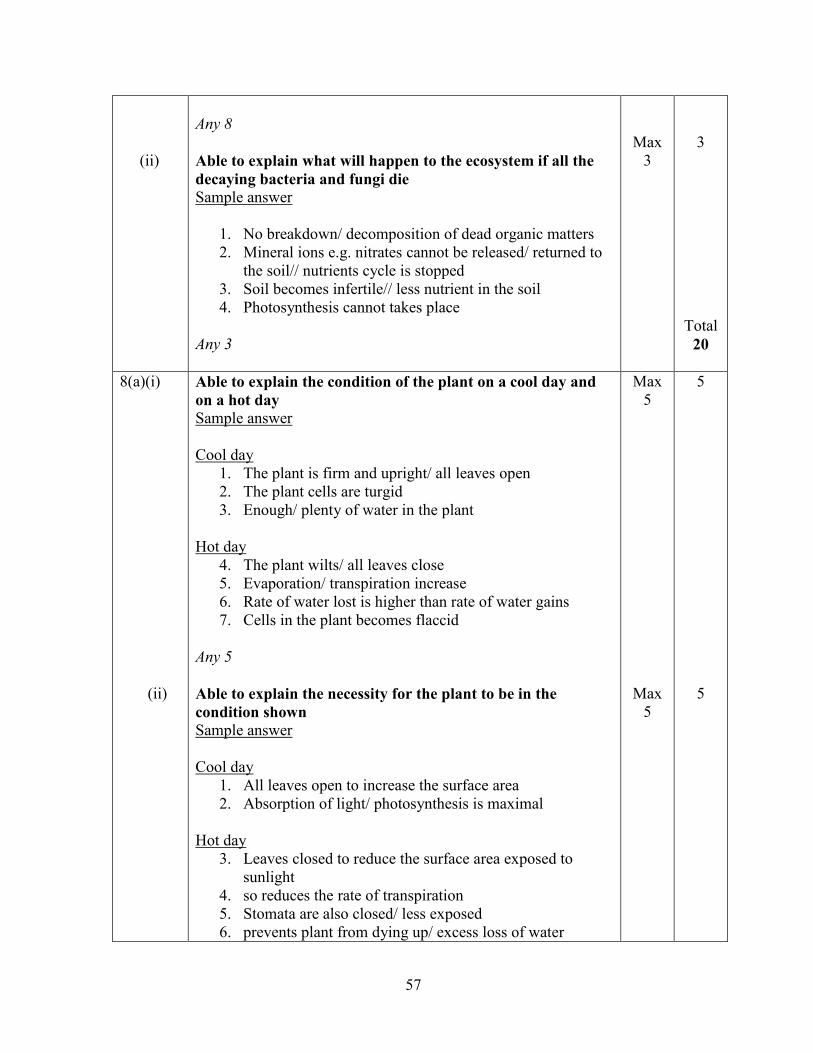
Any 8 Able to explain what will happen to the ecosystem if all the decaying bacteria and fungi die Sample answer
1. No breakdown/ decomposition of dead organic matters 2. Mineral ions e.g. nitrates cannot be released/ returned to
the soil// nutrients cycle is stopped 3. Soil becomes infertile// less nutrient in the soil 4. Photosynthesis cannot takes place
Any 3
Max 3
3
Total 20
8(a)(i) (ii)
Able to explain the condition of the plant on a cool day and on a hot day Sample answer Cool day
1. The plant is firm and upright/ all leaves open 2. The plant cells are turgid 3. Enough/ plenty of water in the plant
Hot day
4. The plant wilts/ all leaves close 5. Evaporation/ transpiration increase 6. Rate of water lost is higher than rate of water gains 7. Cells in the plant becomes flaccid
Any 5 Able to explain the necessity for the plant to be in the condition shown Sample answer Cool day
1. All leaves open to increase the surface area 2. Absorption of light/ photosynthesis is maximal
Hot day
3. Leaves closed to reduce the surface area exposed to sunlight
4. so reduces the rate of transpiration 5. Stomata are also closed/ less exposed 6. prevents plant from dying up/ excess loss of water
Max 5
Max 5
5 5
58
(b)
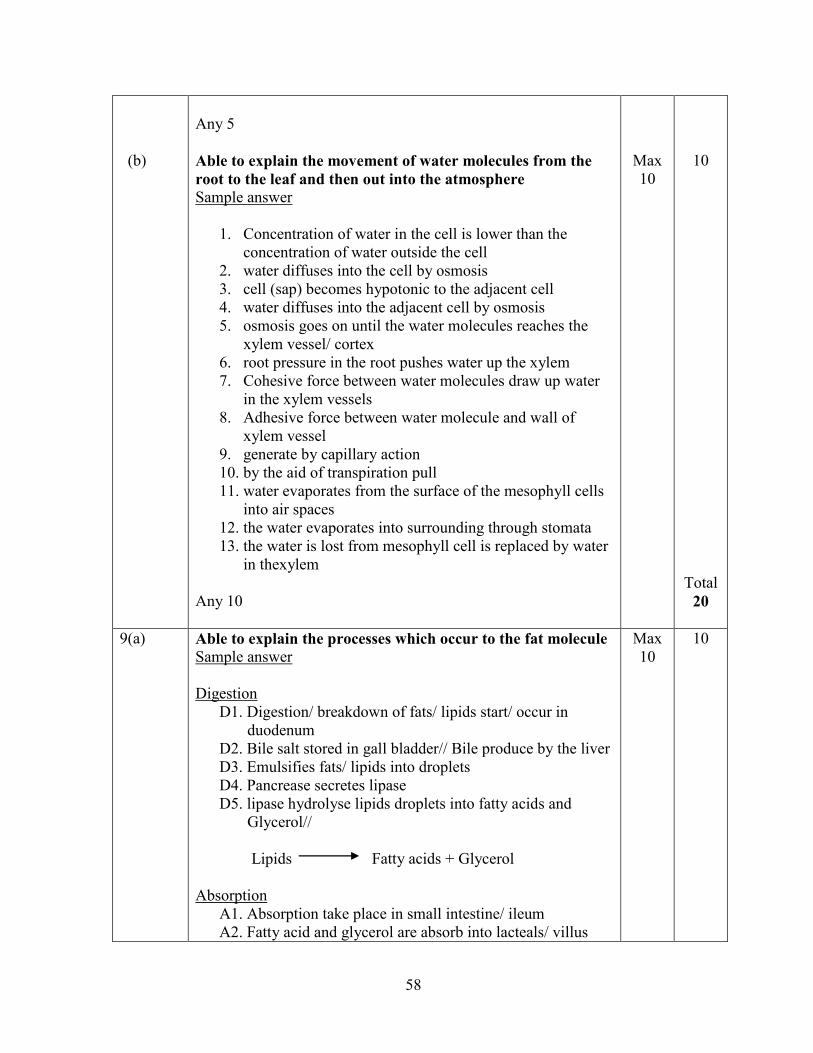
Any 5 Able to explain the movement of water molecules from the root to the leaf and then out into the atmosphere Sample answer
1. Concentration of water in the cell is lower than the concentration of water outside the cell
2. water diffuses into the cell by osmosis 3. cell (sap) becomes hypotonic to the adjacent cell 4. water diffuses into the adjacent cell by osmosis 5. osmosis goes on until the water molecules reaches the
xylem vessel/ cortex 6. root pressure in the root pushes water up the xylem 7. Cohesive force between water molecules draw up water
in the xylem vessels 8. Adhesive force between water molecule and wall of
xylem vessel 9. generate by capillary action 10. by the aid of transpiration pull 11. water evaporates from the surface of the mesophyll cells
into air spaces 12. the water evaporates into surrounding through stomata 13. the water is lost from mesophyll cell is replaced by water
in thexylem Any 10
Max 10
10
Total 20
9(a)
Able to explain the processes which occur to the fat molecule Sample answer Digestion
D1. Digestion/ breakdown of fats/ lipids start/ occur in duodenum D2. Bile salt stored in gall bladder// Bile produce by the liver D3. Emulsifies fats/ lipids into droplets D4. Pancrease secretes lipase D5. lipase hydrolyse lipids droplets into fatty acids and Glycerol//
Lipids Fatty acids + Glycerol Absorption
A1. Absorption take place in small intestine/ ileum A2. Fatty acid and glycerol are absorb into lacteals/ villus
Max 10
10
59
(b)
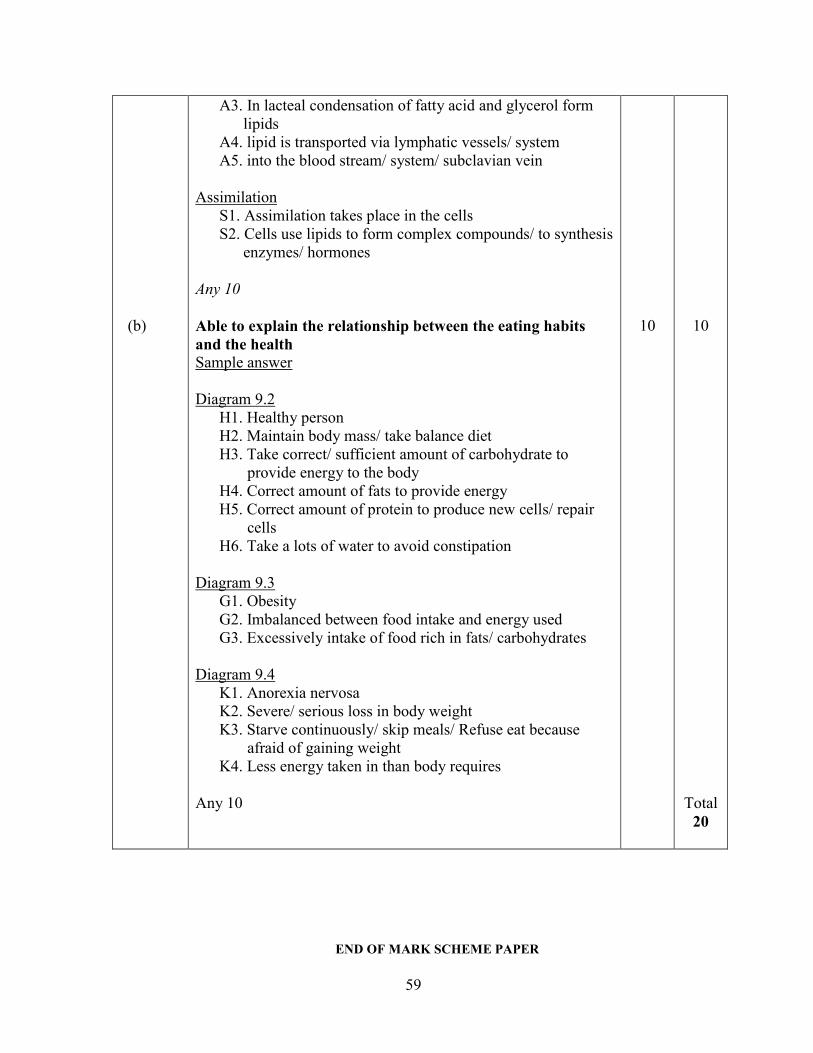
A3. In lacteal condensation of fatty acid and glycerol form lipids A4. lipid is transported via lymphatic vessels/ system A5. into the blood stream/ system/ subclavian vein
Assimilation
S1. Assimilation takes place in the cells S2. Cells use lipids to form complex compounds/ to synthesis enzymes/ hormones
Any 10 Able to explain the relationship between the eating habits and the health Sample answer Diagram 9.2
H1. Healthy person H2. Maintain body mass/ take balance diet H3. Take correct/ sufficient amount of carbohydrate to provide energy to the body H4. Correct amount of fats to provide energy H5. Correct amount of protein to produce new cells/ repair cells H6. Take a lots of water to avoid constipation
Diagram 9.3 G1. Obesity G2. Imbalanced between food intake and energy used G3. Excessively intake of food rich in fats/ carbohydrates
Diagram 9.4
K1. Anorexia nervosa K2. Severe/ serious loss in body weight K3. Starve continuously/ skip meals/ Refuse eat because afraid of gaining weight K4. Less energy taken in than body requires
Any 10
10
10
Total 20
END OF MARK SCHEME PAPER
60
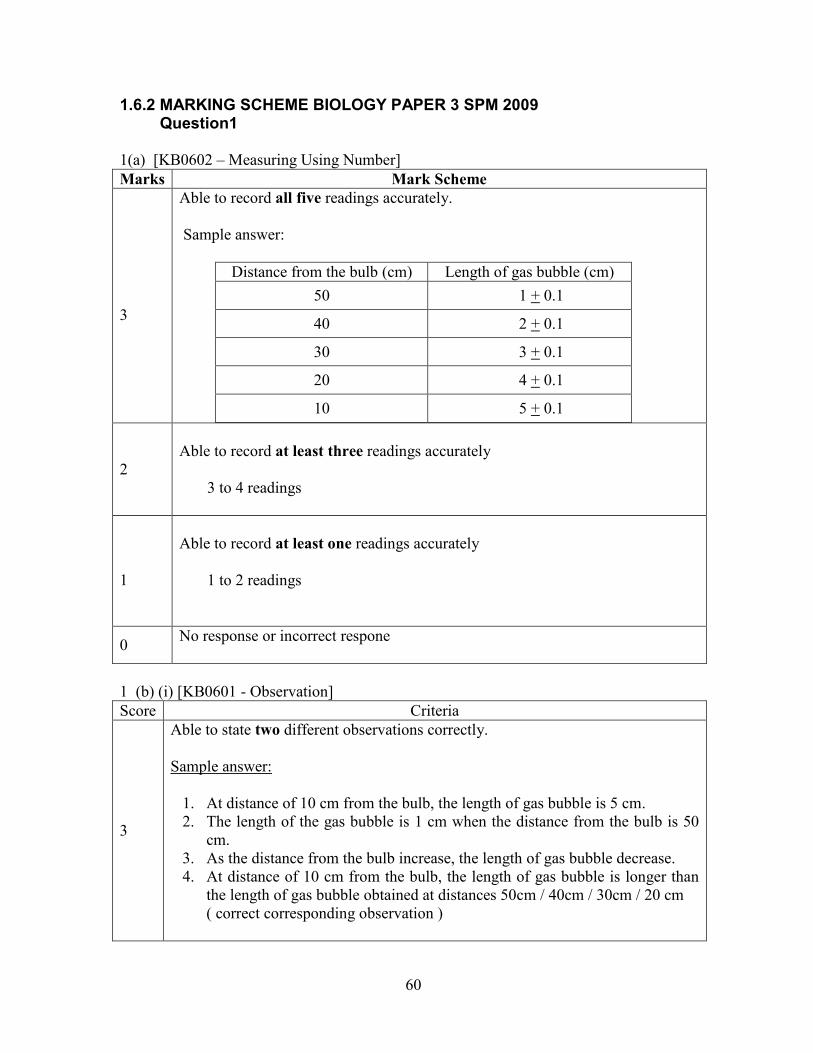
1.6.2 MARKING SCHEME BIOLOGY PAPER 3 SPM 2009 Question1 1(a) [KB0602 – Measuring Using Number] Marks Mark Scheme
3
Able to record all five readings accurately. Sample answer:
Distance from the bulb (cm) Length of gas bubble (cm) 50 1 + 0.1 40 2 + 0.1 30 3 + 0.1 20 4 + 0.1 10 5 + 0.1
2
Able to record at least three readings accurately 3 to 4 readings
1
Able to record at least one readings accurately 1 to 2 readings
0 No response or incorrect respone
1 (b) (i) [KB0601 - Observation] Score Criteria
3
Able to state two different observations correctly. Sample answer:
1. At distance of 10 cm from the bulb, the length of gas bubble is 5 cm. 2. The length of the gas bubble is 1 cm when the distance from the bulb is 50
cm. 3. As the distance from the bulb increase, the length of gas bubble decrease. 4. At distance of 10 cm from the bulb, the length of gas bubble is longer than
the length of gas bubble obtained at distances 50cm / 40cm / 30cm / 20 cm ( correct corresponding observation )
61
2
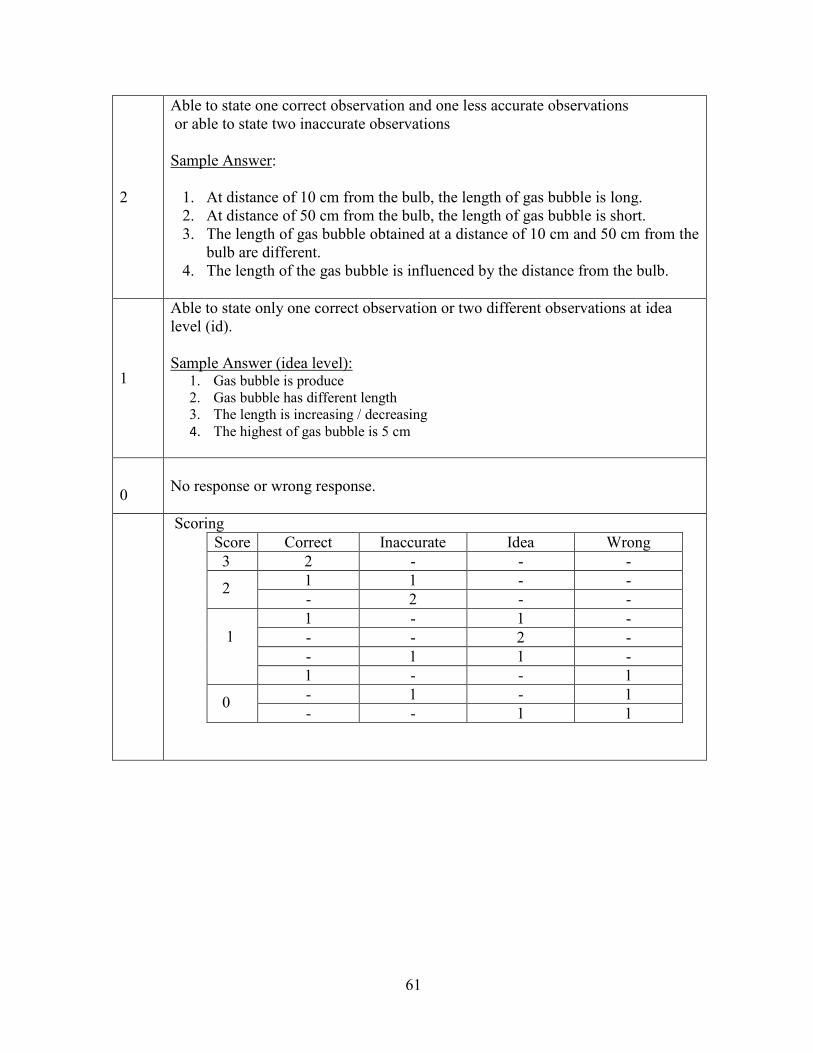
Able to state one correct observation and one less accurate observations or able to state two inaccurate observations Sample Answer:
1. At distance of 10 cm from the bulb, the length of gas bubble is long. 2. At distance of 50 cm from the bulb, the length of gas bubble is short. 3. The length of gas bubble obtained at a distance of 10 cm and 50 cm from the
bulb are different. 4. The length of the gas bubble is influenced by the distance from the bulb.
1
Able to state only one correct observation or two different observations at idea level (id). Sample Answer (idea level):
1. Gas bubble is produce 2. Gas bubble has different length 3. The length is increasing / decreasing 4. The highest of gas bubble is 5 cm
0
No response or wrong response.
Scoring Score Correct Inaccurate Idea Wrong 3 2 - - -
2 1 1 - - - 2 - -
1
1 - 1 - - - 2 - - 1 1 - 1 - - 1
0 - 1 - 1 - - 1 1
62
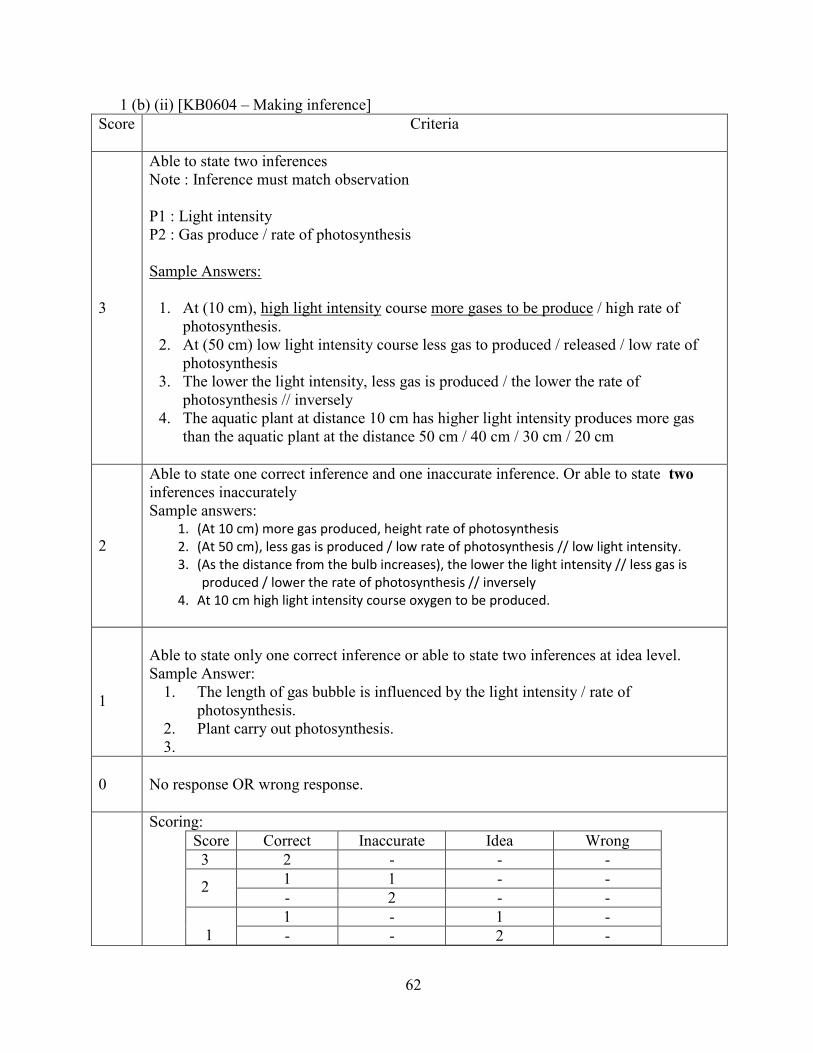
1 (b) (ii) [KB0604 – Making inference] Score Criteria
3
Able to state two inferences Note : Inference must match observation P1 : Light intensity P2 : Gas produce / rate of photosynthesis Sample Answers:
1. At (10 cm), high light intensity course more gases to be produce / high rate of photosynthesis.
2. At (50 cm) low light intensity course less gas to produced / released / low rate of photosynthesis
3. The lower the light intensity, less gas is produced / the lower the rate of photosynthesis // inversely
4. The aquatic plant at distance 10 cm has higher light intensity produces more gas than the aquatic plant at the distance 50 cm / 40 cm / 30 cm / 20 cm
2
Able to state one correct inference and one inaccurate inference. Or able to state two inferences inaccurately Sample answers:
1. (At 10 cm) more gas produced, height rate of photosynthesis 2. (At 50 cm), less gas is produced / low rate of photosynthesis // low light intensity. 3. (As the distance from the bulb increases), the lower the light intensity // less gas is
produced / lower the rate of photosynthesis // inversely 4. At 10 cm high light intensity course oxygen to be produced.
1
Able to state only one correct inference or able to state two inferences at idea level. Sample Answer:
1. The length of gas bubble is influenced by the light intensity / rate of photosynthesis.
2. Plant carry out photosynthesis. 3.
0
No response OR wrong response.
Scoring: Score Correct Inaccurate Idea Wrong 3 2 - - -
2 1 1 - - - 2 - -
1
1 - 1 - - - 2 -
63
- 1 1 - 1 - - 1
0 - 1 - 1 - - 1 1
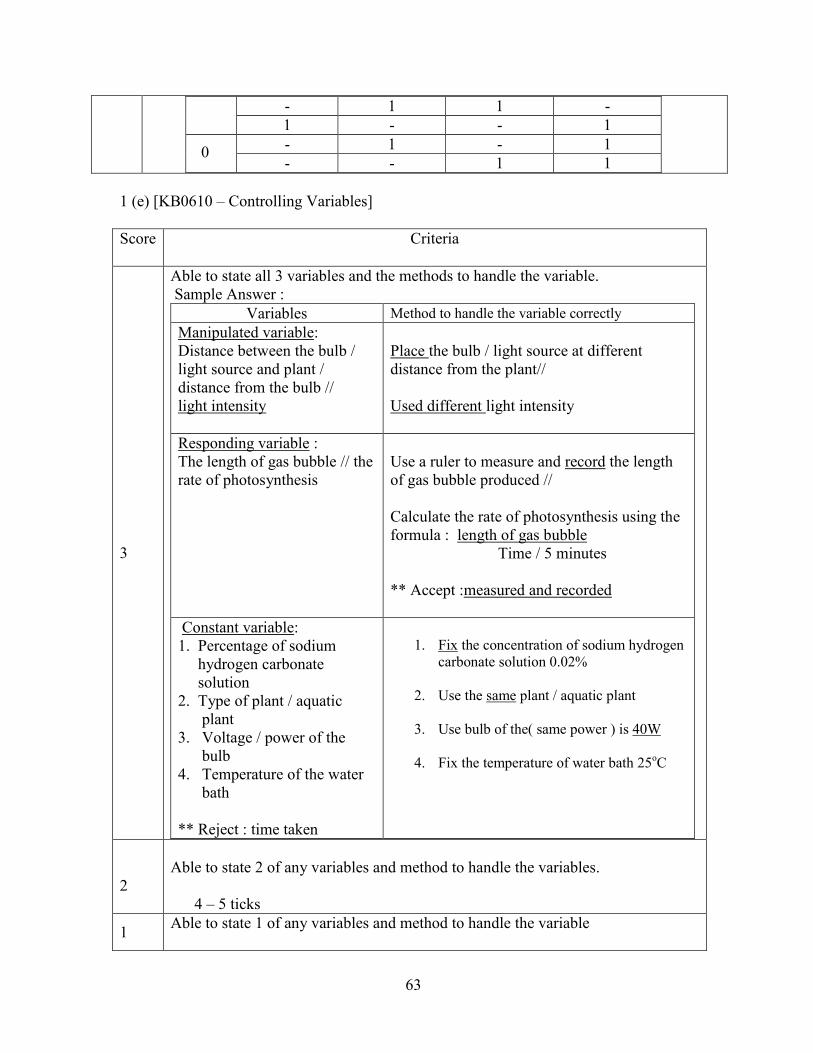
1 (e) [KB0610 – Controlling Variables] Score Criteria
3
Able to state all 3 variables and the methods to handle the variable. Sample Answer :
Variables Method to handle the variable correctly Manipulated variable: Distance between the bulb / light source and plant / distance from the bulb // light intensity
Place the bulb / light source at different distance from the plant// Used different light intensity
Responding variable : The length of gas bubble // the rate of photosynthesis
Use a ruler to measure and record the length of gas bubble produced // Calculate the rate of photosynthesis using the formula : length of gas bubble Time / 5 minutes ** Accept :measured and recorded
Constant variable: 1. Percentage of sodium hydrogen carbonate solution 2. Type of plant / aquatic plant 3. Voltage / power of the bulb 4. Temperature of the water bath ** Reject : time taken
1. Fix the concentration of sodium hydrogen
carbonate solution 0.02%
2. Use the same plant / aquatic plant
3. Use bulb of the( same power ) is 40W
4. Fix the temperature of water bath 25oC
2
Able to state 2 of any variables and method to handle the variables.
4 – 5 ticks
1 Able to state 1 of any variables and method to handle the variable
64
2-3 ticks
0
No response or only one criteria correct. 0 – 1 tick
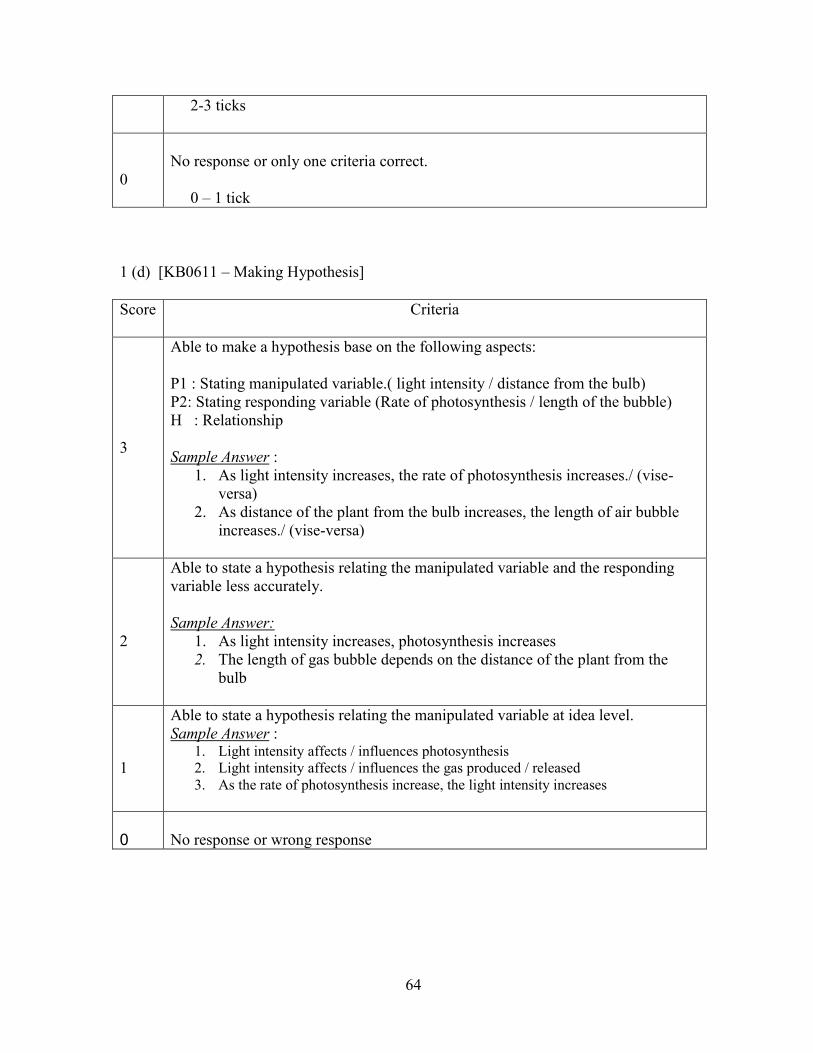
1 (d) [KB0611 – Making Hypothesis] Score Criteria
3
Able to make a hypothesis base on the following aspects: P1 : Stating manipulated variable.( light intensity / distance from the bulb) P2: Stating responding variable (Rate of photosynthesis / length of the bubble) H : Relationship Sample Answer :
1. As light intensity increases, the rate of photosynthesis increases./ (vise-versa)
2. As distance of the plant from the bulb increases, the length of air bubble increases./ (vise-versa)
2
Able to state a hypothesis relating the manipulated variable and the responding variable less accurately. Sample Answer:
1. As light intensity increases, photosynthesis increases 2. The length of gas bubble depends on the distance of the plant from the
bulb
1
Able to state a hypothesis relating the manipulated variable at idea level. Sample Answer :
1. Light intensity affects / influences photosynthesis 2. Light intensity affects / influences the gas produced / released 3. As the rate of photosynthesis increase, the light intensity increases
0
No response or wrong response
65
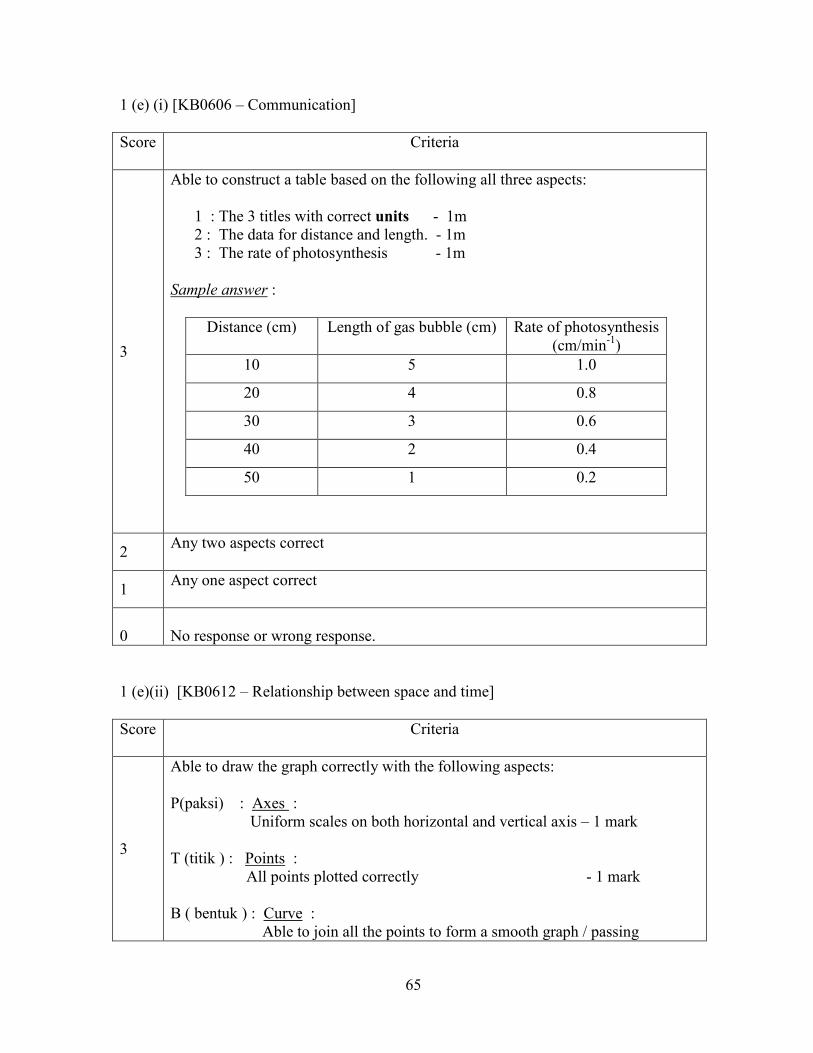
1 (e) (i) [KB0606 – Communication] Score Criteria
3
Able to construct a table based on the following all three aspects:
1 : The 3 titles with correct units - 1m 2 : The data for distance and length. - 1m 3 : The rate of photosynthesis - 1m
Sample answer :
Distance (cm) Length of gas bubble (cm) Rate of photosynthesis (cm/min-1)
10 5 1.0
20 4 0.8
30 3 0.6
40 2 0.4
50 1 0.2
2 Any two aspects correct
1 Any one aspect correct
0
No response or wrong response.
1 (e)(ii) [KB0612 – Relationship between space and time] Score Criteria
3
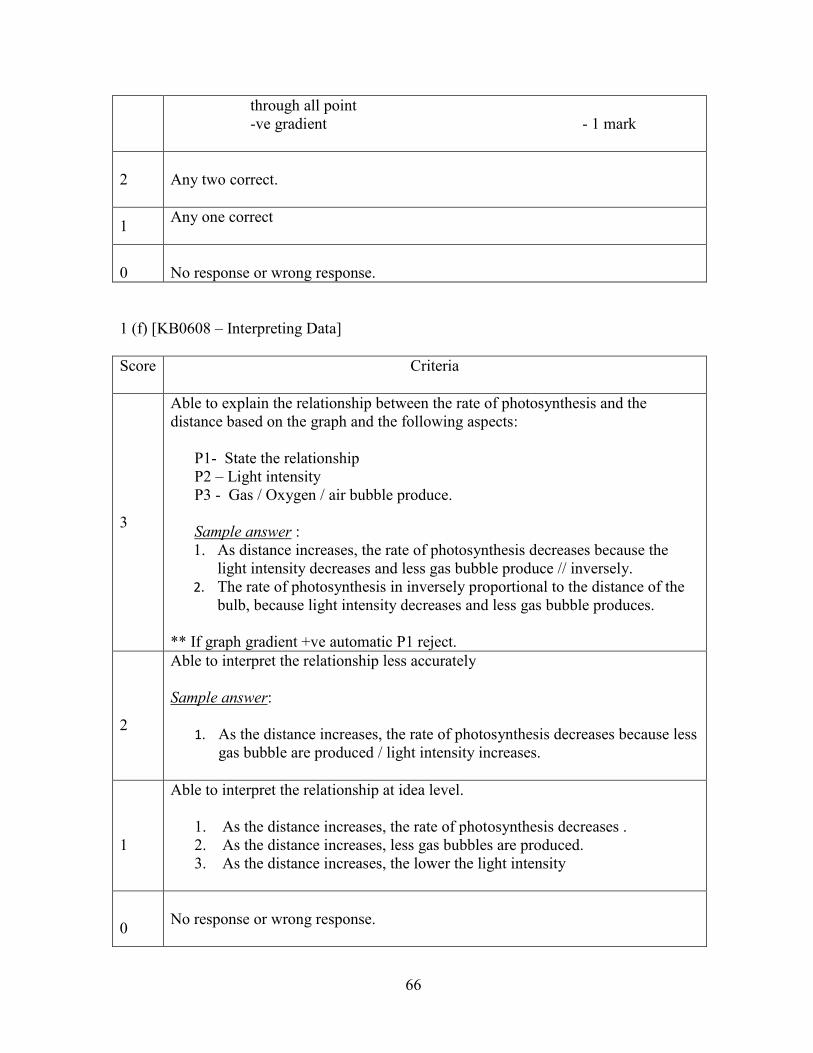
Able to draw the graph correctly with the following aspects: P(paksi) : Axes : Uniform scales on both horizontal and vertical axis – 1 mark T (titik ) : Points : All points plotted correctly - 1 mark B ( bentuk ) : Curve : Able to join all the points to form a smooth graph / passing
66
through all point -ve gradient - 1 mark
2 Any two correct.
1 Any one correct
0
No response or wrong response.
1 (f) [KB0608 – Interpreting Data] Score Criteria
3
Able to explain the relationship between the rate of photosynthesis and the distance based on the graph and the following aspects: P1- State the relationship P2 – Light intensity P3 - Gas / Oxygen / air bubble produce. Sample answer :
1. As distance increases, the rate of photosynthesis decreases because the light intensity decreases and less gas bubble produce // inversely.
2. The rate of photosynthesis in inversely proportional to the distance of the bulb, because light intensity decreases and less gas bubble produces.
** If graph gradient +ve automatic P1 reject.
2
Able to interpret the relationship less accurately Sample answer:
1. As the distance increases, the rate of photosynthesis decreases because less gas bubble are produced / light intensity increases.
1
Able to interpret the relationship at idea level. 1. As the distance increases, the rate of photosynthesis decreases . 2. As the distance increases, less gas bubbles are produced. 3. As the distance increases, the lower the light intensity
0
No response or wrong response.
67
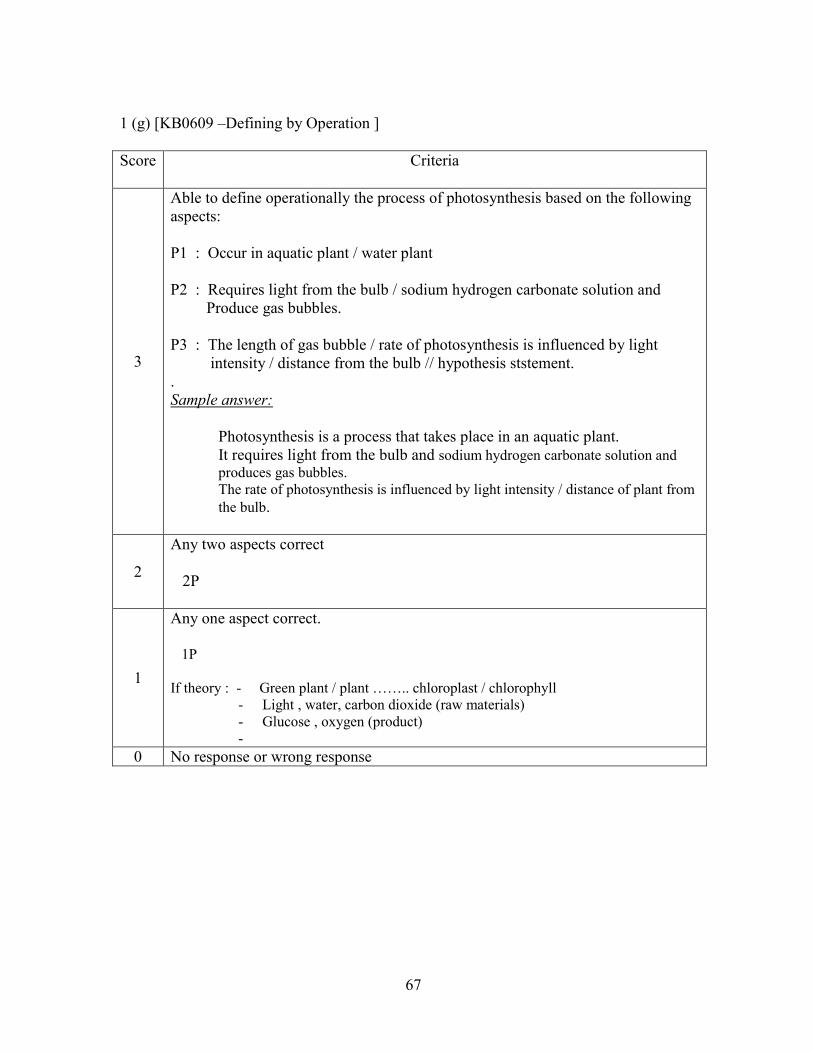
1 (g) [KB0609 –Defining by Operation ] Score Criteria
3
Able to define operationally the process of photosynthesis based on the following aspects: P1 : Occur in aquatic plant / water plant P2 : Requires light from the bulb / sodium hydrogen carbonate solution and Produce gas bubbles. P3 : The length of gas bubble / rate of photosynthesis is influenced by light intensity / distance from the bulb // hypothesis ststement. . Sample answer:
Photosynthesis is a process that takes place in an aquatic plant. It requires light from the bulb and sodium hydrogen carbonate solution and produces gas bubbles. The rate of photosynthesis is influenced by light intensity / distance of plant from the bulb.
2
Any two aspects correct 2P
1
Any one aspect correct. 1P If theory : - Green plant / plant …….. chloroplast / chlorophyll
- Light , water, carbon dioxide (raw materials) - Glucose , oxygen (product) -
0 No response or wrong response
68
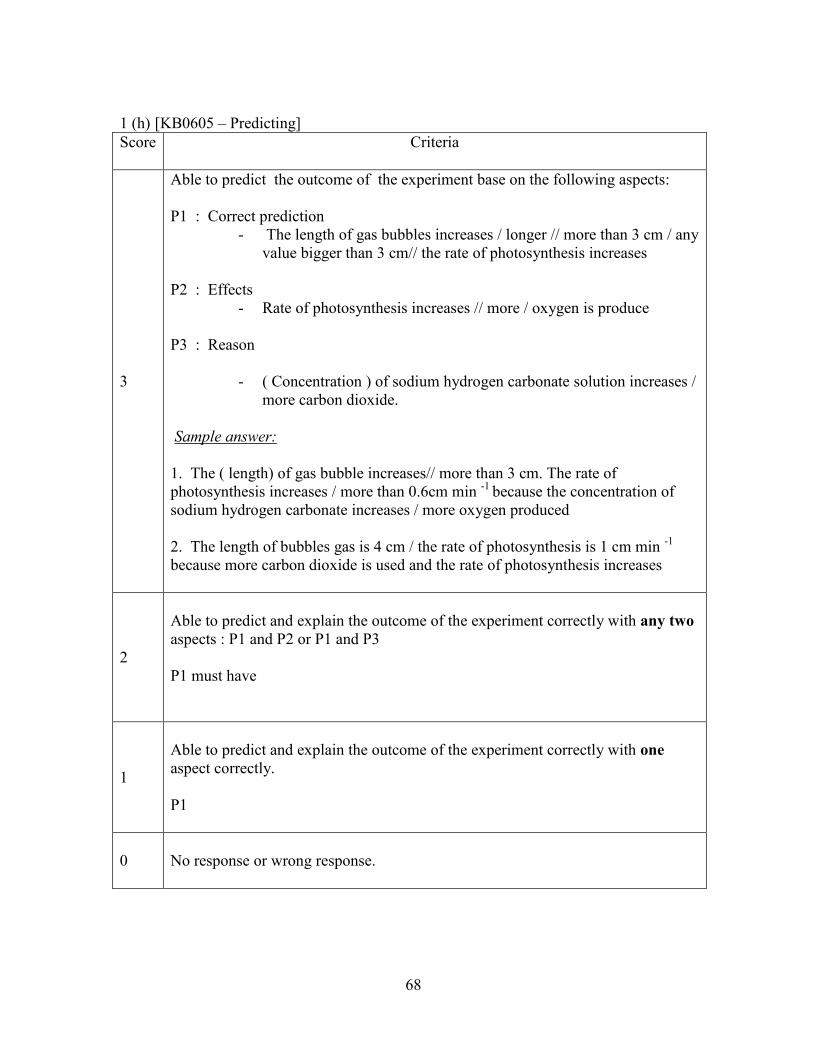
1 (h) [KB0605 – Predicting] Score Criteria
3
Able to predict the outcome of the experiment base on the following aspects: P1 : Correct prediction
- The length of gas bubbles increases / longer // more than 3 cm / any value bigger than 3 cm// the rate of photosynthesis increases
P2 : Effects
- Rate of photosynthesis increases // more / oxygen is produce
P3 : Reason
- ( Concentration ) of sodium hydrogen carbonate solution increases / more carbon dioxide.
Sample answer: 1. The ( length) of gas bubble increases// more than 3 cm. The rate of photosynthesis increases / more than 0.6cm min -1 because the concentration of sodium hydrogen carbonate increases / more oxygen produced 2. The length of bubbles gas is 4 cm / the rate of photosynthesis is 1 cm min -1
because more carbon dioxide is used and the rate of photosynthesis increases
2
Able to predict and explain the outcome of the experiment correctly with any two aspects : P1 and P2 or P1 and P3 P1 must have
1
Able to predict and explain the outcome of the experiment correctly with one aspect correctly. P1
0
No response or wrong response.
69
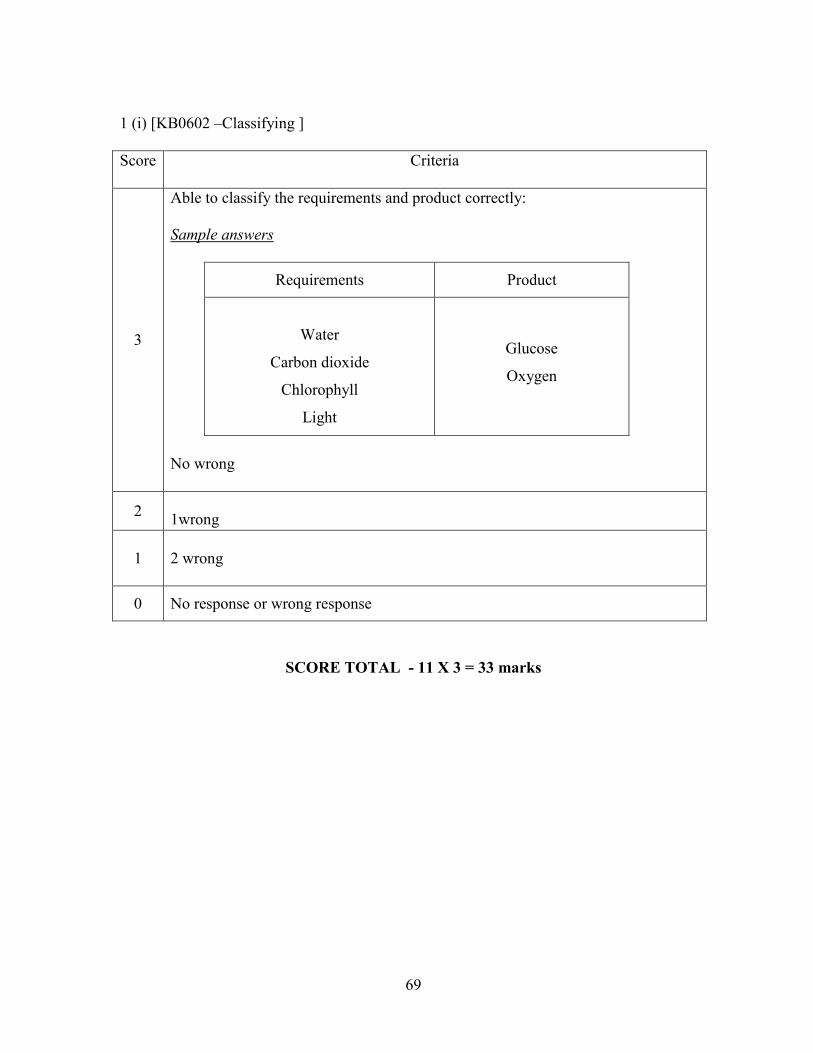
1 (i) [KB0602 –Classifying ] Score Criteria
3
Able to classify the requirements and product correctly: Sample answers
Requirements Product
Water
Carbon dioxide
Chlorophyll
Light
Glucose
Oxygen
No wrong
2 1wrong
1 2 wrong
0 No response or wrong response
SCORE TOTAL - 11 X 3 = 33 marks
70
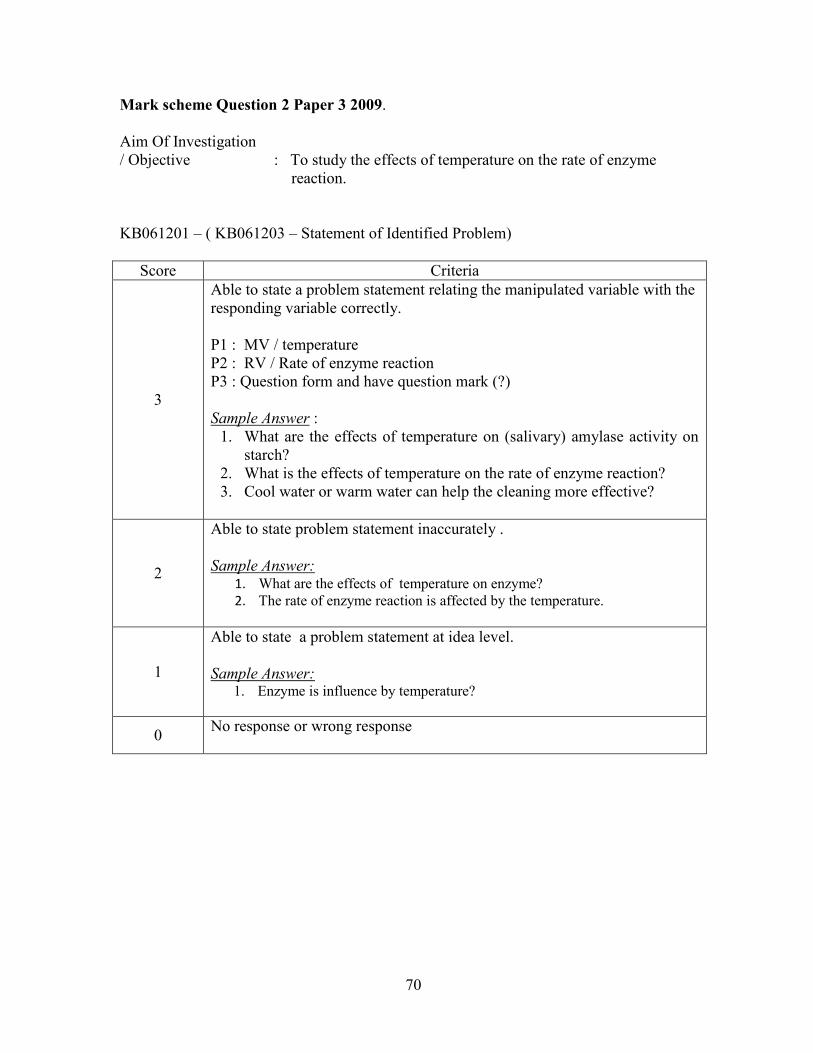
Mark scheme Question 2 Paper 3 2009. Aim Of Investigation / Objective : To study the effects of temperature on the rate of enzyme
reaction. KB061201 – ( KB061203 – Statement of Identified Problem)
Score Criteria
3
Able to state a problem statement relating the manipulated variable with the responding variable correctly. P1 : MV / temperature P2 : RV / Rate of enzyme reaction P3 : Question form and have question mark (?) Sample Answer :
1. What are the effects of temperature on (salivary) amylase activity on starch?
2. What is the effects of temperature on the rate of enzyme reaction? 3. Cool water or warm water can help the cleaning more effective?
2
Able to state problem statement inaccurately . Sample Answer:
1. What are the effects of temperature on enzyme? 2. The rate of enzyme reaction is affected by the temperature.
1
Able to state a problem statement at idea level. Sample Answer:
1. Enzyme is influence by temperature?
0 No response or wrong response
71
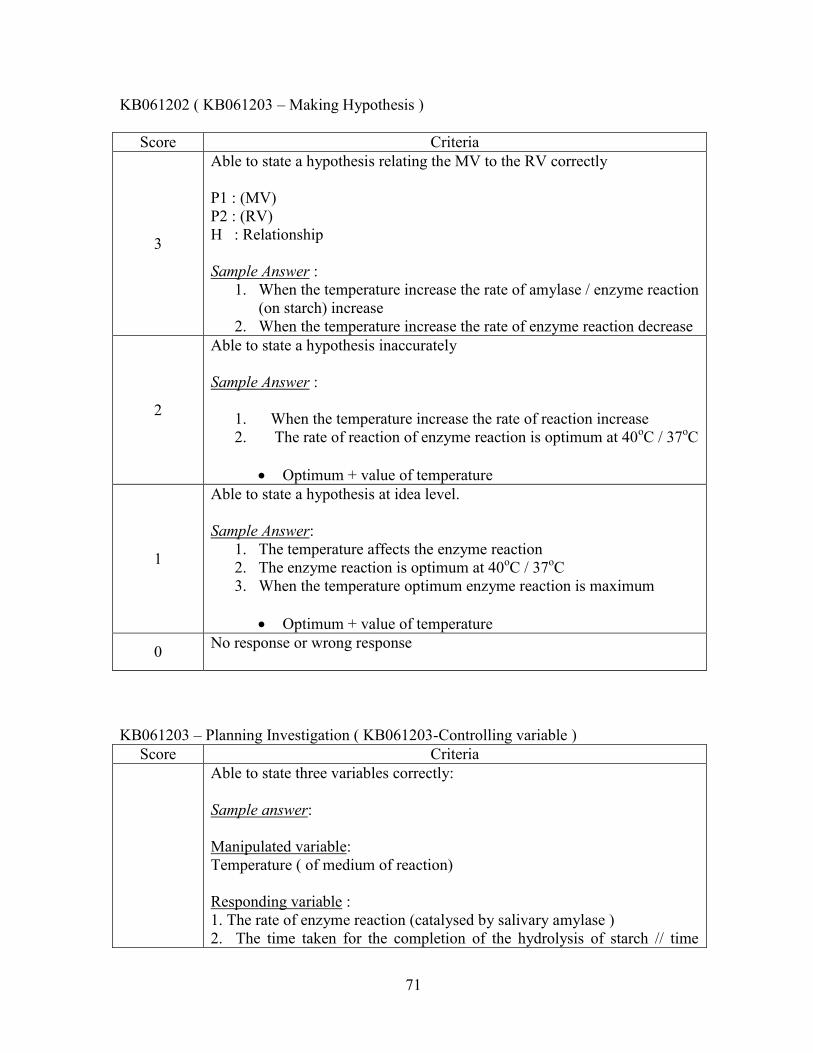
KB061202 ( KB061203 – Making Hypothesis )
Score Criteria
3
Able to state a hypothesis relating the MV to the RV correctly P1 : (MV) P2 : (RV) H : Relationship Sample Answer :
1. When the temperature increase the rate of amylase / enzyme reaction (on starch) increase
2. When the temperature increase the rate of enzyme reaction decrease
2
Able to state a hypothesis inaccurately Sample Answer : 1. When the temperature increase the rate of reaction increase 2. The rate of reaction of enzyme reaction is optimum at 40oC / 37oC
Optimum + value of temperature
1
Able to state a hypothesis at idea level. Sample Answer:
1. The temperature affects the enzyme reaction 2. The enzyme reaction is optimum at 40oC / 37oC 3. When the temperature optimum enzyme reaction is maximum
Optimum + value of temperature
0 No response or wrong response
KB061203 – Planning Investigation ( KB061203-Controlling variable )
Score Criteria Able to state three variables correctly:
Sample answer: Manipulated variable: Temperature ( of medium of reaction) Responding variable : 1. The rate of enzyme reaction (catalysed by salivary amylase ) 2. The time taken for the completion of the hydrolysis of starch // time
72
taken for reaction of enzyme. Controlled variable: 1. Volume of amylase / saliva 2. Concentration of amylase 3. Volume of starch suspension 4. Concentration of starch suspension 5. pH value 6. Type of enzyme
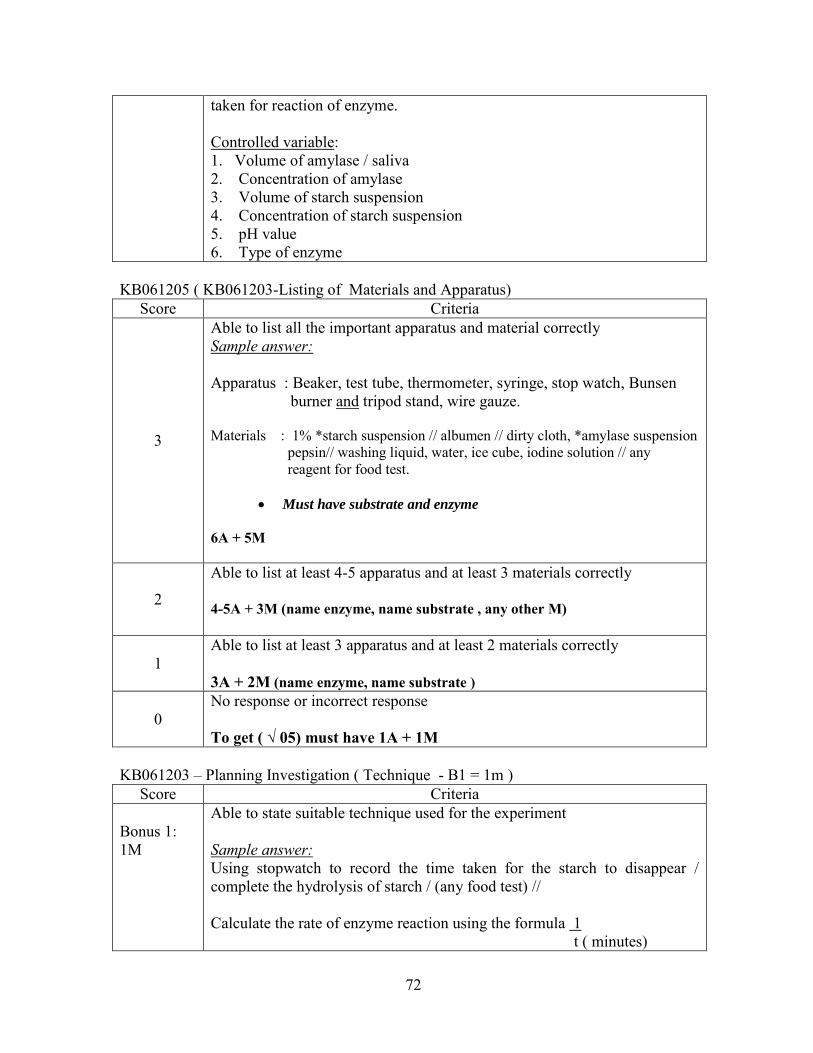
KB061205 ( KB061203-Listing of Materials and Apparatus)
Score Criteria
3
Able to list all the important apparatus and material correctly Sample answer: Apparatus : Beaker, test tube, thermometer, syringe, stop watch, Bunsen burner and tripod stand, wire gauze. Materials : 1% *starch suspension // albumen // dirty cloth, *amylase suspension pepsin// washing liquid, water, ice cube, iodine solution // any reagent for food test.
Must have substrate and enzyme
6A + 5M
2
Able to list at least 4-5 apparatus and at least 3 materials correctly 4-5A + 3M (name enzyme, name substrate , any other M)
1 Able to list at least 3 apparatus and at least 2 materials correctly 3A + 2M (name enzyme, name substrate )
0 No response or incorrect response To get ( √ 05) must have 1A + 1M
KB061203 – Planning Investigation ( Technique - B1 = 1m )
Score Criteria Bonus 1: 1M
Able to state suitable technique used for the experiment Sample answer: Using stopwatch to record the time taken for the starch to disappear / complete the hydrolysis of starch / (any food test) // Calculate the rate of enzyme reaction using the formula 1 t ( minutes)
73
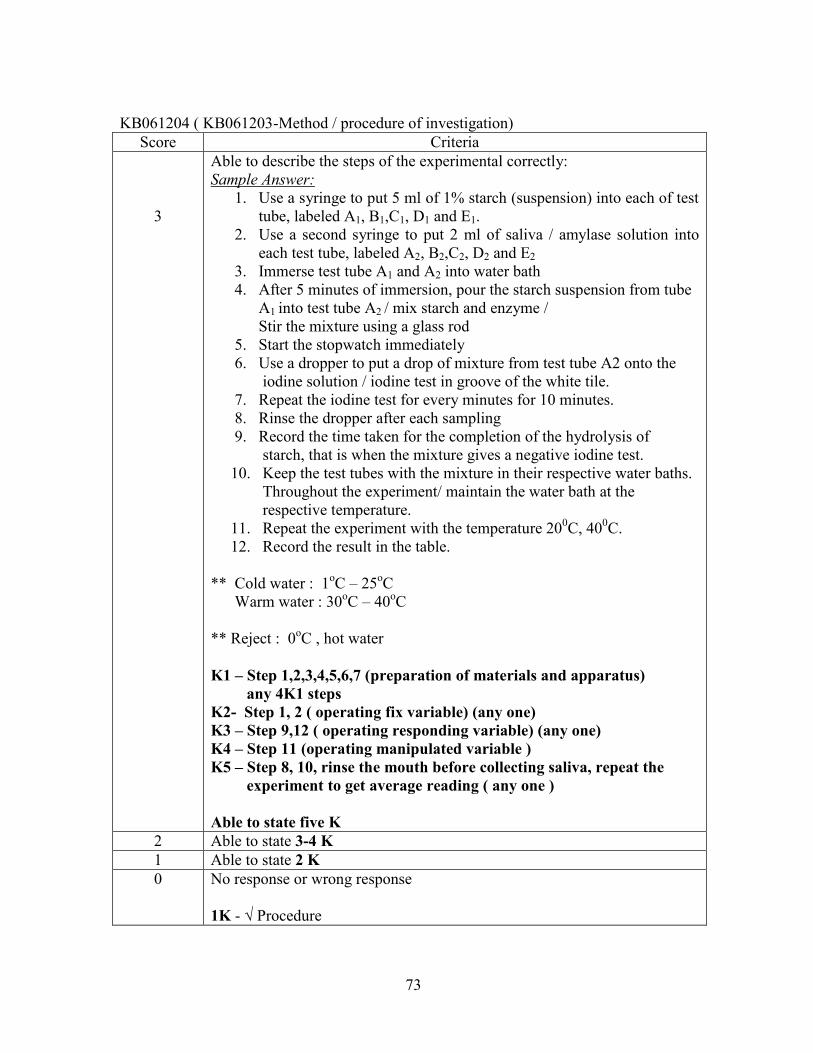
KB061204 ( KB061203-Method / procedure of investigation)
Score Criteria 3
Able to describe the steps of the experimental correctly: Sample Answer:
1. Use a syringe to put 5 ml of 1% starch (suspension) into each of test tube, labeled A1, B1,C1, D1 and E1.
2. Use a second syringe to put 2 ml of saliva / amylase solution into each test tube, labeled A2, B2,C2, D2 and E2
3. Immerse test tube A1 and A2 into water bath 4. After 5 minutes of immersion, pour the starch suspension from tube
A1 into test tube A2 / mix starch and enzyme / Stir the mixture using a glass rod 5. Start the stopwatch immediately 6. Use a dropper to put a drop of mixture from test tube A2 onto the iodine solution / iodine test in groove of the white tile. 7. Repeat the iodine test for every minutes for 10 minutes. 8. Rinse the dropper after each sampling 9. Record the time taken for the completion of the hydrolysis of starch, that is when the mixture gives a negative iodine test. 10. Keep the test tubes with the mixture in their respective water baths. Throughout the experiment/ maintain the water bath at the respective temperature. 11. Repeat the experiment with the temperature 200C, 400C. 12. Record the result in the table. ** Cold water : 1oC – 25oC Warm water : 30oC – 40oC ** Reject : 0oC , hot water K1 – Step 1,2,3,4,5,6,7 (preparation of materials and apparatus) any 4K1 steps K2- Step 1, 2 ( operating fix variable) (any one) K3 – Step 9,12 ( operating responding variable) (any one) K4 – Step 11 (operating manipulated variable ) K5 – Step 8, 10, rinse the mouth before collecting saliva, repeat the experiment to get average reading ( any one ) Able to state five K
2 Able to state 3-4 K 1 Able to state 2 K 0 No response or wrong response
1K - √ Procedure
74
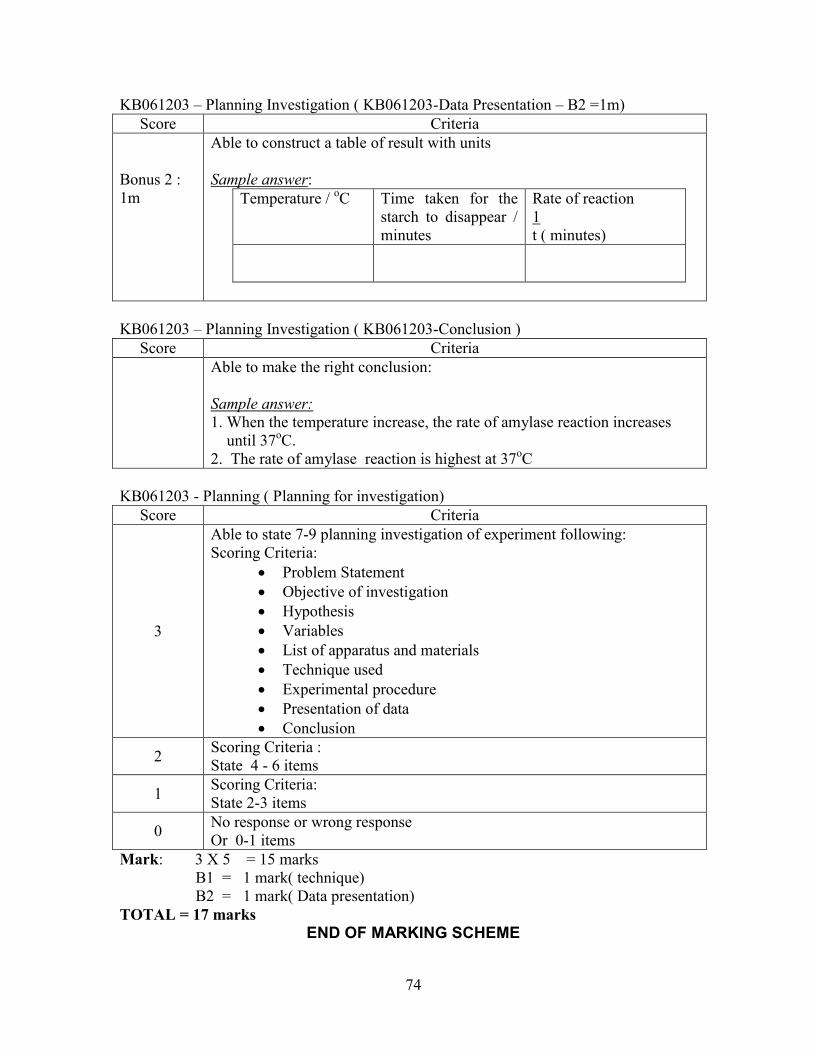
KB061203 – Planning Investigation ( KB061203-Data Presentation – B2 =1m) Score Criteria
Bonus 2 : 1m
Able to construct a table of result with units Sample answer:
Temperature / oC Time taken for the starch to disappear / minutes
Rate of reaction 1 t ( minutes)
KB061203 – Planning Investigation ( KB061203-Conclusion )
Score Criteria Able to make the right conclusion:
Sample answer: 1. When the temperature increase, the rate of amylase reaction increases until 37oC. 2. The rate of amylase reaction is highest at 37oC
KB061203 - Planning ( Planning for investigation)
Score Criteria
3
Able to state 7-9 planning investigation of experiment following: Scoring Criteria:
Problem Statement Objective of investigation Hypothesis Variables List of apparatus and materials Technique used Experimental procedure Presentation of data Conclusion
2 Scoring Criteria : State 4 - 6 items
1 Scoring Criteria: State 2-3 items
0 No response or wrong response Or 0-1 items
Mark: 3 X 5 = 15 marks B1 = 1 mark( technique) B2 = 1 mark( Data presentation) TOTAL = 17 marks
END OF MARKING SCHEME
75
PAPER 3 (EXERCELANCE STUDENT’S ANSWER)
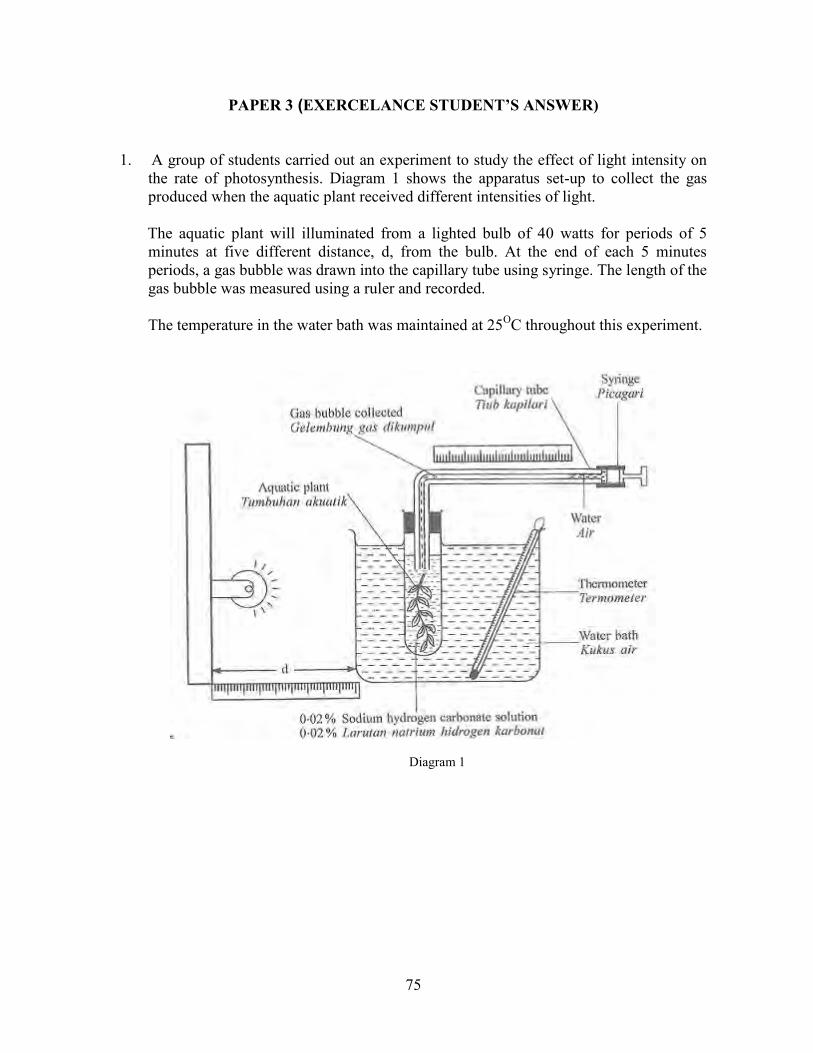
1. A group of students carried out an experiment to study the effect of light intensity on
the rate of photosynthesis. Diagram 1 shows the apparatus set-up to collect the gas produced when the aquatic plant received different intensities of light.
The aquatic plant will illuminated from a lighted bulb of 40 watts for periods of 5
minutes at five different distance, d, from the bulb. At the end of each 5 minutes periods, a gas bubble was drawn into the capillary tube using syringe. The length of the gas bubble was measured using a ruler and recorded.
The temperature in the water bath was maintained at 25OC throughout this experiment.
Diagram 1
76
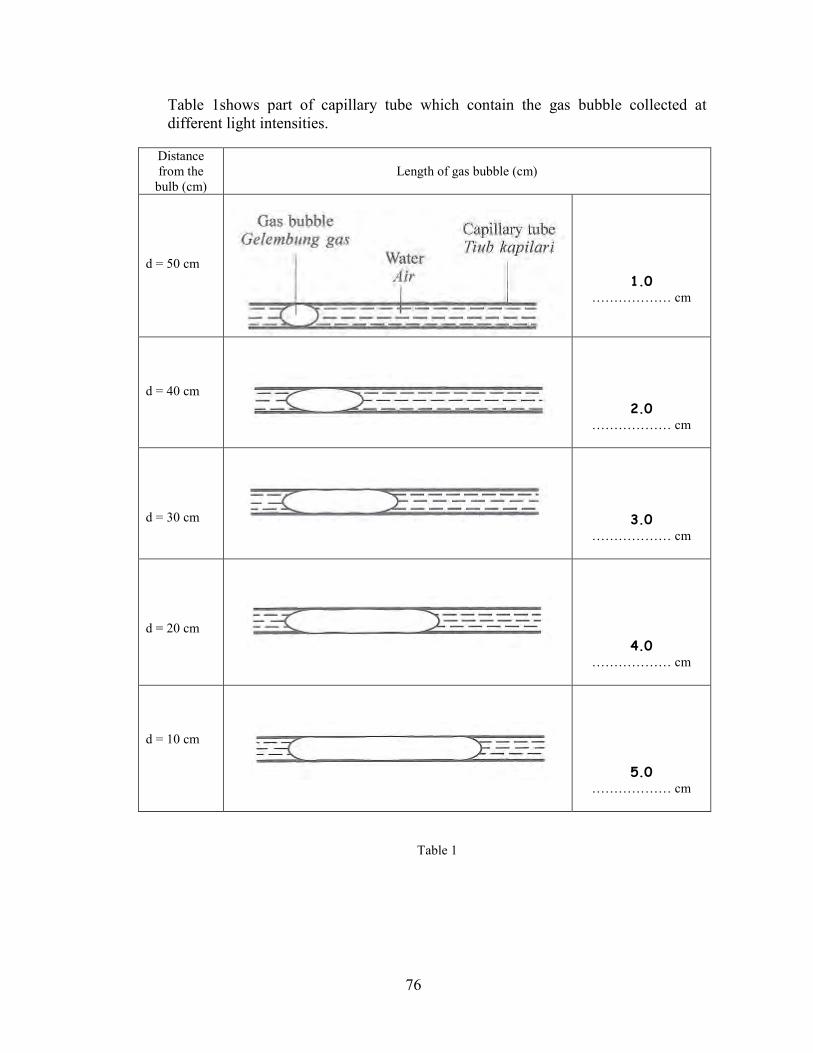
Table 1shows part of capillary tube which contain the gas bubble collected at different light intensities.
Distance from the
bulb (cm) Length of gas bubble (cm)
d = 50 cm
1.0 ……………… cm
d = 40 cm
2.0 ……………… cm
d = 30 cm
3.0 ……………… cm
d = 20 cm
4.0 ……………… cm
d = 10 cm
5.0 ……………… cm
Table 1
77
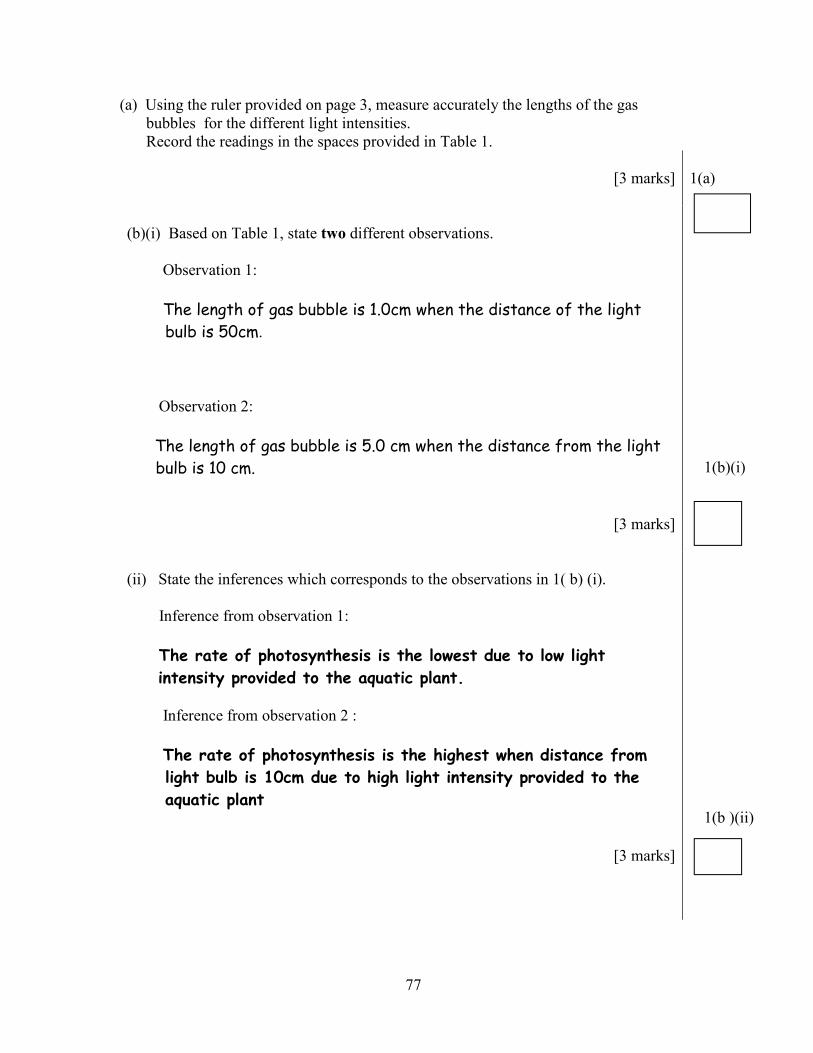
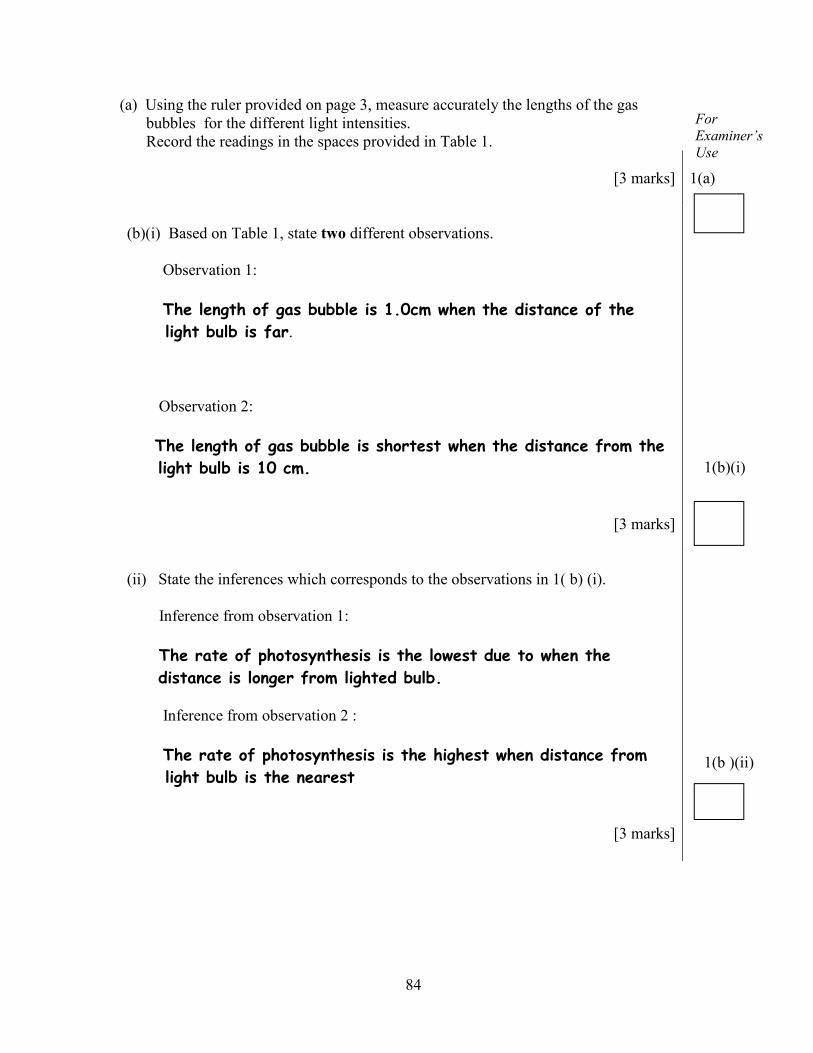
(a) Using the ruler provided on page 3, measure accurately the lengths of the gas bubbles for the different light intensities. Record the readings in the spaces provided in Table 1.
[3 marks]
1(a)
(b)(i) Based on Table 1, state two different observations. Observation 1: The length of gas bubble is 1.0cm when the distance of the light
bulb is 50cm. Observation 2: The length of gas bubble is 5.0 cm when the distance from the light
bulb is 10 cm.
[3 marks]
(ii) State the inferences which corresponds to the observations in 1( b) (i). Inference from observation 1: The rate of photosynthesis is the lowest due to low light
intensity provided to the aquatic plant. Inference from observation 2 : The rate of photosynthesis is the highest when distance from
light bulb is 10cm due to high light intensity provided to the
aquatic plant
[3 marks]
1(b )(ii)
1(b)(i)
78
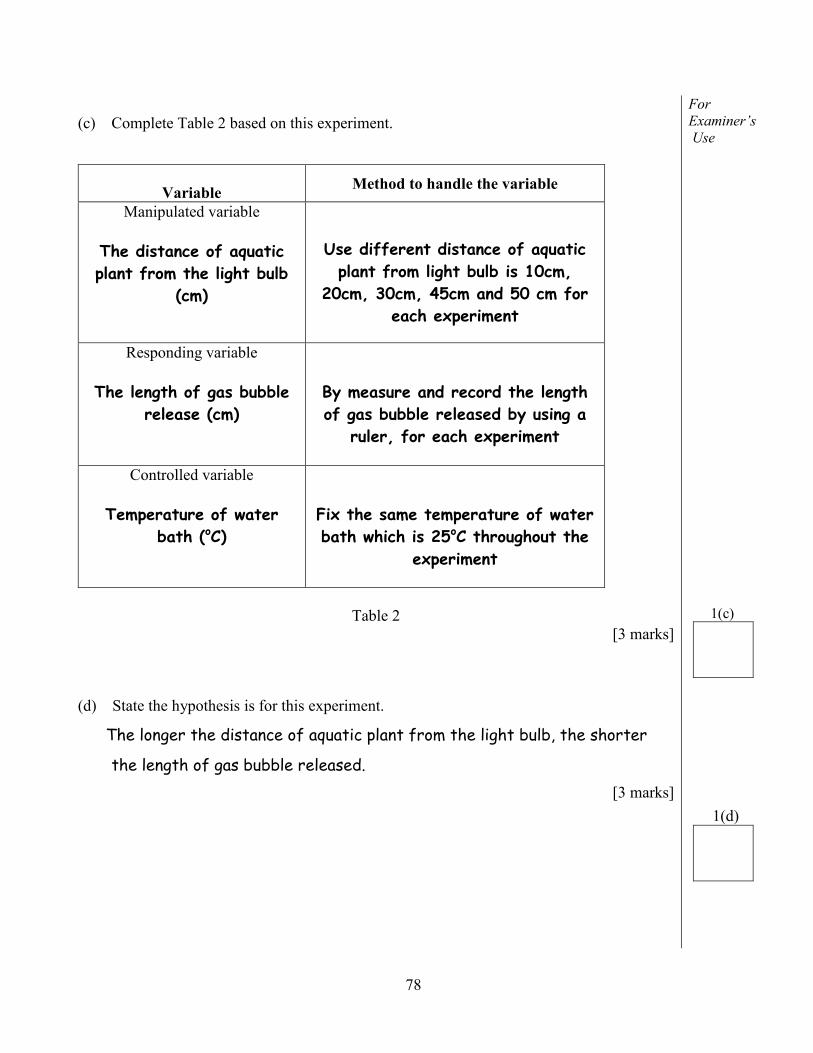
(c) Complete Table 2 based on this experiment.
For Examiner’s Use
Variable Method to handle the variable
Manipulated variable
The distance of aquatic
plant from the light bulb
(cm)
Use different distance of aquatic
plant from light bulb is 10cm,
20cm, 30cm, 45cm and 50 cm for
each experiment
Responding variable
The length of gas bubble
release (cm)
By measure and record the length
of gas bubble released by using a
ruler, for each experiment
Controlled variable
Temperature of water
bath (oC)
Fix the same temperature of water
bath which is 25oC throughout the
experiment
Table 2
[3 marks]
1(c)
(d) State the hypothesis is for this experiment.
The longer the distance of aquatic plant from the light bulb, the shorter
the length of gas bubble released.
[3 marks]
1(d)
79
(e) (i) Construct a table and record all the data collected in this experiment. Your table should have the following titles:
- Distance from the bulb - Length of gas bubble - Rate of photosynthesis
Rate of photosynthesis = Length of gas bubble Time
Distance from the
bulb / ( cm)
Length of gas
bubble / (cm)
Rate of photosynthesis
/ (cmmin-1)
10 5.0 1.0
20 4.0 0.8
30 3.0 0.6
40 2.0 0.4
50 1.0 0.2
[3marks]
(e) (ii) Use the graph paper provided on the page 8 to answer this part of the question. Using the data in 1(e)(i) , draw the graph of the rate of photosynthesis against the distance from the bulb.
[3 marks]
1(e)(ii)
For Examiner’s Use
1(e)(i)
80
Graph of the rate of photosynthesis against the distance from the bulb (f) Based on the graph in 1(e)(ii), explain the relationship between the rate of photosynthesis and the distance from the bulb. The rate of photosynthesis increases as the distance from the bulb
81
(i) Using the list provided below, in Table 3, classify the requirements to carry out the process of photosynthesis and the products obtained.
Requirements Products
Chlorophyll
Light
Carbon dioxide
Water
Glucose
Oxygen
Table 3
[3 marks]
1(i) Total
For Examiner’s Use
1(g)
Water, Light, Oxygen, Glucose , Carbon dioxide, Chlorophyll
82
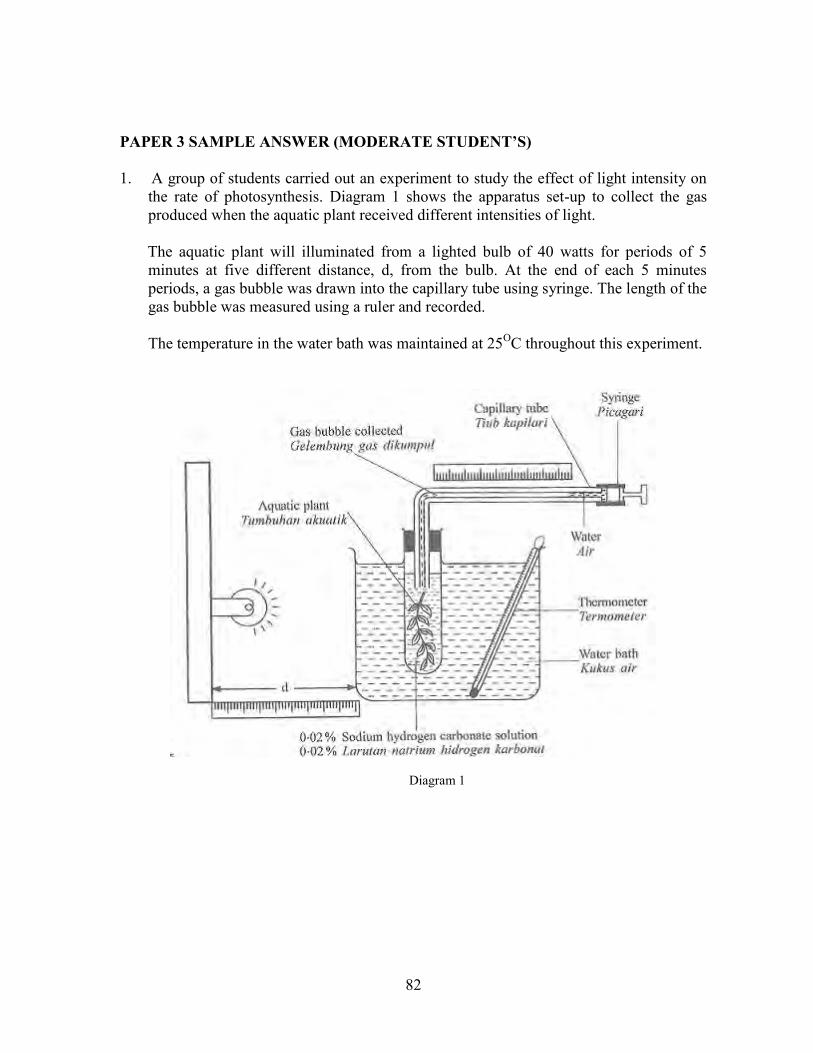
PAPER 3 SAMPLE ANSWER (MODERATE STUDENT’S) 1. A group of students carried out an experiment to study the effect of light intensity on
the rate of photosynthesis. Diagram 1 shows the apparatus set-up to collect the gas produced when the aquatic plant received different intensities of light.
The aquatic plant will illuminated from a lighted bulb of 40 watts for periods of 5
minutes at five different distance, d, from the bulb. At the end of each 5 minutes periods, a gas bubble was drawn into the capillary tube using syringe. The length of the gas bubble was measured using a ruler and recorded.
The temperature in the water bath was maintained at 25OC throughout this experiment.
Diagram 1
83
Table 1shows part of capillary tube which contain the gas bubble collected at different light intensities.
Distance from the
bulb (cm) Length of gas bubble (cm)
d = 50 cm
1.0 ……………… cm
d = 40 cm
2.0 ……………… cm
d = 30 cm
3.0 ……………… cm
d = 20 cm
4.0 ……………… cm
d = 10 cm
5.0 ……………… cm
Table 1
84
(a) Using the ruler provided on page 3, measure accurately the lengths of the gas bubbles for the different light intensities. Record the readings in the spaces provided in Table 1.
[3 marks]
1(a)
(b)(i) Based on Table 1, state two different observations. Observation 1: The length of gas bubble is 1.0cm when the distance of the
light bulb is far. Observation 2: The length of gas bubble is shortest when the distance from the
light bulb is 10 cm.
[3 marks]
(ii) State the inferences which corresponds to the observations in 1( b) (i). Inference from observation 1: The rate of photosynthesis is the lowest due to when the
distance is longer from lighted bulb. Inference from observation 2 : The rate of photosynthesis is the highest when distance from
light bulb is the nearest
[3 marks]
For Examiner’s Use 1(g)
1(b )(ii)
1(b)(i)
85
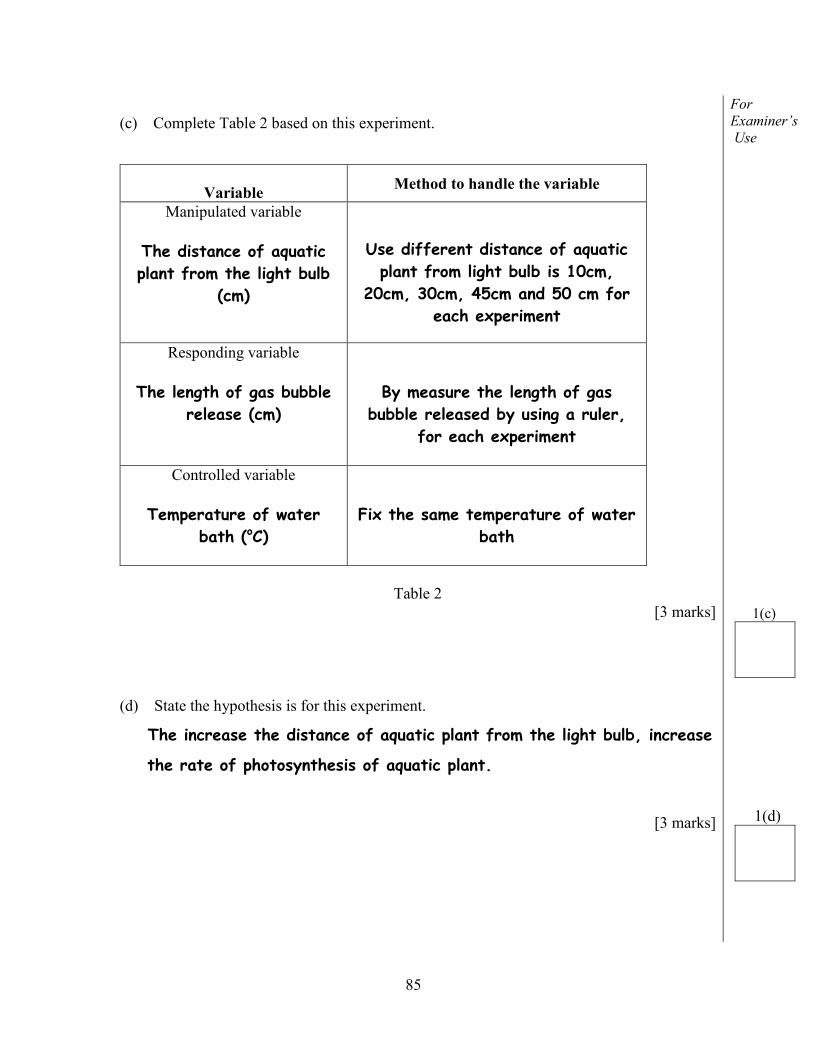
(c) Complete Table 2 based on this experiment.
For Examiner’s Use
Variable Method to handle the variable
Manipulated variable
The distance of aquatic
plant from the light bulb
(cm)
Use different distance of aquatic
plant from light bulb is 10cm,
20cm, 30cm, 45cm and 50 cm for
each experiment
Responding variable
The length of gas bubble
release (cm)
By measure the length of gas
bubble released by using a ruler,
for each experiment
Controlled variable
Temperature of water
bath (oC)
Fix the same temperature of water
bath
Table 2
[3 marks]
1(c)
(d) State the hypothesis is for this experiment.
The increase the distance of aquatic plant from the light bulb, increase
the rate of photosynthesis of aquatic plant.
[3 marks]
1(d)
86
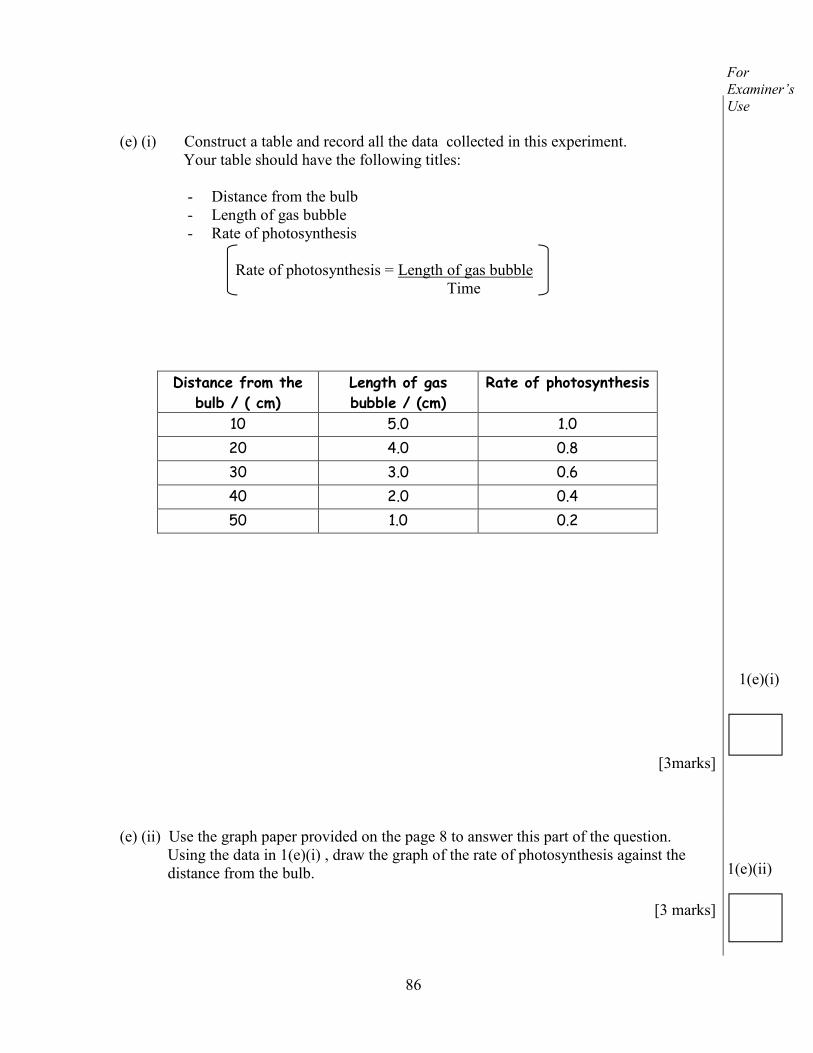
(e) (i) Construct a table and record all the data collected in this experiment. Your table should have the following titles:
- Distance from the bulb - Length of gas bubble - Rate of photosynthesis
Rate of photosynthesis = Length of gas bubble Time
Distance from the
bulb / ( cm)
Length of gas
bubble / (cm)
Rate of photosynthesis
10 5.0 1.0
20 4.0 0.8
30 3.0 0.6
40 2.0 0.4
50 1.0 0.2
[3marks]
(e) (ii) Use the graph paper provided on the page 8 to answer this part of the question. Using the data in 1(e)(i) , draw the graph of the rate of photosynthesis against the distance from the bulb.
[3 marks]
1(e)(ii)
For Examiner’s Use
1(e)(i)
87 Graph of the rate of photosynthesis against the distance from the bulb
88
(ii) Using the list provided below, in Table 3, classify the requirements to carry out the
process of photosynthesis and the products obtained.
Requirements Products
Chlorophyll
Light
Carbon dioxide
Glucose
Oxygen
Water
Table 3
[3 marks]
1(i) Total
For Examiner’s Use
1(g)
Water, Light, Oxygen, Glucose , Carbon dioxide, Chlorophyll
89
EXAMPLE ANSWER (QUESTION 2 ) 2. Situation 1A
Housewife A uses warm water to wash her clothes using washing liquid which contains added enzyme. The cleaning is more effective. Situation 2 Using the same washing liquid as in situation 1, housewife B uses cold water to wash her clothes. The cleaning is less effective. Base on both situation, design a laboratory experiment to study the effect of temperature on the rate of enzyme reaction.
The planning of your experiment must include the following aspects:
Problem statement
Aim of investigation
Hypothesis
Variables
List of apparatus and materials
Technique used
Experimental procedure or method
Presentation of data
Conclusion
[17 marks]
90
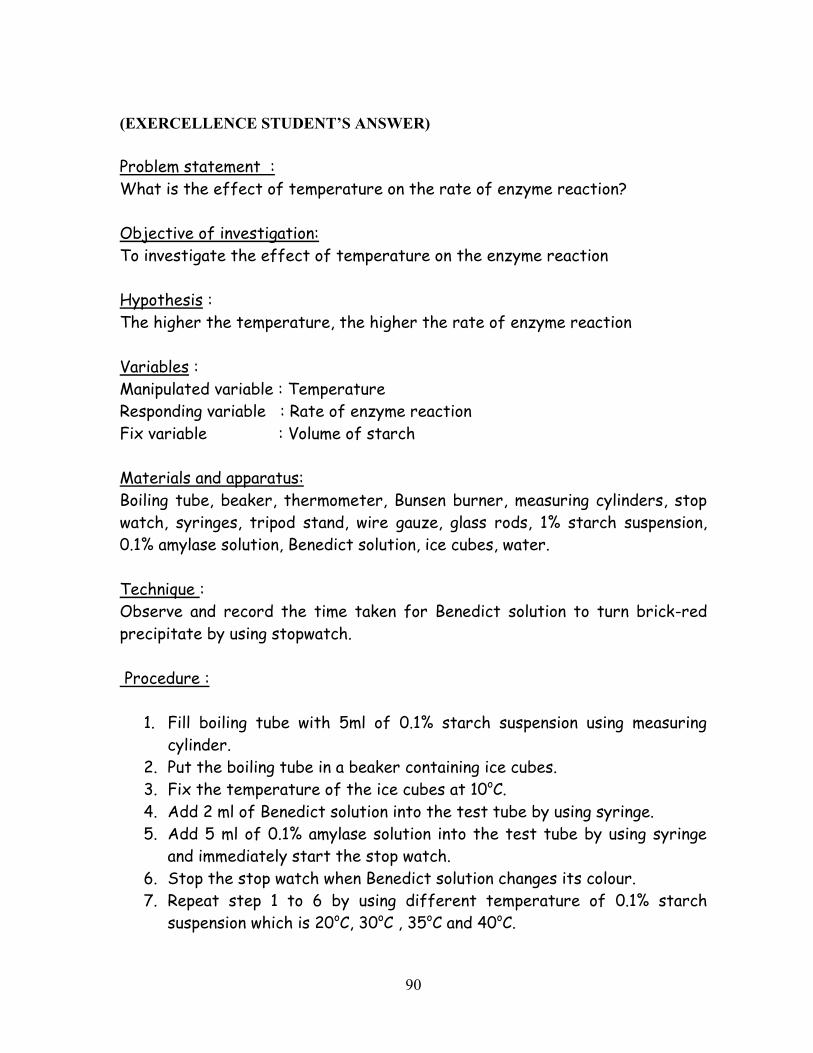
(EXERCELLENCE STUDENT’S ANSWER)
Problem statement :
What is the effect of temperature on the rate of enzyme reaction?
Objective of investigation:
To investigate the effect of temperature on the enzyme reaction
Hypothesis :
The higher the temperature, the higher the rate of enzyme reaction
Variables :
Manipulated variable : Temperature
Responding variable : Rate of enzyme reaction
Fix variable : Volume of starch
Materials and apparatus:
Boiling tube, beaker, thermometer, Bunsen burner, measuring cylinders, stop
watch, syringes, tripod stand, wire gauze, glass rods, 1% starch suspension,
0.1% amylase solution, Benedict solution, ice cubes, water.
Technique :
Observe and record the time taken for Benedict solution to turn brick-red
precipitate by using stopwatch.
Procedure :
1. Fill boiling tube with 5ml of 0.1% starch suspension using measuring
cylinder.
2. Put the boiling tube in a beaker containing ice cubes.
3. Fix the temperature of the ice cubes at 10oC.
4. Add 2 ml of Benedict solution into the test tube by using syringe.
5. Add 5 ml of 0.1% amylase solution into the test tube by using syringe
and immediately start the stop watch.
6. Stop the stop watch when Benedict solution changes its colour.
7. Repeat step 1 to 6 by using different temperature of 0.1% starch
suspension which is 20oC, 30oC , 35oC and 40oC.
91
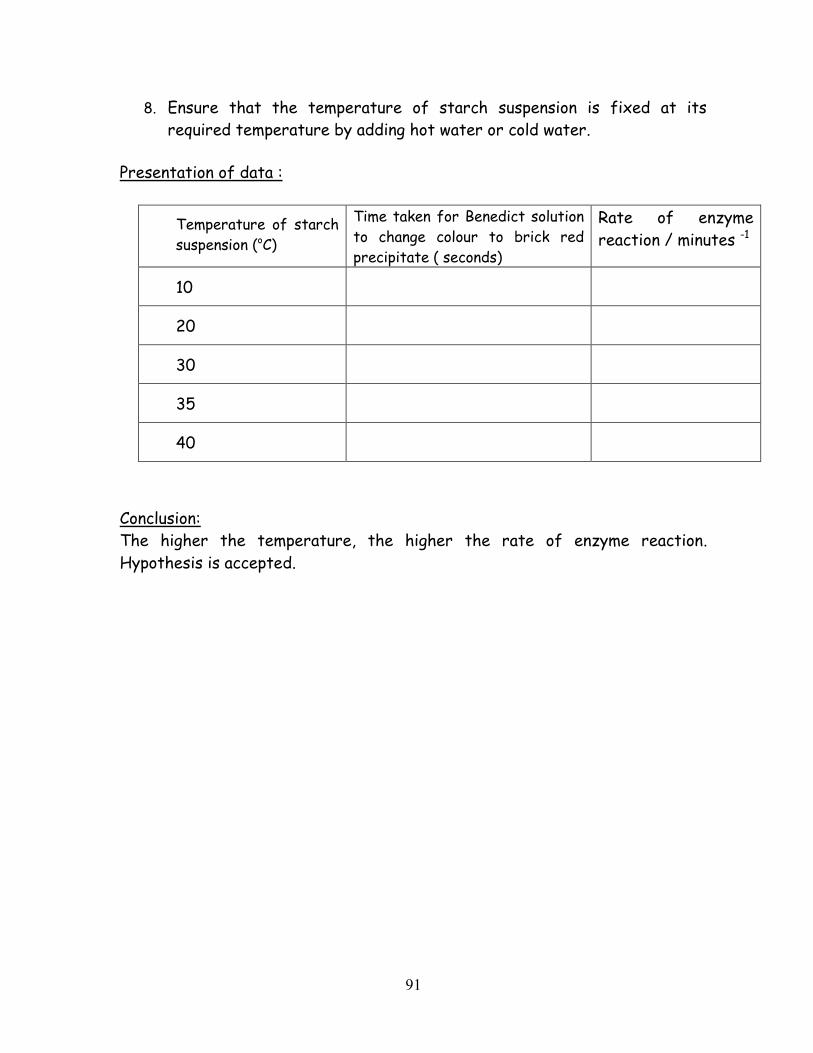
8. Ensure that the temperature of starch suspension is fixed at its
required temperature by adding hot water or cold water.
Presentation of data :
Temperature of starch
suspension (oC)
Time taken for Benedict solution
to change colour to brick red
precipitate ( seconds)
Rate of enzyme
reaction / minutes -1
10
20
30
35
40
Conclusion:
The higher the temperature, the higher the rate of enzyme reaction.
Hypothesis is accepted.
92
(MODERATE STUDENT’S ANSWER)
Problem statement :
How does different temperature of water affect the rate of enzyme reaction
?
Objective of investigation:
To investigate the effect of temperature on the rate of enzyme reaction
Hypothesis :
The optimum temperature for enzyme functioning effectively is 37oC.
Variables :
Manipulated variable : The temperature of water bath
Responding variable : Time taken to hydrolyse albumen suspension from
cloudy to clear
Fix variable : Enzyme concentration
Materials and apparatus:
Test tube, measuring cylinder, thermometer, beaker, stopwatch, dropper, 5%
pepsin, 10cm3 hydrochloric acid, albumen suspension, Bunsen burner, tripod
stand, wire gauze, retort stand, water bath, ice cubes.
Technique :
Record the time taken for albumen suspension to be hydrolysed from cloudy to
clear by using a stopwatch.
Procedure :
1. 4 clean beakers are filled in water. Beakers are labeled as A, B, C, D.
2. Test tube are filled in 5 ml albumen suspension, 1% pepsin enzyme, 10
cm3 of hydrochloric acid by using measuring cylinder.
3. Beaker A contain test tube filled with albumen suspension, pepsin
enzyme, hydrochloric acid. Then beaker A is put on tripod stand and
cooled at temperature 25o by using ice cube. The action must be quickly.
The thermometer record the temperature.
93
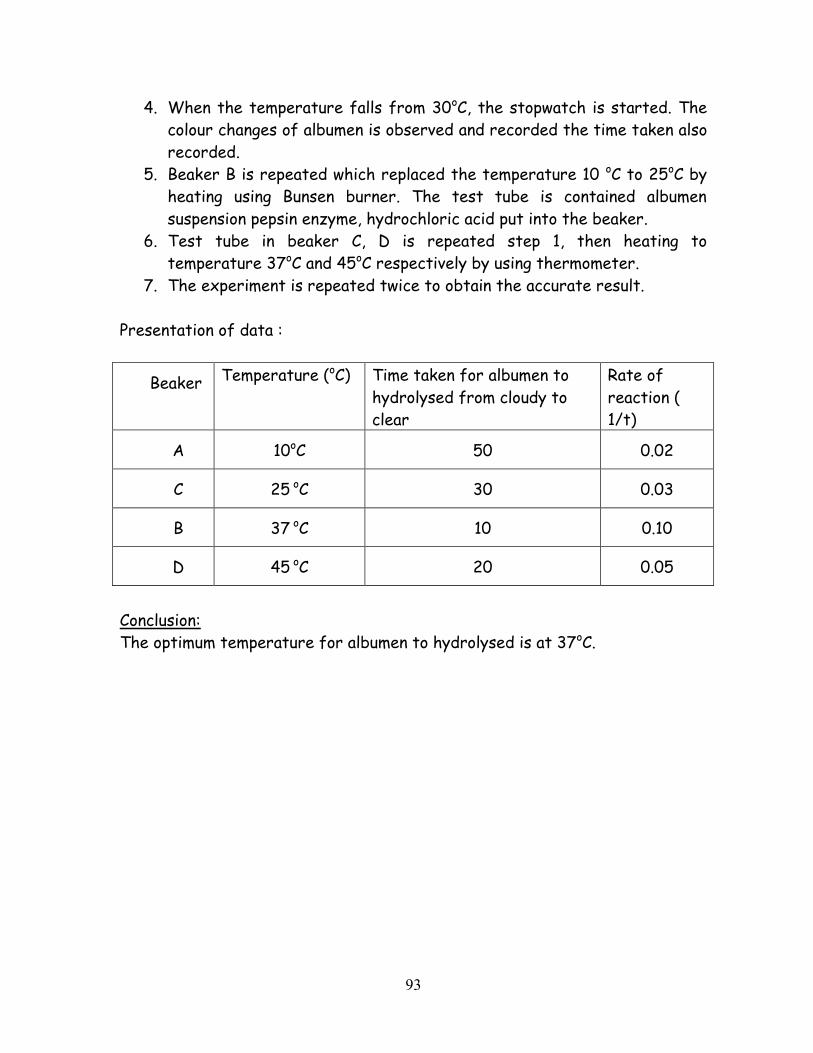
4. When the temperature falls from 30oC, the stopwatch is started. The
colour changes of albumen is observed and recorded the time taken also
recorded.
5. Beaker B is repeated which replaced the temperature 10 oC to 25oC by
heating using Bunsen burner. The test tube is contained albumen
suspension pepsin enzyme, hydrochloric acid put into the beaker.
6. Test tube in beaker C, D is repeated step 1, then heating to
temperature 37oC and 45oC respectively by using thermometer.
7. The experiment is repeated twice to obtain the accurate result.
Presentation of data :
Beaker Temperature (oC) Time taken for albumen to
hydrolysed from cloudy to
clear
Rate of
reaction (
1/t)
A 10oC 50 0.02
C 25 oC 30 0.03
B 37 oC 10 0.10
D 45 oC 20 0.05
Conclusion:
The optimum temperature for albumen to hydrolysed is at 37oC.
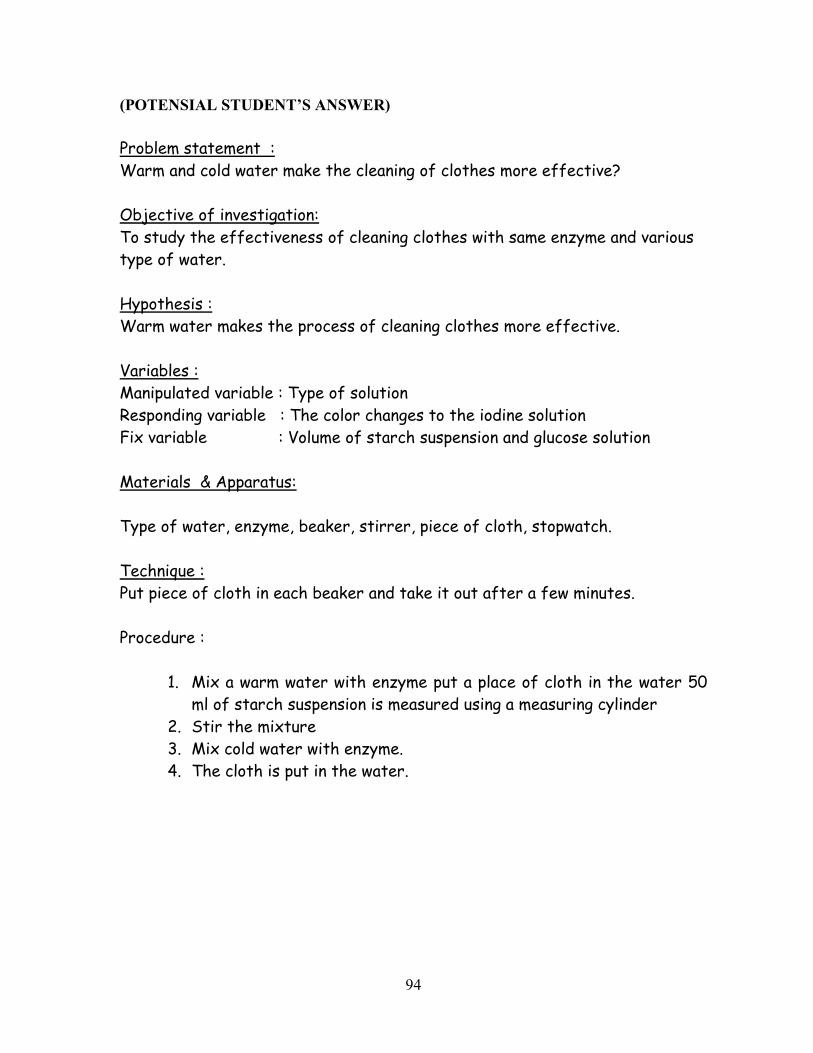
94
(POTENSIAL STUDENT’S ANSWER)
Problem statement :
Warm and cold water make the cleaning of clothes more effective?
Objective of investigation:
To study the effectiveness of cleaning clothes with same enzyme and various
type of water.
Hypothesis :
Warm water makes the process of cleaning clothes more effective.
Variables :
Manipulated variable : Type of solution
Responding variable : The color changes to the iodine solution
Fix variable : Volume of starch suspension and glucose solution
Materials & Apparatus:
Type of water, enzyme, beaker, stirrer, piece of cloth, stopwatch.
Technique :
Put piece of cloth in each beaker and take it out after a few minutes.
Procedure :
1. Mix a warm water with enzyme put a place of cloth in the water 50
ml of starch suspension is measured using a measuring cylinder
2. Stir the mixture
3. Mix cold water with enzyme.
4. The cloth is put in the water.
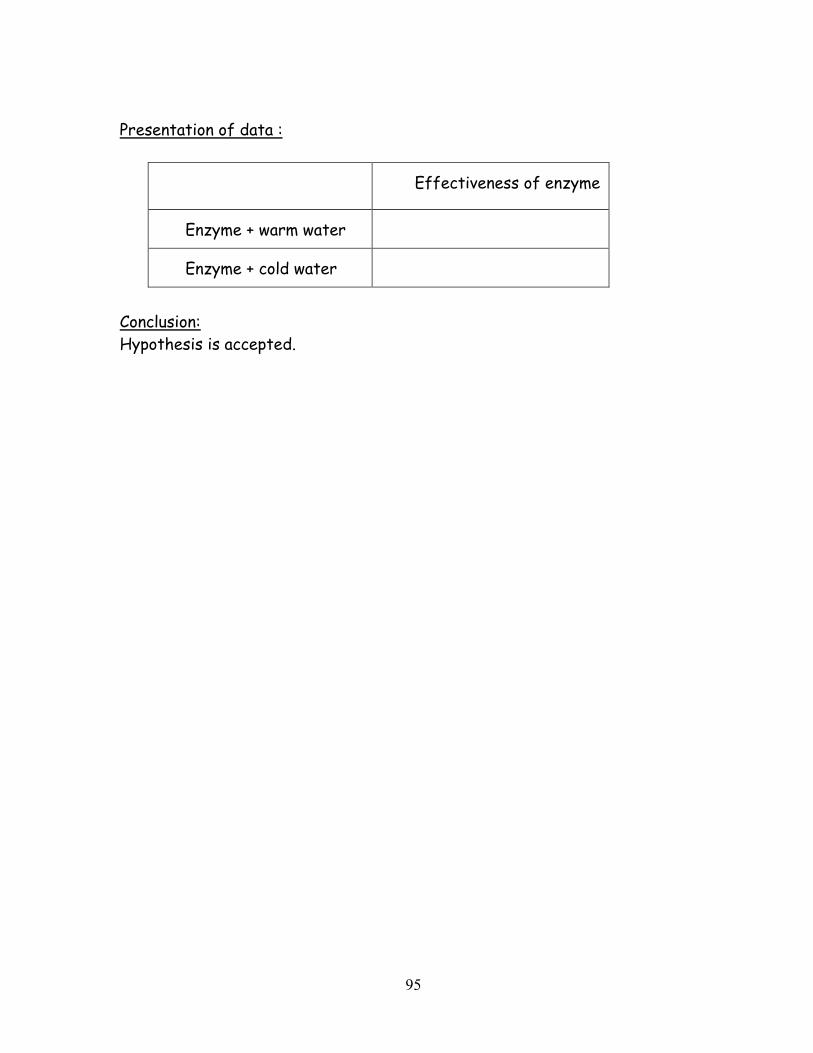
95
Presentation of data :
Effectiveness of enzyme
Enzyme + warm water
Enzyme + cold water
Conclusion:
Hypothesis is accepted.
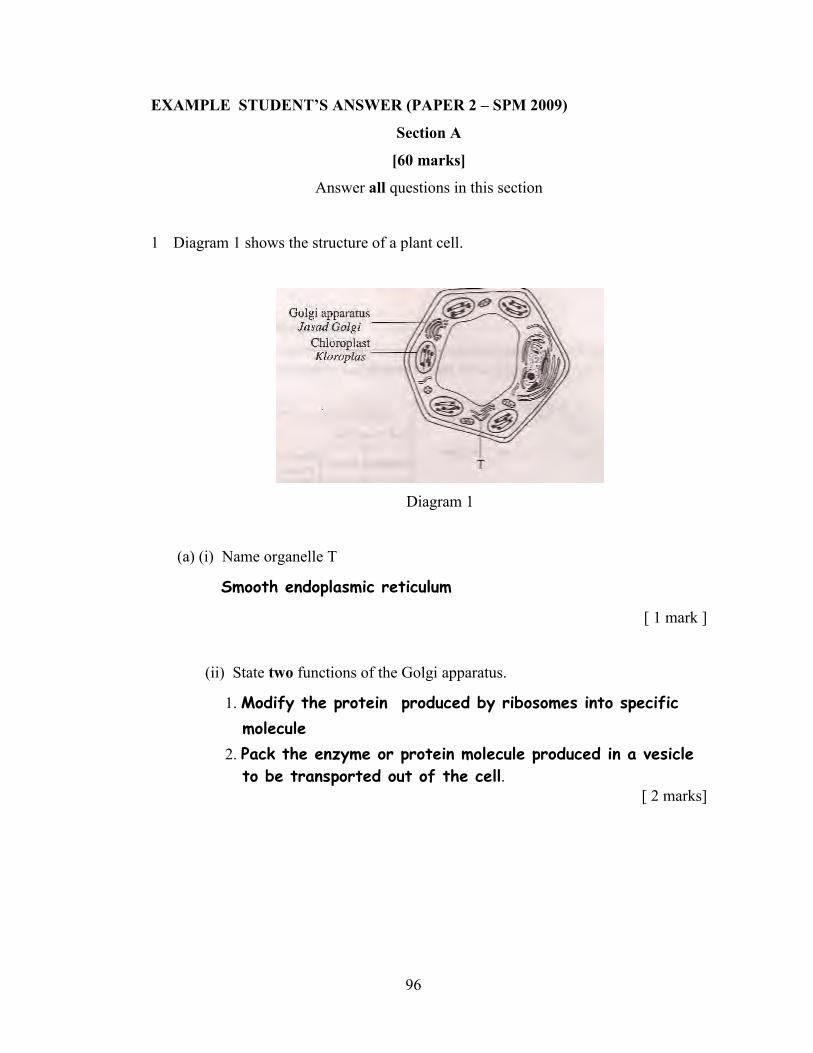
96
EXAMPLE STUDENT’S ANSWER (PAPER 2 – SPM 2009)
Section A
[60 marks]
Answer all questions in this section
1 Diagram 1 shows the structure of a plant cell.
Diagram 1
(a) (i) Name organelle T
Smooth endoplasmic reticulum
[ 1 mark ]
(ii) State two functions of the Golgi apparatus.
1. Modify the protein produced by ribosomes into specific
molecule 2. Pack the enzyme or protein molecule produced in a vesicle
to be transported out of the cell. [ 2 marks]
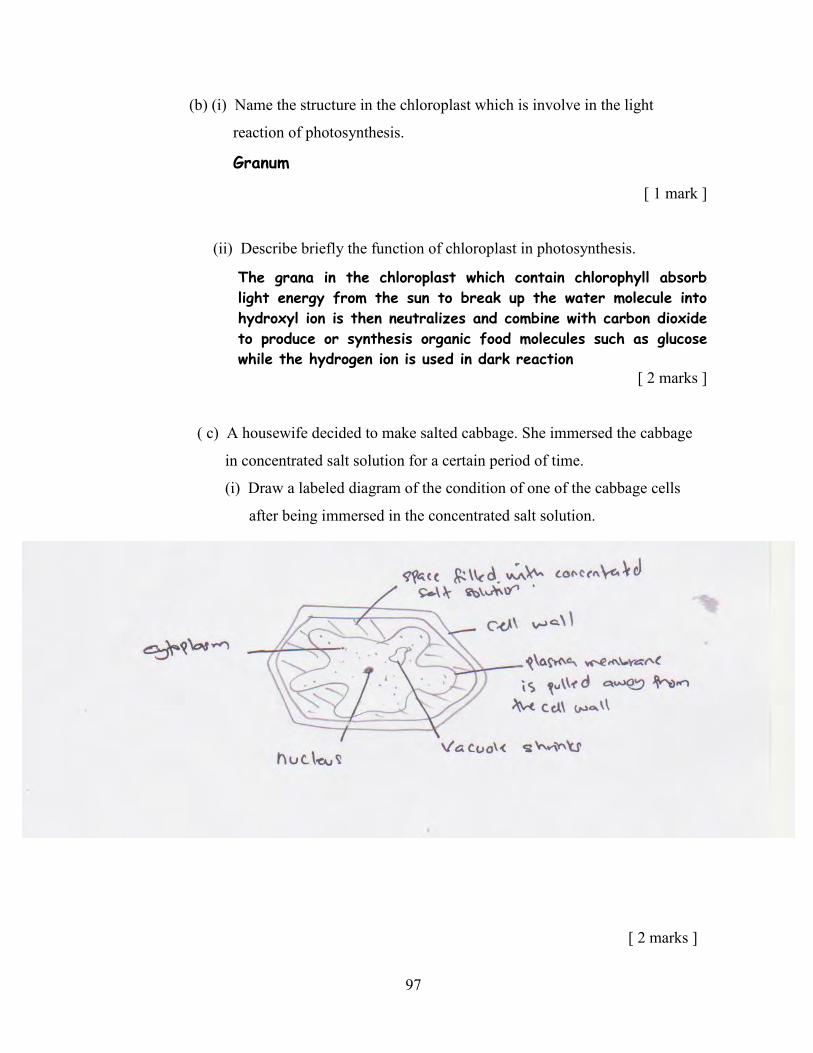
97
(b) (i) Name the structure in the chloroplast which is involve in the light
reaction of photosynthesis.
Granum
[ 1 mark ]
(ii) Describe briefly the function of chloroplast in photosynthesis.
The grana in the chloroplast which contain chlorophyll absorb
light energy from the sun to break up the water molecule into
hydroxyl ion is then neutralizes and combine with carbon dioxide
to produce or synthesis organic food molecules such as glucose
while the hydrogen ion is used in dark reaction [ 2 marks ]
( c) A housewife decided to make salted cabbage. She immersed the cabbage
in concentrated salt solution for a certain period of time.
(i) Draw a labeled diagram of the condition of one of the cabbage cells
after being immersed in the concentrated salt solution.
[ 2 marks ]
98
(iii) What has happened to the cell in the concentrated salt solution?
Explain how this happened.
The cell undergo plasmolysis. The concentrated salt solution is
hypertonic to the cell sap in the cabbage cell. Therefore, water
molecule from the cytoplasm and vacuole diffuse out of the cell
to the salt solution by osmosis. As the result , the vacuole and
cytoplasm lost water and shrink. The plasma membrane is pulled
away from the cell wall. The cell wall does not change its shape.
The salt solution diffuse into the cell of cabbage. The cell
become flaccid and plasmolysed.
[ 4 marks ]
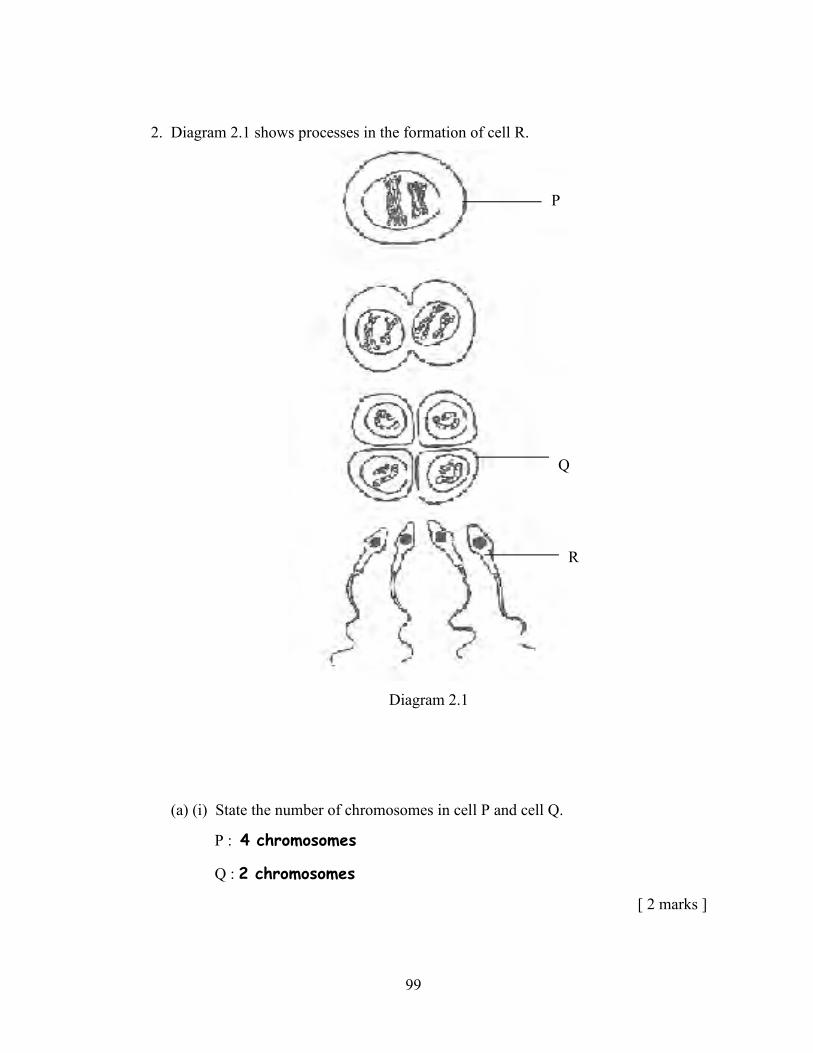
99
2. Diagram 2.1 shows processes in the formation of cell R.
Diagram 2.1
(a) (i) State the number of chromosomes in cell P and cell Q.
P : 4 chromosomes
Q : 2 chromosomes
[ 2 marks ]
P
Q
R
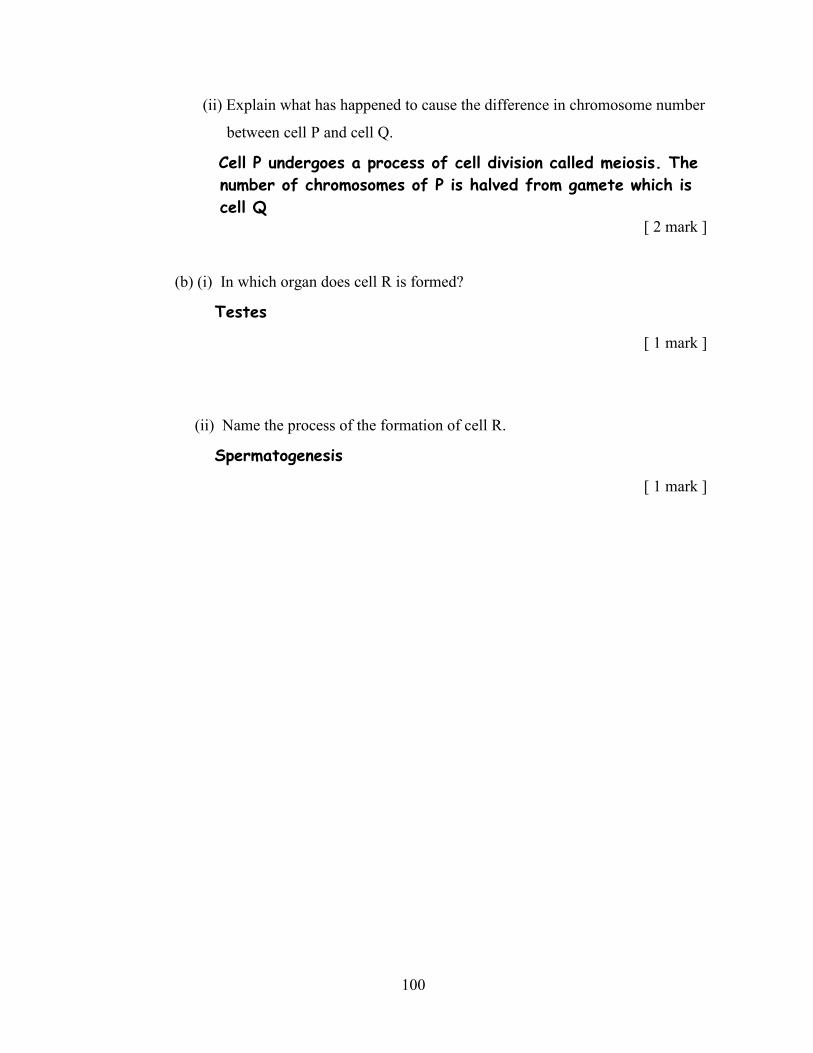
100
(ii) Explain what has happened to cause the difference in chromosome number
between cell P and cell Q.
Cell P undergoes a process of cell division called meiosis. The
number of chromosomes of P is halved from gamete which is
cell Q [ 2 mark ]
(b) (i) In which organ does cell R is formed?
Testes
[ 1 mark ]
(ii) Name the process of the formation of cell R.
Spermatogenesis
[ 1 mark ]
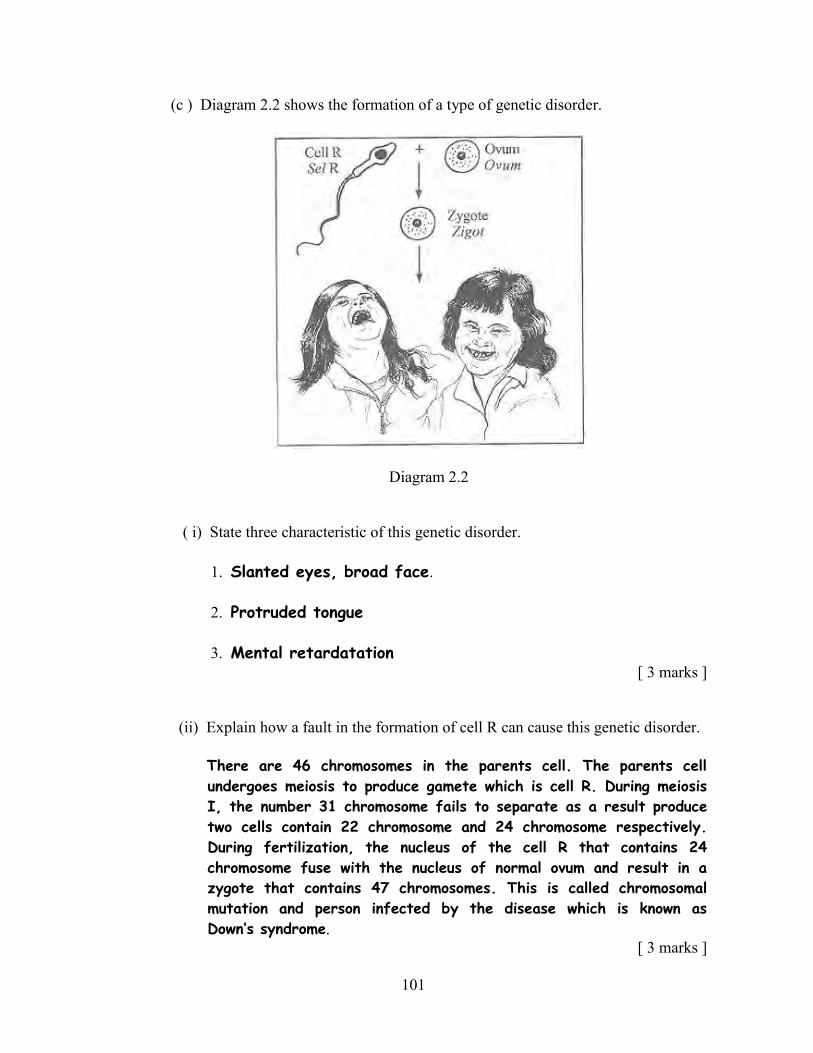
101
(c ) Diagram 2.2 shows the formation of a type of genetic disorder.
Diagram 2.2 ( i) State three characteristic of this genetic disorder. 1. Slanted eyes, broad face. 2. Protruded tongue 3. Mental retardatation
[ 3 marks ]
(ii) Explain how a fault in the formation of cell R can cause this genetic disorder. There are 46 chromosomes in the parents cell. The parents cell
undergoes meiosis to produce gamete which is cell R. During meiosis
I, the number 31 chromosome fails to separate as a result produce
two cells contain 22 chromosome and 24 chromosome respectively.
During fertilization, the nucleus of the cell R that contains 24
chromosome fuse with the nucleus of normal ovum and result in a
zygote that contains 47 chromosomes. This is called chromosomal
mutation and person infected by the disease which is known as
Down’s syndrome. [ 3 marks ]
102
3. Diagram 3 shows the cross-sections of stem from plant P and plant Q which live in
different habitats.
Plant P Plant Q
(a) (i) State the habitat of plant P and plant Q.
P : Land.
Q : Water.
[ 2 marks ]
(ii) Give one reason for the answers in 3(a)(i) .
P : P has vascular bundle when consists of phloem and xylem.
Xylem provided support for the plant Q : Q has air sacs which provided buoyancy for the plant to
float on water. [ 2 marks ]
(b) (i) State the function of phloem.
103
Transport food or organic compound from leaf to other part
of plant.
[ 1 mark ]
(ii) State two differences in the structure of phloem and xylem.
Phloem Xylem
Has sieve tube Has tracheid
Support by cellulose and
pectin
Support by lignin
(iii) Explain the importance of mitosis in the cambium to plant P. For secondary growth,. To provided mechanical support for
the plant. The increase the girth of stem. To make the
stem harder. [ 2 marks ]
(c) A type of plant lives in a swamp area with soft muddy soil and lack of oxygen. Explain the adaptations of the plant to survive in the habitat. The plant has pneumatophores . pneumatophores can absorb
oxygen in air. The plant has cable roots or prop roots. To
anchor the muddy soil. [ 3 marks ]
4. Diagram 4.1 shows a part of the human respiratory system.
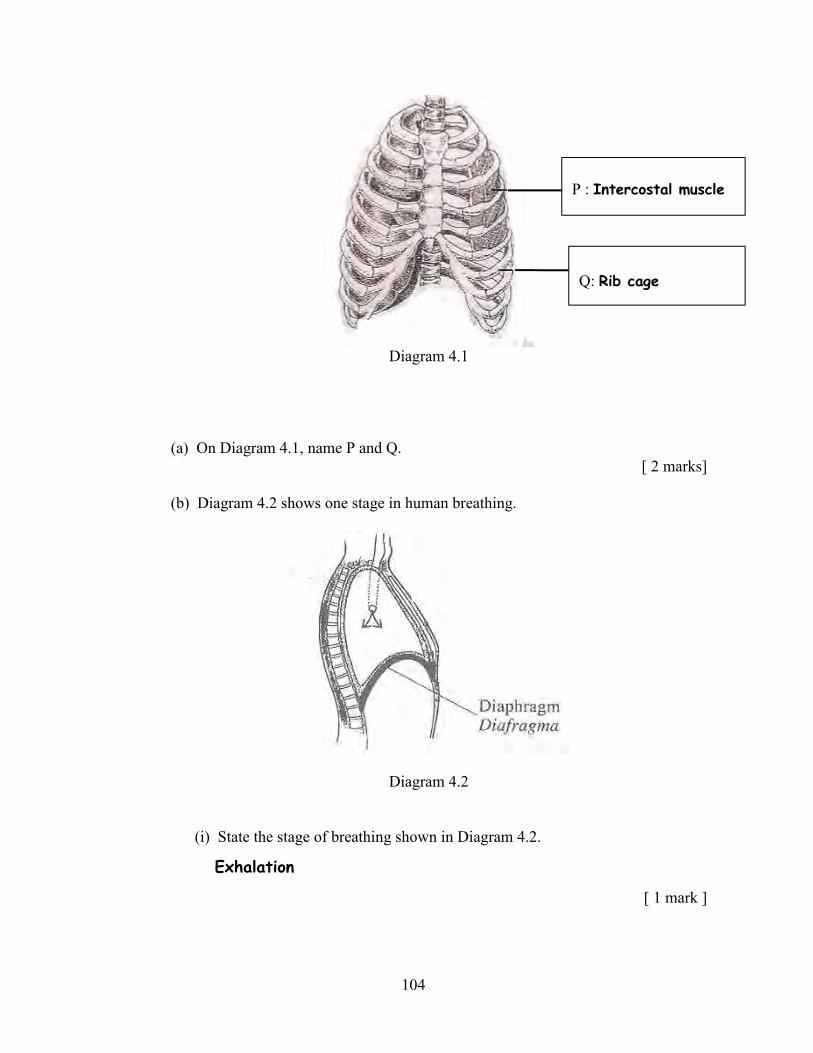
104
Diagram 4.1
(a) On Diagram 4.1, name P and Q.
[ 2 marks]
(b) Diagram 4.2 shows one stage in human breathing.
Diagram 4.2 (i) State the stage of breathing shown in Diagram 4.2.
Exhalation
[ 1 mark ]
P : Intercostal muscle
Q: Rib cage
105
(ii) Explain the function of P in the stage of breathing in 4 (b)(i).
Internal intercostals muscle (P) will relax and work together
with external intercostals muscle that contract to move the
rib cage upward and outward during inhalation. [ 2 mark ]
( c) The diaphragm is unable to function.
Explain how this affects the breathing mechanism.
If the diaphragm is unable to function, breathing mechanisms
may be difficult to function properly as the diaphragm is needed
to contract and relax regularly for inhalation and exhalation.
Contraction and relation of diaphragm will not occur. [ 3 marks ]
(d) Gas exchange takes place across the surface of the alveoli.
(i) Explain the importance of gas exchange in a human
Gas exchange allow the respiratory gases like oxygen to be
transported into the body and carbon dioxide to be
eliminated from the respiratory system. This important to
human for survive
[ 2 marks ]
(ii) State two ways in which alveoli are adapted for efficient gas exchange.
1. Moist in the surface
2. The alveoli is in numerous the increase the surface area.
[ 2 marks ]
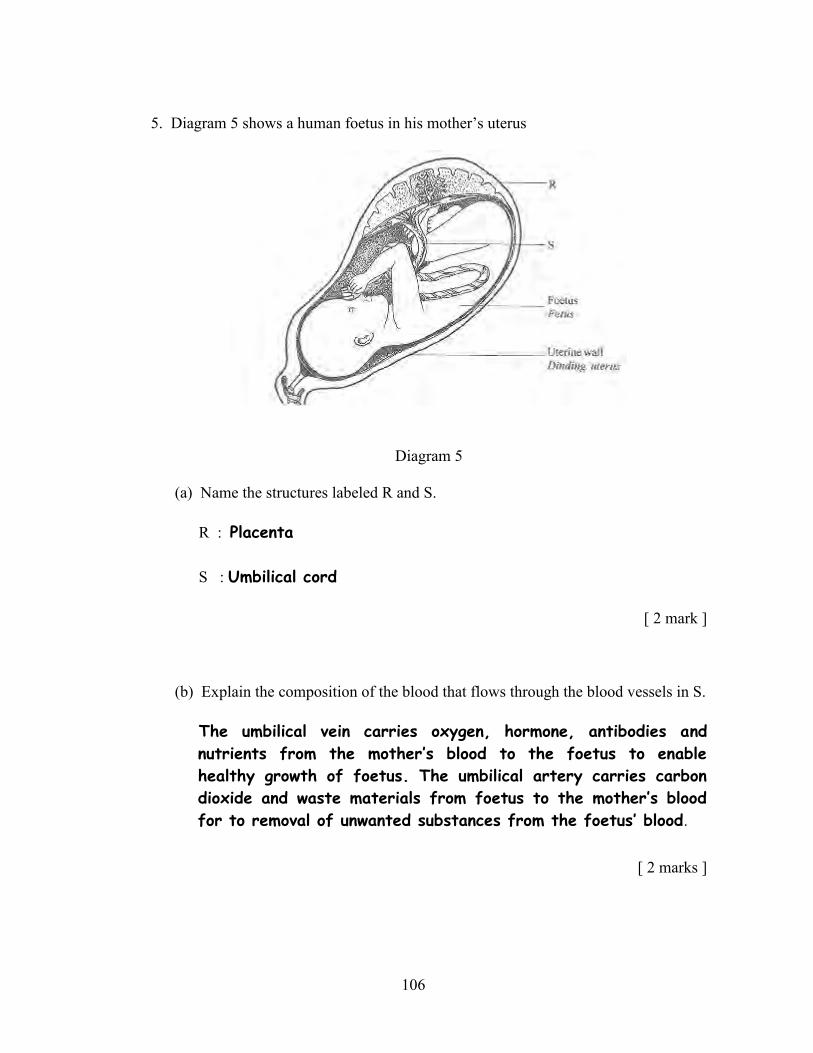
106
5. Diagram 5 shows a human foetus in his mother’s uterus
Diagram 5
(a) Name the structures labeled R and S. R : Placenta
S : Umbilical cord
[ 2 mark ]
(b) Explain the composition of the blood that flows through the blood vessels in S.
The umbilical vein carries oxygen, hormone, antibodies and
nutrients from the mother’s blood to the foetus to enable
healthy growth of foetus. The umbilical artery carries carbon
dioxide and waste materials from foetus to the mother’s blood
for to removal of unwanted substances from the foetus’ blood.
[ 2 marks ]
107
(c ) The structure R is needed to maintain the thickness of the uterine wall. Explain this statement.
R secrete hormone progesterone. Progesterone help in
maintaining the thickness of the endometrium wall so that the
uterine lining will not break down
[ 2 marks ]
(d) (i) State the type of immunity the foetus gets from his mother.
Nature passive immunity
[ 1 mark ] (ii) Explain the importance of structure R to body defence of the foetus.
The body of foetus still unable to produce its own
antibodies to fight against pathogen. The antibodies from
the mother will flow into the foetus blood through the
blood vessels in umbilical cord. This help the foetus to
acquire temporary immunity to fight against diseases or
pathogens while it still in the mother’s worm. The immunity
can also protect the foetus for a few months after it is
born. [ 3 marks ]
(e) Explain why the foetus has s separate blood circulatory system from his
mother.
To form a selective barrier between mother’s blood and foetus’
blood. Some toxic substances from the mother’s blood cannot
enter the foetus’ s blood to safeguard the foetus’s life. It
also gives protection to the foetus whereby the blood of the
mother and foetus do not compatible with the foetus’ blood. It
also prevent the high pressure of blood of the foetus. [ 2 marks ]
108
SECTION B ( SAMPLE STUDENT’S ANSWER) QUESTION 6
Sample 1 6 (a) (i) Traits of the seed shape are around and wrinkled. Traits of
seed colour are yellow and green. Traits of the characteristic, pod shape are inflated shape and constricted shape. Traits for pod colour are green and yellow and for flower colour are purple and white.
Sample 2 6 (a) (i) The characteristic studied are seed shape, seed colour,
pod shape , pod colour and flower of the garden pea plant, Pisum sativum among the F2 generation.
- The traits for seed shape of the pea plants are round seed and
wrinkled seed. - The traits for seed colour are yellow seed and green seed - The traits for pod shape are inflated pod and constricted pod - The traits for pod colour are green pod and yellow pod - The traits for flower colour are purple flower and white flower.
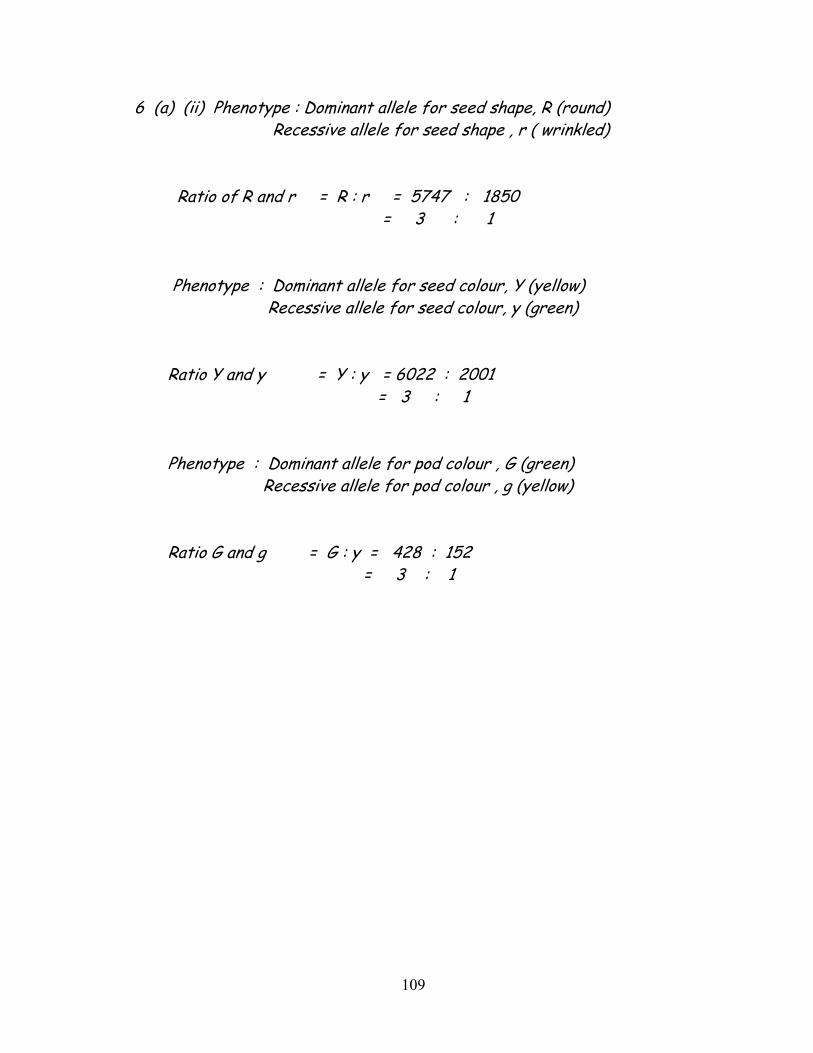
109
6 (a) (ii) Phenotype : Dominant allele for seed shape, R (round) Recessive allele for seed shape , r ( wrinkled) Ratio of R and r = R : r = 5747 : 1850 = 3 : 1 Phenotype : Dominant allele for seed colour, Y (yellow) Recessive allele for seed colour, y (green) Ratio Y and y = Y : y = 6022 : 2001 = 3 : 1 Phenotype : Dominant allele for pod colour , G (green) Recessive allele for pod colour , g (yellow) Ratio G and g = G : y = 428 : 152 = 3 : 1
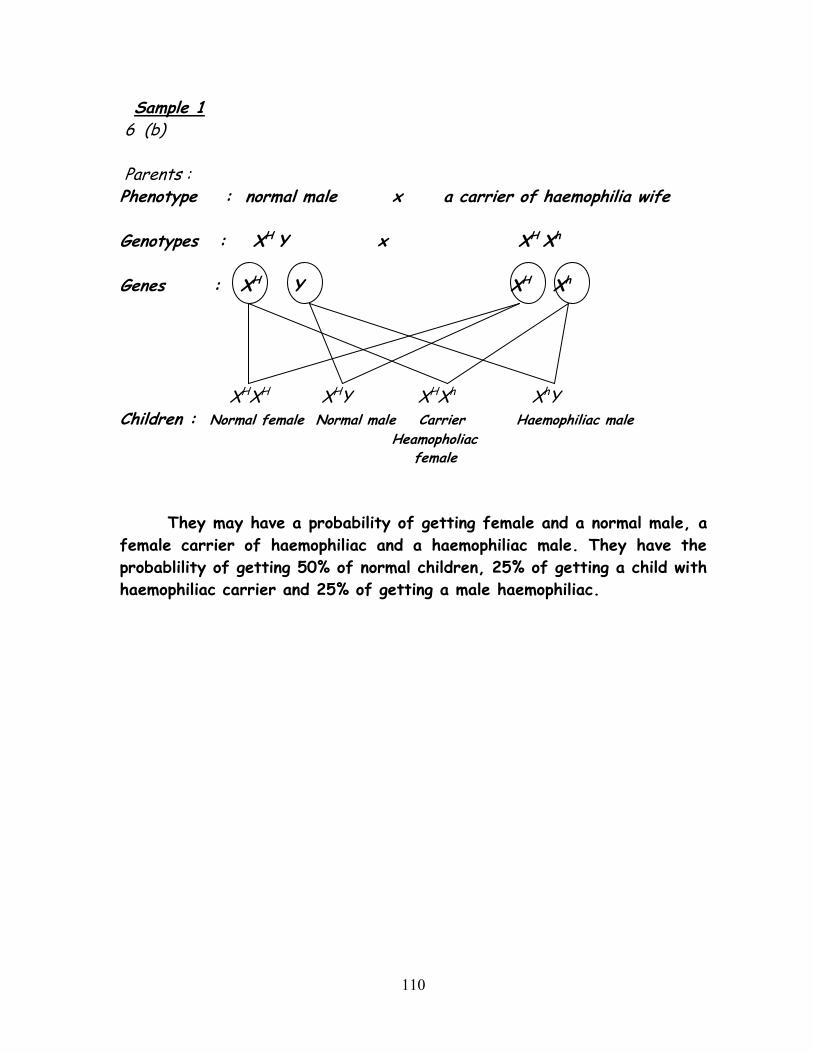
110
Sample 1 6 (b) Parents : Phenotype : normal male x a carrier of haemophilia wife Genotypes : XH Y x XH Xh
Genes : XH Y XH Xh XHXH XHY XHXh XhY Children : Normal female Normal male Carrier Haemophiliac male Heamopholiac female
They may have a probability of getting female and a normal male, a
female carrier of haemophiliac and a haemophiliac male. They have the
probablility of getting 50% of normal children, 25% of getting a child with
haemophiliac carrier and 25% of getting a male haemophiliac.
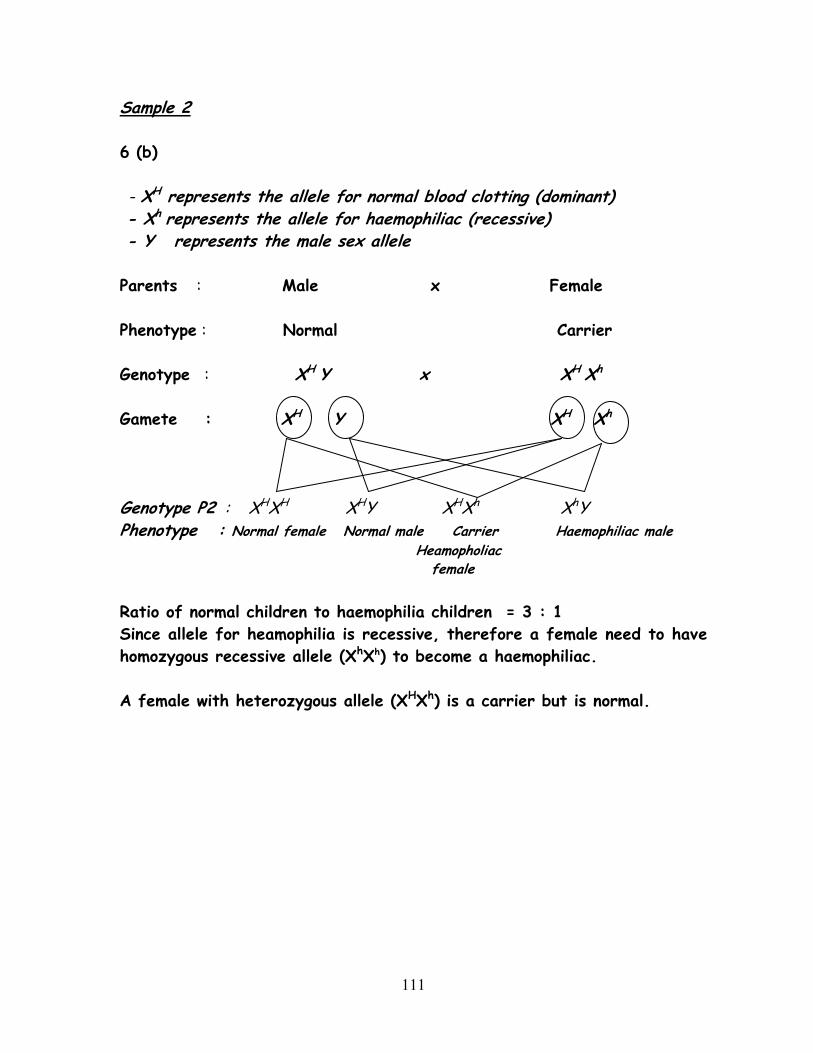
111
Sample 2
6 (b)
- XH represents the allele for normal blood clotting (dominant) - Xh represents the allele for haemophiliac (recessive) - Y represents the male sex allele
Parents : Male x Female
Phenotype : Normal Carrier
Genotype : XH Y x XH Xh
Gamete : XH Y XH Xh
Genotype P2 : XHXH XHY XHXh XhY Phenotype : Normal female Normal male Carrier Haemophiliac male Heamopholiac female
Ratio of normal children to haemophilia children = 3 : 1
Since allele for heamophilia is recessive, therefore a female need to have
homozygous recessive allele (XhXh) to become a haemophiliac.
A female with heterozygous allele (XHXh) is a carrier but is normal.
112
QUESTION 7 7(a)
It is a symbiosis interaction It is a parasitism The flower acts as a parasite and tree act as a host. The flower obtain nutrients from the tree (host) and causing
damage or harm to the tree. The flower cannot synthesis its own nutrient In this interaction, one the flower gets benefit and other the
tree get harm 7 (b)
The farmer can use biological control It is using the prey-predator relationship to decrease the mice
population. The farmer can release the owl or snake into his farm The owl or snake will act as a predator to catch and eat the prey
(mice) Therefore , the population of mice is decreasing, eaten by
predator Meanwhile, the increasing population of the predator will future
the decrease in the mice population cause there is no mice population anymore.
Since the mice is absent, the palm fruits will not be eaten by the mice anymore.
Thus, the yield of the palm fruits increase. ( The predators do not eat the palm fruits )
7 (c ) (i)
The plant cannot absorb the nitrogen directly from the atmosphere
The nitrogen in the air is assimilated into nitrogen compound (compound x)
This nitrogen fixation process is done by the (nitrogen-fixing bacteria)
113
The example of nitrogen-fixing bacteria are the nostoc sp. ( living in the soil) and the rhizobhium ( living in the roots of leguminous plant)
This compound x ( nitrogen compound) is then converted into nitrites by nitrosomonas through nitrification.
Nitrates then, in turn, is converted into nitrates by nitrobacter through nitrification process.
This nitrates is ready absorbed by plants and store as plant proteins in the plant.
As animals eat the plant, the plant proteins is converted into animal protein.
The faces the death body of plants and animals will be decayed by the decomposers into ammonia.
The nitrates in the soil are then returned to the atmosphere to maintain the content of compound x in the soil.
The nitrates is converted into nitrogen in the air by denitrifying bacteria through denitrification process.
The oxygen is needed by the bacteria, nitrogen is returned to the air
This is all known as nitrogen cycle.
7(c ) (ii) The faces and the death body of the plants and animals will not
be able to decomposed They are remained on the ground, polluting the area. The plants surrounding may not get the nutrient (ammonia)
because the faeces and death body are not converted into nutrients.
The soil in that area are not fertile.
114
QUESTION 8 (a) (i)
During a cool day, the rate of transpiration and water loss are slow. The stomata of the leaves open to anable gaseous exchange for
photosynthesis during a cool day , the rate of photosynthesis is high. The leaf also stand upright to receive maximum amount of sunlight. The
leaf cell is turgid During a hot day, the rate of transpiration and water loss is very high.
The stomata of the leaves is closed to prevent water loss. The leaf also lays down because the water loss has cause the leave cell
undergo plasmolysis and not turgid, cannot support the weight of the leaves.
The rate of photosynthesis is lower because gaseous exchange does not take place.
8(a)(ii)
It is necessary for the plant to be in different condition in a cool day and a hot day because plant can prevent water loss in this way.
During a hot day, the stomata is closed to prevent water loss. However, this also prevent gaseous exchange and rate of
photosynthesis is low. During a cool day, the stomata is opened to enable gaseous exchange.
Although the stomata is opened, the rate of water loss is not high because the temperature is low.
As a result, the plant can photosynthesis at maximum rate during a cool day without the danger of water loss. The plant can also survive the hot day by close the stomata prevent excessive water loss.
8(b)
There is water molecule exist inside the soil and called soil water. The cell sap of root hair cell is hypertonic to the soil water as a result,
the water is moved into the root hair cell by osmosis. Now, the cell adjacent to the root hair is hypertonic to the root hair
cell the water move from root hair cell to adjacent cell then neighbouring cell until the water reach the xylem by osmosis.
115
This had cause a root pressure to push the water up of xylem in stem. However the root pressure alone is not sufficient to push the water up until the leave.
The transport of water inside xylem of stem is aided by capillary action due to the small diameter of xylem vessel.
The water column is continuous and do not break due to the adhesive and cohesive property of water molecule.
There is water vapour inside the air space of a leaf. The water vapour is diffuse to the atmosphere through stomata. This cause the sponge mesopyll cell to evaporate through more water
into the air space become more hypertonic and draws water from adjacent cell
The adjacent cell then draws water from xylem vessel, creating a pulling force, which is called transpiration pull
Transpiration pull helps the water to be transported to all parts of plant and leaves and then move out into the atmosphere.
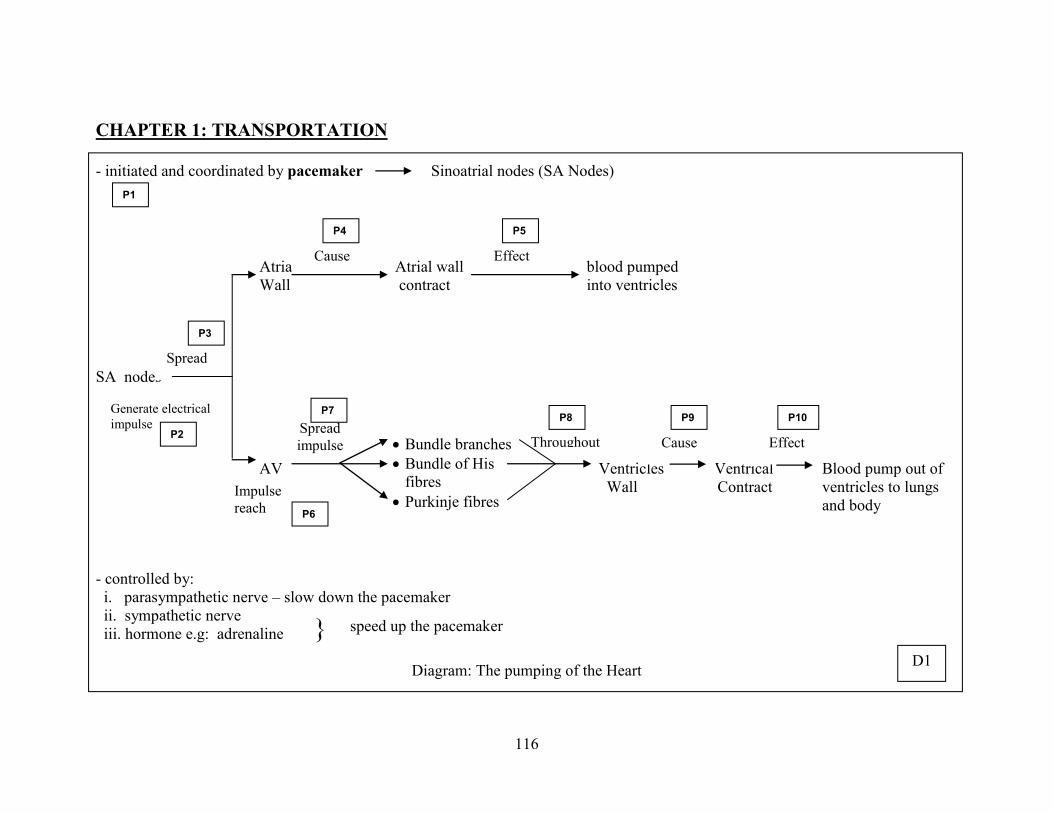
116
CHAPTER 1: TRANSPORTATION - initiated and coordinated by pacemaker Sinoatrial nodes (SA Nodes) Atria Atrial wall blood pumped Wall contract into ventricles SA nodes AV Ventricles Ventrical Blood pump out of
Wall Contract ventricles to lungs and body
- controlled by: i. parasympathetic nerve – slow down the pacemaker ii. sympathetic nerve iii. hormone e.g: adrenaline
Diagram: The pumping of the Heart
Generate electrical impulse
Bundle branches Bundle of His
fibres Purkinje fibres
Spread
Cause Effect
Impulse reach
Spread impulse Throughout Cause Effect
P1
P2
P3
P4 P5
P6
P7 P8 P9 P10
speed up the pacemaker } D1
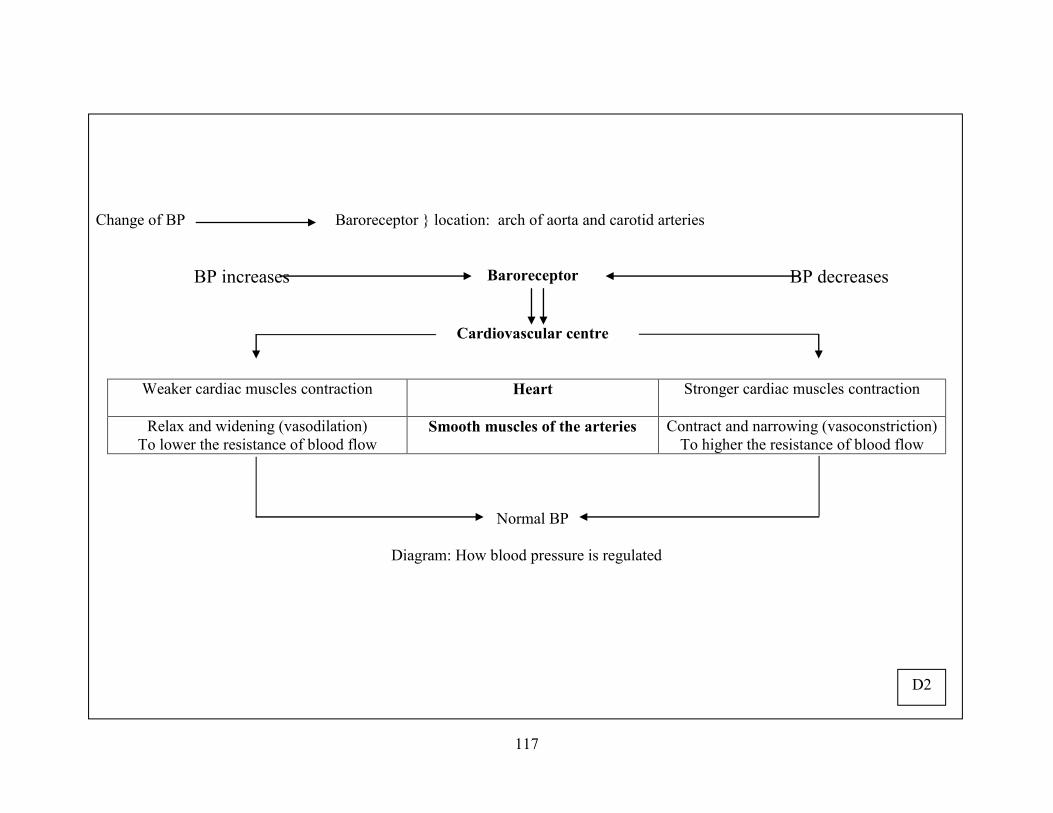
117
Change of BP Baroreceptor } location: arch of aorta and carotid arteries
BP increases
Baroreceptor BP decreases
Cardiovascular centre
Weaker cardiac muscles contraction
Heart Stronger cardiac muscles contraction
Relax and widening (vasodilation) To lower the resistance of blood flow
Smooth muscles of the arteries Contract and narrowing (vasoconstriction) To higher the resistance of blood flow
Normal BP
Diagram: How blood pressure is regulated
D2
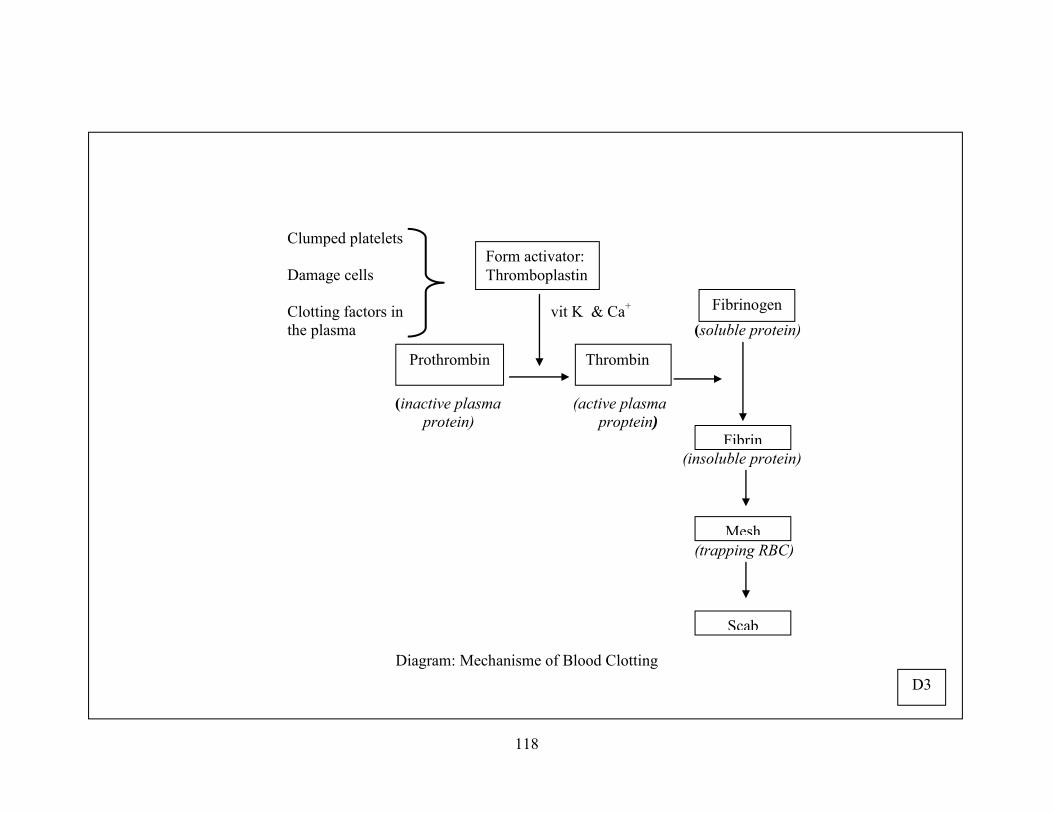
118
Clumped platelets
Damage cells
Clotting factors in vit K & Ca+ the plasma (soluble protein)
(inactive plasma (active plasma protein) proptein)
(insoluble protein)
(trapping RBC)
Diagram: Mechanisme of Blood Clotting
Form activator: Thromboplastin
Prothrombin Thrombin
Fibrinogen
Fibrin
Mesh
Scab
D3
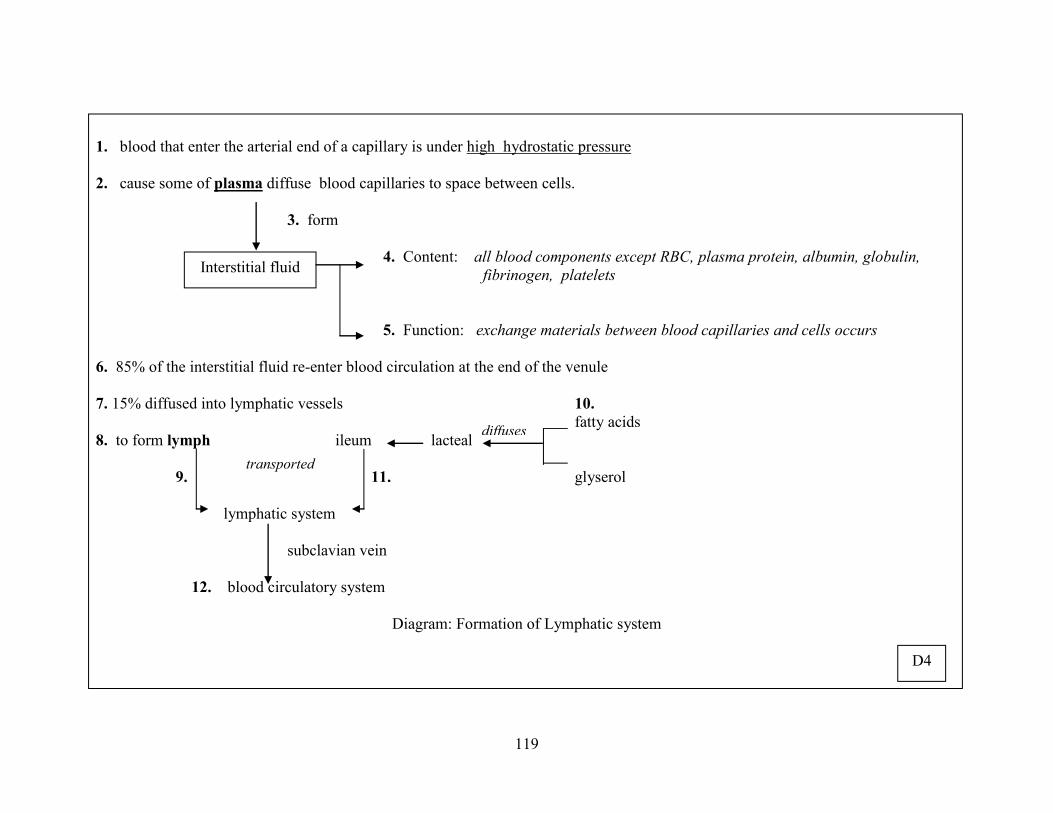
119
Interstitial fluid
diffuses
transported
1. blood that enter the arterial end of a capillary is under high hydrostatic pressure 2. cause some of plasma diffuse blood capillaries to space between cells.
3. form
4. Content: all blood components except RBC, plasma protein, albumin, globulin, fibrinogen, platelets
5. Function: exchange materials between blood capillaries and cells occurs
6. 85% of the interstitial fluid re-enter blood circulation at the end of the venule 7. 15% diffused into lymphatic vessels 10. fatty acids 8. to form lymph ileum lacteal
9. 11. glyserol
lymphatic system subclavian vein
12. blood circulatory system
Diagram: Formation of Lymphatic system
D4
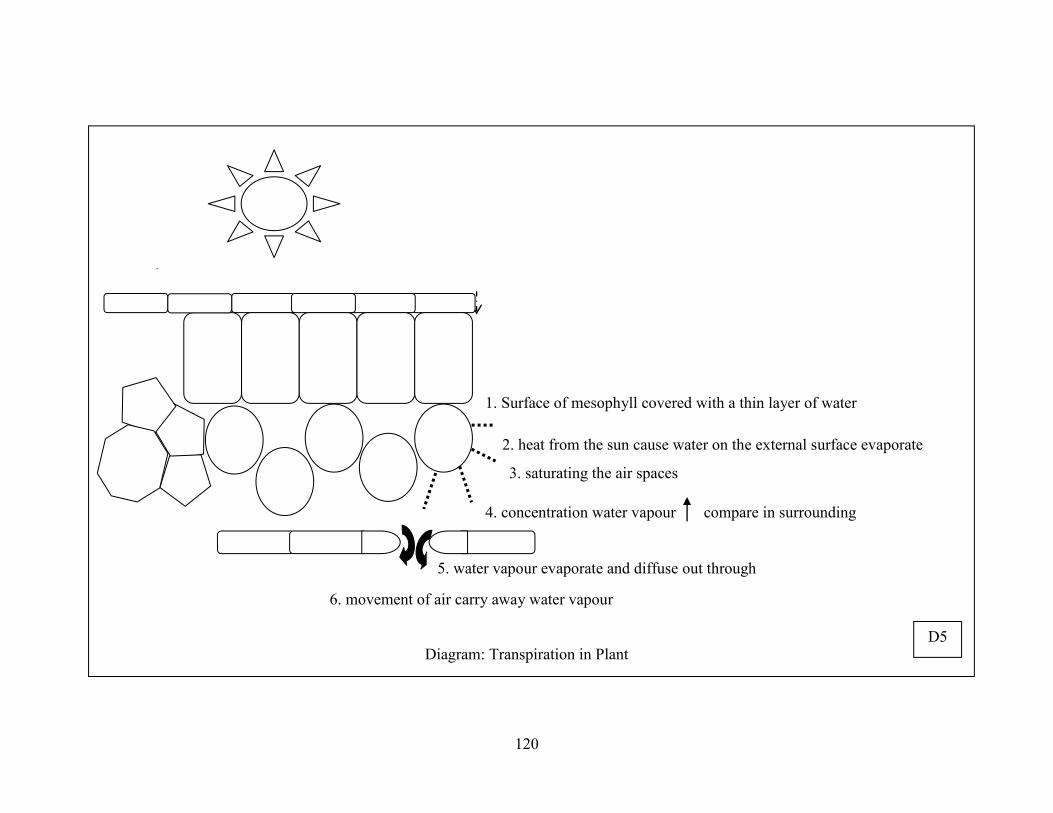
120
.
Diagram: Transpiration in Plant
1. Surface of mesophyll covered with a thin layer of water
2. heat from the sun cause water on the external surface evaporate
4. concentration water vapour compare in surrounding
3. saturating the air spaces
5. water vapour evaporate and diffuse out through stomata
6. movement of air carry away water vapour
D5
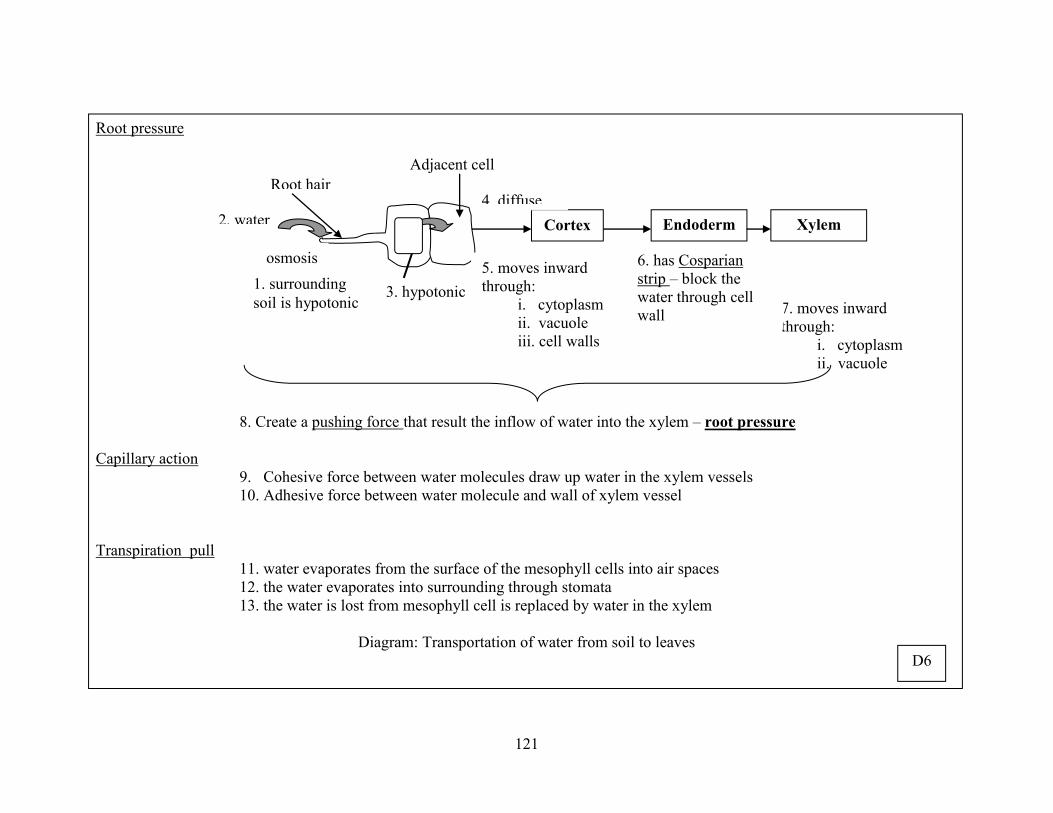
121
Root pressure
8. Create a pushing force that result the inflow of water into the xylem – root pressure Capillary action
9. Cohesive force between water molecules draw up water in the xylem vessels 10. Adhesive force between water molecule and wall of xylem vessel
Transpiration pull 11. water evaporates from the surface of the mesophyll cells into air spaces 12. the water evaporates into surrounding through stomata 13. the water is lost from mesophyll cell is replaced by water in the xylem
Diagram: Transportation of water from soil to leaves
Root hair
1. surrounding soil is hypotonic
2. water
osmosis
Cortex
3. hypotonic 5. moves inward through: i. cytoplasm ii. vacuole iii. cell walls
7. moves inward through: i. cytoplasm ii. vacuole
Endodermis
6. has Cosparian strip – block the water through cell wall
Xylem vessel
4. diffuse
Adjacent cell
D6
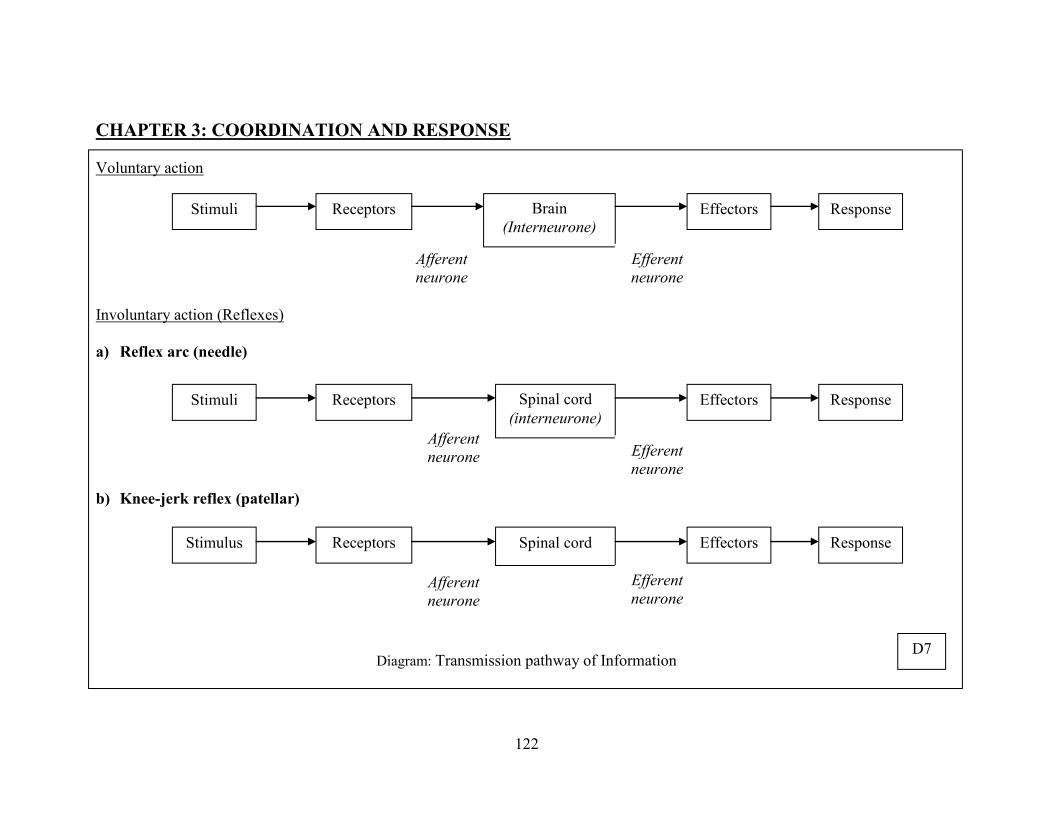
122
CHAPTER 3: COORDINATION AND RESPONSE Voluntary action Involuntary action (Reflexes) a) Reflex arc (needle) b) Knee-jerk reflex (patellar)
Diagram: Transmission pathway of Information
Stimuli
Afferent neurone
Response Effectors Brain (Interneurone)
Receptors
Efferent neurone
Stimulus
Afferent neurone
Response Effectors Spinal cord Receptors
Efferent neurone
Stimuli
Afferent neurone
Response Effectors Spinal cord (interneurone)
Receptors
Efferent neurone
D7
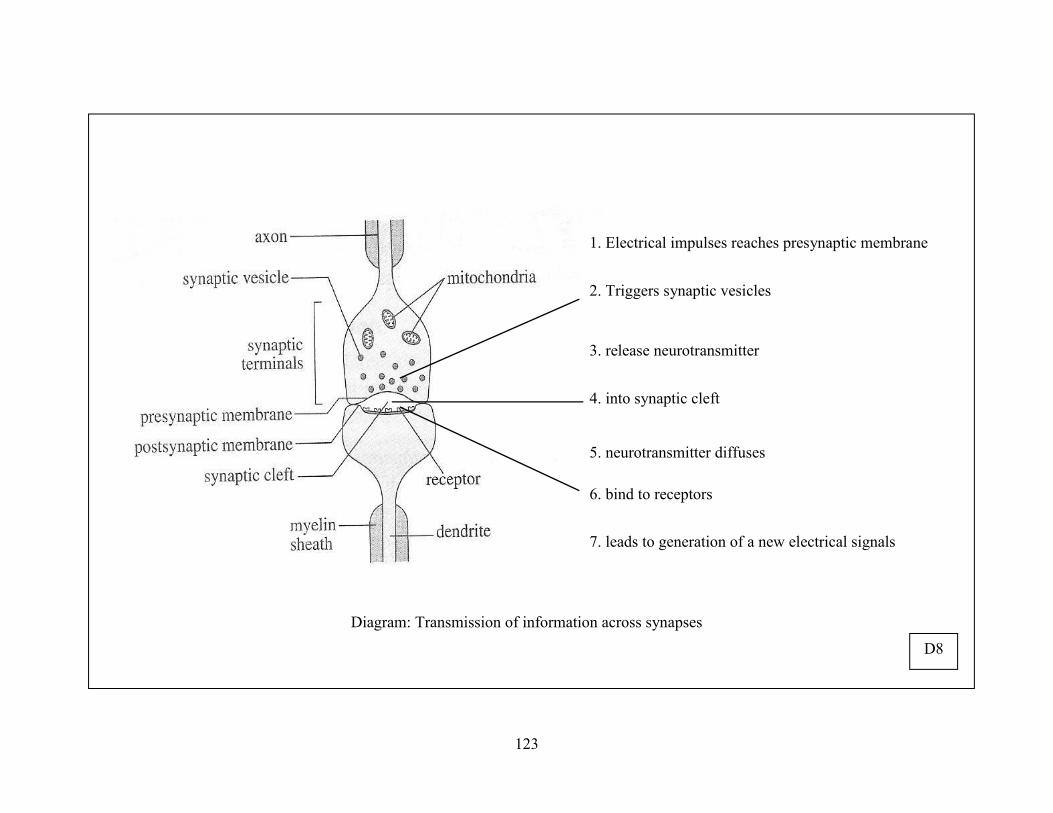
123
Diagram: Transmission of information across synapses
1. Electrical impulses reaches presynaptic membrane
2. Triggers synaptic vesicles
3. release neurotransmitter
4. into synaptic cleft
5. neurotransmitter diffuses
6. bind to receptors
7. leads to generation of a new electrical signals
D8
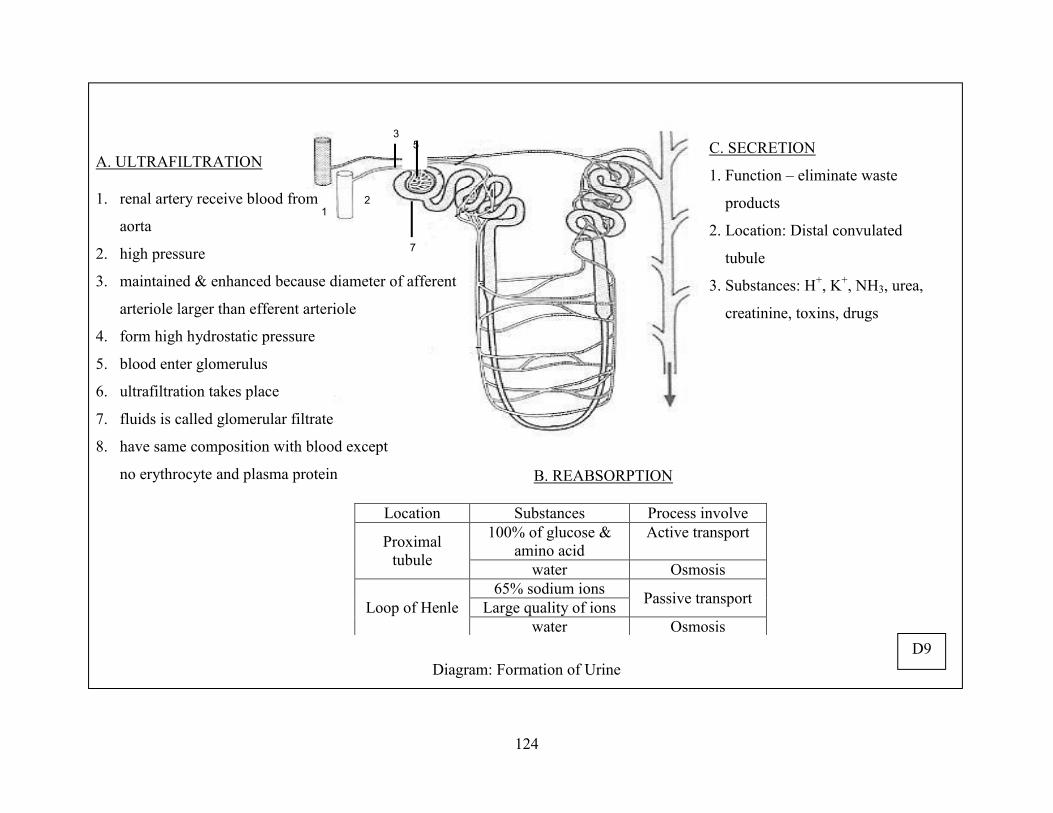
124
2
3
1
5
7
A. ULTRAFILTRATION 1. renal artery receive blood from
aorta
2. high pressure
3. maintained & enhanced because diameter of afferent
arteriole larger than efferent arteriole
4. form high hydrostatic pressure
5. blood enter glomerulus
6. ultrafiltration takes place
7. fluids is called glomerular filtrate
8. have same composition with blood except
no erythrocyte and plasma protein
Diagram: Formation of Urine
B. REABSORPTION
Location Substances Process involve
Proximal tubule
100% of glucose & amino acid
Active transport
water Osmosis
Loop of Henle 65% sodium ions Passive transport Large quality of ions
water Osmosis
C. SECRETION
1. Function – eliminate waste
products
2. Location: Distal convulated
tubule
3. Substances: H+, K+, NH3, urea,
creatinine, toxins, drugs
D9
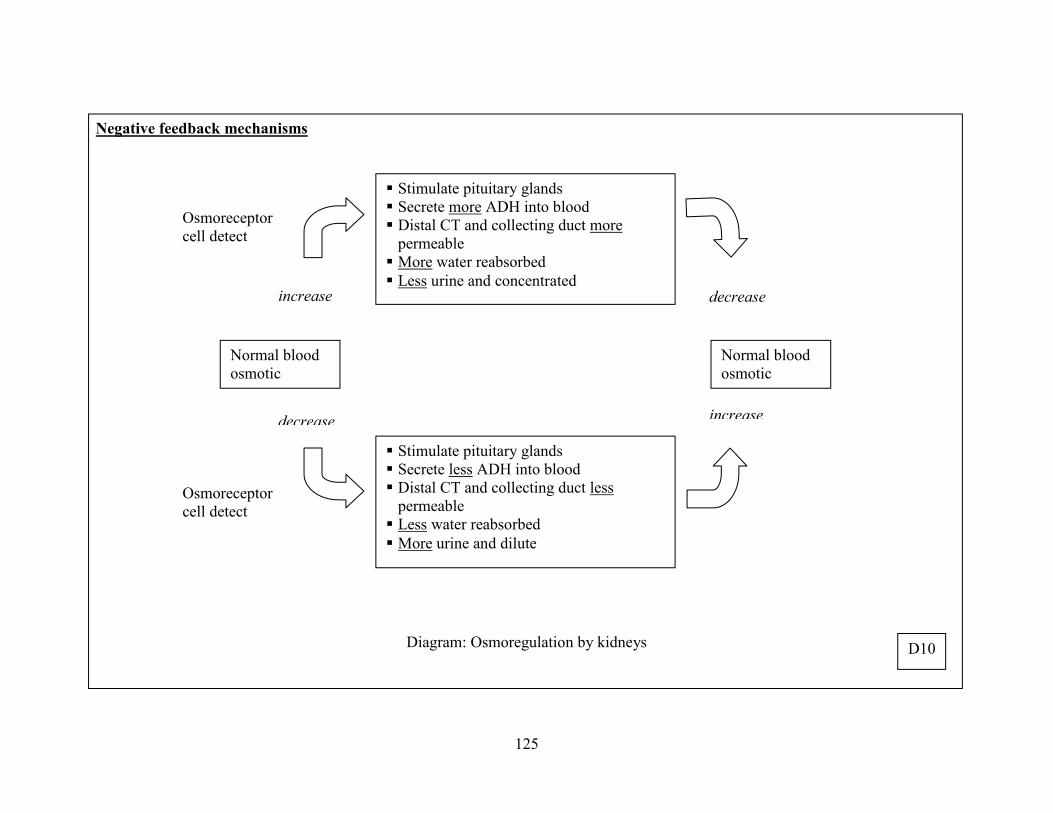
125
Negative feedback mechanisms
Diagram: Osmoregulation by kidneys
Normal blood osmotic pressure
Normal blood osmotic pressure
Stimulate pituitary glands Secrete more ADH into blood Distal CT and collecting duct more
permeable More water reabsorbed Less urine and concentrated
Stimulate pituitary glands Secrete less ADH into blood Distal CT and collecting duct less
permeable Less water reabsorbed More urine and dilute
increase
increase
decrease
decrease
Osmoreceptor cell detect pressure
Osmoreceptor cell detect pressure
D10
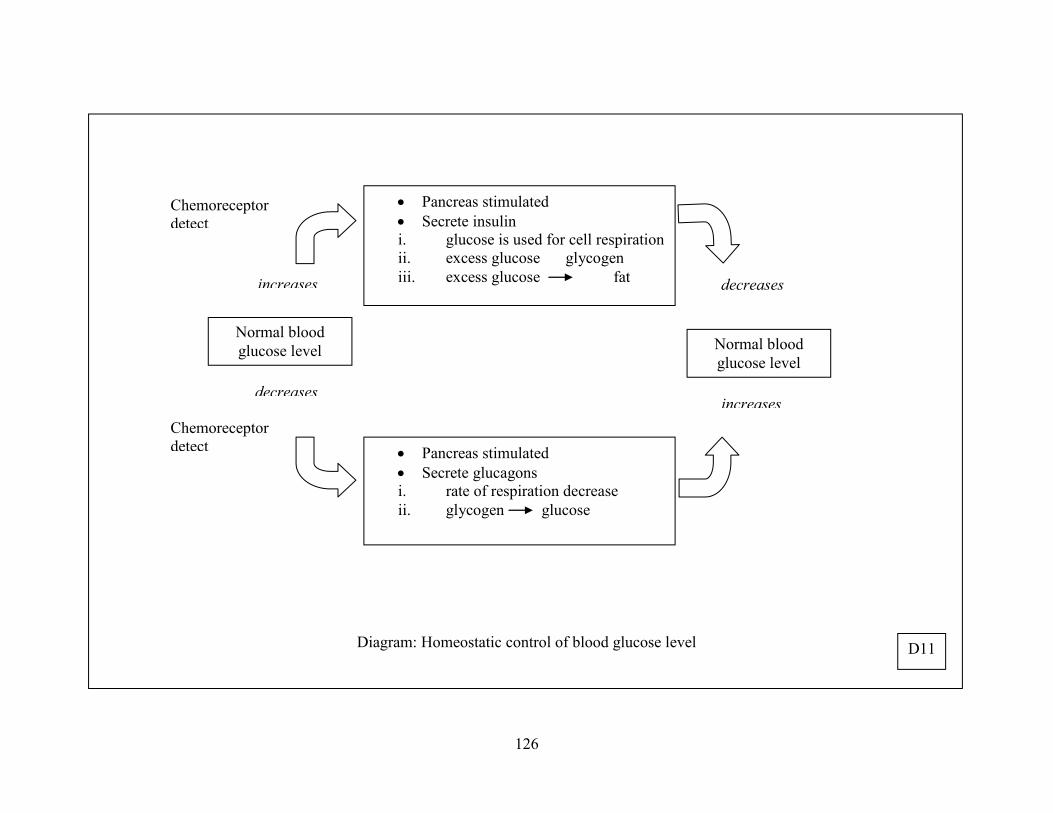
126
Diagram: Homeostatic control of blood glucose level
Normal blood glucose level Normal blood
glucose level
Pancreas stimulated Secrete insulin i. glucose is used for cell respiration ii. excess glucose glycogen iii. excess glucose fat
Pancreas stimulated Secrete glucagons i. rate of respiration decrease ii. glycogen glucose
Chemoreceptor detect
Chemoreceptor detect
increases
increases decreases
decreases
D11
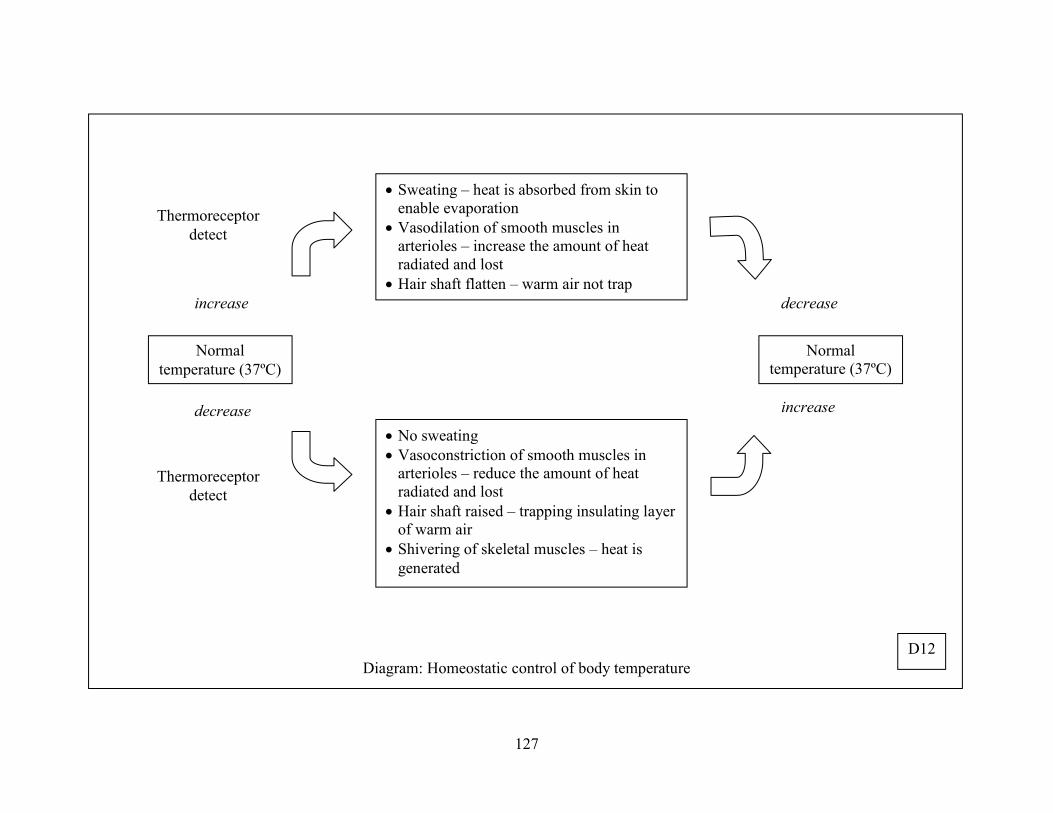
127
Diagram: Homeostatic control of body temperature
Normal temperature (37ºC)
Normal temperature (37ºC)
Sweating – heat is absorbed from skin to enable evaporation
Vasodilation of smooth muscles in arterioles – increase the amount of heat radiated and lost
Hair shaft flatten – warm air not trap against skin
No sweating Vasoconstriction of smooth muscles in
arterioles – reduce the amount of heat radiated and lost
Hair shaft raised – trapping insulating layer of warm air
Shivering of skeletal muscles – heat is generated
Thermoreceptor detect
Thermoreceptor detect
increase decrease
decrease increase
D12
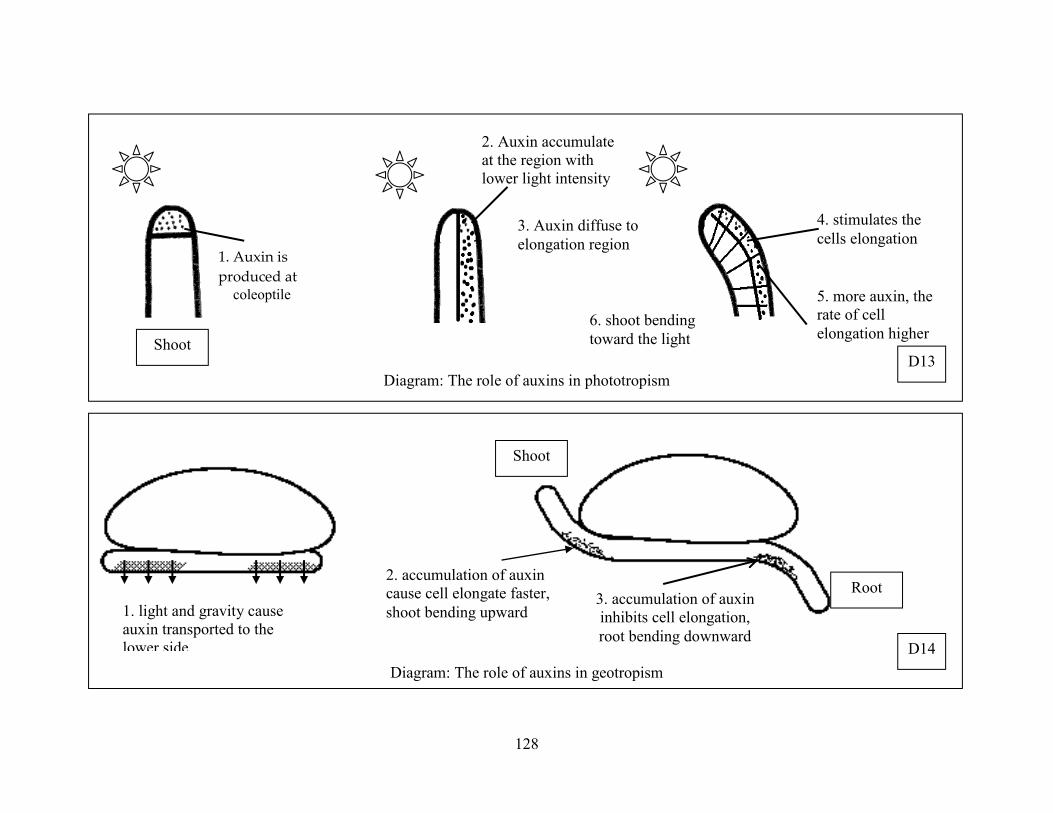
128
Diagram: The role of auxins in phototropism
Diagram: The role of auxins in geotropism
1. Auxin is
produced at coleoptile
2. Auxin accumulate at the region with lower light intensity
3. Auxin diffuse to elongation region
4. stimulates the cells elongation
5. more auxin, the rate of cell elongation higher
1. light and gravity cause auxin transported to the lower side
Shoot
Root 2. accumulation of auxin cause cell elongate faster, shoot bending upward
3. accumulation of auxin inhibits cell elongation, root bending downward
6. shoot bending toward the light Shoot
D13
D14
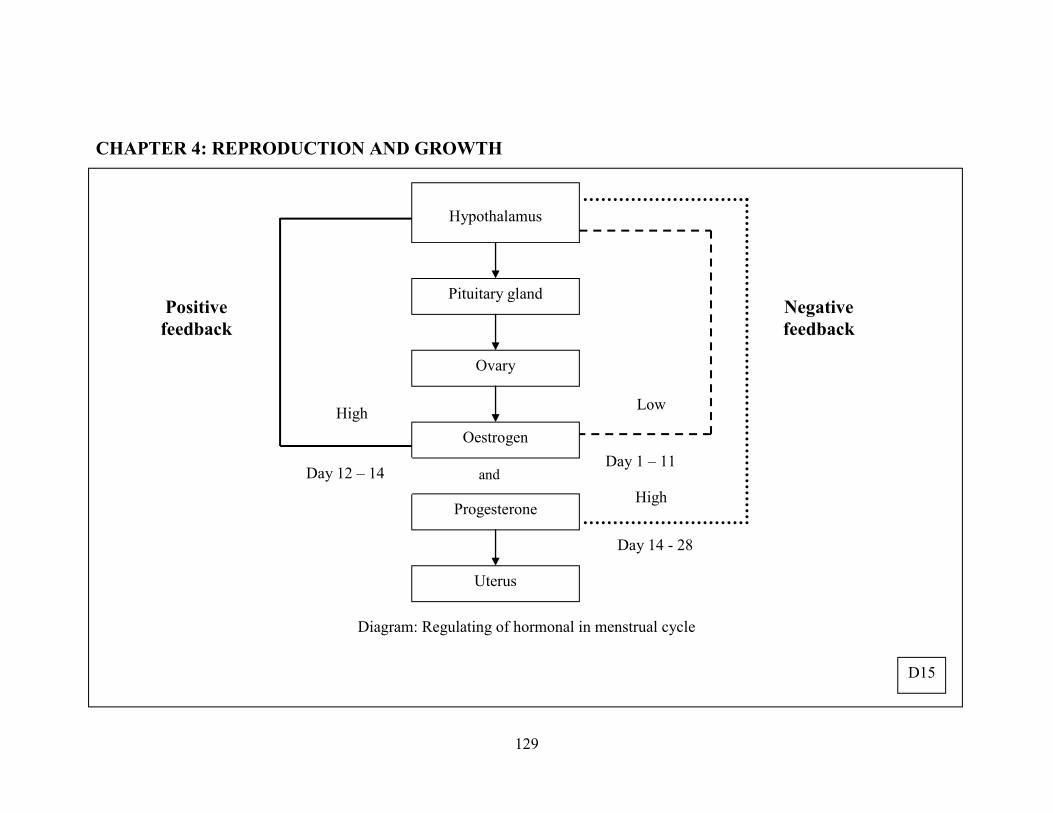
129
CHAPTER 4: REPRODUCTION AND GROWTH and
Diagram: Regulating of hormonal in menstrual cycle
Hypothalamus
Pituitary gland
Ovary
Oestrogen
Progesterone
Uterus
Day 12 – 14 Day 1 – 11
Day 14 - 28
Positive feedback
Negative feedback
High
High
Low
D15
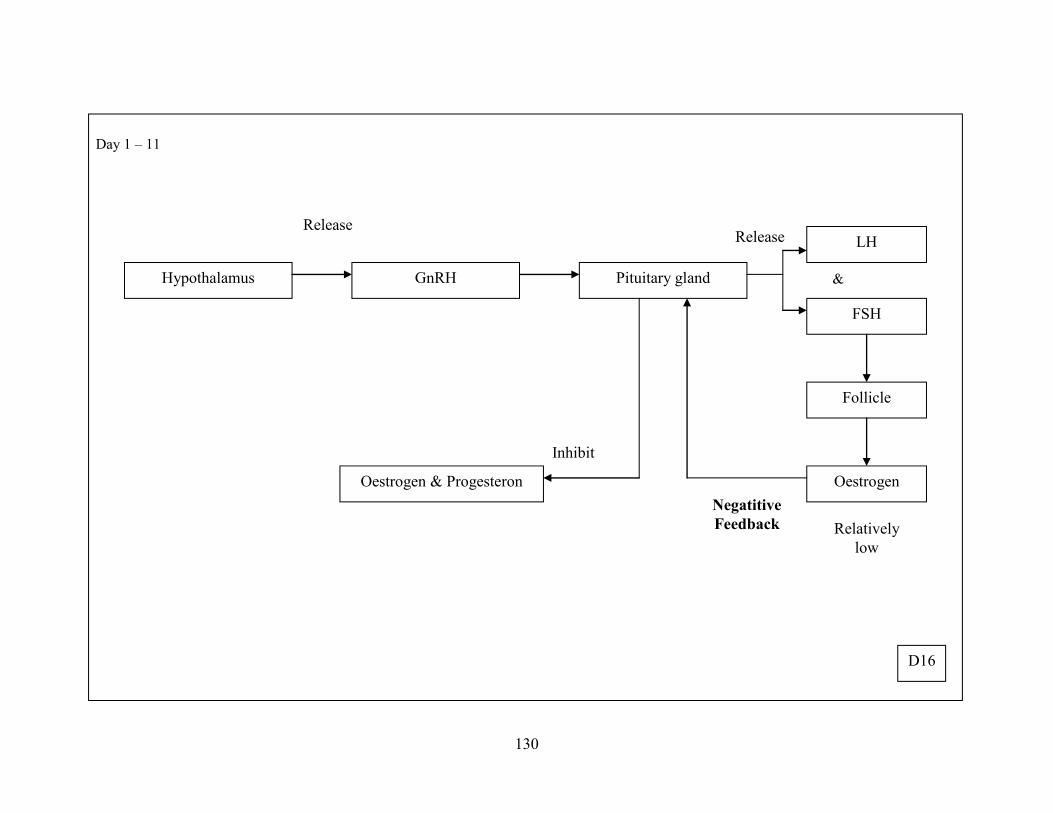
130
Release Release
Inhibit
Day 1 – 11
&
Hypothalamus GnRH Pituitary gland
LH
FSH
Follicle
Oestrogen Oestrogen & Progesteron Negatitive Feedback Relatively
low
D16
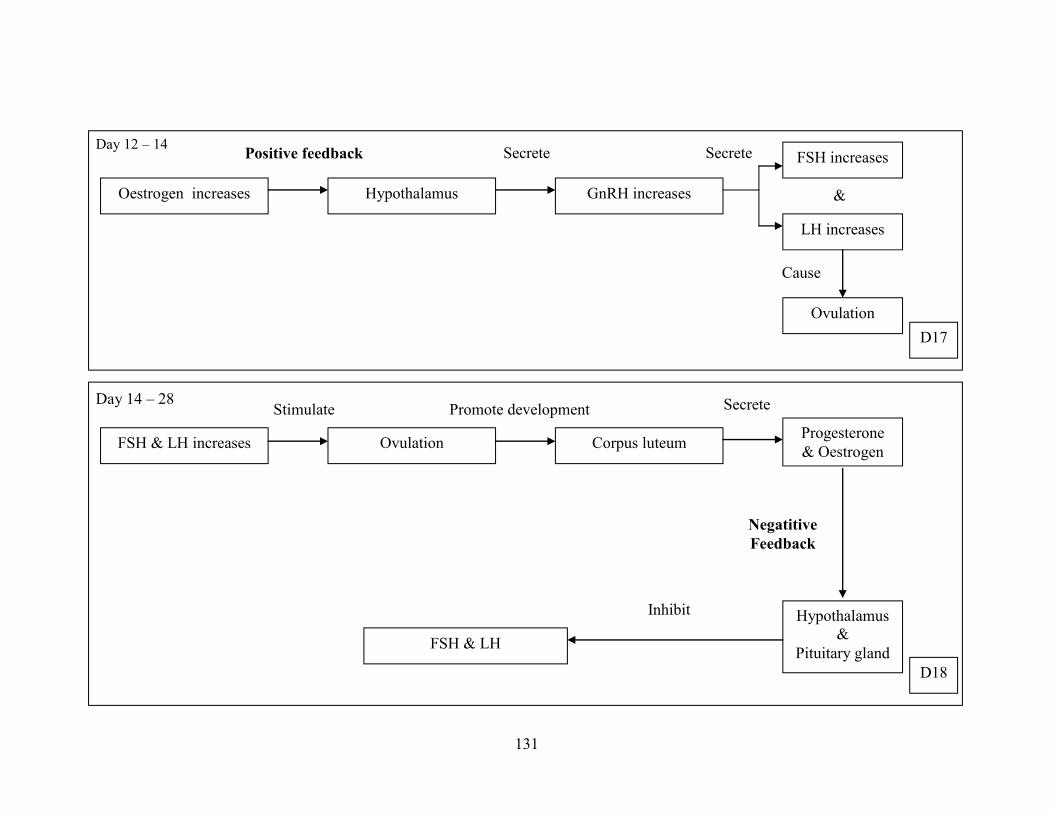
131
Secrete Positive feedback
Cause
Promote development Stimulate
Inhibit
Secrete
Secrete Day 12 – 14 & Day 14 – 28
Oestrogen increases Hypothalamus GnRH increases
FSH increases
LH increases
Ovulation
FSH & LH increases Ovulation Corpus luteum Progesterone & Oestrogen
Hypothalamus &
Pituitary gland FSH & LH
Negatitive Feedback
D17
D18
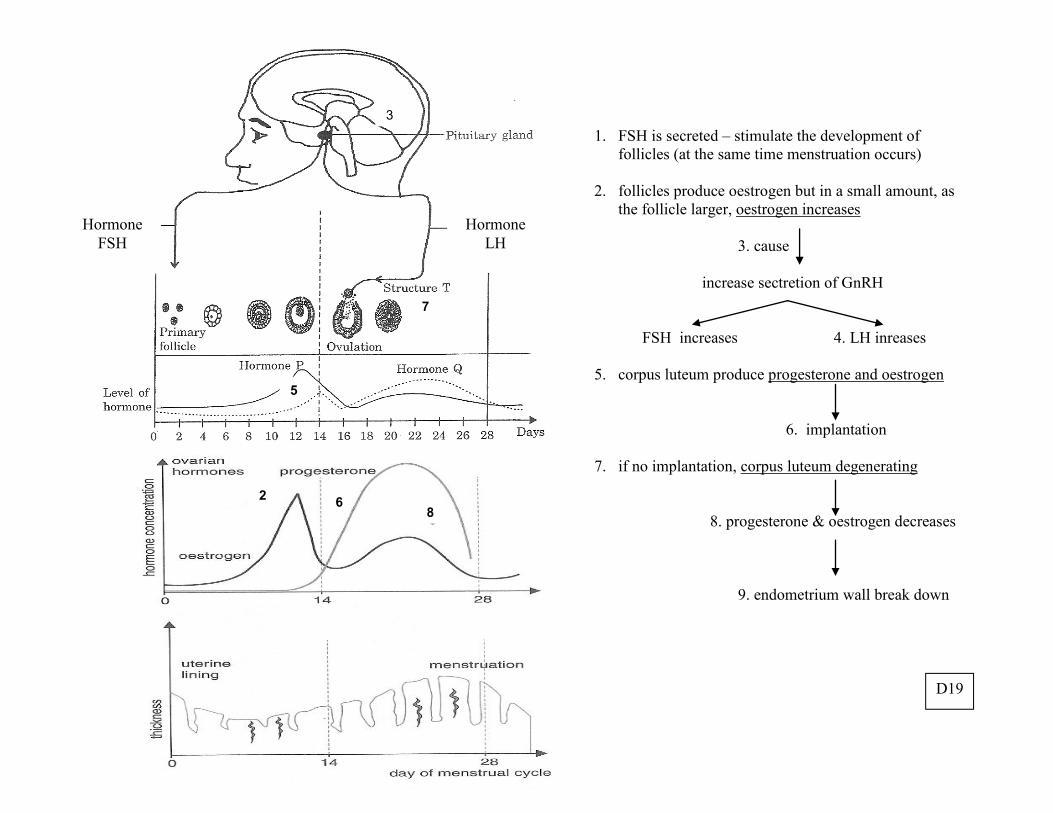
PP
132
Projek Jawab Untuk Jaya
8
6 6
Hormone LH Hormone FSH
7
3 1. FSH is secreted – stimulate the development of
follicles (at the same time menstruation occurs) 2. follicles produce oestrogen but in a small amount, as
the follicle larger, oestrogen increases
3. cause increase sectretion of GnRH FSH increases 4. LH inreases 5. corpus luteum produce progesterone and oestrogen
6. implantation
7. if no implantation, corpus luteum degenerating 8. progesterone & oestrogen decreases
9. endometrium wall break down
5
2 8
Hormone FSH
Hormone LH
D19
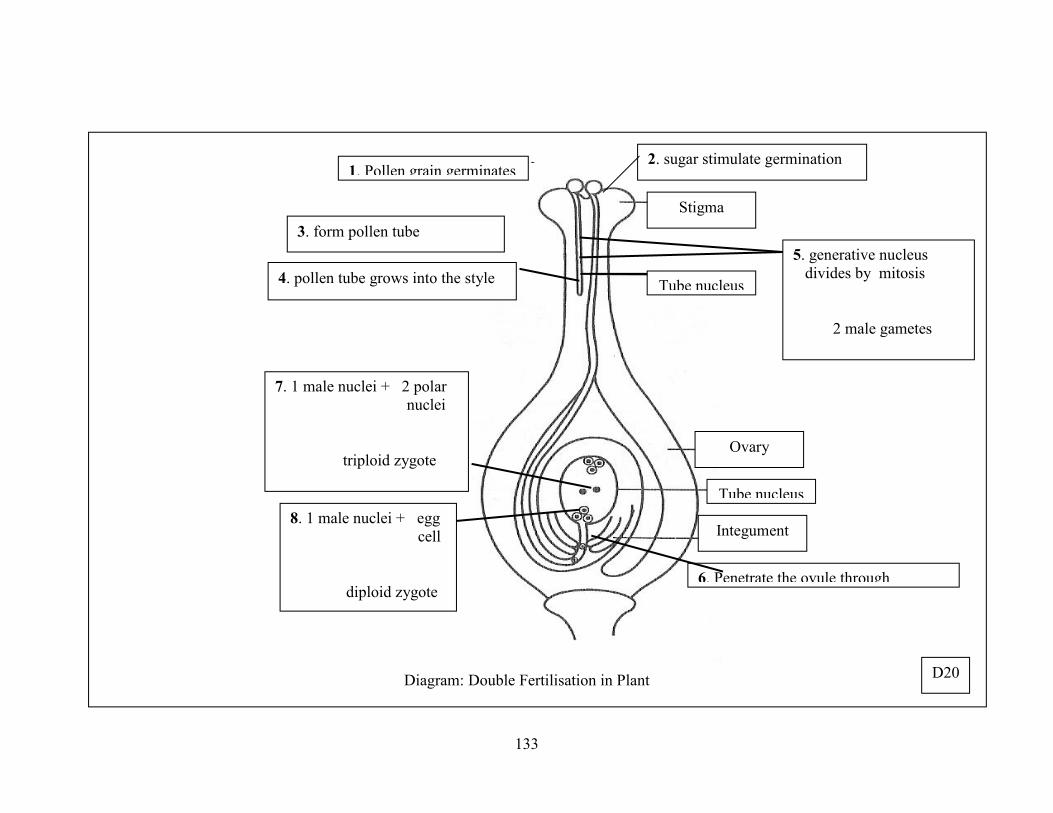
133
● ● ●
Diagram: Double Fertilisation in Plant
1. Pollen grain germinates 2. sugar stimulate germination
4. pollen tube grows into the style
3. form pollen tube
Tube nucleus
5. generative nucleus divides by mitosis 2 male gametes
Stigma
Ovary
Tube nucleus
Integument
6. Penetrate the ovule through micropyle
8. 1 male nuclei + egg cell diploid zygote
7. 1 male nuclei + 2 polar nuclei triploid zygote
D20
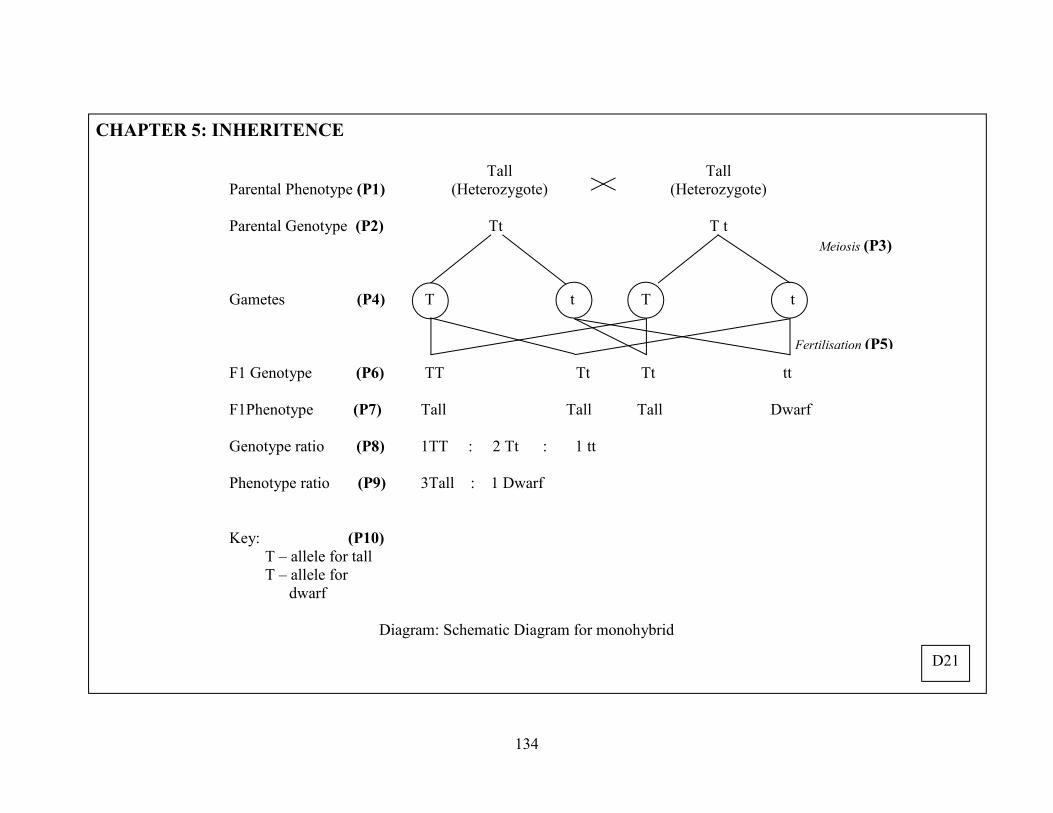
134
Fertilisation (P5)
CHAPTER 5: INHERITENCE
Parental Phenotype (P1)
Tall (Heterozygote)
Tall (Heterozygote)
Parental Genotype (P2)
Tt
T t
Gametes (P4)
T t
T t
F1 Genotype (P6)
TT Tt
Tt tt
F1Phenotype (P7)
Tall Tall
Tall Dwarf
Genotype ratio (P8)
1TT : 2 Tt : 1 tt
Phenotype ratio (P9)
3Tall : 1 Dwarf
Key: (P10) T – allele for tall T – allele for dwarf
Diagram: Schematic Diagram for monohybrid
Meiosis (P3)
D21
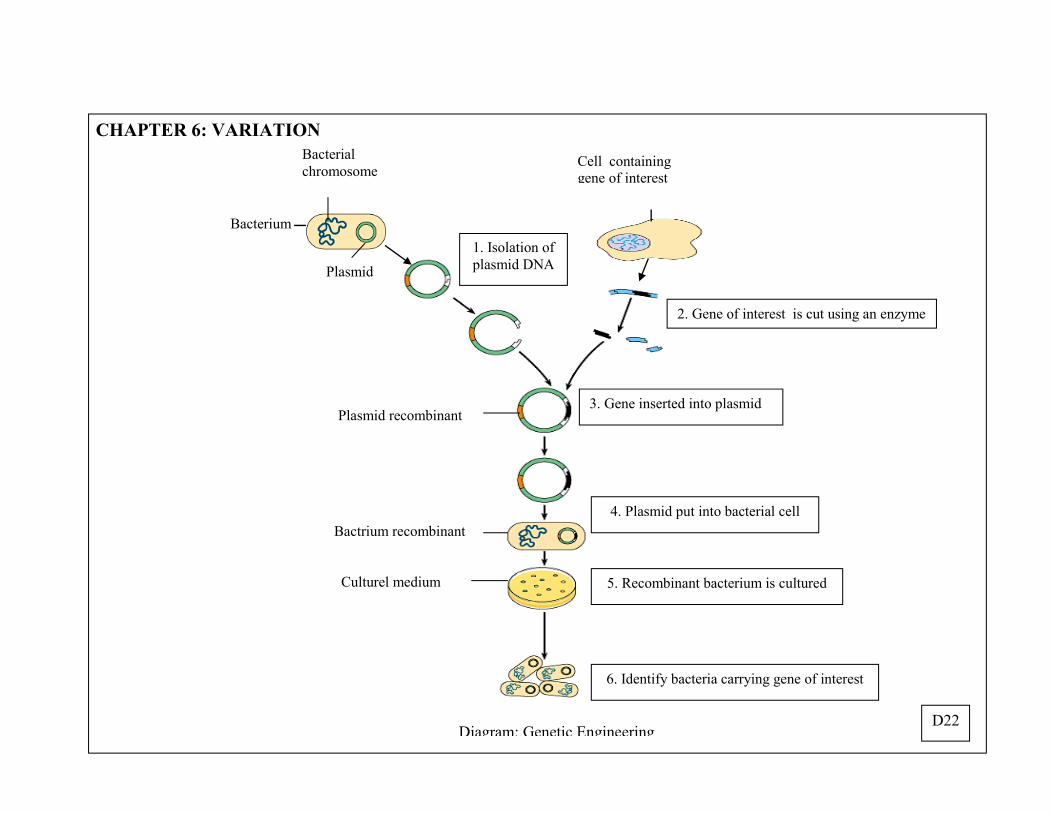
135
CHAPTER 6: VARIATION
Cell containing gene of interest
1. Isolation of plasmid DNA Plasmid
Bacterial chromosome
Bacterium
2. Gene of interest is cut using an enzyme
4. Plasmid put into bacterial cell
3. Gene inserted into plasmid
5. Recombinant bacterium is cultured
6. Identify bacteria carrying gene of interest
Plasmid recombinant
Bactrium recombinant
Culturel medium
Diagram: Genetic Engineering D22
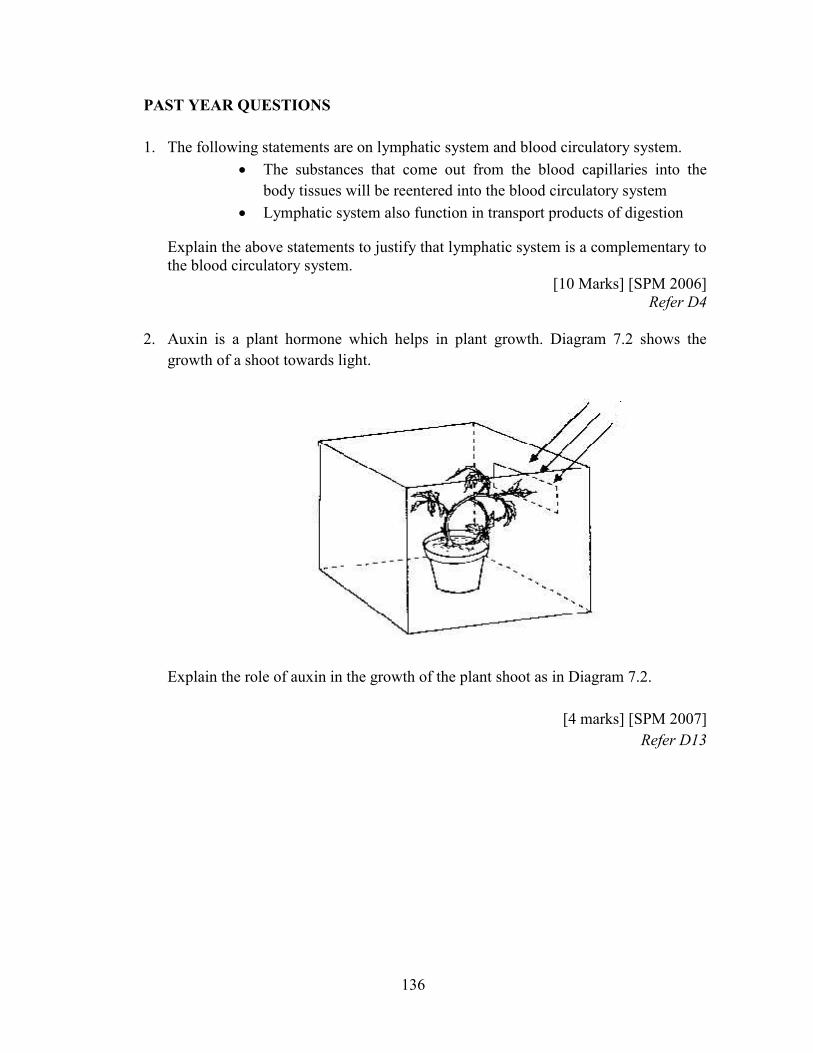
136
PAST YEAR QUESTIONS 1. The following statements are on lymphatic system and blood circulatory system.
The substances that come out from the blood capillaries into the body tissues will be reentered into the blood circulatory system
Lymphatic system also function in transport products of digestion
Explain the above statements to justify that lymphatic system is a complementary to the blood circulatory system.
[10 Marks] [SPM 2006] Refer D4
2. Auxin is a plant hormone which helps in plant growth. Diagram 7.2 shows the
growth of a shoot towards light.
Explain the role of auxin in the growth of the plant shoot as in Diagram 7.2.
[4 marks] [SPM 2007] Refer D13
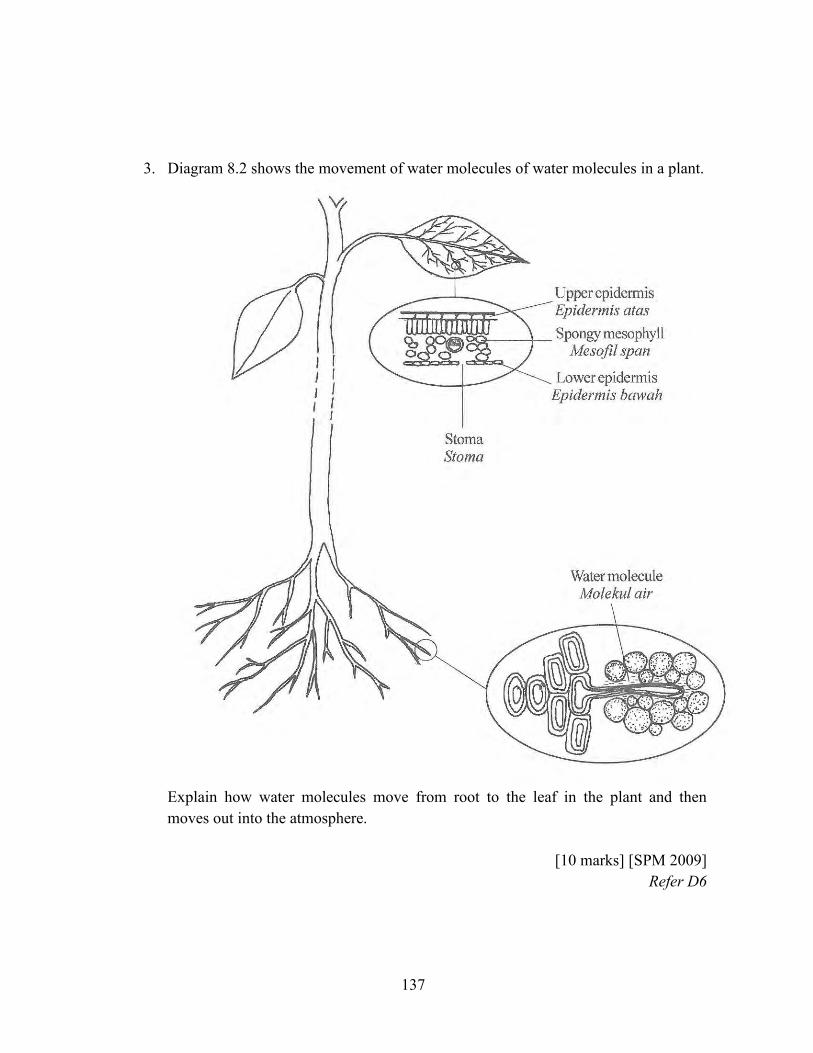
137
3. Diagram 8.2 shows the movement of water molecules of water molecules in a plant.
Explain how water molecules move from root to the leaf in the plant and then moves out into the atmosphere.
[10 marks] [SPM 2009]
Refer D6
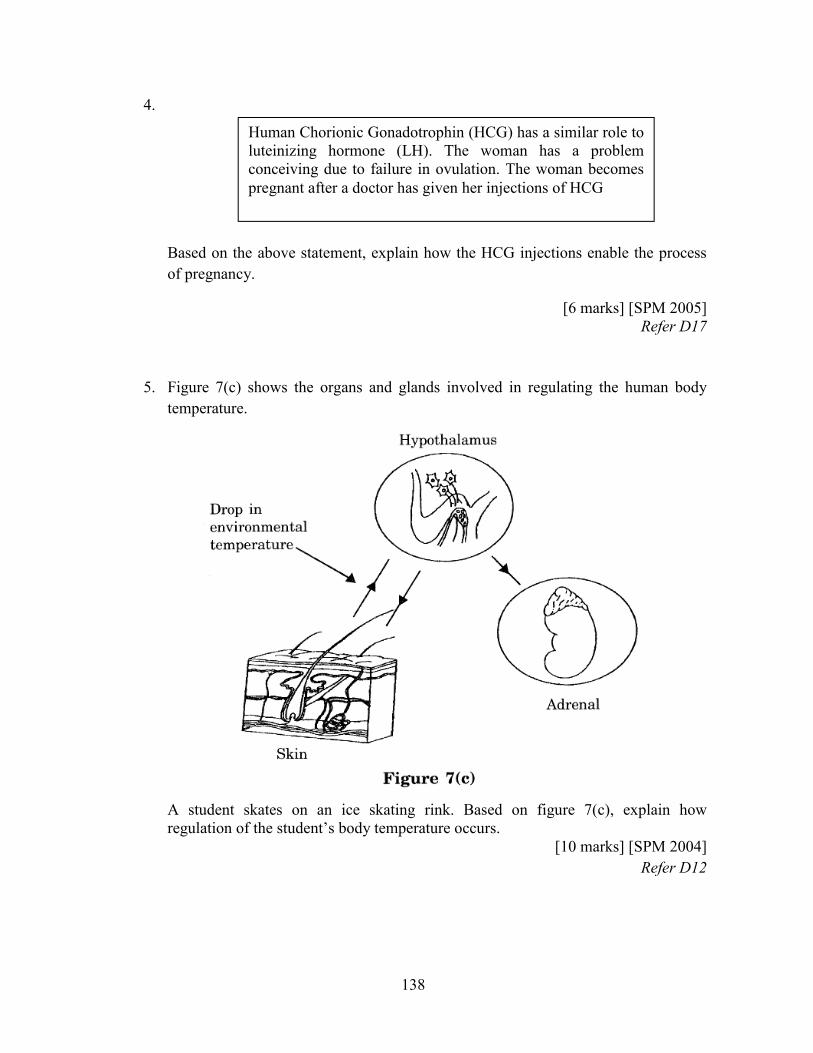
138
4. Based on the above statement, explain how the HCG injections enable the process of pregnancy.
[6 marks] [SPM 2005] Refer D17
5. Figure 7(c) shows the organs and glands involved in regulating the human body temperature.
A student skates on an ice skating rink. Based on figure 7(c), explain how regulation of the student’s body temperature occurs.
[10 marks] [SPM 2004] Refer D12
Human Chorionic Gonadotrophin (HCG) has a similar role to luteinizing hormone (LH). The woman has a problem conceiving due to failure in ovulation. The woman becomes pregnant after a doctor has given her injections of HCG
139
6. Starting from when the blood enters the kidney, explain how the waste products excreted from kidney as urine.
[15 marks] [SPM 1988] Refer D9
7. A supervisor enters a frozen storage that use for keeping the food. Explain the
physiology changes that occurs in the body to maintain his body temperature.
[10 marks] [SPM 2001] Refer D12
8. Individual X had a medical check up. He told the doctor that his wound at his leg
takes time for recovery. After the medical check up ,the doctor told him: i. His urine is positive for reducing sugar ii. His blood glucose level over the normal level iii. Are adviced to reduce the intake of rich carbohydrate food iv. To take insulin injection
Based on your biological knowledge, write a report that explain the individual X’s condition.
[8 marks] [SPM 2001] Refer D11
9. Menstrual cycle is controlled by hormones that released by pituitary gland and
ovary. Married women who want to practice family planning may use the contraceptive pills. Describe how contraceptive pills act as a negative feedback to prevent pregnancy.
[10 marks] [SPM 2002]
Refer D16 & D18
10. In a family, the father has curly hair and the mother has straight hair. Based on your genetic knowledge, explain why all their children do not have straight hair.
[10 marks] [SPM 1987]
Refer D21
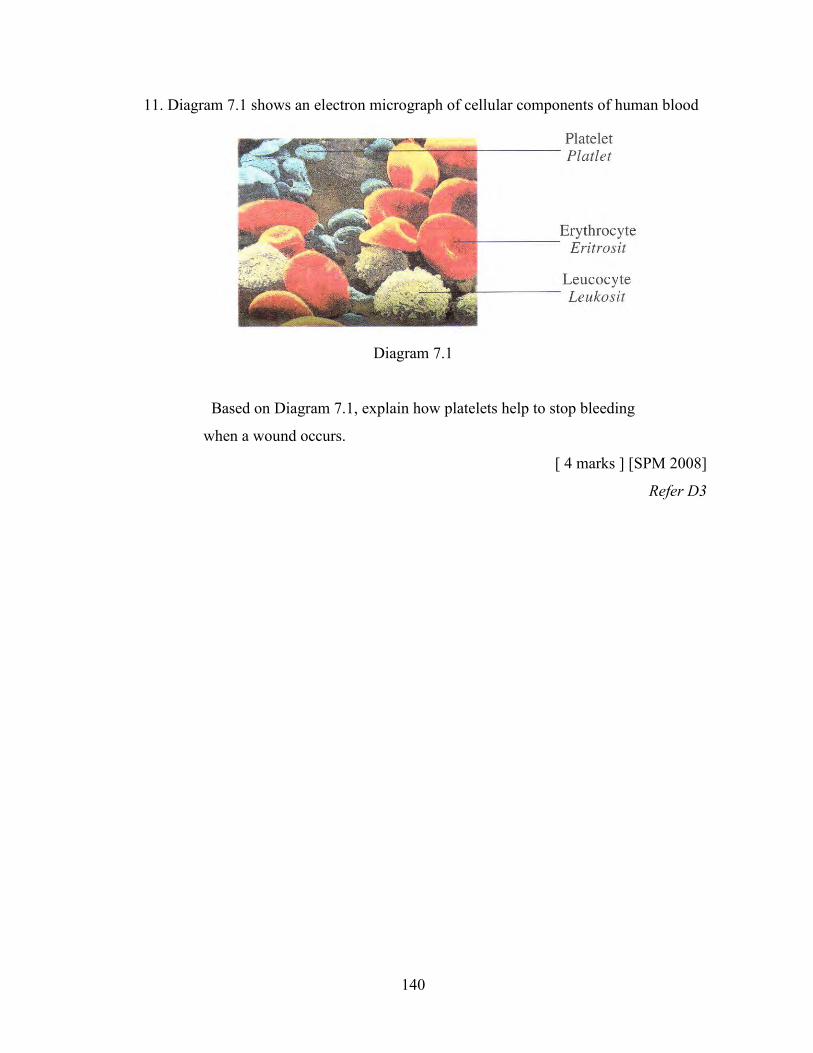
140
11. Diagram 7.1 shows an electron micrograph of cellular components of human blood
Diagram 7.1
Based on Diagram 7.1, explain how platelets help to stop bleeding
when a wound occurs.
[ 4 marks ] [SPM 2008]
Refer D3
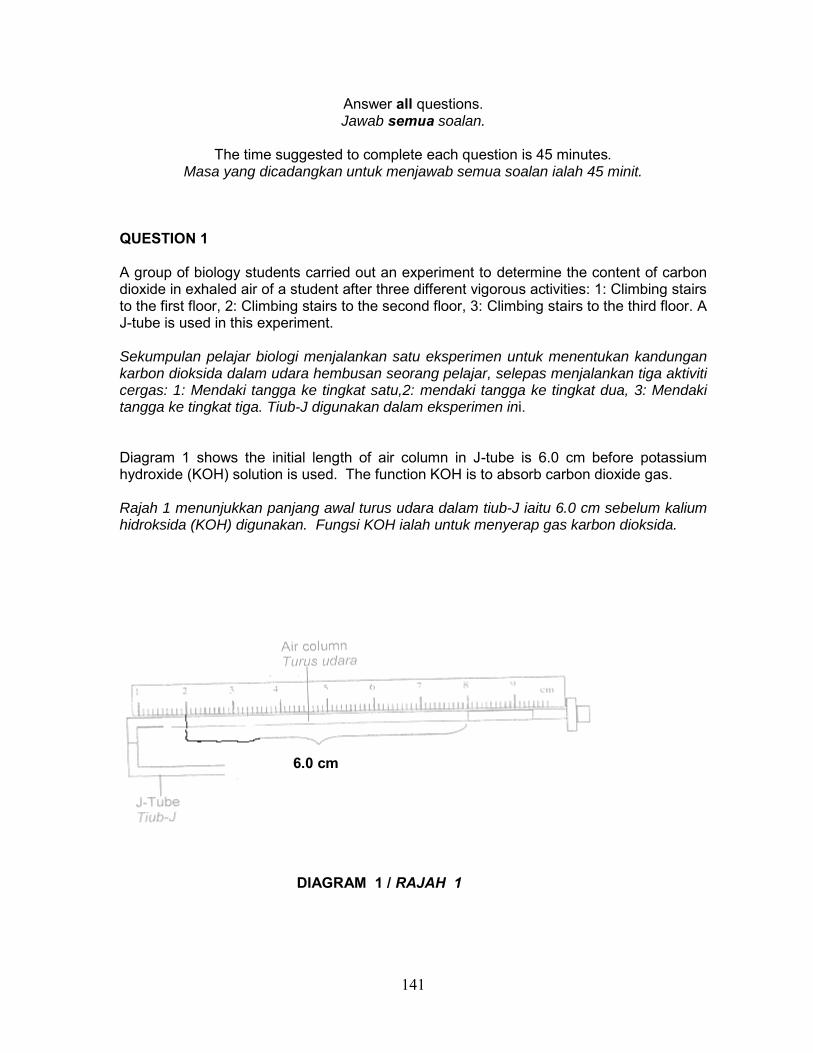
141
Answer all questions. Jawab semua soalan.
The time suggested to complete each question is 45 minutes.
Masa yang dicadangkan untuk menjawab semua soalan ialah 45 minit. QUESTION 1 A group of biology students carried out an experiment to determine the content of carbon dioxide in exhaled air of a student after three different vigorous activities: 1: Climbing stairs to the first floor, 2: Climbing stairs to the second floor, 3: Climbing stairs to the third floor. A J-tube is used in this experiment. Sekumpulan pelajar biologi menjalankan satu eksperimen untuk menentukan kandungan karbon dioksida dalam udara hembusan seorang pelajar, selepas menjalankan tiga aktiviti cergas: 1: Mendaki tangga ke tingkat satu,2: mendaki tangga ke tingkat dua, 3: Mendaki tangga ke tingkat tiga. Tiub-J digunakan dalam eksperimen ini. Diagram 1 shows the initial length of air column in J-tube is 6.0 cm before potassium hydroxide (KOH) solution is used. The function KOH is to absorb carbon dioxide gas. Rajah 1 menunjukkan panjang awal turus udara dalam tiub-J iaitu 6.0 cm sebelum kalium hidroksida (KOH) digunakan. Fungsi KOH ialah untuk menyerap gas karbon dioksida.
6.0 cm
DIAGRAM 1 / RAJAH 1
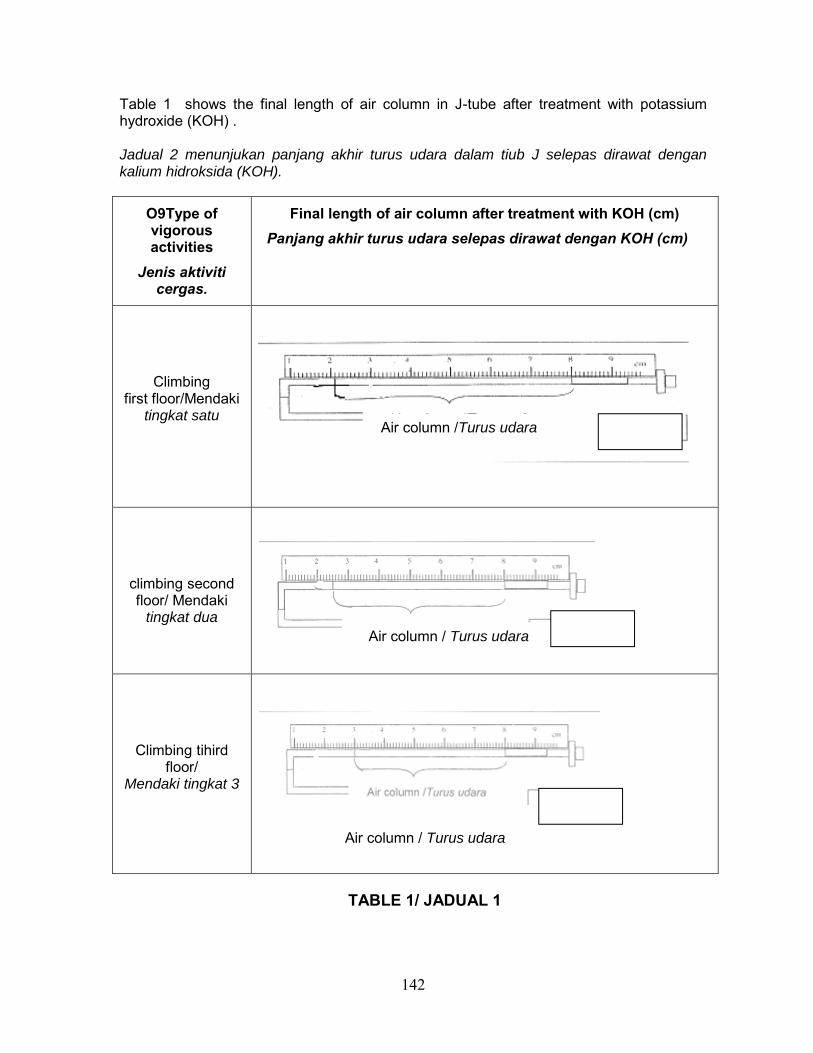
142
Table 1 shows the final length of air column in J-tube after treatment with potassium hydroxide (KOH) . Jadual 2 menunjukan panjang akhir turus udara dalam tiub J selepas dirawat dengan kalium hidroksida (KOH).
O9Type of vigorous activities
Jenis aktiviti cergas.
Final length of air column after treatment with KOH (cm) Panjang akhir turus udara selepas dirawat dengan KOH (cm)
Climbing first floor/Mendaki
tingkat satu
climbing second floor/ Mendaki
tingkat dua
Climbing tihird floor/
Mendaki tingkat 3
TABLE 1/ JADUAL 1
Air column / Turus udara
Air column /Turus udara
Air column / Turus udara
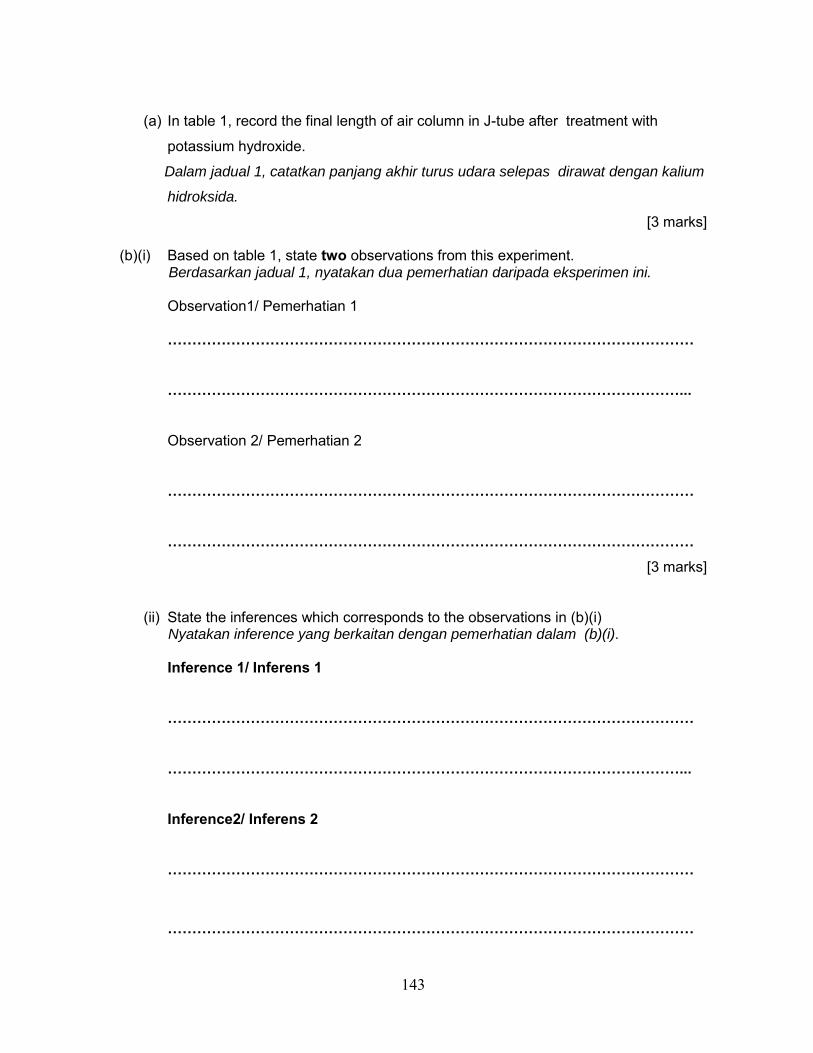
143
(a) In table 1, record the final length of air column in J-tube after treatment with
potassium hydroxide.
Dalam jadual 1, catatkan panjang akhir turus udara selepas dirawat dengan kalium
hidroksida.
[3 marks]
(b)(i) Based on table 1, state two observations from this experiment. Berdasarkan jadual 1, nyatakan dua pemerhatian daripada eksperimen ini.
Observation1/ Pemerhatian 1 ……………………………………………………………………………………………… ……………………………………………………………………………………………...
Observation 2/ Pemerhatian 2
……………………………………………………………………………………………… ………………………………………………………………………………………………
[3 marks]
(ii) State the inferences which corresponds to the observations in (b)(i) Nyatakan inference yang berkaitan dengan pemerhatian dalam (b)(i).
Inference 1/ Inferens 1
……………………………………………………………………………………………… ……………………………………………………………………………………………...
Inference2/ Inferens 2
………………………………………………………………………………………………
………………………………………………………………………………………………
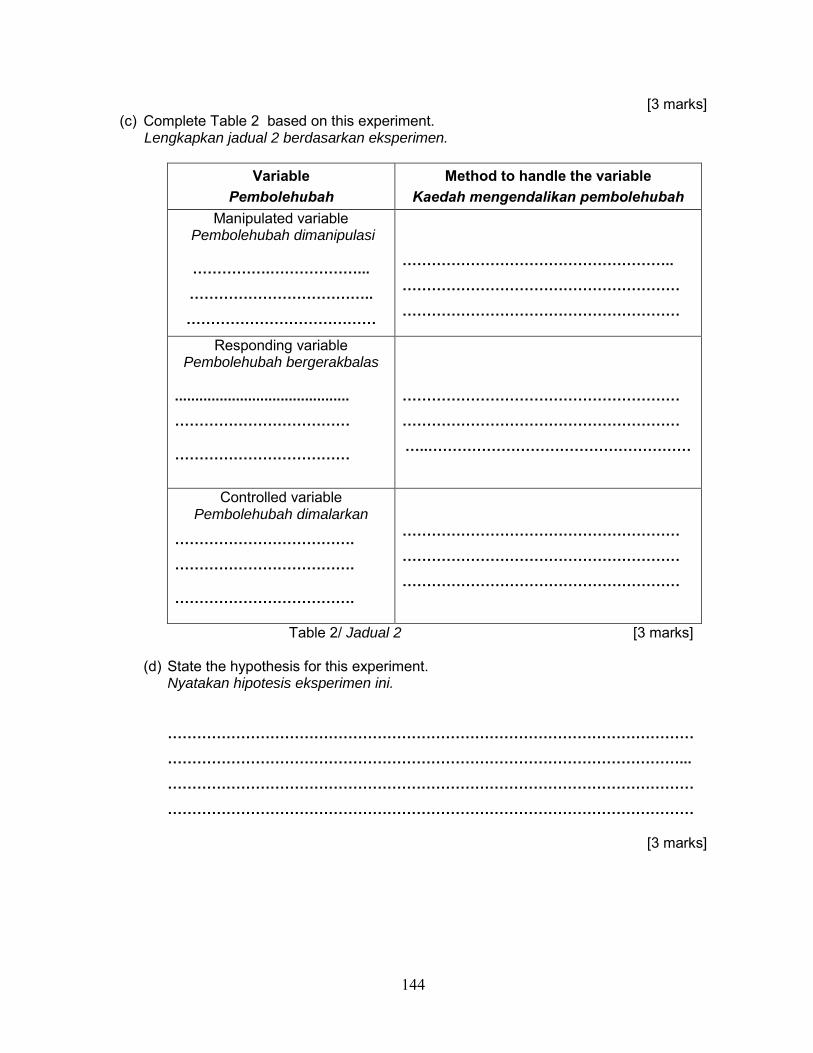
144
[3 marks] (c) Complete Table 2 based on this experiment. Lengkapkan jadual 2 berdasarkan eksperimen.
Variable
Pembolehubah Method to handle the variable
Kaedah mengendalikan pembolehubah Manipulated variable
Pembolehubah dimanipulasi
…………….………………... ……………………………….. …………………………………
……………………………………………….. ………………………………………………… …………………………………………………
Responding variable Pembolehubah bergerakbalas
........................................... ……………………………… ………………………………
………………………………………………… ………………………………………………… …..………………………………………………
Controlled variable Pembolehubah dimalarkan
………………………………. ………………………………. ……………………………….
………………………………………………… ………………………………………………… …………………………………………………
Table 2/ Jadual 2 [3 marks]
(d) State the hypothesis for this experiment. Nyatakan hipotesis eksperimen ini.
……………………………………………………………………………………………… ……………………………………………………………………………………………... ……………………………………………………………………………………………… ………………………………………………………………………………………………
[3 marks]
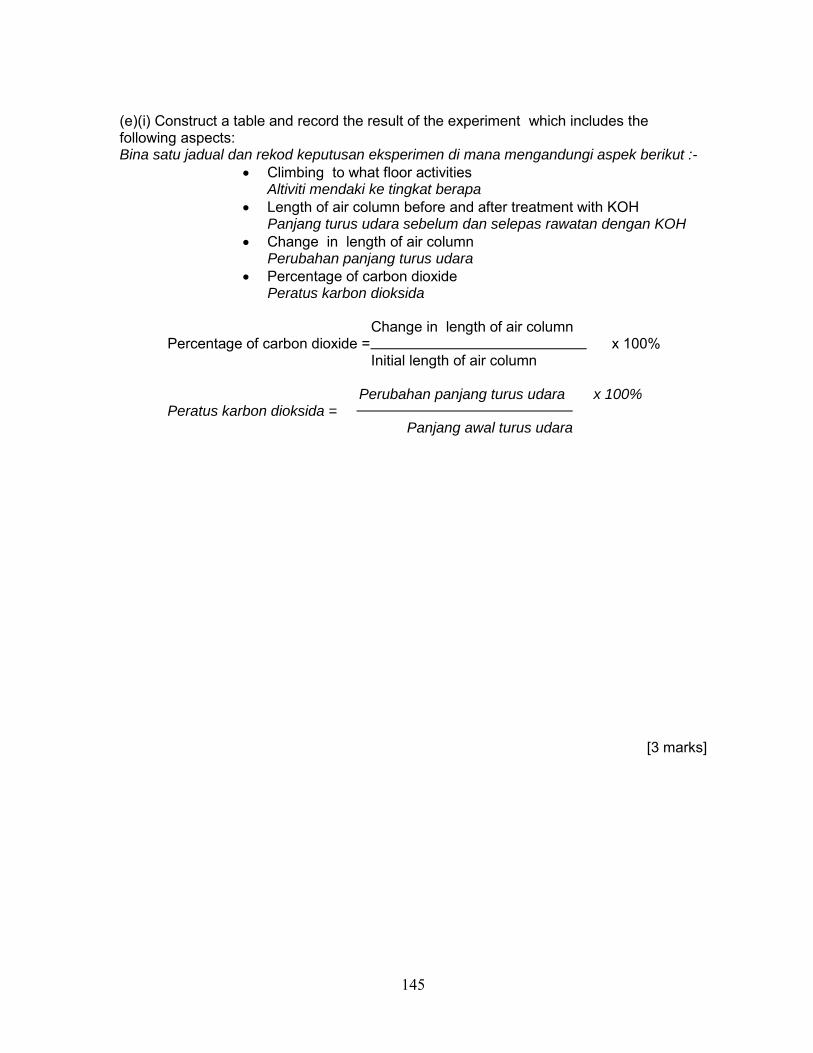
145
(e)(i) Construct a table and record the result of the experiment which includes the following aspects: Bina satu jadual dan rekod keputusan eksperimen di mana mengandungi aspek berikut :-
Climbing to what floor activities Altiviti mendaki ke tingkat berapa
Length of air column before and after treatment with KOH Panjang turus udara sebelum dan selepas rawatan dengan KOH
Change in length of air column Perubahan panjang turus udara
Percentage of carbon dioxide Peratus karbon dioksida
Change in length of air column
Percentage of carbon dioxide = x 100% Initial length of air column
Perubahan panjang turus udara x 100% Peratus karbon dioksida =
Panjang awal turus udara
[3 marks]
146
ii) Draw a bar chart to show percentage of carbon dioxide against activities on the graph paper provided. Lukis graf bar untuk menunjukkan peratus karbon dioksida melawan aktiviti cergas pada kertas graf yang disediakan.
[3 marks]
f) Based on a bar chart, explain the relationship between level of floor and the percentage of carbon dioxide released ?
147
Berdasarkan graf bar , terangkan perhubungan antara tingkat yang didaki dan peratus pembebasan karbon dioksida?
………………………………………………………………………………………………
……………………………………………………………………………………………...
………………………………………………………………………………………………
……………………………………………………………………………………………… [3 marks]
g) Climbing stair activity is repeated by increasing to fifth floors. Predict the
percentage of carbon dioxide released. Aktiviti mendaki tangga diulang dengan meningkatkan tingkat, ke tingkat lima. Ramalkan peratus karbon dioksida yang dibebaskan.
………………………………………………………………………………………………
……………………………………………………………………………………………...
………………………………………………………………………………………………
……………………………………………………………………………………………… [3 marks]
(h) Based on the result of this experiment, state the operational definition exhaled air?
Berdasarkan keputusan eksperimen ini, nyatakan definasi secara operasi bagi udara hembusan?
………………………………………………………………………………………………
……………………………………………………………………………………………...
………………………………………………………………………………………………
………………………………………………………………………………………………
[3 marks] (i) Using the list provided below, in the table 3, classify the requirements to carry out the
experiment.
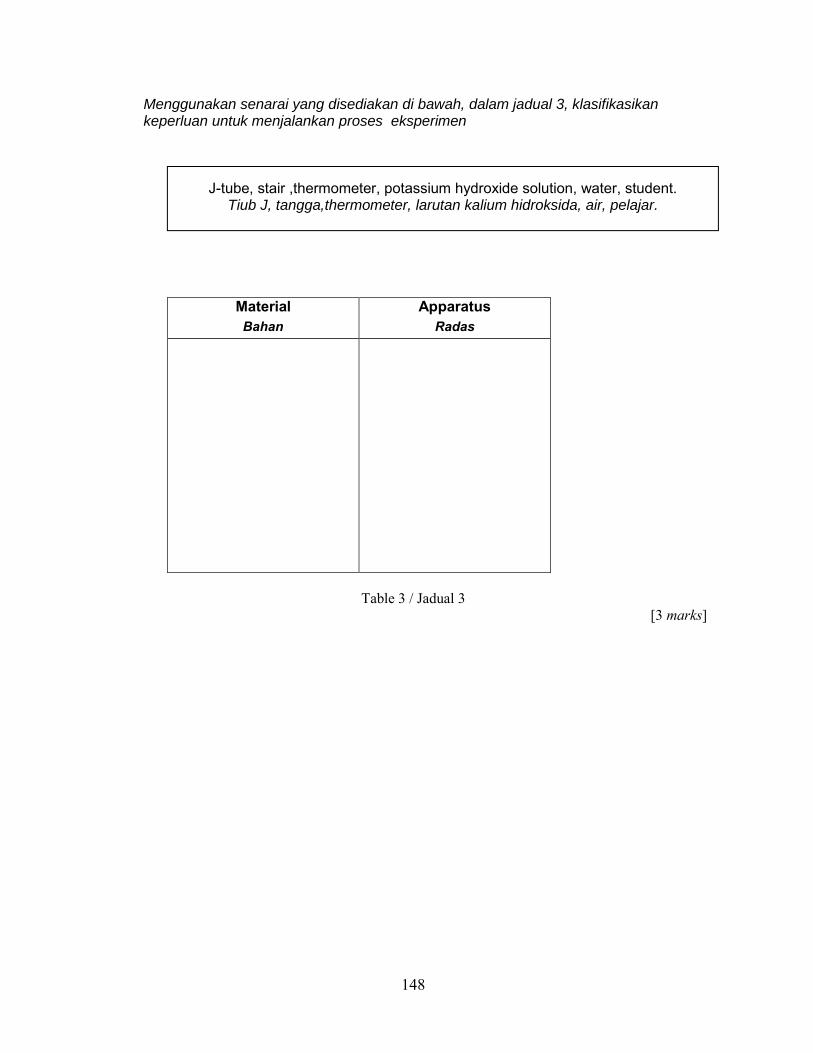
148
Menggunakan senarai yang disediakan di bawah, dalam jadual 3, klasifikasikan keperluan untuk menjalankan proses eksperimen
Material Bahan
Apparatus Radas
Table 3 / Jadual 3
[3 marks]
J-tube, stair ,thermometer, potassium hydroxide solution, water, student. Tiub J, tangga,thermometer, larutan kalium hidroksida, air, pelajar.
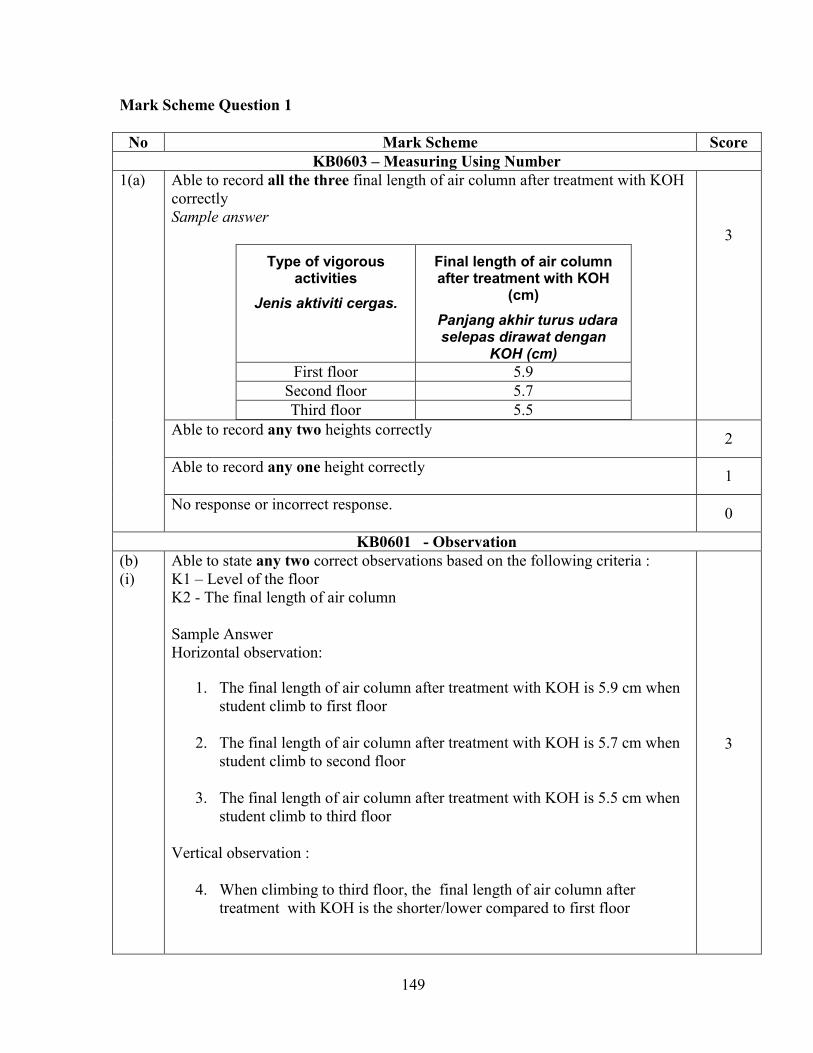
149
Mark Scheme Question 1
No Mark Scheme Score KB0603 – Measuring Using Number
1(a)
Able to record all the three final length of air column after treatment with KOH correctly Sample answer
Type of vigorous activities
Jenis aktiviti cergas.
Final length of air column after treatment with KOH
(cm) Panjang akhir turus udara
selepas dirawat dengan KOH (cm)
First floor 5.9 Second floor 5.7 Third floor 5.5
3
Able to record any two heights correctly 2
Able to record any one height correctly 1
No response or incorrect response. 0
KB0601 - Observation (b) (i)
Able to state any two correct observations based on the following criteria : K1 – Level of the floor K2 - The final length of air column Sample Answer Horizontal observation:
1. The final length of air column after treatment with KOH is 5.9 cm when student climb to first floor
2. The final length of air column after treatment with KOH is 5.7 cm when
student climb to second floor
3. The final length of air column after treatment with KOH is 5.5 cm when student climb to third floor
Vertical observation :
4. When climbing to third floor, the final length of air column after treatment with KOH is the shorter/lower compared to first floor
3

150
Able to state one correct observation and any one inaccurate observation or
able to state two inaccurate observations Sample answers of incomplete observation : (Has the level of floor, but no value of length but in qualitative) Horizontal
1. At first floor,the final length of air column after treatment with KOH is longer.
2. At third floor,the final length of air column after treatment with KOH is shorter.
Vertical
3. Lower level of floor, has longer final length of air column after treatment with KOH (comparing)
2
Able to state only one correct observation or Able to state two observations at idea level. Sample answer
1. In lower / higher of level floor, has longer/shorter final length of column after treatment with KOH.
2. Final length of air column is decrease.
1
No response or incorrect response or one idea only 0
Scoring
Correct Inaccurate Idea Wrong Score 2 - - - 3 1 1 - - 2 - 2 - - 1 - 1 - 1 - - 2 - 1 1 - 1 1 - - 1 - 1 0 - - 1 1
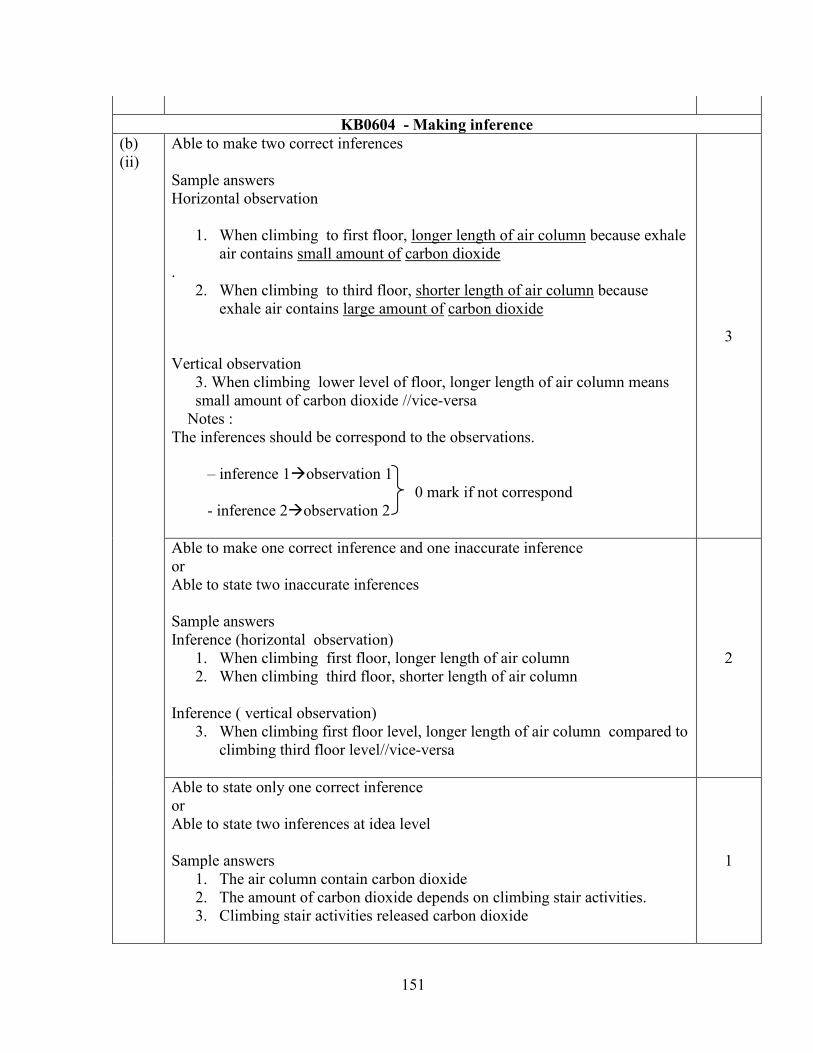
151
KB0604 - Making inference
(b) (ii)
Able to make two correct inferences Sample answers Horizontal observation
1. When climbing to first floor, longer length of air column because exhale air contains small amount of carbon dioxide
. 2. When climbing to third floor, shorter length of air column because
exhale air contains large amount of carbon dioxide Vertical observation
3. When climbing lower level of floor, longer length of air column means small amount of carbon dioxide //vice-versa
Notes : The inferences should be correspond to the observations. – inference 1observation 1 0 mark if not correspond
- inference 2observation 2
3
Able to make one correct inference and one inaccurate inference or Able to state two inaccurate inferences Sample answers Inference (horizontal observation)
1. When climbing first floor, longer length of air column 2. When climbing third floor, shorter length of air column
Inference ( vertical observation)
3. When climbing first floor level, longer length of air column compared to climbing third floor level//vice-versa
2
Able to state only one correct inference or Able to state two inferences at idea level Sample answers
1. The air column contain carbon dioxide 2. The amount of carbon dioxide depends on climbing stair activities. 3. Climbing stair activities released carbon dioxide
1
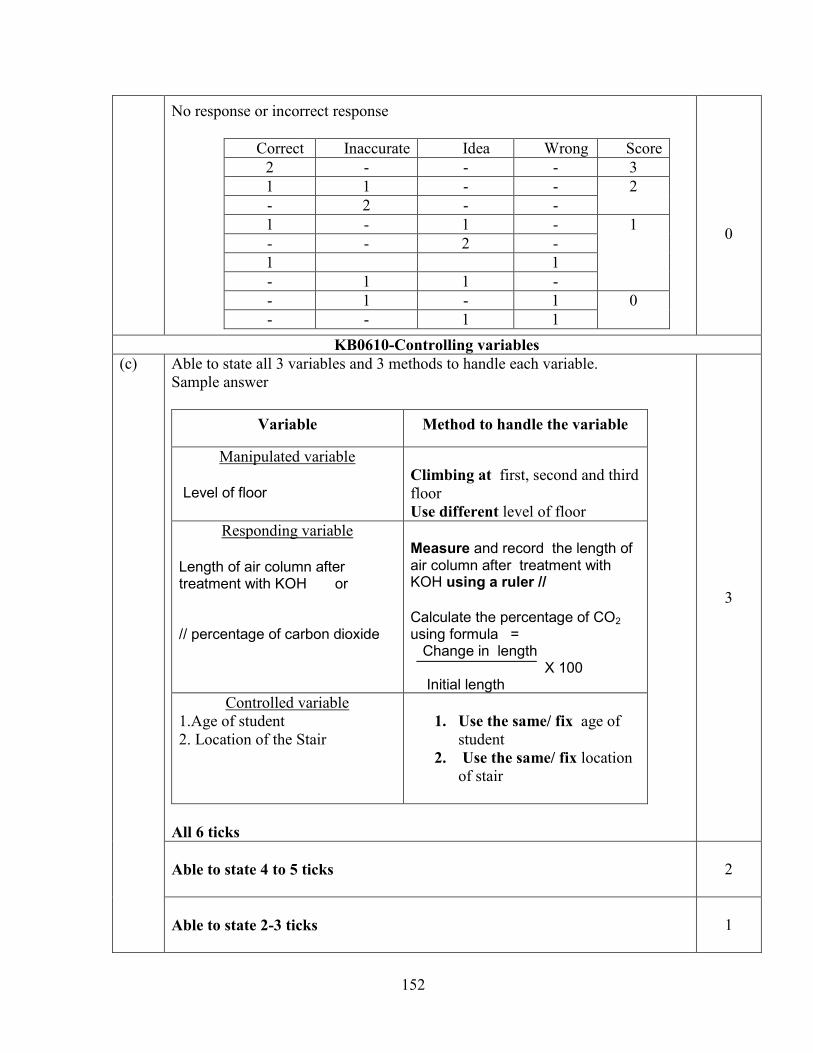
152
No response or incorrect response
Correct Inaccurate Idea Wrong Score 2 - - - 3 1 1 - - 2 - 2 - - 1 - 1 - 1 - - 2 - 1 1 - 1 1 - - 1 - 1 0 - - 1 1
0
KB0610-Controlling variables
(c) Able to state all 3 variables and 3 methods to handle each variable. Sample answer
Variable Method to handle the variable
Manipulated variable Level of floor
Climbing at first, second and third floor Use different level of floor
Responding variable
Length of air column after treatment with KOH or // percentage of carbon dioxide
Measure and record the length of air column after treatment with KOH using a ruler // Calculate the percentage of CO2 using formula = Change in length X 100 Initial length
Controlled variable 1.Age of student 2. Location of the Stair
1. Use the same/ fix age of
student 2. Use the same/ fix location
of stair
All 6 ticks
3
Able to state 4 to 5 ticks
2
Able to state 2-3 ticks
1
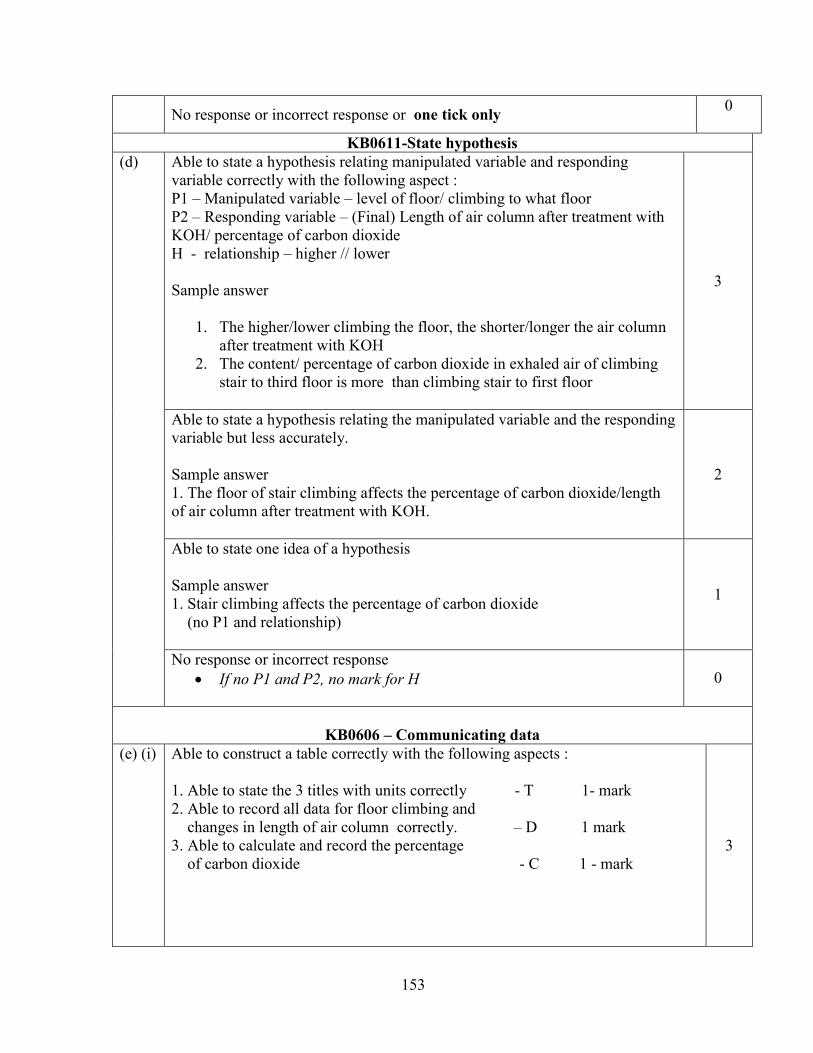
153
No response or incorrect response or one tick only 0
KB0611-State hypothesis (d) Able to state a hypothesis relating manipulated variable and responding
variable correctly with the following aspect : P1 – Manipulated variable – level of floor/ climbing to what floor P2 – Responding variable – (Final) Length of air column after treatment with KOH/ percentage of carbon dioxide H - relationship – higher // lower Sample answer
1. The higher/lower climbing the floor, the shorter/longer the air column after treatment with KOH
2. The content/ percentage of carbon dioxide in exhaled air of climbing stair to third floor is more than climbing stair to first floor
3
Able to state a hypothesis relating the manipulated variable and the responding variable but less accurately. Sample answer 1. The floor of stair climbing affects the percentage of carbon dioxide/length of air column after treatment with KOH.
2
Able to state one idea of a hypothesis Sample answer 1. Stair climbing affects the percentage of carbon dioxide (no P1 and relationship)
1
No response or incorrect response If no P1 and P2, no mark for H
0
KB0606 – Communicating data
(e) (i) Able to construct a table correctly with the following aspects : 1. Able to state the 3 titles with units correctly - T 1- mark 2. Able to record all data for floor climbing and changes in length of air column correctly. – D 1 mark 3. Able to calculate and record the percentage of carbon dioxide - C 1 - mark
3
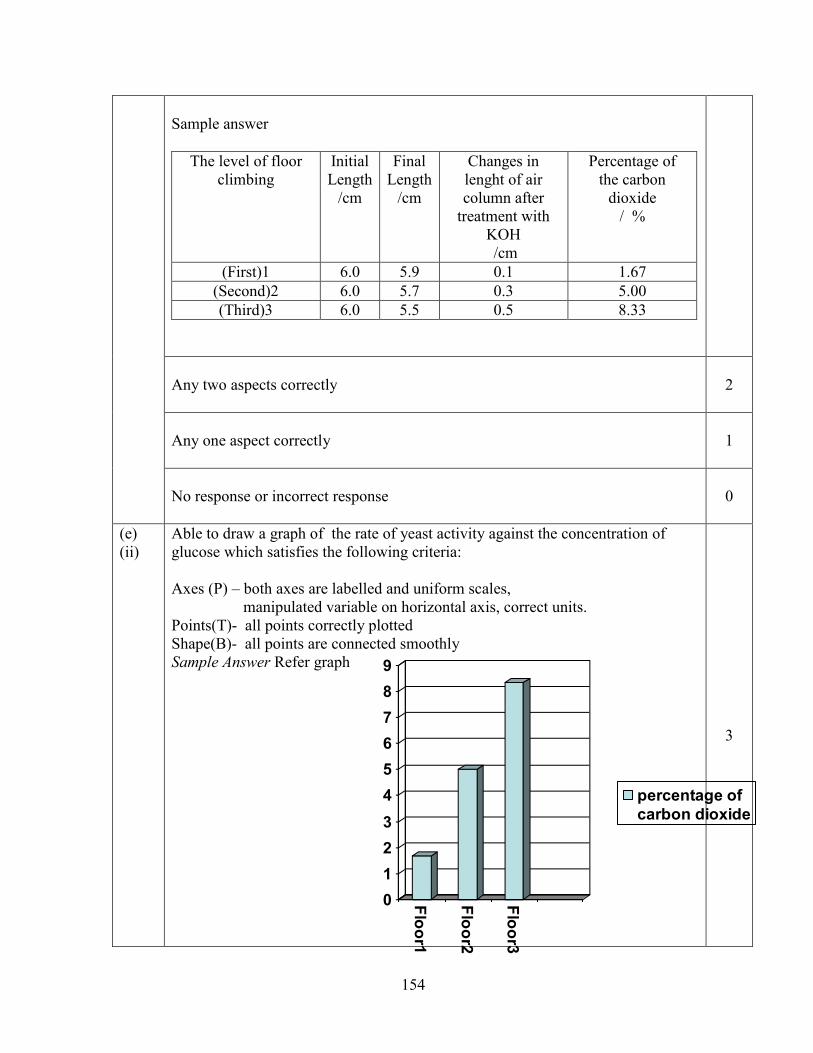
154
Sample answer
The level of floor climbing
Initial Length
/cm
Final Length
/cm
Changes in lenght of air column after
treatment with KOH /cm
Percentage of the carbon
dioxide / %
(First)1 6.0 5.9 0.1 1.67 (Second)2 6.0 5.7 0.3 5.00 (Third)3 6.0 5.5 0.5 8.33
Any two aspects correctly
2
Any one aspect correctly 1
No response or incorrect response
0
(e) (ii)
Able to draw a graph of the rate of yeast activity against the concentration of glucose which satisfies the following criteria: Axes (P) – both axes are labelled and uniform scales, manipulated variable on horizontal axis, correct units. Points(T)- all points correctly plotted Shape(B)- all points are connected smoothly Sample Answer Refer graph
3
0123456789
Floor1
Floor2
Floor3
percentage ofcarbon dioxide
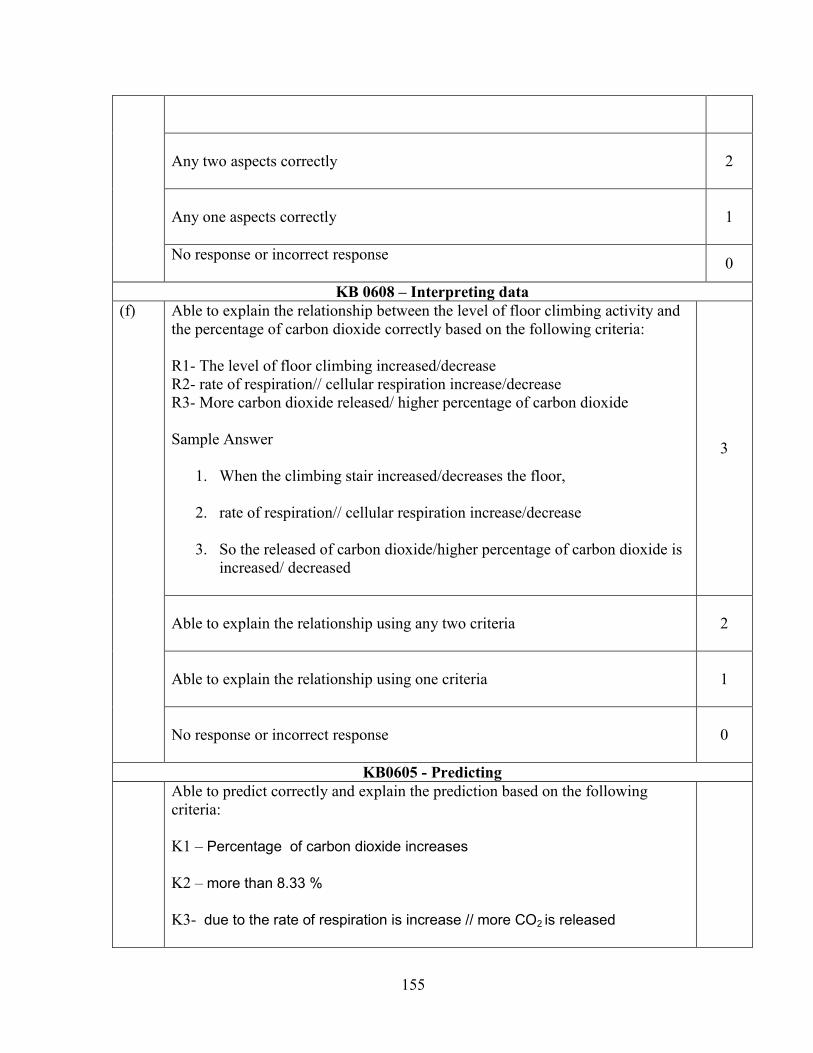
155
Any two aspects correctly
2
Any one aspects correctly
1
No response or incorrect response 0
KB 0608 – Interpreting data (f)
Able to explain the relationship between the level of floor climbing activity and the percentage of carbon dioxide correctly based on the following criteria: R1- The level of floor climbing increased/decrease R2- rate of respiration// cellular respiration increase/decrease R3- More carbon dioxide released/ higher percentage of carbon dioxide Sample Answer
1. When the climbing stair increased/decreases the floor,
2. rate of respiration// cellular respiration increase/decrease
3. So the released of carbon dioxide/higher percentage of carbon dioxide is increased/ decreased
3
Able to explain the relationship using any two criteria
2
Able to explain the relationship using one criteria
1
No response or incorrect response
0
KB0605 - Predicting
Able to predict correctly and explain the prediction based on the following criteria: K1 – Percentage of carbon dioxide increases K2 – more than 8.33 % K3- due to the rate of respiration is increase // more CO2 is released
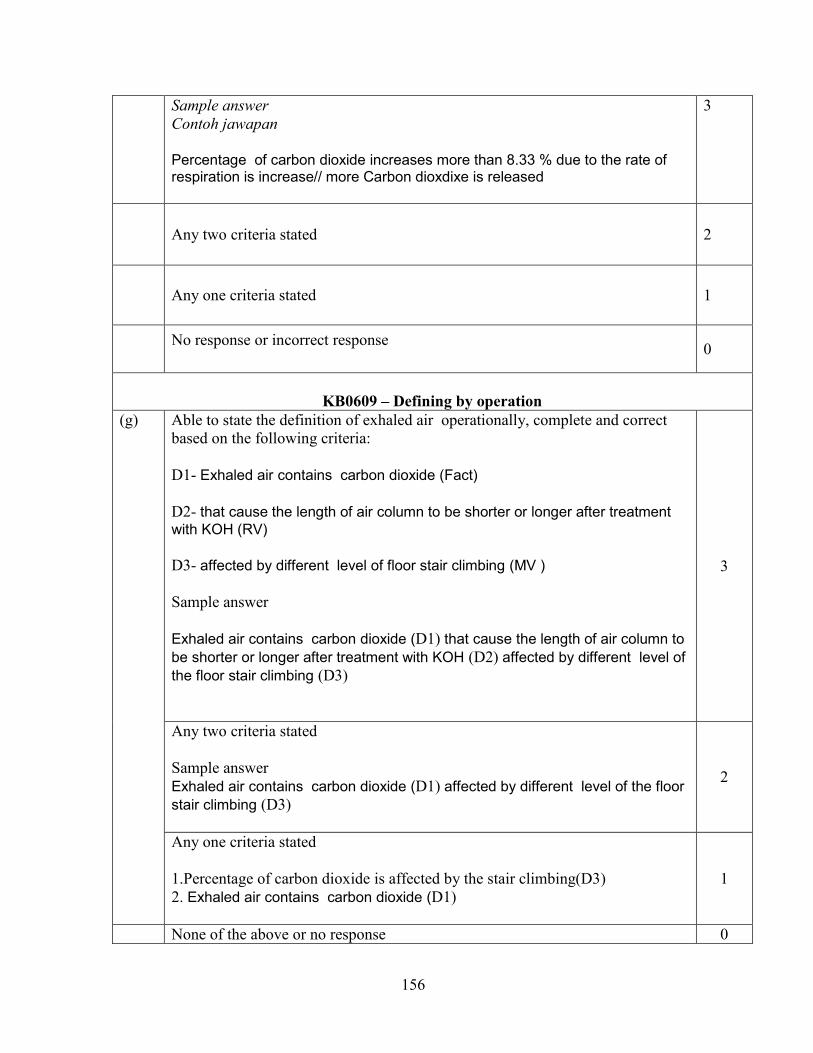
156
Sample answer Contoh jawapan Percentage of carbon dioxide increases more than 8.33 % due to the rate of respiration is increase// more Carbon dioxdixe is released
3
Any two criteria stated 2
Any one criteria stated 1
No response or incorrect response 0
KB0609 – Defining by operation
(g) Able to state the definition of exhaled air operationally, complete and correct based on the following criteria: D1- Exhaled air contains carbon dioxide (Fact) D2- that cause the length of air column to be shorter or longer after treatment with KOH (RV) D3- affected by different level of floor stair climbing (MV ) Sample answer Exhaled air contains carbon dioxide (D1) that cause the length of air column to be shorter or longer after treatment with KOH (D2) affected by different level of the floor stair climbing (D3)
3
Any two criteria stated Sample answer Exhaled air contains carbon dioxide (D1) affected by different level of the floor stair climbing (D3)
2
Any one criteria stated 1.Percentage of carbon dioxide is affected by the stair climbing(D3) 2. Exhaled air contains carbon dioxide (D1)
1
None of the above or no response 0
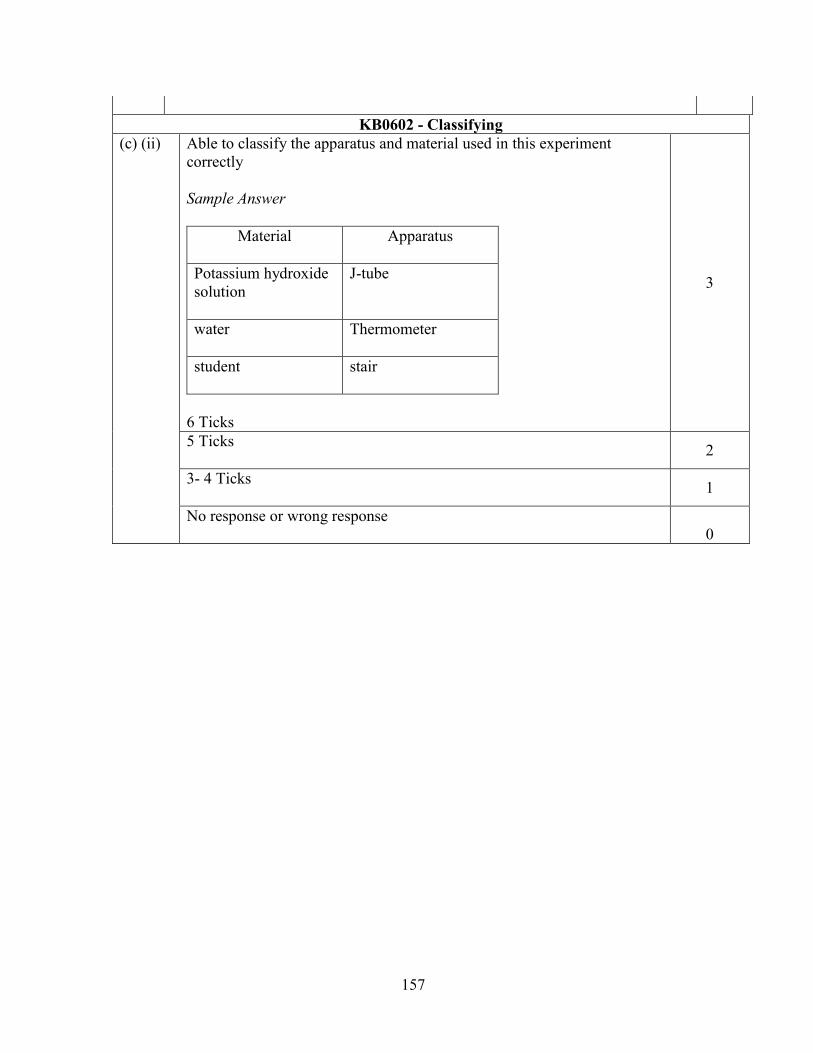
157
KB0602 - Classifying
(c) (ii) Able to classify the apparatus and material used in this experiment correctly Sample Answer
Material
Apparatus
Potassium hydroxide solution
J-tube
water
Thermometer
student
stair
6 Ticks
3
5 Ticks 2
3- 4 Ticks 1
No response or wrong response 0
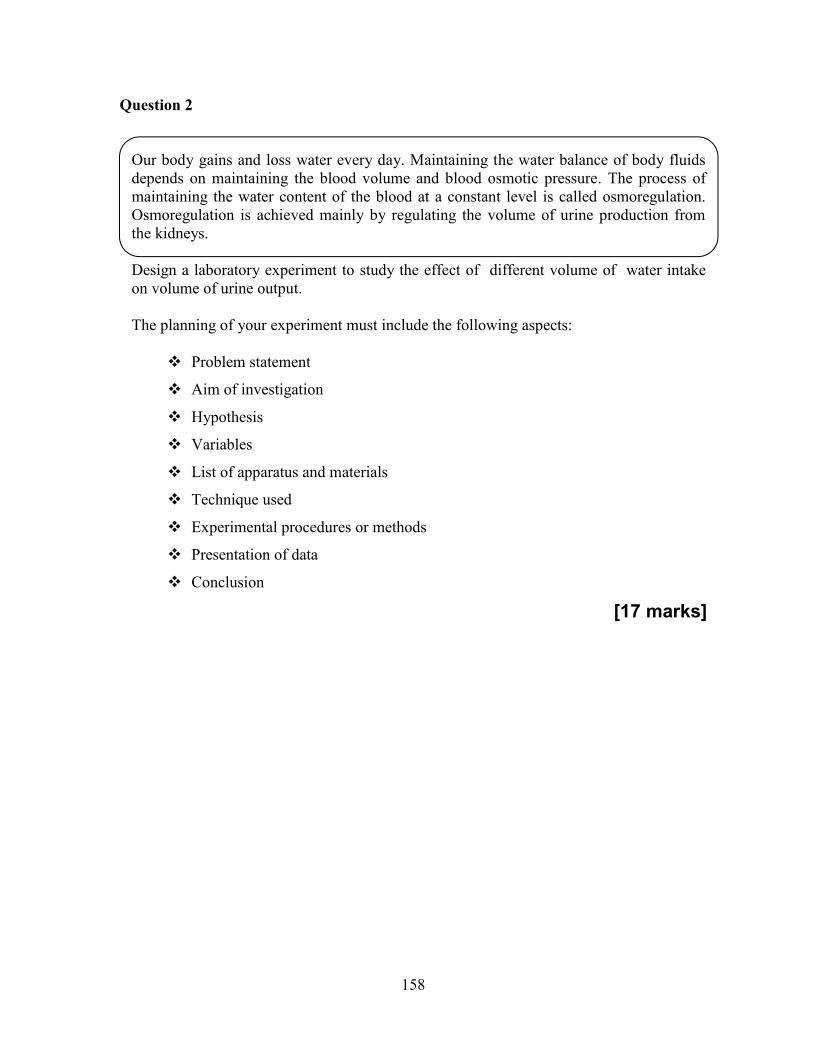
158
Question 2
Our body gains and loss water every day. Maintaining the water balance of body fluids depends on maintaining the blood volume and blood osmotic pressure. The process of maintaining the water content of the blood at a constant level is called osmoregulation. Osmoregulation is achieved mainly by regulating the volume of urine production from the kidneys. Design a laboratory experiment to study the effect of different volume of water intake on volume of urine output. The planning of your experiment must include the following aspects:
Problem statement
Aim of investigation
Hypothesis
Variables
List of apparatus and materials
Technique used
Experimental procedures or methods
Presentation of data
Conclusion
[17 marks]
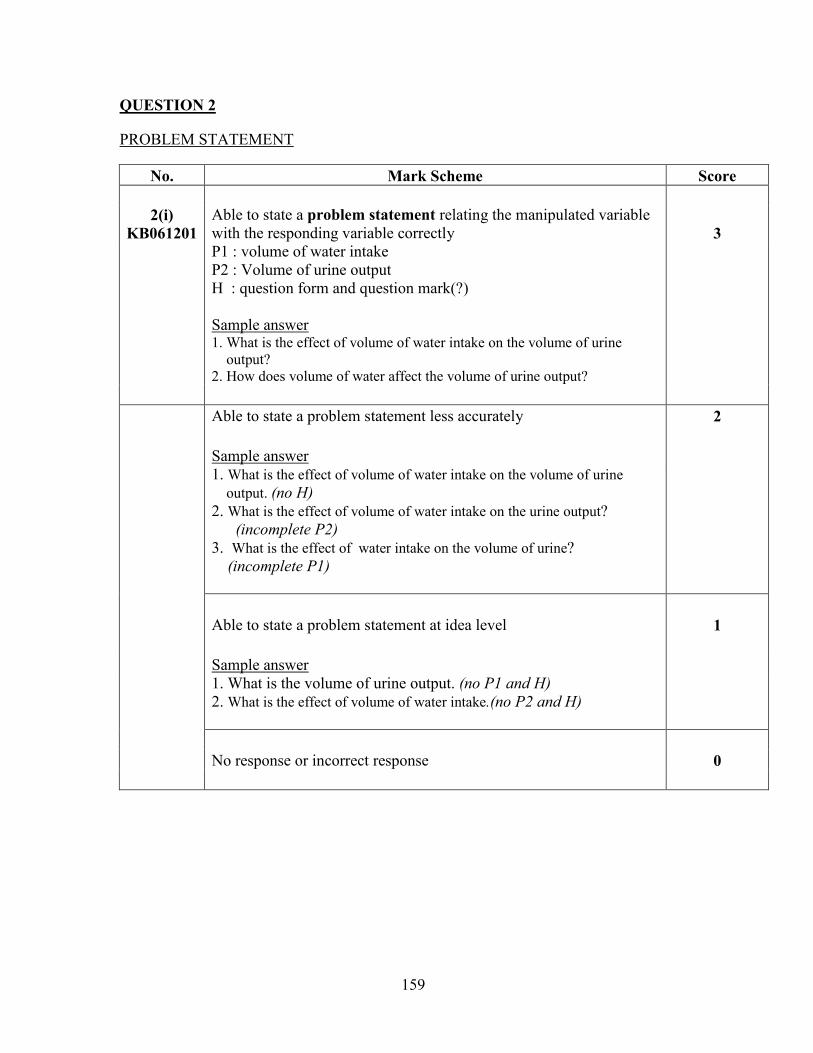
159
QUESTION 2
PROBLEM STATEMENT
No. Mark Scheme Score
2(i) KB061201
Able to state a problem statement relating the manipulated variable with the responding variable correctly 3
P1 : volume of water intake P2 : Volume of urine output H : question form and question mark(?) Sample answer 1. What is the effect of volume of water intake on the volume of urine output? 2. How does volume of water affect the volume of urine output?
Able to state a problem statement less accurately 2 Sample answer
1. What is the effect of volume of water intake on the volume of urine output. (no H) 2. What is the effect of volume of water intake on the urine output? (incomplete P2) 3. What is the effect of water intake on the volume of urine? (incomplete P1)
Able to state a problem statement at idea level 1 Sample answer
1. What is the volume of urine output. (no P1 and H) 2. What is the effect of volume of water intake.(no P2 and H)
No response or incorrect response 0
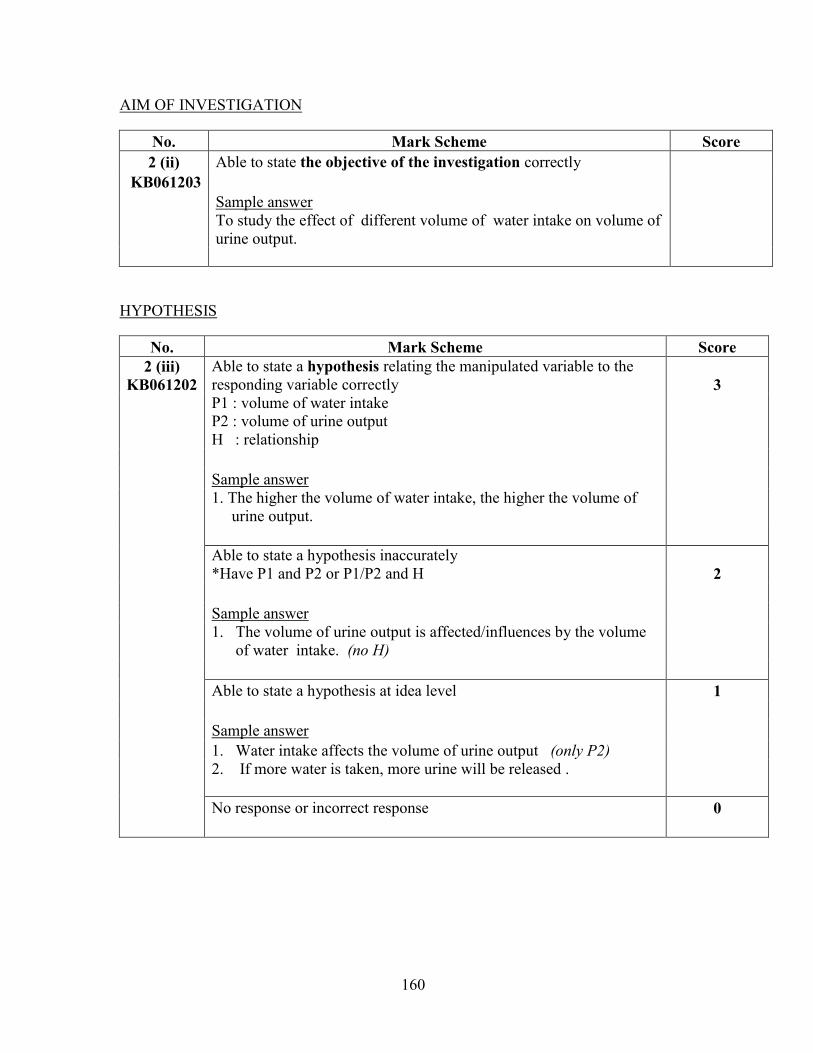
160
AIM OF INVESTIGATION
No. Mark Scheme Score 2 (ii) Able to state the objective of the investigation correctly
KB061203 Sample answer
To study the effect of different volume of water intake on volume of urine output.
HYPOTHESIS
No. Mark Scheme Score 2 (iii)
KB061202 Able to state a hypothesis relating the manipulated variable to the responding variable correctly 3
P1 : volume of water intake P2 : volume of urine output H : relationship
Sample answer
1. The higher the volume of water intake, the higher the volume of urine output.
Able to state a hypothesis inaccurately *Have P1 and P2 or P1/P2 and H 2
Sample answer
1. The volume of urine output is affected/influences by the volume of water intake. (no H)
Able to state a hypothesis at idea level 1 Sample answer 1. Water intake affects the volume of urine output (only P2)
2. If more water is taken, more urine will be released .
No response or incorrect response 0
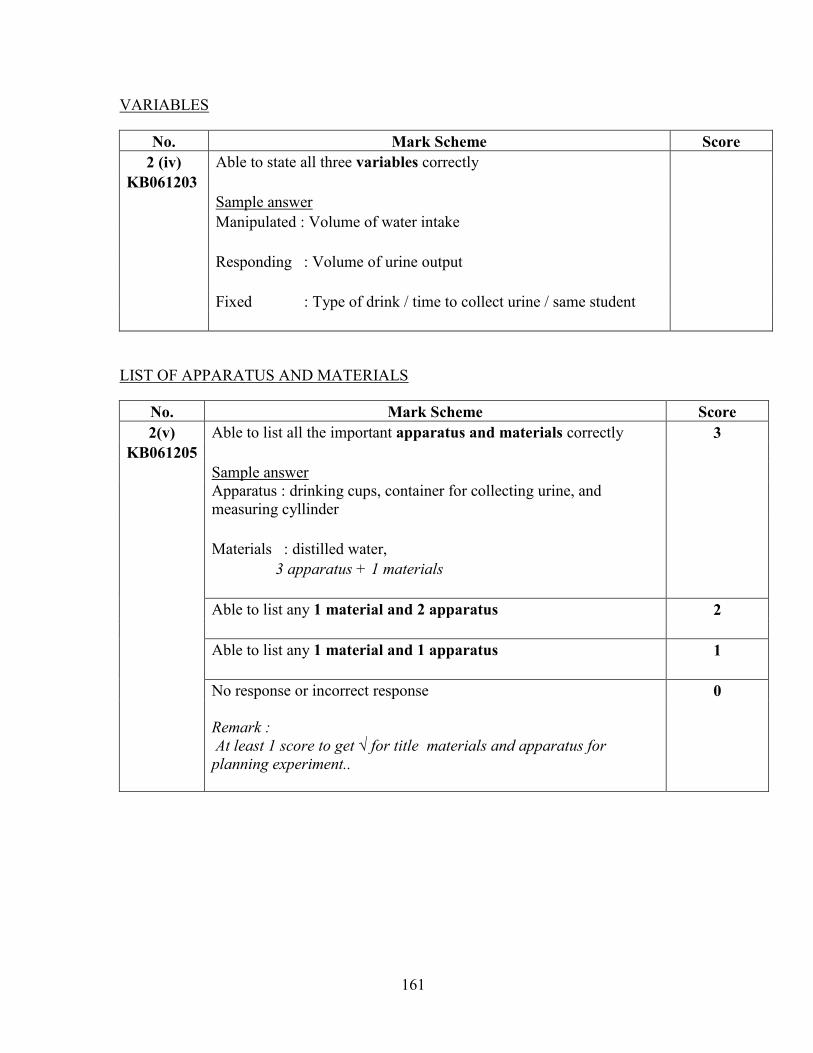
161
VARIABLES
No. Mark Scheme Score 2 (iv) Able to state all three variables correctly
KB061203 Sample answer Manipulated : Volume of water intake Responding : Volume of urine output Fixed : Type of drink / time to collect urine / same student
LIST OF APPARATUS AND MATERIALS
No. Mark Scheme Score 2(v) Able to list all the important apparatus and materials correctly 3
KB061205 Sample answer
Apparatus : drinking cups, container for collecting urine, and measuring cyllinder
Materials : distilled water, 3 apparatus + 1 materials Able to list any 1 material and 2 apparatus 2 Able to list any 1 material and 1 apparatus 1 No response or incorrect response 0
Remark : At least 1 score to get √ for title materials and apparatus for planning experiment..
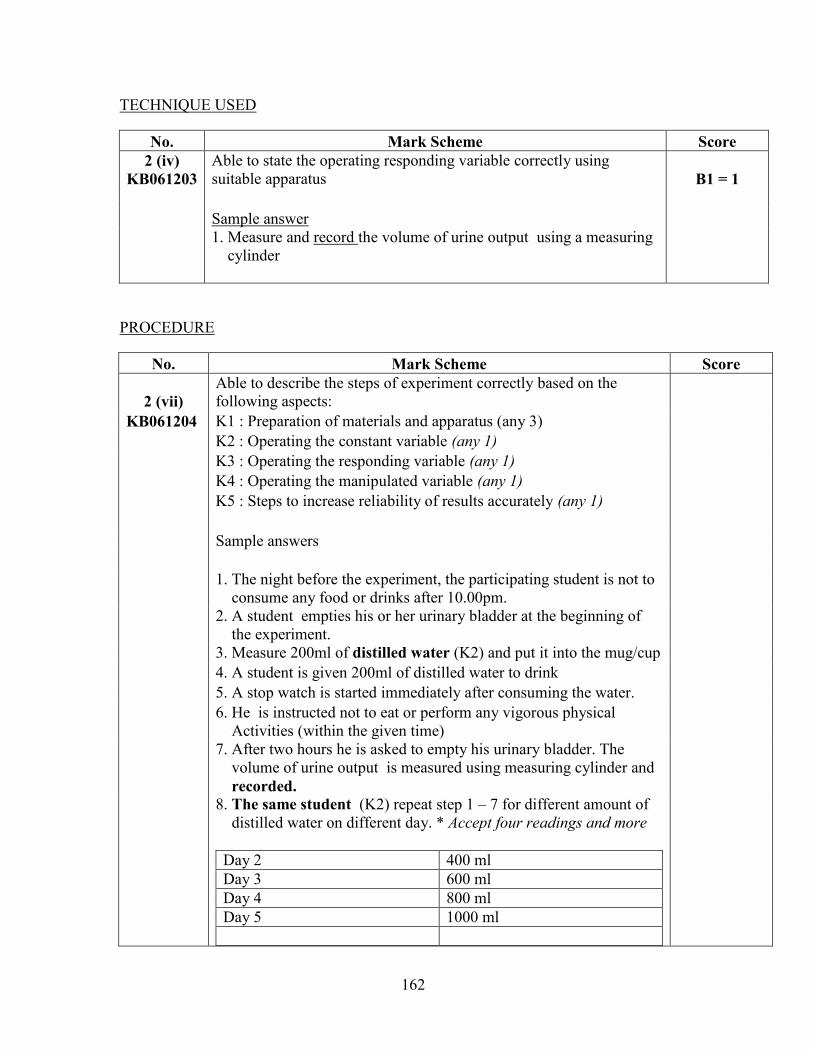
162
TECHNIQUE USED
No. Mark Scheme Score 2 (iv)
KB061203 Able to state the operating responding variable correctly using suitable apparatus B1 = 1
Sample answer
1. Measure and record the volume of urine output using a measuring cylinder
PROCEDURE
No. Mark Scheme Score
2 (vii) Able to describe the steps of experiment correctly based on the following aspects:
KB061204 K1 : Preparation of materials and apparatus (any 3) K2 : Operating the constant variable (any 1) K3 : Operating the responding variable (any 1) K4 : Operating the manipulated variable (any 1) K5 : Steps to increase reliability of results accurately (any 1) Sample answers
1. The night before the experiment, the participating student is not to consume any food or drinks after 10.00pm.
2. A student empties his or her urinary bladder at the beginning of the experiment.
3. Measure 200ml of distilled water (K2) and put it into the mug/cup 4. A student is given 200ml of distilled water to drink 5. A stop watch is started immediately after consuming the water.
6. He is instructed not to eat or perform any vigorous physical Activities (within the given time)
7. After two hours he is asked to empty his urinary bladder. The volume of urine output is measured using measuring cylinder and recorded.
8. The same student (K2) repeat step 1 – 7 for different amount of distilled water on different day. * Accept four readings and more Day 2 400 ml Day 3 600 ml Day 4 800 ml Day 5 1000 ml
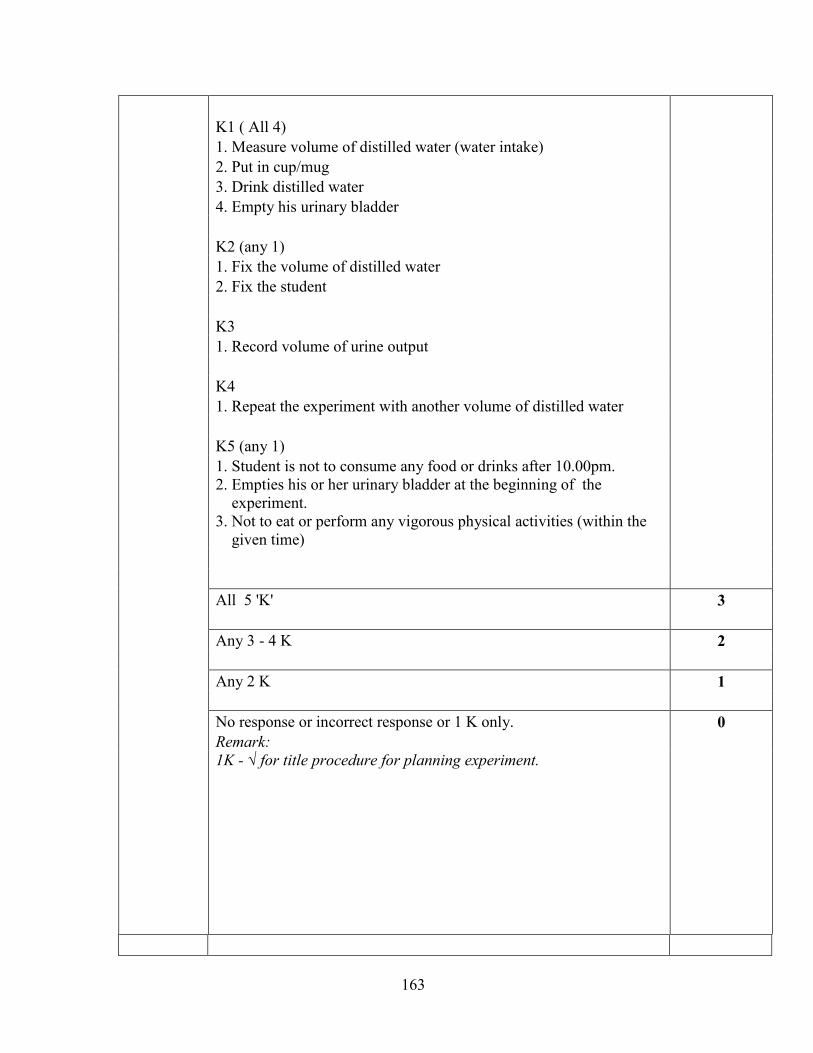
163
K1 ( All 4) 1. Measure volume of distilled water (water intake) 2. Put in cup/mug 3. Drink distilled water 4. Empty his urinary bladder K2 (any 1) 1. Fix the volume of distilled water 2. Fix the student K3 1. Record volume of urine output K4 1. Repeat the experiment with another volume of distilled water K5 (any 1) 1. Student is not to consume any food or drinks after 10.00pm.
2. Empties his or her urinary bladder at the beginning of the experiment.
3. Not to eat or perform any vigorous physical activities (within the given time)
All 5 'K' 3 Any 3 - 4 K 2 Any 2 K 1 No response or incorrect response or 1 K only. 0 Remark:
1K - √ for title procedure for planning experiment.
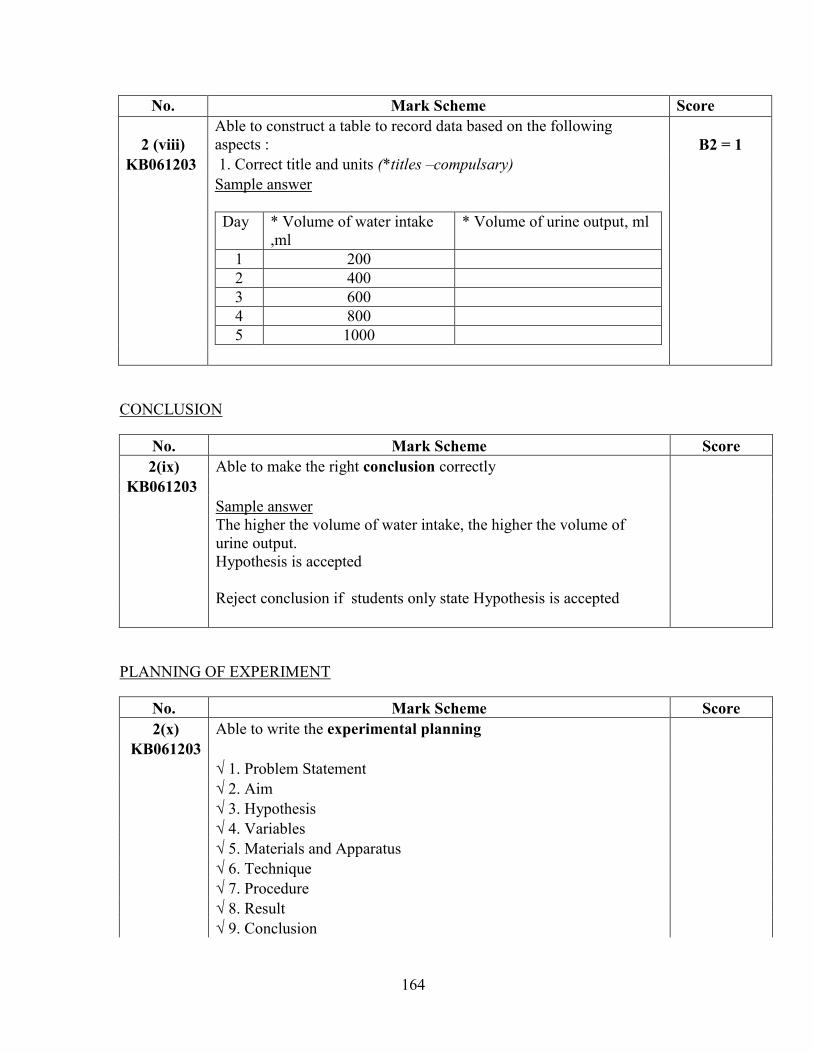
164
No. Mark Scheme Score
2 (viii) Able to construct a table to record data based on the following aspects : B2 = 1
KB061203 1. Correct title and units (*titles –compulsary) Sample answer
Day * Volume of water intake
,ml * Volume of urine output, ml
1 200 2 400 3 600 4 800 5 1000
CONCLUSION
No. Mark Scheme Score 2(ix) Able to make the right conclusion correctly
KB061203 Sample answer
The higher the volume of water intake, the higher the volume of urine output. Hypothesis is accepted Reject conclusion if students only state Hypothesis is accepted
PLANNING OF EXPERIMENT
No. Mark Scheme Score 2(x) Able to write the experimental planning
KB061203 √ 1. Problem Statement √ 2. Aim √ 3. Hypothesis √ 4. Variables √ 5. Materials and Apparatus √ 6. Technique √ 7. Procedure √ 8. Result √ 9. Conclusion
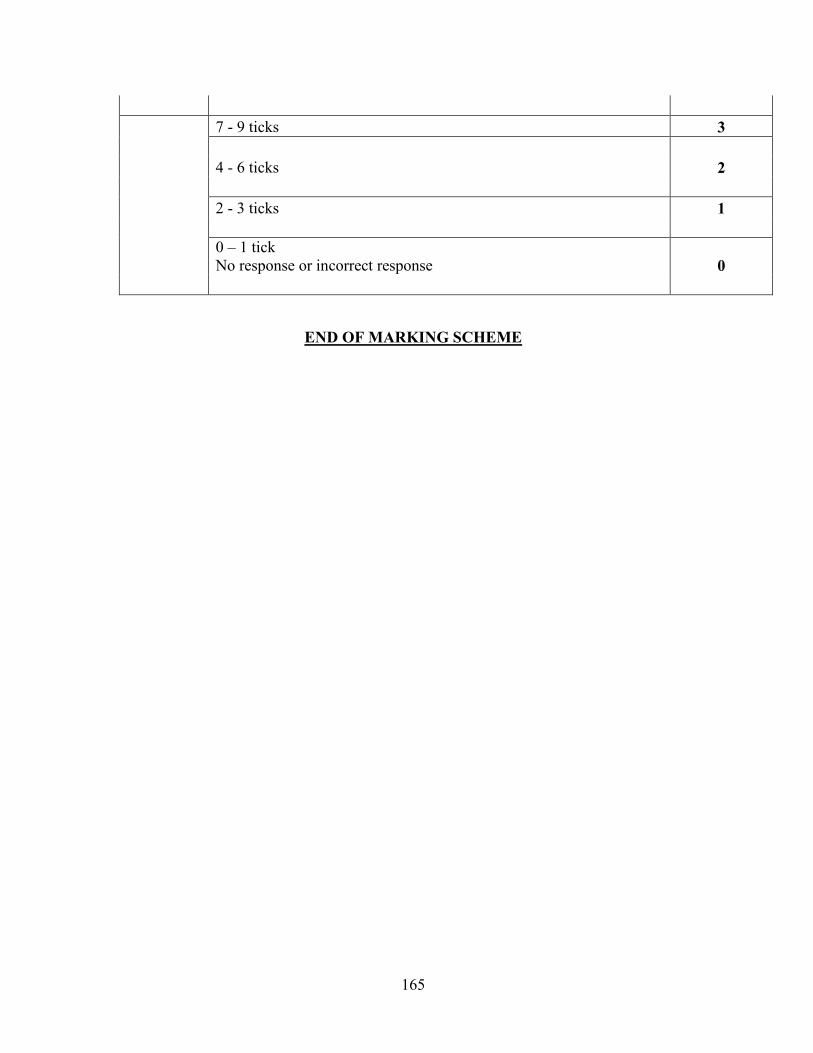
165
7 - 9 ticks 3 4 - 6 ticks 2 2 - 3 ticks 1
0 – 1 tick No response or incorrect response 0
END OF MARKING SCHEME
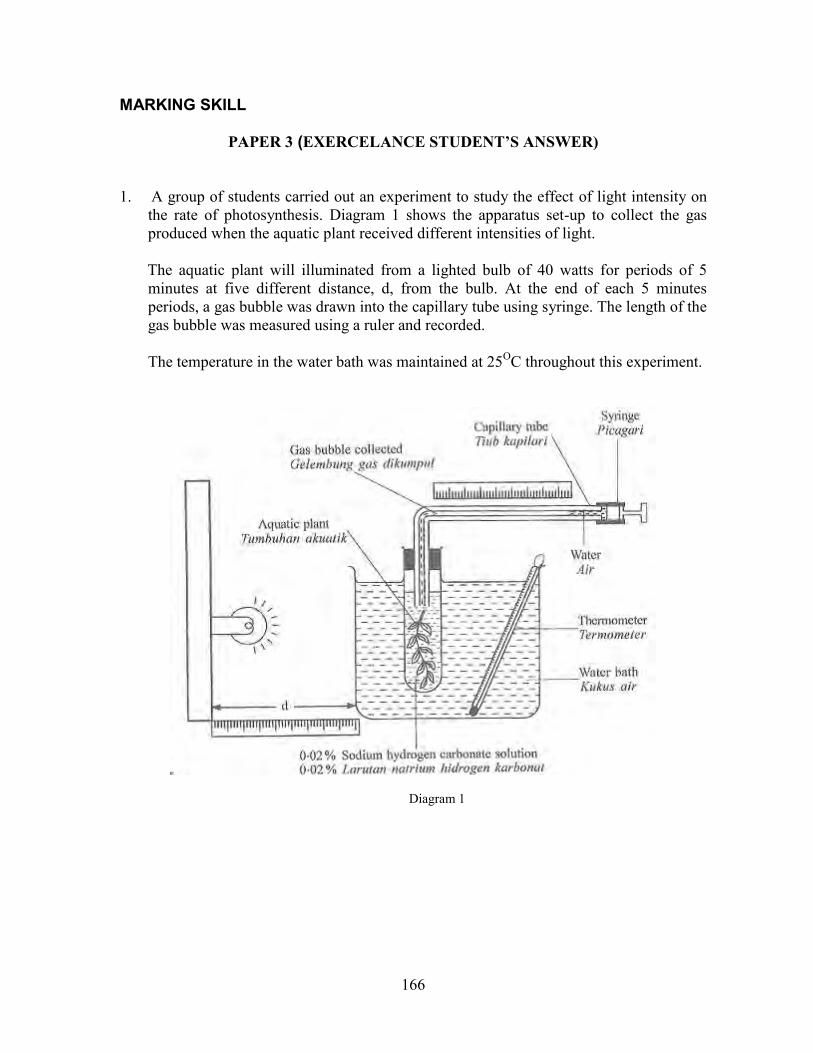
166
MARKING SKILL
PAPER 3 (EXERCELANCE STUDENT’S ANSWER)
1. A group of students carried out an experiment to study the effect of light intensity on
the rate of photosynthesis. Diagram 1 shows the apparatus set-up to collect the gas produced when the aquatic plant received different intensities of light.
The aquatic plant will illuminated from a lighted bulb of 40 watts for periods of 5
minutes at five different distance, d, from the bulb. At the end of each 5 minutes periods, a gas bubble was drawn into the capillary tube using syringe. The length of the gas bubble was measured using a ruler and recorded.
The temperature in the water bath was maintained at 25OC throughout this experiment.
Diagram 1
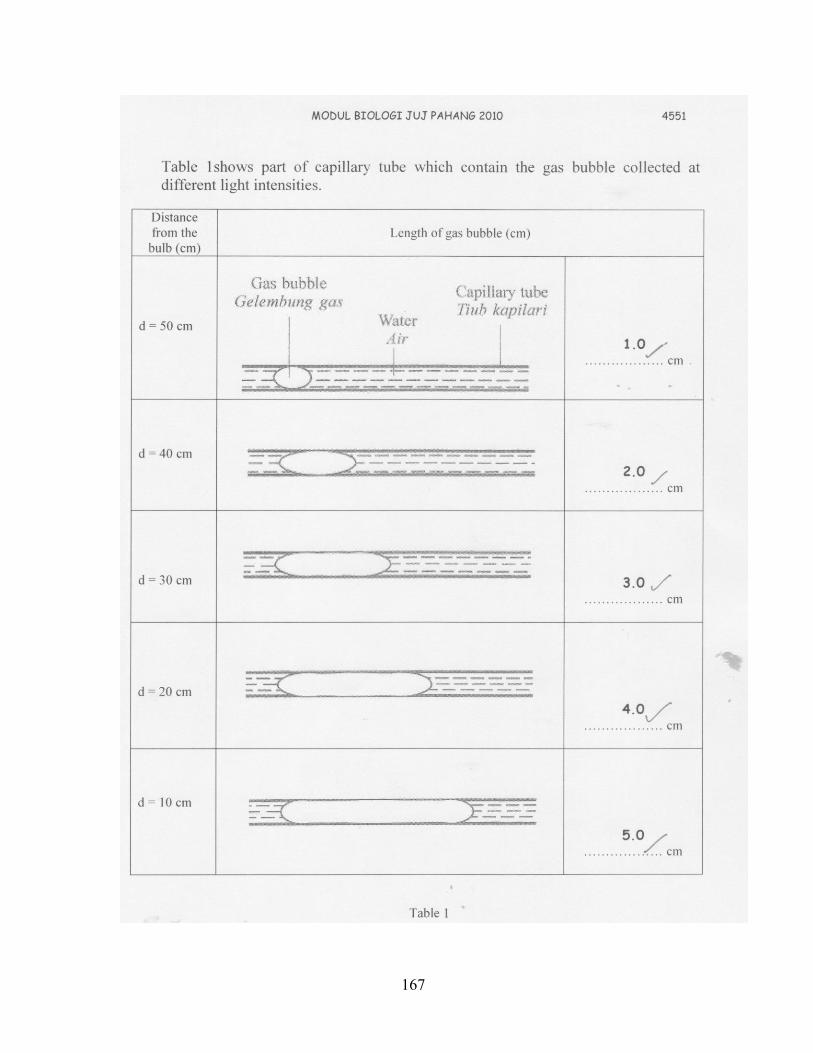
167
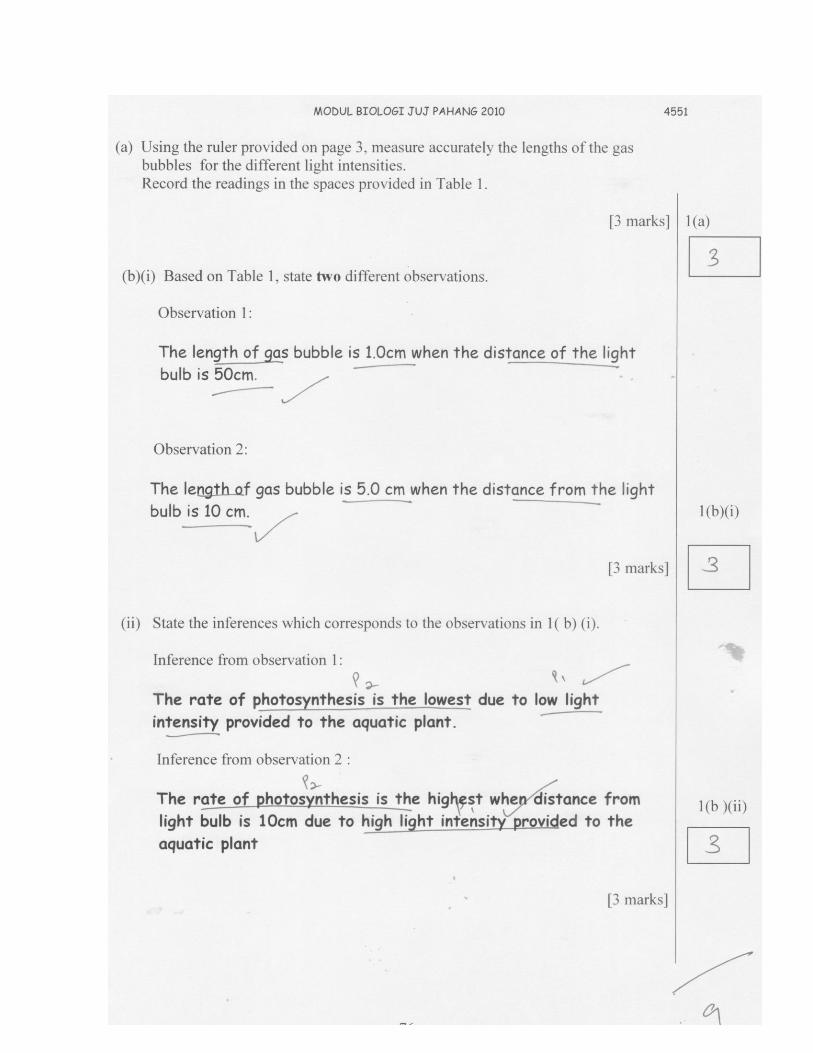
168
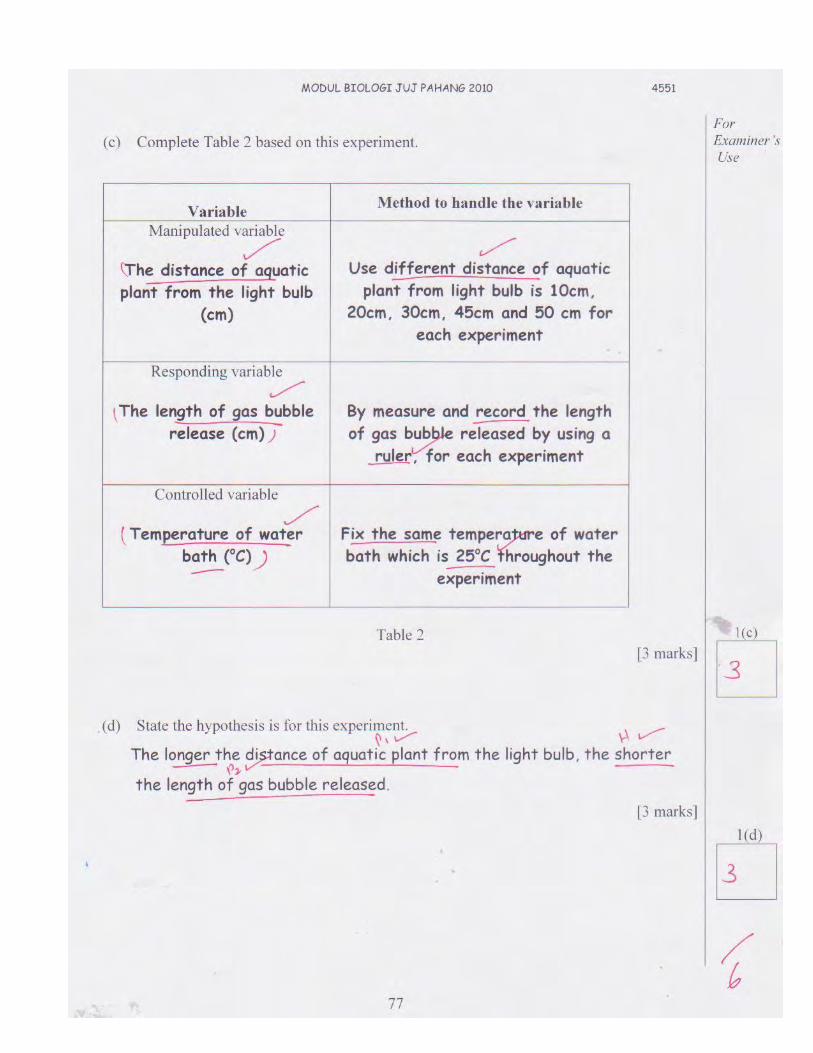
169
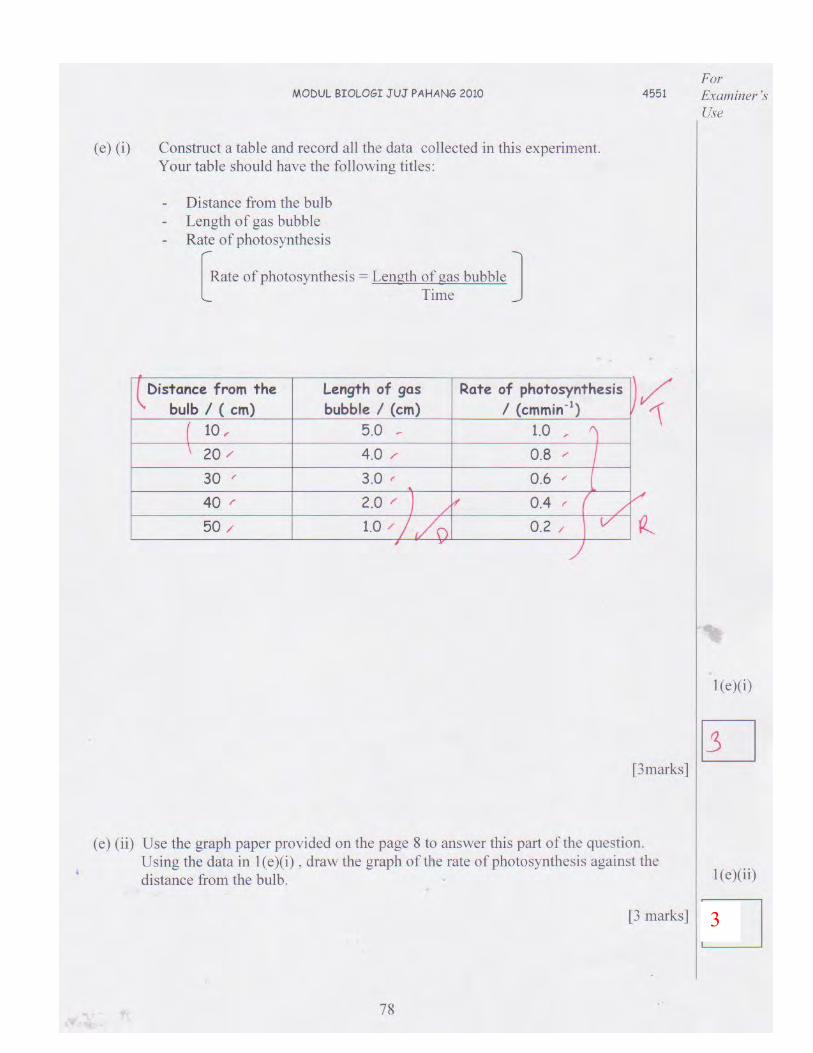
170
3
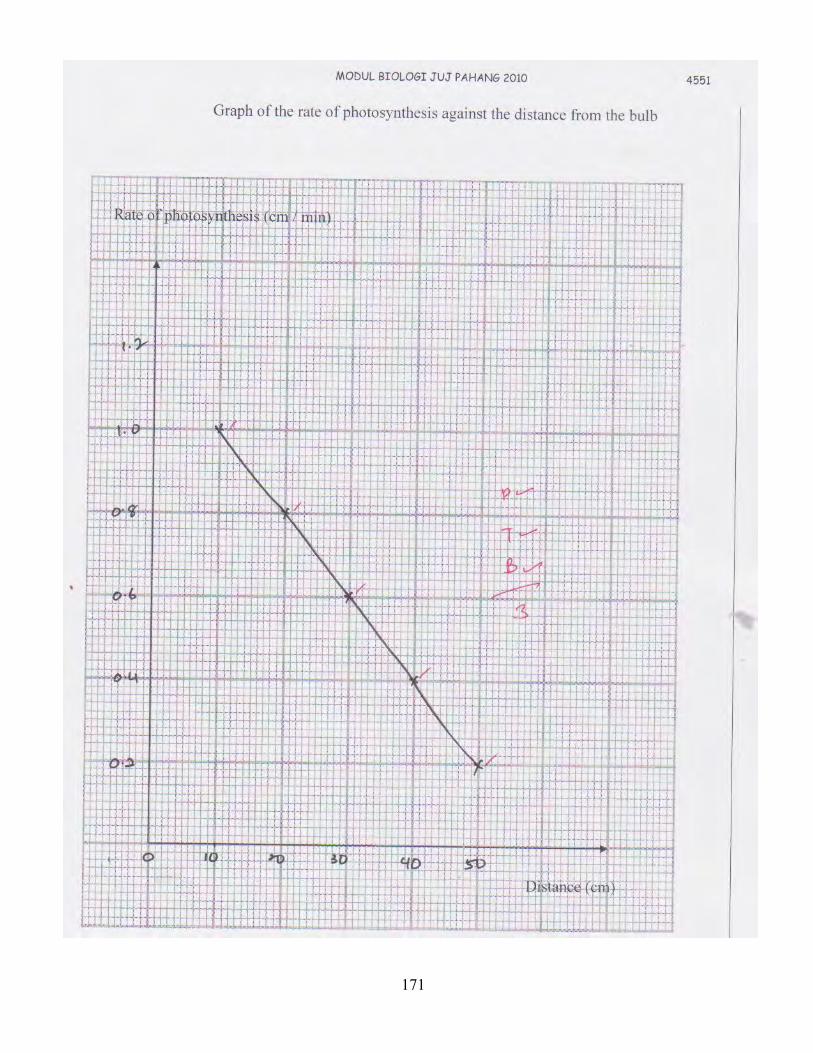
171
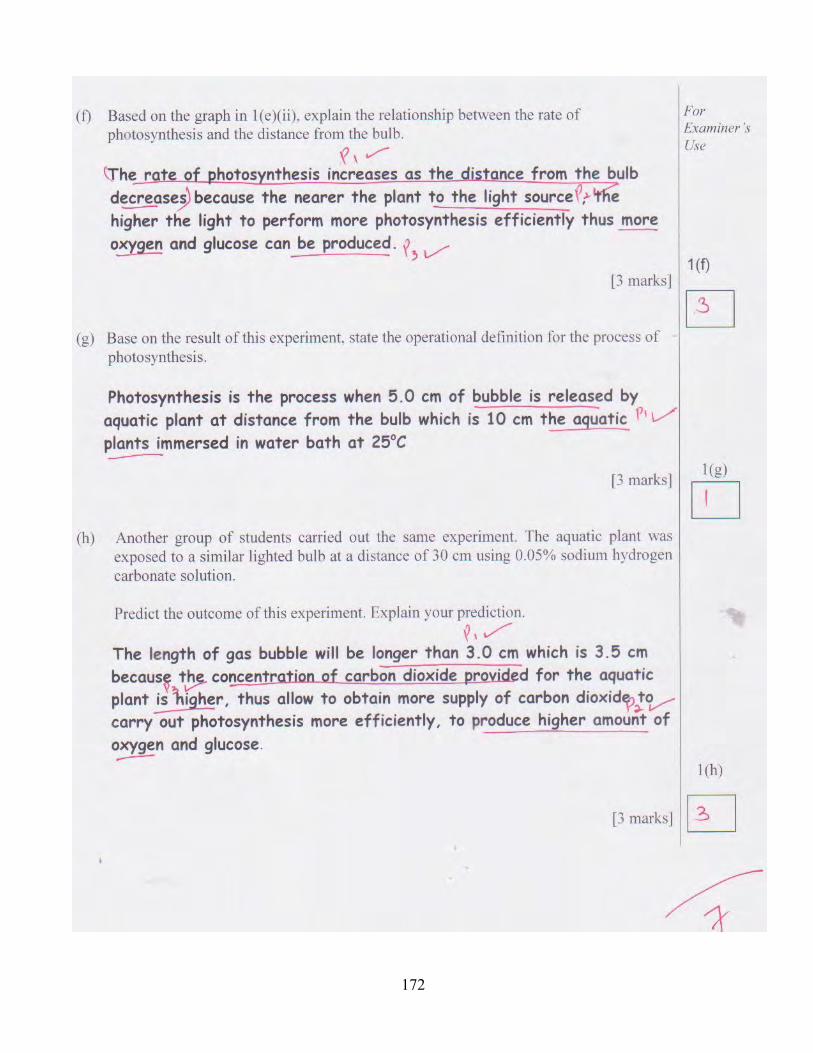
172
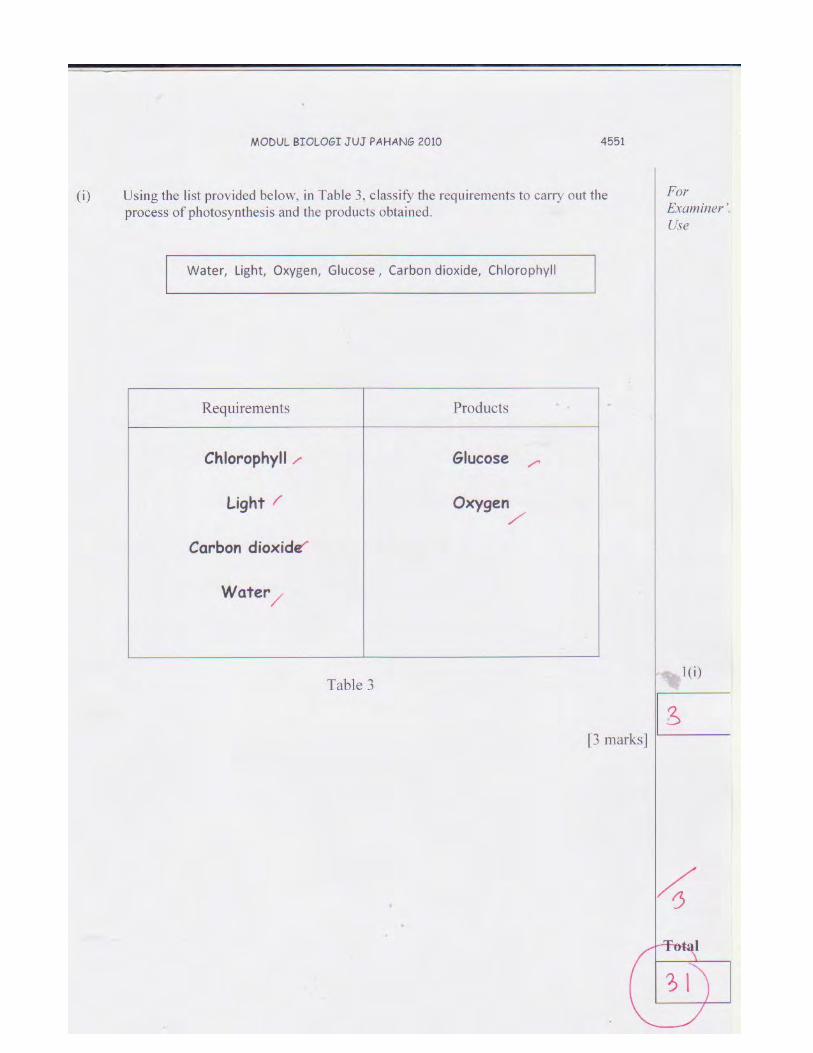
173
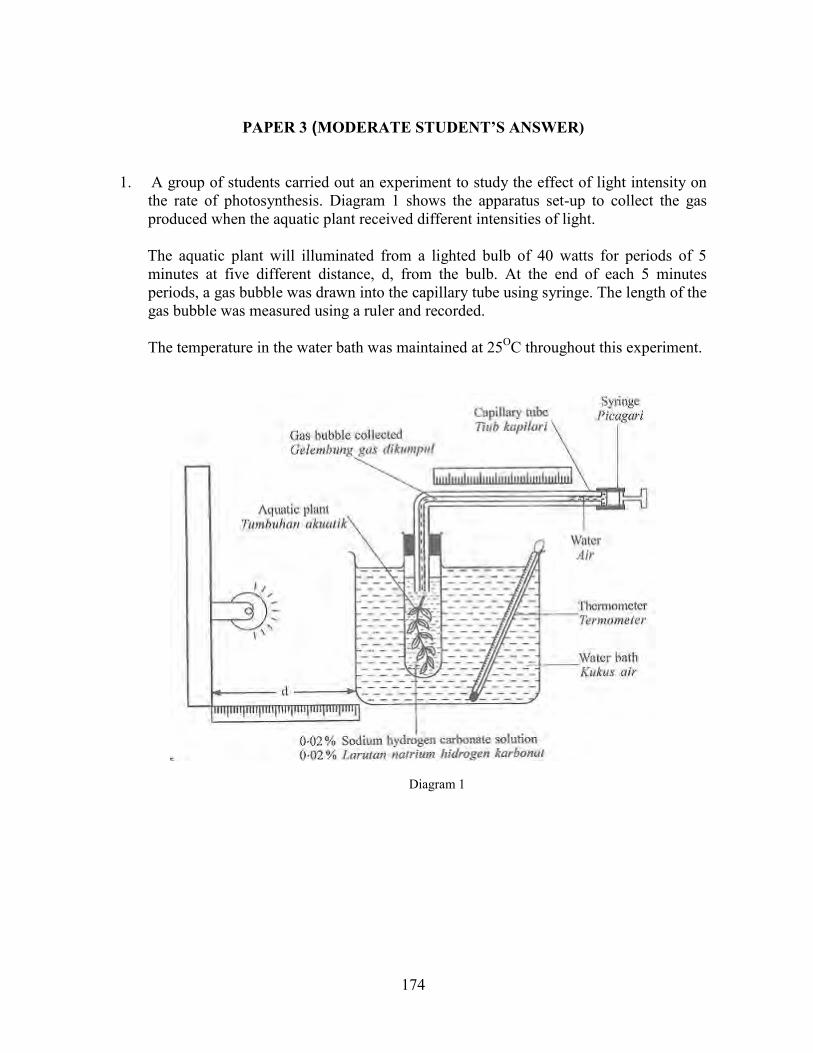
174
PAPER 3 (MODERATE STUDENT’S ANSWER)
1. A group of students carried out an experiment to study the effect of light intensity on
the rate of photosynthesis. Diagram 1 shows the apparatus set-up to collect the gas produced when the aquatic plant received different intensities of light.
The aquatic plant will illuminated from a lighted bulb of 40 watts for periods of 5
minutes at five different distance, d, from the bulb. At the end of each 5 minutes periods, a gas bubble was drawn into the capillary tube using syringe. The length of the gas bubble was measured using a ruler and recorded.
The temperature in the water bath was maintained at 25OC throughout this experiment.
Diagram 1
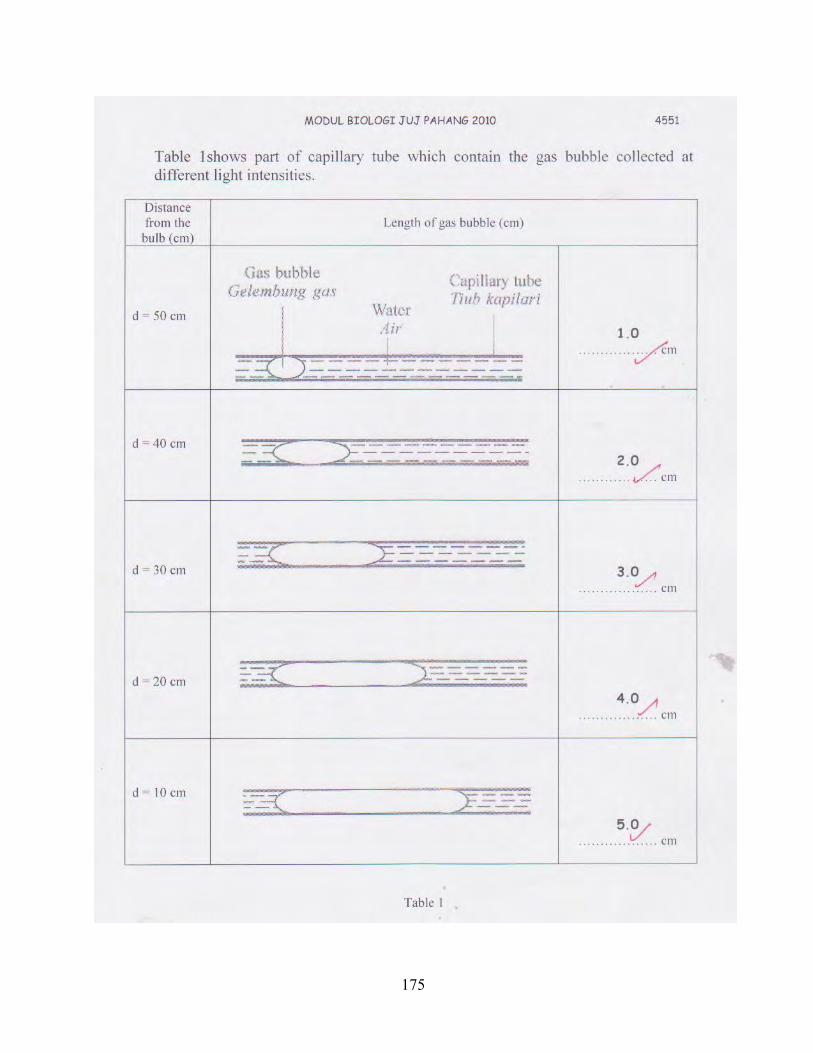
175
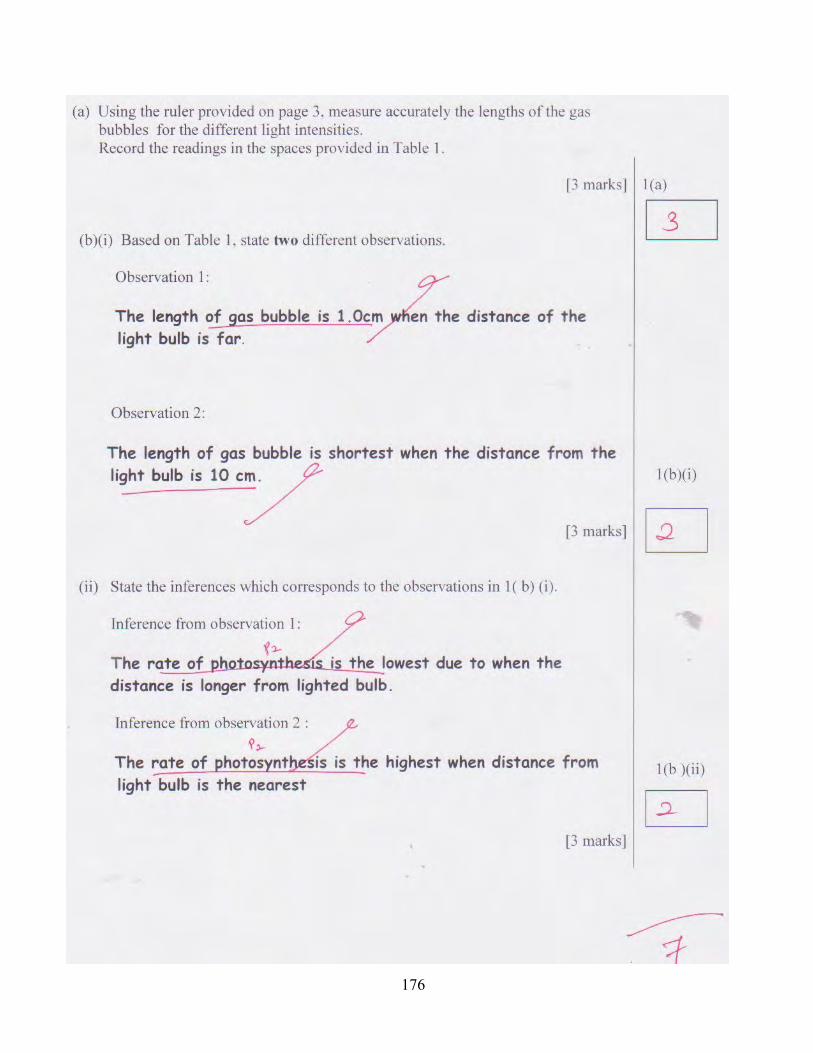
176
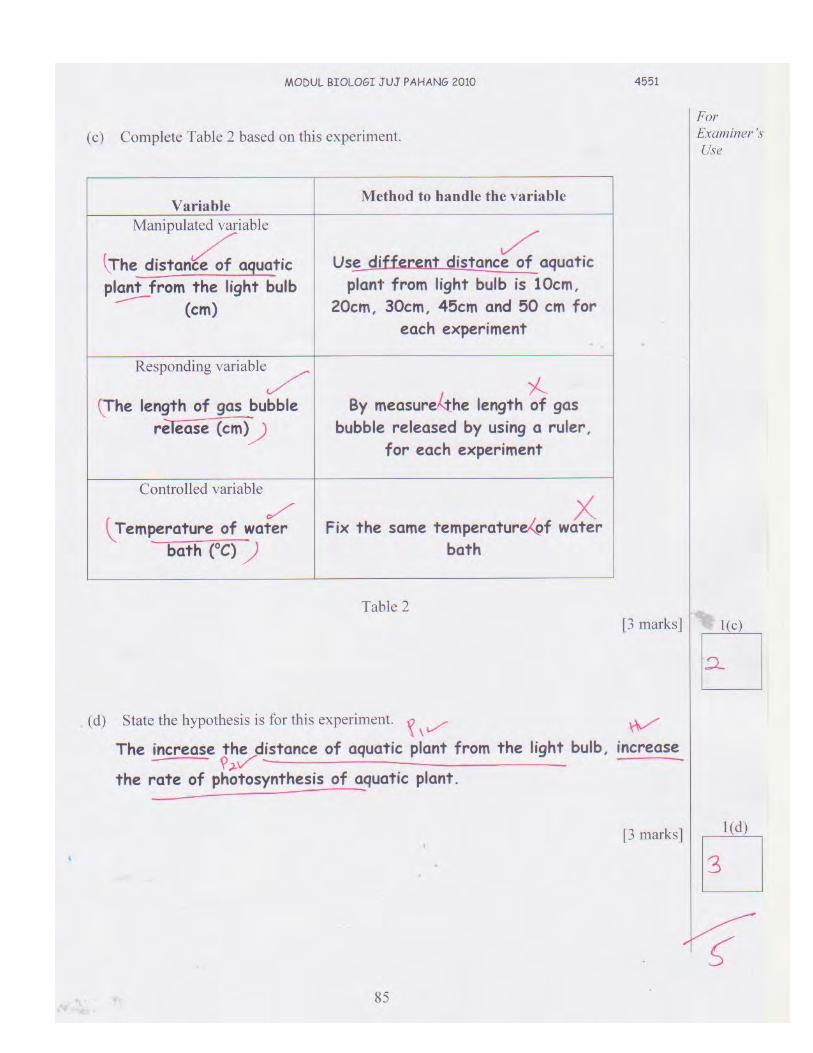
177
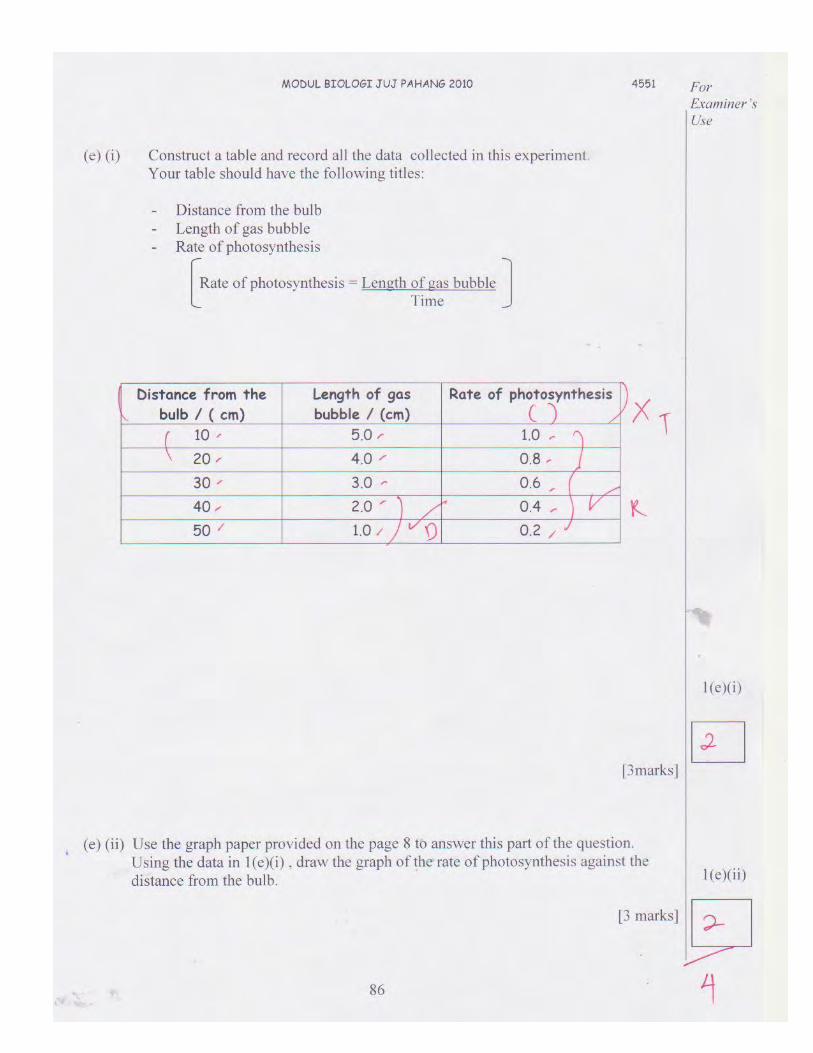
178
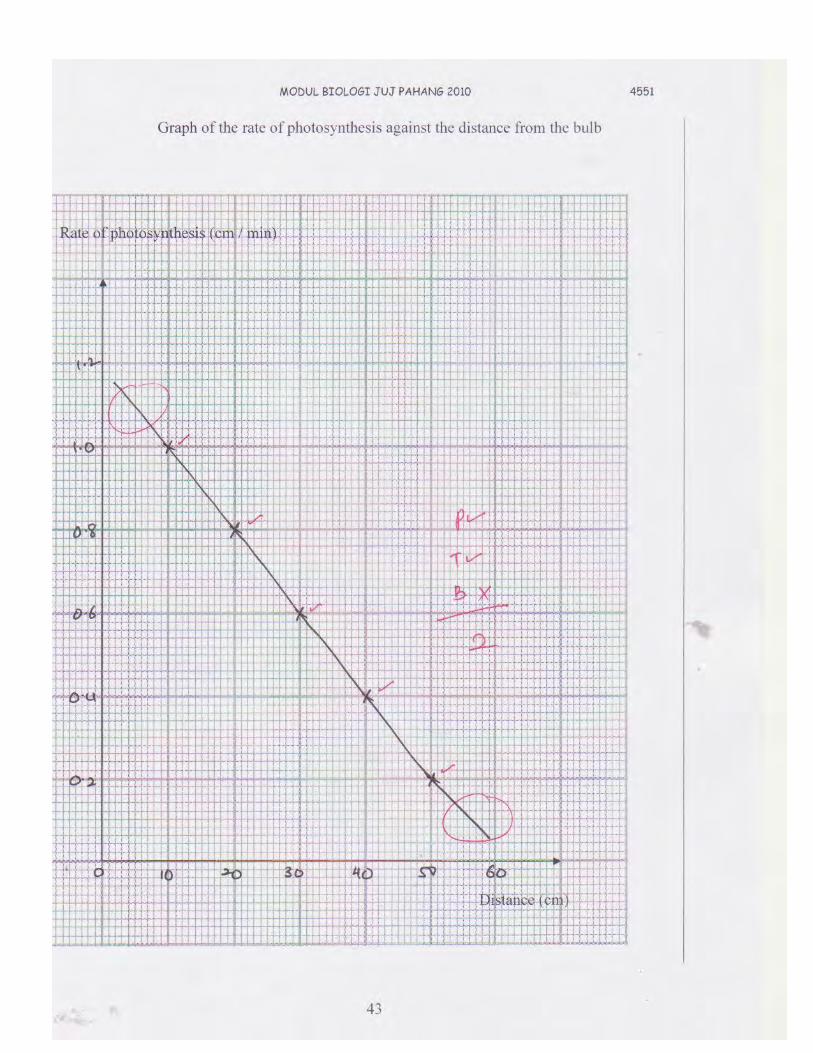
179
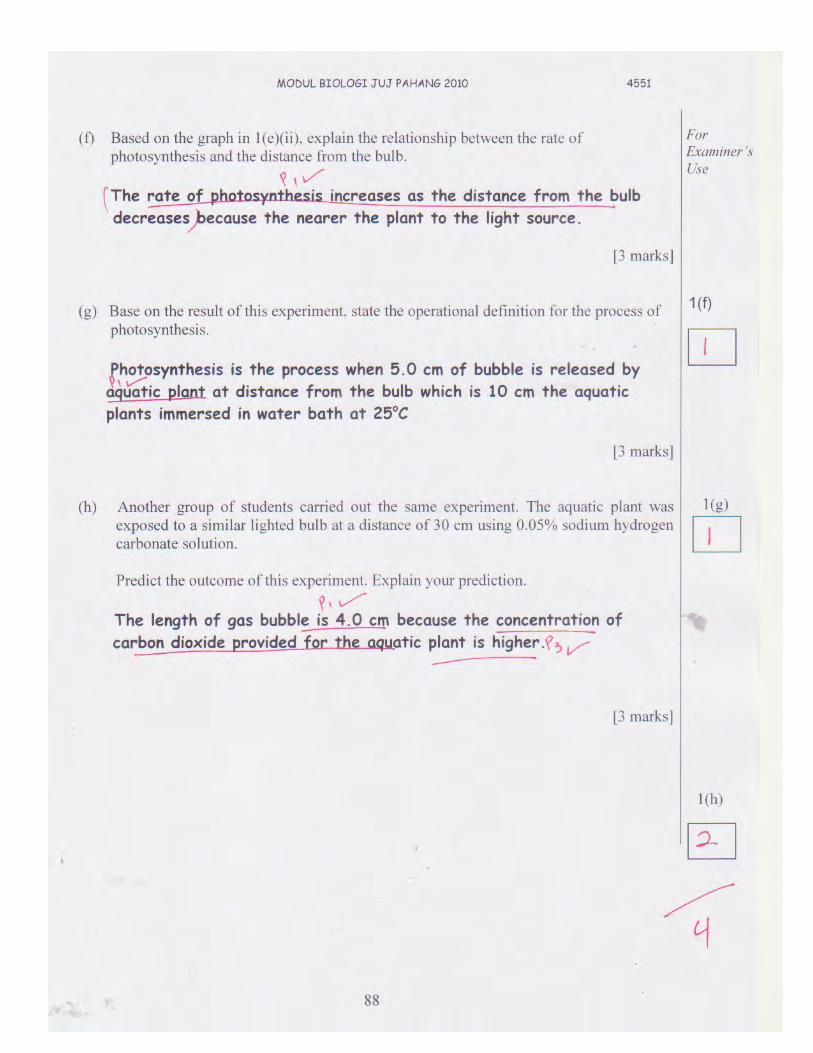
180
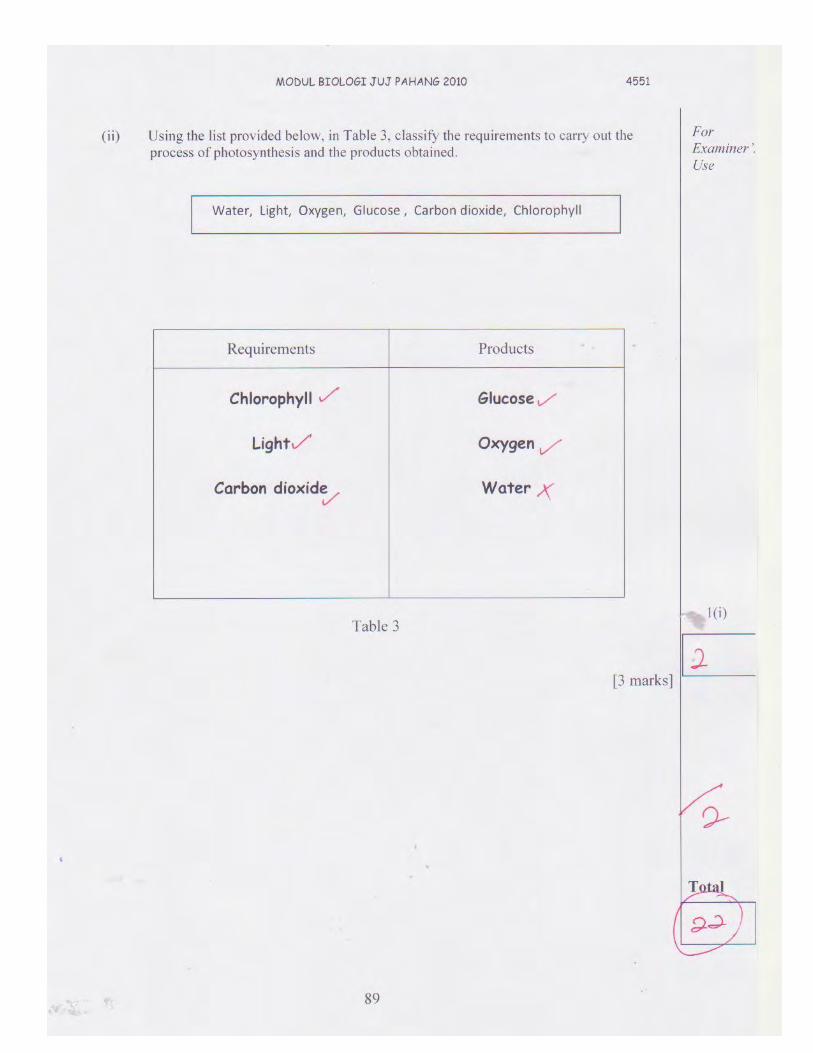
181
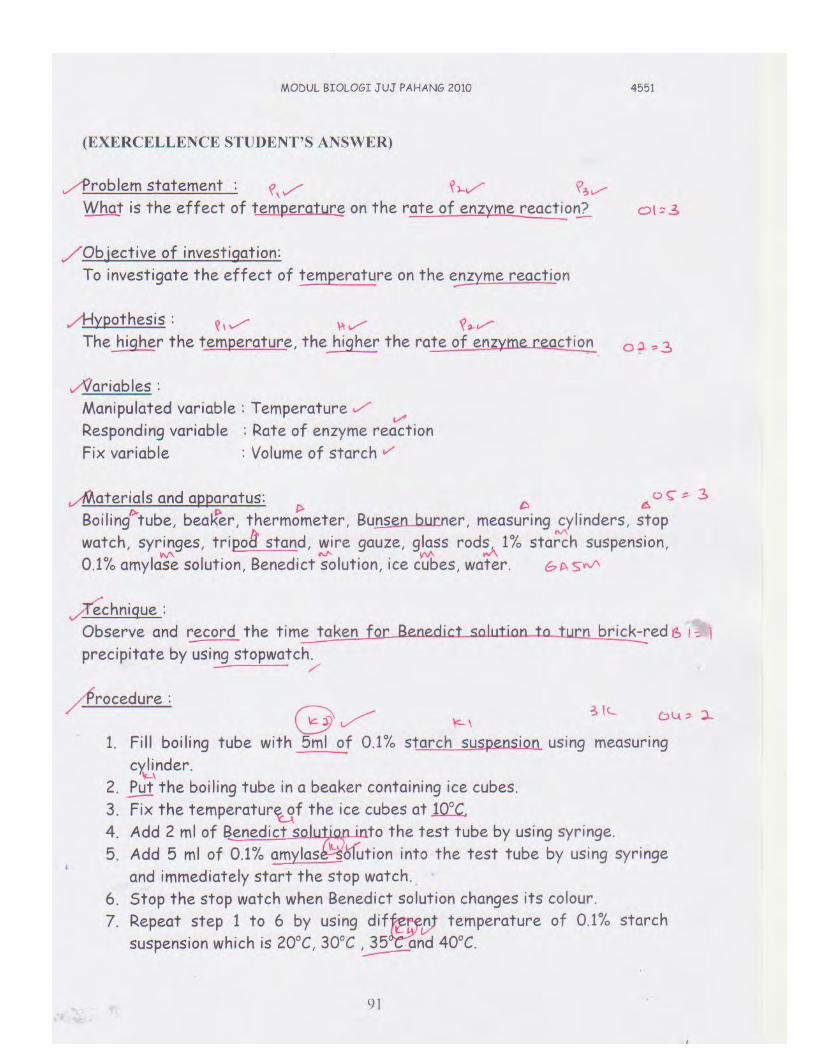
182
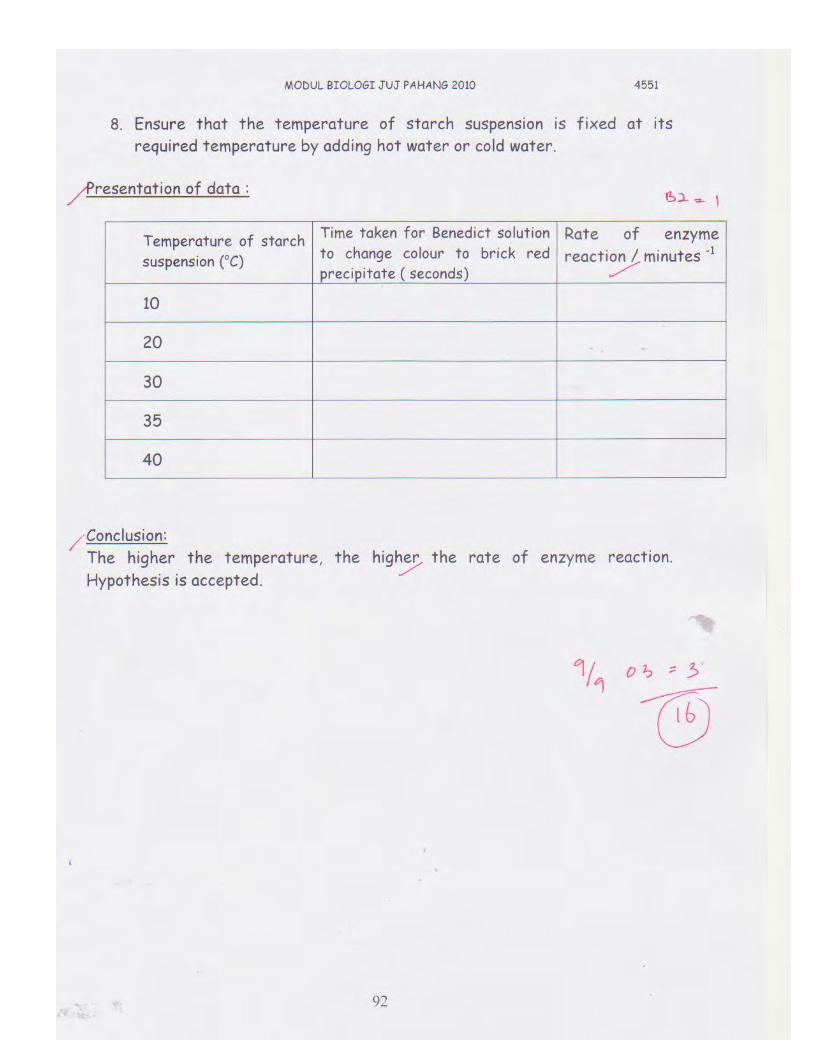
183
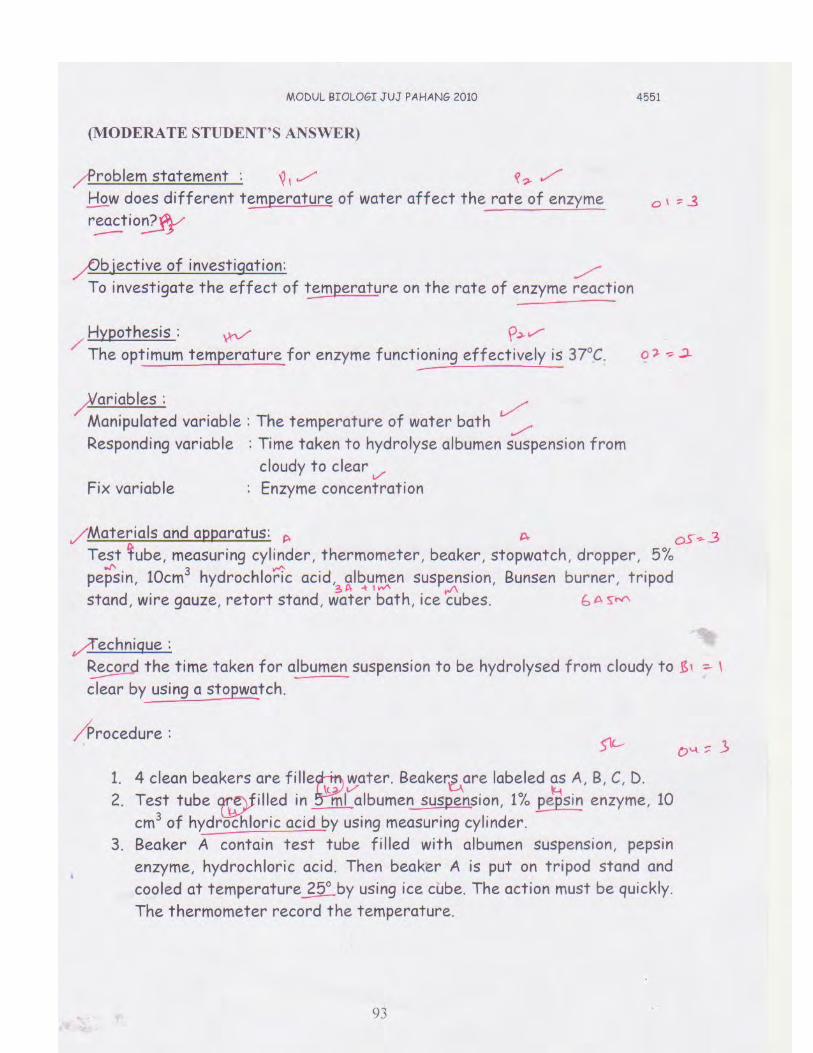
184
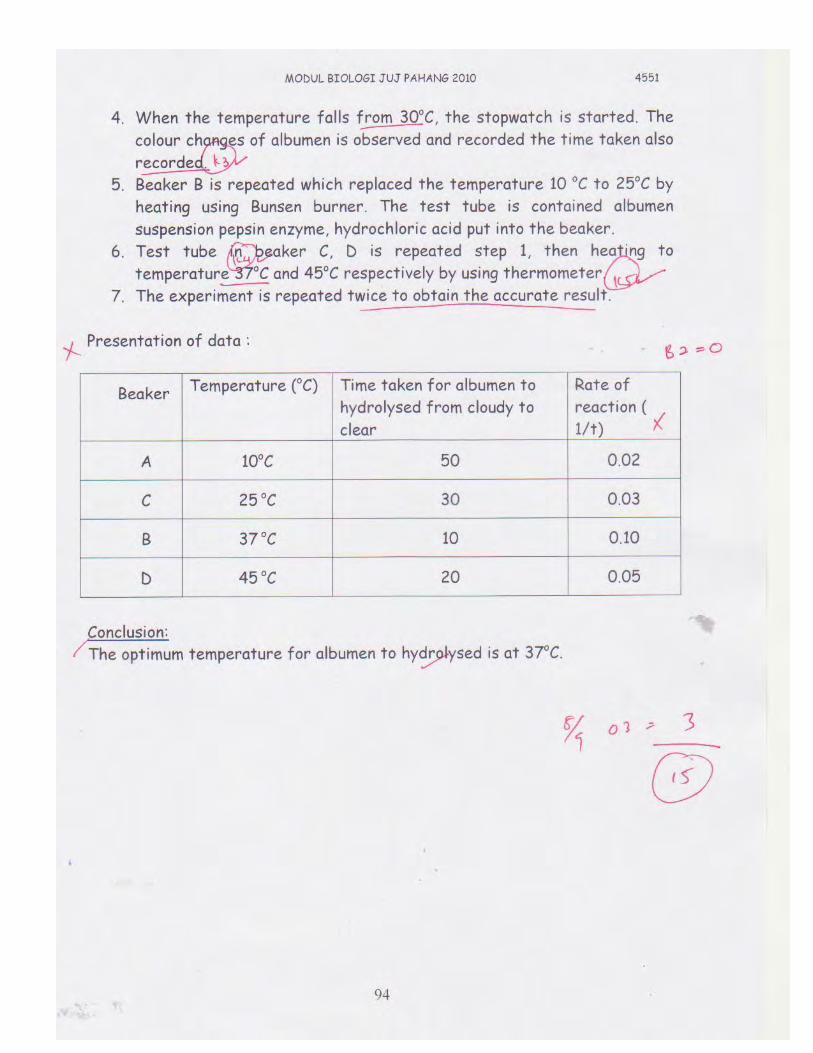
185
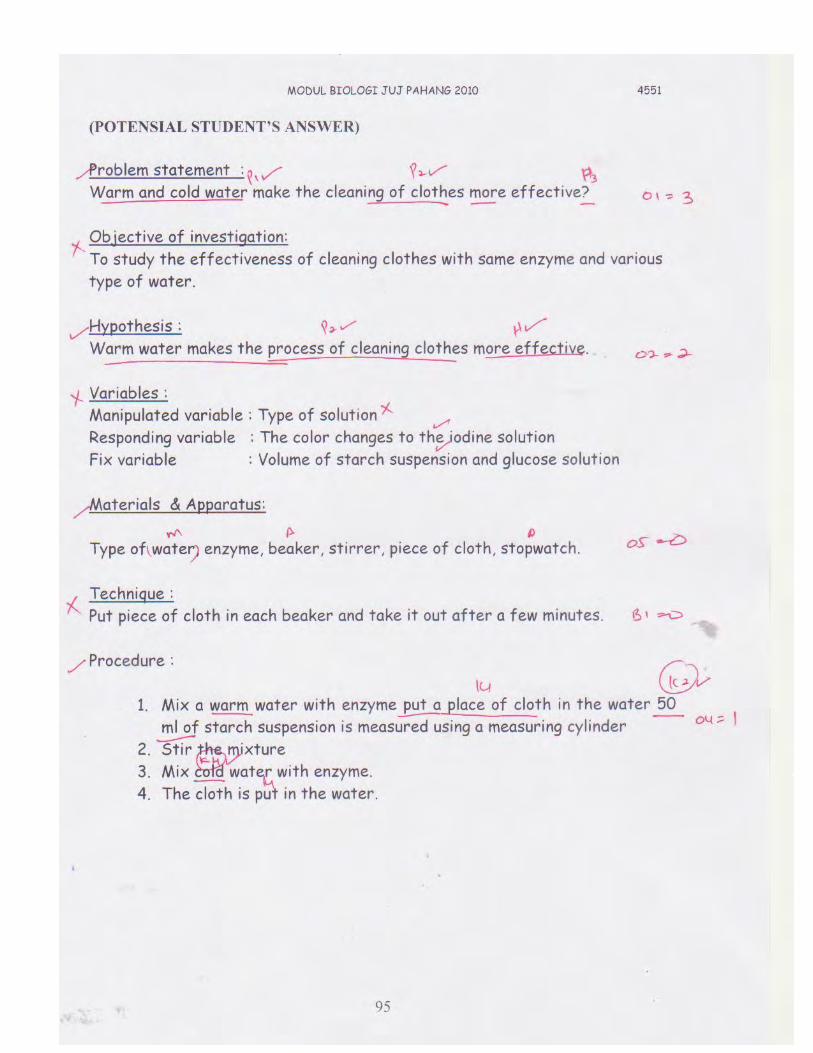
186
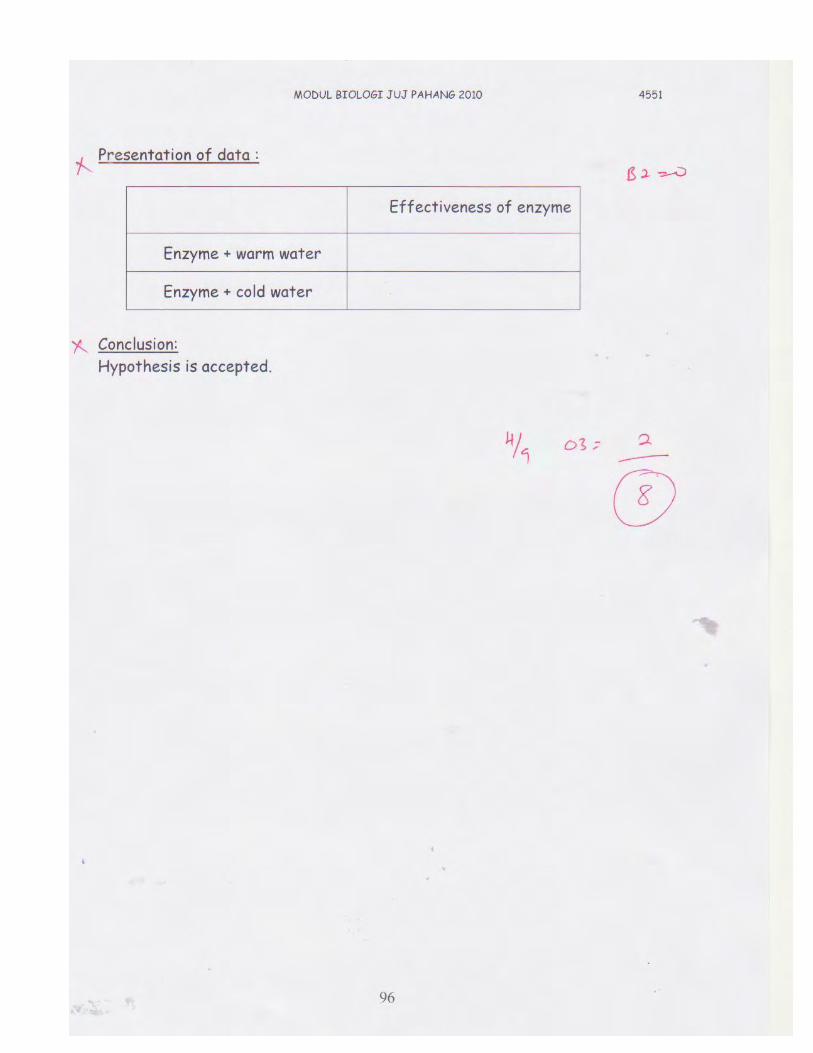
187
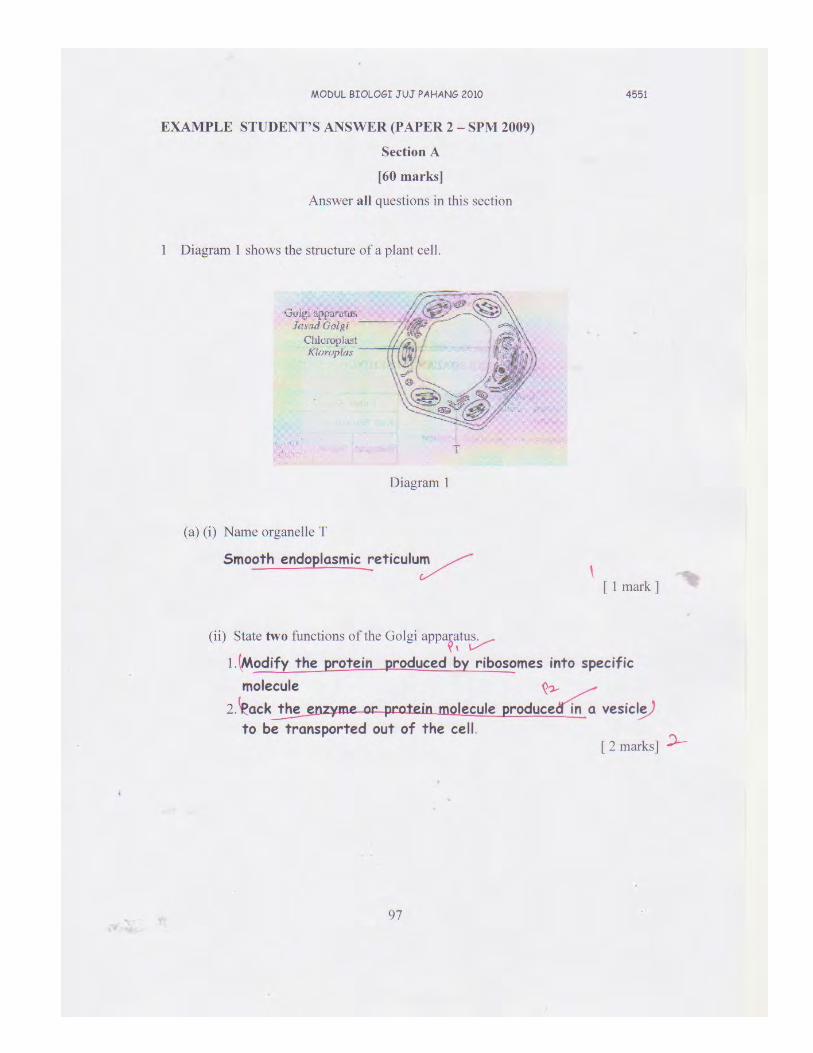
188
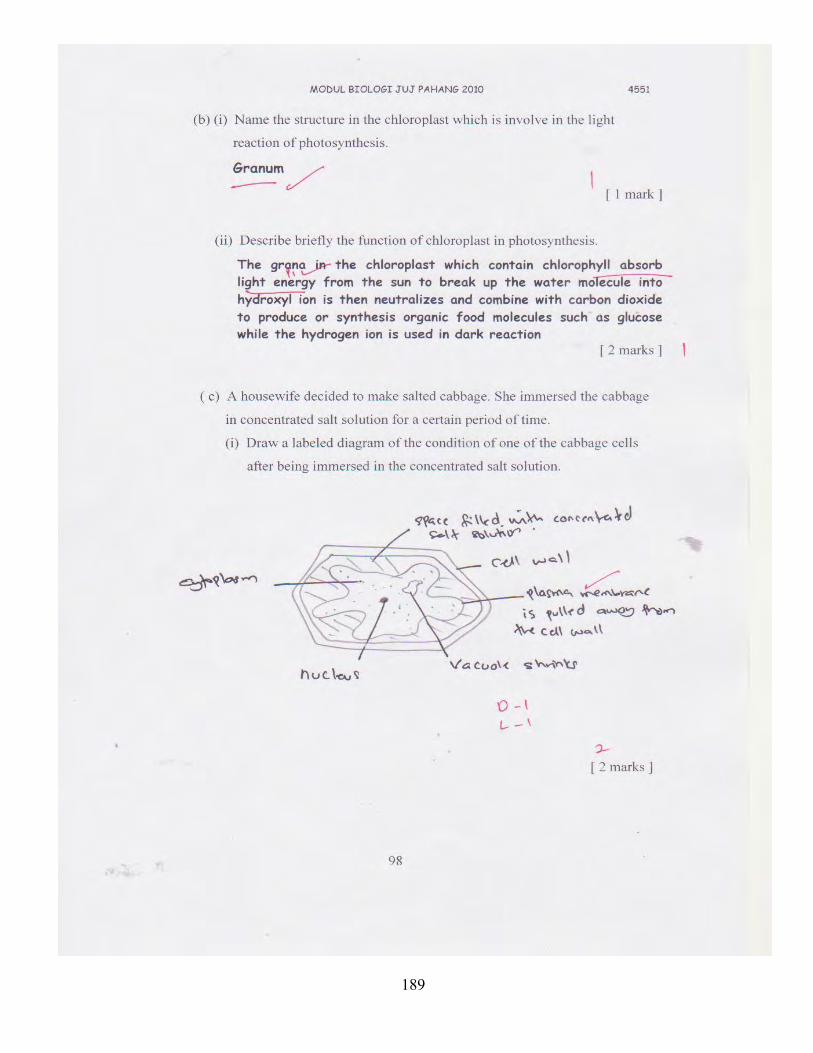
189
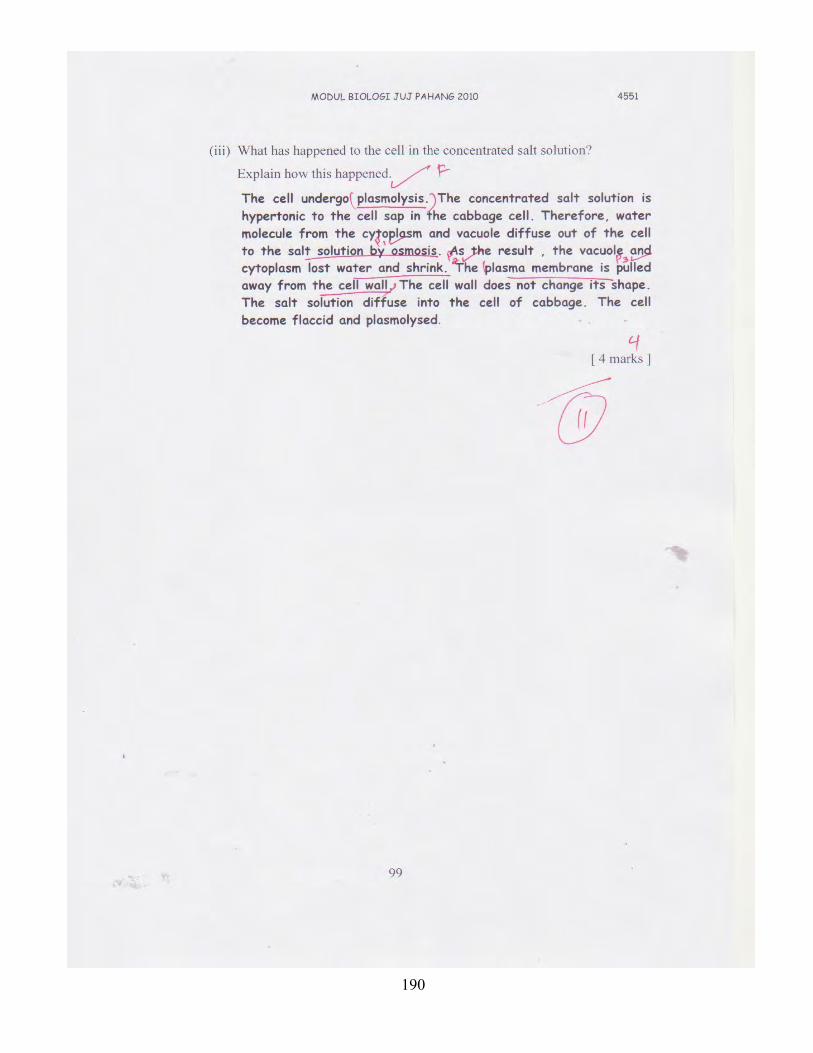
190
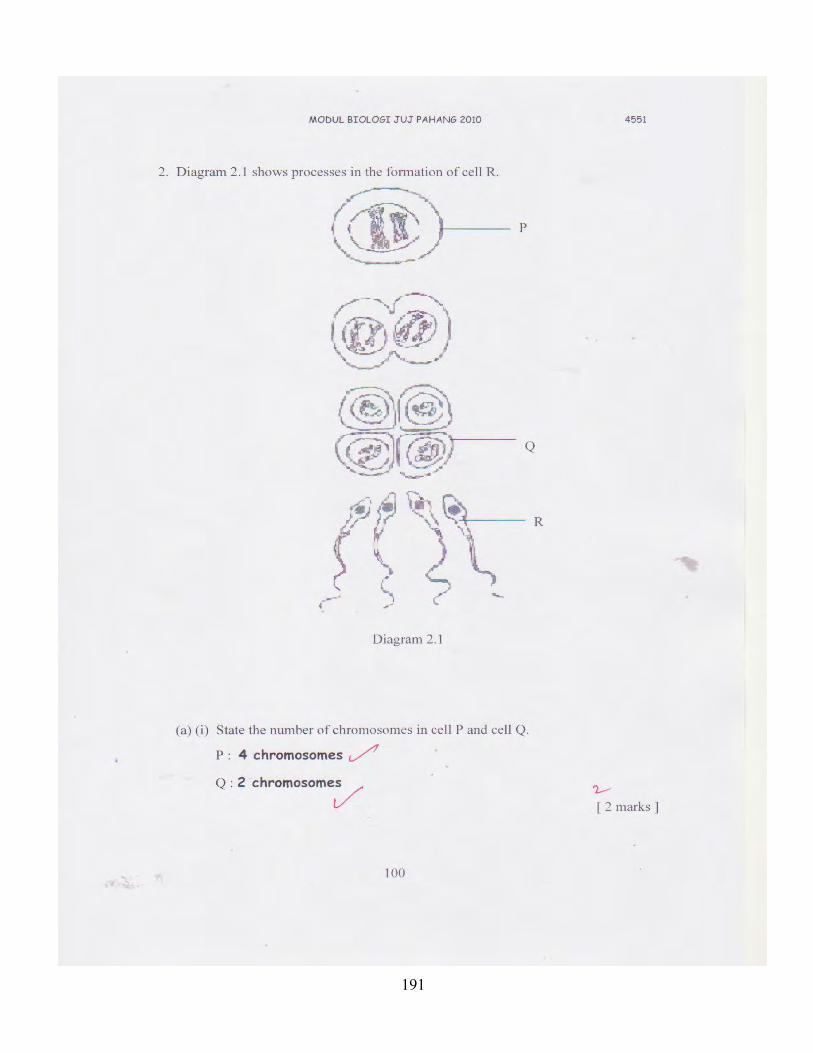
191
192
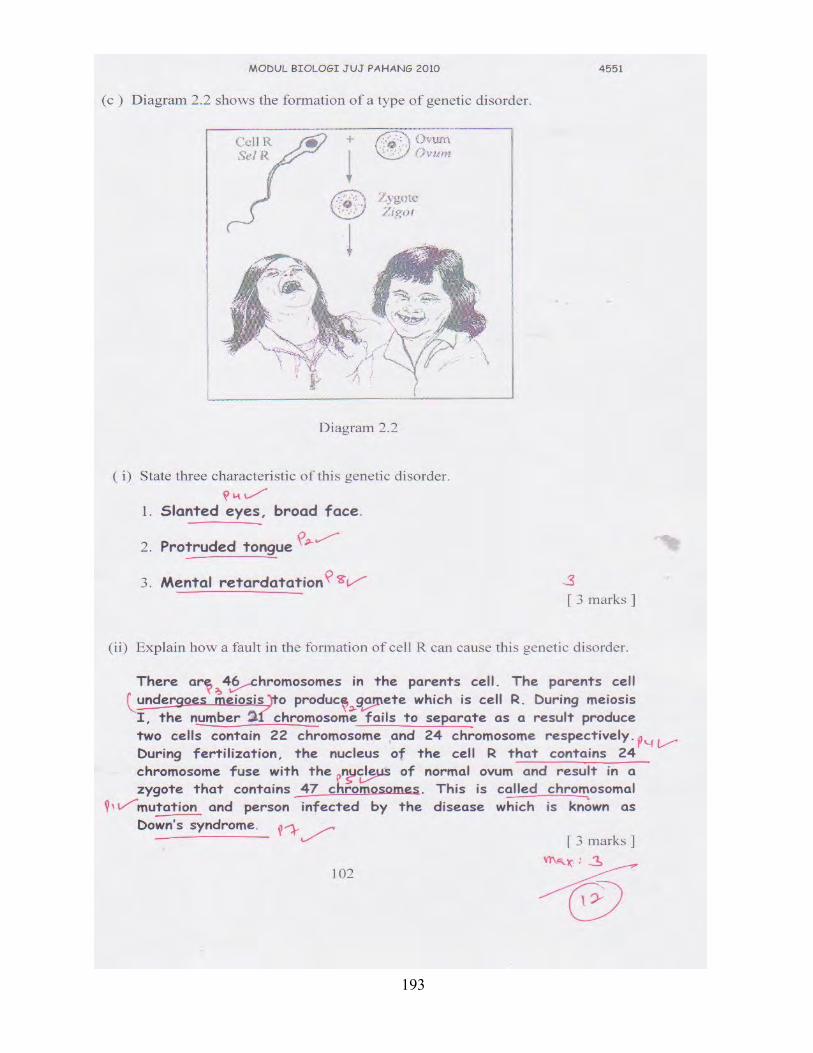
193
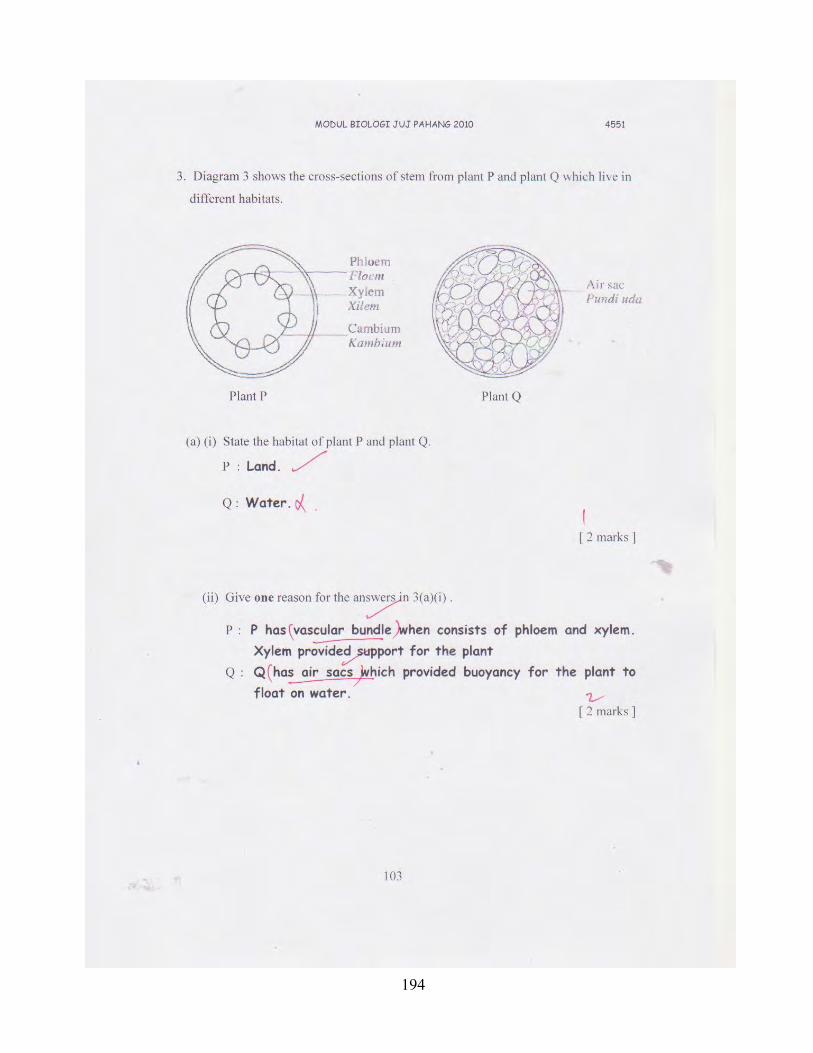
194
195
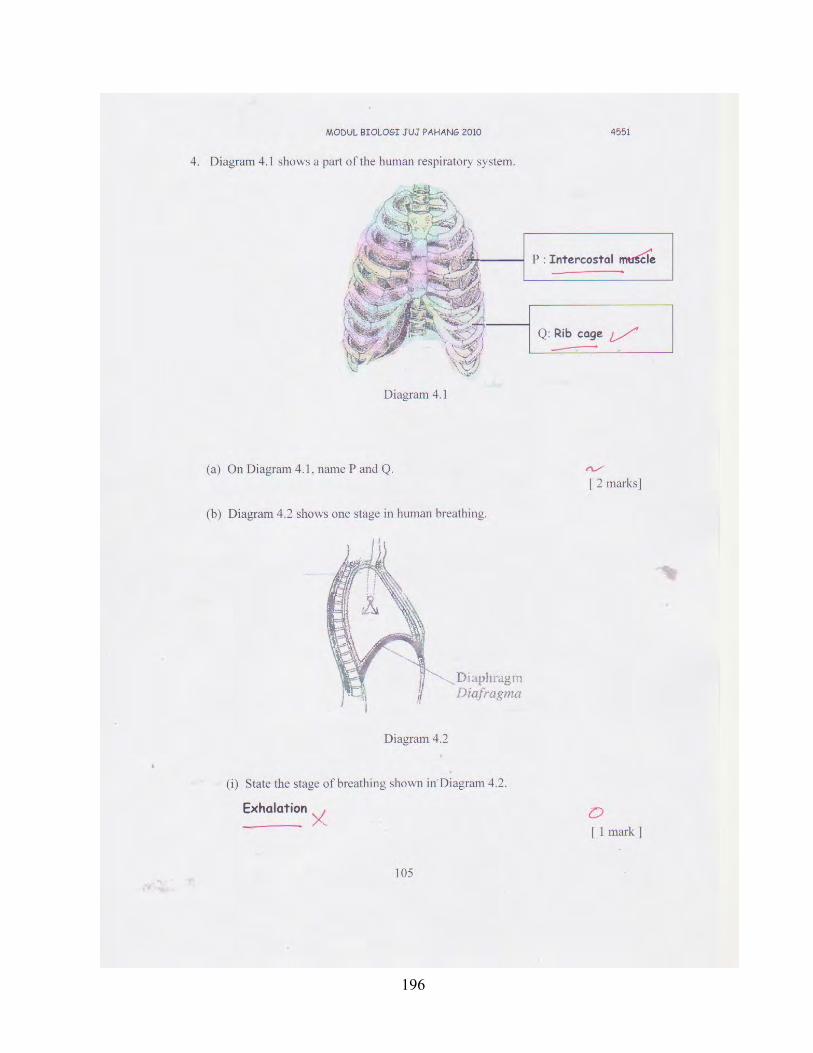
196
197
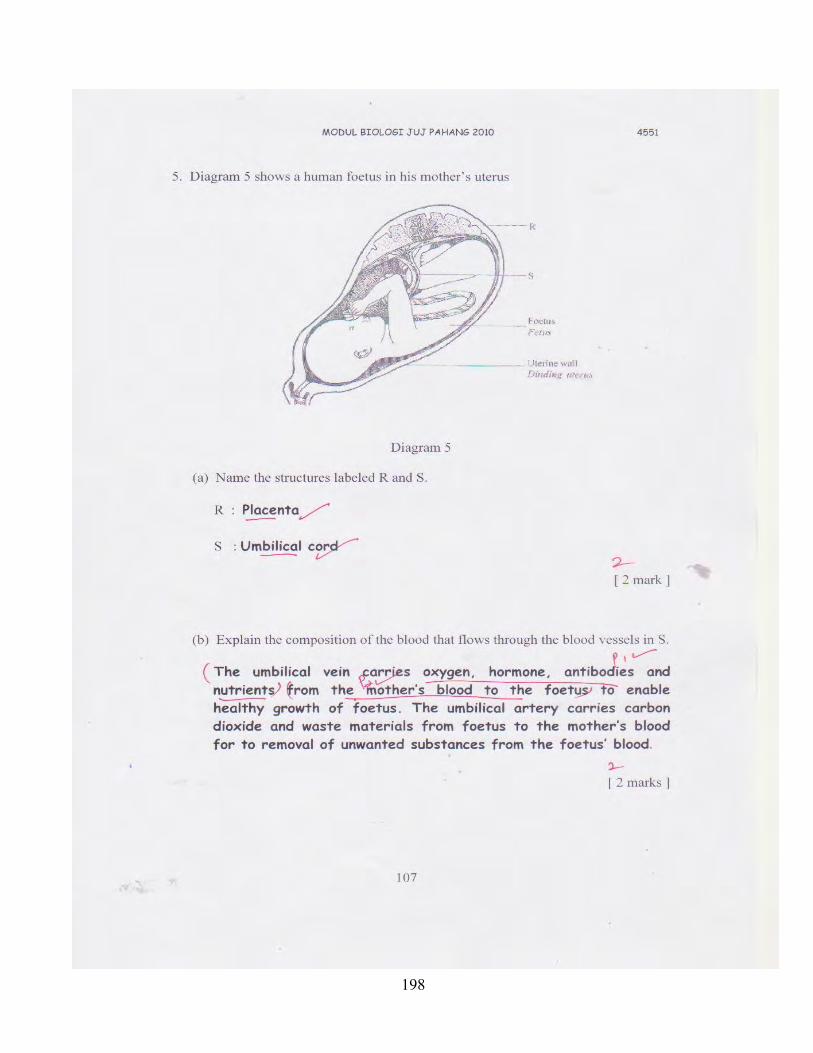
198
199
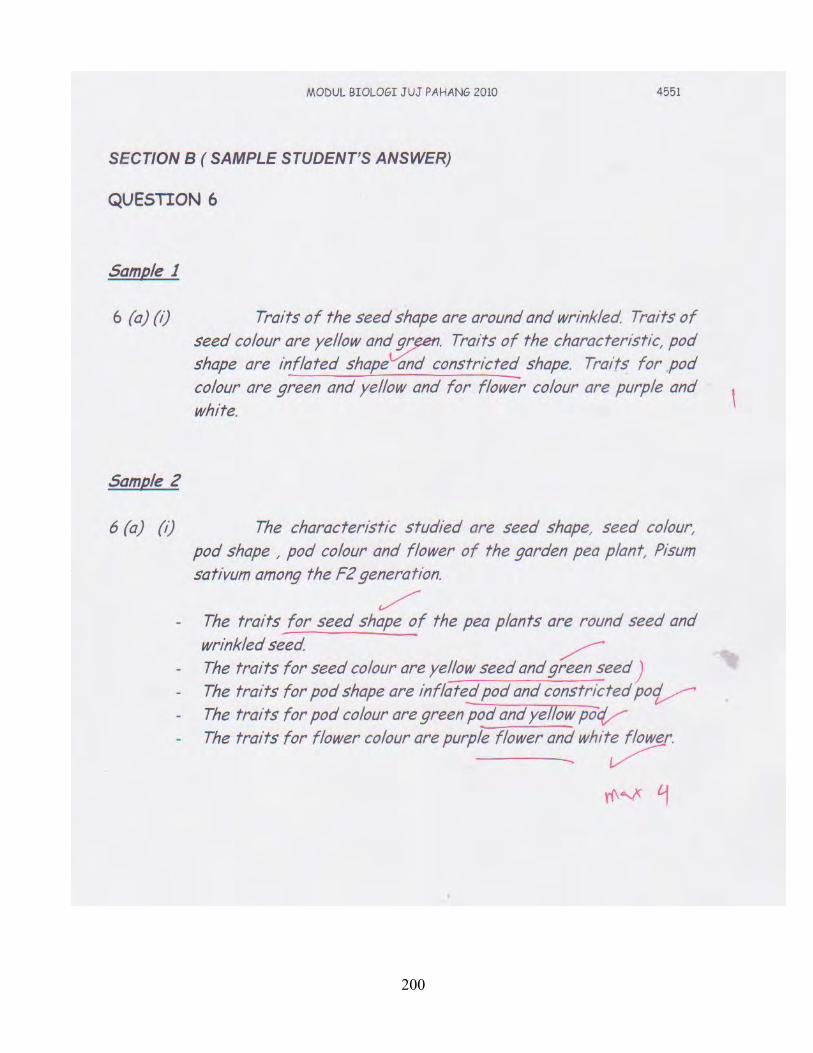
200
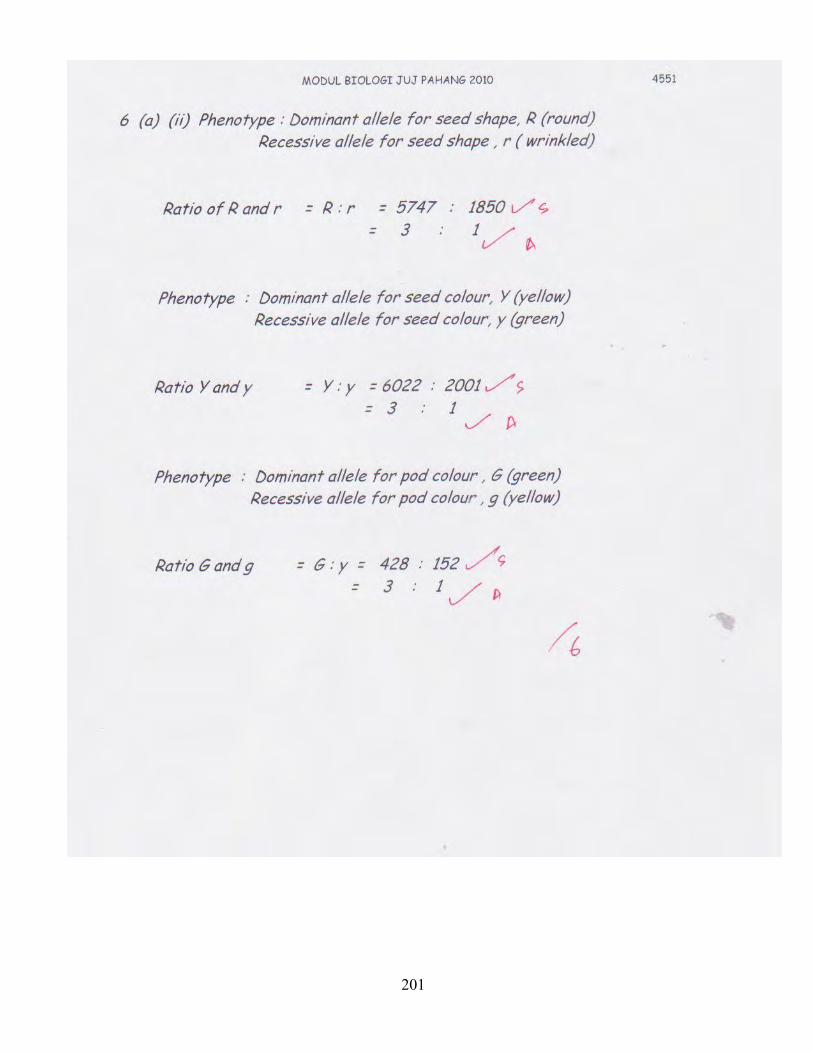
201
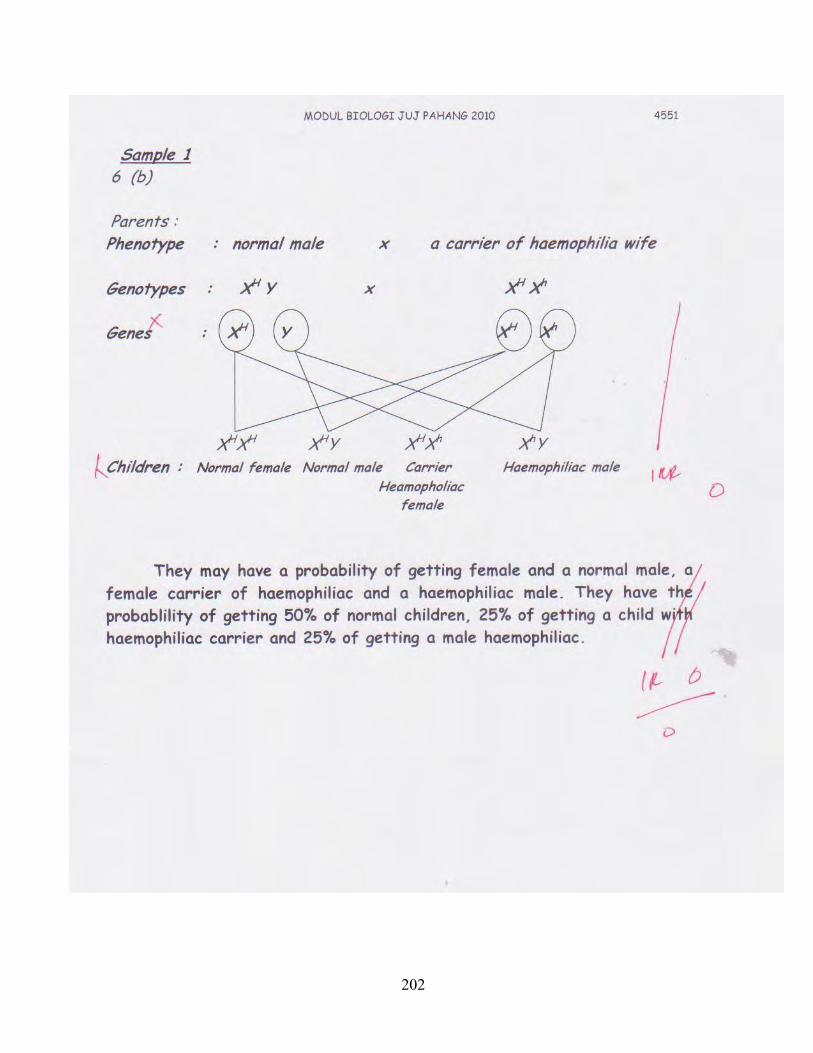
202
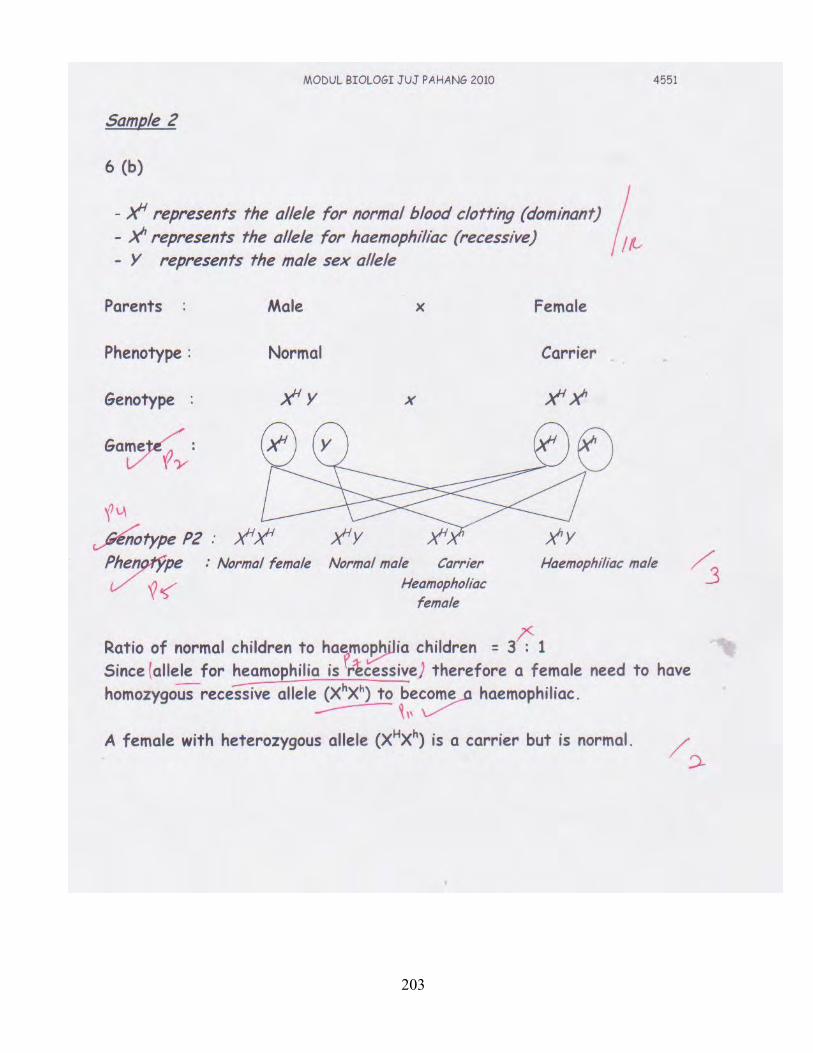
203
204
205
206
207